firebox napac paper on wind energy
TRANSCRIPT

The Economics of Wind Energy ◆ NAPAC May 2010
1
The Economics of Wind Energy Risk, Financing and Accounting Challenges of Wind Farm Development
North American Petroleum Accounting Conference | May 2010
Michael Schiller Managing Director
Firebox Research & Strategy LLC
This program is for the purpose of increasing your understanding of land and the law in oil and gas. Nothing in this program or manual is to be construed as legal advice and neither PDI nor the instructor offer legal advice of any kind. Please consult an a?orney in your area or state of business for any such advice.

The Economics of Wind Energy ◆ NAPAC May 2010
2 Objectives
• The goal of this presentation is to provide an understanding of the economics of wind farms, focusing on their cost structure, risks, financing challenges and accounting hurdles
• Key areas of focus include: – An overview of the physical plant of a wind farm – An overview of the wind farm development process – An overview of the key contracts required – A review of sources of significant risk – An overview of financing options for wind farms; and – The implications of partnership allocation accounting on wind farm deal
structuring

The Economics of Wind Energy ◆ NAPAC May 2010
3 Physical Plant
While a wind farm generating resource differs significantly from a thermal resource in many respects, two in particular stand out as having significant implications
• A thermal plant is able to provide capacity and energy on demand
• A thermal plant consists of a single utility scale capacity resource or a cluster of a few utility scale capacity resources in a contained space
– Where utility scale capacity is defined as 20MW or greater
• A wind farm can only provide energy and that energy is available only on an as is basis
• A wind farm consists of dozens of very small power (e.g., 1 to 3MW) resources scattered over a very large geographic area
1
2
The Economics of Wind Energy ◆ NAPAC May 2010
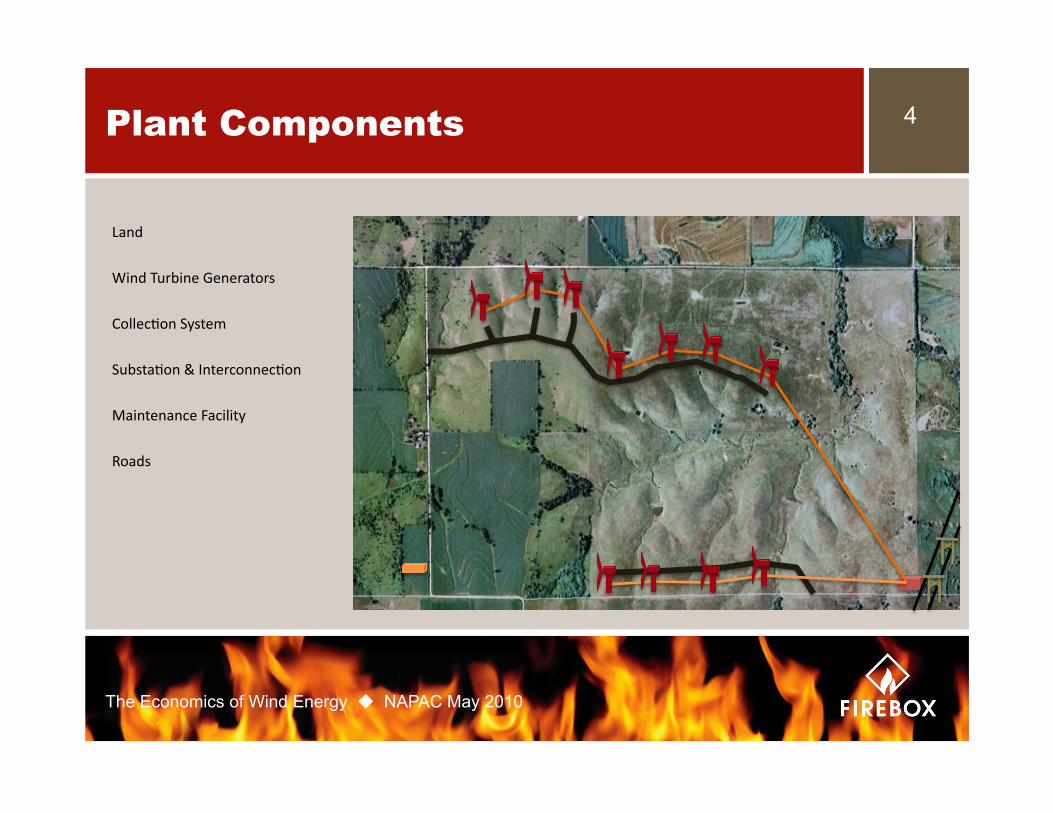
4 Plant Components
Land
SubstaDon & InterconnecDon
Maintenance Facility
Roads
CollecDon System
Wind Turbine Generators

The Economics of Wind Energy ◆ NAPAC May 2010
5
COD
Development Process
Market Assessment
Wind Data CollecDon
Lease AcquisiDon
Environmental Studies
Community Support
DeterminaDon
Site SelecDon
“Early Stage Development”
Financial Decision
Go/ No Go
Power Purchase Agreement
Go/ No Go
ConstrucDon
Financing Agreements
O&M Contract
Turbine Procurement
BOP Contracts
“Late Stage Development”
Environmental & Land Use PermiTng
Site Layout
Wind Resource
Assessment
Go/ No Go
Go/ No Go
Engineering & Design

The Economics of Wind Energy ◆ NAPAC May 2010
6 Cost Structure
Cost Components • Development 2% • Wind Turbines 63% • Balance of Plant 14% • Interconnection 4% • Financing 14% • Other 5%
• Total 100%
Most wind farms require a price of at least $65/MWh plus tax benefits to financially work
Percent of Total Cost
Development Wind Turbines Balance of Plant
InterconnecDon Financing Other
The Economics of Wind Energy ◆ NAPAC May 2010
7 Contracts
• There are four major contracts that define the project
1. Power Purchase Agreement – This is the price per MWh earned on each unit sold over the life of the
deal 2. Turbine Supply Agreement
– The bulk of the project cost is associated with the wind turbines 3. Balance of Plant Contract
– Cost of all non-Turbine equipment and installation 4. Financing
– Cost of money

The Economics of Wind Energy ◆ NAPAC May 2010
8
RISKS

The Economics of Wind Energy ◆ NAPAC May 2010
9 Types of Risk
There are seven major areas of risk: 1. Public Policy 2. Price 3. Wind 4. Environmental 5. Technology 6. Energy Delivery 7. Operational

The Economics of Wind Energy ◆ NAPAC May 2010
10 Public Policy Risk
Public policies are the most important risks that shape the viability, success and failure of wind farms
• Regulation occurs at three levels – Federal regulations established by Congress, the Federal Energy
Regulatory Commission, Department of Energy, the US Fish and Wildlife Service, the Environmental Protection Agency and the US Army Corps of Engineers
– State regulations are established by State Legislatures, State Land and Wildlife agencies
– Local regulations established by County governments and in some cases, townships and cities

The Economics of Wind Energy ◆ NAPAC May 2010
11 Federal Policy Risk
Federal Public Policy is the most important and significant risk a wind farm faces Economic viability is a function of the renewable energy tax credits
• Key federal public policy risks: – Tax credit rules and expiration dates
• PTC 1 year versus 3 year renewal • Expiration of ITC Cash Grant
– Federal energy policies that encourage non-utility generation through guaranteed, competitive access to the Interstate Transmission System
• FERC rulings on RTO/ISO actions and Energy Policy Act rules on renewables
– USFWS regulates threatened and endangered species and administers the Migratory Bird Treaty

The Economics of Wind Energy ◆ NAPAC May 2010
12 State Policy Risk
State policies impact the ability to develop a site State legislation shapes the “on the ground” reality
• Tax policies – Personal property taxes, sales taxes
• Renewable Portfolio Standards – Often require utilities to include a certain percentage of renewable
energy resources in their generation portfolio – Setasides typically only apply to solar – Many states also provide “escape clauses” in their legislation if the price
of the power is too high relative to retail power price targets • States are moving toward establishing land use policies that apply
toward wind farm development

The Economics of Wind Energy ◆ NAPAC May 2010
13 County Policy Risk
Counties (and other local governments) are primarily responsible for zoning and zoning related issues – May impact setbacks from road and buildings – May establish sound impact standards that are more or less stringent
than the industry norms (50db at x meters from a property) – May require building permits and construction standards for electrical
work – May establish local property tax policies

The Economics of Wind Energy ◆ NAPAC May 2010
14 Price Risk
Power price is the second most important risk • Fuel price is the key factor in power prices
– Marginal cost of hydro… ≃$3.00/MWh – Marginal cost of nuclear… ≃$7.00/MWh – Marginal cost of coal… ≃$25.00/MWh – Marginal cost of NG… ≃$50.00/MWh @ $5.00/mmbtu for 10k mmbtu/MWh heat rate
– Marginal cost of NG… ≃$37.50/MWh @ $5.00/mmbtu for 7.5 mmbtu/MWh heat rate
• Natural gas is the key benchmark price for determining the viability of wind in market areas with lots of natural gas fired capacity – It is also the primary “marginal” fuel for most of the US
• Coal is the dominant source of fuel for electric power in most of the US

The Economics of Wind Energy ◆ NAPAC May 2010
15 Fuel Mix by Region
Fuel Source
Coal Natural Gas Nuclear
Hydro Renewables Fuel Oil
55% Coal or greater
Primary fuel is Natural Gas
Primary fuel is Nuclear
Primary Fuel is Hydro
Diverse fuel mix

The Economics of Wind Energy ◆ NAPAC May 2010
16 NG Fired Power Forward Curve
$-‐
$10.000
$20.000
$30.000
$40.000
$50.000
$60.000
$70.000
$80.000
$90.000
$100.000
Apr '10
Aug '10
Dec '10
Apr '11
Aug '11
Dec '11
Apr '12
Aug '12
Dec '12
Apr '13
Aug '13
Dec '13
Apr '14
Aug '14
Dec '14
Apr '15
Aug '15
Dec '15
Apr '16
Aug '16
Dec '16
Apr '17
Aug '17
Dec '17
Apr '18
Aug '18
Dec '18
Apr '19
Aug '19
Dec '19
Apr '20
Aug '20
Dec '20
Apr '21
Aug '21
Dec '21
Apr '22
Aug '22
Dec '22
$NG Price/mmbtu @10kmmbtu/MWh @7500mmbtu/MWh
Linear(@10kmmbtu/MWh) Linear(@7500mmbtu/MWh)
Wind price @ $65/MWh
Crossover Point for 10k mmbtu/MWh: Summer 2015
Crossover Point for 7.5k mmbtu/MWh: Not before 2023
Natural Gas Price Impacts on Electricity Pricing (Forward Curves as of 11 March 2010)
NG$/mmbtu

The Economics of Wind Energy ◆ NAPAC May 2010
17 Wind Risk
Wind is the third most important risk Shapes the type of resource
• Wind resources are energy machines rather than capacity. Thus the availability of wind is critical to determining the viability of a specific site
• Wind is measured using meteorological towers equipped with wind vanes (direction) and anemometers at various heights – Measurement has three dimensions: Speed in meters/second, duration
(annual and seasonal) and direction • Wind risk determines the capacity factor – likely net available energy
production – which determines the potential revenue stream produced by the wind farm

The Economics of Wind Energy ◆ NAPAC May 2010
18 Wind as a Resource
• Great Plains and prairie states have the highest capacity factors overall, with wind speeds averaging in excess of 8 m/s (17.9 mph) at 80 meters (height of blade hub) and net capacity factors of 38% to as high as 50%. Higher hub heights provide greater wind resource

The Economics of Wind Energy ◆ NAPAC May 2010
19 Environmental Risk
• Can be managed through thorough environmental research – avian and bat studies, threatened and endangered species studies and sensitive or threatened and endangered ecosystem or habitat studies
• Most agencies will work with developers on mitigation strategies • Typical mitigation may include wind farm layout modifications,
funding of conservation easements or habitat swaps

The Economics of Wind Energy ◆ NAPAC May 2010
20 Energy Delivery Risk
• Two components to energy delivery – Interconnection – Transmission
• Interconnection upgrades – the cost of the substation and any improvements to the grid that allow the power to be injected into the transmission network at a given point – are typically born by the developer
• Transmission upgrades – the cost of upgrading the transmission system to allow the injected power to reach its intended load center – are typically born by the buyer, but imposed upon the project economics
• Transmission is a significant constraint at this time in most of the US, especially in the wind-rich Great Plains states

The Economics of Wind Energy ◆ NAPAC May 2010
21 Operational Risk
• Operational risks typically impact project layout – designing tower locations to avoid buildings, roads, and other facilities – in order to avoid damages resulting from farm operations
• Operational risks may include ice throw, catastrophic wind events such as tornadoes that would knock down a tower, sound
• O&M costs can also vary by location, maintenance schedule and technology

The Economics of Wind Energy ◆ NAPAC May 2010
22
FINANCE AND ACCOUNTING ISSUES

The Economics of Wind Energy ◆ NAPAC May 2010
23 Tax Credit Financing
Wind energy – all renewables in fact – only work because of federal subsidies
• The primary subsidy is the Production Tax Credit (PTC) – a tax credit (currently $22/MWh) that is available to owners for each MWh produced, typically renewed by Congress annually and accelerated depreciation (5 Year) – The PTC financially exposes investors to wind risk
• The American Recovery and Reinvestment Act of 2009 (Stimulus Bill) extended the PTC for three years and, more significantly made available the Investment Tax Credit and a Treasury Cash Grant in lieu of the tax credit

The Economics of Wind Energy ◆ NAPAC May 2010
24 ARRA ITC and Cash Grant Options
• The ITC is a 30% tax credit and applies to investment in generating equipment only – not to transmission and interconnection upgrades – Similar to the solar ITC – Is available only through 31 December 2012
• Cash Grant program was designed to monetize the ITC and accelerate wind farm investment over the next few years – Must be placed 2009 or 2010 or must be placed in service by the time the
ITC expires so long as construction was started in 2009 or 2010 – Important to note that use of the cash grant reduces the basis of the
property by 50%, thus lowering the net depreciation available to the investor – Cash grant is payable in 60 days from application (COD) and is not taxable
income – Banks consider the Cash Grant to be financeable – so long as the cash
goes to reduce debt!

The Economics of Wind Energy ◆ NAPAC May 2010
25 Other ARRA Benefits
• Extension of bonus depreciation (50% 1st Year) to investments incurred in 2009
• Authorized $1.6 billion in Clean Renewable Energy Bonds with one third available to local governments, public power entities and electric cooperatives
• Removed restriction on use of Industrial Development Bonds to finance projects
• Created a DOE Grant Program (Section 1705 of the Energy Policy Act) for generation, manufacturing and transmission projects commencing construction by 30 September 2011

The Economics of Wind Energy ◆ NAPAC May 2010
26 Tax Benefit Components
• Production Tax Credit – $22/MWh for the first 10 years of operation
• ITC/Cash Grant – 30% of Capital Investment that qualifies for 5 Year MACRS
• Depreciation – 5 Year MACRS for generation related capital costs – 15 Year MACRS for civil and roads – 15 Year SL for financing and legal for lenders/investors – 20 Year SL for transmission system investments and upgrades – 39 Year SL for O&M facilities – Indirect (allocated) for development costs

The Economics of Wind Energy ◆ NAPAC May 2010
27 Deal Structuring
Historical pattern – Pre-Crash
• Most wind deals are done as a “Minnesota Flip,” where the tax equity investor retains 99% ownership until the tax benefits are consumed, and then sells or “flips” the ownership to the developer at FMV, reducing their share from 99% to 5% - usually 10 to 12 years
• Prior to the Financial Crash of 2008, wind farm deals were all equity in order to avoid negative or inverted capital account balances – and thus raise issues with the IRS under Sec. 704 of the IRS Code (Capital Balances and partnership allocation rules) – and to avoid returns being squeezed by banks
• The deals repaid the cash investment and generated return of 9% when the tax credits and depreciation were accounted for

The Economics of Wind Energy ◆ NAPAC May 2010
28 Deal Structuring
New pattern – Post-Crash
• The Cash Grant Program recovers 30% of the investment in 60 days, thus allowing for debt financing of the balance and allowing for recovery of the credits and depreciation in six to seven years – The cash grant, mitigates the risk of reduced investment recovery and
lowered returns by monetizing the investment based on the value of the asset rather than the energy produced
• Debt financing changes the cash flows – the bank debt consumes cash - and puts the tax equity investor at risk to negative capital account balances toward the end of the recovery period.

The Economics of Wind Energy ◆ NAPAC May 2010
29 Who Needs Tax Benefits?
The current challenge is in finding investors with appetite for the tax benefits the projects generate A 100MW project may generate around $55 million in Cash Grant
and $47 million in depreciation over 5 years • Historically, banks, insurance companies and institutional investors,
seeking to shelter earnings from investment activities, have been the leading investors tax equity – The Crash has all but eliminated these participants from the market.
Pre-crash it was estimated that there were 24 active players in the market. Current estimates put it at three
• Other investors have been Utility affiliated Independent Power Producers such as FPL Group’s Next ERA Energy, Duke Energy Generation Services, and Edison International’s Edison Mission Energy unit

The Economics of Wind Energy ◆ NAPAC May 2010
30
SUMMARY

The Economics of Wind Energy ◆ NAPAC May 2010
31 Wind Farm Economics Summary
• Wind farms require tax benefits – credits and accelerated depreciation – to be cost competitive
• The current pressure on power prices make wind farms even under the best of conditions marginal
• The optimal investors in wind farms under current market conditions are energy companies seeking to diversify their portfolio and who can utilize the tax benefits – and whom may benefit from the Green Tags
• The expiration of the Cash Grant program in lieu of the Investment Tax Credit will push projects back toward PTC benefits, increasing the exposure to wind risk for investors and reducing the tax equity appetite for non-financial institutions and energy companies
• Partnership Allocation Rules (Sec. 704 of the IRS Code) complicate the use the debt in financing wind farms

The Economics of Wind Energy ◆ NAPAC May 2010
32 About Firebox
• Firebox Research & Strategy LLC is a consultancy that assists companies in achieving their business goals through the design and support of business and project research, strategy, planning, management and implementation in the Energy and other industries.
• For more information on how Firebox may assist your firm please contact Michael Schiller, Managing Director, at 216-691-0955 or at [email protected].
Firebox Research & Strategy LLC Mixing Business with Measure®