finnish construction sector overview
DESCRIPTION
For cocompeur.wordpress.com website.TRANSCRIPT

Forests9,5 %
Other land and water areas
1,2 %Other assets
1,5 % Warehouses3,6 %
Non-residential buildings2,0 %
Building land9,8 %
Machinery, transportation equipment
11,3 %
Other structures10,4 %
Other buildings20,4 %
Residential buildings28,4 %Arable land
1,8 %
Source: Statistics Finland
Built-up environment two thirds of Finnish national wealth

Construction Sector Output in 2009
Total € 25.3 bill.
Building Construction€ 20.0 bill.
Civil Engineering€ 5.3 bill.
Source: Statistics Finland, VTT
Residentialbuildings€ 4.9 bill.
Otherbuildings€ 4.2 bill.
Investment€ 3.8 bill.
Maintenance€ 1.5 billRepair and maintenance
€ 9.1 bill.
New building € 10.9 bill.
Residentialbuildings€ 4.1 bill.
Otherbuildings€ 6.8bill.
21 %79 %

change from previous year, %
Gross Domestic Product and Construction
Source: Statistics Finland, RT
1,6 1,83,7 2,8
4,9 4,9
1,2
-7,8
1,02,5
-0,4
2,6 3,11,9
4,3 3,8
0,0
-13,2
-2,0
3,0
-16
-12
-8
-4
0
4
8
12
2002 2003 2004 2005 2006 2007 2008 2009 2010 2011
GDP Construction

Confidence Indicator of Constructionbalance
Source: CFI
-80
-60
-40
-20
0
20
40
2000 2001 2002 2003 2004 2005 2006 2007 2008 2009 2010

60
80
100
120
140
1975 1980 1985 1990 1995 2000 2005 2010
Volume of Construction Output
Index, 2000=100
Source: Statistics Finland, RT
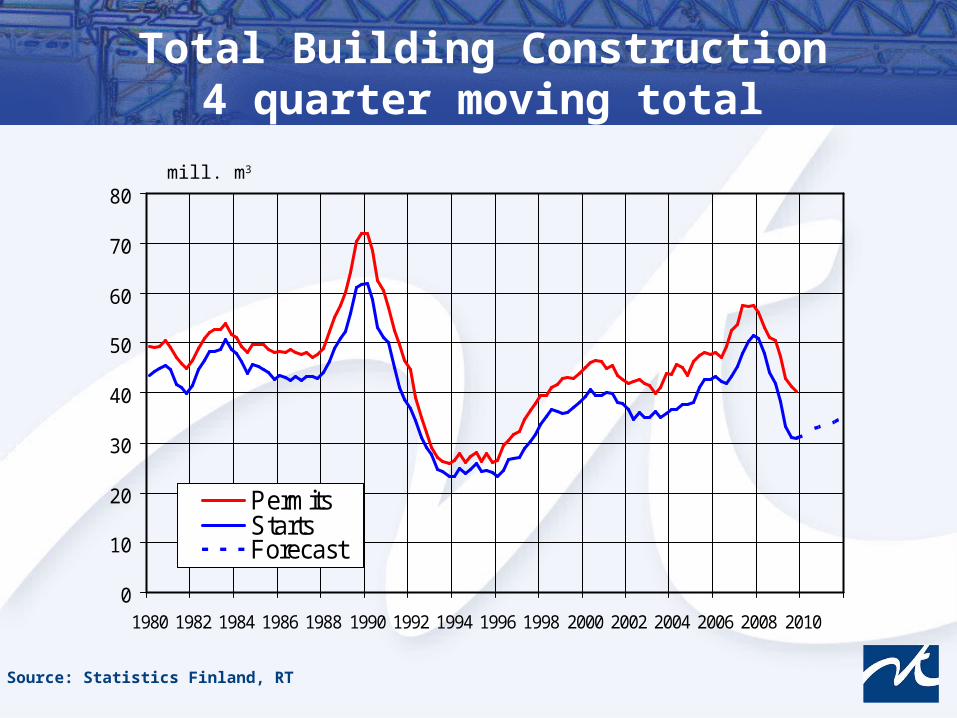
Total Building Construction4 quarter moving total
mill. m3
Source: Statistics Finland, RT
0
10
20
30
40
50
60
70
80
1980 1982 1984 1986 1988 1990 1992 1994 1996 1998 2000 2002 2004 2006 2008 2010
PermitsStartsForecast
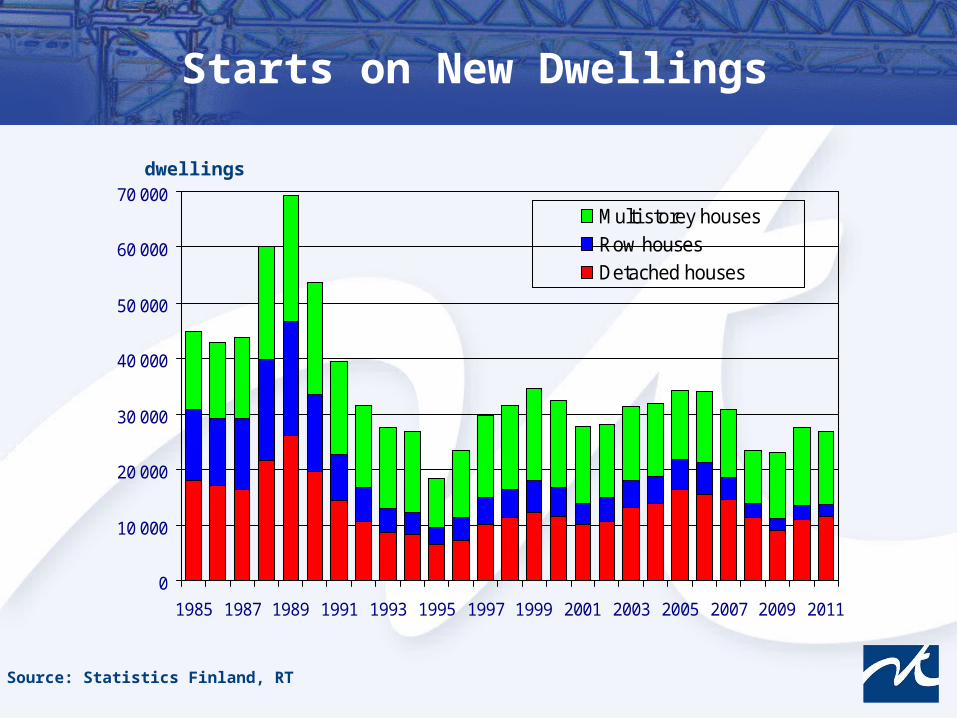
Starts on New Dwellings
dwellings
Source: Statistics Finland, RT
0
10 000
20 000
30 000
40 000
50 000
60 000
70 000
1985 1987 1989 1991 1993 1995 1997 1999 2001 2003 2005 2007 2009 2011
Multi storey housesRow housesDetached houses
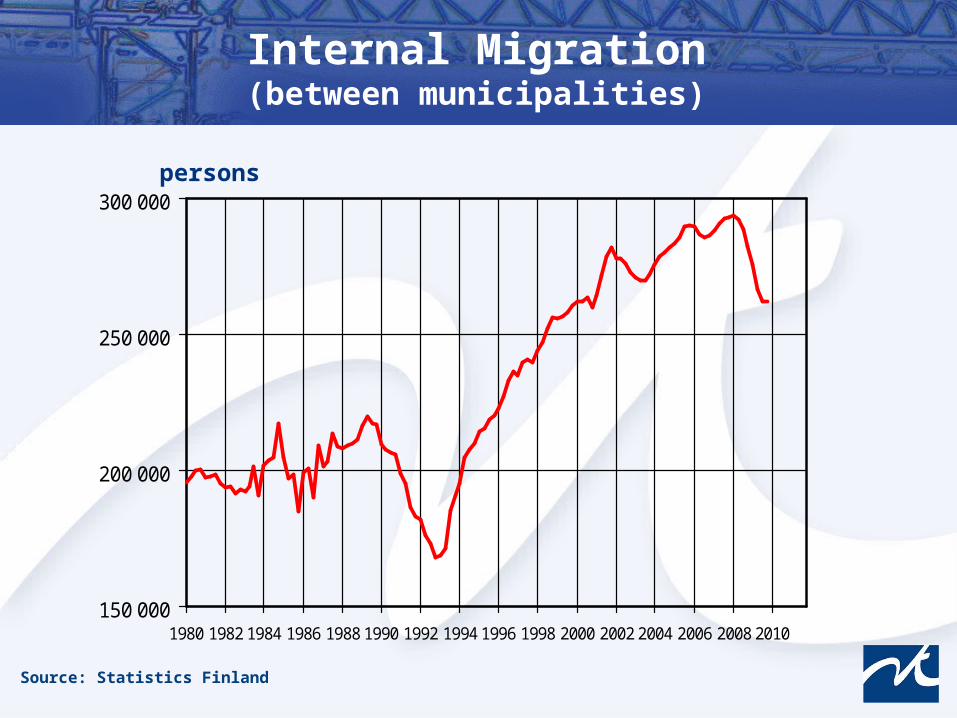
Internal Migration(between municipalities)
persons
Source: Statistics Finland
150 000
200 000
250 000
300 000
1980 1982 1984 1986 1988 1990 1992 1994 1996 1998 2000 2002 2004 2006 2008 2010

70
80
90
100
110
120
130
140
1975 1980 1985 1990 1995 2000 2005 2010
Volume of Civil Engineering Output
Index, 2000=100
Source: Statistics Finland, RT

Employment in Construction4 quarter moving total
persons
Source: Statistics Finland
60 000
80 000
100 000
120 000
140 000
160 000
180 000
200 000
1996 1997 1998 1999 2000 2001 2002 2003 2004 2005 2006 2007 2008 2009

Building Cost Index
change from previous year, %
Source: Statistics Finland
-5
0
5
10
1994199519961997199819992000200120022003200420052006200820092010
Total indexLabour costsBuilding products
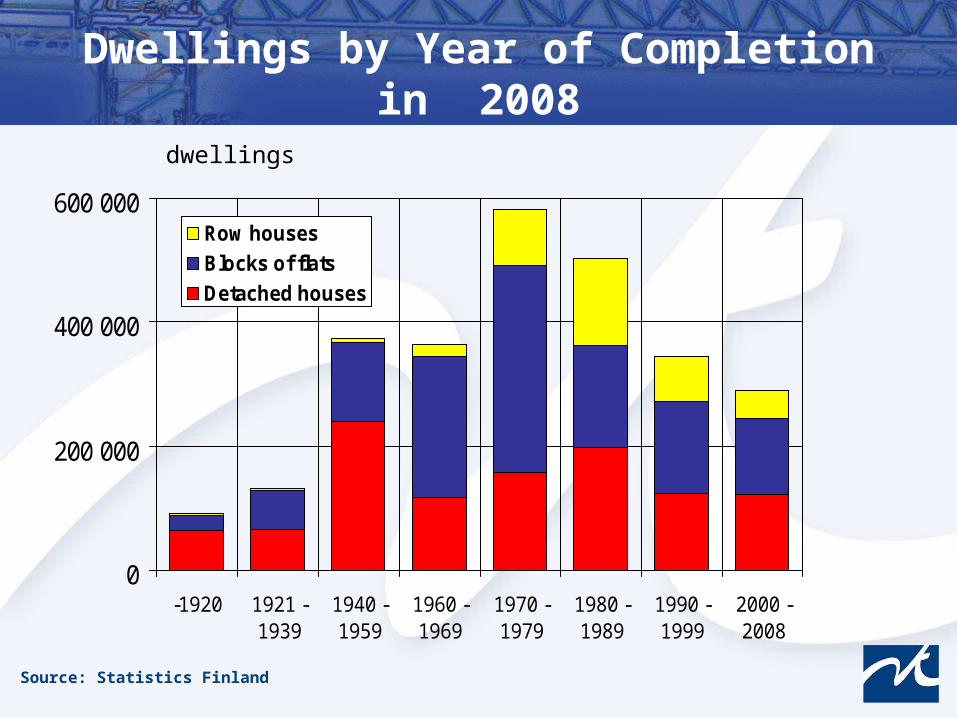
Dwellings by Year of Completion in 2008dwellings
Source: Statistics Finland
0
200 000
400 000
600 000
-1920 1921 -1939
1940 -1959
1960 -1969
1970 -1979
1980 -1989
1990 -1999
2000 -2008
Row housesBlocks of flatsDetached houses
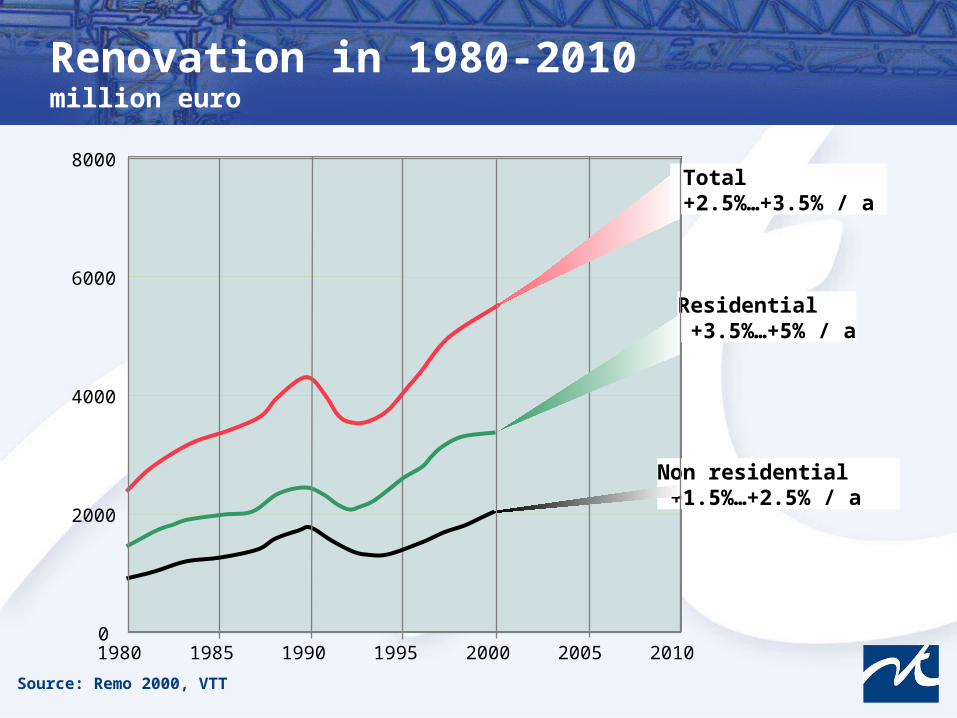
Renovation in 1980-2010million euro
1980 1985 1990 1995 2000 2005 20100
2000
4000
6000
8000
Residential +3.5%…+5% / a
Non residential +1.5%…+2.5% / a
Total +2.5%…+3.5% / a
Source: Remo 2000, VTT

Roads16 %
Streets18 %
Water treatment
9 %
Energy supply16 %
Railways12 %
Waterways2 %Airports
1 %
Telecom-munication
13 %
Eniviron-ment13 %
Civil Engineering in Finland in 2006
Total mill. 4,600 €
Source: Statistics Finland