finite element analysis of a prestressed concrete beam using frp tendon
TRANSCRIPT

APPENDIX 1
A PROJECT REPORT on
FINITE ELEMENT ANALYSIS OF A PRESTRESSED
CONCRETE BEAM USING FRP TENDON Submitted By
GIRISH KUMAR SINGH 1011020021
in the partial fulfillment for the award of the degree
of
BACHELOR OF TECHNOLOGY (FULL TIME) In
CIVIL ENGINEERING Under the guidance of
Mr. SELVA CHANDRAN PANDIAN (Engineering Manager, Parson Brinckerhoff)
SRM UNIVERSITY RAMAPURAM
APRIL, 2014

CONTENTS CHAPTER NO. TITLE PAGE
NO. TABLE OF CONTENT ii
ACKNOWLEDGEMENT vi
ABSTRACT vii
LIST OF TABLE ix
LIST OF FIGURES x
LIST OF ABBREVIATION xii
METHODOLOGY xiii
1. INTRODUCTION 1.1 General 1
1.2 Material Introduction 4
1.2.1 Glass 4
1.2.2 Aramid 4
1.2.3 Carbon 4
1.2.4 Carbon Fibre Composite Cable 5
(CFCC)
1.3 Finite element method
1.3.1 General 6
1.3.2 Ansys 6
1.3.2.1 Finite Element Model Of 6
Concrete
1.3.2.2 Finite Element Model Of 7
Steel Beam
1.3.2.3 Finite Element Model Of 7
Reinforcement
ii

1.3.2.4 Finite Element Model Of 8
External Prestressed
Tendon
1.3.2.5 Finite Element Model Of 8
Steel Plates
1.3.2.6 Finite Element Model Of 9
Interface Surface
1.3.2.7 Representation Of Shear 9
Connectors
2. LITERATURE SURVEY
2.1 General 11
2.2 Serviceability Of Concrete Beams Prestressed 11
By Fiber Reinforced Plastic Shells
2.3 Finite Element Analysis Of Prestressed 12
Concrete Beams
2.4 Element Used In Prestressed Members In Ansys 13
2.4.1 Solid65 Description 14
2.4.2 Link8 Description 17
3. ANSYS MODEL
3.1 General
3.1.1 Element Types 18
3.2 Model No. 1
3.2.1 Material Properties 18
3.2.2 Modelling 24
3.2.3 Meshing 26
3.2.4 Numbering Controls 27
3.2.5 Boundary conditions 28
3.2.6 Analysis type 28
3

3.2.7 Load step method 29
3.2.8 Results 34
3.3 Model No. 2
3.3.1 Beam Property 39 3.3.2 Real Constants 40 3.3.3 Material Properties 42 3.3.4 Modelling 45 3.3.5 Meshing 46 3.3.6 Numbering controls 47 3.3.7 Boundary conditions 48 3.3.8 Analysis type 48 3.3.9 Load step method 49 3.3.10 Results 56
3.4 Model No. 3
3.4.1 Beam Property 60 3.4.2 Real constants 60 3.4.3 Material Properties 62 3.4.4 Modelling 65 3.4.5 Meshing 66 3.4.6 Numbering controls 67 3.4.7 Boundary conditions 68 3.4.8 Analysis type 68 3.4.9 Load step method 69 3.4.10 Results 76
4. EXPERIMENTAL RESULTS
4.1 General 79
4.2 Test Specimen 79
4.3 Testing Scheme 82
4

4.4 Material Properties 82
4.5 Results Of The Experimental Program 85
5. CONCLUSION 89
REFERENCES 90
5

ACKNOWLEDGEMENT
I would like to acknowledge all the people who have helped me in the completion
of this dissertation. First and foremost I would like to express my deepest gratitude to my
advisors Selva Chandran Pandian, Engineering Manager, Parson Brinckerhoff for all his
guidance, advice, suggestion and friendship.
I have been incredibly to have the advisors who gave me the freedom to discover
on my own. I would also like to thanks my HOD Mrs. T.CH. Madhavi For all her support
and suggestion. I am also thankful to the department of civil engineering for their support.
Lastly I would like to give a hearty gratitude to my internal guide Mr.
Sivaramakrishanan Asst. Professor of SRM University for all his support, without his help
and suggestions this project work would not have been possible.
6
ABSTRACT
Concrete prestressed structural components exist in buildings and bridges in
different forms. Understanding the response of these components during loading is
crucial to the development of an overall efficient and safe structure. Different
methods have been utilized to study the response of structural components.
Experimental based testing has been widely used as a means to analyse individual
elements and the effects of concrete strength under loading.
While this is a method that produces real life response, it is extremely time
consuming, and the use of materials can be quite costly. In this paper we used finite
element analysis to study behaviour of these components. The use of computer
software (Ansys) to model these elements is much faster, and extremely cost-
effective. To fully understand the capabilities of finite element computer software
(Ansys), we look back to experimental data and simple analysis.
Data obtained from a finite element analysis package is not useful unless the
necessary steps are taken to understand what is happening within the model that is
created using the software. Also, executing the necessary checks along the way, is
key to make sure that what is being output by the Ansys is valid.
This paper is a study of prestressed concrete beams using finite element
analysis to understand the response of prestressed concrete beams due to transverse
loading and to analyse the behaviour of FRP material under these circumstances.
vii

This paper also includes the comparison of steel and FRP on the same module and
also gives the final load v/s deflection curve under the both linear and non-linear
properties of the materials.
8

LIST OF TABLES
SR. NO.
1.1
TITLE OF THE TABLE
Typical Fibre Properties
PAGE NO.
2
1.2 Material Type of specimen - 1 18
1.3 Real Constants of specimen - 1 19
1.4 Material Properties of specimen - 1 21
1.5 Result Comparison of specimen -1 38
1.6 Material Type of specimen – 2 39
1.7 Real Constants of specimen – 2 41
1.8 Material Properties of specimen – 2 43
1.9 Result Comparison of specimen -2 56
1.10 Material Type of specimen – 3 60
1.11 Real Constants of specimen – 3 61
1.12 Material Properties of specimen – 3 63
1.13 Result Comparison of specimen -3 76
1.14 Test Program 82
1.15 Tensile Properties of Leadline 83
1.16 Concrete Properties 83
1.17 Prestressing Force in the Tested Beams 84
9

LIST OF FIGURES
SR.NO.
1.
NAME OF THE FIGURE
Geometry of Solid 65
PAGE NO.
6
2. Geometry of Shell 43 7
3. Geometry of Link 8 8
4. Geometry of Link 45 8
5. Geometry of Contra 173 and Target 170 9
6. Geometry of Combin 39 10
7. Stress-Strain curve of concrete 23
8. Cross and Reinforcement Details 24
9. Line Diagram of the R-2-.5V 25
10. Line Diagram showing Tendons 25
11. Cross-Sectional View of Elements 26
12. Isometric View of Element 26
13. Behavior of Beam 34
14. Bursting Zone due to prestressing 34
15. Y-Component Displacement 35
16. Load vs. Midspan Deflection with no prestressing 35
17. Load vs. Midspan Deflection with 30% prestressing 36
18. Load vs. Midspan Deflection with 50% prestressing 36
19. Load vs. Midspan Deflection with 70% prestressing 37
20. Load vs. Midspan Deflection with 100% prestressing 37
21. Stress- Strain Curve of Concrete 44
22. Line Diagram of Beam 45
23. Outline of Beam In Ansys 45
24. Cross-Sectional View of Elements 46
25. Isometric View of Element 46
26. Elements of Beam 54
1

27. Stress Distribution in beam 54
28. Stress in X-Direction 55
29. Stress in Y-Direction 55
30. Deflection for Sr. No. 2 57
31. Deflection for Sr. No. 3 57
32. Deflection for Sr. No. 4 58
33. Deflection for Sr. No. 5 58
34. Stress Strain curve of concrete 65
35. Outline of beam in Ansys 65
36. Front line view 66
37. Elements after Meshing 66
38. Elements of Beam 74
39. Stress Pattern 74
40. Deflection of beam 75
41. Line Diagram 75
42. Final Graph for Load v/s Deflection 76
43. Load v/s Deflection For Sr. No. 1 77
44. Load v/s Deflection For Sr. No. 2 77
45. Load v/s Deflection For Sr. No. 3 78
46. Load v/s Deflection For Sr. No. 4 78
47. Cross Section of the Tested Beams 81
48. Details of End Zone of the Beam 81
49. Stress-Strain Relationship of Lead line Bar 84
50. Load-Deflection graph with different number of 87
Lead line Bars
51. Stress Strain Behavior of beams 88
1

List of Abbreviations
SR. NO.
1.
Abbreviation
FRP
Full Form
Fibre Reinforced Polymer
2. GFRP Glass Fibre Reinforced Polymer
3. AFRP Aramid Fibre Reinforced Polymer
4. CFRP Carbon Fibre Reinforced Polymer
5. CFCC Carbon Fibre Composite Cable
6. FEM Finite Element Modelling
7. UX Degree in freedom X- direction
8. UY Degree of freedom in Y-direction
9. UZ Degree of freedom in Z-direction
10. MAT Material
11. EX Modulus of Rigidity
12. PRXY Poisson’s Ratio
xii

METHODOLOGY 3.1 RESEARCH METHODOLOGY
Finite element method was used to study the behavior of pre-stressed beam
using FRP Tendons. Linear and non-linear analyses were carried out to evaluate the stress
in the beam. The finite element modeling of beam was validated with the results available
from literature. The results of experimental investigation were used for validation of the
finite element model. Finite element analyses on the simply supported beam were carried
out and the results are presented. From the analytical investigation, the behavior of FRP
Tendons can be studied.
13

Methodology flow chart
14
CHAPTER 1
INTRODUCTION
1.1 GENERAL
(REFER ACI440-04R)
Fibre-reinforced polymer (FRP) composites have been proposed for use as
prestressing tendons in concrete structures. The promise of FRP materials lies in their high-
strength lightweight, noncorrosive, non-conducting, and nonmagnetic properties. In
addition, FRP manufacturing, using various cross-sectional shapes and material
combinations, offers unique opportunities for the development of shapes and forms that
would be difficult or impossible with conventional steel materials. Lighter-weight
materials and preassembly of complex shapes can boost constructability and efficiency of
construction.
At present, the higher cost of FRP materials suggests that FRP use will be confined
to applications where the unique characteristics of the material are most appropriate.
Efficiencies in construction and reduction in fabrication costs will expand their potential
market. FRP reinforcement is available in the form of bars, grids, plates, and tendons. This
document examines both internal and external prestressed reinforcement in the form of
tendons.
One of the principal advantages of FRP tendons for prestressing is the ability to
configure the reinforcement to meet specific performance and design objectives. FRP
tendons may be configured as rods, bars, and strands as shown in Table. 1.1. The surface
texture of FRP tendons may vary, resulting in bond with the surrounding concrete that
varies from one tendon configuration to another. Unlike conventional steel reinforcement,
there are no standardized shapes, surface configurations, fibre orientation, constituent
materials, and proportions for the final products.
Similarly, there is no standardization of the methods of production, such as
pultrusion, braiding, filament winding, or FRP preparation for a specific application. Thus,
1 | P a g e

2 | P a g e
FRP materials require considerable engineering effort to use properly. Bakis (1993) has
outlined manufacturing processes. FRP tendons are typically made from one of three basic
fibres. These fibres are aramid, carbon, and glass. Aramid fibres consist of a semi crystalline
polymer known as aromatic polyamide. Carbon fibres are based on the layered grapheme
(hexagonal) networks present in graphite, while glass generally uses either E-glass or S-
glass fibres. E-glass is a low-cost calcium-alumino boro silicate glass used where strength,
low conductivity, and acid resistance are important. S-glass is a magnesium- alumino
silicate glass that has higher strength, stiffness, and ultimate strain than E-glass. S- glass
costs more than E-glass, and both are susceptible to degradation in alkaline
environments. Table 1.1 gives properties of typical fibres.
The selection of the fibre is primarily based on consideration of cost, strength,
stiffness, and long-term stability. Within these fibre groups, different performance and
material characteristics may be achieved. For example, aramids may come in low, high,
and very high modulus configurations. Carbon fibres are also available with moduli
ranging from below that of steel to several multiples of that of steel. Of the several fibre
types, glass-based FRP reinforcement is least expensive and generally uses either E-glass
or S-glass fibres. The resins used for fibre impregnation are usually thermosetting and may
be polyester, vinyl ester, epoxy, phenolic, or polyurethane.
The formulation, grade, and physical-chemical characteristics of resins are
practically limitless. The possible combinations of fibres, resins, additives, and fillers make
generalization of the properties of FRP tendons very difficult. Additionally, FRP
composites are heterogeneous and anisotropic. Final characteristics of an FRP tendon are
dependent on fibre and resin properties, as well as the manufacturing process. Specific
details of a particular tendon should be obtained from the manufacturer of the tendon.

The advantages of FRP reinforcement in comparison to steel reinforcement are as follows:
I. High ratio of strength to mass density (10 to 15 times greater than steel)
II. Carbon and Aramid fibre reinforcements have excellent fatigue characteristics(as
much as three times higher than steel) However, the fatigue strength ofglass FRP
reinforcement may be significantly below steel's
III. Excellent corrosion resistance and electromagnetic neutrality
IV. Low axial coefficient of thermal expansion, especially for carbon fibre reinforced
composite materials.
The disadvantages of FRP reinforcement include:
I. High cost (5 to 50 times more than steel)
II. Low modulus of elasticity (for Aramid and glass FRP)
III. Low ultimate failure strain
IV. High ratio of axial to lateral strength causing concern for anchorages when using
FRP reinforcement for prestressing
V. Long term strength can be lower than the short-term strength for
FRPreinforcement due to creep rupture phenomenon
VI. Susceptibility of FRP to damage by ultra-violet radiation
VII. Aramid fibres can deteriorate due to water absorption
VIII. High transverse thermal expansion coefficient in comparison to concrete
The tensile characteristics of reinforcement made from Carbon Fibre Reinforced
Plastic (CFRP) , Aramid Fibre Reinforced Plastic (AFRP), and Glass Fibre Reinforced
Plastic (GFRP), are compared to steel.
3 | P a g e

1.2 Material Introduction
1.2.1 Glass:
Two types of glass fibres are commonly used in the construction industry, namely-
glass and S-glass. E-glass type is the most widely used GFRP due to its lower cost
as compared to S-glass type, however S-glass has a higher tensile strength. Fresh
drawn glass fibres exhibit a tensile strength in the order of 3450 Mpa, but surface flaws
produced by abrasion tend to reduce the strength to 1700 Mpa. This strength is
furthered graded under fatigue loading due to the growth of flaws and also degrades in
the presence of water. Commercially GFRP prestressing tendons and rods are available
underthe brand names of Isopod by Pulpal Inc. (Canada), IMCa by Imia Reinforced
PlasticsInc. (USA), Jute by Cousin Frere (France), Kodiak by IGI International Grating
(USA),Plalloy by Asahi Glass Matrex (Japan), Polystal by Bayer AG and StragBau-
AG(Germany), and C-bar by Marshell Ind. (USA).
1.2.2 Aramid:
Aramid (abbreviation for aromatic polyamide) based FRP products have a
tensile strength in the range of 2650 to 3400 MPa and an elastic modulus of from 73 to
165GPa. AFRP prestressing tendons are produced in different shapes such as spiral
wound,braided, and rectangular rods. It has been reported that there is no fatigue limit
for Aramid fibres, however creep-rupture phenomenon has been observed. Aramid fibres
are also quite sensitive to ultra-violet radiation. Commercially, AFRP prestressing tendons
androds are available under the brand names of Technora by Teijin (Japan), Fibre by Mitsui
(Japan), Arapree by AKZO and Hollands cheBetonGroep (Holland), Phillystran by United
Ropeworks (USA), and Parafil Ropes by ICI Linear Composites (UK).
1.2.3 Carbon:
Carbon fibres can be produced from two materials, namely textile (PAN-based)and
PITCH-based material. The most common textile material is poly-acrylonitrile
(PAN).PITCH-based material is a by-product of petroleum refining or coal coking. Carbon
4 | P a g e

Fibres have exceptionally high tensile strength to weight ratios with strength ranging
from 1970to 3200 MPaand tensile modulus ranging from 270 to 517 GPa. These fibres
also have a low coefficient of linear expansion on the order of 0.2x 10⁻⁶ mimiC, and
high fatigue strength. However, disadvantages are their low impact resistance, high
electrical conductivity, and high cost. Commercially available CFRP prestressing tendons
are available under the brand names of Carbon Fibre Composite Cable (CFCC) by
TokyoRope (Japan), Leadline by Mitsubishi Kasai (Japan), Jitec by Cousin Frere (France),
and Bri-Ten by British Ropes (UK).
1.2.4 Carbon Fibre Composite Cable (CFCC):
Carbon Fibre Composite Cables (CFCC) made in Japan by Tokyo
RopeManufacturing Co. use PAN (polyacrylonite) type carbon fibres supplied by Toho
Rayon.Individual wires are manufactured by a roving prepreg process where the epoxy
resin is heat cured. The prepreg is twisted to create a fibre core and then wrapped by
synthetic yarns. The purpose of the yarn is to protect the fibres from ultra-violet radiation
and mechanical abrasion, and also improves the bond properties of the wire to
concrete.Cables are then made from one, seven, nineteen, or thirty-seven wires and are
twisted to allow better stress distribution through the cross-section.
Tokyo Rope currently produces cables with diameters from 3 to 40 mm in any length
up to 600 metres. For 12.5 and 15.2 mm diameter CFCC cables the ultimate tensile strengths
are 2100 and 2150 MPa respectively. Both sizes have a tensile elastic modulus of 137 GPa
and an ultimate tensile failure strain of 1.5 to 1.6%. The thermal coefficient of expansion is
approximately 0.6xl0-6 /C which is about 1/20 that of steel. The relaxation is about 3.5%
after 30 years at 80% of the ultimate load, this is about 50% less than that of steel. Also
pull-out tests show that CFCC has a bond strength to concrete of6.67 MPa, which is more
than twice that of steel.
5 | P a g e

1.3 Finite element method
1.3.1 General :
There are many software which is use for analysis but Ansys gives more accurate
results compared to other software.
1.3.2 Ansys:
The ANSYS computer program is utilized for analyzing structural components
encountered throughout the current study. Finite element representation and corresponding
elements designation in ANSYS used in this study are discussed:-
1.3.2.1 Finite element model of concrete
The finite element idealization of concrete should be able to represent the concrete
cracking, crushing, the interaction between concrete and reinforcement and the capability
of concrete to transfer shear after cracking by aggregate interlock. In order to investigate
the failure in concrete for prestressed composite steel-concrete beams, three dimensional
elements are to be used.
In the current study, three-dimensional brick element with 8 nodes is used to model
the concrete (SOLID65 in ANSYS). The element is defined by eight nodes having three
degrees of freedom at each node: translations of the nodes in x, y, and z-directions. The
geometry, node locations, and the coordinate system for this element are shown in Figure
1.
Fig: 1. Geometry Of SOLID65
6 | P a g e
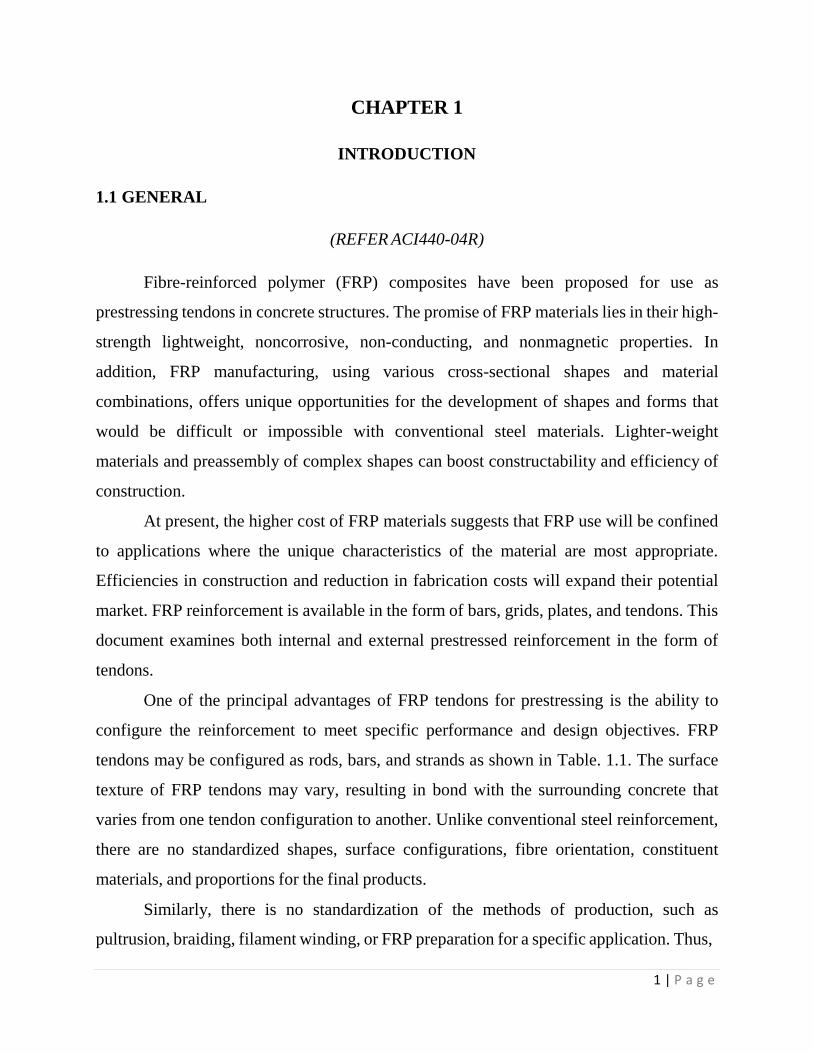
1.3.2.2 Finite element model of steel beam
To represent the steel beam in finite element, 4-node shell element is needed
with three translations in x, y and z in each node to achieve the compatibility condition
with translation in x, y and z in adjacent brick element to it. For this purpose, three-
dimensional 4-node shell element, which is represented as (SHELL43 in ANSYS) is used,
regardless of the rotations in each nodes. The element has plasticity, creep, stress
stiffening, large deflection, and large strain capabilities. The geometry, node locations,
and the coordinate system for this element are shown in Figure 2.
Fig: 2. Geometry Of SHELL43
1.3.2.3Finite element model of reinforcement
To model steel reinforcement in finite element. Three techniques exist these are
discrete, embedded, and smeared. The discrete model (LINK8) is used in this study. The
LINK8 is a spar (or truss) element. This element can be used to model trusses, sagging
cables, links, springs, etc. The 3-D spar element is a uniaxial tension-compression
element with three degrees of freedom at each node: translations of the nodes in
x, y, and z-directions. No bending of the element is considered. The geometry, node
locations, and the coordinate system for this element are shown in Figure 3.
7 | P a g e

1.3.2.4 Finite element model of external prestressed tendon
In the present study the prestressing stress was taken as the initial value and
equal to the effective stress .It appears in the analysis as initial strain in link element.
Link8 is used to represent the external cable. Since the cable is located outside the steel
section and the prestressing force is transferred to composite beam through end anchorages
and stiffeners, the cable is connected to beam only at the anchorage or stiffeners.
1.3.2.5 Finite element model of steel plates
Steel plates are added at the loading location to avoid stress concentration
problems. This provides a more even stress distribution over the load area. The solid
element (SOLID45 in program) was used for the steel plates. The element is used for the
3-D modelling of solid structures. The element is defined by eight nodes having three
degrees of freedom at each node translations in the nodal x, y, and z directions as shown
in Figure (4).
Fig: 4. Geometry Of SOLID45
Fig: 3. Geometry Of LINK8
8 | P a g e
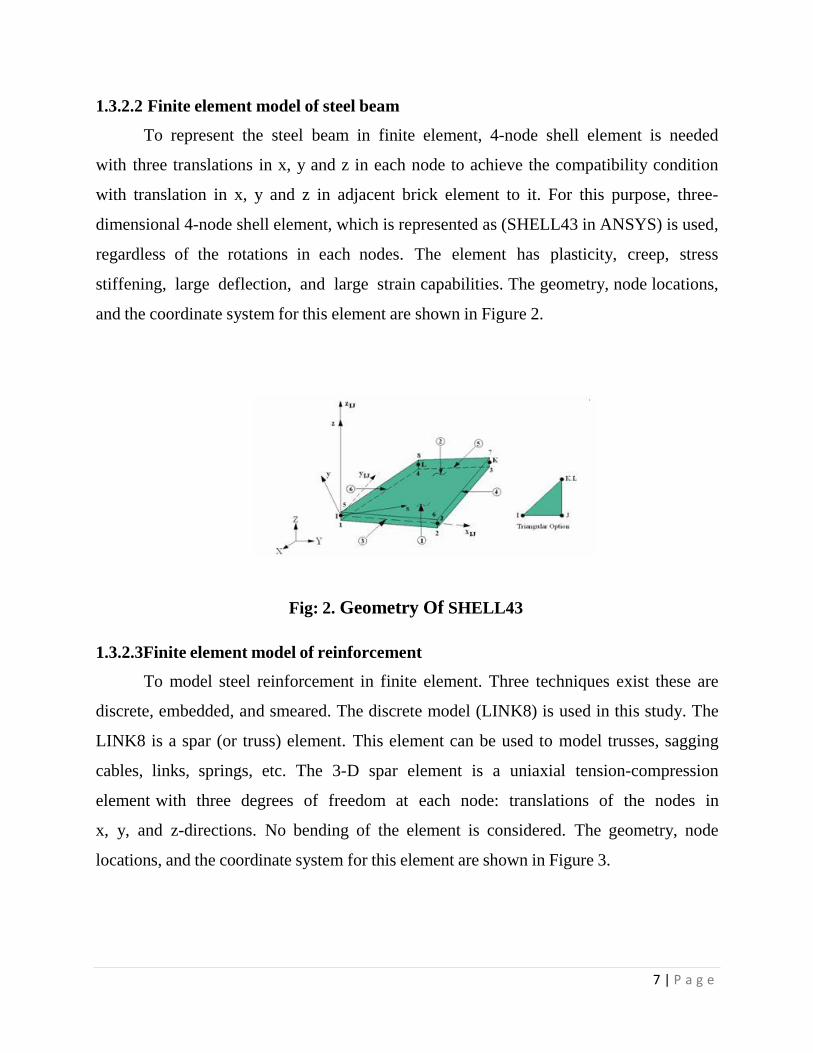
1.3.2.6 Finite element model of interface surface
A three-dimensional nonlinear surface-to-surface “contact-pair” element (CONTA-
173& TARGE170) was used to model the nonlinear behaviour of the interface
surface between concrete and steel beam. The contact-pair consists of the contact
between two boundaries, one of the boundaries represents contact, slid and deformable
surface taken as contact surface (CONTA-173 in ANSYS) and the other represents rigid
surface taken as a target surface
(TARGE-170 in ANSYS). Figure 5 shows the geometry of (CONTA173& TARGE170).
Fig: 5.Geometry of CONTA173 and TARGET170
1.3.2.7Representation of shear connectors
A nonlinear spring element (COMBIN39 in ANSYS) and (Link8) are used to
represent the shear connectors behaviour. COMBIN39 is used to resist the normal
force between the concrete and steel beam while Link8 works as stirrups in resisting
the vertical shear at concrete layer.
COMBIN39 is a unidirectional element (or nonlinear spring) with nonlinear
generalized force-deflection capability that can be used in any analysis.
The element has longitudinal or torsional capability in 1-D, 2-D, or 3-D
applications. The geometry, node locations, and the coordinate system for this element are
shown in Figure 6.
9 | P a g e

Fig: 6. Geometry of COMBIN39
10 | P a g e

CHAPTER 2
LITERATURE SURVEY
2.1 General
To provide a detailed review of the body of literature related to reinforce and prestressed
concrete in its entirety would be too immense to address in this paper. However, there are
many good references that can be used as a starting point for research (ACI
1978,MacGregor 1992, Nawy 2000). This literature review and introduction will focus
on recent contributions related to FEA and past efforts most closely related to the needs
of the present work.
The use of FEA has been the preferred method to study the behavior of concrete
(For economic reasons). William and Tanabe (2001) contains a collection of papers
concerning finite element analysis of reinforced concrete structures. This collection
contains areas of study such as: seismic behavior of structures, cyclic loading of
reinforced concrete columns, shear failure of reinforced concrete beams, and concrete
steel bond models.
Shing and Tanabe (2001) also put together a collection of papers dealing with
In-elastic behavior of reinforced concrete structures under seismic loads. The
monograph contains contributions that outline applications of the finite element method for
studying post-peak cyclic behavior and ductility of reinforced concrete beam, the analysis
of reinforced concrete components in bridge seismic design, the analysis of reinforced
concrete beam-column bridge connections, and the modeling of the shear behavior of
reinforced concrete bridge structures.
The focus of these most recent efforts is with bridges, columns, and seismic design.
The focus of this thesis is the study of non-prestressed and prestressed flexural members.
AMR A. ABDELRAHMAN(1995) give the basic behavior of prestressed member
with full experimental data and the specification of the section with its dimension and the
11 | P a g e

number of strands used in every section during casting. He also provides the property of
FRP material used in the section and the results obtained after the testing of the section.
The following is a review and synthesis of efforts most relevant to this thesis
discussing FEA applications, experimental testing, and concrete material models.
2.2 Serviceability of concrete beams prestressed by fibre reinforced plastic tendons
by Amr a. abdelrahman
Use of carbon fibre reinforced plastic, CFRP, as prestressing reinforcement
for Concrete structures, has increased rapidly for the last ten years. The non-corrosive
Characteristics, high strength-to-weight ratio and good fatigue properties of CFRP
Reinforcement significantly increase the service life of structures. However, the high cost
and low ductility of CFRP reinforcement due to its limited strain at failure are problems yet
to be solved for widespread use of this new material. Use of partially prestressed concrete
members has the advantages of reducing cost and improving deform ability.
However, the deflection and cracking of concrete beams partially prestressed by
CFRP reinforcement should be investigated.An experimental program undertaken at the
University of Manitoba to study the serviceability of concrete beams prestressed by CFRP
reinforcements is reported. Testsare described of eight concrete beams prestressed by
Leadline CFRP bars, produced by Mitsubishi Kasei, Japan, and two beams prestressed by
conventional steel strands. The beams are 6.2 meters long and 330 mm in depth. The
various parameters considered are the prestressing ratio, degree of prestressing, and
distribution of CFRP rods in the tension zone. The thesis examines the various limit states
and flexural behavior of concrete beams prestressed by CFRP bars, including different
modes of failure. The behavior of beams prestressed by CFRP bars is compared to similar
beams prestressed by conventional steel strands.
12 | P a g e

Theoretical models are proposed to predict the deflection prior and after cracking
and the crack width of concrete beams prestressed by Lead lineCFRP bars under service
loading conditions. Crack width is predicted using appropriate bond factors for this type of
reinforcement. A procedure is formulated for predicting the location of the centroidal axis
of the cracked sections prestressed by CFRP bars. In addition, a method is proposed to
calculate the deflection and the crack width of beams partially prestressed by CFRP bars
under repeated load cycles within the service loading range. The deform ability of concrete
beams prestressed by CFRP reinforcement is also discussed. A model is proposed to
quantify the deform ability of beams prestressed by fiber reinforced plastic
reinforcements.The reliability of the proposed methods and the other methods used from
the literature to predict the deflection and the crack width is examined by comparing the
measured and the computed values of the tested beams and beams tested by others.
An excellent agreement is found for the methods predicting the deflection and a good
agreement is found for the crack width prediction. Design guidelines for prestressed
concrete beams with CFRP reinforcement are also presented.
2.3 Finite Element Analysis of Prestressed Concrete Beams By Abhinav S.Kasat &
Alsson varghese
Finite element analysis is an effective method of determining the static
performance of structures for the reasons which are saving in design time cost effective in
construction and increase the safety of the structure. Previously it is necessary to use
advanced mathematical methods in analysis large structures, such as bridges tall buildings
and other more accuracy generally required more elaborate techniques and therefore a
large friction of the designer’s time could be devoted to mathematical analysis. Finite
element methods free designer’s from the need to concentrate on mathematical calculation
and allow them to spend more time on accurate representation of the intended
structure and review of the calculated performance (Smith, 1988). Furthermore by using
the programs with interactive graphical facilities it is possible to generate finite element
models of complex structures with considerable ease and to obtain the results in a
13 | P a g e
convenient readily assimilated form.This may save valuable design time. More accurate
analysis of structure is possible by the finite element method leading to economics in
materials and construction also in enhancing the overall safety (DeSalvoand
Swanson,1985).
However in order to use computer time and design time effectively it is important to
plan the analysis strategy carefully. Before a series of dynamic tests carry out in the field
a complete three-dimensional finite element models are developed for a bridges prior to
its testing. The results from these dynamic analyses are used to select instrument positions
on the bridge and predict static displacement. Then, they are calibrated using the
experimental frequencies and mode shapes. The frequencies and mode shapes mainly are
used to provide a basis for the study of the influence of certain parameters on the dynamic
response of the structure the influence of secondary structural elements the cracking of the
deck slabs the effects of long-term concrete creep and shrinkage and soon (Paultre and
Proulx, 1995). Besides more sophisticated methods based on finite element or finite strip
representation have been used by some researchers to study the dynamic behaviour of
bridges Fam(1973) and Tabba (1972)studied the behaviour of curved box section bridges
using the finite element method for applied static and dynamic loads. A three-
dimensional finite element analysis program was developed for curved cellular structures.
Solutions of several problems involving static and dynamic responses were presented
using the proposed and others sophisticated methods of analysis. An experimental study
conducted on two curved box girder Plexiglas models confirmed here liability of the
proposed methods of analysis.
2.4 Element Used In Prestressed MemberANSYS 2012
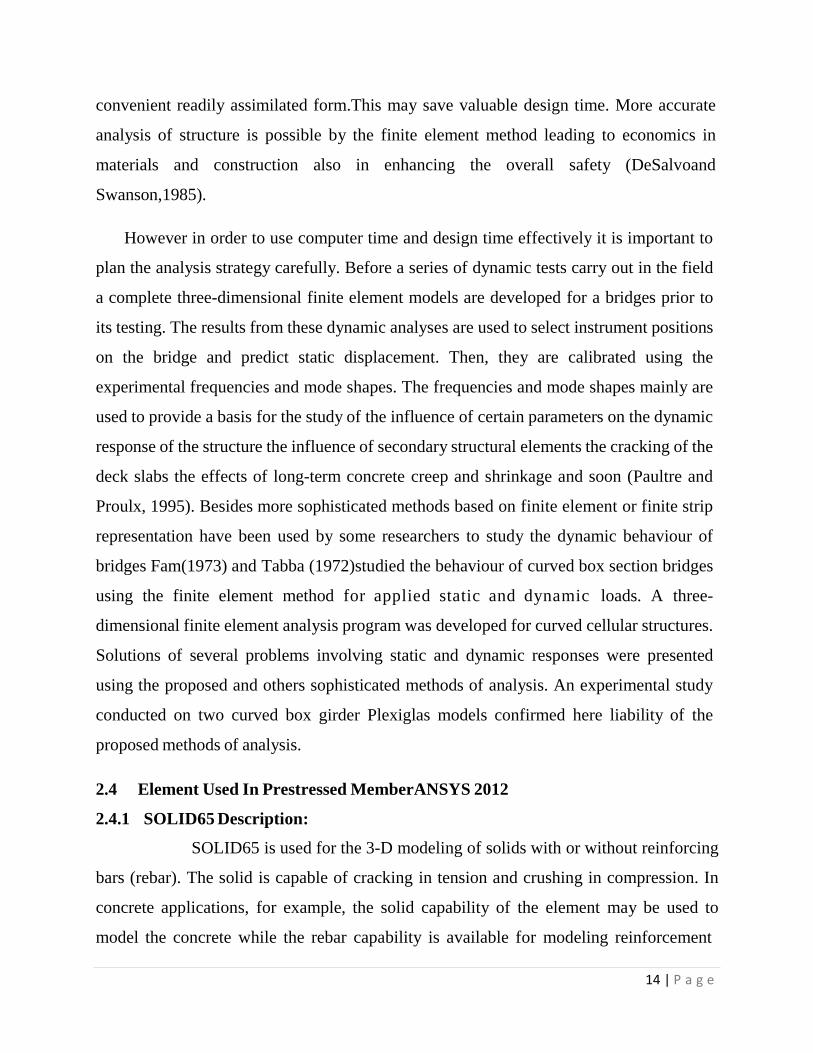
2.4.1 SOLID65 Description:
SOLID65 is used for the 3-D modeling of solids with or without reinforcing
bars (rebar). The solid is capable of cracking in tension and crushing in compression. In
concrete applications, for example, the solid capability of the element may be used to
model the concrete while the rebar capability is available for modeling reinforcement
14 | P a g e

behavior. Other cases for which the element is also applicable would be reinforced
composites (such as fiberglass), and geological materials (such as rock). The element is
defined by eight nodes having three degrees of freedom at each node: translations in the
nodal x, y, and z directions. Up to three different rebar specifications may be defined.The
concrete element is similar to the SOLID45 (3-D Structural Solid) element with the
addition of special cracking and crushing capabilities. The most important aspect of this
element is the treatment of nonlinear material properties. The concrete is capable of
cracking (in three orthogonal directions), crushing, plastic deformation, and creep. The
rebar are capable of tension and compression, but not shear. They are also capable of plastic
deformation and creep. See SOLID65 in the ANSYS, Inc. Theory Reference for more details
about this element.
Solid 65 Geometry
15 | P a g e

SOLID65
Input Summary
Nodes:-I, J, K, L, M, N, O, P
Degrees of Freedom:-UX, UY, UZ
Real Constants:-MAT1, VR1, THETA1, PHI1, MAT2, VR2,THETA2, PHI2, MAT3,
VR3, THETA3, PHI3, CSTIF
(where MATn is material number, VRn is volume ratio, and THETAn and PHIn are
orientation angles for up to 3 rebar materials)
Material Properties
EX, ALPX (or CTEX or THSX), DENS (for each rebar) EX, ALPX (or CTEX or
THSX), PRXY or NUXY, DENS (for concrete)
Supply DAMP only once for the element (use MAT command to assign material
property set). REFT may be supplied once for the element, or may be assigned on a per
rebar basis. See the discussion in "SOLID65 Input Data" for more details.
Special Features
Plasticity
Creep
Cracking
Crushing
Large deflection
Large strain
Stress stiffening
Birth and death
Adaptive descent
16 | P a g e

2.4.2 LINK8 Description:
LINK8 is a spar which may be used in a variety of engineering applications. This
element can be used to model trusses, sagging cables, links, springs, etc. The 3-D spar
element is a uniaxial tension-compression element with three degrees of freedom at each
node: translations in the nodal x, y, and z directions. As in a pin-jointed structure, no
bending of the element is considered. Plasticity, creep, swelling, stress stiffening, and large
deflection capabilities are included. See LINK8 in the ANSYS, Inc. Theory Reference for
more details about this element. See LINK10 for a tension-only/compression-only element.
LINK8 Input Summary
Nodes:-I, J
Degrees of Freedom:-UX, UY, UZ
Real Constants:- REA - Cross-sectional areaISTRN - Initial strain
Material Properties EX, ALPX (or CTEX or THSX), DENS, DAMP
Special Features
Large deflection ,Creep,Large deflection, Plasticity, Stress
stiffening, Swelling , Birth and death
LINK8 GEOMETRY
17 | P a g e

CHAPTER 3
ANSYS MODEL
3.1 General
3.1.1Element Types
Table: 1.2- Material Type
Material Type ANSYS Element
Concrete Solid 65
Steel Plates and Supports Solid 45
Reinforcement Link 8
The element types for this model are shown in Table 1.2. The Solid65 element was
used to model the concrete. This element has eight nodes with three degrees of freedom at
each node – translations in the nodal x, y, and z directions. This element is capable of
plastic deformation, cracking in three orthogonal directions, and crushing.
A Solid45 element was used for steel plates at the supports for the beam. This
element has eight nodes with three degrees of freedom at each node – translations in the
nodal x, y, and z directions.
A Link8 element was used to model steel reinforcement. This element is a 3D spar
element and it has two nodes with three degrees of freedom – translations in the nodal x,
y, and z directions. This element is also capable of plastic deformation.
3.2 Real Constants
The real constants for this model are shown in Table: 1.3. Note that individual
elements contain different real constants. No real constant set exists for the Solid45
element. Real Constant Set 1 is used for the Solid65 element. It requires real constants for
18 | P a g e

rebar assuming a smeared model. Values can be entered for Material Number, Volume
Ratio, and Orientation Angles. The material number refers to the type of material for the
reinforcement. The volume ratio refers to the ratio of steel to concrete in the element. The
orientation angles refer to the orientation of the reinforcement in the smeared model.
ANSYS allows the user to enter three rebar materials in the concrete.
Each material corresponds to x, y, and z directions in the element. The
reinforcement has uniaxial stiffness and the directional orientation is defined by the user.
In the present study the beam is modelled using discrete reinforcement.
Therefore, a value of zero was entered for all real constants which turned the
smeared reinforcement capability of the Solid65 element off. Real Constant Sets 2 is
defined for the Link8 element. Values for cross-sectional area and initial strain were
entered.
Table:1.3- Real Constants
Real Constant Element Type Constants
Real
Constants
for Rebar
1
Real
Constants
for Rebar
2
Real
Constants
for Rebar
3
Material
Number
0 0 0
Volume
Ratio
0 0 0
19 | P a g e
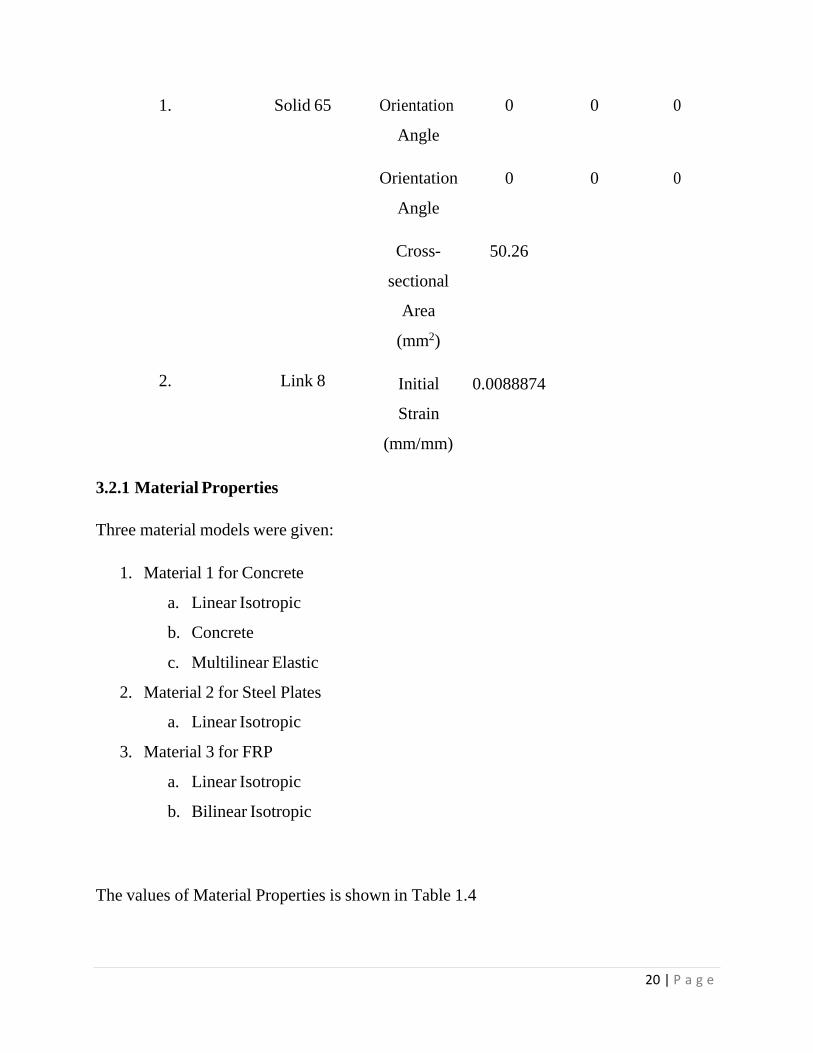
1. Solid 65 Orientation
Angle
0 0 0
Orientation 0 0 0
Angle
Cross- 50.26
sectional
Area
(mm2)
2. Link 8 Initial 0.0088874
Strain
(mm/mm)
3.2.1 Material Properties
Three material models were given:
1. Material 1 for Concrete
a. Linear Isotropic
b. Concrete
c. Multilinear Elastic
2. Material 2 for Steel Plates
a. Linear Isotropic
3. Material 3 for FRP
a. Linear Isotropic
b. Bilinear Isotropic
The values of Material Properties is shown in Table 1.4
20 | P a g e

Table: 1.4- Material Properties
Material Model No. Element Type Material Properties
Linear Isotropic
EX 38,480
PRXY 0.2
Multilinear Isotropic 1. Solid 65
Point 1
Strain
0.00036
Stress
9.8023 Point 2 0.0006 15.396 Point 3 0.0013 27.517
21 | P a g e

Point 4 0.0019 32.102
Point 5 0.00243 33.095
Concrete
ShrCf-Op 0.3
ShrCf-Cl 1
UnTensSt 5.3872
UnTensSt -1
BiCompSt 0
HydroPrs 0
BiCompSt 0
UnTensSt 0
TenCrFac 0
Linear Isotropic
2. Solid 45 EX 2,00,000 PRXY 0.3
Linear Isotropic
EX 1,87,000
PRXY 0.65
3. Link 8 Bilinear Isotropic
Yield Stress 2050
Tang Mod 0.65
22 | P a g e

Fig: 7. Stress- Strain Curve of Concrete
23 | P a g e

3.2.2Modelling
3.2.2.1Model 1
Fig: 8. Cross and Reinforcement Details
24 | P a g e

Fig: 9. Line Diagram of the R-2-.5V
Fig: 10. Line Diagram showing Tendons
25 | P a g e

3.2.3Meshing
Fig: 11. Cross-Sectional View of Elements
Fig: 12. Isometric View of Element
26 | P a g e

3.2.4 Numbering Controls
The command merge items merges separate entities that have the same
location. These items will then be merged into single entities. Caution must be taken when
merging entities in a model that has already been meshed because the order in which
merging occurs is significant. Merging keypoints before nodes can result in some of the
nodes becoming “orphaned” that is, the nodes lose their association with the solid model.
The orphaned nodes can cause certain operations (such as boundary condition transfers,
surface load transfers, and so on) to fail. Care must be taken to always merge in the order
that the entities appear. All precautions were taken to ensure that everything was merged
in the proper order. Also, the lowest number was retained during merging.
Commands Used
NUMMRG,NODE – To merge all nodes
NUMMRG,KP – To merge all keypoints
27 | P a g e

3.2.5 Boundary Conditions
Displacement boundary conditions are needed to constrain the model to get a unique
solution. To ensure that the model acts the same way as the experimental beam, boundary
conditions need to be applied at points of symmetry, and where the supports and loadings
exist. The symmetry boundary conditions were set first.
(Go To Main Menu)
Solution
Define Loads
Apply
Structural
Displacement
On Lines
(Pick lines) & OK
(Lab2) All DOF (DOFs to be constrained)
(Value) 0
OK
3.2.6 Analysis Type
The finite element model for this analysis is a simple beam under transverse loading.
For the purposes of this model, the Static analysis type is utilized. The Restart command
is utilized to restart an analysis after the initial run or load step has been completed. The
use of the restart option will be detailed in the analysis portion of the discussion.
28 | P a g e

(Go To Main Menu)
Solution
Analysis Type
Static & OK
3.2.7 Load Step Method
Step 1
(Go To Main Menu)
Solution
Solution Controls
Basic – Enter the values as shown below.
29 | P a g e

Step 2
(Go To Main Menu)
Solution
Solution Controls
Nonlinear - Enter the values as shown below.
Step 3
(Go To Main Menu)
Solution
Define Loads
Apply
Structural
Force/Moment Value On Nodes
30 | P a g e

Step 4
(Go To Main Menu)
Solution
Load Step Opts
Write LS File
(Value) Load Step file number n, 1 &OK
31 | P a g e

Step 5
(Go To Main Menu)
Solution
Define Loads
Delete
Structural
Force/Moment Value
On Nodes- Pick All
Step 6
Repeat the procedure from step 1 to step 5 with different load values.
Step 7
(Go To Main Menu)
Solution
Solve
From LS File
(Value) LSMIN- 1, LSMAX- 6, LSINC- 1
32 | P a g e
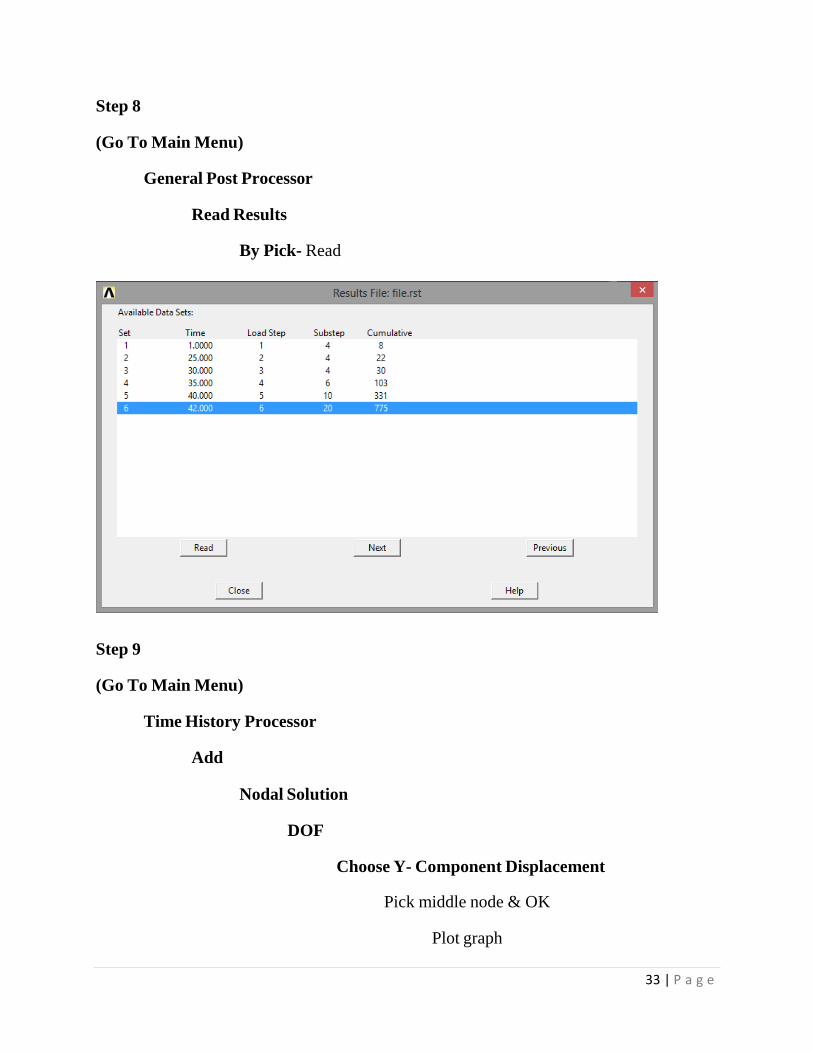
Step 8
(Go To Main Menu)
General Post Processor
Read Results
By Pick- Read
Step 9
(Go To Main Menu)
Time History Processor
Add
Nodal Solution
DOF
Choose Y- Component Displacement
Pick middle node & OK
Plot graph
33 | P a g e

3.2.8 Results
Fig: 13.Behaviour of Beam
Fig: 14. Bursting Zone due to prestressing
34 | P a g e

Fig: 15. Y-Component Displacement
Fig: 16. Load vs. Midspan Deflection with no prestressing
35 | P a g e

Fig: 17. Load vs. Midspan Deflection with 30% prestressing
Fig: 18. Load vs. Midspan Deflection with 50% prestressing
36 | P a g e

Fig: 19. Load vs. Midspan Deflection with 70% prestressing
Fig: 20. Load vs. Midspan Deflection with 100% prestressing
37 | P a g e

Table: 1.5-Result Comparison:
SNO. Pre-stressing
Force, KN
Percentage Pre-
stressing, %
Midspan
Deflection At
35KN Load(mm)
1. 0 0 160
2. 50.12 30 62
3. 83.53 50 20
4. 116.94 70 12
5. 167.06 100 11
3.Model No. 2
Beam Dimensions:
38 | P a g e

Total number of Tendons: - 4
Spacing between tendons: - 25mm
Total Span length :- 6200mm
3.3.1. Beam Property
Table 1.6- Material Type
Material Type ANSYS Element
Concrete Solid 65
Steel Plates and Supports Solid 45
Reinforcement Link 8
The element types for this model are shown in Table 1.6. The Solid65 element was
used to model the concrete. This element has eight nodes with three degrees of freedom at
each node – translations in the nodal x, y, and z directions. This element is capable of
plastic deformation, cracking in three orthogonal directions, and crushing.
39 | P a g e

A Solid45 element was used for steel plates at the supports for the beam. This
element has eight nodes with three degrees of freedom at each node – translations in the
nodal x, y, and z directions.
A Link8 element was used to model steel reinforcement. This element is a 3D spar
element and it has two nodes with three degrees of freedom – translations in the nodal x,
y, and z directions. This element is also capable of plastic deformation.
3.3.2. Real Constants
The real constants for this model are shown in Table 1.7. Note that individual
elements contain different real constants. No real constant set exists for the Solid45
element. Real Constant Set 1 is used for the Solid65 element. It requires real constants for
rebar assuming a smeared model. Values can be entered for Material Number, Volume
Ratio, and Orientation Angles. The material number refers to the type of material for the
reinforcement. The volume ratio refers to the ratio of steel to concrete in the element. The
orientation angles refer to the orientation of the reinforcement in the smeared model.
ANSYS allows the user to enter three rebar materials in the concrete.
Each material corresponds to x, y, and z directions in the element. The
reinforcement has uniaxial stiffness and the directional orientation is defined by the user.
In the present study the beam is modelled using discrete reinforcement.
Therefore, a value of zero was entered for all real constants which turned the
smeared reinforcement capability of the Solid65 element off. Real Constant Sets 2 is
defined for the Link8 element. Values for cross-sectional area and initial strain were
entered.
40 | P a g e
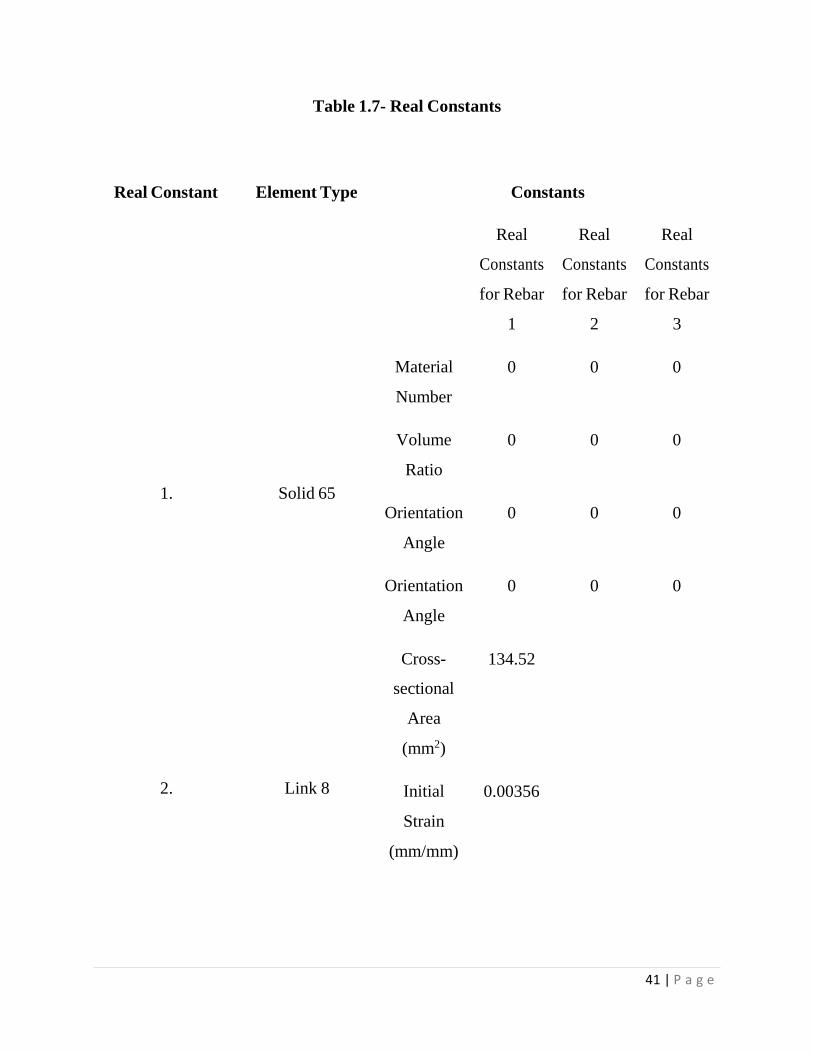
Table 1.7- Real Constants
Real Constant Element Type Constants
Real
Constants
for Rebar
1
Real
Constants
for Rebar
2
Real
Constants
for Rebar
3
Material 0 0 0
Number
Volume 0 0 0
Ratio
1. Solid 65 Orientation
0
0
0
Angle
Orientation 0 0 0
Angle
Cross- 134.52
sectional
Area
(mm2)
2. Link 8 Initial 0.00356
Strain
(mm/mm)
41 | P a g e

3.3.3. Material Properties
Three material models were given:
1. Material 1 for Concrete
a. Linear Isotropic
b. Concrete
c. Multilinear Elastic
2. Material 2 for Steel Plates
a. Linear Isotropic
3. Material 3 for FRP
a. Linear Isotropic
b. Bilinear Isotropic
The values of Material Properties is shown in Table 1.8
42 | P a g e

Table 1.8- Material Properties
Material Model No. Element Type Material Properties
Linear Isotropic
EX 38,480
PRXY 0.2
Multilinear Isotropic 1.
Concrete
ShrCf-Op 0.3
ShrCf-Cl 1
UnTensSt 5.3872
UnTensSt -1
BiCompSt 0
HydroPrs 0
BiCompSt 0
Solid 65 Strain
Stress
Point 1 0.00036 9.8023 Point 2 0.0006 15.396 Point 3 0.0013 27.517 Point 4 0.0019 32.102 Point 5 0.00243 33.095
43 | P a g e

Figure 3.1- Stress- Strain Curve of Concrete
UnTensSt 0
TenCrFac 0
Linear Isotropic
2. Solid 45 EX 2,00,000 PRXY 0.3
Linear Isotropic
EX 1,87,000
PRXY 0.65
3. Link 8 Bilinear Isotropic
Yield Stres 2050
Tang Mod 0.65
Fig: 21. Stress- Strain Curve of Concrete
44 | P a g e

3.3.4 Modelling
Fig: 22. Line Diagram of Beam
Fig: 23.Outline of Beam In Ansys
45 | P a g e
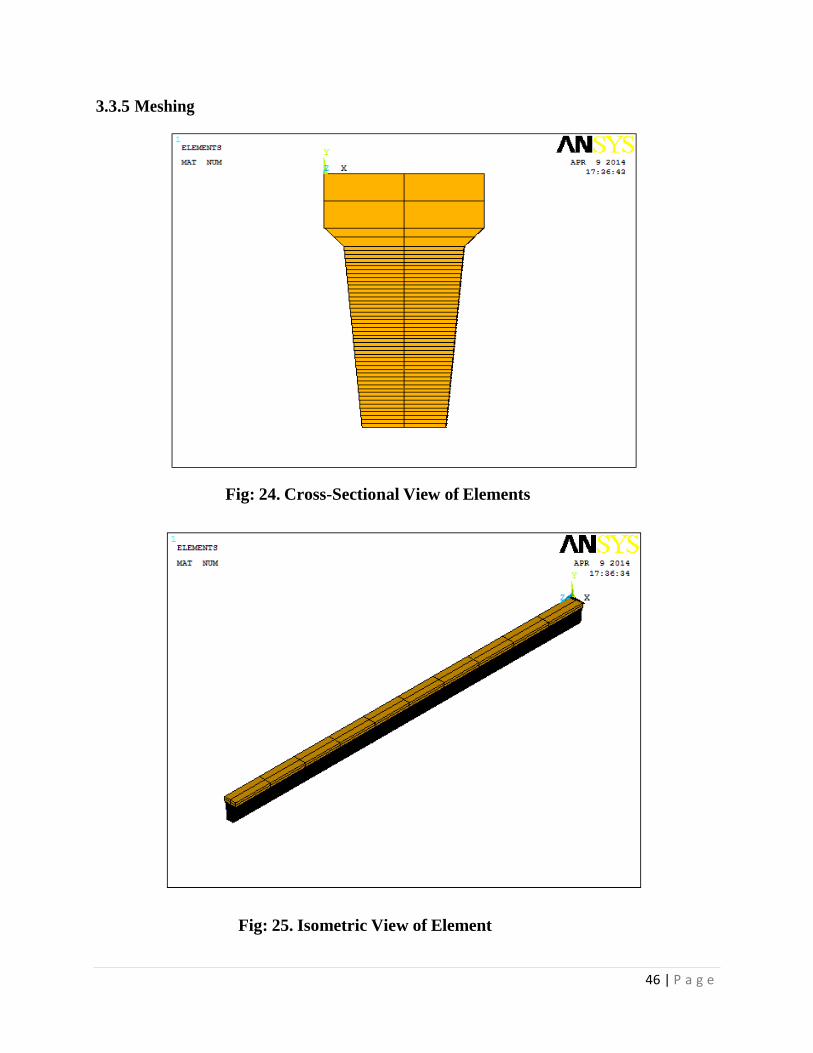
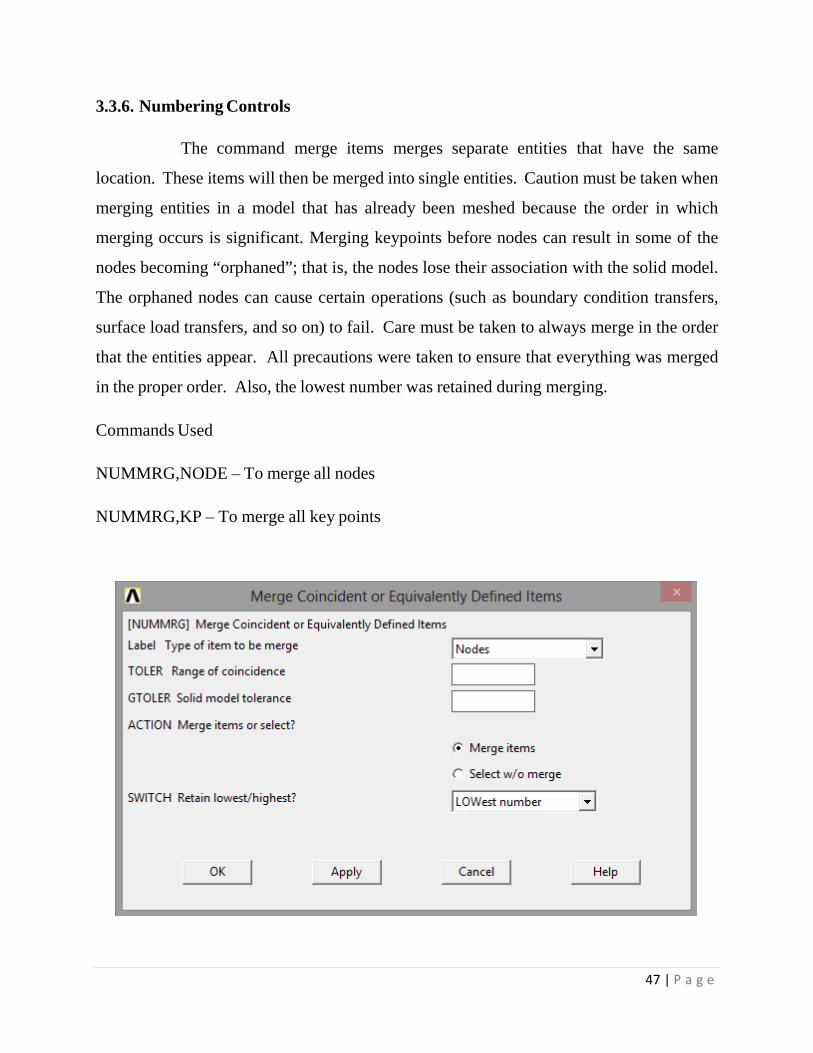
3.3.5 Meshing
Fig: 24. Cross-Sectional View of Elements
Fig: 25. Isometric View of Element
46 | P a g e
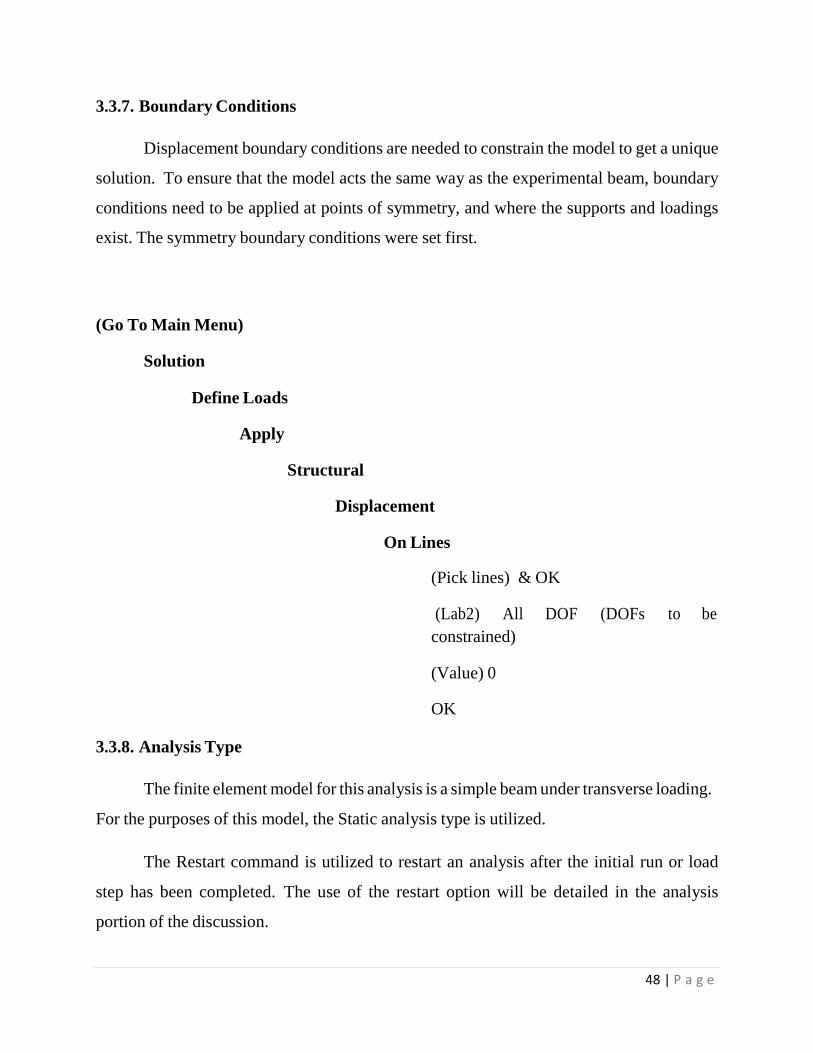
3.3.6. Numbering Controls
The command merge items merges separate entities that have the same
location. These items will then be merged into single entities. Caution must be taken when
merging entities in a model that has already been meshed because the order in which
merging occurs is significant. Merging keypoints before nodes can result in some of the
nodes becoming “orphaned”; that is, the nodes lose their association with the solid model.
The orphaned nodes can cause certain operations (such as boundary condition transfers,
surface load transfers, and so on) to fail. Care must be taken to always merge in the order
that the entities appear. All precautions were taken to ensure that everything was merged
in the proper order. Also, the lowest number was retained during merging.
Commands Used
NUMMRG,NODE – To merge all nodes
NUMMRG,KP – To merge all key points
47 | P a g e
3.3.7. Boundary Conditions
Displacement boundary conditions are needed to constrain the model to get a unique
solution. To ensure that the model acts the same way as the experimental beam, boundary
conditions need to be applied at points of symmetry, and where the supports and loadings
exist. The symmetry boundary conditions were set first.
(Go To Main Menu)
Solution
Define Loads
Apply
Structural
Displacement
On Lines
(Pick lines) & OK
(Lab2) All DOF (DOFs to be constrained)
(Value) 0
OK
3.3.8. Analysis Type
The finite element model for this analysis is a simple beam under transverse loading.
For the purposes of this model, the Static analysis type is utilized.
The Restart command is utilized to restart an analysis after the initial run or load
step has been completed. The use of the restart option will be detailed in the analysis
portion of the discussion.
48 | P a g e

(Go To Main Menu)
Solution
Analysis Type
Static & OK
3.3.9. Load Step Method
Step 1
(Go To Main Menu)
Solution
Solution Controls
Basic – Enter the values as shown below.
49 | P a g e

Step 2
(Go To Main Menu)
Solution
Solution Controls
Nonlinear - Enter the values as shown below.
Step 3 (Go To Main Menu)
Solution
Define Loads
Apply
Structural
Force/Moment Value
On Nodes
50 | P a g e

Step 4
(Go To Main Menu)
Solution
Load Step Opts
Write LS File
(Value) Load Step file number n, 1 &OK
51 | P a g e

Step 5
(Go To Main Menu)
Solution
Define Loads
Delete
Structural
Force/Moment Value
On Nodes- Pick All
Step 6
Repeat the procedure from step 1 to step 5 with different load values.
Step 7
(Go To Main Menu)
Solution
Solve
From LS File
(Value) LSMIN- 1, LSMAX- 6, LSINC- 1
52 | P a g e

Step 8
(Go To Main Menu)
General Post Processor
Read Results
By Pick- Read
Step 9
(Go To Main Menu)
Time History Processor
Add
Nodal Solution
DOF
Choose Y- Component Displacement
Pick middle node & OK
Plot graph (Graphs are in the end.)
53 | P a g e
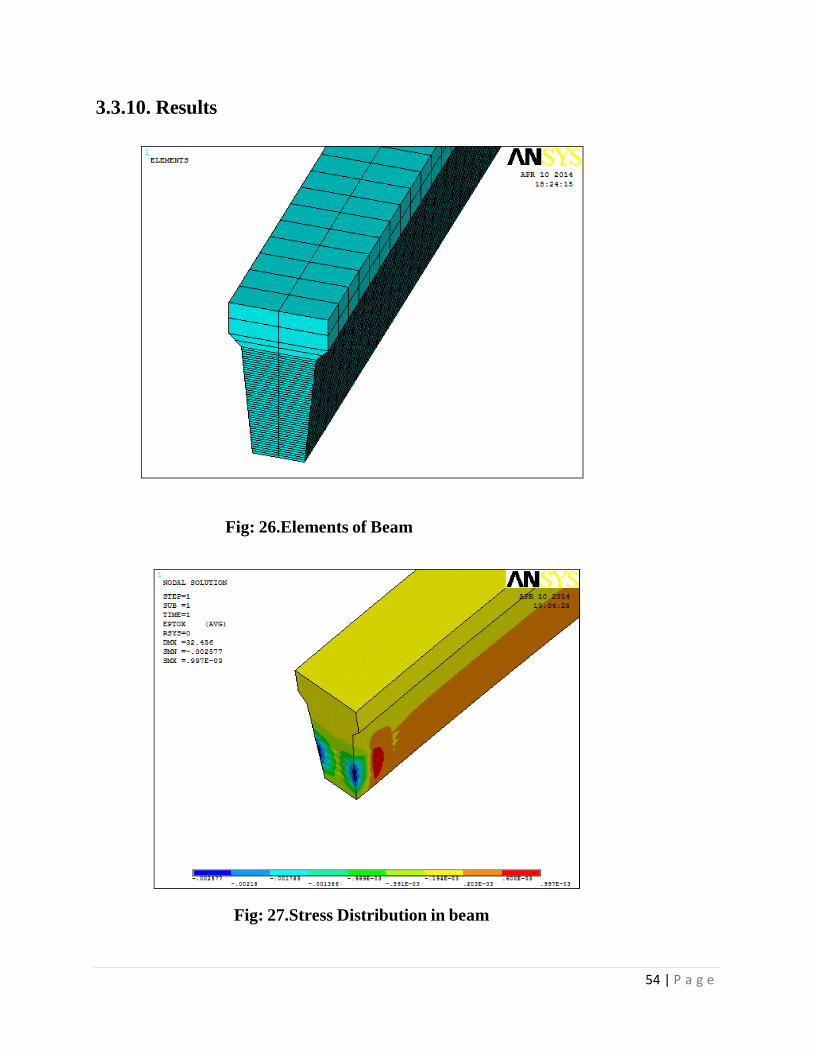
3.3.10. Results Fig: 26.Elements of Beam
Fig: 27.Stress Distribution in beam
54 | P a g e

4.12 Bending And Stress in beam after prestressing
Fig: 28.Stress in X-Direction.
Fig: 29.Stress in Y-Direction
55 | P a g e
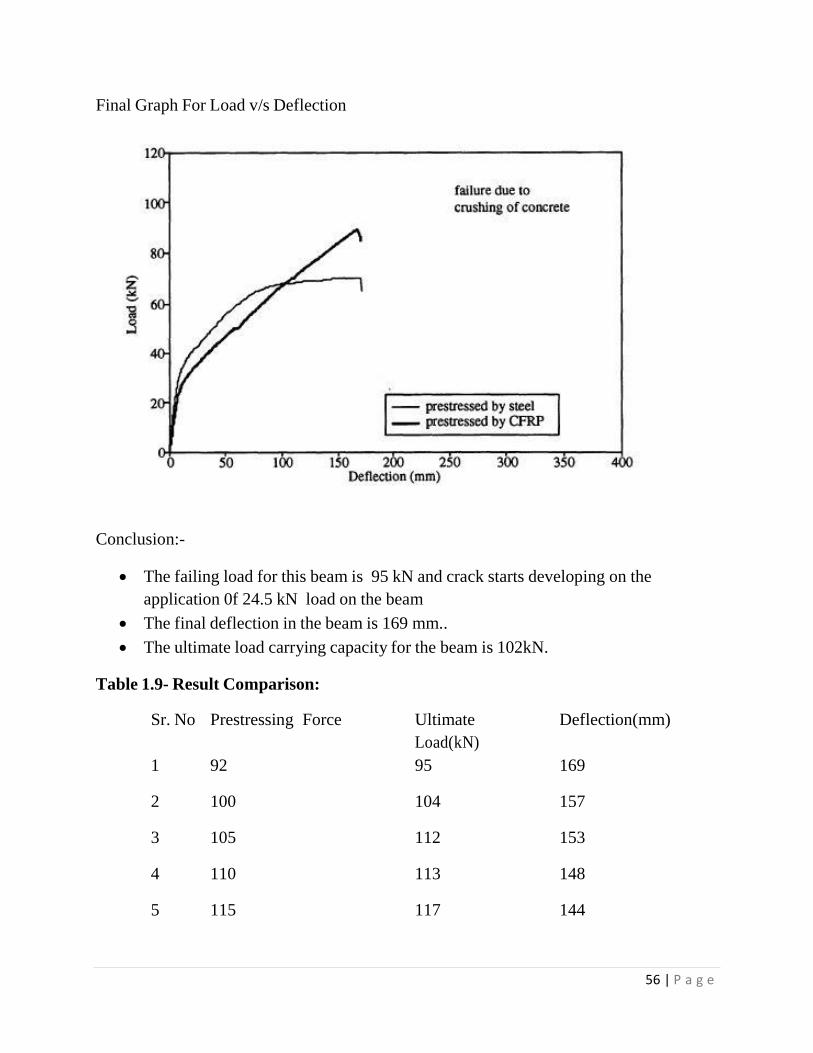
Final Graph For Load v/s Deflection
Conclusion:-
• The failing load for this beam is 95 kN and crack starts developing on the application 0f 24.5 kN load on the beam
• The final deflection in the beam is 169 mm.. • The ultimate load carrying capacity for the beam is 102kN.
Table 1.9- Result Comparison:
Sr. No Prestressing Force Ultimate Load(kN)
Deflection(mm)
1 92 95 169
2 100 104 157
3 105 112 153
4 110 113 148
5 115 117 144
56 | P a g e

Fig: 30. Deflection for Sr. No. 2
Fig: 31. Deflection for Sr. No. 3
57 | P a g e

Fig: 32. Deflection for Sr. No. 4
Fig: 33. Deflection for Sr. No. 5
58 | P a g e
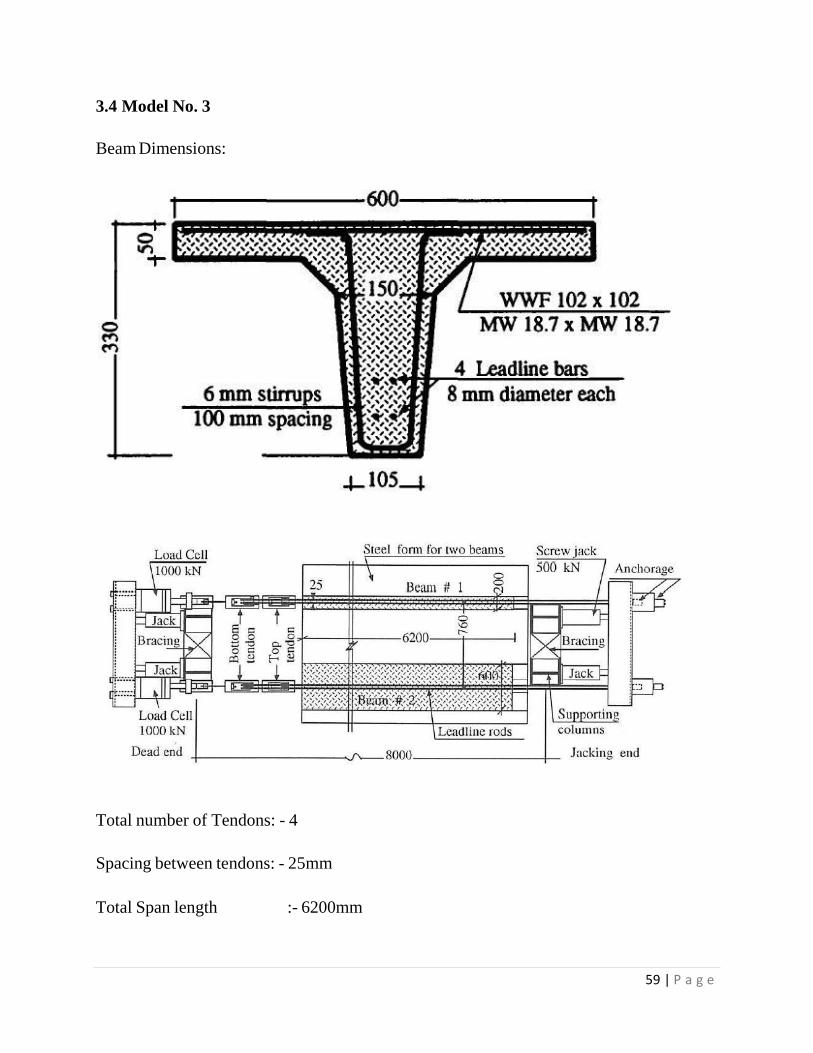
3.4 Model No. 3
Beam Dimensions:
Total number of Tendons: - 4
Spacing between tendons: - 25mm
Total Span length :- 6200mm
59 | P a g e

3.4.1 Beam Property
Table 1.10- Material Type
Material Type ANSYS Element
Concrete Solid 65
Steel Plates and Supports Solid 45
Reinforcement Link 8
The element types for this model are shown in Table 1.10. The Solid65 element
was used to model the concrete. This element has eight nodes with three degrees of
freedom at each node – translations in the nodal x, y, and z directions. This element is
capable of plastic deformation, cracking in three orthogonal directions, and crushing.
A Solid45 element was used for steel plates at the supports for the beam. This
element has eight nodes with three degrees of freedom at each node – translations in the
nodal x, y, and z directions.
A Link8 element was used to model steel reinforcement. This element is a 3D spar
element and it has two nodes with three degrees of freedom – translations in the nodal x,
y, and z directions. This element is also capable of plastic deformation.
3.4.2 Real Constants
The real constants for this model are shown in Table 1.11. Note that individual
elements contain different real constants. No real constant set exists for the Solid45
element. Real Constant Set 1 is used for the Solid65 element. It requires real constants for
rebar assuming a smeared model. Values can be entered for Material Number, Volume
Ratio, and Orientation Angles. The material number refers to the type of material for the
reinforcement. The volume ratio refers to the ratio of steel to concrete in the element. The
60 | P a g e
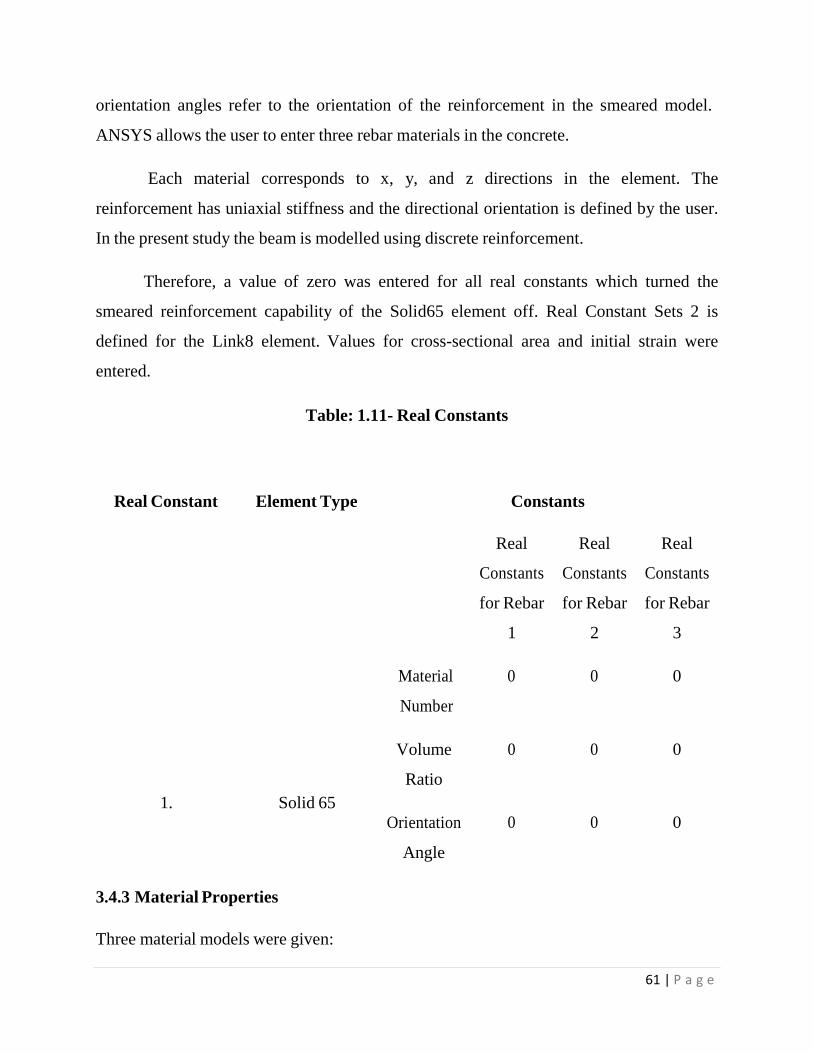
orientation angles refer to the orientation of the reinforcement in the smeared model.
ANSYS allows the user to enter three rebar materials in the concrete.
Each material corresponds to x, y, and z directions in the element. The
reinforcement has uniaxial stiffness and the directional orientation is defined by the user.
In the present study the beam is modelled using discrete reinforcement.
Therefore, a value of zero was entered for all real constants which turned the
smeared reinforcement capability of the Solid65 element off. Real Constant Sets 2 is
defined for the Link8 element. Values for cross-sectional area and initial strain were
entered.
Table: 1.11- Real Constants
Real Constant Element Type Constants
Real
Constants
for Rebar
1
Real
Constants
for Rebar
2
Real
Constants
for Rebar
3
Material
Number
0 0 0
1. Solid 65
Volume
Ratio
Orientation
Angle
0 0 0
0 0 0
3.4.3 Material Properties
Three material models were given:
61 | P a g e

Orientation
Angle
0 0 0
Cross- 157.45
sectional
Area
(mm2)
2. Link 8 Initial 0.03
Strain
(mm/mm)
1. Material 1 for Concrete
a. Linear Isotropic
b. Concrete
c. Multilinear Elastic
2. Material 2 for Steel Plates
a. Linear Isotropic
3. Material 3 for FRP
a. Linear Isotropic
b. Bilinear Isotropic
The values of Material Properties is shown in Table 1.12
62 | P a g e

Table: 1.12- Material Properties
Material Model No. Element Type Material Properties
Linear Isotropic
EX 38,480
PRXY 0.2
Multilinear Isotropic 1. Solid 65
Strain
Stress Point 1 0.00036 9.8023 Point 2 0.0006 15.396 Point 3 0.0013 27.517 Point 4 0.0019 32.102
63 | P a g e

Point 5 0.00243 33.095
Concrete
ShrCf-Op 0.3
ShrCf-Cl 1
UnTensSt 5.3872
UnTensSt -1
BiCompSt 0
HydroPrs 0
BiCompSt 0
UnTensSt 0
TenCrFac 0
Linear Isotropic
2. Solid 45 EX 2,00,000 PRXY 0.3
Linear Isotropic
EX 1,87,000
PRXY 0.65
3. Link 8 Bilinear Isotropic
Yield Stress 2050
Tang Mod 0.65
64 | P a g e

Figure 3.1- Stress- Strain Curve of Concrete
Fig: 34. Stress Strain curve of concrete
3.4.4. Modelling
Fig: 35. Outline of beam in Ansys
65 | P a g e

Fig: 36. Front line view
3.4.5Meshing
Fig.37. Elements after Meshing
66 | P a g e

3.4.6 Numbering Controls
The command merge items merges separate entities that have the same
location. These items will then be merged into single entities. Caution must be taken when
merging entities in a model that has already been meshed because the order in which
merging occurs is significant. Merging keypoints before nodes can result in some of the
nodes becoming “orphaned”; that is, the nodes lose their association with the solid model.
The orphaned nodes can cause certain operations (such as boundary condition transfers,
surface load transfers, and so on) to fail. Care must be taken to always merge in the order
that the entities appear. All precautions were taken to ensure that everything was merged
in the proper order. Also, the lowest number was retained during merging.
Commands Used
NUMMRG,NODE – To merge all nodes
NUMMRG,KP – To merge all keypoints
67 | P a g e

3.4.7 Boundary Conditions
Displacement boundary conditions are needed to constrain the model to get a unique
solution. To ensure that the model acts the same way as the experimental beam, boundary
conditions need to be applied at points of symmetry, and where the supports and loadings
exist. The symmetry boundary conditions were set first.
(Go To Main Menu)
Solution
Define Loads
Apply
Structural
Displacement
On Lines
(Pick lines) & OK
(Lab2) All DOF (DOFs to be constrained)
(Value) 0
OK
3.4.8 Analysis Type
The finite element model for this analysis is a simple beam under transverse loading.
For the purposes of this model, the Static analysis type is utilized.
The Restart command is utilized to restart an analysis after the initial run or load
step has been completed. The use of the restart option will be detailed in the analysis
portion of the discussion.
68 | P a g e

(Go To Main Menu)
Solution
Analysis Type
Static & OK
3.4.9 Load Step Method
Step 1
(Go To Main Menu)
Solution
Solution Controls
Basic – Enter the values as shown below.
69 | P a g e

Step 2
(Go To Main Menu)
Solution
Solution Controls
Nonlinear - Enter the values as shown below.
Step 3
(Go To Main Menu)
Solution
Define Loads
Apply
Structural
Force/Moment Value
On Nodes
70 | P a g e

Step 4
(Go To Main Menu)
Solution
Load Step Opts
Write LS File
(Value) Load Step file number n, 1 &OK
71 | P a g e

Step 5
(Go To Main Menu)
Solution
Define Loads
Delete
Structural
Force/Moment Value
On Nodes- Pick All
Step 6
Repeat the procedure from step 1 to step 5 with different load values.
Step 7
(Go To Main Menu)
Solution
Solve
From LS File
(Value) LSMIN- 1, LSMAX- 6, LSINC- 1
72 | P a g e

Step 8
(Go To Main Menu)
General Post Processor
Read Results
By Pick- Read
Step 9
(Go To Main Menu)
Time History Processor
Add
Nodal Solution
DOF
Choose Y- Component Displacement
Pick middle node & OK
Plot graph (Graphs are in the end.)
73 | P a g e

Fig:-38.Elements of Beam
Fig:-39.Stress Pattern
74 | P a g e

Fig:-40.Deflection of beam
Fig:-41.Line Diagram
75 | P a g e

Fig: 42. Final Graph for Load v/s Deflection
3.4.10 Conclusion:-
• The failing load for this beam is 97.5 kN and crack starts developing on the application 0f 31.5 kN load on the beam
• The final deflection in the beam is 174 mm.. • The ultimate load carrying capacity for the beam is 113kN.
Table 1.13- Result comparison
Sr. No. Prestressing Ultimate Deflection(mm) Force(kN) Load(kN)
1 128 113 174
2 135 117 164
3 140 124 154
4 145 130 150
76 | P a g e
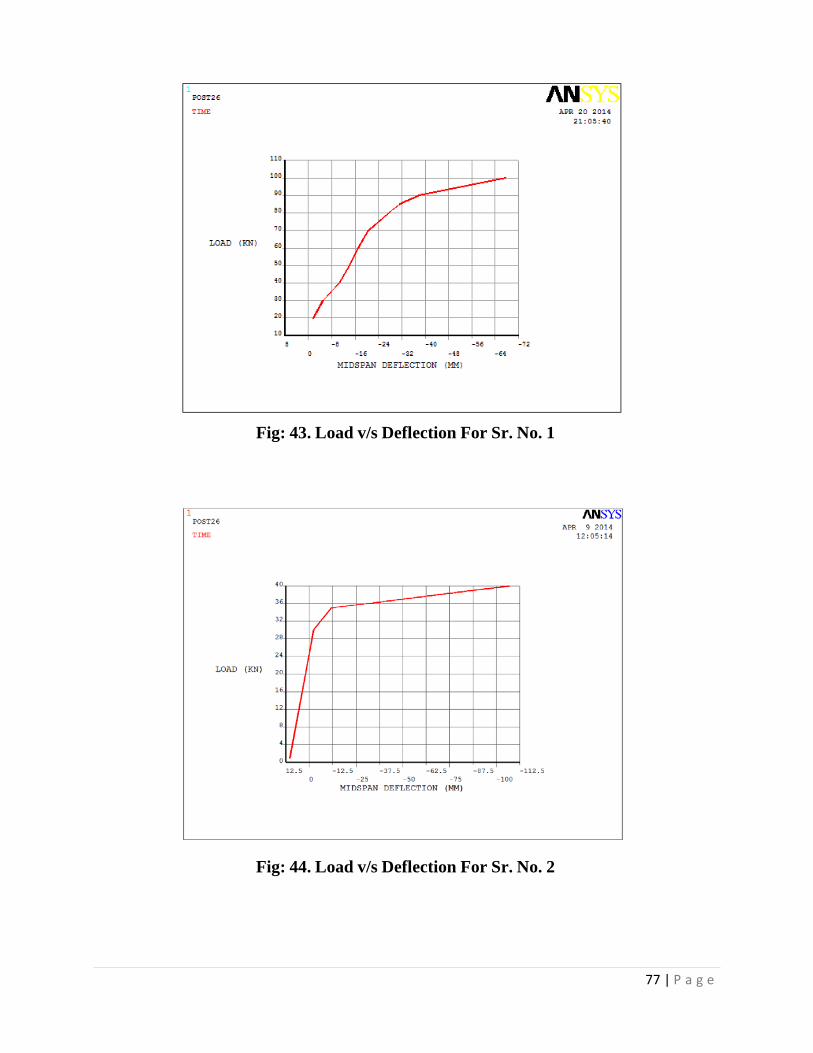
Fig: 43. Load v/s Deflection For Sr. No. 1
Fig: 44. Load v/s Deflection For Sr. No. 2
77 | P a g e

Fig: 45. Loadv/s Deflection For Sr. No. 3
Fig: 46. Load v/s Deflection For Sr. No. 4
78 | P a g e

CHAPTHER 4
EXPERIMENTAL RESULTS
4.1 GENERAL
The experimental program was undertaken to study the flexural behaviour of
prestressed and partially prestressed concrete beams with carbon fibre-reinforced-plastic
(CFRP) prestressing bars. The serviceability limit states in terms of crack width, crack
spacing and deflection prior to and after cracking were examined. The modes of failure and
the ultimate carrying capacity of the beams were also investigated. The test specimens
consisted of eight beams prestressed by CFRP bars and two additional beams prestressed
by conventional steel strands. The parameters considered in this experimental program
were the prestressing ratio and the degree of prestressing. Several control specimens were
tested to evaluate the material properties of the concrete, CFRP reinforcement, and
prestressing steel. This chapter presents details of jacking, testing setup and different
instrumentations used to measure the response of the beams. This chapter also presents the
properties of the materials used in this study based on testing of the control specimens.
4.2 TEST SPECIMENS
Ten pretensioned prestressed concrete T -beams with a total length of 6.2 m and a
depth of 330 mm were tested. The beams were simply supported with a 5.8-m span and a
200-mm projection from each end. The beams had the same span-to-depth ratio as is
typically used by industry for bridge girders. The beams had a flange width varying from
200 mm to 600 mm, as shown in Fig. 47. Eight of the tested beams were prestressed by 8-
mm Leadline CFRP bars produced by Mitsubishi Kasei, Japan; and two beams were
prestressed by 13-mm conventional steel strands. The beams were reinforced for shear
using double-legged steel stirrups, 6 mm in diameter, uniformly spaced 100 mm apart. The
steel stirrups were tied to two longitudinal steel bars, 6 mm in diameter, 25 mm from the
top surface of the beam. The nominal yield stress of the steel stirrups and longitudinal bars
79 | P a g e

was 400 MPa. The top flange was reinforced by welded wire fabric (WWF) 102xl02, MW
18.7 x MW 18.7 (CPCI Metric Design Manual 1989). The end zone of the beam was
reinforced by two steel plates of 12.5-mm (112") thickness and two steel bars of 10 mm
diameter. The beams had an adequate factor of safety for shear and bond. The variables of
the test program were as follows:
1. Degree of prestressing: two levels of jacking stresses of CFRP bars were used, 50
and 70 percent of the guaranteed ultimate strength of the Leadline as reported by
the manufacturing company
2. Number of Leadline bars: two and four bars were used.
3. Distribution of the Leadline bars in the tension zone: where Leadline bars were
placed in two and four layers, as shown in Fig. 47.
4. Flange width of the beams: two widths were used, 200 mm and 600 mm
Detailed information about the tested beams is given in Table 3.1. The designation
of the beams have the first letter either T, R, or S, refers to T -section of 600-mm flange
width, Rectangular section of 200-mm flange width and beams prestressed by steel
reinforcement, respectively. The first number of the beam designation is either 2 or 4,
which refers to the number of prestressing bars, while the second number, .5 or .7, refers
to the ratio of the jacking stress to the guaranteed ultimate strength. The last letter in the
beam designation, H or V, refers to the configuration of the bars in the tension zone, either
Horizontal or Vertical.
80 | P a g e

Fig: 47. Cross Section of the Tested Beams
Fig: 48. Details of End Zone of the Beam
81 | P a g e

4.3 TESTING SCHEME
The beams were tested using two quasi-static monotonic concentrated loads, 1.0 m
apart. The load was applied under stroke control with a rate of 1.0 mm/min up to the
cracking load and thereafter at a rate of 2.0 mm/min up to failure. The load was cycled
three times between an upper load level of 60 percent of the predicted strength of the
beams, which is equivalent to 1.5 to 2 times the cracking load, depending on the
prestressing level, and a lower load level of 80 percent of the cracking load of the beam.
The second and the third cycles were applied using the same rate of loading as in the initial
cycle. The aim of the repeated loading at the service load limit was to study the deflection,
after loss of beam stiffness due to cracking and the cracking behaviour after stabilization
of cracks.
4.4 MATERIAL PROPERTIES
Table 1.14 – Test Program
82 | P a g e

Table 1.16 – Concrete Properties
Table 1.15 – Tensile Properties of Leadline
83 | P a g e

Table 1.17 – Prestressing Force in the Tested Beams
Fig: 49. Stress-Strain Relationship of Leadline Bar
84 | P a g e

4.5 RESULTS OF THE EXPERIMENTAL PROGRAM
Beam R-2-.5: was prestressed with the same' force and the same location of bars as
beam T-2-.5. The camber of the beam was 7 mm 36 days after casting. The beam cracked
at 12.7 KN and failed at 56.8 kN. Five cracks were observed in the constant moment zone,
as shown in Fig. 6-9; four of them occurred at load levels ranging between 12.7 and 15.9
KN, while the fifth crack occurred at 23.4 kN with a loud noise.
The load was cycled three times between 10.0 and 24.0 kN. Again the beam failed
by rupture of the bottom Leadline bar, accompanied by flexure and flexure-shear cracks
extending to the top flange of the beam. The load dropped to 22.0 KN and the beam carried
more load until the test was stopped. The deflection at failure was 164.6 mm, or 1135 of
the beam span.
Beam R-4-.5-V: had a 200-mm flange width and was prestressed by four Leadline
bars jacked to 50 percent of the guaranteed strength and located as in beam T-4-.5-V. The
camber of beam R-4-.5-V was measured prior to testing, 40 days after casting, and was
found to be 10.0 mm. The beam had a cracking load of 23.1 kN and five cracks occurred
between 23.4 kN and 30.0 kN,
The beam was cycled between lower and upper load levels of 20.0 and 45.0 kN.
The beam failed by rupture of the bottom Leadline bar at a load level of 90.2 kN
accompanied by a horizontal crack at about 50 mm from the bottom surface of the beam.
The load dropped to 50.9 leN. The beam carried more load until crushing of the concrete
at the top surface of the beam between the two concentrated loads occurred at a load level
of 53.7 kN.
The deflectionof the beam was 186.2 mm, or 1/31 of the beam span. This deflection
was the largest observed deflection compared to that of the other beams prestressed by
Leadline and jacked to 50 percent of the guaranteed ultimate strength. This is attributed to
the type of failure where both the concrete and the Leadline were strained to the full
capacity.
85 | P a g e

Beam R-4-.7: had a 200-mm flange width and a prestressing force identical to that
of beam T-4-.7. The beam was prestressed by four Leadline bars located as in beam T-4-
.5-V. The measured camber of the beam. on the day of testing, 36 days after casting, was
13 mm. The beam cracked at 32.1 kN and failed at 98.1 kN by rupture of the bottom
Leadline bar.
Five cracks were observed in the constant moment zone, as shown in Fig. 6-7. The
second to fifth cracks occurred at load levels ranging from 34.2 kN to39.0 kN. The beam
was cycled three times between 25.0 and 50.0 kN. At onset of failure, two cracks in the
constant moment zone extended to the top surface of the flange and the load dropped to
zero. The deflection at failure was 164.5 mm, or 1135 of the span of the beam.
Beam T-4-.5-V: had a flange width of 600 mm and was prestressed by four Leadline
bars located at 50, 78, 100, and 128 mm from the bottom fibres of the beam. The Leadline
bars were jacked to 50 percent of the guaranteed strength. Before testing, the camber was
5.5 mm 33 days after casting. The beam cracked at a load level of 27.3 kN and failed at a
load level of 97.9 kN. Five cracks occurred in the constant moment zone as shown in Fig.
6-4. The first three cracks occurred at a load level of 27.3 kN.
The other two cracks occurred at a load level ranging between 29.0 and 33.0 kN.
The beam was cycled three times between lower and upper load limits of 23.0 and 45.0
kN, respectively. The beam was unloaded at 68.6 kN, which is 70 percent of the measured
failure load, and loaded again to failure to evaluate the released elastic and the consumed
inelastic energy of the beam.
The corresponding deflection of the beam at 68.6 kN, before unloading, was 91.8
mm. The behaviour of the beam was not completely elastic as the residual deflection of the
beam at zero load was 10.5 mm.
The energy released at unloading of the beam was mainly elastic. The inelastic
energy consumed by the beam was very small and occurred mainly due to cracking of
concrete. After reloading, the deflection of the beam at 68.6 kN was only 5 percent higher
86 | P a g e
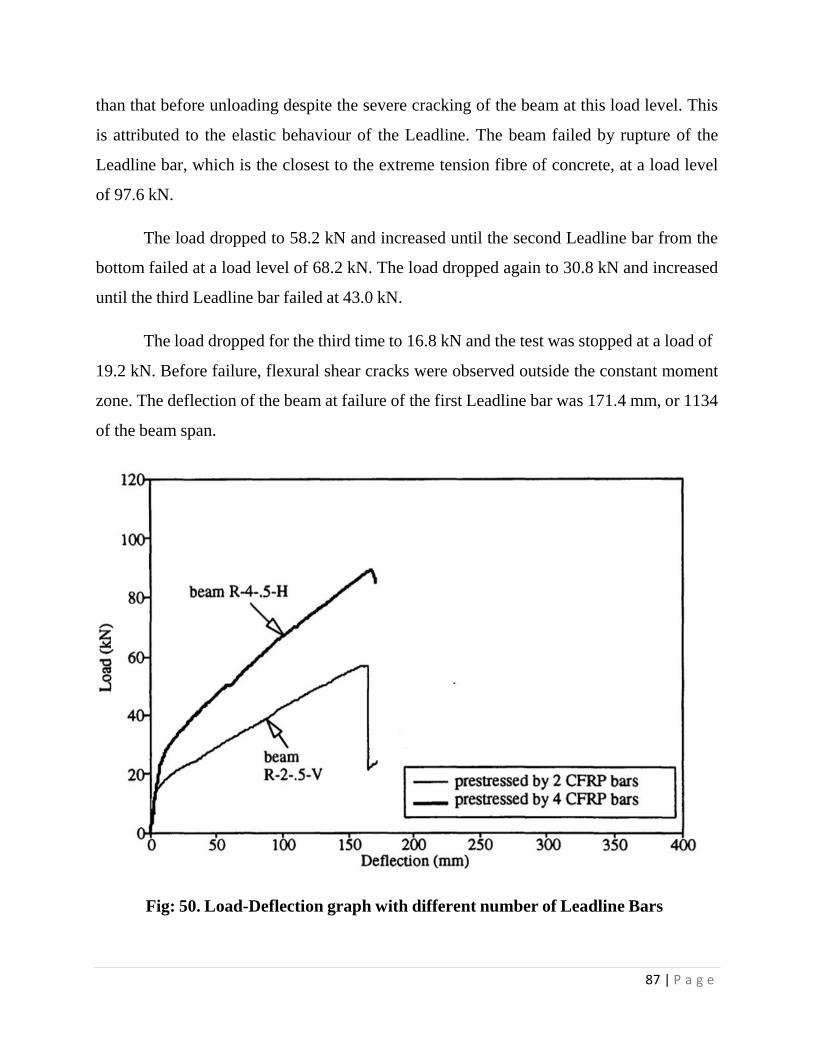
than that before unloading despite the severe cracking of the beam at this load level. This
is attributed to the elastic behaviour of the Leadline. The beam failed by rupture of the
Leadline bar, which is the closest to the extreme tension fibre of concrete, at a load level
of 97.6 kN.
The load dropped to 58.2 kN and increased until the second Leadline bar from the
bottom failed at a load level of 68.2 kN. The load dropped again to 30.8 kN and increased
until the third Leadline bar failed at 43.0 kN.
The load dropped for the third time to 16.8 kN and the test was stopped at a load of
19.2 kN. Before failure, flexural shear cracks were observed outside the constant moment
zone. The deflection of the beam at failure of the first Leadline bar was 171.4 mm, or 1134
of the beam span.
Fig: 50. Load-Deflection graph with different number of Leadline Bars
87 | P a g e

Fig: 51. Stress Strain Behaviour of beams
88 | P a g e

CONCLUSION
The final results obtained from Ansys are perfectly matching with the laboratory
test done by Amr A. Abdelrahman in University of Manitoba for Serviceability of
Concrete Beams Prestressed by Fiber Reinforced Plastic Tendons in year 1995.
The model prepared in Ansys is showing the same load deflection curve so now we
can say that the finite element testing of CFRP can be done by Ansys and models that we
prepared are exactly behaving like model that they had prepared in laboratory.
The deflection of FRP material having modulus of elasticity 1, 87,000 and poison
ratio 0.65 is calculated under various load and constrained condition and the output of the
activity is giving the real deflection what we assumed to get in laboratory.
As per the final conclusion the FRP prestressed beam are able to take load like other
available material but the main advantage with FRP material is that they are free from
corrosion so we can use them in underground structure and as well as in those areas where
rusting is a big problem.
The ultimate load carrying capacity of the FRP materials are more that steel and it
also undergo less deformation. The behaviour of steel and FRP is shown in figure below.
89 | P a g e

REFERENCES
1. Analysis Of Reinforced Concrete Structures Usingansys Nonlinear Concrete
Modelantonio F. Barbosa And Gabriel O. Ribeiro federal University Of Minas
Geraisdepartment Of Structural Engineering avenida Do Contorno, 842 – 2o
Andar30110-060 – Belo Horizonte - Mg – Brazil
2. Ansys Problem #1(Beam Deflection) By Nyquist/Haghighi
3. A General Method For Deflections Evaluation Of Fiber reinforced Polymer (Frp)
Reinforced Concrete Members Maria Antonietta Aiello And Luciano Ombres,
University Of Lecce, Lecce, Italy
4. Bond Properties Of CFCC Prestressing Strands In Pretensioned Concrete
Beamsbynolan G. Domenico
5. Deflection Analysis Of Reinforced Concrete T-Beam Prestressed With CFRP
Tendons Externally Byle Huangphd Studentschool Of Civil Engineering wuhan
University china
6. Deflection Of Frp Reinforced Concrete Beamsraed Al-Sunna1,2, Kypros
Pilakoutas2, Peter Waldron2 And Tareqal-Hadeed building Research Centre, Royal
Scientific Society, Amman, Jordan.Centre for Cement and Concrete, Department of
Civil and Structural Engineering,University Of Sheffield, United Kingdom.
7. Ductility Of Pretensioned Concrete Beams With Hybridfrp/Stainless Steel
Reinforcements Dorian P. Tung And T. Ivan Campbell department Of Civil
Engineering, Queen.S University, Kingston, Ontario, Canada
8. Experimental Study Of Influence Of Bond On Flexural behaviour Of Concrete Beams
Pretensioned With Aramid fiber Reinforced Plastics by Janet M. Lees And Chris J.
Burgoyne
9. Finite Element Analysis Of Prestressed Concrete Beams Byabhinav S. Kasat &
Valsson Varghese
10. Flexural BehaviourOf Reinforced Concretebeams Using Finite Element Analysis
(Elastic Analysis) Byr. Srinivasan And K. Sathiya
90 | P a g e

11. Finite Element Modelling Of Composite Steel-Concrete Beams With External
Prestressing Amer M. Ibrahim1, Saad K. Mohaisen2, Qusay W. Ahmed3
1- Professor, College Of Engineering, Diyala University, Iraq
2- Dr.College Of Engineering, Al-Mustansiriya University, Iraq
3- Structure Engineering Diyala University, Iraq
12. Finite Element Analysis Of An Intentionally Damaged Prestressed Reinforced
Concrete Beam Repaired With Carbon Fiber Reinforced Polymers by David A.
Brighton submitted To The Graduate Faculty As Partial Fulfilment Of The
Requirements For The Masters Of Science Degree In Civil Engineering
13. Flexural Behaviour Of Reinforced and Prestressed Concrete Beamsusing Finite
Element Analysis by Anthony J. Wolanski, B.S.
14. Modelling And Behaviour Of Prestressed Concrete Spandrel beamsa Dissertation
submitted To The Faculty Of The Graduate School of The University Of Minnesota
by bulentmercan
15. Nonlinear Analysis Of Rc Beam For Different Shear Reinforcement Patterns By
Finite Element Analysissaifullah, M.A. Hossain, S.M.K.Uddin, M.R.A. Khan And
M.A. Amin
16. Prestressed Concrete Structures Dr. A. K. Senguptadepartment Of Civil
EngineeringIndian Institute Of Technology, Madras
91 | P a g e