fingerprint classification* -...
TRANSCRIPT

Pergamon Pattern Recognition, Vol 29, No. 3, pp. 389 404, 1996
Elsevier Science Lid Copyright © 1996 Pattern Recognition Society
Printed in Great Britain. All rights reserved 0031 3203/96 $15.00+.(R~
0031-3203(95)00106-9
FINGERPRINT CLASSIFICATION*
KALLE KARU and ANIL K. JAINt Department of Computer Science, Michigan State University, East Lansing, M1 48824, U.S.A.
(Received 4 April 1995; in revised form 23 May 1995; received for publication 7 July 1995)
Abstract A fingerprint classification algorithm is presented in this paper. Fingerprints are classified into five categories: arch, tented arch, left loop, right loop and whorl. The algorithm extracts singular points (cores and deltas) in a fingerprint image and performs classification based on the number and locations of the detected singular points. The classifier is invariant to rotation, translation and small amounts of scale changes. The classifier is rule-based, where the rules are generated independent of a given data set. The classifier was tested on 4000 images in the NIST-4 database and on 5400 images in the NIST-9 database. For he NIST-4 database, classification accuracies of 85.4% for the five-class problem and 91.1% for the four-class problem (with arch and tented arch placed in the same category) were achieved. Using a reject option, the four-class classification error can be reduced to less than 6% with 10% fingerprint images rejected. Similar classification performance was obtained on the NIST-9 database.
Fingerprints Classification Delta Core Directional i ma ge Poincar+ index
I. I N T R O D U C T I O N
Every person is believed to have unique fingerprints/1J This makes fingerprint matching one of the most reliable methods for identifying people, t21 Fingerprint matching is usually carried out at two different levels. At the coarse level, fingerprints can be classified into six main classes: arch, tented arch, right loop, left loop, whorl and twin loop, as shown in Fig. 1. The fine-level matching is performed by extracting ridge endings and branching points, called minutiae, ~3) from a fingerprint image (see Fig. 2). The similarity between two finger- prints is determined by comparing the two sets of minutiae points. Although the coarse classification does not identify a fingerprint uniquely, it is helpful in determining when two fingerprints do not match. For example, a right loop image should be matched with only other right loop images in the database of finger- prints. When fingerprints from all the ten fingers are available, the coarse level classification of these ten prints drastically reduces the proportion of database images to be matched at the finer level. A human expert can perform coarse-level classification of fingerprints relatively easy. For an automatic system, the problem is much more difficult because the system must take into account the global directions of the ridges as well as their local connectivity to make its decision.
The fingerprint classification problem has been ad- dressed by many researchers in the past/4-6) A syntac- tic method is presented by Rao et al/5~ The approach
* This work was supported by a contract from the Depart- ment of Defense.
t Author to whom correspondence should be addressed.
taken by Srinivasan et al. {6) is similar to our approach except that we use a different method to locate core and delta points. The Poincar6 index has been used by Kawagoe and Tojo ~4) to detect singular points in the image. Wilson et a lF '8) have used a neural network to classify fingerprint images.
In this paper we are interested in the coarse-level classification. An algorithm for classifying an input fingerprint image into one of the six classes is de- scribed. The algorithm consists of three major steps: (i) computation of the ridge directions, ~9~ (ii) finding the singularities in the directional image ~4~ and (iii) classifi- cation of the fingerprint based on the detected singular points. A high-level diagram of the algorithm is shown in Fig. 3. Each step of the algorithm is discussed in the following sections. The method can, in principle, be used to classify fingerprints into six categories, but since the NIST databases ~1°'11) do not contain any twin loop images (or they are labeled as whorls), the algorithm was tested only on images from five classes.
In Sections 2 and 3 we present the algorithms for computing the directional image, finding singular points and classifying the fingerprint. Section 4 deals with fingerprint registration for fine-level matching. We show that the extracted singular points can be used as registration points for fingerprint normalization. Section 5 presents experimental results and compares them with other classification results reported in the literature. ~7'8~ There are not many fingerprint classifi- cation algorithms reported in the literature that have been tested on such a large data set as the NIST-4 database which contains 4000 images or the NIST-9 database with 5400 images.
389

390 K. KARU and A. K, JAIN
Arch Tented Arch
Le~ Loop Right Loop
Whorl
Fig. 1. Six classes of fingerprints.
Twin-loop

Fingerprint classification 391
(b)
Fig. 2. Minutiae points. (a) Input image; (b) result of the minutiae point detector proposed by Ratha et al. TM
input fingerprint imag e
Compute dlrectzons [
i i i
Arch
i
Smooth directional image
i
i Find singular points
I
0 ! Number of core-delta pairs ~
:1 2
Loop or tented arch. ] - Whorl or twin loop? ] T
loop [
Leet loop
i I [
' Left loop: ~ Right loop, Tented archj,(V~orl) , Tw~ l~E)~"
Fig. 3. Block diagram of the fingerprint classification algorithm.
slit sum s 1 at position (i,j) is computed as:
s l = l ( i - - 2 , j - - 4) + l ( i - - 1,j - 2)
+ l ( i + 1 , j + 2 ) + I ( i + 2 , j + 4 ) .
Similar expressions can be written for the other slit sums. Finding the sums So, S l , . . . , s 7 is equivalent to convolving the image with eight 9 x 9 masks, too, m1,. . . , m 7, where the mask m i has values of 1 at positions where the mask shown in Fig. 4 has values i and zero everywhere else.
Let 0 _< p, q _< 7 be indices such that:
sp = min si, i = 0,,..,7
sq= max si, i = 0,...,7
The direction at a pixel is defined to be p if the center pixel is located on a ridge (dark area) and q if the center pixel is located in a valley (light area). If the center pixel has a value C, then its direction is given by:
J'p if ( 4 C + s p + s q ) > 3 ~ = o S i = (1)
otherwise.
2. C O M P U T I N G T H E D I R E C T I O N A L I M A G E
The method for finding the ridge direction at each [gixei of an input image is adopted from the paper by Stock and Swonger tg~ [see also reference (8)]. To com- pute the direction at a pixel, the 9 x 9 m~isk shown in Fig. 4 is centered at the pixel of interest. The gray values of pixels in eight directions (at positions marked by numbers 0, 1, . . . , 7) are added together to obtain the slit sums s o, s 1 . . . . . s 7. For example, if the gray value of the image at position ( i , j ) is denoted by I ( i , j ) , then the
6 5 4 3 2
7 6 5 4 3 2 1 7 1
0 0 0 0 1 7
1 2 3 4 5 6 7
2 3 4 5 6
Fig. 4. The 9 x 9 mask to compute the slit sums.
392 K. KARU and A. K. JAIN
The computations in equation (1) give us a direction at each pixel, quantized to eight values. These direc- tions are usually very noisy and, therefore, they need to be smoothed and averaged in a local neighbourhood. There is an inherent difficulty in averaging direction values since these values are determined modulo 8 and a simple addition does not give the correct results. However, there is a nice representation of directions as vectors. 18~ For each pixel, we compute its direction 7 in degrees (~e [0, 180°)), multiply this by two and repre- sent it as a unit vector in this direction v-- (cos 2a, sin 2~). An image in this representation can be smoothed by averaging the two components of the vectors separately. As a by-product, we also obtain the confidence value in the estimated direction as the
length of the averaged vector. It is easy to transform the vector representation (x, y) to directional represen- tation by setting d = ½arctanffx). However, it is conveni- ent to work directly with vectors and convert them back to directions only when necessary.
After computing the directional image, we convert the directions to vectors of unit length. The 512 × 512 vector image is then tiled into windows of size 8 x 8 and the vectors in each window are averaged so that the output is a vector image of size 64 x 64. This relatively small image can be smoothed further (by smoothing each vector component separately). We have used a 3 × 3 averaging box filter. The filter can be implemented very efficiently and by applying it several times we obtain a Gaussian-like smoothing of the
(b)
(c)
Fig. 5. Computation of the directional image of the input whorl image in Fig. l; (a) directional image before smoothing; (b) directional image smoothed once; (c) directional image smoothed l0 times.

Fingerprint classification 393
reduced vector image. One of the most crucial prob- lems in the fingerprint classification algorithm is to determine the amount of smoothing which should be applied to the 64 x 64 vector image. We have taken an iterative approach, where we smooth the image once and then try to classify it. If the classifier fails, we smooth the image once more and try to classify the image again. This process eventually terminates be- cause any image, when smoothed sufficiently many times, becomes a constant directional image and this image is classified as an arch pattern.
Figure 5(a) shows the directional image obtained with the method described above. Figures 5(b) and (c) show the same directional image [Fig. 5(a)] smoothed once and 10 times, respectively.
3. CLASSIFICATION
To classify a 64 x 64 input image of direction vec- tors, we first find the singular points (cores and deltas) and then classify the image by the number and loca- tions of these singularities. ¢4~ The definition of cores and deltas that is used here may differ from their customary use in fingerprint analysis. (For example, Henry ¢12) defines a core point as the uppermost point of the innermost ridge. Using this definition, there are no core points defined for arch and tented arch type fingerprints.) A point in the directional image is classi- fied as an ordinary point, core or delta by computing the Poincar6 index along a small closed curve around the point. The Poincar6 index is computed by summing
/
_ /
O r d i n a r y po in t D e l t a po in t 0 o _ 1 8 0 °
Core po in t Double -core po in t 180 ° 360 °
Fig. 6. Computation of the Poincar~ index and the definition of ordinary, core and delta points. The circle is centered at the point of interest, denoted as "X".

394 K. K A R U and A. K. JAIN
Arch Tented Arch
f
Left Loop Right Loop
J
Whorl Twin Loop
Fig. 7. Cores ( c ) and deltas (A) in fingerprint images belonging to different classes.

Fingerprint classification 395
up the changes in the direction angle around the curve. When making a full counter-clockwise turn around the curve in a directional image, we see that the direction angle turns 0, + 180 and +360°, . . .dur ing this trip. A point is termed ordinary if the angle has turned 0 °, core if it has turned 180 ° and delta if it has turned - 1 8 0 ° (Fig. 6). Lower or higher values of directional change could be called double-core, double-delta and so on, but in discretized representations, as described later, these values never occur.
In a 64 x 64 image, we compute the Poincar6 index at every pixel (i,j) in a 2 x 2 rectangle, where the upper left corner is placed at the pixel of interest. The rec- tangle is traversed in the counterclockwise direction:
( i , j )~ ( i + 1,j)--*(i + 1,j + 1)--*(i,j + 1)--*(i,j).
When computing the difference between two angles (which is determined up to + 180°), we take the differ- ence which is smallest in the absolute value.
After locating all the core and delta points, we classify the fingerprint image based on the number and locations of these points. As can be seen in Fig. 7, an arch fingerprint image contains no cores or deltas, loops and tented arches contain one core and one delta, and whorls and twin loops have two cores and two deltas. We discriminate a tented arch from a loop by connecting the core and delta points with a straight line. In a tented arch image, this line's orientation is along the local direction vectors, while in a loop image the line intersects local directions transversally (see Fig. 8). Let/~ be the slope of the line connecting the core and delta points, and let ~1,~2 . . . . . ~, be the local
J
Ten ted Arch Loop
J
W h o r l Twin Loop
Fig. 8. Discriminating tented arches from loops and whorls from twin loops.
396 K. KARU and A. K. JAIN
L e ~ Loop L e ~ Loop
Right Loop
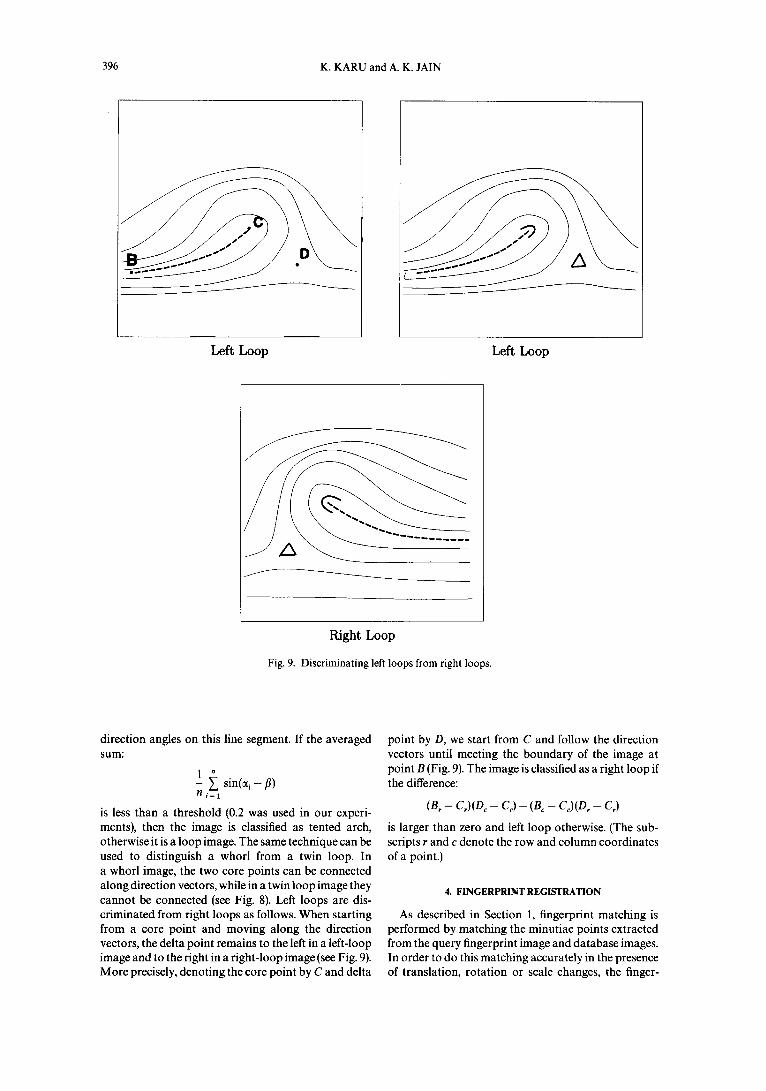
Fig. 9. Discriminating left loops from right loops.
direction angles on this line segment. If the averaged s u m :
5 sin(cq- fl)
F/i= 1
is less than a threshold (0.2 was used in our experi- ments), then the image is classified as tented arch, otherwise it is a loop image. The same technique can be used to distinguish a whorl from a twin loop. In a whorl image, the two core points can be connected along direction vectors, while in a twin loop image they cannot be connected (see Fig. 8). Left loops are dis- criminated from right loops as follows. When starting from a core point and moving along the direction vectors, the delta point remains to the left in a left-loop image and to the right in a right-loop image (see Fig. 9). More precisely, denoting the core point by C and delta
point by D, we start from C and follow the direction vectors until meeting the boundary of the image at point B (Fig. 9). The image is classified as a right loop if the difference:
( B r - - C r ) ( D c - Co) - ( B c - C c ) ( D , - C , )
is larger than zero and left loop otherwise. (The sub- scripts r and c denote the row and column coordinates of a point.)
4. FINGERPRINT REGISTRATION
As described in Section 1, fingerprint matching is performed by matching the minutiae points extracted from the query fingerprint image and database images. In order to do this matching accurately in the presence of translation, rotation or scale changes, the finger-

Fingerprint classification 397
L e ~ Loop Right Loop
W h o r l Tented Arch
Arch Ten ted A r c h / A r c h
Fig. 10. Examples of detected core (E]), delta (A) and registration ( x ) points.

398 K. KARU and A. K. JAIN
print images have to be normalized. This normaliz- ation could be carried out, for example, by finding two distinguished points in every fingerprint image. In our test database, called NIST-4, tl°l the images are at the same scale and approximately with the same orienta- tion. Normalization must, therefore, account for trans- lation only and one distinguished point is sufficient for this purpose. Wegstein t13~ suggests the use of center points for registration.
Core and delta points extracted from the fingerprint images are good candidates for registration points. In loop and tented arch images, we select the core point as the registration point. In a whorl image, the core point having the smaller row coordinate is used for registra- tion. In an arch image, the registration point is found as follows. For each row i in the directional image we compute the sum:
Ci= ~] Idl,j-di.j-ll,
where di j is the direction at location (i, j) and the sum is over all the pixels in the ith row. The row coordinate of the registration point is determined as the index i for which c~ is maximal. In this ith row, the column coordinate is found as the index j which minimizes the absolute value:
k=~_2 d j ' i + k •
The detected column coordinate j corresponds to the horizontal part of the ridges, where the positive and negative slopes sum up to almost zero.
Figure 10 shows a few examples of fingerprint im- ages with the detected core, delta and registration points.
5. EXPERIMENTAL RESULTS
Our fingerprint classification algorithm was first tested on the NIST-4 database which contains 4000 images, equally distributed between five classes-- arches, tented arches, left loops, right loops and whorls. The images are 512 x 512 in size with eight bits per pixel and the fingerprints have been manually labeled. The classification algorithm given in Fig. 3 is invariant to translation, rotation and moderate amounts of scale changes in the fingerprint. The NIST-
4 database consists of mostly centered and horizon- tally aligned fingerprint images, so our algorithm can be simplified as follows:
(1) Since the border areas of the 512 x 512 images contain mainly background and sometimes hand-writ- ten text, the directions in the 40 pixel wide strip along the borders were set to zero degrees. This also ensures that core and delta points are in pairs.
(2) Since we are more interested in locating cores and deltas in the center of the image, the vectors in the 64 x 64 direction image were divided by their distance to the center of the image. When smoothing such an image, noise in the border areas is eliminated prior to the undesired smoothing of the singularities in the middle of the image.
(3) No core points were allowed in the 80 pixel wide strip along the borders.
(4) If a core point was less than 8 pixels (24 pixels in border areas) from its nearest delta point, then this core-delta pair was removed.
The error in classifying the 4000 fingerprint images into five classes was 14.6%. The confusion matrix is given in Table 1. The columns in Table 1 do not sum up to 800, because some of the fingerprints in the database were assigned two different classes. Even fingerprint experts are sometimes unable to classify a fingerprint image uniquely. For example, the last image in Fig. 10 was labeled as both a tented arch and an arch. When any one of the true labels matched the result of our algorithm, the classification was assumed to be correct.
Most of the classification error can be attributed to images of poor quality and images containing addi- tional lines or tabulations (see Fig. 11). The largest source of error, however, is due to the classification of about half of the tented arches as arches. Figure 12 shows that there are two different types of tented arches. Our algorithm classifies the first type of tented arch as a tented arch, while the second type is classified as an arch. In fact, it is extremely difficult to discrimi- nate the second type of tented arches from arches based on the directional image only. If we combine arches and tented arches into the same class, then the classification error for the resulting four-class problem reduces to 8.6% and the resulting confusion matrix is given in Table 2.
Table l. Five-class classification results on NIST-4 database
Assigned class
True class Whorl Left loop Right loop Arch Tented arch
Whorl 731 35 30 1 10 Left loop 33 780 6 10 79 Rightloop 23 3 672 7 7 Arch 5 36 37 912 197 Tented arch 4 11 45 5 321

Fingerprint classification 399
(a) (b)
(c) (d)
Fig. 11. Examples of poor quality fingerprint images; (a) an arch image, classified as arch; (b) an arch image, classified as a tented arch; (c) a tented arch image, classified as an arch; (d) a left loop image classified as
a whorl.
Images of poor quality, such as those in Fig. I l, are difficult to classify even for a fingerprint expert. It would be desirable if our algorithm could reject these images or classify them as "unknown". We have con- sidered two strategies to reject fingerprint images. The first method computes the "quality" of a fingerprint image and rejects the image if the quality is below a certain threshold. When computing the directional image we obtain a 64 x 64 image of vectors, where the direction of a vector corresponds to the ridge direction and the length of the vector gives the confidence value of that particular ridge direction. We average the lengths of the 64 x 64 vectors and call it the quality of the image. The second rejection method sets an upper
limit on the amount of smoothing that can be applied to the directional image. Figure 3 shows that the directional image is smoothed until no more than two core-delta pairs are left. When limiting the number of smoothing operations to n, we reject the image if after n iterations the image still contains more than two core-delta pairs. Figure 13 shows the error rates for the four-class classification problem as functions of the reject rate. Plots (a) and (b) in Fig. 13 show the error rates when rejection based on the image quality and amount of smoothing, respectively, was used. The plot (c) combines the two rejection criteria, allowing no more than three smoothing operations and varying the image quality threshold.

. . . . i:i;!:~y,;ii !
~Uiiiii
400 K. KARU and A. K. JAIN
Fig. 12. Two types of tented arches.
Table 2. Four-class classification results on NIST-4 database
Assigned class
True class Whorl Left loop Right loop Arch
Whorl 731 35 30 l l Left loop 33 780 6 89 Rightloop 23 3 672 14 Arch 9 33 73 1458
0 ' )
E
W
() ' ' :30 ' ' 10 2 0 4 0 5 0
Reject Percen tage
Fig. 13. Four-class error-reject plots of the NIST-4 database; (a) rejection was based on image quality; (b) rejection was based on the amount of smoothing; (c) rejection was based on a combination of image quality and the amount of smoothing (three smoothing operations were allowed and the threshold for image
quality was varied).

Fingerprint classification 401
Q.
!- W
0 _ . . . . . . . . . . . Ic l
i i t i t t
0 10 20 30 40 50
Reject Percentage
Fig. 14. Five-c•asserr•r-rejectp••ts•ftheNIST-4database•usingpri•rpr•babi•ities;(a)rejecti•nwasbased on image quality; (b) rejection was based on the amount of smoothing; (c) rejection was based on a combination of image quality and the amount of smoothing (three smoothing operations were allowed and
the threshold for image quality was varied).
In the NIST-4 database, fingerprint images from the five classes are equally distributed. However, the prior probabilities of observing a fingerprint from these classes are as follows: ts) whorl = 27.9%, left loop = 33.8%, right loop= 31.7%, arch = 3.7% and tented arch = 2.9%. The error-reject plots of the five-class problem, when taking into account these prior prob- abilities, are shown in Fig. 14. The three plots (a), (b) and (c) are similar to those in Fig. 13, except that the prior probabilities were used to compute the total error and reject rates as the weighted sums of the error and reject rates of the individual classes. The classifier itself was not adjusted to the prior probabilities. The use of prior probabilities decreases the error for the five-class problem, but not for the four-class problem. In the four-class problem, the error in classifying arches and tented arches is less than the error from the other types of fingerprints. Therefore, using a low a priori class probability (5%) for the arches and tented arches increases the total error.
The fingerprint classification algorithm was also tested on the NIST-9 database, tl 1) This database con- tains 5400 labeled fingerprint images which are not always centered and properly oriented. As a pre- processing step, we extracted the darkest 512 x 512 region in the original 768 x 832 image as the expected fingerprint location and applied our algorithm to this subimage. Figure 15 shows an example image from the NIST-9 database and the extracted 512 x 512 subim- age. The five-class classification error from the 5400 images was 12.4% and the confusion matrix is given in Table 3. Error rate versus reject rate is plotted in Figure 16. Results of classifying images in NIST-4 and
NIST-9 databases into four or five classes, with and without a priori class probabilities, are summarized in Table 4. Fingerprints in the NIST-9 database are already naturally distributed and no other a priori probabilities can be applied.
Classification of a fingerprint image currently takes less than 3 s of CPU time on a Sparc-20 workstation. Most of this time (ca 2.8 s) is spent on.computing the direction at each pixel of an input image and averaging these directions in 8 × 8 windows. Operations with the reduced 64 x 64 image, such as smoothing, finding the singularities and classifying them, are substantially faster (ca 0.1 s).
For the five-class classification problem, Wilson et al38~ have used a neural network-based classifier. The classifier was tested on the same NIST-4 database and the best reported error rates were 17% with the equally spaced grid, 14% with the unequally spaced grid and 9.8% with 10% rejects. For the unequally spaced grid, statistical knowledge about the core- delta locations was used to obtain a finer mesh at the expected positions of cores and deltas. When taking into account prior probabilities of the five classes, an error rate of 4.6% was achieved with 10% rejected fingerprints. Our algorithm uses the same method for computing the directions. However, the major difference is that the neural network of Wilson et al. ts~ is first trained on 2000 finger- print images and then tested on the other 2000 images of the same fingers. Our rule-based classification algo- rithm does not depend on a particular data set and it was tested on the entire database consisting of 4000 images.

402 K. KARU and A. K. JAIN
q
7 ̧
Fig. 15. An example image form the NIST-9 database and the extracted subimage.
Table 3. Five-class classification results on NIST-9 database
Assigned class
True class Whorl Left loop Right loop Arch Tented arch
Whorl 1305 95 79 8 5 Left loop 78 1485 8 15 11 Right loop 67 13 1447 17 4 Arch 8 26 31 "314 30 Tented arch 16 48 109 40 134

Fingerprint classification 403
O4
¢ -
o • T -
e l
uJ o~
¢ o
I1 "., " . . . . . . . . . . . . . . . . . . . . . . . . . b
' , . . . . . . . . . . . . C
i i i i i i
0 10 20 30 40 50
Reject Percentage
Fig. 16. Five-class error-reject plots of the NIST-9 database; (a) rejection was based on image quality; (b) rejection was based on the amount of smoothing; (c) rejection was based on a combination of image quality and the amount of smoothing (five smoothing operations were allowed and the threshold for image
quality was varied).
Table 4. Summary of the error percentages from different classification results
Number of Prior Rejection classes probabilities (10%) NIST-4 NIST-9
14.6 12.4 5 x/ 11.9
13.6 9.9 x/ 8.7
8.6 11.7 4 ~/ 9.4
6.1 8.6 x/ 7.0
6. CONCLUSIONS AND FUTURE WORK
Currently acceptable fingerprint classification per- formance as set by FBI is 1% error with a 20% reject rate. " ~ Error in classifying individual fingerprints must be small because when classifying fingerprints from all the 10 fingers, the errors from single finger- print classifications will accumulate. Figure 13(c) shows that our classification error for the four-class problem is ca 5% with 20% rejects. In order to reduce this error rate, input image quality must be improved either by preprocessing or by using better fingerprint capturing methods. Wilson et al. ts~ used a Fourier- transform-based image enhancement to remove noise. While this method improves the quality of images in Figs 11 (a) and (c), it does not improve the classification accuracy of images which contain tabulations [Fig. 1 l(d)] or broken lines [Fig. 1 l(b)l, because the tabu- lation and lines are also enhanced. Currently, the algorithm seldom fails with images of good contrast
and images which contain no written text. The reject criteria that we have used are not very effective and should be improved. As the plots in Figs 13, 14 and 16 show, 10% of rejected patterns results in a ca 1 2% decrease in the error rates. We are presently studying better methods for rejecting fingerprint images.
Acknowledgement--The authors would like to acknowledge Nalini Ratha for assistance in conducting the experiments and preparing the manuscript.
REFERENCES
1. H. C. Lee and R. E. Gaensslen, Advances in Fingerprint Technology. Elsevier, New York (1991).
2. B. Miller, Vital signs of identity, IEEE Spectrum 31(2), 22-30 (1994).
3. N. Ratha, S. Chen and A. K. Jain, Adaptive flow orienta- tion based texture extraction in fingerprint images, Pat- tern Recognition, 28, 1657-1672 (1995)
4. M. Kawagoe and A. Tojo, Fingerprint Pattern Classifica- tion, Pattern Recognition 17(3), 295 303 (1984).

404 K. KARU and A. K. JAIN
5. C. V. K. Rao and K. Black, Type classification of finger- prints: A syntactic approach, IEEE Trans. PAMI 2, 223-231 (1980).
6. V.S. Srinivasan and N. N. Murthy, Detection of singular points in fingerprint images, Pattern Recognition 25(2), 139-153 (1992).
7. J. L. Blue, G. T. Candela, P. J. Grother, R. Chellapa and C. L. Wilson, Evaluation of pattern classifiers for finger- print and OCR applications, Pattern Recognition 27(4), 485-501 (1994).
8. C. L. Wilson, G. T. Candela and C. I. Watson, Neural Network Fingerprint Classification, J. Artific. Neural Networks 1(2), 1-25 (1993).
9. R. M. Stock and C. W. Swonger, Development and evaluation of a reader of fingerprint minutiae, Cornell
Aeronautical Laboratory, Technical Report CAL No. XM-2478-X-1 : 13-17 (1969).
10. C. I. Watson and C. L. Wilson, NIST Special Database 4. Fingerprint Database. National Institute of Standard and Technology (March 1992).
11. C. I. Watson, NIST Special Database 9. Mated Finger- print Card Pairs. National Institute of Standard and Technology (February 1993).
12. E. R. Henry, Classification and Uses of Fingerprints. George Routledge and Sons, London (1900).
13. J. H. Wegstein, An automated fingerprint identi- fication system. NBS Special Publication 500-89, National Bureau of Standards, U.S. Dept. of Commerce (1982).
14. C. L. Wilson. Personal communication.
About the Author--ANIL JAIN received a B.Tech. degree in 1969 from the Indian Institute of Technology, Kanpur, and the M.S. and Ph.D. degrees in Electrical Engineering from the Ohio State University, in 1970 and 1973, respectively. He joined the faculty of Michigan State University in 1974, where he currently holds the rank of University Distinguished Professor in the Department of Computer Science. Dr Jain served as Program Director of the Intelligent Systems Program at the National Science Foundation (1980-1981) and has held visiting appointments at Delft Technical University, Holland, Norwegian Computing Center, Oslo and Tata Research Development and Design Center, Pune, India. He has also been a consultant to several industrial, government and international organizations. His current research interests are computer vision, image processing, and pattern recognition. Dr Jain has made significant contributions and published a large number of papers on the following topics: statistical pattern recognition, exploratory pattern analysis, Markov random fields, texture analysis, interpretation of range images and 3D object recognition. Several of his papers have been reprinted in edited volumes on image processing and pattern recognition. He received the best paper awards in 1987 and 1991, and received certificates for outstanding contributions in 1976, 1979 and 1992 from the Pattern Recognition Society. Dr Jain served as the Editor-in-Chief of the IEEE Transactions on Pattern Analysis and Machine Intelligence (1991-1994) and currently serves on the editorial boards of Pattern Recognition journal, Pattern Recognition Letters, Journal of Mathematical Imaging, Journal of Applied Intelligence and IEEE Transactions on Neural Networks. He is the co-author of Algorithms for Clustering Data, Prentice-Hall, 1988, has edited the book Real-Time Object Measurement and Classification, Springer-Verlag, 1988, and has co-edited the books, Analysis and Interpretation of Range Images, Springer-Verlag, 1989, Neural Networks and Statistical Pattern Recognition, North-Holland, 1991, Markov Random Fields: Theory and Applications, Academic Press, 1993, and 3D Object Recognition, Elsevier, 1993. Dr Jain is a Fellow of the IEEE. He was the Co-General Chairman of the 11 th International Conference on Pattern Recognition, Hague (1992), General Chairman of the IEEE Workshop on Interpreta- tion of 3D Scenes, Austin (1989), Director of the NATO Advanced Research Workshop on Real-time Object Measurement and Classification, Maratea (1987) and co-directed NSF supported Workshops on Future Research Directions in Computer Vision, Maui (1991), Theory and Applications of Markov Random Fields, San Diego (1989) and Range Image Understanding, East Lansing (1988). Dr Jain was a member of the IEEE Publications Board (1988-1990) and served as the Distinguished Visitor of the IEEE Computer Society (1988-1990).
About the Author--KALLE KARU received a Diploma from Tartu University, Estonia, in 1993. He is currently a graduate student at Michigan State University. His current research interests are computer vision and image processing. Kalle Karu is a student member of IEEE.