fingerprint cards telecom equipment and it
TRANSCRIPT

Fingerprint Cards SwedenTelecom Equipment and IT
Commissioned Equity Research • 19 February 2019
KEY DATA
SwedenStock countryFINGB SSBloombergFINGb.STReuters
SEK 17.80 Share price (close)100%Free Float
EUR 0.53/SEK 5.59Market cap. (bn)www.fingerprints.comWebsite
15 May 2019Next report date
PERFORMANCE
Feb16 Feb17 Feb18 Feb190
30
60
90
120
Fingerprint Cards
Sweden OMX Stockholm All-Share (Rebased)
Source: Thomson Reuters
VALUATION APPROACH
4 9 14 19
DCF SEK 8.3 SEK 16.0
Source: Nordea estimates
ESTIMATE CHANGES
2021E2020E2019EYear3%4%-10%Sales
37%33%-54%EBIT (adj)
Source: Nordea estimates
Cost focus buys time for smartcard transition
The smartphone market is in decline and we calculate a fall in Fingerprint's addressable market of 11% for 2019E. We trim sales by 10% for 2019E but raise them by 4%, 3% and 16% for 2020E-22E, respectively, thanks to a potential improvement in the company's smartphone market share and higher smartcard volumes. Successful cost cutting and greater confidence in cost management lead to us lifting our EBIT margin estimates for 2020-22E by 2.2, 3.0 and 2.6 pp, respectively. We also foresee lower financial risks and increase our valuation range to SEK 8.3-16.0 (6.0-11.9).
Slight revenue beat, but gross and operating margins falterRevenue of SEK 424m beat our estimates by 2%. Gross margin declined 5.9 pp to 20.8%, missing our estimates by 3.3 pp owing to a delay in the new FPC 1511 and falling margins of older sensors. EBIT was SEK -26m in Q4 2018, SEK -25m less than our estimates. This was mainly due to higher admin costs than we had expected. However, overall opex was down 43% y/y in Q4, which makes us more confident in cost management.
Cost management has proven efficient, margins to expandWe forecast a gross margin expansion of 5.7 pp to 26.5% for Q1 2019E and 27.5% for 2019E as volumes of the new low-cost FPC1511 sensor picks up. The CEO expects the production costs of FPC1511 to be at least 10% lower. We are more confident in the company's ability to manage costs and cut our opex estimates by 3% a year for 2019E-20E.
Biometric smartcards reach 135m units 2023E, FPC pole positionOur recent market research spurs us to lift the market size for 2020E-22E by 61% owing to higher ASP and biometric smartcard volumes. We strengthen our view of Fingerprint as an early market leader, raising our segment revenue estimates by 61%, 61% and 84% for 2020-22, respectively.
Valuation high even with success in smartcards/smartphonesThe FPC share has surged 81% since the Q3 report, with a 2020E P/E of 40.2x and 2020E EV/EBIT of 26.7x. Using a WACC of 9.8%, our updated DCF-based fair value range is SEK 8.3-16.0 (6.0-11.9). The top end of this range requires rapid revenue growth, a leading position in the smartcard market, and a stable execution and market environment for smartphone sensors. However, the current share price still exceeds our assumptions.
Nordea Markets - AnalystsJörgen WetterbergSenior Analyst
Dan JohanssonAnalyst
Henning ZakrissonAnalyst
SUMMARY TABLE - KEY FIGURES
2021E2020E2019E2018201720162015SEKm1,9171,7991,4581,5352,9666,6382,901Total revenue
324274129-7562342,662939EBITDA (adj)22817833-7721552,613916EBIT (adj)
11.9%9.9%2.3%-50.3%5.2%39.4%31.6%EBIT (adj) margin0.570.440.04-2.010.386.6112.50EPS (adj)
28.1%898.3%102.2%-624.4%-94.2%-47.1%638.0%EPS (adj) growth0.000.000.000.000.000.000.00DPS (ord)2.42.63.41.71.52.8-0.4EV/Sales
19.926.7150.2n.m.29.27.1n.m.EV/EBIT (adj)31.440.2n.m.n.m.41.39.59.5P/E (adj)2.72.93.11.82.18.80.0P/BV
0.0%0.0%0.0%0.0%0.0%0.0%0.0%Dividend yield (ord)3.8%3.1%2.0%3.5%3.5%5.4%n.m.FCF Yield bef acq & disp
-1,038-827-652-541-455-1,162-1,031Net debt-3.2-3.0-5.10.7-1.9-0.4-1.1Net debt/EBITDA
20.1%11.9%2.1%-34.1%6.5%n.m.n.m.ROIC after taxSource: Company data and Nordea estimates
Marketing material commissioned by Fingerprint Cards

Fingerprint Cards19 February 2019
Company update: Q4 2018 reportFingerprint's reported Q4 net sales of SEK 424m, 2.2% above our estimates but down 31% y/y. The previously troubled gross margin ended up at 20.8%, higher than the lows of around 15% in H1 2018 but sequentially down by 5.9 pp. The company does not issue guidance for margins but claims that it is set to improve as the new, more profitable low-cost FPC1511 sensor becomes a bigger share of the sensors sold. We expect this to happen gradually in H1 2019. Although the company has completed its cost-cutting programme, it reveals that it is working on trimming costs even further. The last payment from the DeltaID acquisition debt was paid off in the quarter, making the company free of long-term debt.
FINGERPRINT CARDS: Q4 2018 DEVIATION TABLE
Actual Nordea Cons. Actual Actual
(SEKm) Q4 18 Q4 18E Q4 18E Q3 18 q/q Q4 17 y/yNet sales 424 415 +9 +2.2% 380 44 +12% 431 -2% 615 -31%
Gross profit 88 100 -12 -12% 101 -13 -13% 115 -23% 130 -113%Gross margin 21% 24% -3.3pp 27% -5.8pp 27% -5.9pp 21% -0.4pp
EBIT -26 -1 -25 -2450% 7 -32 -475% 7 -470% -41 +37%Operating margin -6% 0% -5.8pp 2% -7.8pp 2% -7.6pp -7% +0.6pp
EPS -0.06 -0.02 -0.04 -200% 0.02 -0.08 -498% 0.01 -700% -0.05 -20%
Deviation
vs. actual
Deviation
vs. actual
Source: Company data, Infront and Nordea estimates
Company resultsSmartphone market still challenging
Fingerprint's reported net sales of SEK 424m in Q4, were 2.2% above our estimates but a decline of 31% y/y. The competitive market for capacitive fingerprint sensors is still challenging and has led to lower ASPs. We note that various sources claim volumes in the smartphone industry as a whole, have been in decline over the past two years. However, Fingerprint is one of four major fingerprint sensor manufacturers still active on the market and it says that the ASP erosion is starting to subside.
Non-smartphone revenues exceed 10% in Q4 2018
The company has a target that 10% of revenues should stem from other segments than fingerprint sensors for smartphones. It achieved this in Q4 2018, with most of the volumes coming in H2. The largest segment in non-smartphone revenues is fingerprint sensors for door locks, a growing market in China.
QUARTERLY NET SALES PROGRESSION
-70.0%
-60.0%
-50.0%
-40.0%
-30.0%
-20.0%
-10.0%
0.0%
10.0%
20.0%
30.0%
0
200
400
600
800
1,000
1,200
1,400
1,600
1,800
Q4 16 Q1 17 Q2 17 Q3 17 Q4 17 Q1 18 Q2 18 Q3 18 Q4 18
SE
Km
Net sales y/y
Source: Company data
Marketing material commissioned by Fingerprint Cards 2
Fingerprint Cards19 February 2019
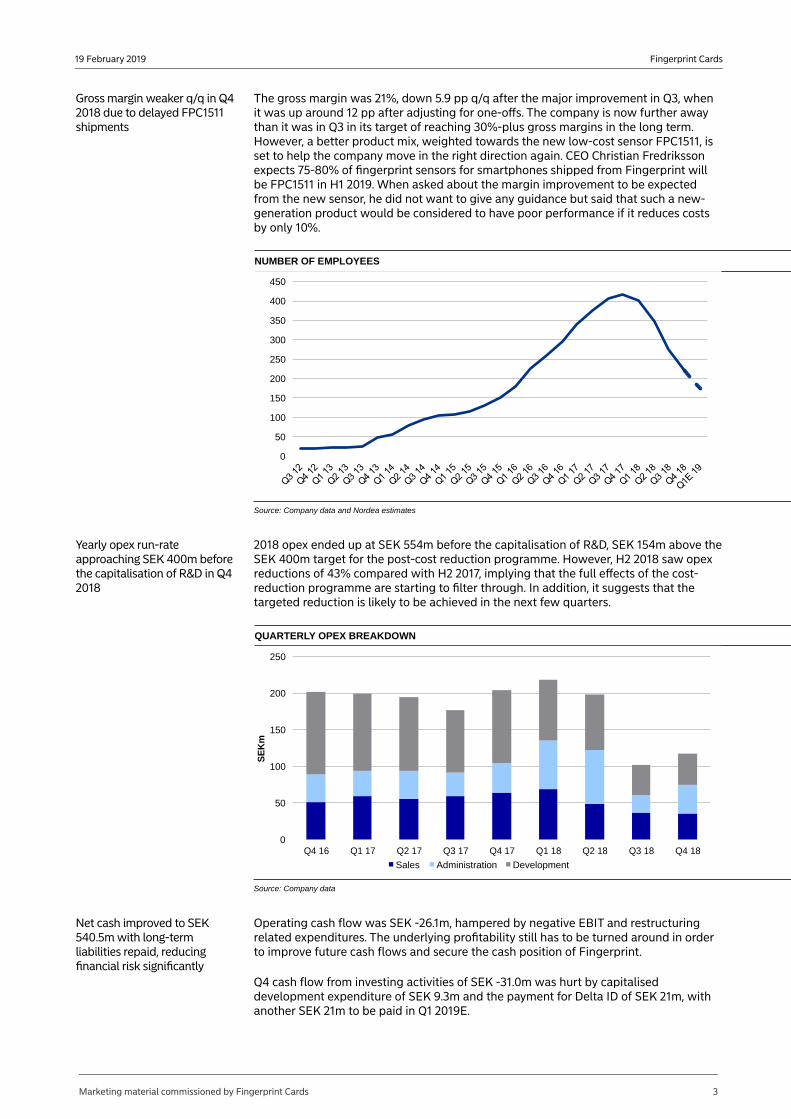
Gross margin weaker q/q in Q4 2018 due to delayed FPC1511 shipments
The gross margin was 21%, down 5.9 pp q/q after the major improvement in Q3, when it was up around 12 pp after adjusting for one-offs. The company is now further away than it was in Q3 in its target of reaching 30%-plus gross margins in the long term. However, a better product mix, weighted towards the new low-cost sensor FPC1511, is set to help the company move in the right direction again. CEO Christian Fredriksson expects 75-80% of fingerprint sensors for smartphones shipped from Fingerprint will be FPC1511 in H1 2019. When asked about the margin improvement to be expected from the new sensor, he did not want to give any guidance but said that such a new-generation product would be considered to have poor performance if it reduces costs by only 10%.
NUMBER OF EMPLOYEES
0
50
100
150
200
250
300
350
400
450
Source: Company data and Nordea estimates
Yearly opex run-rate approaching SEK 400m before the capitalisation of R&D in Q4 2018
2018 opex ended up at SEK 554m before the capitalisation of R&D, SEK 154m above the SEK 400m target for the post-cost reduction programme. However, H2 2018 saw opex reductions of 43% compared with H2 2017, implying that the full effects of the cost-reduction programme are starting to filter through. In addition, it suggests that the targeted reduction is likely to be achieved in the next few quarters.
QUARTERLY OPEX BREAKDOWN
0
50
100
150
200
250
Q4 16 Q1 17 Q2 17 Q3 17 Q4 17 Q1 18 Q2 18 Q3 18 Q4 18
SE
Km
Sales Administration Development
Source: Company data
Net cash improved to SEK 540.5m with long-term liabilities repaid, reducing financial risk significantly
Operating cash flow was SEK -26.1m, hampered by negative EBIT and restructuring related expenditures. The underlying profitability still has to be turned around in order to improve future cash flows and secure the cash position of Fingerprint.
Q4 cash flow from investing activities of SEK -31.0m was hurt by capitalised development expenditure of SEK 9.3m and the payment for Delta ID of SEK 21m, with another SEK 21m to be paid in Q1 2019E.
Marketing material commissioned by Fingerprint Cards 3

Fingerprint Cards19 February 2019
Cash flow from financing activities was SEK -151.3m. It consisted of amortisation and the repayment of the remaining portion of the acquisition loan for Delta ID, after which Fingerprint has no interest-bearing liabilities.
Net cash ended Q4 at SEK 540.5m (454.9).
The smartphone sensor marketFingerprint's in-display optical sensor to be introduced during 2019 – lagging competitors
In line with our expectations, the main biometric trend in new high-end smartphones launched in Q4 was in-display fingerprint sensors. With Fingerprint's sensor still to be launched, it looks as though the company will enter a more mature market than it and we previously forecast, since other manufacturers of such sensors have already launched their products and started to supply smartphone OEMs.
Fingerprint remarked that it will launch its in-display optical solution during 2019. We believe that better price performance is needed in order for Fingerprint to reach a market share on a par with the more mature capacitive sensor segment.
Samsung is stopping their iris sensors in Galaxy S10
Samsung decided to let go of the iris recognition from its Galaxy S10 model, instead of going for in-display fingerprint. This is a big blow for the market of iris recognition technology, which has had the Samsung flagship series as an important forerunner. However, we believe that iris has a place in the market as a multimodal feature as soon as cameras and sensors move into the displays. We note that Samsung is not a Fingerprint's customer when it comes to handheld devices.
18 new models with Fingerprint's sensors
A total of 18 new smartphone models using Fingerprints sensors were launched in the quarter compared with 12 in Q3.
SELECT RECENT HANDSETS LAUNCHED WITH FINGERPRINT SENSORS
Announcement Launch Manufacturer Model Sensor
10/10/2018 18/10/2018 Google Pixel 3 FPC1075
10/10/2018 18/10/2018 Google Pixel 3 XL FPC1075
24/10/2018 16/10/2018 Huawei Mate 20 FPC1291
25/10/2018 25/10/2018 Xiaomi MIX 3 FPC1291
30/10/2018 09/11/2018 Xiaomi Black Shark Helo FPC1229
14/01/2019 12/02/2019 Xiaomi Redmi Note 7 FPC1511
14/01/2019 24/12/2018 Xiaomi Play FPC1028
Source: Company data
Iris and face recognition efforts merge
While no comments were made about the potential dismantled development of a 3D face recognition sensor algorithm, CEO Christian Fredriksson announced that the next generations of iris recognition were under development. He commented that the company was working on a combined 2D face and iris-sensor technology that would combine the ease-of-use of face recognition with the high security of iris recognition.
The smartcard marketSome recent research and remarks made about the future size of the biometric smartcard market prompt us to reconsider our views. Research house Goode Intelligence and smartcard sensor developer Next Biometrics have both released forecast figures for the size of such markets, predicting 579 million and 800 million biometric smartcards, respectively, to be shipped in 2023E. Both are positive about the extensive growth potential of biometric smartcards. Fingerprint's CEO is still more careful in making predictions. However, he did note that half of the payment cards shipped today use the relatively new contactless NFC technology and that this was a positive data point to take into account. Our main issue with these volume forecasts is the price of the sensors compared with the price of a smartcard.
We highlight a few of the newly presented data points and forecasts. We present our view in the segment 'The biometric smartcard market' below.
Marketing material commissioned by Fingerprint Cards 4

Fingerprint Cards19 February 2019
FINGERPRINT'S OUT-OF-THE-BOX SMARTCARD ENROLMENT KIT
Source: Company data
Fingerprint innovates to resolve the enrolment challenges for biometric smartcards
The day before the Q4 report, Fingerprint presented its solution for the previously problematic concept of fingerprint enrolment for smartcards. A few different solutions were presented in a video on the company's website, including a demonstration version of an out-of-the-box enrolment kit. While this does not change our fundamental views on the size of the market, it shows that Fingerprint is aware of potential problems in future products. It also highlights that the company is willing to innovate to overcome these problems and to offer solutions.
The Fingerprint shareFingerprint's share has had a remarkable run
The Fingerprint share has, after a long period of decline, bounced up in the past few months. It is now at a level unseen in 2018. YTD, the stock is up 83%, and the 52-week return is 85%.
52-WEEK SHARE PRICE TREND
0
5
10
15
20
25
Feb2018
Mar2018
Apr2018
May2018
Jun2018
Jul2018
Aug2018
Sep2018
Oct2018
Nov2018
Dec2018
Jan2019
Feb2019
SE
K
Source: Thomson Reuters
Marketing material commissioned by Fingerprint Cards 5
Fingerprint Cards19 February 2019
Share price increase somewhat puzzling
It is not entirely clear what has provided the fuel for the rally in the past few months. There has been no major news from the company and new guidance has not been released. We find the most credible reason to be more interest from institutional investors (eg Legal & General) as a result of index tracking. In addition, retail investors may have updated their views on the upcoming smartcard market and insiders may be buying the stock, improving the sentiment. New research and comments about smartcard volumes have surfaced in the time period, especially connected to Fingerprint's competitors and partners such as Idex, Next and Zwipe. We highlight some of these numbers and present our view in the segment 'The biometric smartcard' segment below.
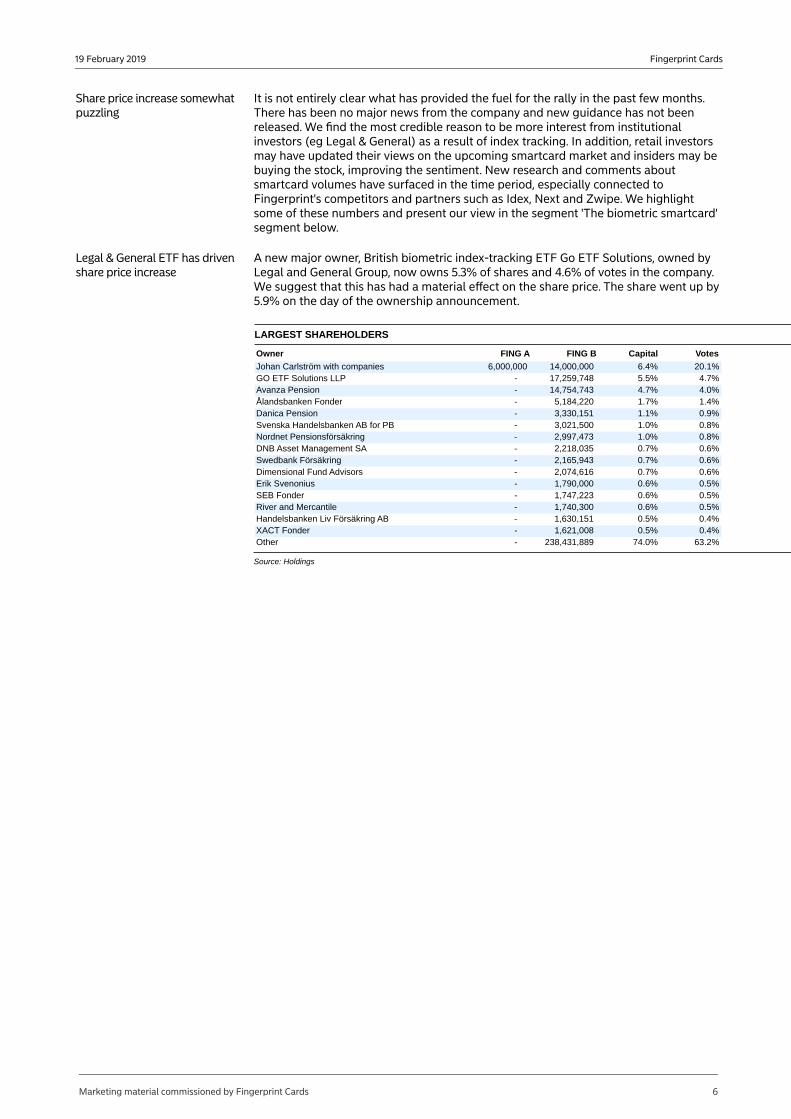
Legal & General ETF has driven share price increase
A new major owner, British biometric index-tracking ETF Go ETF Solutions, owned by Legal and General Group, now owns 5.3% of shares and 4.6% of votes in the company. We suggest that this has had a material effect on the share price. The share went up by 5.9% on the day of the ownership announcement.
LARGEST SHAREHOLDERS
Owner FING A FING B Capital Votes
Johan Carlström with companies 6,000,000 14,000,000 6.4% 20.1%GO ETF Solutions LLP - 17,259,748 5.5% 4.7%Avanza Pension - 14,754,743 4.7% 4.0%Ålandsbanken Fonder - 5,184,220 1.7% 1.4%Danica Pension - 3,330,151 1.1% 0.9%Svenska Handelsbanken AB for PB - 3,021,500 1.0% 0.8%Nordnet Pensionsförsäkring - 2,997,473 1.0% 0.8%DNB Asset Management SA - 2,218,035 0.7% 0.6%Swedbank Försäkring - 2,165,943 0.7% 0.6%Dimensional Fund Advisors - 2,074,616 0.7% 0.6%Erik Svenonius - 1,790,000 0.6% 0.5%SEB Fonder - 1,747,223 0.6% 0.5%River and Mercantile - 1,740,300 0.6% 0.5%Handelsbanken Liv Försäkring AB - 1,630,151 0.5% 0.4%XACT Fonder - 1,621,008 0.5% 0.4%Other - 238,431,889 74.0% 63.2%
Source: Holdings
Marketing material commissioned by Fingerprint Cards 6

Fingerprint Cards19 February 2019
Estimate revisionsThe Q4 report and newly announced data points on relevant markets prompt us to revise our estimates. We expect the smartphone market to decline further in 2019, affecting capacitive sensor volumes. However, we see heightened potential in the smartcard market for the years beyond 2019, thanks to the emergence of new research and promising comments by competitors recently. We are more confident in Fingerprint's ability to raise margins and manage costs. We present our new estimates below and explain our motivation for the revisions. Our new estimates and scenario analysis lead to a DCF-based valuation range of SEK 8.3-16.0 (6.0-11.9).
The four main assumptions that spur our estimate revisions are:
The smartphone market will be challenging in 2019, with the third year of declining volumes. We forecast a decline of 11% in Fingerprint's addressable market of smartphone volumes. This will lead to volume reductions, but Fingerprint will likely manage to grab a larger market share. This is because its major customers are not those suffering the most in the market, and we note that the attachment rates of fingerprint sensors are set to increase.The price of a smartcard sensor is likely going to be higher than we had thought, even when volumes pick up. We increase our ASP estimates by 60%. We also increase the attachment rates slightly for payment cards after 2020E, and we are still confident in Fingerprint's market position in the segment.The margin effect of the new FPC1511 sensor has not yet been seen in numbers, but this will improve underlying margins for the core business starting in H1 2019. This leads us to increase our gross margin assumptions by 0.5 pp and 2.0 pp for 2020-21, respectively. We also revise our opex estimates to take into account the successful cost-cutting programme in H2 2018.The company is now debt-free and the immediate risk of financial shortage and default has been lowered significantly. Therefore, we reduce our financial risk estimates in our valuation.
FINGERPRINT CARDS: EARNINGS REVISIONS
SEKm 2019E 2020E 2021E 2022E 2019E 2020E 2021E 2022E 2019E 2020E 2021E 2022E 2019E 2020E 2021E 2022E
Net sales 1,458 1,799 1,917 2,316 1,622 1,736 1,858 1,989 -164 +63 +58 +327 -10.1% +3.7% +3.1% +16.4%Gross profit 401 558 632 741 454 529 576 636 -53 +28 +56 +105 -11.7% +5.4% +9.8% +16.4%Gross margin 27.5% 31.0% 33.0% 32.0% 28.0% 30.5% 31.0% 32.0% -0.5pp +0.5pp +2.0pp - - - - -
Operating expensesSales expenses 131 148 160 185 143 146 149 151 -12 +2 +12 +34 -8% +1% +8% +22%Administrative expenses 93 88 88 88 94 94 94 94 -1 -6 -6 -6 -1% -6% -6% -6%Development expenses 144 144 156 160 146 156 167 179 -2 -12 -11 -19 -1% -8% -7% -11%Total opex 368 380 404 433 382 395 409 424 -14 -16 -5 +9 -4% -4% -1% +2%
Other operating income 0 0 0 0 0 0 0 0 - - - - - - - -
EBIT 33 178 228 308 71 134 166 212 -39 +45 +62 +96 -54% +33% +37% +45%EBIT margin 2.3% 9.9% 11.9% 13.3% 4.4% 7.7% 8.9% 10.7% -2.1pp +2.2pp +3.0pp +2.6pp - - - -
EPS 0.04 0.44 0.57 0.76 0.14 0.33 0.41 0.53 -0.10 +0.11 +0.15 +0.24 -68% +33% +37% +45%
Units shipped (m)Capacitive 216 231 238 242 235 233 246 252 -19 -1 -8 -10 -8% -1% -3% -4%In-display 1 8 19 34 1 11 27 45 -0 -3 -8 -11 -32% -30% -30% -25%Iris 20 43 59 64 56 89 116 119 -36 -45 -57 -55 -64% -51% -49% -46%Smartcards - 7 14 43 1 7 12 32 -1 +0 +2 +11 -100% +0% +15% +34%
ASP (USD)Capacitive 0.69 0.59 0.50 0.42 0.67 0.57 0.48 0.41 +0.02 +0.02 +0.02 +0.01 +4% +4% +4% +4%In-display 2.9 2.0 1.5 1.1 2.9 2.0 1.5 1.1 - - - - - - - -Iris 0.3 0.3 0.3 0.3 0.3 0.3 0.3 0.3 - - - - - - - -Smartcards 6.4 4.5 3.1 2.2 4.0 2.8 2.0 1.4 +2.4 +1.7 +1.2 +0.8 +60% +60% +60% +60%
New Estimates Old estimates Diff % Diff
Source: Nordea estimates
Marketing material commissioned by Fingerprint Cards 7

Fingerprint Cards19 February 2019
Smartphone segmentSmartphone volumes set to decline
New reports on the number of smartphones shipped during 2018 reveal a decline in volumes for the second year in a row. Profit warnings issued by Apple and Samsung, among others, and industry analyst reports from IDC and Credit Suisse also do not bode well for 2019. Some in the market have even claimed that volumes will decline to levels not seen since 2013, burdened primarily by weakened consumer demand in China.
Smartcards to account for more than a third of revenues from 2022E
FINGERPRINT'S REVENUES
0
1,000
2,000
3,000
4,000
5,000
6,000
7,000
2015 2016 2017 2018 2019E 2020E 2021E 2022E 2023E 2024E
SE
Km
Capacitive In-display Iris Face Smartcards Automotive&Embedded
Source: Company data and Nordea estimates
Smartphone market in decline, Fingerprint's position stable
While Fingerprint claims that its major customers have not issued profit warnings recently, we still believe that the smartphone market will decline in 2019, taking its toll on Fingerprint's performance. We thus lower our total smartphone shipment volumes for 2019. We now see an 11% decline in volumes y/y, which leads to a decrease in Fingerprint's addressable market for capacitive sensors. We keep our volume growth forecasts for 2020-22. The effect is mitigated by the fact that the major Fingerprint customers have not announced the same volume issues. In addition, Fingerprint is now one of only four major players in the capacitive sensor market for smartphones. This encourages us to increase the company's market share slightly in our forecasts, mitigating the lower sensor volume in 2020E-22E.
GLOBAL SMARTPHONE SHIPMENTS
-15.0%
-10.0%
-5.0%
0.0%
5.0%
10.0%
15.0%
20.0%
25.0%
30.0%
0
200
400
600
800
1,000
1,200
1,400
1,600
2013 2014 2015 2016 2017 2018 2019E 2020E 2021E 2022E 2023E 2024E
mill
ion
un
its
Smartphone shipments y/y growth
Source: IDC, Credit Suisse, Statista, ABI Research and Nordea estimates
We also believe that our previous assumptions on sensor ASP have been a little low and now reduce our assumed price erosion in 2019, leading to 4% higher sensor ASP.
Iris recognition not catching much interest in smartphones
It is clear that iris recognition in smartphones has not caught the interest that Fingerprint had hoped for when acquiring Delta ID, nor has it been as high as we had forecast in our previous reports. The fact that Samsung decided to ditch iris recognition in the flagship model Galaxy S10 is a negative data point, in our view, and it calls for negative attachment rate revisions. We lower our touchless sensor shipment estimate
Marketing material commissioned by Fingerprint Cards 8

Fingerprint Cards19 February 2019
by 64% for 2019. However, since the numbers were low to begin with, this does not have a material impact on our revenue estimates.
FINGERPRINT'S TOUCHLESS SENSOR SHIPMENTS
0%
5%
10%
15%
20%
25%
30%
0
10
20
30
40
50
60
70
80
2018 2019E 2020E 2021E 2022E 2023E
mil
lion
un
its
Touchless in smartphones Touchless in embedded segment
Smartphone iris sensor market share Smartphone attachment rate
Source: Nordea estimates
SmartcardsASP for smartcard likely higher than we expected
As discussed in the segment 'The biometric smartcard market', new data on sensor costs and card volumes have been published recently, which has led us to revise our view on the market size slightly. We increase the sensor ASP in the segment by 60%, due to comments made by Fingerprint's competitors. The higher ASP also reflects the fact that Fingerprint is likely to ship sensors and complete T-shape modules for smartcards, thus earning a bigger share of the card cost.
GLOBAL PAYMENT CARD SHIPMENTS
0%
2%
4%
6%
8%
10%
12%
0
500
1,000
1,500
2,000
2,500
3,000
3,500
4,000
2019E 2020E 2021E 2022E 2023E 2024E
Non-biometric payment cards Biometric payment cards Attachment rate
Source: Nordea estimates
Smartcards are set to grow rapidly
Even though the main problem with attachment rates in smartcards is the price of the sensors, we expect the market to grow slightly faster than before in light of the recent research. We remove all shipment forecasts from 2019 and now expect the first million in volumes to roll out in 2020, with increased volume estimates for 2021-22.
We detail our view on the size of the biometric smartcard market in the segment 'The biometric smartcard market'.
Cost managementMore faith in company's cost-cutting abilities
Thanks to the sweeping cost reductions the company has achieved in the last two quarters, we are now more confident in its ability to make further cuts and keep costs down. Based on the opex target of under SEK 400m before the capitalisation of R&D, we reduce our opex estimates for the coming years, mainly in 2019. While the administrative costs saw a rise in Q4, both H2 and Q4 2018 opex saw y/y declines of
Marketing material commissioned by Fingerprint Cards 9

Fingerprint Cards19 February 2019
43%. This is the reason why we expect the opex reductions to be sustainable. We believe administrative costs will be lower in H1 2019E as a result of the cancelled leases and other cost-cutting measures.
OPEX FORECASTS
0
50
100
150
200
250
300
350
400
450
H115
H215
H116
H216
H117
H217
H118
H218
H119
H219
H120
H220
H121
H221
H122
H222
H123
H223
H124
H224
SE
Km
Sales expenses Administrative expenses Development expenses
Source: Company data and Nordea estimates
The only cost that we do not reduce for 2019E-22E is sales expenses, which we believe will increase as revenue rises owing to sales provisions and the like.
Gross margin to improve during 2019E
While the gross margin came in lower than we expected, this seems to be due to the effect of the low-cost sensor FPC1511 reaching meaningful volumes later than we thought. We decrease our margin assumptions slightly for H1 2019 but increase them for H2, when we assume the ~12% cheaper sensor will start to gain volume shares. This also affects 2020E-21E margins. In 2021, we believe the volumes in the new smartcard segment will start to increase, improving the overall gross margins with its higher product margins.
Embedded solutionsOther segment will account for roughly 10% of revenues in 2019E
That more than 10% of Fingerprint's 2018 revenue came from segments other than smartphones is a testament to the mounting interest in implementing biometric sensors in other solutions such as security, border control, and identification for everyday IoT items. The market for biometric door locks, especially in China, is growing at promising rates, in our view. Fingerprints claimed to have an attractive position in this market in 2018, with a total of 10 million sensors shipped in China. It forecasts 15 million sensors for China alone for 2019. Therefore, we increase our sensor shipment volumes in the embedded segments for the next few years, leading to higher revenues from the segment.
Marketing material commissioned by Fingerprint Cards 10

Fingerprint Cards19 February 2019
Detailed estimatesFINGERPRINT: VOLUMES AND ASP
Q3 18 Q4 18 Q1 19E Q2 19E Q3 19E 2017 2018 2019E 2020E 2021E 2022E 2023E
USD/SEK 8.95 9.05 9.25 9.25 9.25 8.54 8.70 9.25 9.25 9.25 9.25 9.25Revenues (SEKm) 431 424 349 364 395 2,966 1,535 1,458 1,799 1,917 2,316 2,737Change y/y -49% -31% 21% -7% -8% -55% -48% -5% 23% 7% 21% 18%
Smartphone related units (m)Capacitive 52 57 46 49 55 245 193 200 215 217 220 221ASP (USD) 0.84 0.74 0.72 0.71 0.68 1.41 0.83 0.69 0.59 0.50 0.42 0.38Change y/y -39% -43% -20% -17% -19% -38% -41% -17% -15% -15% -15% -10%In-display 0 0 0 0 0 0 0 1 8 19 34 60ASP (USD) - - - - - - 4.2 2.9 2.0 1.5 1.1 0.8Change y/y - - - - - - - -30% -30% -27% -25% -25%
Iris - - - - - - - 4 23 37 40 43ASP (USD) - - - - - - 0.38 0.34 0.31 0.28 0.25 0.23Change y/y - - - - - - - -10% -10% -10% -10% -10%
Smartcard related units (m) 0 0 0 0 0 0 0 0 7 14 43 88ASP (USD) 8.00 8.00 6.40 6.40 6.40 - 8 6 4 3 2 2Change y/y 0.0% 0.0% -20.0% -20.0% -20.0% 0 0 0 0 0 0 0
Automotive & Embedded-related units (m)Capacitive 3.50 4.30 4.00 4.00 4.00 4 13 16 16 21 23 27Touchless 4.00 4.00 3.61 4.00 4.00 10.0 16.0 15.6 20.0 22.0 24.2 26.6
Source: Company data and Nordea estimates
FINGERPRINT: P&L
Q3 18 Q4 18 Q1 19E Q2 19E Q3 19E 2017 2018 2019E 2020E 2021E 2022E 2023E
Net sales 431 424 349 364 395 2,966 1,535 1,458 1,799 1,917 2,316 2,737
Change y/y -49% -31% 21% -7% -8% -55% -48% -5% 23% 7% 21% 18%Cost of goods sold -316 -336 -257 -264 -285 -1,977 -1,533 -1,057 -1,242 -1,284 -1,575 -1,883Gross profit 115 88 92 100 110 989 2 401 558 632 741 854Gross margin 27% 21% 26% 27% 28% 33% 0% 28% 31% 33% 32% 31%
Sales expenses -37 -35 -31 -33 -36 -237 -189 -131 -148 -160 -185 -213Administrative expenses -24 -39 -23 -23 -23 -146 -202 -93 -88 -88 -88 -88Development expenses -41 -43 -36 -36 -36 -391 -244 -144 -144 -156 -160 -170Total opex -102 -117 -91 -92 -95 -774 -635 -368 -380 -404 -433 -471Change y/y -42% -43% -58% -54% -7% 29% -18% -42% 3% 6% 7% 9%Opex/sales 24% 28% 26% 25% 24% 26% 41% 25% 21% 21% 19% 17%Other operating incomes/expenses -7 3 0 0 0 -61 -139 0 0 0 0 0
Operating profit 7 -26 2 8 15 155 -772 33 178 228 308 382Margin 2% -6% 1% 2% 4% 5% -50% 2% 10% 12% 13% 14%Net financial items -4 2 -4 -4 -4 -13 -25 -15 0 0 0 0
Pre-tax profit 3 -24 -2 4 12 142 -797 18 178 228 308 382Tax 0 6 0 -1 -3 -22 166 -4 -39 -50 -68 -84Tax rate 7% 26% 22% 22% 22% 15% 21% 22% 22% 22% 22% 22%Net profit 3 -18 -2 3 9 120 -631 14 139 178 240 298EPS 0.01 -0.06 0.00 0.01 0.03 0.38 -2.01 0.04 0.44 0.57 0.76 0.95
Source: Company data and Nordea estimates
Marketing material commissioned by Fingerprint Cards 11

Fingerprint Cards19 February 2019
The biometric smartcard marketFingerprint's revenues in the last years have almost entirely stemmed from capacitive sensors for smartphones, a market that is in clear decline. As a result, the company is venturing into new markets. One of the main bets as of today is that of biometric smartcards. These are payment and security cards that implement a fingerprint scanner to mitigate the security issues of PIN codes and contactless payments. There are many views on the size of this market, and the uncertainty is one of the key reasons for the volatility and differing views on the value of theFingerprint's stock. We therefore want to shed some light on the subject and present our views below.
Fingerprint was founded to create fingerprint sensors for payment cards
When Fingerprint Cards was founded in 1997, the company's objective was to develop fingerprint sensors for payment cards. In 2005, founder Lennart Carlson wanted to dismantle all operations due to the slower-than-expected developing market for biometric solutions. The company was saved and it entered a golden age when fingerprint sensors became popular in smartphones. It is now returning to its roots thanks to the potentially burgeoning market for biometric smartcards. The world might have not been ready in 1997, but the question is if it is ready now.
Year-to-date, Fingerprint's stock is up 83%. While the news flow contains a few product launches in smartphones using Fingerprint's sensors, we believe the main cause of the movements is changing views on the size of the biometric smartcard market.
In the coming sections, we present a number of different views on the relevant factors affecting the future revenue streams of Fingerprint's smartcard sensor business line –mainly being the size of the card market, the attachment rate of fingerprint sensors, the price of a sensor and the market share of Fingerprint.
The size of the payment card marketThe size of the market is uncertain
With new payment methods on the rise globally, and with the huge Chinese market historically favouring smartphone over card payments, the number of payment cards shipped in the coming years is not a straight-forward thing to forecast. Even historical numbers contain differences depending on sources and definitions.
FORECASTS OF PAYMENT CARD SHIPMENTS GLOBALLY
-
500
1,000
1,500
2,000
2,500
3,000
3,500
4,000
2010 2011 2012 2013 2014 2015 2016 2017 2018 2019E2020E2021E2022E2023E
Eurosmart 2018 IHS Markit 2017 Nordea 2018
Source: Eurosmart, IHS Markit and Nordea estimates
Marketing material commissioned by Fingerprint Cards 12

Fingerprint Cards19 February 2019
We base our estimates on a number of research houses
Our estimates from 2018 are based on research from IHS, Eurosmart and statements made by ABI Research, Fingerprint Cards, peers and competitors.
The attachment rate of biometric sensorsBiometric sensors are convenient and secure
No matter the size of the payment card market in the future, Fingerprint can only address the portion of the cards that will implement biometrics. It is probable that fingerprints will become the standard biometric solution for biometric payment cards, even though similar concepts such as vein patterns have been discussed, simply because it is user friendly, familiar and secure.
However, they cost more than the card themselves
The main problem with implementing a fingerprint sensor to a payment card is not the customer usefulness or the card manufacturer demand. In recent years, the popularity of the contactless Near Field Communication (NFC) solution has increased, with some sources citing attachment rates of around 50% in certain regions. In addition, the cards have been praised by customers and vendors for their user-friendliness and speed. Besides aligning one's thumb to the sensor, a biometric smartcard requires almost the same action from a user but does not come with a payment cap that a contactless card does today. Based on this, we reason that biometric smartcards will be as popular with users as contactless cards are. We therefore assume that there will not be any material issues in customer demand.
The problem rather is the price of a fingerprint sensor. While different producers and researchers claim different present prices of fingerprint sensors for smartcards, consensus is that attaching a sensor to a card today will increase the cost of the card dramatically. This is the balancing act of the market size – the higher the price, the lower the attachment rates and vice versa.
SMARTPHONE FINGERPRINT SENSOR ATTACHMENT RATE AND ASP
0%
10%
20%
30%
40%
50%
60%
70%
$0.00
$0.50
$1.00
$1.50
$2.00
$2.50
$3.00
2015 2016 2017 2018 2019E
US
D
ASP Attachment rate
Source: Company data and Nordea estimates
Attachment rates in smartphones went up rapidly after the iPhone 5S
There are two historical cases of interest. First is the obvious other mass market for fingerprint sensors – the smartphone industry – where attachment rates quickly went to above 50% after the launch of the pioneering iPhone 5S. The important thing to keep in mind here is that the ASP of a fingerprint sensor is less than 1% of the complete production cost for many models. In contrast, a fingerprint sensor for a smartcard is likely around 400% of the cost of a contactless payment card today, assuming a sensor price of USD 8 and a card price of around USD 2.
Contactless payment cards have become very popular
The other interesting case is that of contactless payment cards. The novelty was launched by major card payment schemes in 2005 and has grown significantly since then, with some reports claiming that more than half of the cards shipped today come with contactless technology. At a Nordea Tech Seminar in November 2018, Fingerprint's CEO, Christian Fredriksson, commented that it took eight years for contactless cards to surpass a billion in volumes. We see no reason why biometric sensors in smartcards should follow a faster volume trend than this.
Marketing material commissioned by Fingerprint Cards 13
Fingerprint Cards19 February 2019
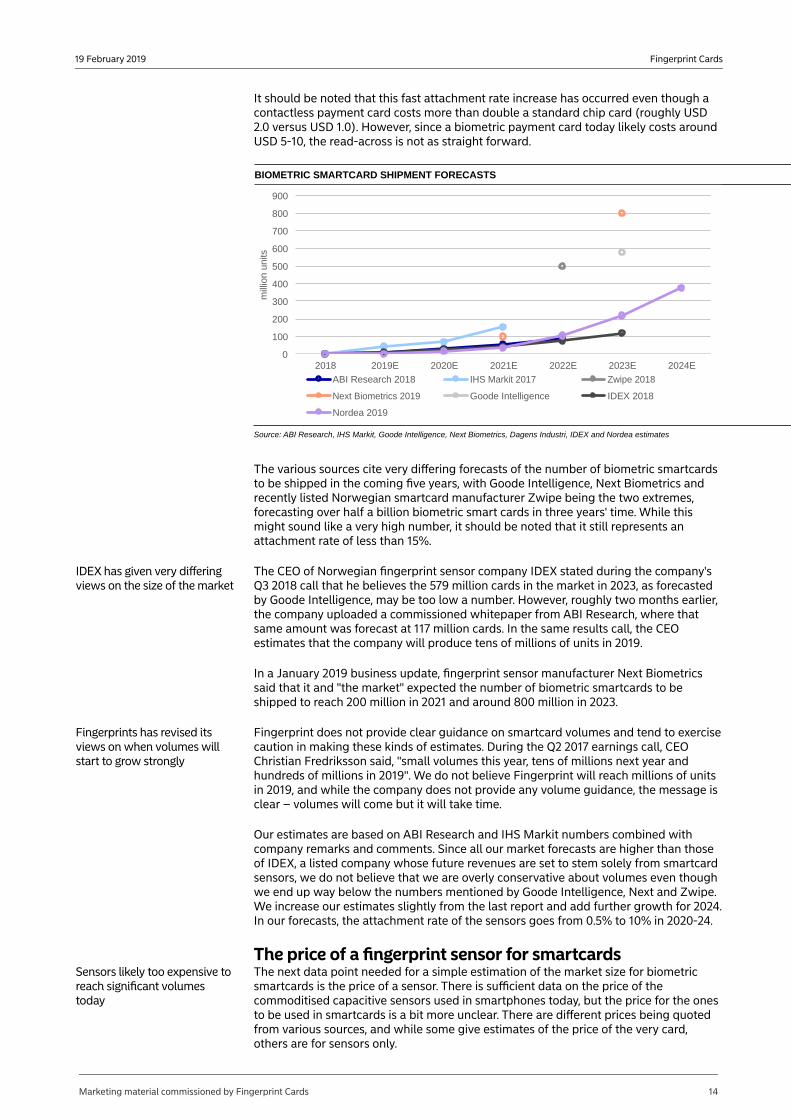
It should be noted that this fast attachment rate increase has occurred even though a contactless payment card costs more than double a standard chip card (roughly USD 2.0 versus USD 1.0). However, since a biometric payment card today likely costs around USD 5-10, the read-across is not as straight forward.
BIOMETRIC SMARTCARD SHIPMENT FORECASTS
0
100
200
300
400
500
600
700
800
900
2018 2019E 2020E 2021E 2022E 2023E 2024E
mill
ion
units
ABI Research 2018 IHS Markit 2017 Zwipe 2018
Next Biometrics 2019 Goode Intelligence IDEX 2018
Nordea 2019
Source: ABI Research, IHS Markit, Goode Intelligence, Next Biometrics, Dagens Industri, IDEX and Nordea estimates
The various sources cite very differing forecasts of the number of biometric smartcards to be shipped in the coming five years, with Goode Intelligence, Next Biometrics and recently listed Norwegian smartcard manufacturer Zwipe being the two extremes, forecasting over half a billion biometric smart cards in three years' time. While this might sound like a very high number, it should be noted that it still represents an attachment rate of less than 15%.
IDEX has given very differing views on the size of the market
The CEO of Norwegian fingerprint sensor company IDEX stated during the company's Q3 2018 call that he believes the 579 million cards in the market in 2023, as forecasted by Goode Intelligence, may be too low a number. However, roughly two months earlier, the company uploaded a commissioned whitepaper from ABI Research, where that same amount was forecast at 117 million cards. In the same results call, the CEO estimates that the company will produce tens of millions of units in 2019.
In a January 2019 business update, fingerprint sensor manufacturer Next Biometrics said that it and "the market" expected the number of biometric smartcards to be shipped to reach 200 million in 2021 and around 800 million in 2023.
Fingerprints has revised its views on when volumes will start to grow strongly
Fingerprint does not provide clear guidance on smartcard volumes and tend to exercise caution in making these kinds of estimates. During the Q2 2017 earnings call, CEO Christian Fredriksson said, "small volumes this year, tens of millions next year and hundreds of millions in 2019". We do not believe Fingerprint will reach millions of units in 2019, and while the company does not provide any volume guidance, the message is clear – volumes will come but it will take time.
Our estimates are based on ABI Research and IHS Markit numbers combined with company remarks and comments. Since all our market forecasts are higher than those of IDEX, a listed company whose future revenues are set to stem solely from smartcard sensors, we do not believe that we are overly conservative about volumes even though we end up way below the numbers mentioned by Goode Intelligence, Next and Zwipe. We increase our estimates slightly from the last report and add further growth for 2024. In our forecasts, the attachment rate of the sensors goes from 0.5% to 10% in 2020-24.
The price of a fingerprint sensor for smartcardsSensors likely too expensive to reach significant volumes today
The next data point needed for a simple estimation of the market size for biometric smartcards is the price of a sensor. There is sufficient data on the price of the commoditised capacitive sensors used in smartphones today, but the price for the ones to be used in smartcards is a bit more unclear. There are different prices being quoted from various sources, and while some give estimates of the price of the very card, others are for sensors only.
Marketing material commissioned by Fingerprint Cards 14

Fingerprint Cards19 February 2019
CAPACITIVE FINGERPRINT SENSORS IN SMARTPHONES
0%
10%
20%
30%
40%
50%
60%
70%
$0.00
$0.50
$1.00
$1.50
$2.00
$2.50
$3.00
2015 2016 2017 2018 2019E
US
D
ASP Attachment rate
Source: Nordea estimates
CAPACITIVE FINGERPRINT SENSORS IN SMARTCARDS
0%
1%
2%
3%
4%
5%
6%
7%
$0.00
$1.00
$2.00
$3.00
$4.00
$5.00
$6.00
$7.00
2019E 2020E 2021E 2022E 2023E
US
D
ASP Attachment rate
Source: Nordea estimates
The sensors cost more than the cards
In an interview with the chairman of the board of biometric smartcard producer Zwipe and previous Fingerprint's CEO Jörgen Lantto in January 2019, said that he believed the price of such a card will be USD 5-10. In the same interview, he also forecast that the number of biometric smartcards in the market will reach half a billion three to four years from now. ABI Research estimates, in a 2018 report, that the price today is somewhere in the range of USD 13-19, while sensor manufacturer IDEX claims it is above USD 20. Most sources put the price of a regular chip card at less than USD 1 and a contactless one at roughly USD 2. ABI Research means that the manufacturers needs to aim for the USD 5 per card mark in order to reach any significant volumes.
In a 2017 capital markets day presentation, IDEX said that it expected the ASP for its sensor to end up in the range of USD 3-5 to gain volumes in the business. In the company's earnings call in Q3 2018, when asked if this range was still relevant, the company's response that the price would be higher than that.
In NEXT Biometrics' market predictions from 2017, the ASP for a biometric smartcard sensor seems to lie around USD 4. It also stated that the sensor and the inlay of the card will cost around USD 8-10. The company also believes that the total card cost has to move below USD 10 for banks to start ramping up volumes. In a January 2019 business update, the company stated that cards should cost around USD 4-5 for the market to start gaining volumes, which it predicted would happen in 2021-23. However, the company also stated a range of USD 5-7 for the same time period in the presentation.
Based on the information above, we revise our ASPs for the sensors and modules for the next few years, increasing them for the initial launch years. Our estimate for the ASP is now around USD 4.5 for 2020E, when we believe volumes will start to ramp up. We expect an annual price erosion of around 30% over our forecast period, similar to what was seen in the smartphone market. This is also a key reason for volumes ramping up.
Fingerprint's market shareFingerprints seemingly on the frontier of development
There are two main competitors in producing fingerprint sensors for smartcards – IDEX and Next biometrics, both listed on the Oslo Stock Exchange. While both of these companies have indicated that smartcards are their future focus market, Fingerprint has been clearly dominant in global market trials. This lead might, however, be at threat, with IDEX now testing cards in collaboration with an unnamed Asian bank.
We believe that the competition will put pressure on ASP as well as increase the competition among card issuers in their collaborations with biometric companies to produce cards as advanced as their peers. Our view is that Fingerprint is in a good position to get a large market share initially, and we believe the three producers will be able to maintain a major part of the market together for at least a number of years.
The payment card industry is centred in Europe
While there are emerging competitors in China and other parts of Asia, we believe the Europe-centric card-manufacturing market and the extensive certification processes of payment cards will be barriers of entry. This will create a more sustainable market share outlook for Fingerprint compared with the decline in the smartphone business. According to Fingerprint, 80% of payment card production today takes place in Europe.
Marketing material commissioned by Fingerprint Cards 15

Fingerprint Cards19 February 2019
GLOBAL BIOMETRIC SMARTCARD SHIPMENTS
0
50
100
150
200
250
300
350
400
2019E 2020E 2021E 2022E 2023E 2024E
Other Fingerprint
Source: Nordea estimates
Our market share estimates are set at 40% for the initial volume years, and then down to 32% when competition ramps up in 2024E.
Marketing material commissioned by Fingerprint Cards 16

Fingerprint Cards19 February 2019
Factors to consider when investing in Fingerprint CardsFingerprint Cards has a chequered past, to say the least. Its journey as a listed company was rather uneventful at the outset – it experienced slow adoption of capacitive fingerprint sensors only because its technology was ahead of its time. When the technology started gaining momentum, Fingerprint enjoyed a head start and growth was immense, providing its shareholders significant returns. However, competition finally caught up, and the company’s decline came equally fast. The company now faces great challenges, but is not down for the count just yet. With the introduction of new biometric modalities (eg in-display fingerprint sensors and iris recognition) and growth in emerging segments, we see the possibility of a new dawn for Fingerprint Cards. In combination with more streamlined operations, the business could once again return to earnings growth and close the current margin gap to its peers. However, expanding from one to three or more industrial segments, and from essentially one product line to four, is a balancing act when cash is scarce – it carries high risk and potentially high rewards.
There are four main factors toconsider
We consider the following factors critical when evaluating an investment in Fingerprint Cards:
• Its potential to become a next-generation technology leader,
• Adjacent biometric market opportunities and an increased attachment rate for new applications that increase earnings diversification,
• Streamlined operations and a new product offering set to improve margins, and
• Its potential as a takeover target.
The most important risks aremainly related to futurerevenue streams
The main risks to consider are the following:
• Fingerprint's competitive position could be threatened by new smartphone biometric sensor standards,
• Uncertainty regarding the future size and growth of new market opportunities within smartcards, automotive and embedded solutions,
• Challenging market conditions with immense competition, declining volumes and pressure on price,
• The potential need to turn to capital markets in the future due to the pressure on the company’s financial position, and
• High concentration of existing and potential customers, with the ten largest customers accounting for 98.8% of revenues.
The future is multimodalityWe believe that in-display fingerprint sensors will become the future norm in smartphones
Following the success of fingerprint sensors in smartphones, in-display fingerprint sensors and touchless biometric modalities have become attractive to customers and manufacturers in the smartphone market. We have seen an increasing number of phones with multimodal biometric sensors, such as fingerprint sensors combined with face or iris recognition. The 2018 Google Pixel 3 launch was criticised for not featuring face recognition on top of its fingerprint sensor. One likely reason for Google's exclusion of touchless modalities is its willingness to keep screen bezel size down, another is that some reviews claim the non-Apple face recognition technology is unsatisfactory from convenience and security perspectives – a view that is adhered to by Fingerprint's CEO. Apple's FaceID solution is a major R&D investment and the competition has not yet
Marketing material commissioned by Fingerprint Cards 17

Fingerprint Cards19 February 2019
caught up, but this is just a matter of time. Advanced face recognition technology also requires that components are not obscured by display pixels, thus increasing the bezel or notch size requirements in the phones. We thus believe that in-display as a standalone sensor will be the norm in high-end smartphones until touchless sensors are good enough to be offered as a multimodality outside of Apple iPhones – which is likely to happen in 2019.
Technology leadership position still up for grabs
This spring, we witnessed the launch of a handful of devices sporting huge displays with fingerprint sensors built into the actual screen of the device. Despite receiving praise for the design, the sensors are reportedly slow, and there is room for improvement by moving from “hot zone” detection, where only a very small part of the display is able to detect the fingerprint, to full-display detection.
GLOBAL SMARTPHONE SHIPMENTS
0
200
400
600
800
1,000
1,200
1,400
1,600
mill
ion
un
its
Source: IDC, Credit Suisse and Nordea estimates
FINGEPRINT SENSOR ATTACHMENT RATE
0%10%20%30%40%50%60%70%80%90%
100%
Source: Nordea estimates
Opportunity for Fingerprint to take a leadership position in in-display sensors for next generation high-end smartphones
So far, Fingerprint and Egistec are the only biometric sensor companies to announce the development of full-display sensors, although we believe other competitors are working on similar solutions. Egistec's full-display sensor is based on optical detection while Fingerprint's uses ultrasound technology to create a fast and reliable sensor that can detect a fingerprint anywhere on the display. Qualcomm has a finished and ready-to-ship in-display ultrasound sensor, but it is hot-zone-based and has not gained traction in the consumer market yet. Fingerprint, assuming its product is released ahead of the competition, could enjoy first-mover advantage in full-display sensors and once again grab a large share of the high-end smartphone market for biometric sensors. However, the issue is R&D capability: Fingerprint is a smaller company than most of its competitors. Considering the recent cost and personnel reductions, as well as its diversified R&D focus, we are not surprised that Fingerprint did not release the sensor in H2 2018. The risk of bringing the sensor to market too late, or that the product will simply be too expensive, cannot be ignored. As of today, the launch date for the ultrasound in-display fingerprint sensor has not been announced and the company will instead offer an optical solution starting in 2019. According to the company, the solution is almost finished, being demoed for customers at the moment and the next step is basically a design win for the product.
Marketing material commissioned by Fingerprint Cards 18

Fingerprint Cards19 February 2019
GLOBAL IN-DISPLAY SENSOR SHIPMENTS EXCLUDING APPLE
0%
50%
100%
150%
200%
250%
300%
350%
400%
450%
500%
0
50
100
150
200
250
300
350
400
2018 2019E 2020E 2021E 2022E 2023E 2024E
mill
ion
un
its
Shipments y/y growth
Source: Nordea estimates
The opportunities of future product marketsCapacitive sensors likely to bearound for the foreseeablefuture
Capacitive fingerprint sensors in smartphones have become commonplace, but they are likely to be replaced by ultrasound and optical solutions in the coming years. This is because ultrasound and optical detection, contrary to capacitive sensors, work through smartphone displays. However, capacitive sensors are still easy to implement, cheap to produce and offer high degrees of security and convenience. Despite the heavy competition, Fingerprint is still a market leader in this area and one of roughly four companies to make it through the heavy competition in the latest years; as such, when the company ventures into new markets, it brings considerable experience to the table.
New segments like smartcardscould add earningsdiversification
According to the company, smartcards are the single-largest future opportunity for Fingerprints. With more than three billion payment cards shipped annually around the world, the addressable market is huge. Using its newly launched T-shape module and sensor series, the company has already started testing sensor-equipped cards. It is one of only a few players openly planning to enter the maturing market with an actual product. Combined with the increasing implementation of fingerprint sensors in other segments (home security, automotive and the Internet of Things), this should diversify Fingerprint’s offering and make the company less vulnerable to volatility in smartphone volumes. The Q3 standard approval of the FPC1021AP sensor for automotive implementation came with the statement that the product is ready for mass-market production in 2019. This gives us a positive view that this segment, while small, is set to grow.
GLOBAL BIOMETRIC SMARTCARD SHIPMENTS
0.0%
2.0%
4.0%
6.0%
8.0%
10.0%
12.0%
0
50
100
150
200
250
300
350
400
2019E 2020E 2021E 2022E 2023E 2024E
Shipments Attachment rate
Source: Nordea estimates
Marketing material commissioned by Fingerprint Cards 19

Fingerprint Cards19 February 2019
Returning to cost leadershipCost reduction programme todrive opex below SEK 400mbefore capitalisation of R&D
To ensure future competitiveness and a return to earnings growth, Fingerprint has implemented a number of measures to improve its margins. The company has already finished one cost-cutting programme and has started rolling out another one, from which it should reap benefits during the latter part of this year. The latest programme aims to adapt to the ongoing challenging market conditions for capacitive sensors and is expected to reduce headcount by an additional 150 employees. The target is still set at total annual operational expenses before capitalisation of R&D below SEK 400m, which was the level back in 2015. We believe this is feasible in 2019E.
Product innovation shouldadapt to demand for smallerand cheaper sensors
The Q2 announcement of the FPC1511 sensor, which the company claims to be its most cost-efficient sensor so far, is yet another driver to adapt to the latest shift in demand favouring smaller and cheaper fingerprint sensors. While the pricing of the sensor is not public, it is said to be the most cost-optimised sensor released by Fingerprint so far. If the new cost-cutting programme is executed properly and the FPC1511 gains order momentum in early 2019, we believe the company should be able to close the margin gap to its peers and defend its leading position in the market for capacitive fingerprint sensors.
Challenging market could trigger industry consolidationBroken industry, not a broken company
With sensor prices in freefall, plummeting 30% annually in the last years, the capacitive sensor is being commoditised at a more rapid pace than likely anyone could have foreseen. On top of this, new industry standards are starting to emerge, creating the need for additional investments in R&D at the worst possible time. Industry experts such as ABI still rank Fingerprint as the market leader in a competitive assessment based on innovation and implementation, so its product and patent portfolio still holds value. Its experience in capacitive sensors should also offer first-mover advantages in new verticals and product categories.
Inevitable margin scenario is playing out
The flipside of the brutal price erosion seen in the past few quarters would be that it amplifies the normalisation of a more realistic margin scenario than seen in 2016. Maintaining an EBIT margin of almost 40% for a commodity product is unrealistic in the long term. However, the rapid margin decline likely increases the probability that we are nearing a point where price pressure will start to subside.
The current market situation is tough, which could incite consolidation
With the market leader on the ropes, smaller competitors are also likely to struggle, which could start a wave of consolidation. Against that backdrop, we do not rule out that Fingerprint itself could be a target for companies such as Qualcomm/NXP, ST Electronics, Samsung, etc. Benchmarking its margins against its peers, we see scope for margin normalisation due to the recent underperformance, although margins likely will not return to previous highs. This has also been acknowledged by Fingerprint’s management along with the announced plans to streamline the organisation. A new owner could likely fast-track this development, although it would eventually require consent from the chairman of the board, Johan Carlström, who is also the largest owner.
Marketing material commissioned by Fingerprint Cards 20

Fingerprint Cards19 February 2019
Risk factorsBelow, we list the key risk factors for Fingerprint Cards. The purpose of this is not to provide a comprehensive picture of all risks that the company may face, but instead to highlight those that we find most relevant. The main risks we see relate to new industry standards, development speed, uncertainty of the potential in new market segments and the current financial position.
Technology risk and new industry standardsThe biometric sensor market isgoing through a paradigm shift
While fingerprint sensors are now used in above 60 % of all smartphones produced, the capacitive fingerprint sensor technology used by Fingerprint has been commoditised and the ASP has plummeted. The industry is also increasingly moving towards new standards, such as touchless recognition or in-display fingerprint sensors, and while Fingerprint has new technologies under development, the company has yet to implement them in a finished product. If Fingerprint does not meet its planned product roadmap, it risks losing market shares to competitors, such as Goodix and Synaptics, which have already successfully implemented and adapted versions of the new technology. Recent statements from the CEO as well as remarks made during the Q2 report indicate that Fingerprint has discontinued, or at least shifted focus from, its development of a 3D face recognition technology. The Q2 report also contained substantial writedowns in capitalised R&D, from one long-term and one more recent product development. While the company does not state it explicitly, we suggest that one of these probably refers to face recognition technology. While this might have been a necessary move to complete the cost-cutting programme, it also puts the company at risk of missing the target market if face recognition becomes the norm in future smartphones. That said, we suggest that this risk is lowered by the Q4 announcement that the company is working on improving its iris solution by adding 2D face recognition.
Customer concentrationA few major OEMs account for the majority of Fingerprint'saddressable markets, leadingto volatility in revenuesand development costs
In 2017, 98.8% of Fingerprint’s revenue stemmed from its ten largest customers, and three out of the five largest smartphone manufacturers are Fingerprint’s customers. This is primarily because almost all of the company’s large OEM customers are in the highly concentrated smartphone market. If Fingerprint fails to compete on product offerings and prices for now and for future generations of sensors, it could lose customers to its competitors, and revenue is likely to take a considerable beating with every lost customer. The company recently reached its target to achieve 10% of revenues from segments other than smartphones. This alleviates the risks in the company, and we suggest that risks will diminish even further as the company improves its customer mix.
Development speedSome of Fingerprint’scompetitors have a moreconvincing history ofinnovation
The technology used for in-display fingerprint detection is not based on the same technology (capacitance-based fingerprint detection) that launched Fingerprint in the first place. The company does not have a legacy of revolutionising innovations in other areas. The development of in-display sensors presented during the November 2017 Technology Update promises cutting-edge technology in terms of ultrasound fingerprint detection and 3D face recognition. The first would, if presented soon, provide a sensor more advanced than anything currently found in the consumer market, but its development has been delayed. While Fingerprint spends a significant amount on R&D and has a large number of PhDs in its development force, the company is up against competitors with superior R&D muscle. The cost cuts and upcoming reductions in personnel could also slow the ongoing innovation process down and hamper the progress of future innovations. The risk is therefore that Fingerprint's end products will not be competitive enough to maintain the company’s market share in high-end smartphones.
Since we expect a large portion of future revenues to come from smartcards, this risk is becoming less relevant. This is because the players that are openly competing with Fingerprint on that front are smaller companies with less R&D power and experience in the biometric mass markets. Fingerprint is likely going to be the technology leader in biometric smartcards when and if that market opens up and starts gaining volumes.
Marketing material commissioned by Fingerprint Cards 21
Fingerprint Cards19 February 2019
Size and growth of biometric sensor marketThere is no consensus onhow big the future biometricmarkets will become
In an interview with, the newly elected chairman of the board, Johan Carlström, in 2018 claimed that Fingerprint Cards is the market leader in fingerprint detection and that smartcards and IoT will be a new, important market for the company’s detectors. While the current technology that Fingerprint offers would likely be well suited for many products, and the T-shape module for smartcard fingerprint sensors is promising, there is no guarantee that the company will enjoy a strong, long-lasting first-mover advantage in these markets. As these are new markets, price discovery is still ongoing, and the initial ASPs and the rate of future price decreases are still uncertain. The addressable market size is based on sensitive assumptions relating to the attachment rate, and these ultimately depend on the payment industry’s dynamics and the strategic choices of the major card producers.
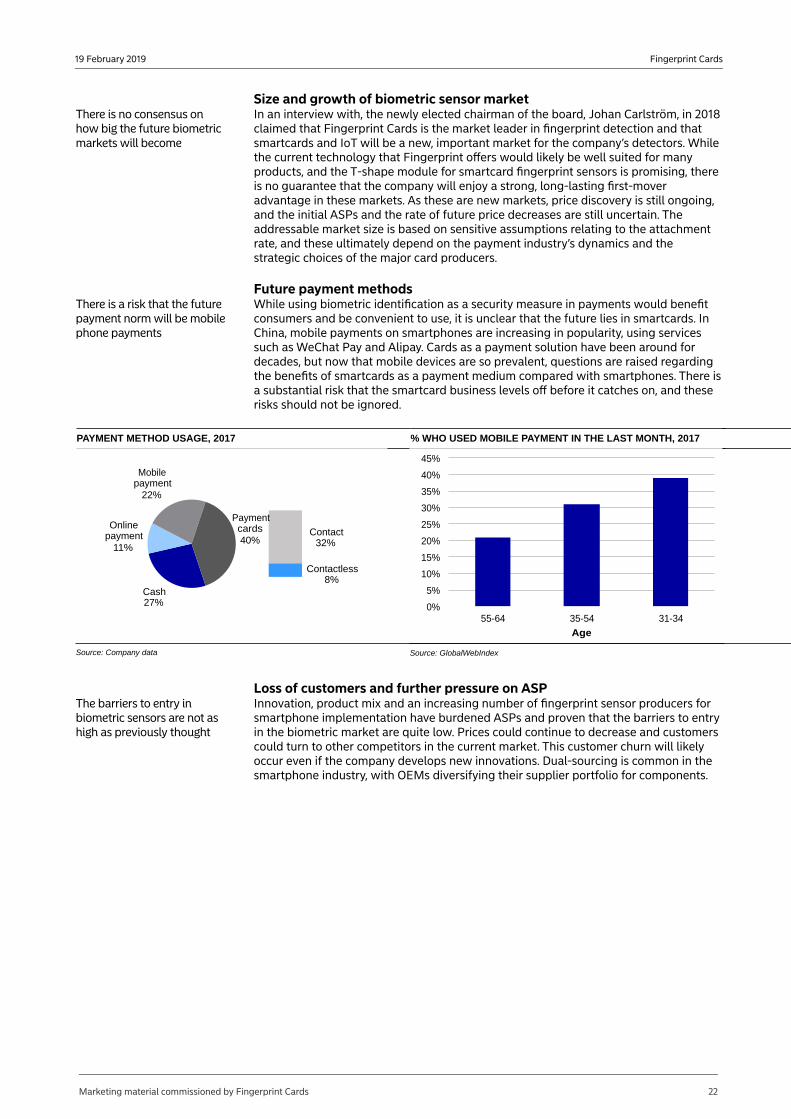
Future payment methodsThere is a risk that the futurepayment norm will be mobilephone payments
While using biometric identification as a security measure in payments would benefit consumers and be convenient to use, it is unclear that the future lies in smartcards. In China, mobile payments on smartphones are increasing in popularity, using services such as WeChat Pay and Alipay. Cards as a payment solution have been around for decades, but now that mobile devices are so prevalent, questions are raised regarding the benefits of smartcards as a payment medium compared with smartphones. There is a substantial risk that the smartcard business levels off before it catches on, and these risks should not be ignored.
PAYMENT METHOD USAGE, 2017
Cash27%
Online payment
11%
Mobile payment
22%
Contact32%
Contactless8%
Payment cards40%
Source: Company data
% WHO USED MOBILE PAYMENT IN THE LAST MONTH, 2017
0%
5%
10%
15%
20%
25%
30%
35%
40%
45%
55-64 35-54 31-34
Age
Source: GlobalWebIndex
Loss of customers and further pressure on ASPThe barriers to entry inbiometric sensors are not ashigh as previously thought
Innovation, product mix and an increasing number of fingerprint sensor producers for smartphone implementation have burdened ASPs and proven that the barriers to entry in the biometric market are quite low. Prices could continue to decrease and customers could turn to other competitors in the current market. This customer churn will likely occur even if the company develops new innovations. Dual-sourcing is common in the smartphone industry, with OEMs diversifying their supplier portfolio for components.
Marketing material commissioned by Fingerprint Cards 22

Fingerprint Cards19 February 2019
Reported numbers and forecastsINCOME STATEMENT
2021E2020E2019E20182017201620152014201320122011SEKm1,9171,7991,4581,5352,9666,6382,901234951069Net revenue6.5%23.4%-5.0%-48.2%-55.3%128.9%n.m.144.9%828.4%-85.0%12.6%Revenue growthn.a.n.a.n.a.n.a.n.a.n.a.n.a.n.a.n.a.n.a.n.a.of which organicn.a.n.a.n.a.n.a.n.a.n.a.n.a.n.a.n.a.n.a.n.a.of which FX324274129-7562342,662939-72-21-288EBITDA-16-16-16-16-14-8-60-2-1-1Depreciation and impairments PPE
308258113-7722212,654933-72-23-297EBITA-80-80-800-66-41-17-74-11-9-4Amortisation and impairments
22817833-7721552,613916-145-34-393EBIT00000000000of which associates00000000000Associates excluded from EBIT00-15-25-133502111Net financials00000000000Changes in value, net
22817818-7971422,648915-144-33-383Pre-tax profit-50-39-4166-22-579-112-1000Reported taxes
17813914-6311202,069804-144-33-383Net profit from continued operations00000000000Discontinued operations00000000000Minority interests
17813914-6311202,069804-144-33-383Net profit to equity0.570.440.04-2.010.386.6112.50-2.32-0.59-0.830.08EPS0.000.000.000.000.000.000.000.000.000.000.00DPS0.000.000.000.000.000.000.000.000.000.000.00of which ordinary0.000.000.000.000.000.000.000.000.000.000.00of which extraordinary
Profit margin in percent16.9%15.2%8.8%-49.2%7.9%40.1%32.4%-30.7%-22.1%-271.4%11.1%EBITDA16.1%14.4%7.7%-50.3%7.4%40.0%32.1%-30.7%-24.2%-284.4%9.8%EBITA11.9%9.9%2.3%-50.3%5.2%39.4%31.6%-62.2%-35.3%-376.6%3.9%EBIT
Adjusted earnings324274129-7562342,662939-72-21-288EBITDA (adj)308258113-7722212,654933-72-23-297EBITA (adj)22817833-7721552,613916-145-34-393EBIT (adj)0.570.440.04-2.010.386.6112.50-2.32-0.59-0.830.08EPS (adj)
Adjusted profit margins in percent16.9%15.2%8.8%-49.2%7.9%40.1%32.4%-30.7%-22.1%-271.4%11.1%EBITDA (adj)16.1%14.4%7.7%-50.3%7.4%40.0%32.1%-30.7%-24.2%-284.4%9.8%EBITA (adj)11.9%9.9%2.3%-50.3%5.2%39.4%31.6%-62.2%-35.3%-376.6%3.9%EBIT (adj)
Performance metricsCAGR last 5 years
-22.0%-9.1%44.2%74.3%210.5%149.5%116.5%43.4%28.3%-13.1%44.0%Net revenue-34.4%-21.8%n.m.n.m.n.m.222.4%159.4%n.m.n.m.n.m.n.m.EBITDA-38.6%-27.9%n.m.n.m.n.m.295.5%256.0%n.m.n.m.n.m.n.m.EBIT-38.8%-48.7%n.m.n.m.n.m.143.9%204.7%n.m.n.m.n.m.n.m.EPS
n.m.n.m.n.m.n.m.n.m.n.m.n.m.n.m.n.m.n.m.n.m.DPSAverage last 5 years
-1.8%15.3%19.0%19.4%27.3%33.5%21.2%-45.5%-33.9%-40.4%-36.9%Average EBIT margin2.1%17.7%20.7%21.1%29.2%35.2%24.9%-22.4%-17.5%-23.1%-24.2%Average EBITDA margin
VALUATION RATIOS - ADJUSTED EARNINGS
2021E2020E2019E20182017201620152014201320122011SEKm31.440.2n.m.n.m.41.39.59.5n.m.n.m.n.m.24.3P/E (adj)14.017.438.3n.m.19.27.0n.m.1.410.02.2n.m.EV/EBITDA (adj)14.818.443.7n.m.20.47.0n.m.1.49.22.1n.m.EV/EBITA (adj)19.926.7150.2n.m.29.27.1n.m.0.76.31.6n.m.EV/EBIT (adj)
VALUATION RATIOS - REPORTED EARNINGS
2021E2020E2019E20182017201620152014201320122011SEKm31.440.2n.m.n.m.41.39.59.5n.m.n.m.n.m.24.3P/E2.372.653.391.721.522.79-0.36-0.44-2.22-5.90-0.34EV/Sales14.017.438.3n.m.19.27.0n.m.1.410.02.2n.m.EV/EBITDA14.818.443.7n.m.20.47.0n.m.1.49.22.1n.m.EV/EBITA19.926.7150.2n.m.29.27.1n.m.0.76.31.6n.m.EV/EBIT
0.0%0.0%0.0%0.0%0.0%0.0%0.0%0.0%0.0%0.0%0.0%Dividend yield (ord.)3.8%3.1%2.0%3.5%3.5%5.4%n.m.n.m.n.m.n.m.n.m.FCF yield0.0%0.0%0.0%0.0%0.0%0.0%0.0%0.0%0.0%0.0%0.0%Payout ratio
Source: Company data and Nordea estimates
Marketing material commissioned by Fingerprint Cards 23

Fingerprint Cards19 February 2019
BALANCE SHEET
2021E2020E2019E20182017201620152014201320122011SEKm9831,0231,0631,1031,188715070542928Intangible assets
00000000000of which R&D9831,0231,0631,1031,188715070542928of which other intangibles
00000000000of which goodwill3030303035292119554Tangible assets00000000000Shares associates00000000000Interest bearing assets00000000000Deferred tax assets00000000000Other non-IB non-current assets00028001n.a.001Other non-current assets
1,0131,0531,0931,1611,2231017189603433Total non-current assets3833603063486466731539920114Inventory2912732212334381,13261811631653Accounts receivable
474436383134353720833Other current assets1,0388276525419201,1621,0311022126123Cash and bank1,7591,5041,2151,1592,3173,4021,8393362718183Total current assets
n.a.n.a.n.a.n.a.n.a.n.a.n.a.0000Assets held for sale2,7722,5562,3082,3193,5403,5031,910425330115117Total assets
2,1071,9281,7891,7762,3312,2261,147301288102106Shareholders equity00000000000Of which preferred stocks00000000000Of which equity part of hybrid debt00000000000Minority interest
2,1071,9281,7891,7762,3312,2261,147301288102106Total Equity5252525219013600000Deferred tax0000222000000Long term interest bearing debt00000000000Pension provisions00000000001Other long-term provisions00000000010Other long-term liabilities00000000000Convertible debt00000000000Shareholder debt00000000000Hybrid debt
5252525241213600011Total non-current liabilities1111190258101221500Short-term provisions
320300243256268822549662653Accounts payable2932752222341086111436286Other current liabilities
0000243000000Short term interest bearing debt6145764674928091,14176312342139Total current liabilities
00000000000Liabilities for assets held for sale2,7722,5562,3082,3193,5523,5031,910425330115117Total liabilities and equity
Balance sheet and debt metrics-1,038-827-652-541-455-1,162-1,031-102-212-61-23Net debt
109102971281,0211,35814513232851Working capital1,1221,1551,1901,2882,2441,458217221914284Invested capital2,1591,9801,8411,8282,7312,3621,147301288103107Capital employed8.8%7.5%0.8%-30.7%5.3%n.m.n.m.-49.0%-16.7%-36.7%3.6%ROE
20.1%11.9%2.1%-34.1%6.5%n.m.n.m.-72.6%-39.4%-47.8%3.2%ROIC10.6%9.0%1.8%-42.2%5.7%n.m.79.8%-48.2%-11.7%-37.7%2.5%ROCE
-3.2-3.0-5.10.7-1.9-0.4-1.11.410.02.2-3.0Net debt/EBITDAn.m.n.m.n.m.n.m.n.m.n.m.n.m.n.m.n.m.n.m.n.m.Interest coverage
76.0%75.4%77.5%76.6%65.6%63.5%60.0%70.9%87.0%88.4%91.0%Equity ratio-49.3%-42.9%-36.4%-30.4%-19.5%-52.2%-89.9%-33.8%-73.7%-59.5%-21.6%Net gearing
Source: Company data and Nordea estimates
Marketing material commissioned by Fingerprint Cards 24

Fingerprint Cards19 February 2019
CASH FLOW STATEMENT
2021E2020E2019E20182017201620152014201320122011SEKm324274129-7562342,662939-72-21-288EBITDA (adj) for associates-50-39-4232-345-498-20000Paid taxes
00-15-250000111Net financials000-189-6815780615-11Change in provisions0028-2801-1002-1Change in other LT non-IB00000000000Cash flow to/from associates00000000000Dividends paid to minorities000796112-192-64-20-15-21Other adj to reconcile to cash flow
27423513830-682,130951-86-20-299Funds from operations (FFO)-7-530244444-1,000-43-88-1143-31Change in NWC
2682301682753771,130908-174-3114-21Cash flow from operations (CFO)-56-56-56-163-204-63-17-76-38-12-11Capital expenditure
2121741121121731,067891-250-692-32Free cash flow before A&D00000000000Proceeds from sale of assets0000000-15000Acquisitions
2121741121121731,067891-265-692-32Free cash flow
00000000000Dividends paid00000-1,000481552213425Equity issues / buybacks000-5080000010Net change in debt00-10000001-2Other financing adjustments00016-41564-90001Other non-cash adjustments
212174112-380-242131929-11015138-8Change in cash
Cash flow metricsn.m.58.3%58.3%n.m.n.m.n.m.74.5%n.m.n.m.n.m.n.m.Capex/D&A
-2.9%-3.1%-3.8%-10.6%-6.9%-0.9%-0.6%-32.3%-40.2%n.m.-15.6%Capex/Sales
Key information18181810166311871122Share price year end (/current)
5,5895,5895,5893,1794,96419,67800000Market cap.4,5504,7624,9362,6394,50918,516-1,031-102-212-61-23Enterprise value314.0314.0314.0314.0314.0313.10.00.00.00.00.0Diluted no. of shares, year-end (m)
Source: Company data and Nordea estimates
Marketing material commissioned by Fingerprint Cards 25

Fingerprint Cards19 February 2019
Disclaimer and legal disclosuresOrigin of the reportThis publication or report originates from: Nordea Bank Abp, including its branches Nordea Danmark, Filial af Nordea Bank Abp, Finland, Nordea Bank Abp, filial i Norge and Nordea Bank Abp, filial i Sverige (together "Nordea") acting through their unit Nordea Markets.
Nordea Bank Abp is supervised by the European Central Bank and the Finnish Financial Supervisory Authority and the branches are supervised by the European Central Bank and the Finnish Financial Supervisory Authority and the Financial Supervisory Authorities in their respective countries.
Content of reportThis report has been prepared solely by Nordea Markets.
Opinions or suggestions from Nordea Markets credit and equity research may deviate from one another or from opinions presented by other departments in Nordea. This may typically be the result of differing time horizons, methodologies, contexts or other factors.
The information provided herein is not intended to constitute and does not constitute investment advice nor is the information intended as an offer or solicitation for the purchase or sale of any financial instrument. The information contained herein has no regard to the specific investment objectives, the financial situation or particular needs of any particular recipient. Relevant and specific professional advice should always be obtained before making any investment or credit decision
Opinions or ratings are based on one or more methods of valuation, for instance cash flow analysis, use of multiples, behavioural technical analyses of underlying market movements in combination with considerations of the market situation and the time horizon. Key assumptions of forecasts or ratings in research cited or reproduced appear in the research material from the named sources. The date of publication appears from the research material cited or reproduced. Opinions and estimates may be updated in subsequent versions of the report, provided that the relevant company/issuer is treated anew in such later versions of the report.
Validity of the reportAll opinions and estimates in this report are, regardless of source, given in good faith, and may only be valid as of the stated date of this report and are subject to changewithout notice.
No individual investment or tax adviceThe report is intended only to provide general and preliminary information to investors and shall not be construed as the basis for any investment decision. This report has been prepared by Nordea Markets as general information for private use of investors to whom the report has been distributed, but it is not intended as a personal recommendation of particular financial instruments or strategies and thus it does not provide individually tailored investment advice, and does not take into account the individual investor's particular financial situation, existing holdings or liabilities, investment knowledge and experience, investment objective and horizon or risk profile and preferences. The investor must particularly ensure the suitability of an investment as regards his/her financial and fiscal situation and investment objectives. The investor bears the risk of losses in connection with an investment.
Before acting on any information in this report, it is recommendable to consult (without being limited to) one's financial, legal, tax, accounting, or regulatory advisor in any relevant jurisdiction.
The information contained in this report does not constitute advice on the tax consequences of making any particular investment decision. Each investor shall make his/her own appraisal of the tax and other financial merits of his/her investment.
SourcesThis report may be based on or contain information, such as opinions, estimates and valuations which emanate from: Nordea Markets' analysts or representatives, publicly available information, information from other units of Nordea, or other named sources.
To the extent this publication or report is based on or contain information emanating from other sources ("Other Sources") than Nordea Markets ("External Information"), Nordea Markets has deemed the Other Sources to be reliable but neither Nordea, others associated or affiliated with Nordea nor any other person, do guarantee the accuracy, adequacy or completeness of the External Information.
Limitation of liabilityNordea or other associated and affiliated companies assume no liability as regards to any investment, divestment or retention decision taken by the investor on the basis of this report. In no event will Nordea or other associated and affiliated companies be liable for direct, indirect or incidental, special or consequential damages (regardless ofwhether being considered as foreseeable or not) resulting from the information in this report.
Risk informationThe risk of investing in certain financial instruments, including those mentioned in this report , is generally high, as their market value is exposed to a lot of different factors such as the operational and financial conditions of the relevant company, growth prospects, change in interest rates, the economic and political environment, foreign exchange rates, shifts in market sentiments etc. Where an investment or security is denominated in a different currency to the investor's currency of reference, changes in rates of exchange may have an adverse effect on the value, price or income of or from that investment to the investor. Past performance is not a guide to future performance. Estimates of future performance are based on assumptions that may not be realized. When investing in individual shares, the investor may lose all or part of the investments.
Conflicts of interestReaders of this document should note that Nordea Markets has received remuneration from the company mentioned in this document for the production of the report. The remuneration is not dependent on the content of the report.
Nordea, affiliates or staff in Nordea, may perform services for, solicit business from, hold long or short positions in, or otherwise be interested in the investments (including derivatives) of any company mentioned in the report.
To limit possible conflicts of interest and counter the abuse of inside knowledge, the analysts of Nordea Markets are subject to internal rules on sound ethical conduct, the management of inside information, handling of unpublished research material, contact with other units of Nordea and personal account dealing. The internal rules have been prepared in accordance with applicable legislation and relevant industry standards. The object of the internal rules is for example to ensure that no analyst will abuse or cause others to abuse confidential information. It is the policy of Nordea Markets that no link exists between revenues from capital markets activities and individual analyst remuneration. Nordea and the branches are members of national stockbrokers' associations in each of the countries in which Nordea has head offices. Internal rules have been developed in accordance with recommendations issued by the stockbrokers associations. This material has been prepared following the Nordea Conflict of Interest Policy, which may be viewed at www.nordea.com/mifid.
Distribution restrictionsThe securities referred to in this report may not be eligible for sale in some jurisdictions. This report is not intended for, and must not be distributed to private customers in the UK or the US. This research report is intended only for, and may be distributed only to, accredited investors, expert investors or institutional investors in Singapore who maycontact Nordea Bank, Singapore Branch of 138 Market Street, #09-01 CapitaGreen, Singapore 048946.
This report may be distributed by Nordea Bank Luxembourg S.A., 562 rue de Neudorf, L-2015 Luxembourg which is subject to the supervision of the Commission de Surveillance du Secteur Financier.
This publication or report may be distributed by Nordea Bank Abp Singapore Branch, which is subject to the supervision of the European Central Bank, the Finnish Financial Supervisory Authority and the Monetary Authority of Singapore.
This publication or report may be distributed in the UK to institutional investors by Nordea Bank Abp London Branch of 6th Floor, 5 Aldermanbury Square, London, EC2V 7AZ, which is under supervision of the European Central Bank, Finanssivalvonta (Financial Supervisory Authority) in Finland and subject to limited regulation by the Financial Conduct Authority and Prudential Regulation Authority in the United Kingdom. Details about the extent of our regulation by the Financial Conduct Authority and Prudential Regulation Authority are available from us on request.
This report may not be mechanically duplicated, photocopied or otherwise reproduced, in full or in part, under applicable copyright laws.
Marketing material commissioned by Fingerprint Cards 26

Fingerprint Cards19 February 2019
Analyst Shareholding
Nordea Markets analysts do not hold shares in the companies that they cover.No holdings or other affiliations by analysts or associates.
Market-making obligations and other significant financial interestNordea Markets has no market-making obligations in Fingerprint Cards.
Fair value sensitivityWe calculate our fair values by weighting DCF, DDM, SOTP, asset-based and other standard valuation methods. When applicable, we set a 12-month target price by applying an appropriate premium/discount and/or other relevant adjustment to our fair value to reflect the share price potential we see within the coming 12 months. Our fair values are sensitive to changes in valuation assumptions, of which growth, margins, tax rates, working capital ratios, investment-to-sales ratios and cost of capital are typically the most sensitive. It should be noted that our fair values would change by a disproportionate factor if changes are made to any or all valuation assumptions, owing to the non-linear nature of the standard valuation models applied (mentioned above). As a consequence of the standard valuation models we apply, changes of 1-2 percentage points in any single valuation assumption can change the derived fair value by as much as 30% or more. Dividend payouts are included in the target price. All research is produced on an ad hoc basis and will be updated when the circumstances require it.
Investment banking transactionsIn view of Nordea’s position in its markets readers should assume that the bank may currently or may in the coming three months and beyond be providing or seeking to provide confidential investment banking services to the company/companies
Marketing MaterialThis research report should be considered marketing material, as it has been commissioned and paid for by the subject company, and has not been prepared in accordance with the regulations designed to promote the independence of investment research and it is not subject to any legal prohibition on dealing ahead of the dissemination of the report. However, Nordea Markets analysts are according to internal policies not allowed to hold shares in the companies/sectors that they cover.
Where applicable, recommendation changes are available at: https://research.nordea.com/compliance#equity-changes.
Issuer Review
This report has not been reviewed by the Issuer prior to publication.
Completion Date
19 Feb 2019, 09:37 CET
Nordea Bank Abp Nordea Bank Abp, filial i Sverige Nordea Danmark, Filial af Nordea Nordea Bank Abp, filial i NorgeBank Abp, Finland
Nordea Markets Division,Research
Nordea Markets Division,Research
Nordea Markets Division,Research
Nordea Markets Division,Research
Visiting address:Aleksis Kiven katu 7, Helsinki
Visiting address:Smålandsgatan 17
Visiting address:Grønjordsvej 10
Visiting address:Essendropsgate 7
FI-00020 Nordea SE-105 71 Stockholm DK-2300 Copenhagen S N-0107 OsloFinland Sweden Denmark Norway
Tel: +358 9 1651 Tel: +46 8 614 7000 Tel: +45 3333 3333 Tel: +47 2248 5000Fax: +358 9 165 59710 Fax: +46 8 534 911 60 Fax: +45 3333 1520 Fax: +47 2256 8650
Reg.no. 2858394-9Satamaradankatu 5Helsinki
Marketing material commissioned by Fingerprint Cards 27