finding excuses to decline the ask
TRANSCRIPT

Finding Excuses to Decline the Ask
Christine L. Exley and Ragan Petrie ∗
October 26, 2016
Abstract
Individuals frequently exploit “flexibility” built into decision environments to give
less. They use subjectivity to justify options benefiting themselves over others, they
avoid information that may encourage them to give, and they avoid the ask itself. In
this paper, we examine whether a reluctance to give may arise even when such explicit
flexibility is absent. We investigate whether merely alerting individuals to an upcoming
prosocial ask – that is neither avoided nor contains subjective components – results
in reduced prosocial behavior. That is, we investigate whether individuals use time to
quickly find or develop their own flexibility and excuses not to give. Results from a
field study and complementary online study provide a clear answer: yes.
Keywords: charitable giving, prosocial behavior, self-servingly biases, excuses
JEL codes: D64, C93
∗Exley: [email protected], Harvard Business School; Petrie: [email protected], Department of Economics,Texas A&M University; We gratefully acknowledge funding for this project from George Mason University,Harvard Business School, and Stanford University.
1

One need not look far to see evidence of charitable acts.Volunteerism and giving in local
communities are common. Social media campaigns, such as #GivingTuesday, highlight
giving opportunities online. Giving USA recently reported the highest level of (inflation-
adjusted) charitable giving in their 60-year history: $358.38 billion in 2014. Over 70% of
this giving comes from individuals, as opposed to foundations, bequests, or corporations.
While about one-third of donations benefit religious organizations, other popular causes
range from education to the environment and animals (Giving USA Foundation, 2015).
Despite this prevalence of giving, or perhaps in part because of it, there is a clear re-
luctance to give. Individuals walk in a direction away from solicitors (Andreoni, Rao and
Trachtman, 2016; Trachtman et al., 2015), do not answer their door for fundraisers (DellaV-
igna, List and Malmendier, 2012), opt-out of future mail campaign solicitations (Kamdar
et al., 2015), and avoid tasks that earn them money if a donation request is known to fol-
low (Lin, Schaumberg and Reich, 2016).1 Individuals also achieve outcomes that benefit
themselves over others more often by engaging in self-serving evaluations of fairness (Bab-
cock et al., 1995; Konow, 2000), ambiguity (Haisley and Weber, 2010), beliefs about others
(Di Tella et al., 2015; Klinowski, 2015), risk (Exley, 2016a), subjective quality measures
(Gneezy et al., 2016; Exley, 2016c), and competing moral principles (Danilov and Saccardo,
2016; Garbarino, Slonim and Villeval, 2016).2
Gino, Norton and Weber (2016) classify such behavior by noting that “when the context
provides sufficient flexibility to allow plausible justification that one can both act egoistically
while remaining moral, individuals seize on such opportunities to prioritize self-interest at
the expense of morality.” Earlier work highlights this precondition of flexibility to engage
in less desirable or questionable behavior when they refer to mechanisms such as “elastic
justification” (Hsee, 1995, 1996), “causistry” (Norton, Vandello and Darley, 2004), or “moral
wiggle room” (Dana, Weber and Kuang, 2007).3
1Avoidance may also reflect a desire to avoid empathetic triggers (Andreoni, Rao and Trachtman, 2016)or social pressure (DellaVigna, List and Malmendier, 2012), as also supported by additional work (Meer,2011; Andreoni and Rao, 2011; Castillo, Petrie and Wardell, 2014, 2015). Relatedly, individuals desire toavoid others knowing about giving opportunities (Dana, Cain and Dawes, 2006; Broberg, Ellingsen andJohannesson, 2007; Lazear, Malmendier and Weber, 2012).
2Other factors that may be viewed self-servingly may relate to the reliance on chance or others’ decisions(Dana, Weber and Kuang, 2007; Andreoni and Bernheim, 2009; Linardi and McConnell, 2011; Falk andSzech, 2013), the use of donations (Fong and Oberholzer-Gee, 2011; Li et al., 2015; Gneezy, Keenan andGneezy, 2014; Batista, Silverman and Yang, 2015), or performance metrics (Yoruk, 2016; Brown, Meer andWilliams, 2014; Gneezy, Keenan and Gneezy, 2014; Meer, 2014).
3Indeed, decades ago, Snyder et al. (1979) shows that when individuals are choosing between two movietheaters, they only avoid choosing the same movie theater as a person with disabilities if the movies aredifferent – not the same. More recent examples show how individuals use flexibility when delegating decisionsto others (Hamman, Loewenstein and Weber, 2010; Coffman, 2011; Bartling and Fischbacher, 2012), weighingplausible counterfactuals (Shalvi et al., 2011), assessing their own ability (Schwardman and van der Weele,2016), or avoiding “moral tests” (Miller and Monin, 2016).
2

Even in a setting without explicit flexibility, individuals may find and develop their own
excuses not to give. To consider the potential for such underlying behavior, this paper in-
vestigates individuals’ responses to a prosocial ask in a decision context that is not explicitly
flexible. Subjective components that could readily serve as excuses not to give – such as com-
peting norms of fairness, ambiguity, or risk – are not highlighted in our setting. Avoidance
behavior that may emerge when an individual infers an ask is forthcoming (e.g. by avoid-
ing potential solicitors) does not manifest in our setting; the prosocial ask is not avoided.
Our setting thus allows for the examination of a broader phenomenon where a reluctance to
give emerges from merely giving individuals time to think about an impending ask. To test
whether individuals capitalize on such an opportunity by finding or developing their own
excuses not to give, the prosocial ask is either announced in advance and “expected” or a
surprise and “unexpected.”4
Most environments are not conducive to examining the impact of expecting the ask
absent the flexibility to avoid it. Future donation asks are often avoided if they are expected.
Imminent donations asks, such as when individuals receive fundraising mail or are approached
by solicitors, are likely recognized as such and do not allow for unexpected asks.
We therefore embed our field experiment in an online voting contest where the ask is
imminent but not necessarily expected. Upon arriving at the contest webpage, individuals
learn that they must complete a three-step registration process for their vote to count. In the
first step, individuals vote for their favorite animal group and are unlikely to expect an ask.5
In the second step, individuals provide information on how they know their voted-for animal
group and view any messages related to their randomly assigned treatment group. In the
third step, individuals face the ask and decide whether to click-through to the donation page
of their voted-for animal group. Strong treatment effects and attrition of only 1% validate
this design choice. The use of an online voting contest also maintains the benefits of a natural
environment where individuals are not directly informed of, and likely remain unaware of,
the on-going research.6 The six treatments groups – which influence what participants view
during the second step before the ask – arise from two conditions.
Our first condition addresses our central question by varying the expectation of the ask.
When the ask is expected, the second step mentions the upcoming donation ask by saying
4Inherent to examining whether individuals develop their own excuses absent explicit flexibility, we con-sider excuses broadly in this study. For instance, excuses may involve psychologically guarding oneself fromemotional appeals, thinking of reasons not to give such as there being better giving alternatives, or formingbeliefs that do not counter one’s identity or help to limit cognitive dissonance.
5Moreover, the degree to which individuals already expect an ask biases against our treatment effectsthat arise from the manipulation of the expectation of an ask.
6Most individuals have voted in an online contest or poll before (Google Consumer survey, Oct. 2015,n=500) and over a quarter have done so to help others (Google Consumer survey, Oct. 2015, n=500).
3

“Do you love [group name]? Register your vote in the next step, and if you want to, donate
to them!” When the ask is unexpected, the second step instead reads “Do you love [group
name]? Register your vote in the next step!”
Our second condition investigates potential policy interventions that may limit individu-
als’ ease with which to find excuses not to give.7 We compare the effectiveness of providing
no information, unavoidable information and avoidable information on “why to give” in the
second step. In line with industry practice, provided information features an adoption story
about a rescued dog.
Our contest yielded approximately six-thousand participants. When no information is
provided, we find that the mere expectation of the ask causes click-through rates to fall
by 22%. Individuals appear readily able to find their own excuses when given time – in
practice, just a few seconds – to do so.8 A reluctance to give extends beyond settings with
explicitly provided flexibility and hints that being caught on the spot with a request can
increase compliance, perhaps because there is little time to develop excuses.
Results related to policy also emerge. While the negative impact of expecting the ask
persists in the presence of avoidable information, unavoidable information effectively counter-
acts this drop. In addition to validating the common practice of charities bundling donation
requests with unavoidable information on why to give, these results are consistent with in-
dividuals more easily developing excuses when information on why to give can be avoided.
Indeed, in line with the idea that individuals avoid information to maintain “moral wiggle
room” (Dana, Weber and Kuang, 2007; Bartling, Engl and Weber, 2014; Grossman, 2014;
van der Weele, 2014; Grossman and van der Weele, 2016), 22% of participants view informa-
tion they could have avoided when the ask is unexpected but only 17% do so when the ask
is expected. Among those that view information, individuals spend more time considering
it when they know the ask is coming and excuses would likely be needed.9
In our field experiment, we only observe click-through rates to donation pages. To in-
vestigate if the negative impact of the ask persists with donation data, we therefore ran
a complementary online experiment with approximately eight-hundred Amazon Mechani-
cal Turk workers. Corresponding results document a 5% significant decrease in average
7This particular investigation was also instrumental to recruiting our non-profit partners.8Alternatively, expecting the ask may create a negative association with the contest and reduce giving
absent any excuse-related behavior. Several pieces of evidence do not support this possibility. Attritionis rare and does not vary across treatment groups. If expecting the ask sours the experience, individualsnonetheless cast their vote, and moreover, viewing habits suggest that they avoid information and take timeto find excuses when they expect the ask. Expecting the ask also does not discourage individuals who havepreviously supported for their voted-for charity, counter to at least a uniform souring of the experience.
9This also relates to the later discussed response time literature (Rand, Greene and Nowak, 2012; Tinghoget al., 2013; Recalde, Riedl and Vesterlund, 2014; Krajbich et al., 2015; Kessler, Kivimaki and Niederle, 2015).
4

donations if the ask is expected, and this average effect masks substantial heterogeneity.
Expecting the ask causes a 10% significant reduction in average donation among individuals
who have not previously supported their voted-for charity, 12% significant reduction among
females, and 20% significant reduction among the interaction of these two groups.
Our field experiment also finds heterogeneity by prior support for the charity. Both
experiments therefore contribute to growing evidence that there is a spectrum of individuals
ranging from those who are always selfish to those who are always prosocial. Although
not relevant for either extreme, excuses appear more relevant for those closer to the selfish
side.10 Our field experiment (with 83% of that sample being female) is underpowered to
gender differences, however, the finding from the complementary online experiment that
women are more likely to use excuses not to give echos the results from DellaVigna et al.
(2013). They find that women are more likely to avoid the ask when it is easier to do so.
More broadly, women may be more likely to be marginal givers and thus susceptible to
excuses.
1 Field Study DesignStep 1 - Vote for favorite group
For the first step (see Figure 1), an individual votes for her favorite animal group and pro-
Figure 1: Screen shot of first step of the voting contest
-vides her first name, last
name, email address and zip
code. She also confirms her
eligibility by agreeing to the
terms-of-use and stating that
she is 18 years or older, re-
sides in the US and will only
vote once. An individual only
views information that this
contest is related to a re-
search study if she chooses to
click on the terms-of-use hy-
perlink, and in the 4% of
10Karlan and Wood (2014) find more adverse responses to effectiveness information among smaller previousdonors, Exley (2016a) documents more excuse-driven responses to risk among those who give less when thereis no risk, and Exley (2016c) finds more excuse-driven responses to lower-rated charities among those who giveless to the highest-rated charities. In the voting literature, Gerber and Rogers (2009) observe that messagesabout low-voter-turnout, relative to high-voter-turnout, are most counterproductive among infrequent voters.Heterogeneous findings by prior prosocial behavior also appears in relation to responsiveness to naturaldisasters (Lilley and Slonim, 2016), financial incentives (Niesse-Ruenzi, Weber and Becker, 2014; Lacetera,Macis and Slonim, 2014), social image concerns (Exley, 2016b), and self-image concerns (Gneezy et al., 2012).
5
cases where this occurs, note that this hyperlink click precedes the treatment variations
shown in the second step.
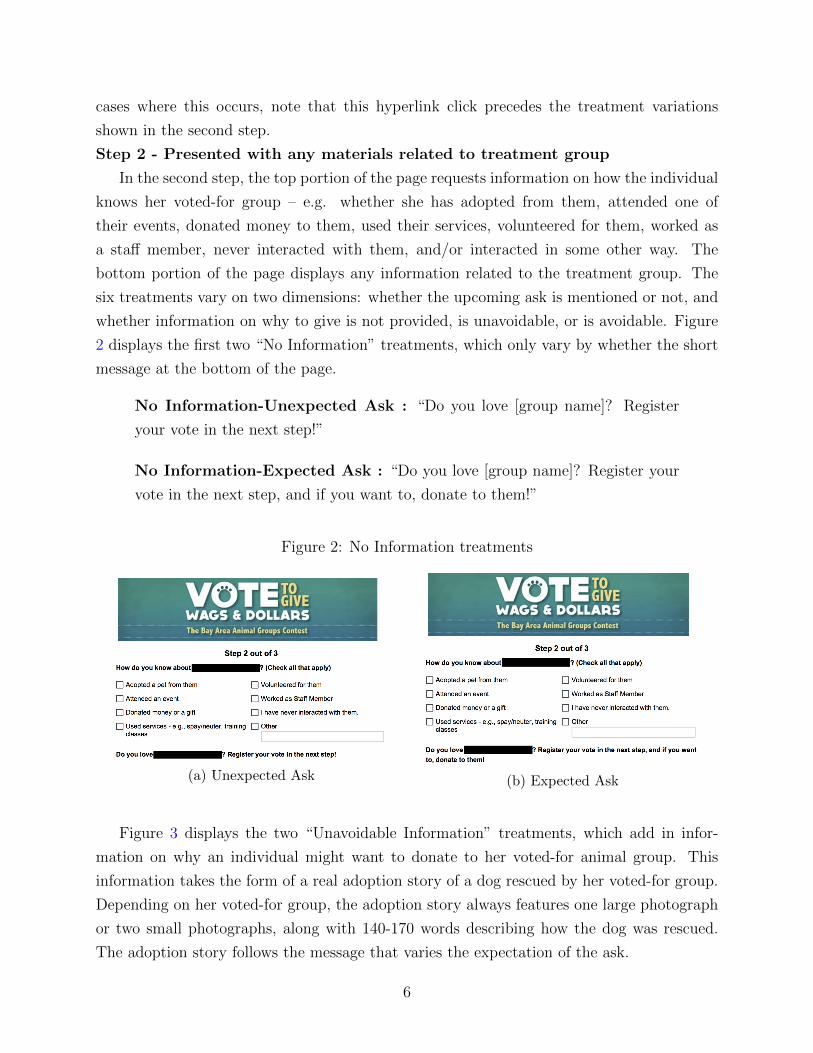
Step 2 - Presented with any materials related to treatment group
In the second step, the top portion of the page requests information on how the individual
knows her voted-for group – e.g. whether she has adopted from them, attended one of
their events, donated money to them, used their services, volunteered for them, worked as
a staff member, never interacted with them, and/or interacted in some other way. The
bottom portion of the page displays any information related to the treatment group. The
six treatments vary on two dimensions: whether the upcoming ask is mentioned or not, and
whether information on why to give is not provided, is unavoidable, or is avoidable. Figure
2 displays the first two “No Information” treatments, which only vary by whether the short
message at the bottom of the page.
No Information-Unexpected Ask : “Do you love [group name]? Register
your vote in the next step!”
No Information-Expected Ask : “Do you love [group name]? Register your
vote in the next step, and if you want to, donate to them!”
Figure 2: No Information treatments
(a) Unexpected Ask (b) Expected Ask
Figure 3 displays the two “Unavoidable Information” treatments, which add in infor-
mation on why an individual might want to donate to her voted-for animal group. This
information takes the form of a real adoption story of a dog rescued by her voted-for group.
Depending on her voted-for group, the adoption story always features one large photograph
or two small photographs, along with 140-170 words describing how the dog was rescued.
The adoption story follows the message that varies the expectation of the ask.
6

Unavoidable Information-Unexpected Ask: “Do you love [group name]?
Read ‘[dog name]’s Story’ below about a pup they saved, and register your vote
in the next step!”
Unavoidable Information-Expected Ask: “Do you love [group name]? Read
‘[dog name]’s Story’ below about a pup they saved, register your vote in the next
step, and if you want to, donate to them!”
Figure 3: Unavoidable Information treatments
(a) Unexpected Ask (b) Expected Ask
Figure 4 displays the final two “Avoidable Information” treatments. An individual can
click the bar at the bottom of the page to reveal the information or not click to avoid the
information. This bar follows the message that varies the expectation of the ask.
Avoidable Information-Unexpected Ask: “Do you love [group name]? Click
to read ‘[dog name]’s Story’ below about a pup they saved, and register your vote
in the next step!”
7

Avoidable Information-Expected Ask: “Do you love [group name]? Click
to read ‘[dog name]’s Story’ below about a pup they saved, register your vote in
the next step, and if you want to, donate to them!”
Figure 4: Avoidable Information treatments
(a) Unexpected Ask (b) Expected Ask
Step 3 - Choose whether to click-through to donation page
As shown in Figure 5, during the third and final step, an individual must decide whether
to click-through to her voted-for group’s donation page. To ensure an individual makes an
Figure 5: Screen shots of third step of the voting contest
active decision about clicking-
through, notice that she must
indicate this decision before
clicking on the “register my
vote” button. After click-
ing this button, a screen ap-
pears confirming the vote has
been registered and a confir-
mation email is sent. If the
voter chooses to click-through
to the donation page of her
voted-for animal group, she
is automatically redirected to
that page.
8

2 Field Study Data
2.1 Participant Recruitment
From March 9th to 22nd of 2015, individuals could vote for one out of eight participating
Bay Area animal groups.11 To encourage participation, the group with the most votes by
the end of the contest won $4,000. Additionally, one voter was chosen at random, and the
group that individual voted for won $1,500. This smaller prize provided an incentive for all
individuals to register a vote, even if their voted-for group was unlikely to win the $4,000.
The contest was hosted via a Qualtrics survey on the website of an organization that
helps individuals find dogs for adoption (www.wagaroo.com) from animal shelters, rescue
groups, or families needing to rehome their dogs. The hosting organization did not partici-
pate in the contest. Groups participating in this contest, however, had interacted with the
hosting organization before, mostly by posting profiles of their dogs available for adoption
on the hosting organization’s website. This relationship helped to ensure supporters of the
participating groups about the legitimacy of the contest. The left panel of Figure 6 shows
how the landing page for the contest appeared.
To facilitate voter recruitment, participating groups were provided with professionally
designed promotional materials. The right panel of Figure 6 shows an example. Groups
were free to use these materials and any of their own materials to promote the contest via
outlets such as Facebook, Twitter, their own web page, and email lists.12
Figure 6: Voting Contest
(a) Landing Page (b) Example Promotional Ad
11Random assignment to treatment groups was balanced across the 2 weeks of the contest, and our resultsare robust to only considering data from the first or second week.
12Our own monitoring suggests that most promotion took place on Facebook.
9

2.2 Participant Completion
Out of the 6,664 individuals who began the three-step voting registration process, only
4% did not complete all three steps. Excluding individuals with a duplicate name and/or
email address reduces the rate of attrition to only 1% of the remaining 6,059 individuals who
began the registration process.13 The attrition rate remains constant across all treatment
groups, and our results are not sensitive to excluding individuals on the basis of duplicate
names and/or email addresses.14 The analysis that follows therefore excludes all potential
duplicates and focuses on the 5,976 unique and successfully cast votes, thus yielding 980 -
1,005 in each treatment group.
2.3 Description of the Data
For the 5,976 participants, we measured the amount of time participants spent on each
step. While the median time spent on the first step (44-45 seconds) and last step (11
seconds) did not vary across treatments, the amount of time spent on the second step varied
in the direction one would expect: 19-21 seconds when no information was provided, 26-27
seconds when the information was avoidable, and 31-32 seconds when the information was
unavoidable.
Our data also consist of information directly inputted as part of the three-step voting
registration. From participants’ inputted names in the first step, computer code that predicts
gender from a database of names indicates 83% of participants were female, 14% were male,
and 4% were not known. From participants’ answers about how they knew their voted-for
group in the second step, 26% have adopted a pet from them, 22% have donated money or
a gift, 17% have attended an event, 15% have volunteered, 10% have used a service such as
spay/neuter or training classes, and 1% have worked as a staff member. Appendix Table A.1
shows that the frequency of these interactions, as well as predicted gender, are not different
across the treatment groups.
Participants’ active decisions about whether to click-through to the donation page of their
voted-for animal group in the third step is our central outcome metric. Among voters who
chose to click-through, subsequent donation decisions were only observed by the involved
animal group. Data collection from the animal groups unfortunately resulted in noisy and
non-standardized information. Even if we consider this data, the observed donation level
of 1-2% leaves us underpowered to detect any significant differences across our treatment
13The reduced attrition rate may reflect some individuals starting to register a second vote but thenquitting when they remembered that only one vote per person was allowed.
14This is important as it is indeed possible that some individuals shared the same name as anotherparticipant, or that more than one individual shared a particular email address, such as a family emailaddress.
10

groups.15 Analysis of donation data, however, is possible with our complementary online
experiment (see Section 4).
Before turning to how click-through rates change in response to our treatment variations
in the next section, it is useful to note that click-through rates, or targeted website traffic to
donation pages, are highly valued metrics. For instance, in their survey paper on political
campaigns, Nickerson and Rogers (2014) discuss how “data collected from online activities
can be of particular value” as the barrier to entry is low and it facilitates predictions about
levels of support and likelihood of subsequent actions. Given the increasing professionalism of
the nonprofit sector (Hwang and Powell, 2009), it may therefore be no surprise that a similar
focus appears to be developing among nonprofit organizations. Out of the 84 nonprofit
organizations (netting over $400 million dollars) featured in the 2015 M+R Benchmarks
Study, 76% paid for web marketing.16 The belief that this investment may be worthwhile
is moreover supported by M+R Benchmarks Study reporting an average of $610 dollars in
donations for every 1,000 website visitors compared to only an average of $40 for every 1,000
fundraising emails sent.
As a baseline, it is therefore encouraging to note that we observe an average click-through
rate to donation pages of 46%. This average compares favorably to available benchmarks
about how often individuals click-through in response to emails.17
3 Field Study Results
3.1 Treatment Effects on Click-through Rates
In the No Information - Unexpected Ask treatment, voters are reminded to register their
vote in the next step. The addition of 8 words that alert voters to the upcoming donation
ask in the No Information - Expected Ask treatment has a substantial impact. Figure 7
shows that the mere expectation of the ask, or opportunity to find and develop one’s own
excuses prior to the ask, causes click-through rates to significantly decrease from 51% to
only 40%. Columns (1) and (2) of Table 1 confirm the significance of this drop via a linear
probability model of the likelihood to click-through on expecting the ask, both when controls
15Although noisy, it is interesting to note that rates conditional on being asked are typically around 2% formail campaigns (Huck and Rasul, 2011; Karlan and List, 2007; Karlan and Shafir, 2011; Eckel and Grossman,2008) and via social media (Castillo, Petrie and Wardell, 2014, 2015).
16For details, please see http://mrbenchmarks.com.17The M+R Benchmark Study reports a click-through rate of 0.48% from fundraising emails, with only 14%
even being opened. MailChimp reports a click-through rate of 2.89% from large email campaigns initiated bynonprofit organizations, with only 25.45% of emails being opened (see http://mailchimp.com/resources/research/
email-marketing-benchmarks). Silverpop reports that even the top-quartile of nonprofit organizations only havea click-through rate of 4.8% and opening rate of 27.3% (see http://www.silverpop.com/Documents/Whitepapers/
2013/WP_EmailMarketingMetricsBenchmarkStudy2013.pdf). We are not aware of any benchmark of click-throughrates from an online contest.
11

are not included and when controls are included for each voter’s gender, day during contest
that they voted, selected animal group, and ways in which they know their selected animal
group.18 That is, individuals appear readily able to find excuses not to click-through when
the ask is expected. This reluctance to give arises even without the ability to avoid the ask or
the provision of information or factors that allow for subjective and self-serving evaluations.
Table 1: Click-through regressions
Linear probability model of click-throughInformation: None None or None or
Unavoidable Avoidable(1) (2) (3) (4) (5) (6)
Expected Ask -0.11∗∗∗ -0.11∗∗∗ -0.11∗∗∗ -0.11∗∗∗ -0.11∗∗∗ -0.11∗∗∗
(0.03) (0.03) (0.03) (0.03) (0.03) (0.03)
Unavoidable Info -0.04 -0.04(0.03) (0.03)
Expected Ask 0.11∗∗ 0.10∗∗
*Unavoidable Info (0.03) (0.03)
Avoidable Info -0.03 -0.03(0.02) (0.02)
Expected Ask 0.04 0.03*Avoidable Info (0.03) (0.03)
Previous Supporter 0.04∗∗ 0.07∗∗∗ 0.06∗∗
(0.02) (0.02) (0.02)Constant 0.51∗∗∗ 0.43∗∗∗ 0.51∗∗∗ 0.45∗∗∗ 0.51∗∗∗ 0.43∗∗∗
(0.04) (0.03) (0.04) (0.04) (0.04) (0.02)Controls no yes no yes no yesObservations 1989 1989 3973 3973 3987 3987Click-through rates 0.46 0.46 0.46 0.46 0.45 0.45
∗ p < 0.10, ∗∗ p < 0.05, ∗∗∗ p < 0.01. Standard errors are clustered at the voted-for animalgroup level and shown in parentheses. The results are from a linear probability modelof likelihood to click-through to the donation page of voted-for animal group. ExpectedAsk, Unavoidable Info, and Avoidable Info are indicators for when the ask is expected, theinformation provided is unavoidable, and the information provided is avoidable. Controlsinclude indicators for each individual’s day that they voted during the contest, selectedanimal groups, previous supporters, and males.
Turning now to the policy-related results, we investigate whether expecting the ask is less
detrimental when developing excuses may be more difficult or less desirable.19 Consistent
18All results in this paper are robust to considering Probit regression results as opposed to regressionresults from a linear probability model.
19A reduction in the salience of an upcoming ask may directly decrease the focus on finding excuses.
12

with this possibility, there is no longer a negative impact of expecting the ask when unavoid-
able information on why to give is provided. In the Unavoidable Information treatments,
click-through rates remain at 47% regardless of whether the ask is expected or unexpected.20
Columns (3) and (4) of Table 1 show providing unavoidable information significantly and
indeed fully counteracts the negative impact of expecting the ask.21
However, when information can be acquired in a manner that allows for excuses not to
give, we again see evidence for the negative impact of expecting the ask. In the Avoid-
able Information treatments, expecting the ask causes a significant reduction from 48% to
41%. Columns (5) and (6) of Table 1 show that providing avoidable information does not
significantly counteract the negative impact of expecting the ask.22
Figure 7: Clicks-through rates
.3.4
.5Fr
actio
n th
at C
lick-
thro
ugh
NoInformation
UnavoidableInformation
AvoidableInformation
Unexpected Ask Expected Ask +/- 2 SEs
20As the unavoidable information provided in this study did not encourage higher click-through ratesacross the board – that is, it only countered the negative impact of expecting the ask – there is room tooptimize what type of information is provided. For instance, results from Levine and Kam (2015) indicatethat the focus on past success as opposed to future need may suggest that the organizations can succeedwithout further support. Unavoidable information may also be less effective if it causes individuals to expectthe ask even without explicitly mentioning it. While this could explain the equal click-through rates inthe Unavoidable Information treatments, it would not explain why similar findings do not persist whenindividuals are offered the same information in the Avoidable Information treatments.
21 Expected Ask + Expected Ask*Unavoidable Info = 0 is not rejected (p = 0.91).22Expected Ask + Expected Ask*Avoidable Info = 0 is rejected (p = 0.01).
13

3.2 Heterogeneous Treatment Effects on Click-through Rates
Charities often consider how to target fundraising appeals towards new versus previous
supporters, and prior literature confirms that responsiveness to various factors, such as image
concerns or financial incentives, vary across these two groups. To consider the potential
for heterogeneous effects by the level of prior support, we therefore turn to the gathered
information on how voters know their voted-for animal group. We classify 54% of voters
as previous supporters if they have previously adopted from, donated to, volunteered for,
attended an event of, used services of, or been a staff member for their voted-for animal
group. The remaining 46% of new supporters include anyone who has not engaged in those
forms of previous support; they have never interacted with their voted-for animal group or
have only interacted in some other way. Other ways largely involve small interactions, and
in particular, liking the group on Facebook.
Appendix Table A.2 displays the main click-through regression results when the treatment
effects are interacted with an indicator for being a previous supporter. As shown by the
coefficient on Expected Ask, expecting the ask causes click-through rates to significantly drop
by 16 percentage points among new supporters. As shown by the coefficient on Expected
Ask*Previous Supporter, this drop is qualitatively smaller by 9 percentage points among
previous supporters. The resulting 7 percentage point drop in click-through rates from
expecting the ask is indeed not statistically significant among previous supporters.23 In
other words, while new supporters appear to capitalize on the opportunity to find and
develop their own excuses when they expect the ask, a similar reluctance to give does not
significantly emerge among previous supporters.24,25
3.3 Treatment Effects and Information Acquisition
Information acquisition choices in the Avoidable Information treatments are such that
individuals more readily avoid prosocial behavior when the ask is expected. This section fur-
ther considers whether evidence – related to both extensive margin decisions about whether
to reveal the information and intensive margin decisions about how to consider the informa-
tion when revealed – is consistent with excuse-driven behavior.
23Expected Ask + Expected Ask*Previous Supporter = 0 is not rejected (p = 0.20).24There is also some evidence that previous supporters are less responsive to the provision of information,
perhaps because previous supporters are more familiar with the available information on how their voted-for group rescues dogs. While unavoidable information has a negative level effect among new supporters,unavoidable information is significantly less detrimental to previous supporters and does not significantlyinfluence their click-through rates (Unavoidable Info + Unavoidable Info*Previous Supporter = 0 is notrejected, p = 0.94).
25Appendix Tables A.3 further provides some qualitative evidence for females being more responsive tothe treatment manipulations, although our sample, consisting of 83% females, is underpowered to detect anypotential differences.
14

The moral wiggle room literature suggests viewing decisions will be affected at the ex-
tensive margin when the ask is expected. While information may be avoided both when the
ask is expected and unexpected, a particular desire to maintain “wiggle room” is more likely
when the ask is expected. Our results support information avoidance in both scenarios.
Avoidance is common when the ask is unexpected: only 18% of new supporters and 25%
of previous supporters reveal the information. Avoidance is even more likely when the ask
is expected: only 13% of new supporters and 21% of previous supporters reveal the infor-
mation. That is, expecting the ask causes a 28% decrease in revealing information among
new supporters and a 18% decrease among previous supporters. The first two columns of
Appendix Table A.4 confirm these drops for both new and previous supporters, although
qualitatively less so among the latter.26
The self-serving literature suggests viewing decisions will be affected on the intensive
margin. Individuals may view the same information in a more self-serving manner when they
may profit from doing so. Unlike the extensive margin though, there is no clear measure
of individuals’ intensive margin viewing decisions. In focusing on one observable measure
– the amount of time individuals spend viewing the information – the last two columns of
Appendix Table A.4 show that viewing time is not significantly different when the ask is
expected or unexpected.
However, conditional on revealing the information, Appendix Table A.5 demonstrates
that viewing time behavior may be more nuanced. Among individuals who choose to reveal
the information when the ask is unexpected, both new supporters and previous supporters
who click-through spend more time viewing the information than their counterparts who do
not click-through.27 This pattern may reasonably arise because individuals who support the
organization are more likely both to spend time reading information and to click-through.
Suggestively, a similar pattern does not emerge when the ask is instead expected. There
is less time spent viewing the information among individuals who click-through (generous-
types) and more time spent viewing among individuals who do not click through (selfish-
types). The generous-fast finding is particularly striking among previous supporters while
the selfish-slow finding is more striking among new supporters. In addition to supporting the
possibility that new supporters are more likely to be excuse-driven than previous supporters,
this finding is consistent with the broader empirical findings where prosocial tendencies are
intuitive and fast while selfish choices are deliberate and slow (see Zaki and Mitchell (2013)
for a review or Rand, Greene and Nowak (2012) for an example).28
26Expected Ask + Expected Ask*Previous Supporter = 0 is rejected (p = 0.03).27A similar pattern emerges in the Unavoidable Information treatments (see Appendix Tables A.6).28Our heterogeneous findings also relate to the literature that considers how confounds may influence
the relationship between decision time and prosocial tendencies. For instance, the relationship may depend
15

4 Complementary Online StudyFrom April 14 -16 of 2016, we recruited 800 participants via Amazon Mechanical Turk
to complete a complementary online study.29 Eligible participants – anyone who resided in
the United States and had completed 100 tasks via this platform with an approval rating
of 95% or better – saw our study description as “You will be asked to answer a 5 minute
academic survey” and knew the guaranteed payments was $1 for completing the survey. One
individual did not partake in our survey yet submitted an (invalid) completion code, and
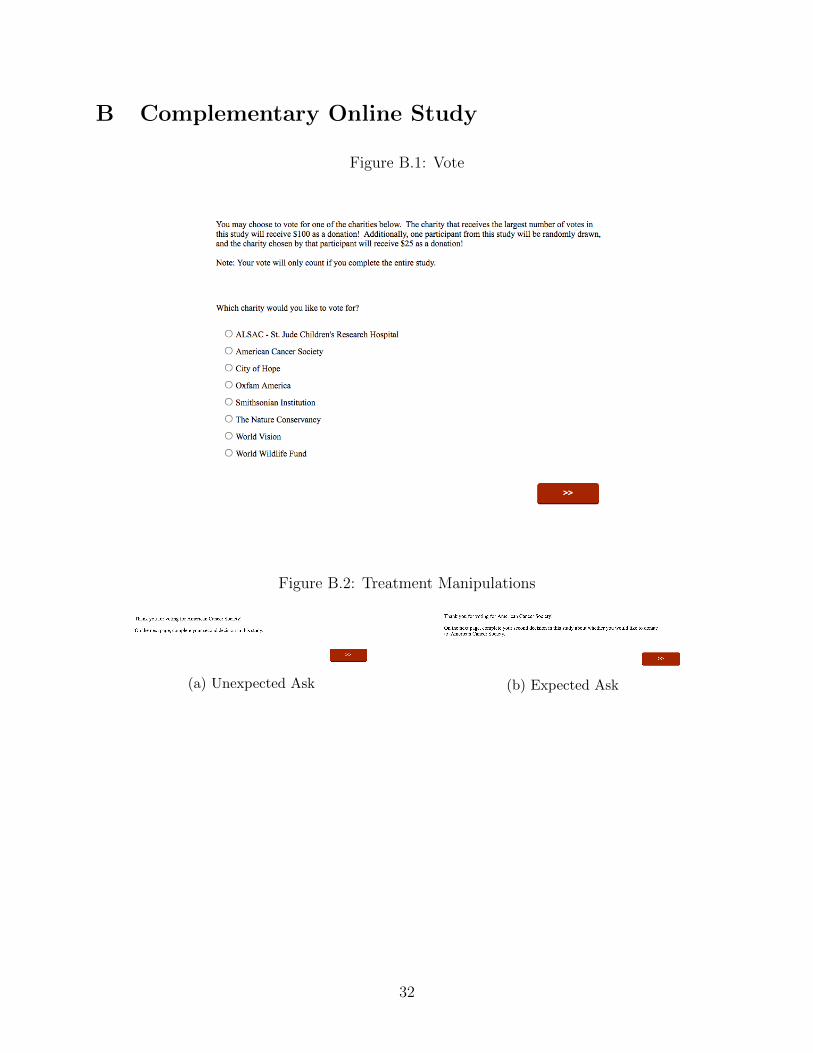
thus our sample size is 799 individuals. As shown via the screenshots in Appendix B, Figures
B.1- B.3, this study employs a similar design as the No Information treatments from the field
study and provides donation data as a robustness check on our field study results.
In the first out of two decisions, individuals are asked to vote for one of eight charities.
They learn that the charity with the most votes will receive a donation of $100, and ad-
ditionally, the charity voted for by a randomly selected participant will receive a donation
of $25. Selecting from the top-ten most followed and the top-ten super-sized charities on
Charity Navigator, the eight charities that individuals could vote for include ALSAC - St.
Jude Children’s Research Hospital, American Cancer Society, City of Hope, Oxfam America,
Smithsonian Institution, The Nature Conservancy, World Vision, and World Wildlife Fund.
After completing their first decision, participants read text according to whether they
are randomly assigned to the expected ask or unexpected ask treatment group.
Unexpected Ask: “Thank you for voting for [group name]! On the next page,
complete your second decision in this study.”
Expected Ask: “Thank you for voting for [group name]! On the next page,
complete your second decision in this study about whether you would like to
donate to [group name].”
In the second decision, individuals are informed of an additional 100 cents in bonus
payment that they may receive. They are asked how much of this bonus payment (in cents)
they would like to keep for themselves and how much they would instead like to donate to
their voted-for charity. The study then concludes with a brief follow-up survey.
ALSAC - St. Jude Children’s Research Hospital garnered the most votes with 37% of
participants choosing them, followed by the American Cancer Society with 24% of the vote
on the selection of individuals (Tinghog et al., 2013), the complexity of the environment (Recalde, Riedland Vesterlund, 2014), or the strength of preferences over the available choice set (Krajbich et al., 2015).Indeed, Kessler, Kivimaki and Niederle (2015) show that more time corresponds with reduced giving whenthe benefits of giving are low but increased giving if the benefits of giving are high.
29For more details about Amazon Mechanical Turk, recent papers investigating this platform includePaolacci, Chandler and Ipeirotis (2010) and Horton, Rand and Zeckhauser (2011).
16

and the World Wildlife Fund with 15% of the vote. The remaining five charities received 2%-
8% of the vote. Individual donations to the charities plus any awarded prize donation (e.g.
$100 or $25) were given to the charities online within a few weeks of the study completion.
We classify 38% of individuals as previous supporters since they indicate having previously
donated to and/or volunteered for their voted-for charity.30 We classify the remaining 62%
of individuals as new supporters since they indicate having never supported their voted-for
charity or only having supported them via social media.31 While this sample is less balanced
between previous and new supporters than our field study (where the split was instead 54%
- 46%), it is substantially more gender balanced with females accounting for 44% of the
sample as opposed to the previously observed 83%.
Table 2 presents the OLS regression results of how much individuals donate on whether
they expect the ask. Column (1) shows that the negative impact of expecting the ask extends
to donation behavior: the average donation decreases by 4 cents when the ask is expected –
representing a 5% significant decrease from 73 cents to 69 cents.
Column (2) shows that, as in our field study, expecting the ask is particularly detrimen-
tal to those who may be more susceptible to excuses not to give – new supporters. While
expecting the ask does not significantly influence the average donation among previous sup-
porters, average donations among new supporters decrease by 8 cents – representing a 10%
significant decrease from 77 cents to 69 cent.32
Column (3) highlights a significant gender difference: expecting the ask is less detrimental
to males than females. While expecting the ask does not significantly influence the average
donation among males, expecting the ask causes the average donation among females to
drop by 9 cents – representing a significant 12% decrease.33
Column (4) shows the the heterogeneous findings are additive. The expectation of the
ask is therefore most detrimental among new female supporters. Column (5) shows that
these results are robust to the inclusion of controls.
30If we also include those who have supporter their voted-for charity via social media, then 46% of partic-ipants would be previous supporters and none of the results that follow significantly change.
31New supporters also include the 1% who check “other” – i.e., their friend works at that charity.32Expected Ask + Expected Ask*Previous Supporter = 0 is not rejected (p = 0.52).33Expected Ask + Expected Ask*Male = 0 is not rejected (p = 0.97).
17

Table 2: Donation regressions
OLS of Donation to Voted-for Charity(1) (2) (3) (4) (5)
Expected Ask -3.94∗ -7.89∗∗∗ -9.15∗∗ -15.19∗∗∗ -14.36∗∗∗
(2.39) (3.03) (3.69) (4.85) (4.83)
Previous Supporter -8.74∗∗ -9.16∗ -5.50(3.55) (5.09) (5.28)
Expected Ask 10.40∗∗ 14.77∗∗ 14.36∗
*Previous Supporter (4.91) (7.43) (7.39)
Male -0.22 -0.96 -1.15(3.40) (4.14) (4.16)
Expected Ask 9.04∗ 12.36∗∗ 11.19∗
*Male (4.84) (6.19) (6.23)
Previous Supporter 0.73 1.17*Male (7.14) (7.23)
Expected Ask -7.01 -6.46*Previous Supporter (9.94) (10.03)*Male
Constant 73.41∗∗∗ 76.70∗∗∗ 73.53∗∗∗ 77.24∗∗∗ 74.60∗∗∗
(1.69) (2.05) (2.48) (3.11) (14.80)
Controls no no no no yesObservations 799 799 799 799 799Average Donation 71.42 71.42 71.42 71.42 71.42
∗ p < 0.10, ∗∗ p < 0.05, ∗∗∗ p < 0.01. Standard errors are clustered at the voted-for animal group level andshown in parentheses. The results are from OLS regressions of donations to voted-for charity. ExpectedAsk and Previous Supporter are indicators for when the ask is expected and previous supporters. Controlsinclude indicators for day the study was conduced and selected charities. Controls also include self-reportsabout whether participants answered questions carefully, answered questions randomly, understood thestudy, have ever volunteered for a charity, or have ever donated to a charity.
5 ConclusionGino, Norton and Weber (2016) conclude their survey paper by noting that self-serving
behavior is likely when individuals have “flexibility and creativity in how they acquire, attend
to, and process information.” This paper extends the literature by documenting evidence for
excuse-driven behavior more broadly, in an environment where there is less flexibility to
avoid the ask and neither information nor factors that can easily be viewed self-servingly are
provided.
In a large field experiment using an online voting contest, we vary whether an upcoming
donation ask is announced and expected or a surprise and (more) unexpected. We document
a 22% significant reduction in click-through rates to donation pages when individuals know
18

an ask is coming. A complementary online experiment confirms this behavior with donation
data. Both studies show how expecting an imminent ask, and thus having the brief opportu-
nity to find and develop excuses prior to facing the ask, is detrimental to prosocial behavior
among new supporters but not previous supporters. The complementary online experiment
also finds that expecting the ask is particularly detrimental to donations from females.
The decision context we consider does not explicitly highlight features that could be
used as excuses. Nonetheless, excuse-driven behavior in our experiment is pronounced. This
poses a challenge to policies seeking to counter excuse-driven behavior. If individuals only
use factors – such as risk, competing norms, or avoidance techniques — as excuses not to
give, then an effective policy may eliminate the risk, define the norms and prevent avoidance
techniques. However, if individuals find their own excuses even absent explicitly-highlighted
information such as risk or competing norms or the ability to engage in avoidance, effective
policies are less clear. The potential array of excuses may therefore suggest a push towards
interventions that encourage participants to evaluate a situation when self-serving motives
are not present before following-up with a related prosocial ask (see such manipulations in
Babcock et al. (1995), Haisley and Weber (2010) and Gneezy et al. (2016)).
In addition to testing strategies for mitigating excuse-driven behavior, we view several
avenues for future work as promising. First, while excuses are not relevant among individ-
uals who are always or never prosocial, both empirically and theoretically considering the
full distribution of excuse-driven types may prove useful. Second, given the various nuances
in prosocial decisions, a feasible strategy for documenting excuse-driven behavior may in-
volve manipulating the expectation of the ask. Third, the ability to more easily develop
excuses when an ask is expected may carry over to other contexts and yield different policy
prescriptions. Limiting the ability to develop excuses may be desirable in some contexts,
such as when excuses impede achieving Pareto-optimal coordination. Instead facilitating
excuse-driven behavior may be desirable in other contexts – for instance, if excuses mitigate
the gender gap in non-promotable tasks at work (Vesterlund et al., 2015).
19

ReferencesAndreoni, James, and B. Douglas Bernheim. 2009. “Social Image and the 50–50
Norm: A Theoretical and Experimental Analysis of Audience Effects.” Econometrica,
77(5): 1607–1636.
Andreoni, James, and Justin M. Rao. 2011. “The power of asking: How communication
affects selfishness, empathy, and altruism.” Journal of Public Economics, 95: 513–520.
Andreoni, James, Justin M. Rao, and Hannah Trachtman. 2016. “Avoiding the
ask: A field experiment on altruism, empathy, and charitable giving.” Journal of Political
Economy.
Babcock, Linda, George Loewenstein, Samuel Issacharoff, and Colin Camerer.
1995. “Biased Judgments of Fairness in Bargaining.” The American Economic Review,
85(5): 1337–1343.
Bartling, Bjorn, and Urs Fischbacher. 2012. “Shifting the Blame: On Delegation and
Responsibility.” Review of Economic Studies, 79(1): 67–87.
Bartling, Bjorn, Florian Engl, and Roberto A. Weber. 2014. “Does willful ignorance
deflect punishment? – An experimental study.” European Economic Review, 70(0): 512 –
524.
Batista, Catia, Dan Silverman, and Dean Yang. 2015. “Directed Giving: Evidence
from an Inter-Household Transfer Experiment.” Journal of Economic Behavior & Orga-
nization.
Broberg, Tomas, Tore Ellingsen, and Magnus Johannesson. 2007. “Is generosity
involuntary?” Economics Letters, 94(1): 32–37.
Brown, Alexander L., Jonathan Meer, and J. Forrest Williams. 2014. “Social Dis-
tance and Quality Ratings in Charity Choice.” NBER Working Paper Series.
Castillo, Marco, Ragan Petrie, and Clarence Wardell. 2014. “Fundraising through
online social networks: A field experiment on peer-to-peer solicitation.” Journal of Public
Economcis, 29–35.
Castillo, Marco, Ragan Petrie, and Clarence Wardell. 2015. “Friends Asking Friends
for Charity: The Importance of Gifts and Audience.” Working Paper.
20

Coffman, Lucas C. 2011. “Intermediation Reduces Punishment (and Reward).” American
Economic Journal: Microeconomics, 3(4): 1–30.
Dana, Jason, Daylian M. Cain, and Robyn M. Dawes. 2006. “What you don’t know
won’t hurt me: Costly (but quiet) exit in dictator games.” Organizational Behavior and
Human Decision Processes, 100: 193–201.
Dana, Jason, Roberto A. Weber, and Jason Xi Kuang. 2007. “Exploiting moral
wiggle room: experiments demonstrating an illusory preference for fairness.” Economic
Theory, 33: 67–80.
Danilov, Anastasia, and Silvia Saccardo. 2016. “Disguised Discrimination.” Working
Paper.
DellaVigna, Stefano, John A. List, Ulrike Malmendier, and Gautam Rao. 2013.
“The Importance of Being Marginal: Gender Differences in Generosity.” NBER Working
Paper No. 18748.
DellaVigna, Stefano, John List, and Ulrike Malmendier. 2012. “Testing for Altruism
and Social Pressure in Charitable Giving.” Quarterly Journal of Economics, 127(1): 1–56.
Di Tella, Rafael, Ricardo Perez-Truglia, Andres Babino, and Mariano Sigman.
2015. “Conveniently Upset: Avoiding Altruism by Distorting Beliefs about Others’ Altru-
ism.” American Economic Review, 105(11): 3416–42.
Eckel, Catherine, and Phillip Grossman. 2008. “Subsidizing charitable contributions:
a natural field experiment comparing matching and rebate subsidies.” Experimental Eco-
nomics, 11(3): 234–252.
Exley, Christine L. 2016a. “Excusing Selfishness in Charitable Giving: The Role of Risk.”
Review of Economic Studies, 83(2): 587–628.
Exley, Christine L. 2016b. “Incentives for Prosocial Behavior: The Role of Reputations.”
Working Paper.
Exley, Christine L. 2016c. “Using Charity Performance Metrics as an Excuse Not To
Give.” Working Paper.
Falk, Armin, and Nora Szech. 2013. “Organizations, Diffused Pivotality and Immoral
Outcomes.” IZA Discussion Paper 7442.
21
Fong, Christina M., and Felix Oberholzer-Gee. 2011. “Truth in giving: Experimental
evidence on the welfare effects of informed giving to the poor.” Journal of Public Eco-
nomics, 95: 436–444.
Garbarino, Ellen, Robert Slonim, and Marie Claire Villeval. 2016. “Loss Aversion
and Lying Behavior: Plus a method to estimate lying.” Working Paper.
Gerber, Alan S., and Todd Rogers. 2009. “Descriptive social norms and motivation to
vote: Everybody’s voting and so should you.” The Journal of Politics, 71(1): 178–191.
Gino, Francesca, Michael I. Norton, and Roberto A. Weber. 2016. “Motivated
Bayesians: Feeling Moral While Acting Egoistically Motivated Bayesians: Feeling Moral
While Acting Egoistically Motivated Bayesians: Feeling Moral While Acting Egotistically.”
Journal of Economic Perspectives, 30(3): 189–212.
Giving USA Foundation. 2015. “Giving USA 2015: The Annual Report on Philanthropy.”
Indiana University Lilly Family School of Philanthropy.
Gneezy, Ayelet, Alex Imas, Amber Brown, Leif D. Nelson, and Michael I. Nor-
ton. 2012. “Paying to Be Nice: Consistency and Costly Prosocial Behavior.” Management
Science, 58(1): 179–187.
Gneezy, Uri, Elizabeth A. Keenan, and Ayelet Gneezy. 2014. “Avoiding overhead
aversion in charity.” Science, 346(6209): 632–635.
Gneezy, Uri, Silvia Saccardo, Marta Serra-Garcia, and Roel van Veldhuizen.
2016. “Motivated Self-Deception, Identity, and Unethical Behavior.” Working paper.
Grossman, Zachary. 2014. “Strategic ignorance and the robustness of social preferences.”
Management Science, 60(11): 2659–2665.
Grossman, Zachary, and Joel J van der Weele. 2016. “Self-image and willful ignroance
in social decisions.” Journal of the European Economic Association.
Haisley, Emily C., and Roberto A. Weber. 2010. “Self-serving interpretations of am-
biguity in other-regarding behavior.” Games and Economic Behavior, 68: 614–625.
Hamman, John R., George Loewenstein, and Roberto A. Weber. 2010. “Self-
Interest through Delegation: An Additional Rationale for the Principal-Agent Relation-
ship.” American Economic Review, 100(4): 1826–1846.
22

Horton, John J., David G. Rand, and Richard J. Zeckhauser. 2011. “The online
laboratory: Conducting experiments in a real labor marke.” Experimental Economics,
14(3): 399–425.
Hsee, Christopher K. 1995. “Elastic justification: How tempting but task-irrelevant fac-
tors influence decisions.” Organizational Behavioral and Human Decision Process, 62(3).
Hsee, Christopher K. 1996. “Elastic justification: How unjustifiable factors influence
judgments.” Organizational Behavior and Human Decision Processes, , (1).
Huck, Steffen, and Imran Rasul. 2011. “Matched fundraising: Evidence from a natural
field experiment.” Journal of Public Economics, 95: 351–362.
Hwang, Hokyu, and Walter W. Powell. 2009. “The Rationalization of Charity: The
Influences of Professionalism in the Nonprofit Sector.” Administrative Science Quarterly,
54: 268–298.
Kamdar, Amee, Steven D. Levitt, John A. List, Brian Mullaney, and Chad
Syverson. 2015. “Once and Done: Leveraging Behavioral Economics to Increase Chari-
table Contributions.”
Karlan, Dean, and Daniel H. Wood. 2014. “The effect of effectiveness: donor response
to aid effectiveness in a direct mail fundraising experiment.” NBER Working Paper Series,
Working Paper 20047.
Karlan, Dean, and John A. List. 2007. “Does Price Matter in Charitable Giving? Ev-
idence from a Large-Scale Natural Field Experiment.” The American Economic Review,
97(5): pp. 1774–1793.
Karlan, Dean, John List, and Eldar Shafir. 2011. “Small matches and charitable giving:
Evidence from a natural field experiment.” Journal of Public Economics, 95(5): 344–350.
Kessler, Judd, Hannu Kivimaki, and Muriel Niederle. 2015. “Generosity Over Time.”
Working Paper.
Klinowski, David. 2015. “Reluctant donors and their reactions to social information.”
Working paper.
Konow, James. 2000. “Fair Shares: Accountability and Cognitive Dissonance in Allocation
Decisions.” The American Economic Review, 90(4): 1072–1092.
23

Krajbich, Ian, Bjorn Bartling, Todd Hare, and Ernst Fehr. 2015. “Rethinking fast
and slow based on a critique of reaction-time reverse inference.” Nature Communications.
Lacetera, Nicola, Mario Macis, and Robert Slonim. 2014. “Rewarding Volunteers: A
Field Experiment.” Management Science, 1–23.
Lazear, Edward P., Ulrike Malmendier, and Roberto A. Weber. 2012. “Sorting in
experiments with application to social preferences.” American Economic Journal: Applied
Economics, 4(1): 136–163.
Levine, Adam Seth, and Cindy D. Kam. 2015. “Organizations, Credibility, and the
Psychology of Collective Action.” Working paper.
Lilley, Matthew, and Robert Slonim. 2016. “Gender Differences in Altruism: Responses
to a Natural Disaster.” IZA Discussion Paper No. 9657.
Linardi, Sera, and Margaret A. McConnell. 2011. “No excuses for good behavior:
Volunteering and the social environment.” Journal of Public Economics, 95: 445–454.
Lin, Stephanie C., Rebecca L. Schaumberg, and Taly Reich. 2016. “Sidestepping
the rock and the hard place: The private avoidance of prosocial requests.” Journal of
Experimental Social Psychology, 35–40.
Li, Sherry Xin, Catherine Eckel, Philip J. Grossman, and Tara Larson Brown.
2015. “Directed giving enhances voluntary giving to government.” Economics Letters,
133: 51–54.
Meer, Jonathan. 2011. “Brother, can you spare a dime? Peer pressure in charitable
solicitation.” Journal of Public Economics, 95(7): 926–941.
Meer, Jonathan. 2014. “Effects of the price of charitable giving: Evidence from an online
crowdfunding platform.” Journal of Economic Behavior & Organization, 103: 113–124.
Miller, Dale T., and Benoıt Monin. 2016. “Moral opportunities versus moral tests.”
In The Social Psychology of Morality. , ed. & P. van Lange J. Forgas, L. Jussim. New
York:Psychology Press.
Nickerson, David, and Todd Rogers. 2014. “Political Campaigns and Big Data.” Journal
of Economic Perspectives, 28: 51–74.
Niesse-Ruenzi, Alexandra, Martin Weber, and David Michael Becker. 2014. “To
pay or not to pay – Evidence from whole blood donations in Germany.” Working paper.
24
Norton, Michael I, Joseph A Vandello, and John M Darley. 2004. “Casuistry and
social category bias.” Journal of personality and social psychology, 87(6): 817–831.
Paolacci, Gabriele, Jesse Chandler, and Panagiotis G. Ipeirotis. 2010. “Running
experiments on amazon mechanical turk.” Judgment and Decision making, 5(5): 411–419.
Rand, David G., Joshua D. Greene, and Martin A. Nowak. 2012. “Spontaneous
giving and calculated greed.” Nature, 489(7416): 427–430.
Recalde, Maria P., Arno Riedl, and Lise Vesterlund. 2014. “Error prone inference
from response time: The case of intuitive generosity.” Working Paper.
Schwardman, Peter, and Joel van der Weele. 2016. “Deception and Self-Deception.”
Tinbergen Institute Discussion Paper.
Shalvi, Shaul, Jason Dana, Michel JJ Handgraaf, and Carsten KW De Dreu.
2011. “Justified ethicality: Observing desired counterfactuals modifies ethical perceptions
and behavior.” Organizational Behavior and Human Decision Processes, 115(2): 181–190.
Snyder, Melvin L, Robert E Kleck, Angelo Strenta, and Steven J Mentzer.
1979. “Avoidance of the handicapped: an attributional ambiguity analysis.” Journal of
personality and social psychology, 37(12): 2297–2306.
Tinghog, Gustav, David Andersson, Caroline Bonn, Harald Bottiger, Camilla
Josephson, Gustaf Lundgren, Daniel Vastfjall, Michael Kirchler, and Magnus
Johannesson. 2013. “Intuition and cooperation reconsidered.” Nature, 498(7452): E1–E2.
Trachtman, Hannah, Andrew Steinkruger, Mackenzie Wood, Adam Wooster,
James Andreoni, James J. Murphy, and Justin M. Rao. 2015. “Fair weather avoid-
ance: unpacking the costs and benefits of “Avoiding the Ask”.” Journal of the Economic
Science Association, 1–7.
van der Weele, Joel J. 2014. “Inconvenient Truths: Determinants of Strategic Ignorance
in Moral Dilemmas.” Working paper.
Vesterlund, Lise, Linda Babcock, Maria Recalde, and Laurie Weinbart. 2015.
“Breaking the Glass Ceiling with “No”: Gender Differences in Accepting and Receiving
Requests for Non-Promotable Tasks.” Working Paper.
Yoruk, Baris K. 2016. “Charity Ratings.” ournal of Economics & Management Strategy,
25(1): 195–219.
25

Zaki, Jamil, and Jason P. Mitchell. 2013. “Intuitive prosociality.” Current Directions
in Psychological Science, 22(6): 466–470.
26

A Field Study
Table A.1: Fraction of participants who have interacted with voted-forgroup in following ways
Information Any None Unavoidable AvoidableExpected Ask yes no yes no yes no
Adopter 0.26 0.28 0.28 0.27 0.23 0.28 0.24Donor 0.22 0.24 0.21 0.22 0.23 0.23 0.21Attendee of Event 0.17 0.17 0.18 0.17 0.16 0.18 0.16Volunteer 0.15 0.16 0.15 0.14 0.13 0.16 0.13User of Services 0.10 0.09 0.10 0.10 0.10 0.11 0.10Staff 0.01 0.02 0.01 0.02 0.01 0.01 0.01Interacted in Other Way 0.44 0.43 0.42 0.44 0.43 0.43 0.46Have Never Interacted 0.07 0.07 0.06 0.07 0.08 0.07 0.07Previous Supporter 0.54 0.55 0.56 0.55 0.53 0.55 0.52New Supporter 0.46 0.45 0.44 0.45 0.47 0.45 0.48Female 0.83 0.85 0.82 0.83 0.82 0.82 0.84Male 0.14 0.13 0.15 0.13 0.14 0.13 0.14Gender Unknown 0.03 0.02 0.04 0.03 0.04 0.04 0.02
Observations 5976 991 1001 1005 980 1000 999
The first eight rows indicate the frequency with which the shown answers wereprovided in response to how a participant knew the animal shelter for which theyvoted. A previous supporter is any individual who indicated that they were anadopter, donor, volunteer, attendee of event, user of services or staff. A new sup-porter is anyone who did not indicate one of the aforementioned ways of knowingthe animal group for which they voted. Computer code that predicts gender fromnames was used to classify participants as female or male, or unknown gender.
27

Table A.2: By type of supporter, click-through regressions
Linear probability model of click-throughInformation: None None or Unavoidable None or Avoidable
(1) (2) (3) (4) (5) (6)
Expected Ask -0.16∗∗∗ -0.16∗∗∗ -0.16∗∗∗ -0.16∗∗∗ -0.16∗∗∗ -0.16∗∗∗
(0.02) (0.02) (0.02) (0.02) (0.02) (0.02)
Unavoidable Info -0.09∗∗∗ -0.09∗∗∗
(0.02) (0.02)
Expected Ask 0.15∗∗∗ 0.15∗∗∗
*Unavoidable Info (0.02) (0.02)
Avoidable Info -0.06∗∗ -0.07∗∗
(0.02) (0.02)
Expected Ask 0.09∗∗ 0.09∗∗
*Avoidable Info (0.04) (0.04)
Previous Supporter -0.04 -0.00 -0.04 0.00 -0.04 -0.00(0.04) (0.04) (0.04) (0.04) (0.04) (0.04)
Expected Ask 0.09 0.09 0.09 0.09 0.09 0.09*Previous Supporter (0.05) (0.05) (0.05) (0.05) (0.05) (0.05)
Unavoidable Info 0.09∗∗ 0.09∗∗
*Previous Supporter (0.04) (0.04)
Expected Ask -0.08 -0.08*Unavoidable Info (0.06) (0.06)*Previous Supporter
Avoidable Info 0.06 0.07*Previous Supporter (0.04) (0.04)
Expected Ask -0.10 -0.10*Avoidable Info (0.06) (0.06)*Previous Supporter
Constant 0.53∗∗∗ 0.46∗∗∗ 0.53∗∗∗ 0.49∗∗∗ 0.53∗∗∗ 0.46∗∗∗
(0.02) (0.04) (0.02) (0.05) (0.02) (0.02)
Controls no yes no yes no yesObservations 1989 1989 3973 3973 3987 3987Click-through rates 0.46 0.46 0.46 0.46 0.45 0.45
∗ p < 0.10, ∗∗ p < 0.05, ∗∗∗ p < 0.01. Standard errors are clustered at the voted-for animalgroup level and shown in parentheses. The results are from a linear probability model oflikelihood to click-through to the donation page of voted-for animal group. Expected Ask,Unavoidable Info, Avoidable Info, and Previous Supporters are indicators for when the askis expected, the information provided is unavoidable, the information provided is avoidable,and previous supporters. Controls include indicators for each individual’s day that they votedduring the contest, selected animal groups, and males.
28

Table A.3: By gender, click-through regressions
Linear probability model of click-throughInformation: None None or Unavoidable None or Avoidable
(1) (2) (3) (4) (5) (6)
Expected Ask -0.11∗∗∗ -0.11∗∗ -0.11∗∗∗ -0.11∗∗∗ -0.11∗∗∗ -0.11∗∗∗
(0.03) (0.03) (0.03) (0.03) (0.03) (0.03)
Unavoidable Info -0.05 -0.04(0.03) (0.03)
Expected Ask 0.10∗∗ 0.10∗∗
*Unavoidable Info (0.03) (0.03)
Avoidable Info -0.04∗ -0.04∗
(0.02) (0.02)
Expected Ask 0.05 0.04*Avoidable Info (0.03) (0.03)
Male -0.05 -0.05 -0.05 -0.05 -0.05 -0.05(0.03) (0.03) (0.03) (0.03) (0.03) (0.03)
Expected Ask 0.04 0.02 0.04 0.03 0.04 0.03*Male (0.06) (0.06) (0.06) (0.06) (0.06) (0.06)
Unavoidable Information 0.05 0.05*Male (0.05) (0.05)
Expected Ask 0.03 0.04*Unavoidable Information (0.09) (0.09)*Male
Avoidable Information 0.08 0.09*Male (0.06) (0.05)
Expected Ask -0.06 -0.05*Avoidable Information (0.09) (0.09)*Male
Constant 0.52∗∗∗ 0.43∗∗∗ 0.52∗∗∗ 0.45∗∗∗ 0.52∗∗∗ 0.44∗∗∗
(0.04) (0.02) (0.04) (0.04) (0.04) (0.01)
Controls no yes no yes no yesObservations 1989 1989 3973 3973 3987 3987Click-through rates 0.46 0.46 0.46 0.46 0.45 0.45
∗ p < 0.10, ∗∗ p < 0.05, ∗∗∗ p < 0.01. Standard errors are clustered at the voted-for animal grouplevel and shown in parentheses. The results are from a linear probability model of likelihood toclick-through to the donation page of voted-for animal group. Expected Ask, Unavoidable Info,Avoidable Info, and Male are indicators for when the ask is expected, the information provided isunavoidable, the information provided is avoidable, and the participant is male. Controls includeindicators for each individual’s day that they voted during the contest, selected animal groups, andprevious supporters.
29

Table A.4: By type of supporter, viewing behavior regressions
Linear probability model of OLS of TimeReveal Information Viewing Information
(1) (2) (3) (4)
Expected Ask -0.05∗∗ -0.05∗ -1.14 -1.08(0.02) (0.02) (0.95) (0.97)
Previous Supporter 0.07∗∗ 0.08∗∗∗ 3.04 3.42(0.03) (0.02) (1.79) (2.07)
Expected Ask 0.01 0.01 -1.42 -1.66*Previous Supporter (0.02) (0.03) (1.78) (1.91)
Constant 0.18∗∗∗ 0.18∗∗ 4.48∗∗∗ 2.98(0.01) (0.06) (0.60) (2.58)
Controls no yes no yesObservations 1998 1998 1998 1998Reveal rates 0.19 0.19Average times (in seconds) 5.15 5.15
∗ p < 0.10, ∗∗ p < 0.05, ∗∗∗ p < 0.01. Standard errors are clustered at the voted-foranimal group level and shown in parentheses. The results in the first panel are froma linear probability model of likelihood to reveal the information. The results in thesecond panel are from OLS regressions of seconds spent viewing the information in theAvoidable Information treatments, which equals 0 if the information is not revealed.If the information is revealed, we define the time spent viewing the information as theamount of seconds that elapses between participants clicking to reveal it and their finalclick on the page to continue to the next step (or in rare cases, their click to close thestory after choosing to reveal it). Expected Ask is an indicator for the Expected Asktreatments. Controls include indicators for each individual’s day that they voted duringthe contest, selected animal groups, and males. Data include the observations from theAvoidable Information treatments.
30
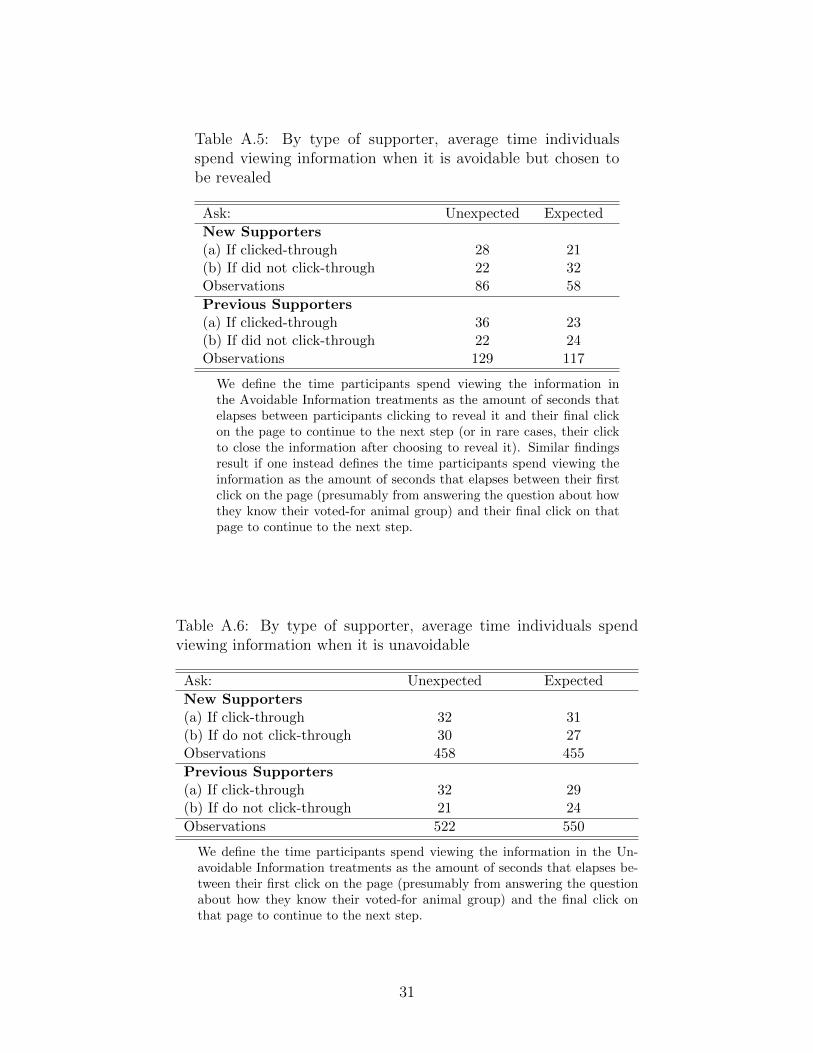
Table A.5: By type of supporter, average time individualsspend viewing information when it is avoidable but chosen tobe revealed
Ask: Unexpected Expected
New Supporters(a) If clicked-through 28 21(b) If did not click-through 22 32Observations 86 58
Previous Supporters(a) If clicked-through 36 23(b) If did not click-through 22 24Observations 129 117
We define the time participants spend viewing the information inthe Avoidable Information treatments as the amount of seconds thatelapses between participants clicking to reveal it and their final clickon the page to continue to the next step (or in rare cases, their clickto close the information after choosing to reveal it). Similar findingsresult if one instead defines the time participants spend viewing theinformation as the amount of seconds that elapses between their firstclick on the page (presumably from answering the question about howthey know their voted-for animal group) and their final click on thatpage to continue to the next step.
Table A.6: By type of supporter, average time individuals spendviewing information when it is unavoidable
Ask: Unexpected Expected
New Supporters(a) If click-through 32 31(b) If do not click-through 30 27Observations 458 455
Previous Supporters(a) If click-through 32 29(b) If do not click-through 21 24
Observations 522 550
We define the time participants spend viewing the information in the Un-avoidable Information treatments as the amount of seconds that elapses be-tween their first click on the page (presumably from answering the questionabout how they know their voted-for animal group) and the final click onthat page to continue to the next step.
31
B Complementary Online Study
Figure B.1: Vote
Figure B.2: Treatment Manipulations
(a) Unexpected Ask (b) Expected Ask
32

Figure B.3: Donation Decision
33