financing transport capacity in the united...
TRANSCRIPT
Financing transport capacity in the United States
Is experience elsewhere useful?
Presentation to Minnesota Agri-growth CouncilMinneapolis, MNMarch 21, 2002
Louis S. ThompsonRailways AdviserThe World Bankhttp://www.worldbank.org/transport/rl_over.htm

Freight demand growth in the U.S.
Demand has grown steadily for truck and railThe relationship of transportation demand to GDP is strong, but a chicken and egg issueLimited potential for modal shiftsLimited effect of electronic data versus freight movement
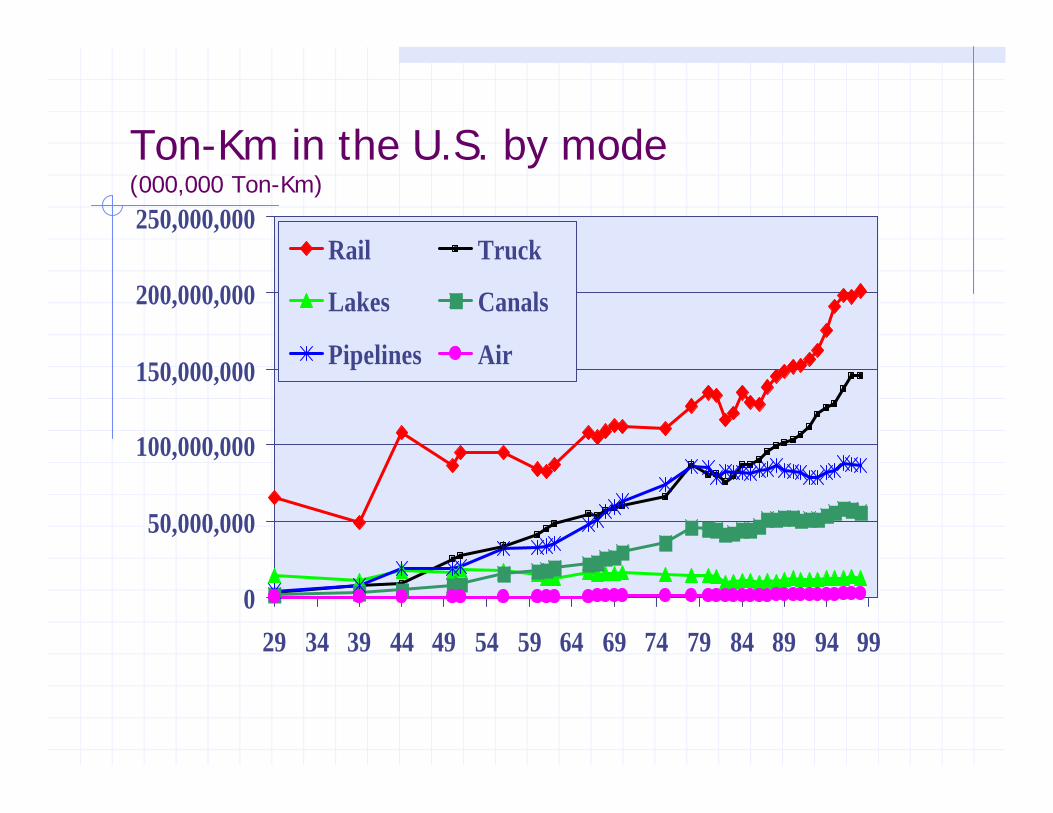
Ton-Km in the U.S. by mode(000,000 Ton-Km)
0
50,000,000
100,000,000
150,000,000
200,000,000
250,000,000
29 34 39 44 49 54 59 64 69 74 79 84 89 94 99
Rail Truck
Lakes Canals
Pipelines Air
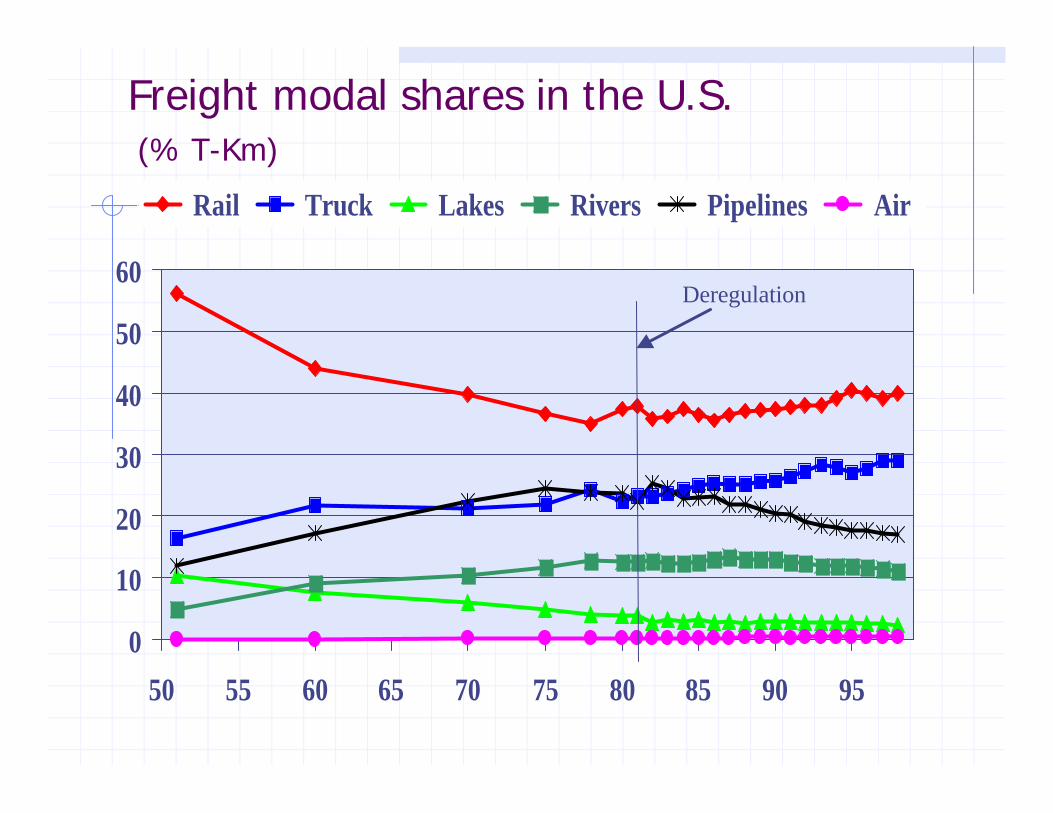
Freight modal shares in the U.S.(% T-Km)
0
10
20
30
40
50
60
50 55 60 65 70 75 80 85 90 95
Rail Truck Lakes Rivers Pipelines Air
Deregulation
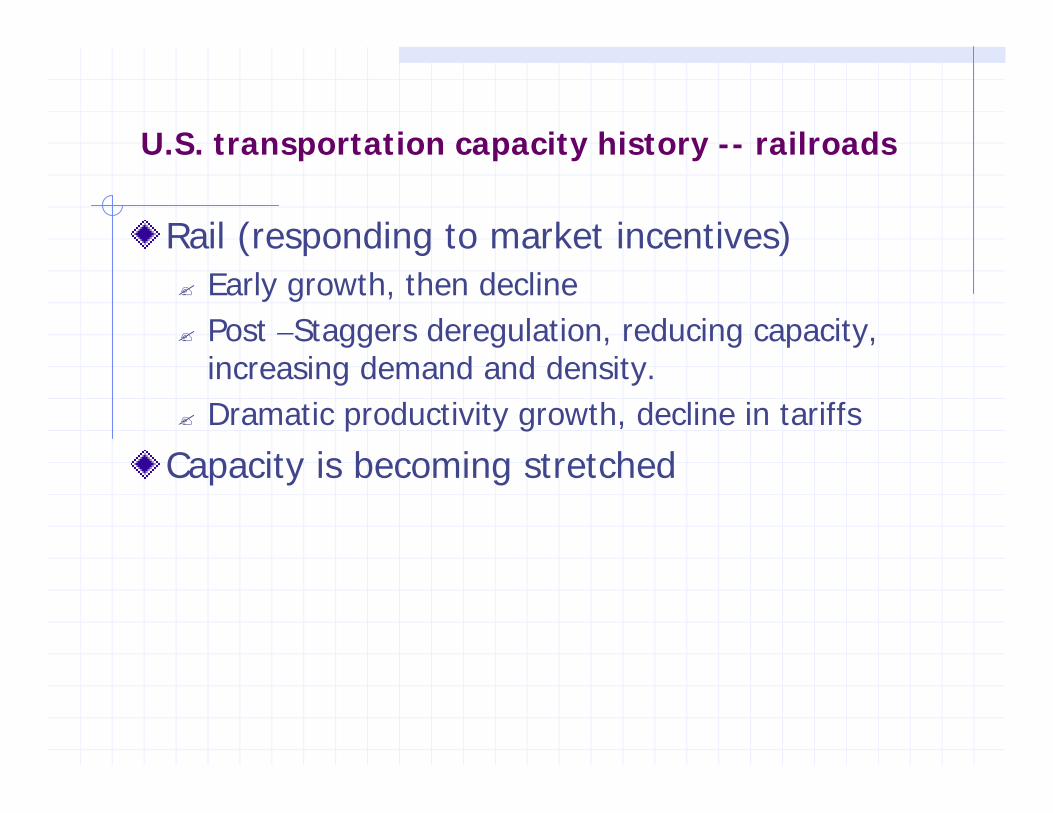
U.S. transportation capacity history -- railroads
Rail (responding to market incentives)? Early growth, then decline? Post –Staggers deregulation, reducing capacity,
increasing demand and density.? Dramatic productivity growth, decline in tariffs
Capacity is becoming stretched
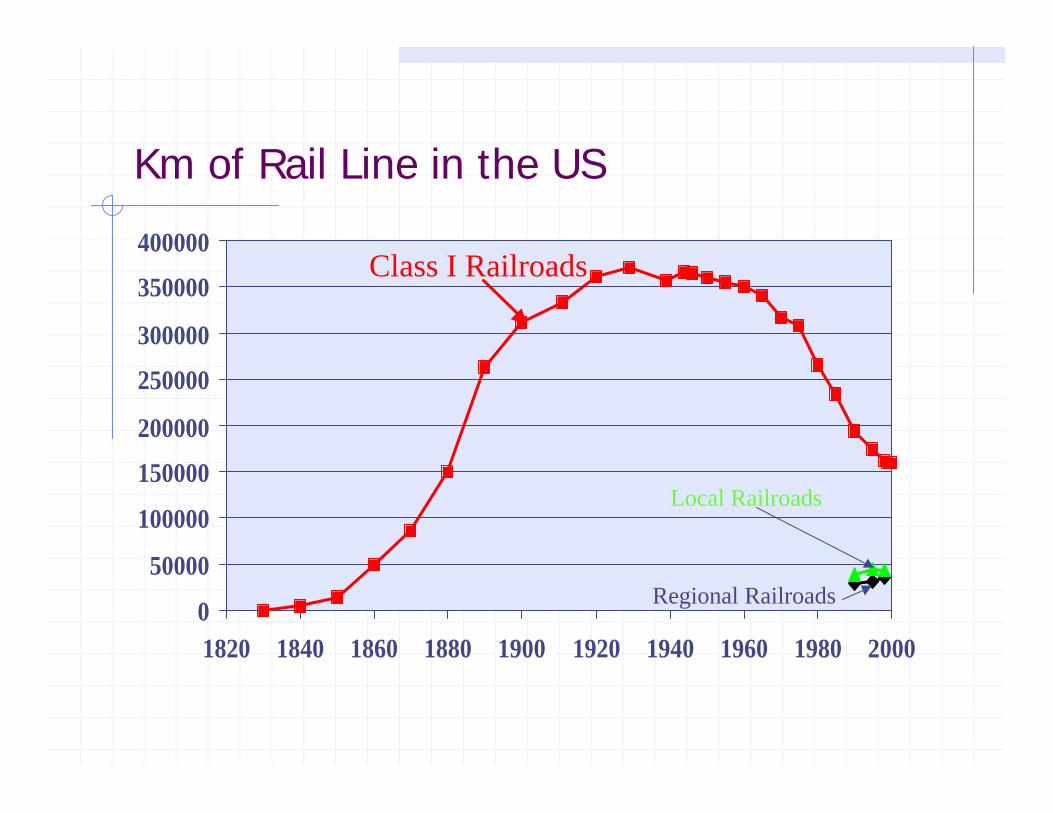
Km of Rail Line in the US
0
50000
100000
150000
200000
250000
300000
350000
400000
1820 1840 1860 1880 1900 1920 1940 1960 1980 2000
Class I Railroads
Local Railroads
Regional Railroads
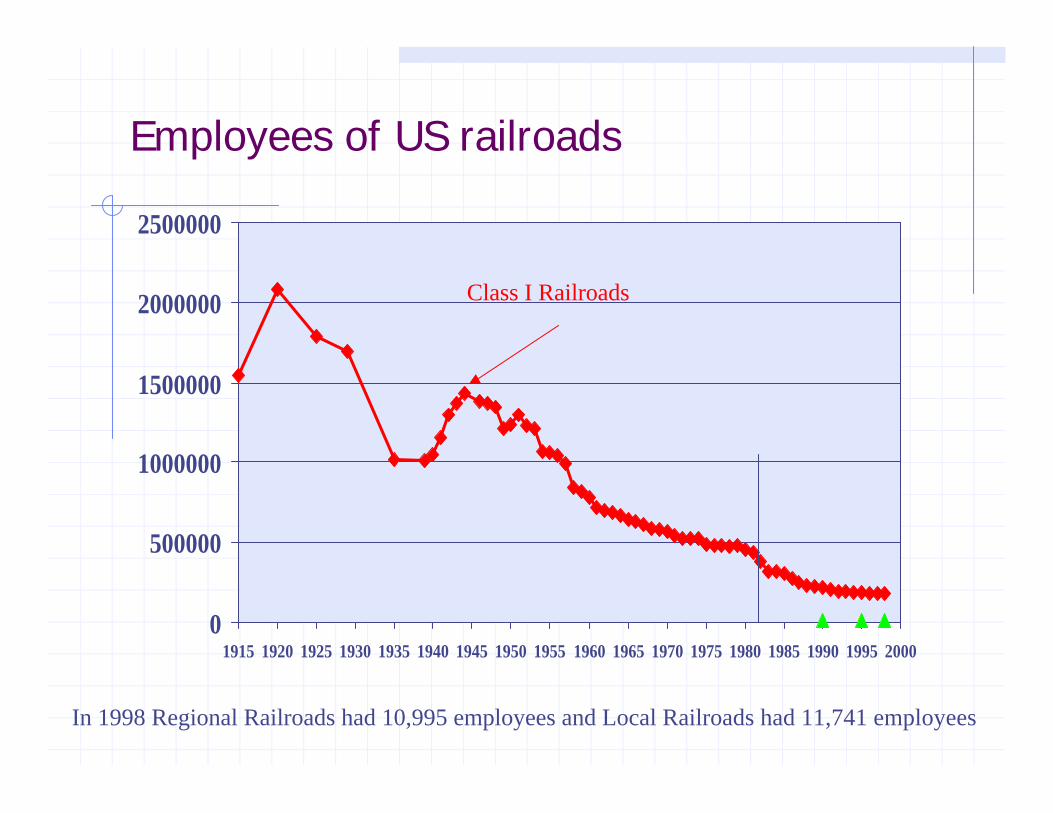
Employees of US railroads
0
500000
1000000
1500000
2000000
2500000
1915 1920 1925 1930 1935 1940 1945 1950 1955 1960 1965 1970 1975 1980 1985 1990 1995 2000
Class I Railroads
In 1998 Regional Railroads had 10,995 employees and Local Railroads had 11,741 employees
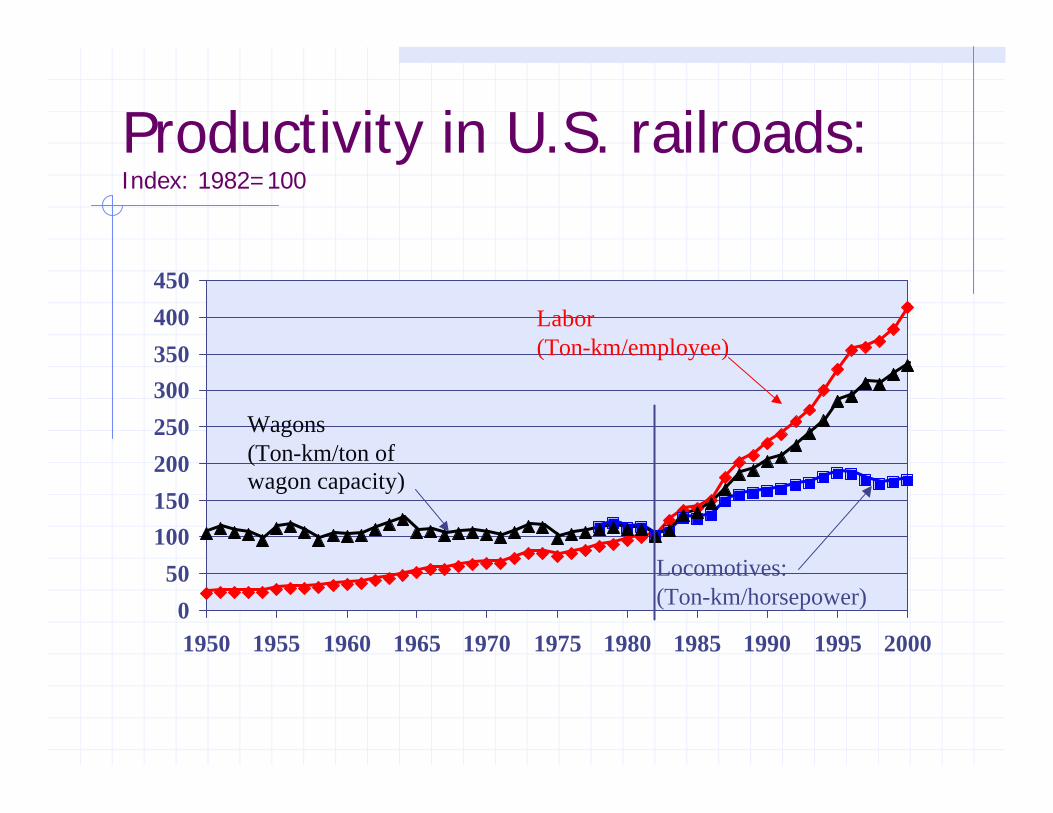
Productivity in U.S. railroads:Index: 1982=100
0
50
100150
200
250
300350
400
450
1950 1955 1960 1965 1970 1975 1980 1985 1990 1995 2000
Labor(Ton-km/employee)
Wagons(Ton-km/ton of wagon capacity)
Locomotives:(Ton-km/horsepower)

US rail freight revenue(US cents/ton-km)
0
0.5
1
1.5
2
2.5
3
3.5
1970 1975 1980 1985 1990 1995 2000
Constant 1988 dollars
Current dollars
Source: AAR Handbooks of Railroad facts, various years
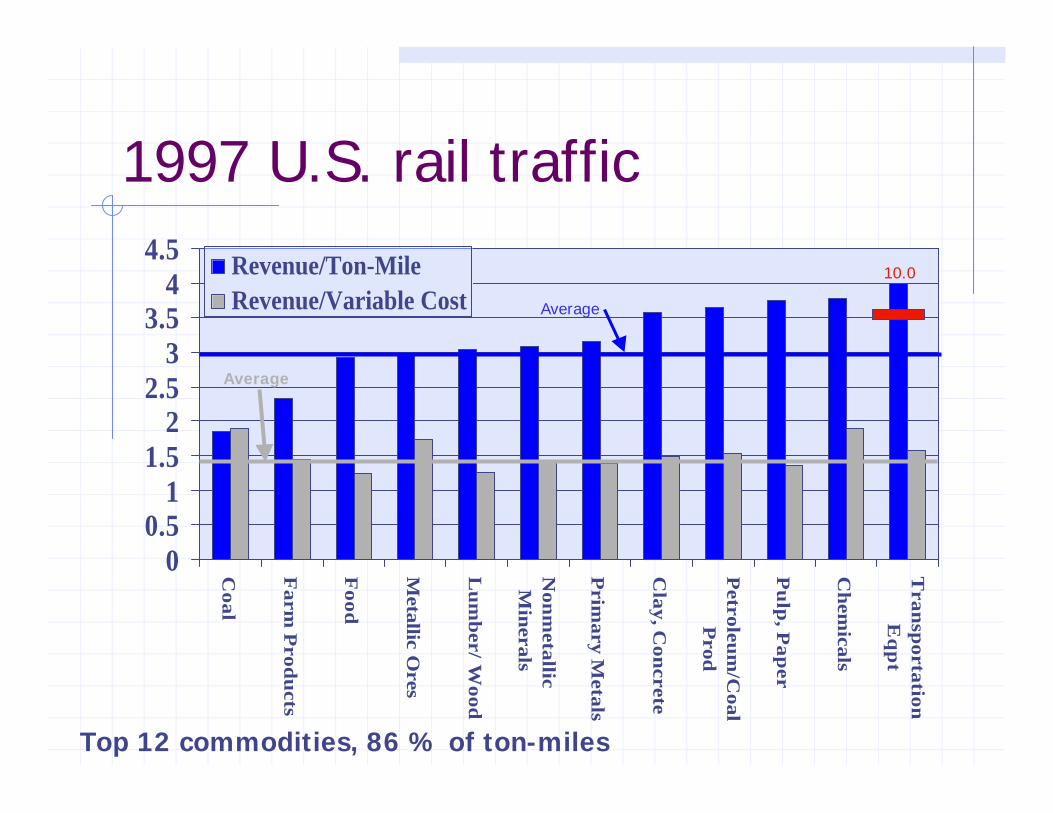
1997 U.S. rail traffic
Top 12 commodities, 86 % of ton-miles
00.5
11.5
22.5
33.5
44.5
Coal
Farm
Prod
ucts
Food
Metallic O
res
Lu
mb
er/ Wood
Non
metallic
Min
erals
Prim
ary Metals
Clay, C
oncrete
Petroleu
m/C
oalP
rod
Pu
lp, P
aper
Ch
emicals
Tran
sportation
Eq
pt
Revenue/Ton-MileRevenue/Variable Cost
10.0
Average
Average
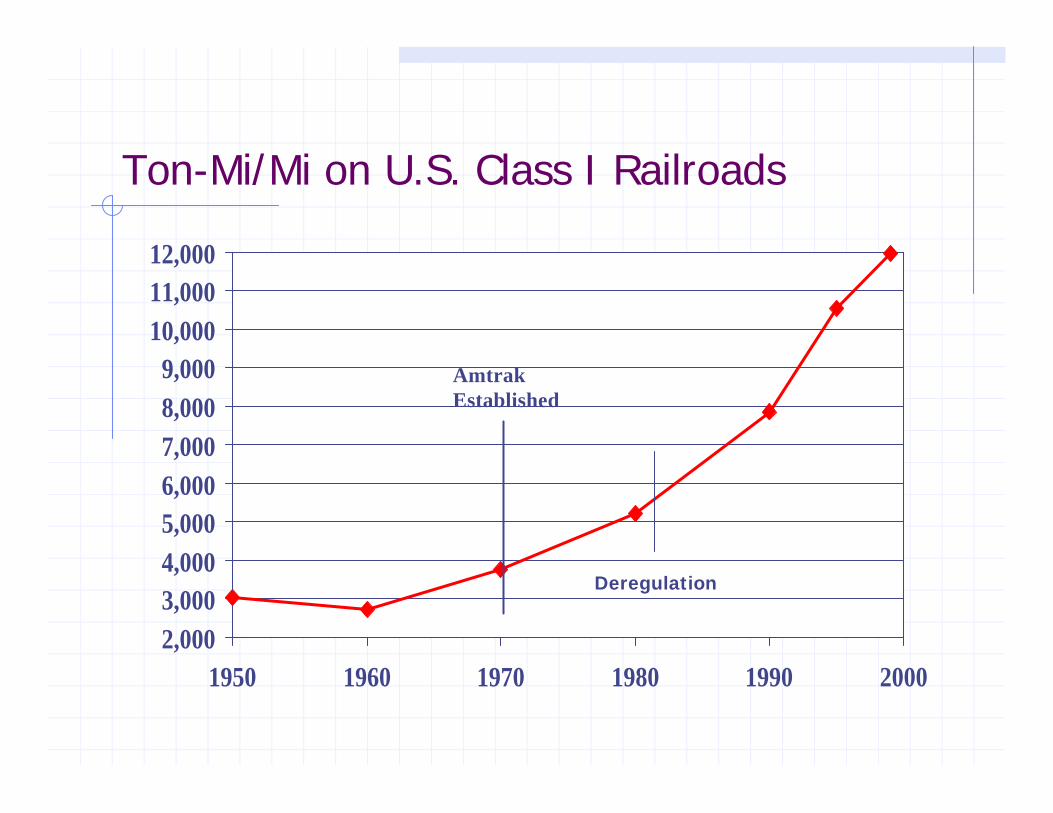
Ton-Mi/Mi on U.S. Class I Railroads
2,0003,0004,0005,0006,0007,0008,0009,000
10,00011,00012,000
1950 1960 1970 1980 1990 2000
AmtrakEstablished
Deregulation

Average U.S. freight train speed (mph)
1516171819202122232425
1945 1950 1955 1960 1965 1970 1975 1980 1985 1990 1995 2000
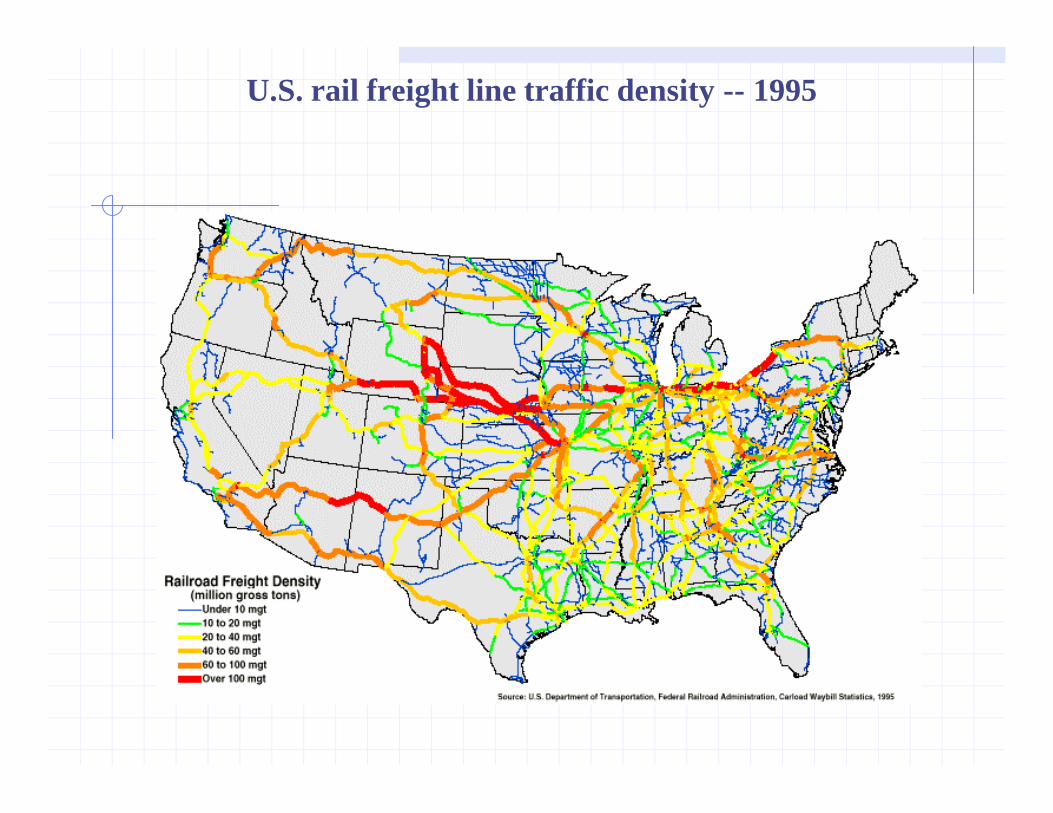
U.S. rail freight line traffic density -- 1995
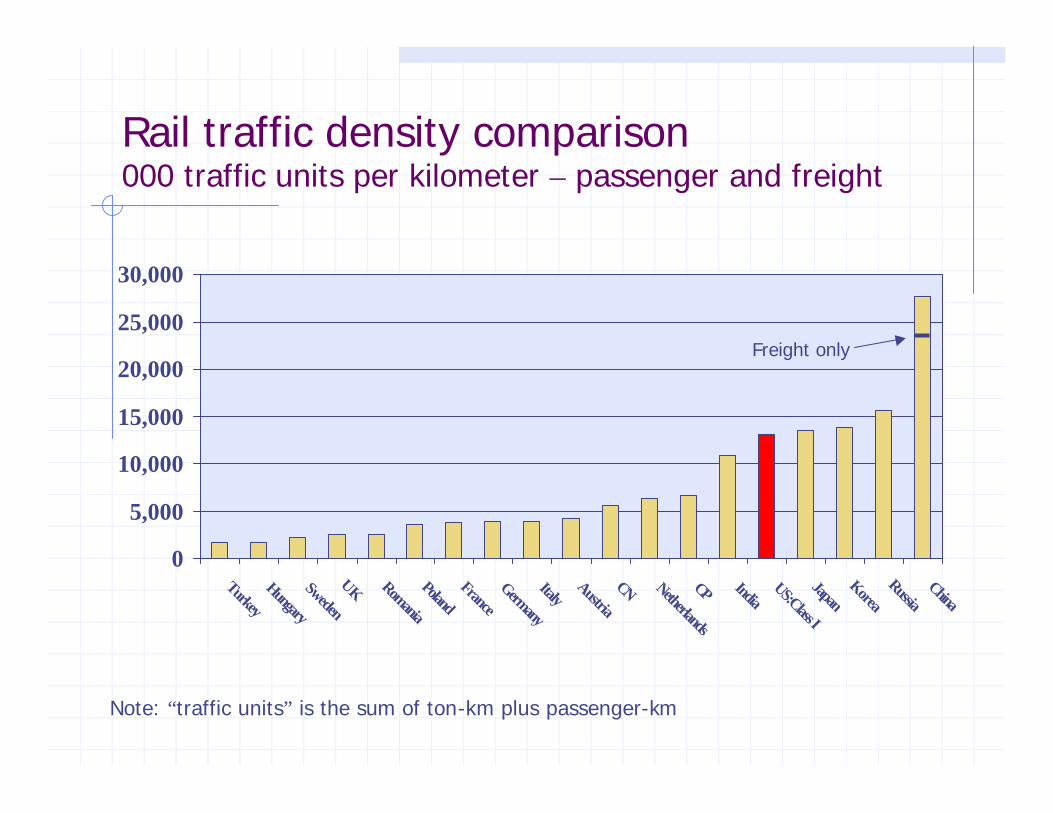
Rail traffic density comparison000 traffic units per kilometer – passenger and freight
0
5,000
10,000
15,000
20,000
25,000
30,000
Turkey
Hungary
Sweden
UK Romania
Poland France
Germany
Italy Austria
CN Netherlands
CP India US:Class I
JapanKorea
Russia China
Freight only
Note: “traffic units” is the sum of ton-km plus passenger-km
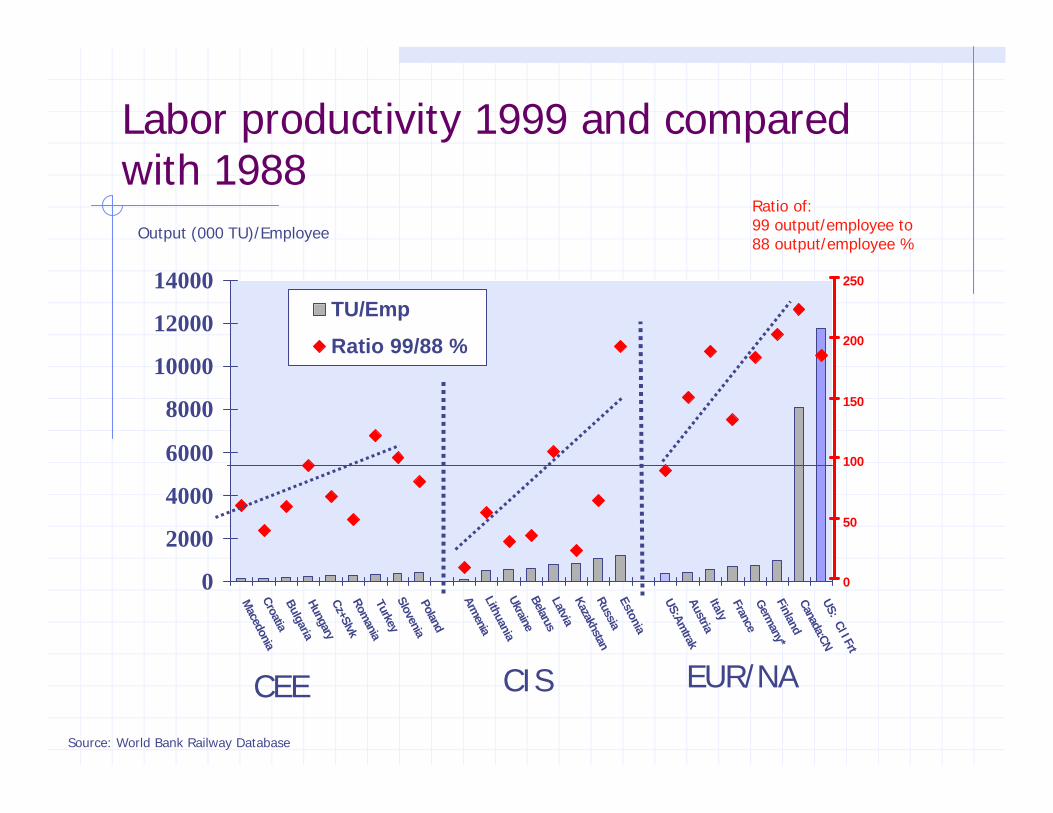
Labor productivity 1999 and compared with 1988
0
2000
4000
6000
8000
10000
12000
14000
Macedonia
Croatia Bulgaria Hungary Cz+Slvk Rom
ania TurkeySlovenia Poland
Armenia
LithuaniaUkraineBelarusLatviaKazakhstanRussiaEstonia
US:Amtrak
Austria Italy France G
ermany*
Finland Canada:CN US: Cl I Frt
0
50
100
150
200
250
TU/Emp
Ratio 99/88 %
Output (000 TU)/Employee
Ratio of:99 output/employee to88 output/employee %
CEE CIS EUR/NA
Source: World Bank Railway Database
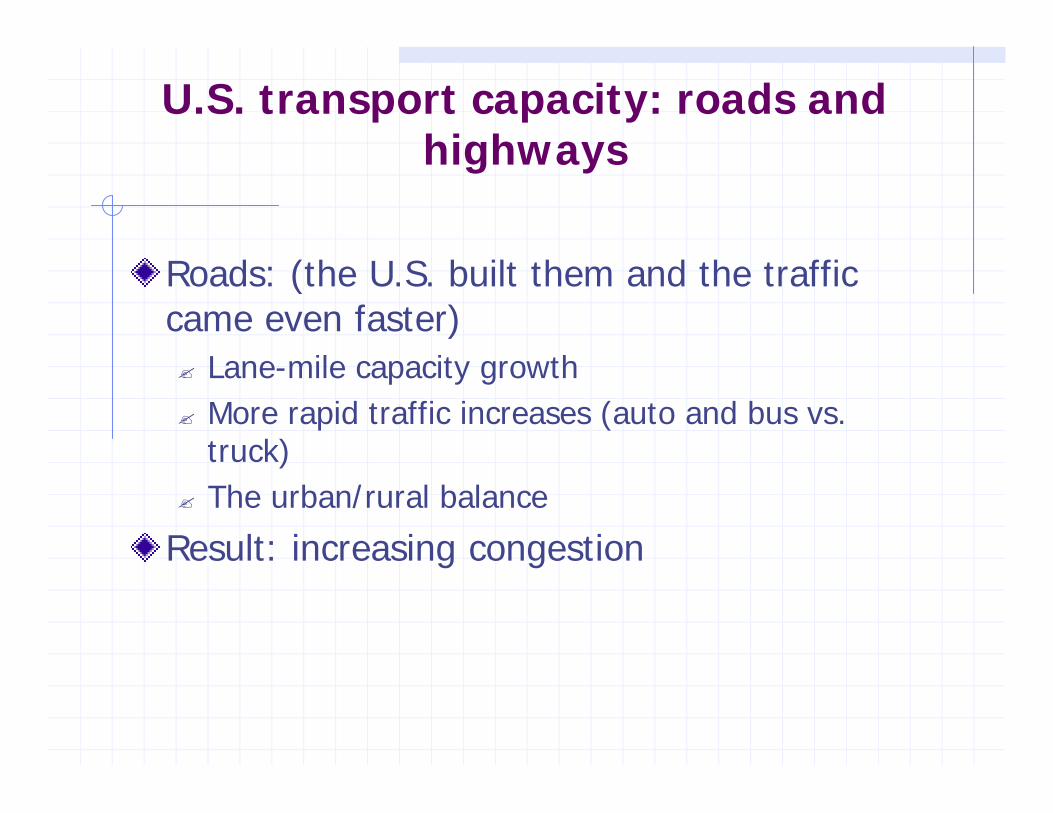
U.S. transport capacity: roads and highways
Roads: (the U.S. built them and the traffic came even faster)? Lane-mile capacity growth? More rapid traffic increases (auto and bus vs.
truck)? The urban/rural balance
Result: increasing congestion

Lane-miles of major highways in the U.S.
100,000200,000300,000400,000500,000600,000700,000800,000900,000
1,000,0001,100,0001,200,0001,300,000
1980 1985 1990 1995 2000
InterstatesOther ArterialsTotal
Source: National Transportation Statistics 2000
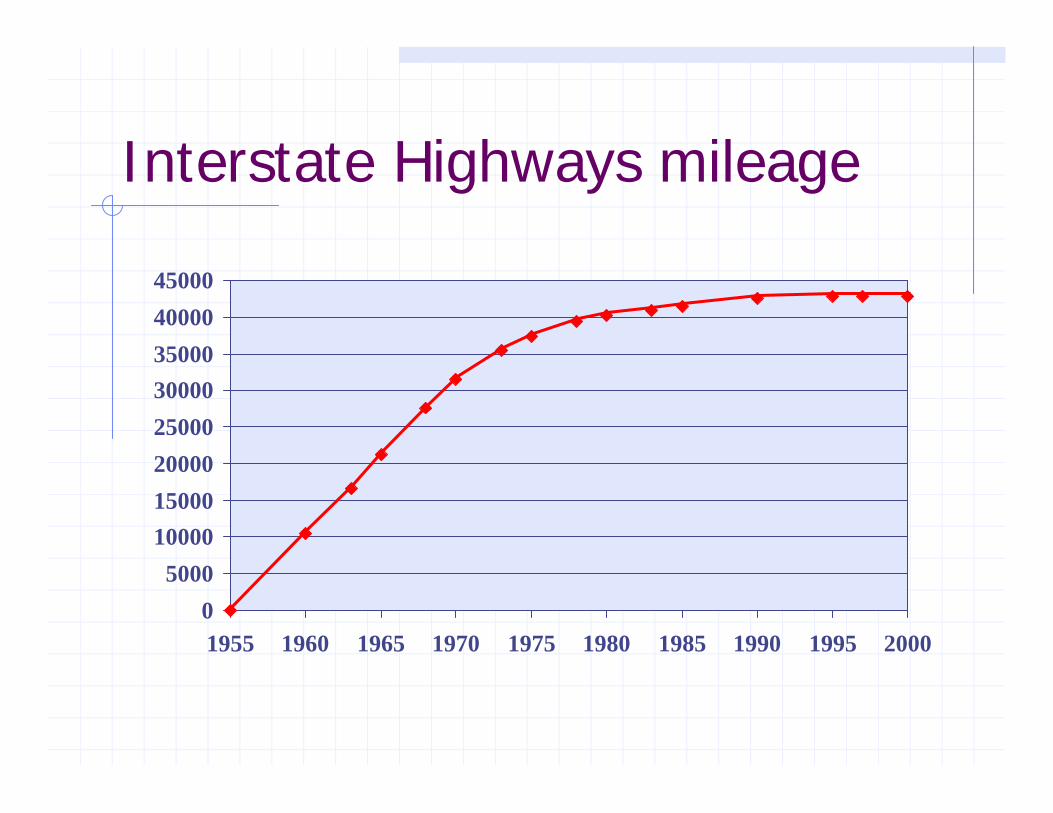
Interstate Highways mileage
0
5000
1000015000
20000
25000
3000035000
40000
45000
1955 1960 1965 1970 1975 1980 1985 1990 1995 2000
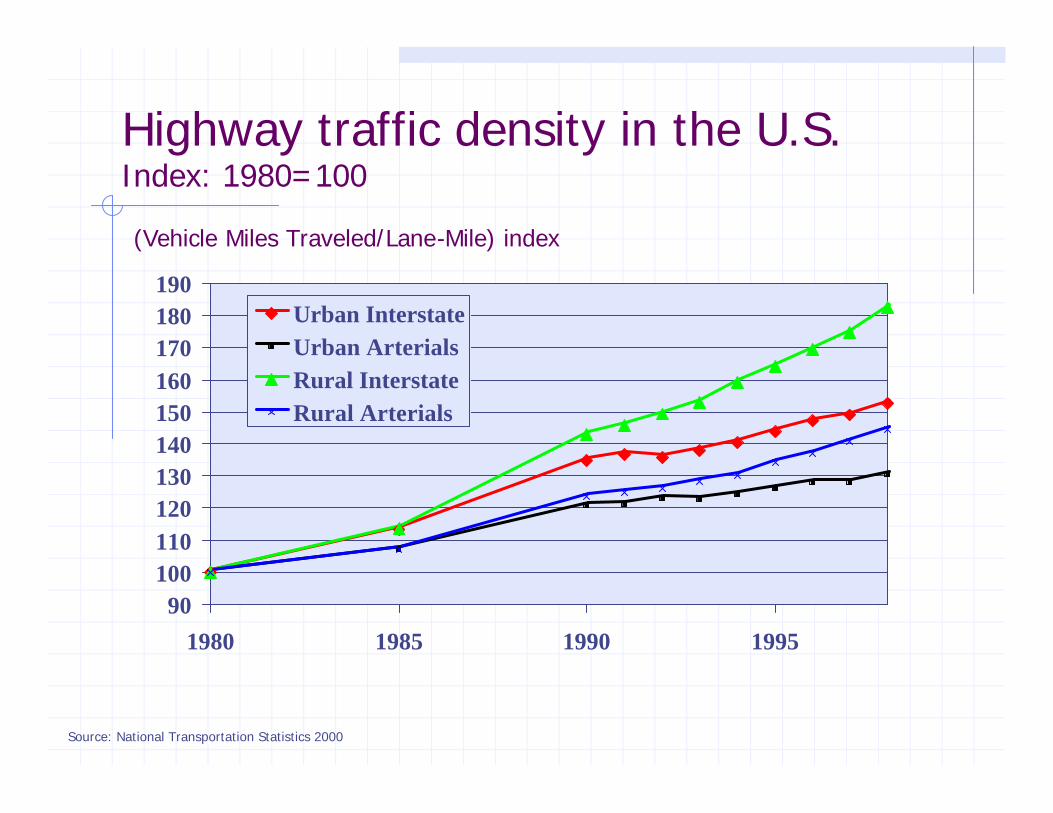
Highway traffic density in the U.S.Index: 1980=100
90100110120130140150160170180190
1980 1985 1990 1995
Urban InterstateUrban ArterialsRural InterstateRural Arterials
(Vehicle Miles Traveled/Lane-Mile) index
Source: National Transportation Statistics 2000
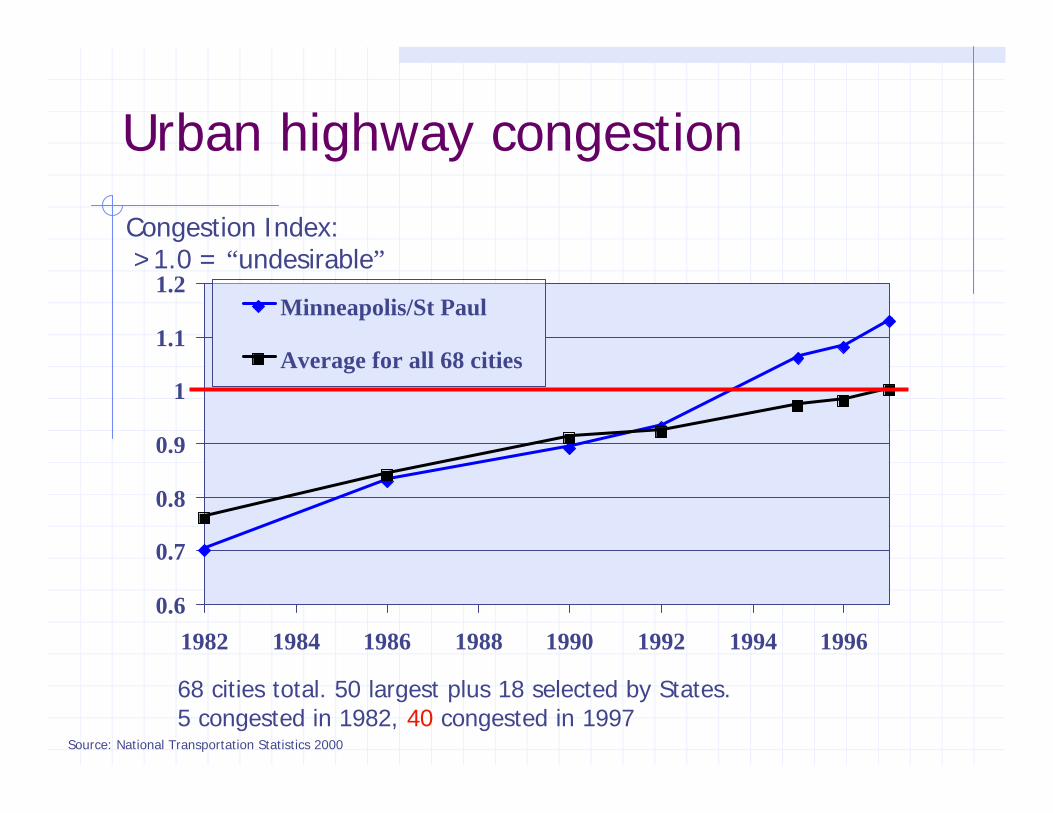
Urban highway congestion
0.6
0.7
0.8
0.9
1
1.1
1.2
1982 1984 1986 1988 1990 1992 1994 1996
Minneapolis/St Paul
Average for all 68 cities
Congestion Index:>1.0 = “undesirable”
68 cities total. 50 largest plus 18 selected by States.5 congested in 1982, 40 congested in 1997
Source: National Transportation Statistics 2000
Financing issues: past and future
How the U.S. financed transport capacity in the pastTransport financing in U.S. compared with elsewhereThe various degrees of cross subsidy

Balance of U.S. transportation spending in 1998
-120,000
-100,000
-80,000
-60,000
-40,000
-20,000
0
20,000
40,000
60,000
80,000
Ch
arg
es
Sp
end
ing
Net
Ch
arg
es
Sp
end
ing
Net
Ch
arg
es
Sp
end
ing
Net
Ch
arg
es
Sp
end
ing
Net
Ch
arg
es
Sp
end
ing
Net
StateFederal
Highways
Air
Transit
Water
Rail

Average highway user charge revenue: U.K. compared to U.S.(US cents per vehicle mile)
05
101520253035404550
Auto Light trucks Heavy trucks
UKUS
Source: Sansom, Nash, Mackie, et al, “Surface Transport Costs and Charges, Great Britain, 1998And, Addendum to the 1997 Federal Highway Cost Allocation Study, May, 2000
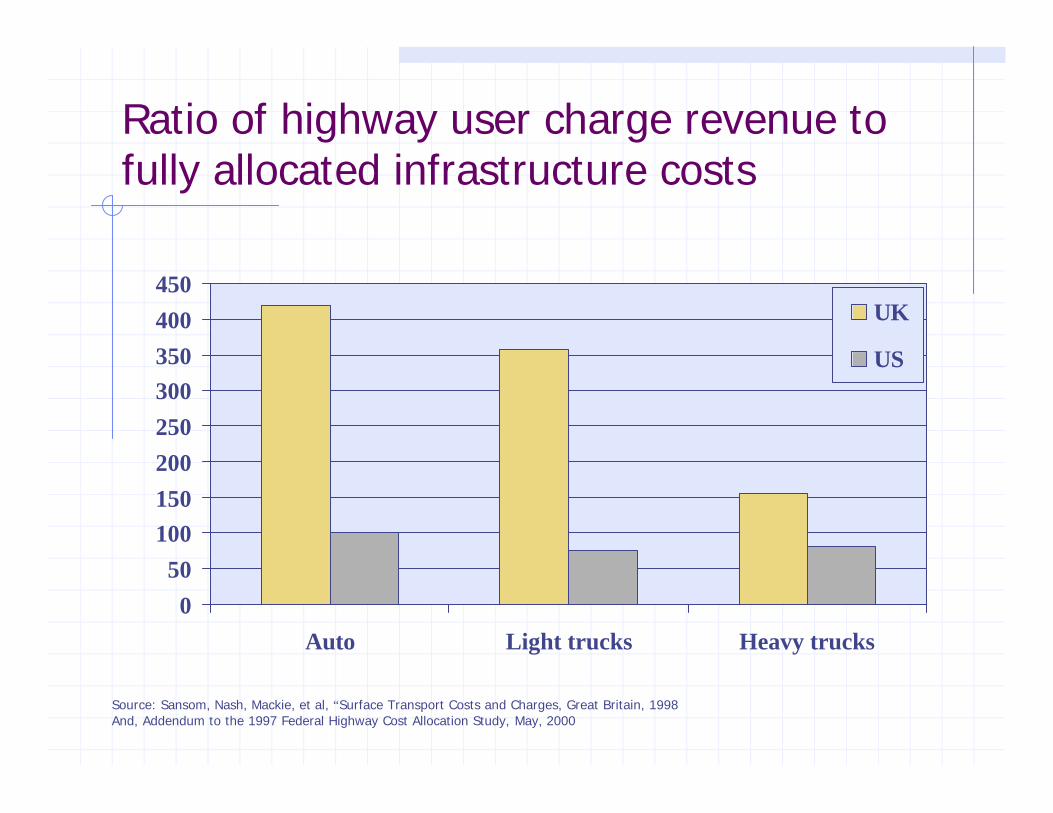
Ratio of highway user charge revenue to fully allocated infrastructure costs
050
100150200250300350400450
Auto Light trucks Heavy trucks
UK
US
Source: Sansom, Nash, Mackie, et al, “Surface Transport Costs and Charges, Great Britain, 1998And, Addendum to the 1997 Federal Highway Cost Allocation Study, May, 2000

Financing capacity in the future:barriers
What can the U.S. afford?? Railroads? Highways
Getting prices right, for capacity and for environmental effectsFunding and administrative barriers (FAA and air traffic control, Corps of Engineers, funding fences)A better public/private balance? Public investment in private rail infrastructure?? Private investment in highway infrastructure?
New technology (road pricing, intelligent vehicles, rail signaling and electrification): does or can it promote efficiency and increase capacity?
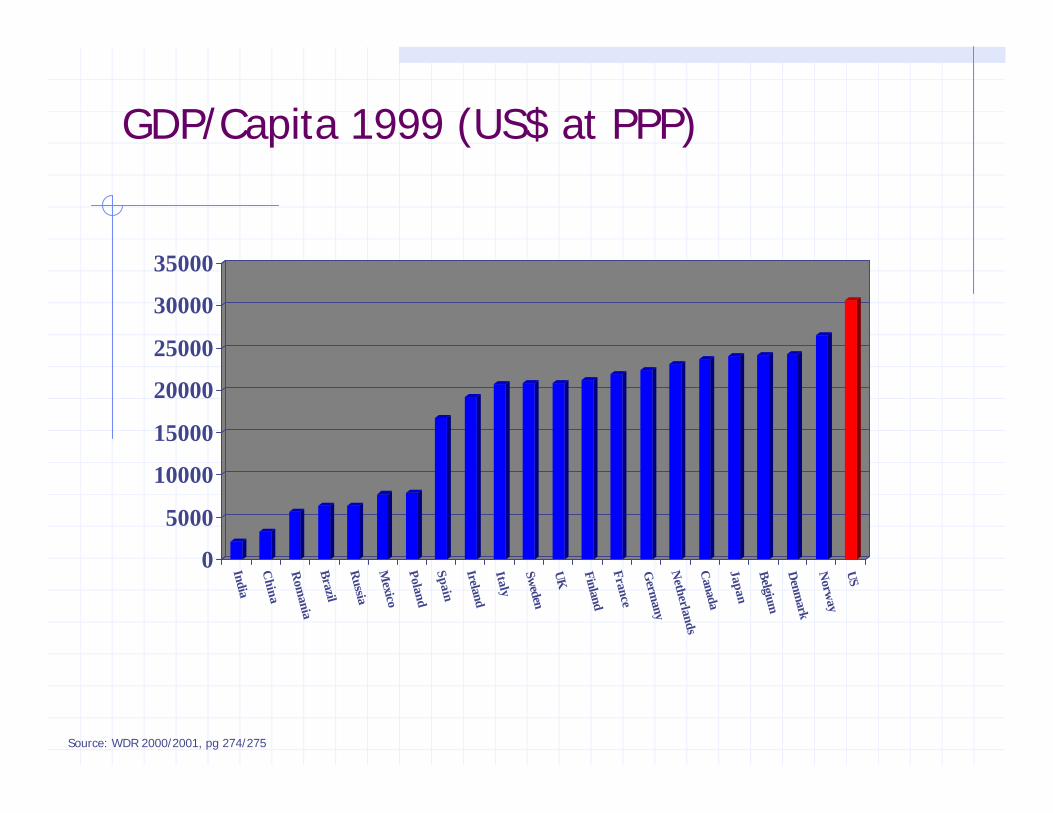
GDP/Capita 1999 (US$ at PPP)
0
5000
10000
15000
20000
25000
30000
35000
India
China
Rom
aniaB
razil
Russia
Mexico
Poland
Spain
Ireland
Italy
Sweden
UK Finland
France
Germ
anyN
etherlandsC
anada
Japan
Belgium
Denm
ark
Norw
ayUS
Source: WDR 2000/2001, pg 274/275

Class I railroad investment in track as % of total investment
3035404550556065707580
1978 1980 1982 1984 1986 1988 1990 1992 1994 1996 1998
Accounting Change
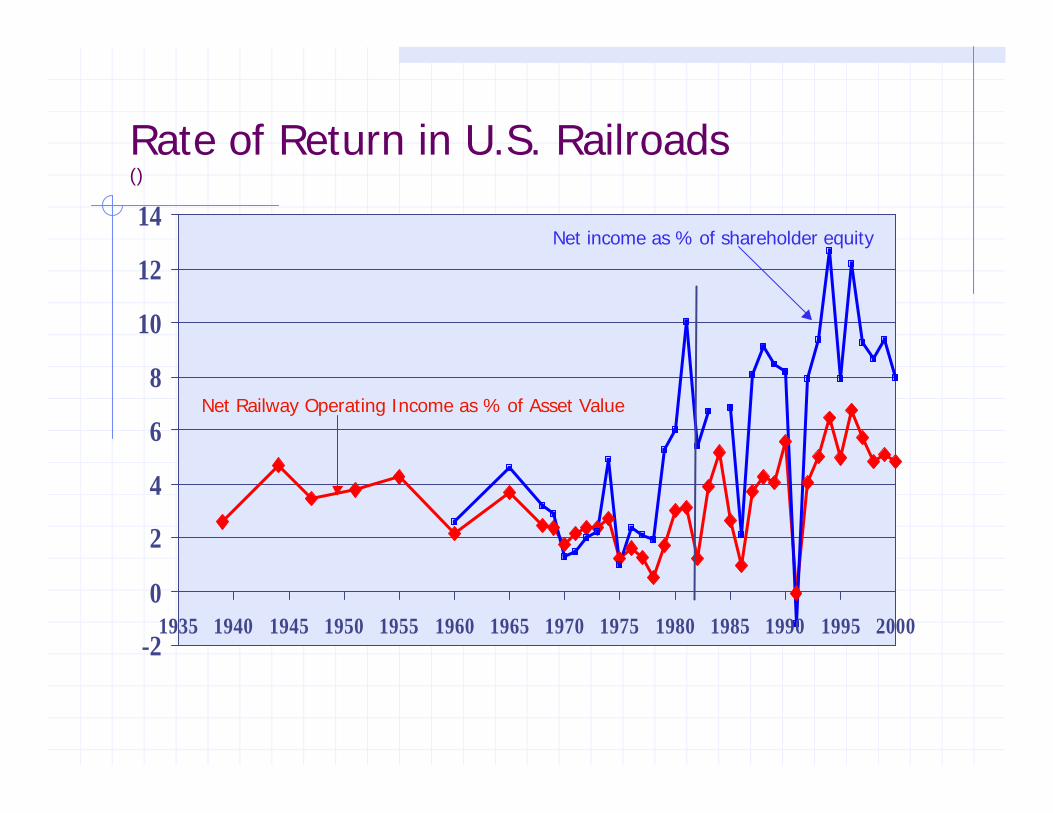
Rate of Return in U.S. Railroads()
-2
0
2
4
6
8
10
12
14
1935 1940 1945 1950 1955 1960 1965 1970 1975 1980 1985 1990 1995 2000
Net Railway Operating Income as % of Asset Value
Net income as % of shareholder equity
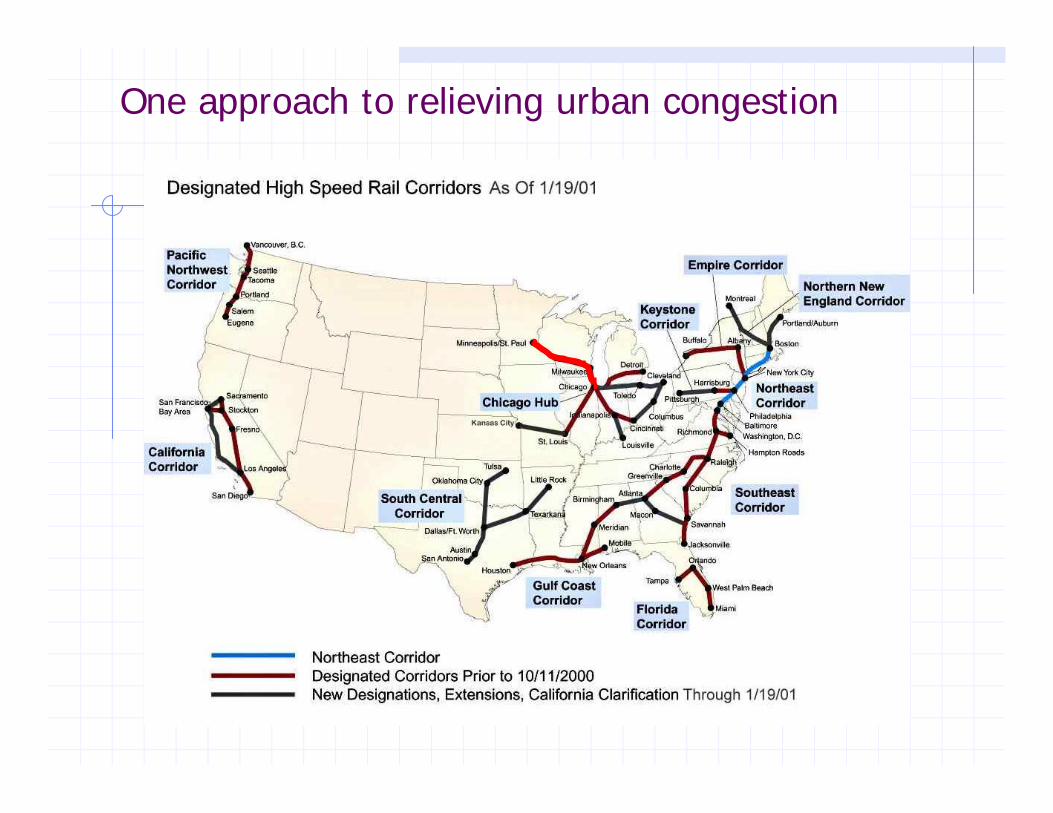
One approach to relieving urban congestion
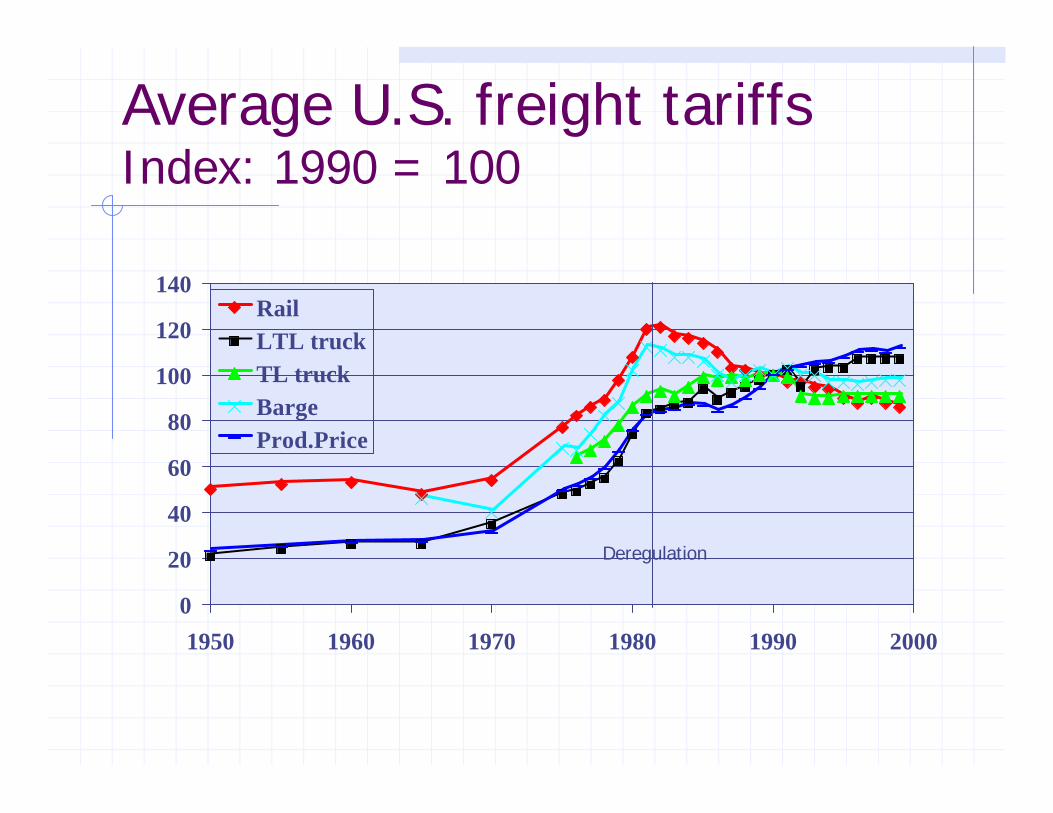
Average U.S. freight tariffsIndex: 1990 = 100
0
20
40
60
80
100
120
140
1950 1960 1970 1980 1990 2000
RailLTL truckTL truckBargeProd.Price
Deregulation
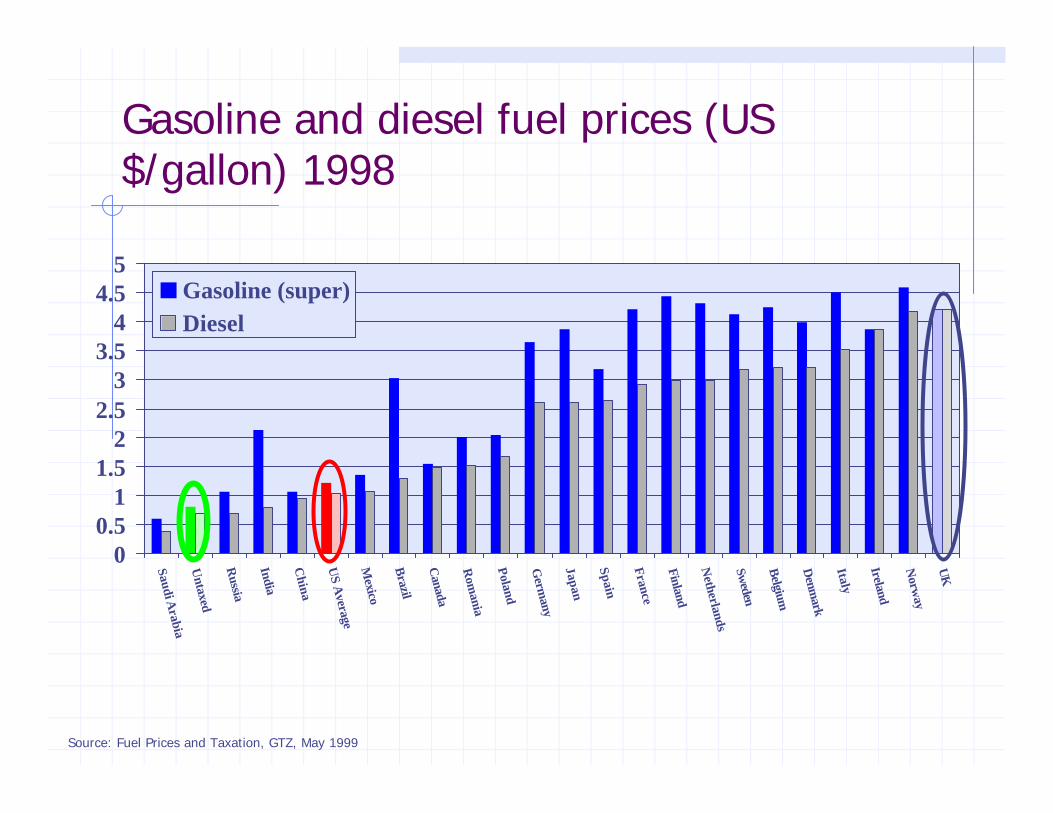
Gasoline and diesel fuel prices (US $/gallon) 1998
00.5
11.5
22.5
33.5
44.5
5
Saudi Arabia
Untaxed
Russia
India
China
US A
verageM
exico
Brazil
Canada
Rom
ania
Poland
Germ
any
Japan
Spain
France
Finland
Netherlands
Sweden
Belgium
Denm
ark
Italy
Ireland
Norw
ay
UK
Gasoline (super)Diesel
Source: Fuel Prices and Taxation, GTZ, May 1999
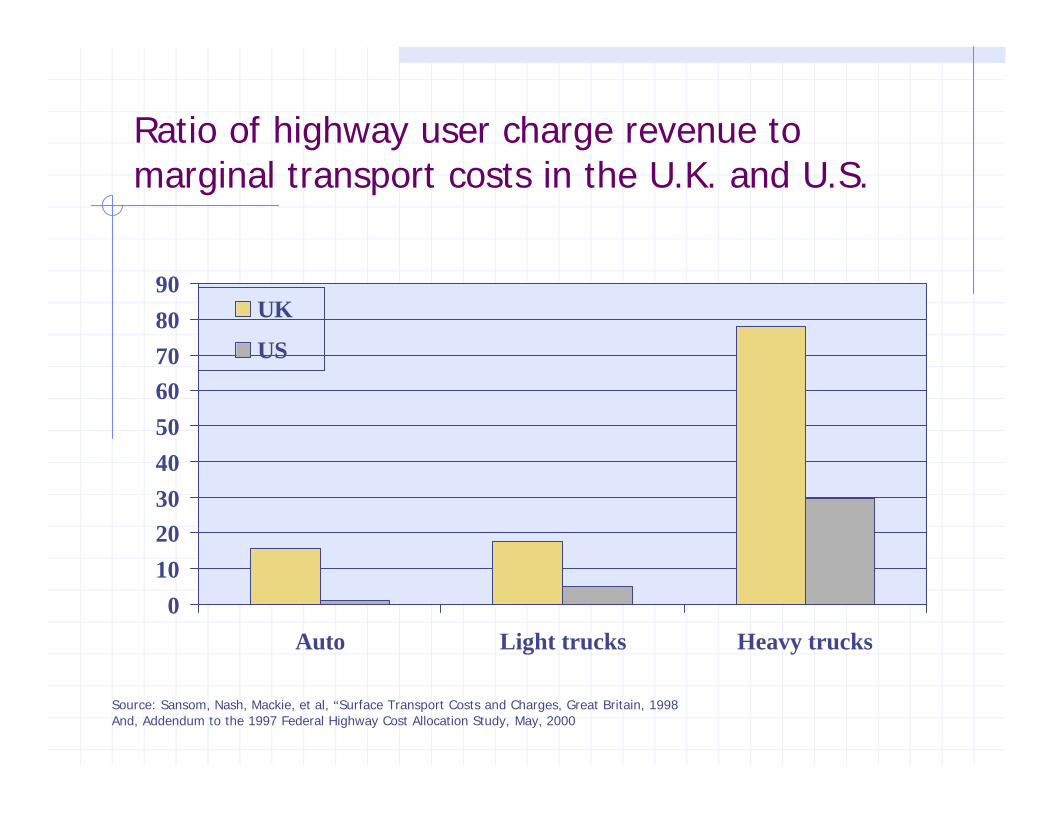
Ratio of highway user charge revenue to marginal transport costs in the U.K. and U.S.
0102030405060708090
Auto Light trucks Heavy trucks
UK
US
Source: Sansom, Nash, Mackie, et al, “Surface Transport Costs and Charges, Great Britain, 1998And, Addendum to the 1997 Federal Highway Cost Allocation Study, May, 2000
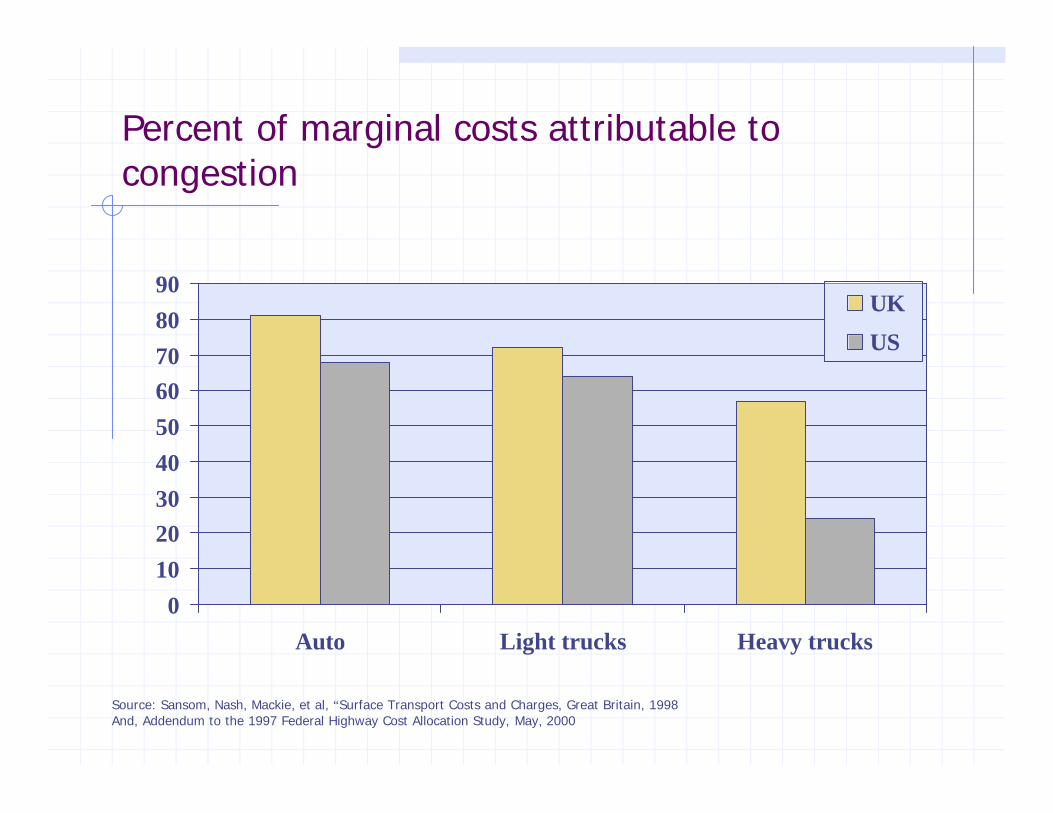
Percent of marginal costs attributable to congestion
0102030405060708090
Auto Light trucks Heavy trucks
UK
US
Source: Sansom, Nash, Mackie, et al, “Surface Transport Costs and Charges, Great Britain, 1998And, Addendum to the 1997 Federal Highway Cost Allocation Study, May, 2000