financing education: opportunities for global action · financing education: opportunities for...
TRANSCRIPT
Liesbet SteerKatie SmithJuly 2015
Financing education: Opportunities for global action
The Brookings Institution is a private non-profit organization. Its mission is to conduct high-quality, independent
research and, based on that research, to provide innovative, practical recommendations for policymakers and the
public. The conclusions and recommendations of any Brookings publication are solely those of its author(s), and
do not reflect the views of the Institution, its management, or its other scholars.
Brookings recognizes that the value it provides is in its absolute commitment to quality, independence and impact.
Activities supported by its donors reflect this commitment and the analysis and recommendations are not deter-
mined or influenced by any donation.
Liesbet Steer is a fellow with the Center for Universal Education at the Brookings Institution.
Katie Smith is a research analyst with the Center for Universal Education at the Brookings Institution.
ContentsAcknowledgments .............................................................................................................. 1
Executive Summary ........................................................................................................... 2Domestic Public Spending on Education: Cautious Optimism ......................................... 4Donor Financing: Early Enthusiasm but Recent Decline ................................................. 5Nonstate Financing: A Growing Source That Could Be Captured ................................... 7Financing Education in Different Country Contexts ......................................................... 8Opportunities for Action ................................................................................................ 14
Introduction ...................................................................................................................... 18
1. Domestic Public Spending on Education: Key Facts .................................................... 20Education Spending Has Been Rising in Low-Income Countries .................................. 20But Education Is Falling as a Spending Priority in Many Countries ............................... 21Public Spending Has Not Been Pro-Poor in Many Countries ........................................ 26Even When It Has Increased, Public Spending Has Often Not Resulted ....................... 29
in Sufficient Learning
2. What Investments Are Donors Making? Key Facts....................................................... 34Early Enthusiasm but Recent Decline in Aid for Education............................................ 35The Role of Multilateral Donors Is Evolving ................................................................... 42The Potential for Growing New Sources of External Public Finance ............................. 46Education Aid Is Fragmented and Insufficiently Aligned with Needs ............................. 49The Growing Interest in Financing Mechanisms That Can Achieve Better Results ........ 57
and Catalyze Other Sources of Finance
3. Private Development Assistance: Key Facts ................................................................ 60Private Development Assistance Is Growing, but Education Is ...................................... 61
Insufficiently PrioritizedA Large Share of Nonstate Financing for Education Is Fragmented and ....................... 63
Not Focused on Areas of Highest NeedPrivate Development Assistance Is Taking New Forms ................................................. 64The Growing Engagement of Nonstate Actors in Delivery Is Raising Questions ........... 66
about Their RoleHouseholds Are Filling the Gaps ................................................................................... 68
4. Financing Education in Different Country Contexts ...................................................... 70Education Trends and Needs ........................................................................................ 73Financing Trends and Issues ......................................................................................... 75Implications for Financing the Post-2015 Education Goals ............................................ 79
5. Four Opportunities for Global Action ............................................................................ 85Action 1: Establish a Global Commission on Education and Financing—Making a ...... 85
Compelling Case for Investment in Education Using Evidence and High-Level Leadership
Action 2: Create a Global Platform for Coordination and Scale Up ............................... 87of External Support
Action 3: Commit to a Data Revolution in Education Linking Financing and Learning ... 91Action 4: Seize Opportunities to Mobilize and Manage Domestic Finances for ............ 94
Education
Annexes ........................................................................................................................... 97Annex 1: Projected Total Annual Cost, Domestic Public Spending and Aid for Basic .... 97
Education in 2020, per Child, constant 2012 dollarsAnnex 2: Goal 4 of the United Nations General Assembly’s Open Working Group ....... 99
on Sustainable Development Goals: Ensure Inclusive and Equitable High-Quality Education and Promote Lifelong Learning Opportunities for All
Annex 3: Methodology ................................................................................................. 101
References..................................................................................................................... 106
Acknowledgments
his study benefited hugely from consultations with numerous individuals and organizations that provided essential inputs throughout the research. Many thanks in particular to contributors to the Building Evidence in Education
(BE2) forum in Dubai in November 2014, participants of the Brookings Symposium on Non-State Actors and Education in March 2015, and the audience at the Seoul Financing for Sustainable Development Forum in the lead up to the World Education Forum in Korea in May 2015. We are also deeply grateful to the many people who were interviewed as part of the research process and to the authors of the country case studies used as inputs to this study, including Nick Hall, Maysa Jalbout, Rabea Malik, Micheal Mambo, Chinedum Nwoko, Arne Strand, Pauline Rose and Steven A. Zyck.
We would also like to thank the reviewers of the draft paper for their thoughtful guidance and critique, including Tamar Atinc, Desmond Birmingham, Julia Gillard, Karen Mundy, Jordan Naidoo, Neil O’Reilly, Olav Seim, Justin van Fleet, Rebecca Winthrop, and the World Bank Education Global Practice team (including Claudia Costin, Amit Dar, and Luis Benveniste). Their valuable comments and recommendations greatly aided our ability to capture and frame a highly nuanced topic. We are also grateful to Suzanne Steensen, Fredrik Erics-son and Guillaume Simon from the OECD-DAC for the many conversation and clarifica-tions around the OECD CRS aid statistics, the UNESCO GMR team for supplying us with country-level costing data, and Manos Antoninis and Babette Wils for explaining the costing methodology. Thanks also to the Varkey Foundation for sharing its Business Backs Educa-tion survey findings.
We are deeply grateful to Lindsay Read for her essential contributions to several chapters of the paper and in particular chapter 4 (Financing Education in Different Country Contexts). We would also like to acknowledge Boming Xie and Laura Stankiewicz for their help with data analysis and case study research.
Finally, we would like to thank the government of Norway and the U.N. Special Envoy for Global Education, Gordon Brown, for their interest in these recommendations, especially regarding the Oslo Summit on Education for Development.
This paper was supported by the William and Flora Hewlett Foundation. Brookings recog-nizes that the value it provides is in its absolute commitment to quality, independence, and impact. Activities supported by its donors reflect this commitment and the analysis and rec-ommendations are not determined or influenced by any donation. The authors disclose that the government of Norway is a funder to the Brookings Institution.
T
FinAnCing eduCAtion: opportunities For globAl ACtion
1
executive summary
t is our hope that this year will be marked in history as the year when the world agreed on an ambitious global plan to eradicate poverty and ensure that all children have access to a high-quality basic education. Achieving
these education goals will require all hands on deck. Governments, donors and nonstate actors will need to work together to deliver on this promise. Significantly more financing will be required, and resources will need to be spent in the most effective way.
We can build on substantial progress made since the beginning of the millennium. Between 1999 and 2012, the number of out-of-school children decreased from 106 million to 58 million; two-thirds more children were enrolled in primary school; gender parity im-proved, with the number of countries with fewer than 90 girls enrolled in primary school for every 100 boys falling from 33 to 16; transition and retention rates improved, and the lower secondary gross enrollment ratio increased from 71 to 85 percent. The pace of progress has accelerated compared with earlier trends, revealing the benefits gained from the increased investment in education goals over the past decade following the reaffirmation of the EFA goals and the MDGs.
However, progress has been uneven, and the remaining challenges disproportionally affect the most marginalized populations. Children in rural areas have been twice as likely as those in urban areas to never go to school; the poorest children are five times less likely to complete primary school than the richest; 36 percent of out-of-school children are in conflict affected zones; and 16 of the 20 countries furthest from reaching the Education for All goals are in Sub-Saharan Africa.
This report focuses on how a subset of the targets related to basic education—that is, that all children should complete high-quality pre-primary, primary and lower sec-ondary education1—can be financed. This focus was chosen because these basic educa-tion goals form the basis of all other goals. They have also been shown to have the highest social returns in developing countries and are likely to be the focus of the bulk of public finance in the years to come. We recognize that the financing of basic education will depend on the ex-tent to which actors can address financing constraints at higher levels of education, which are currently absorbing large shares of public resources in many countries. Solutions to increase financing for basic education need to go hand in hand with developing alternative financing options (e.g., loan programs and selective scholarships) at higher levels of education.
This report reviews the financing efforts for the education sector in developing coun-tries during the past decade and assesses what will be required in the coming years
I
FinAnCing eduCAtion: opportunities For globAl ACtion
2
to reach the basic education goals by 2030. We draw on a variety of data sources as well as five country case studies—for Afghanistan, Lebanon, Malawi, Nigeria and Pakistan. The report has been prepared with an eye to inform the Oslo Summit on Education for Develop-ment and other international meetings this year that provide a unique opportunity for political leaders and heads of donor agencies to get efforts to fulfill the promises of the United Na-tions’ new Sustainable Development Goals (SDGs) off to a motivated start.
We explore how much total spending will need to increase between now and 2020 to be on track to reach the basic education goals by 2030.2 This shorter time horizon was chosen because it is within government and donor planning cycles and is also less sensitive to potential errors in projections of revenue and spending further into the future. Using cost-ing estimates for 2020 for low-income countries (LICs) and lower-middle-income countries (LMICs) produced by the UNESCO Education for All Global Monitoring Report (GMR), as well as our own estimates for upper-middle-income countries (UMICs), we calculate that in 2020, a total annual investment of $30 billion will be required in LICs, $181 billion in LMICs and $326 billion in UMICs (excluding China) to be on track to meet the basic education goals (including pre-primary, primary and lower secondary). This report analyzes how domestic and external resources have evolved over the past decade and how, in the light of these historical trends, the required investments can be mobilized.
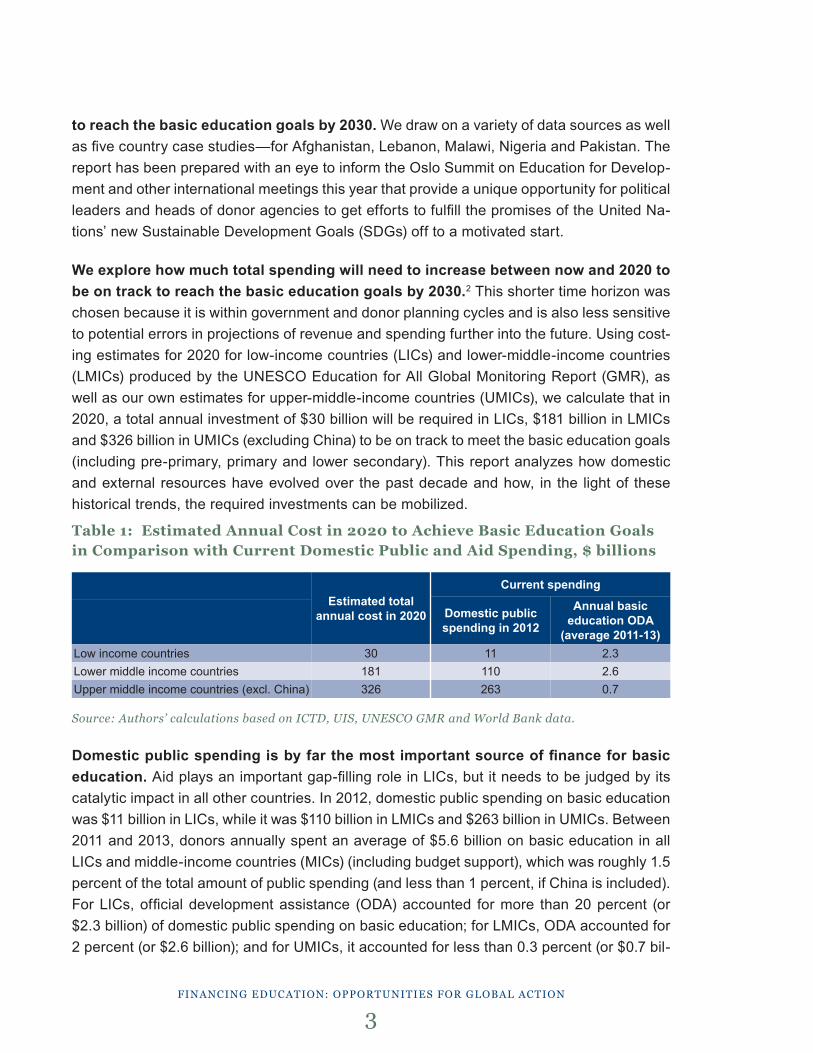
Domestic public spending is by far the most important source of finance for basic education. Aid plays an important gap-filling role in LICs, but it needs to be judged by its catalytic impact in all other countries. In 2012, domestic public spending on basic education was $11 billion in LICs, while it was $110 billion in LMICs and $263 billion in UMICs. Between 2011 and 2013, donors annually spent an average of $5.6 billion on basic education in all LICs and middle-income countries (MICs) (including budget support), which was roughly 1.5 percent of the total amount of public spending (and less than 1 percent, if China is included). For LICs, official development assistance (ODA) accounted for more than 20 percent (or $2.3 billion) of domestic public spending on basic education; for LMICs, ODA accounted for 2 percent (or $2.6 billion); and for UMICs, it accounted for less than 0.3 percent (or $0.7 bil-
FinAnCing eduCAtion: opportunities For globAl ACtion
3
Table 1: Estimated Annual Cost in 2020 to Achieve Basic Education Goals in Comparison with Current Domestic Public and Aid Spending, $ billions
Source: Authors’ calculations based on ICTD, UIS, UNESCO GMR and World Bank data.
Low income countriesLower middle income countriesUpper middle income countries (excl. China)
Estimated total annual cost in 2020
30181326
Current spending
Domestic public spending in 2012
11110263
Annual basic education ODA
(average 2011-13)2.32.60.7
lion; and less than 0.1 percent, including China). Thus, while ODA has played an important part in some LICs in terms of resource flows, in most developing country contexts it should play a catalytic role.
Domestic Public Spending on Education: Cautious OptimismIn developing countries, domestic public spending on education has been rising during the past decade. This increase has been driven by significantly improved domestic resource mobilization. On average, tax revenues have risen from 14 percent to 16 percent of gross domestic product (GDP). Building on this larger tax base, most countries have al-located a greater share of their GDP to education (on average, 4.6 percent of GDP for total education and 1.7 percent of GDP for primary education in 2012). This increasing spending is heartening.
Less encouraging, however, has been the decline in the share of revenues going to education. This suggests that growth in spending as a share of GDP has been driven by improved tax collection rather than a greater prioritization of education in overall spend-ing. These spending patterns will need to be reversed to accomplish the new and more ambitious SDGs. Comparing current spending with recent costing estimates to achieve the SDGs, we find that fewer than 15 percent of LICs and 40 percent of LMICs for which we have data spend more than the required 5.5 percent of GDP needed to meet the basic edu-cation SDGs by 2030.
The insufficient allocation of resources to education is particularly concerning given that education has been widely recognized as the top development priority. Of the more than 7.5 million people who voted in the global My World Survey, education was voted as a top development priority by more than two-thirds of respondents. Similarly, in World Bank client surveys education has consistently been identified as the top development prior-ity by 40 percent of respondents, higher than any other sector.
In addition, spending allocation patterns have been unequal and often skewed to higher levels of education and to the benefit of the well-off. A recent UNICEF study shows that in LICs, on average, 46 percent of public resources are allocated to the 10 per-cent of students who are the most educated. In LMICs the percentage is 26. Disproportion-ate allocations across levels of education tend to favor children from the wealthiest house-holds since they tend to represent a higher share of the more educated children.
In many countries, spending has also not resulted in sufficient learning. Higher spend-ing levels will be a necessary but not sufficient condition for achieving the SDGs. There is a weak positive relationship between spending per student and educational attainment, with huge variability and some countries spending more and achieving less. The interest in find-ing key investments that will break cycles of inefficiency and lead to improved quality has
FinAnCing eduCAtion: opportunities For globAl ACtion
4
skyrocketed in recent years, resulting in the production of dozens of experimental studies. However, there is a growing recognition that particular interventions that fix particular prob-lems are not enough and that more attention to systemic reform is urgently needed in a num-ber of areas, including education system management, teacher training and support, and accountability. There is also a need for more evidence on how countries have successfully improved learning outcomes and overcome barriers to system-level reform. New research programs on improving systems of education are welcome in this respect—such as the mul-tiyear RISE program, funded by the UK Department for International Development (DFID), and the World Bank’s Systems Approach for Better Education Results (SABER) program.
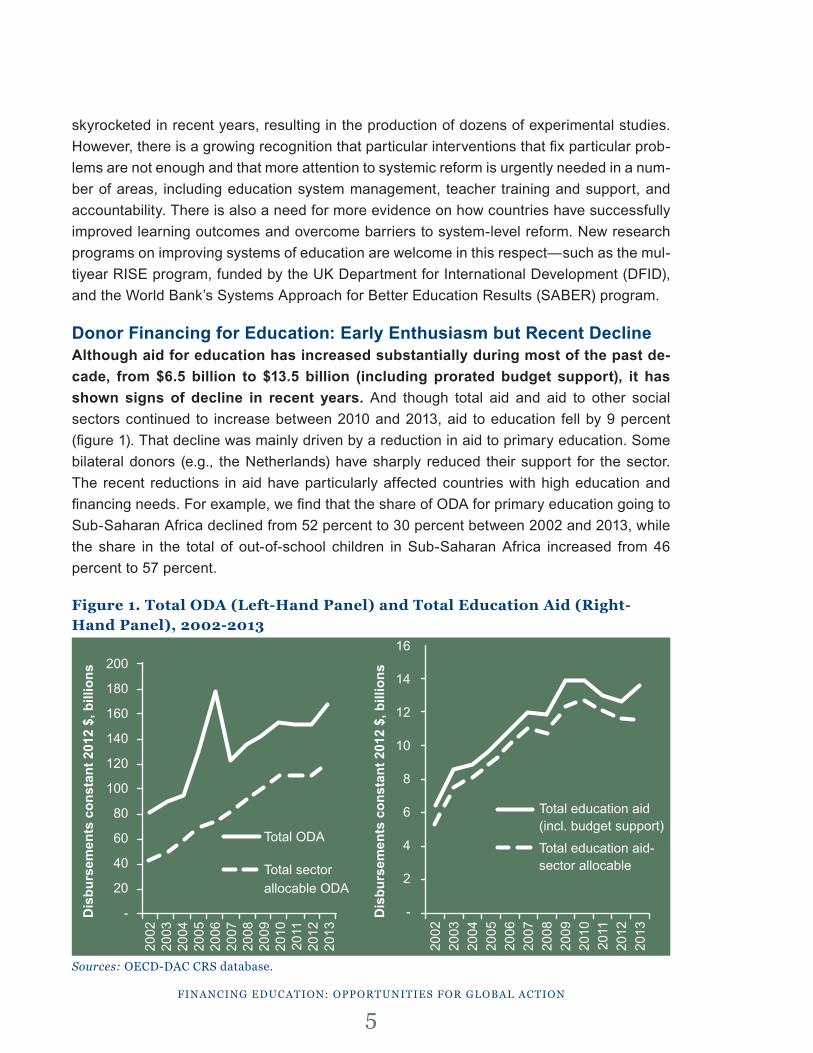
Donor Financing for Education: Early Enthusiasm but Recent DeclineAlthough aid for education has increased substantially during most of the past de-cade, from $6.5 billion to $13.5 billion (including prorated budget support), it has shown signs of decline in recent years. And though total aid and aid to other social sectors continued to increase between 2010 and 2013, aid to education fell by 9 percent (figure 1). That decline was mainly driven by a reduction in aid to primary education. Some bilateral donors (e.g., the Netherlands) have sharply reduced their support for the sector. The recent reductions in aid have particularly affected countries with high education and financing needs. For example, we find that the share of ODA for primary education going to Sub-Saharan Africa declined from 52 percent to 30 percent between 2002 and 2013, while the share in the total of out-of-school children in Sub-Saharan Africa increased from 46 percent to 57 percent.
Figure 1. Total ODA (Left-Hand Panel) and Total Education Aid (Right-Hand Panel), 2002-2013
Sources: oeCd-dAC Crs database.
FinAnCing eduCAtion: opportunities For globAl ACtion
5
Dis
burs
emen
ts c
onst
ant 2
012
$, b
illio
ns
Dis
burs
emen
ts c
onst
ant 2
012
$, b
illio
ns
200
180
160
140
120
100
80
60
40
20
-
2002
2003
2004
2005
2006
2007
2008
2009
2010
2011
2012
2013
Total ODA
Total sector allocable ODA
Total education aid(incl. budget support)
Total education aid-sector allocable
2002
2003
2004
2005
2006
2007
2008
2009
2010
2011
2012
2013
16
14
12
10
8
6
4
2
-
The role of multilateral donors in education is evolving. First, in response to concerns around youth unemployment and the lack of skills in developing countries, multilaterals are shifting their attention towards higher levels of education and system strengthening. Between 2002 and 2013, the share of multilateral donors in primary education dropped from 40 percent to 27 percent; this is after including a prorated share of system strength-ening.3 Greater attention to higher levels of education and system strengthening is clearly needed, but with these greater demands on education finance it has become even more important to enlarge the overall envelope for education and avoid diverting funding from basic to higher levels of education. Second, while bilateral donors have been allocating an increasing amount of their total aid to multilaterals through earmarked financing channels (e.g., through trust funds and global funds), allocations earmarked for education have been declining. Adding the share of core multilateral aid (at 24 percent of total education aid) and noncore multilateral aid (at 10 percent of total education aid) together, we find that educa-tion attracts much less multilateral financing—at 34 percent of total education aid—than health—at 65 percent of total health aid.
In addition to limiting further declines in aid, there is also a need to closely monitor the amount of aid that actually reaches developing countries. Country programmable aid for education, which is the amount of aid that is available for actual programming in countries, is only 70 percent of the total amount of education aid. Comparatively, a much higher share of health aid—86 percent—is country programmable.
Some of the shortfalls in aid to education may be mitigated by an increase in support from new donors and nonconcessional finance, which have been growing rapidly in recent years. However, due to limited data, it is difficult to assess their significance and potential for education. Some studies have suggested that some of the Arab and emerging official donors are particularly interested in supporting education. However, existing data does not yet support this claim. For example, while the United Arab Emirates has substan-tially increased its budget support in recent years, which could potentially benefit education, education represents only 2 percent of its sector allocable aid.
The limited availability of resources underlines the need to use resources effectively. A number of players have made good efforts to coordinate their efforts, but education aid remains highly fragmented. Using donor proliferation as a measure, donor fragmenta-tion has increased over time. From 2008 to 2013, the number of donor relationships in LICs and LMICs increased by 12 percent—from 1,016 to 1,141. Proliferation is particularly dam-aging when donors provide small amounts of aid to individual countries relative to the size of their own budgets and the education aid portfolio in any given country. This “significance” of aid relationships can be assessed using a methodology to measure fragmentation that was developed by the OECD-DAC and is now widely accepted; according to this measure,
FinAnCing eduCAtion: opportunities For globAl ACtion
6
one-third of donor relations in education are insignificant, with little or no improvement over the past 5 years.
Basic education aid allocations are also highly uneven across countries with similar levels of income. Some countries receive much greater amounts of aid per child than oth-ers. It is hard to see the logic of providing $5 of aid per child in Chad and $58 per child in Liberia. The question of whether a particular country is underaided is complex, however, especially when considered from a sector perspective. Our analysis highlights that a sub-stantial amount of basic education aid is directed toward the poorest countries (with the highest financing need)—45 percent to least-developed countries (LDCs). However, alloca-tions are less well aligned with education needs. This situation is highlighted by the fact that the 10 countries that are home to 75 percent of all out-of-school children receive under 30 percent of all aid. Finally, we highlight that donor coordination is challenged by changes in leadership within the donor community. Such transitions need to be managed carefully, and coordination mechanisms need to be developed to help fill gaps and mitigate the impact at the country level.
Innovative financing mechanisms to improve results have been growing. Recognizing the need for more effective financing for education, donors have developed a number of in-novative mechanisms aimed at leveraging new sources of funds and creating stronger links between financing and results. Examples include the World Bank’s Program for Results (P4R), the Norway–World Bank Results in Education for All Children (REACH) program, the DFID Girls’ Education Challenge Program, and the Global Partnership for Education’s (GPE’s) new resource allocation model (which includes a variable tranche related to re-sults). The importance of these programs to generate more and better finance for education has yet to be determined. So far, education has captured only 5 percent of all results-based financing under P4R. A recent review of results-based aid also finds that the existing initia-tives have, as implemented, only been cautious adaptations of traditional approaches to aid programs. They have given enhanced attention to results but have not really focused on accountability or flexibility.
Nonstate Financing: A Growing Source That Could Be CapturedAccording to the OECD-DAC, in 2012, private development assistance (PDA) from OECD countries including charitable, religious and private sector grants stood at $30 billion, which was equivalent to about 25 percent of total net ODA. These flows have been growing at a much faster pace than ODA, with a 51 percent increase between 2006 and 2011.
There has been a surge of interest in nonstate sources of finance for education, but surveys suggest that education is not a high priority for international charitable giv-
FinAnCing eduCAtion: opportunities For globAl ACtion
7
ing. Though highly incomplete data make it difficult to assess how much PDA is going to education,4 a recent analysis of Fortune 500 companies suggests fewer than 10 percent of their donations related to corporate social responsibility (CSR) are given to education. Similarly, of all giving by US foundations to developing countries for the United Nations’ Millennium Development Goals (MDGs), only 1 percent is currently being devoted to basic education, MDG number 2. Anecdotal evidence suggests, however, that foundations and individual donors in developing and emerging economies are perhaps more interested in education than are their OECD counterparts. For example, a survey of Arab donors found that cultural and religious traditions—Islamic guidelines strongly encourage giving to educa-tion—provide a strong foundation for greater engagement in the future.
A large share of nonstate development finance for education is not focused on areas of need. Although charitable giving through foundations and civil society organizations is focused on low income countries or groups, corporate giving tends to be focused on MICs and on emerging markets, which tend to be regions of business or strategic interest. Only half the total CSR spending by global Fortune 500 companies was directed to regions with a large presence of developing countries. The data also suggest that charitable grants (in particular from corporations and some foundations) are often focused on higher levels of education—vocational training, tertiary education and teacher training.
New financing mechanisms are opening up opportunities for collaboration across both nonstate and state actors. Impact bonds, for example, harness private capital to social services such as education while maintaining a focus on achieving outcomes. The potential of these and other mechanisms needs to be further explored. However, discus-sions of nonstate financing and delivery have been contentious and even ideological, and have not adequately addressed what roles various actors, in particular nonstate actors, could play. Solutions—including nonstate financiers and providers—need to be devised to bridge financing gaps where domestic resource capacities fall short.
Finally, any discussion of education finance needs to account for the fact that house-holds are filling gaps and spending significant amounts on education out of their own pockets. In LICs, this spending is estimated to amount to almost half of total domestic public expenditures.
Financing Education in Different Country ContextsThis report highlights how different types of countries have progressed at different speeds and will have different financing needs. These differences are not sufficiently captured by the classic distinction between LICs and MICs. Our global response will need to be tailored to countries’ particular circumstances in terms of development and income, fragility and access to finance. Here, building on a methodology proposed by the OECD-
FinAnCing eduCAtion: opportunities For globAl ACtion
8
DAC, we explore the priorities of six country groups based on level of development, fragility and access to concessional finance (box 1).5
The groups differ in their education needs and relative access to domestic and external finance. A few key observations emerge:
■ Remarkable progress has been made in the Least-Developed Countries (LDCs), but there are still large numbers of out-of-school children in fragile states, and particularly in fragile LMICs.
■ LDCs (groups 1 and 2) have made remarkable progress increasing access to basic education. Further efforts are now needed to close equity gaps and improve quality.
■ The largest numbers of out-of-school children are now concentrated in fragile states (groups 1 and 3), estimated around 70 percent of the total number of out-of-school children in countries for which we have national level data.
FinAnCing eduCAtion: opportunities For globAl ACtion
9
Box 1. Country Groups Based on Level of Development, Fragility and Access to Concessional FinanceGroup 1: Fragile Least-Developed Countries (Fragile LDCs): This group is made up of 27 fragile LDCs that are eligible to receive concessional finance from the International Development Association (IDA), the World Bank’s concessional arm; these are primarily LICs and LMICs in Sub-Saharan Africa and Asia.
Group 2: Nonfragile Least-Developed Countries (Nonfragile LDCs): This group is made up of the 14 remaining LDCs that are not fragile but are eligible for concessional finance from the IDA; these countries are primarily concentrated in Sub-Saharan Africa.
Group 3: Fragile Middle-Income Countries (Fragile LMICs): This group is made up of 14 fragile countries, primarily LMICs that are eligible to receive concessional lending from the IDA.
Group 4: Nonfragile IDA-Eligible Middle-Income Countries (Nonfragile LMICs): This group is made up of 15 countries, primarily LMICs and some UMICs, that are eligible to receive concessional lending from the IDA. They are primarily concentrated in Asia and Latin America.
Group 5: Non IDA-Eligible Middle-Income Countries (Mainly UMICs): This group is made up of the remaining 45 countries on the DAC list that are ODA-eligible, primarily UMICs in Asia and Latin America. They are neither fragile nor IDA-eligible.
Group 6: Small Island Developing States (SIDS): This group is made up of 30 small is-land developing states with populations of less than 1 million. They are ODA-eligible and are primarily LMICs and UMICs. About half are IDA-eligible.
■ UMICs (group 5) are struggling to complete the last mile, and there has been some regression in the Small Island Developing States (SIDS) (group 6). This highlights the fact that even in higher-income countries, stubborn pockets of education poverty still need to be addressed.
■ Domestic revenue-raising capacity and the prioritization of education in domestic expenditures differ markedly across the country groups.
■ Nonfragile LDCs (group 2) have done particularly well in raising their ratio of taxes to GDP and in allocating a larger share of revenue to education.
■ Fragile LDCs and LMICs (groups 1 and 3), however, have recorded much more disap-pointing trends in resource mobilization (in 2012, ratios of taxes to GDP stood at 11 percent in fragile LDCs and at 13 percent in fragile LMICs, the lowest of any group) and have also chosen to allocate a smaller share to education (which also declined over the decade). Meanwhile, ODA to these countries has been rising rapidly, which leads to questions about ODA’s ability to catalyze growth in domestic resources.
■ Although there has been an overall rebalancing of basic education ODA toward fragile countries and UMICs, different patterns have emerged between different types of donors.
■ Bilateral donors are increasing their focus on LDCs, while multilateral donors, with the exception of the GPE, are increasing their attention on MICs.
■ Overall, fragile countries, UMICs and SIDS received the largest increases in ODA, and ODA to nonfragile LDCs slightly declined, even though the needs for pre-primary and quality improvements remain very great.
■ Nonconcessional finance (e.g., the World Bank’s nonconcessional loans through its International Bank for Reconstruction and Development facility) is a growing source of funds, but so far it does not seem to be benefiting education.
■ An annual average of less than $1 per capita of the $25 per capita of other official flows was allocated to education in UMICs in 2011-13.
■ The growth of private investment (i.e. foreign direct investment) in some country groups could provide opportunities for social investments in those country groups.
■ Remittances are growing across all country groups and are an important complemen-tary source of finance for education.
FinAnCing eduCAtion: opportunities For globAl ACtion
10
The analysis of the country groups raises a number of questions that need to be dis-cussed and better understood, highlighting the need for a global platform of dialogue and coordination vis-à-vis international action:
■ How can ODA best leverage domestic resource mobilization and education prioritization in fragile LDCs and LMICs?
■ To what extent should ODA continue to be focused on countries that have demonstrat-ed strong domestic investments and effective use of resources, such as the nonfragile LDCs, and how should this be balanced with the needs of other countries?
■ How can ODA better leverage other external sources of finance such as nonconcessional and private finance in MICs?
■ What role should multilateral donors play? Should they be gap fillers in LDCs or catalysts and knowledge providers in MICs?
■ How should the international community respond to protracted humanitarian crises, in particular in MICs with limited access to concessional finance?
The report finds that financing the SDGs will be most challenging for LDCs and, in particular, for fragile LDCs. Using costing and tax capacity estimates for 2020, the report compares the total spending required by all actors to achieve basic education goals with the estimated domestic resource capacity of different country groups. The assumption here is that the tax effort could rise to the “optimal tax effort” identified by the IMF and World Bank. In addition, we assume that countries would spend the recommended 12 percent of their total revenues on basic education.6 We also separate resource-rich countries from other LDCs and LMICs country groups (groups 1 and 3) to highlight the different revenue capacity in these countries.
Even with optimal tax mobilization and allocation efforts, financing gaps still remain (figure 2), adding to an annual total of at least $27 billion across all country groups by 2020.7 The largest gaps between annual costs and projected domestic public spend-ing, as a share of annual cost, are in LDCs and fragile LMICs (groups 1, 2, and 3):
■ Fragile LDCs (group 1) will need additional annual financing of $7.9 billion to cover total annual costs of $21.7 billion by 2020, equivalent to 36 percent of total cost;
■ Nonfragile LDCs (group 2) will need additional annual financing of $3.1 billion to cover total annual costs of $9.6 billion by 2020, equivalent to 32 percent of total cost;
FinAnCing eduCAtion: opportunities For globAl ACtion
11
■ Fragile LMICs (group 3) will need additional annual financing of $11.2 billion to cover total annual costs of $48.8 billion by 2020, equivalent to 23 percent of total cost.
Other groups will have much smaller financing gaps (as a share of total costs) or should be able to cover costs from their own resources (e.g. resource rich coun-tries).
If aid flows between 2013 and 2020 reflect the historical pattern of the last decade, about 10 billion dollars in aid could be available for spending on basic education in 2020, covering about one-third of the financing gap of $27 billion in all low and middle-income countries (excluding China).8 Of total projected aid in 2020, about one-third ($3.2 billion) would be directed toward fragile LDCs, 14 percent to nonfragile LDCs ($1.4 billion) and 19 percent ($1.9 billion) to fragile LMICs. The rest ($3.5 billion) would be allocated to nonfragile LMICs ($0.9 billion) and the UMICs ($2.4 billion) with much smaller amount for SIDS ($0.2 billion). In addition, at least another $2 billion of nonconcessional finance should be available for education.
Aid allocations should carefully balance education and financing needs—as well as potentially reward performance. The estimated financing gaps imply that at least 40 percent of aid should be directed to LDCs, and potentially a higher share could be directed to fragile states. Recent growth in aid to fragile states should thus be welcomed, because more than 70 percent of the financing gap is likely to be concentrated in fragile states. Any concessional financing allocated to nonfragile higher-income countries should also have a clear focus on catalyzing the volume and effectiveness of domestic resources, including the impact on equity and learning outcomes. In addition, other sources of finance could be tapped, such as nonconcessional financing and various types of innovative finance (impact investment, blended finance, and social investment). Much innovation is going on in this area that could be evaluated and scaled.
FinAnCing eduCAtion: opportunities For globAl ACtion
12
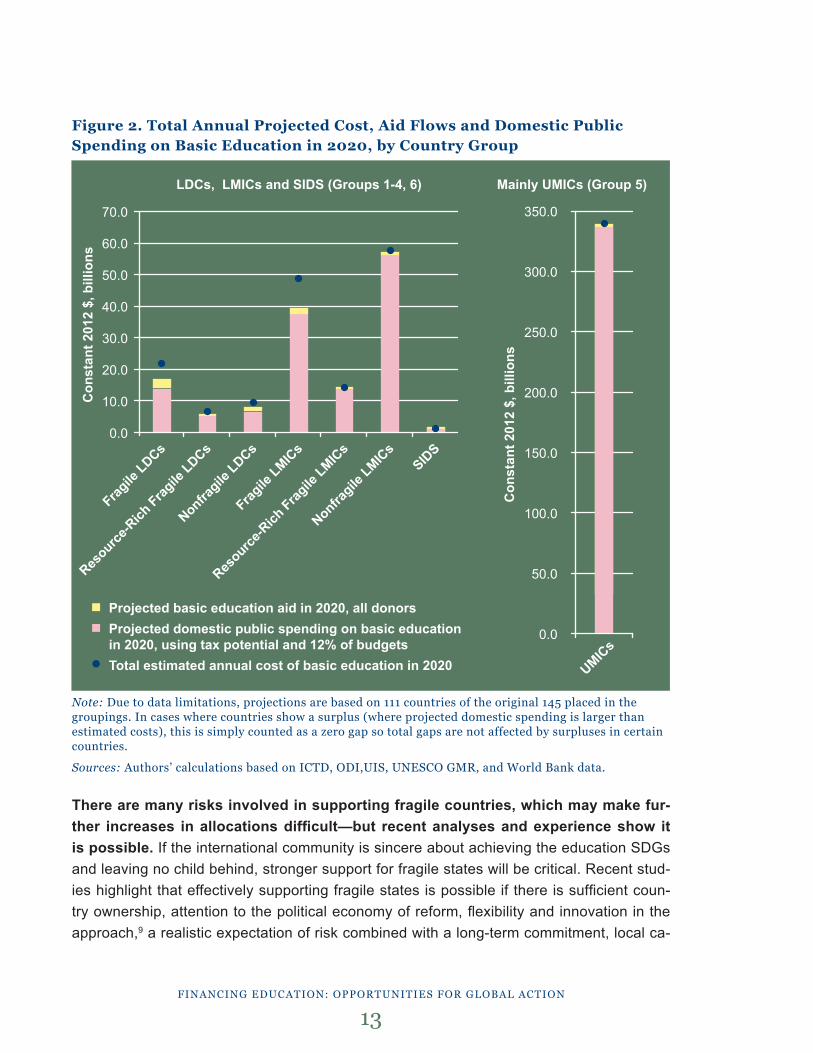
Figure 2. Total Annual Projected Cost, Aid Flows and Domestic Public Spending on Basic Education in 2020, by Country Group
Note: due to data limitations, projections are based on 111 countries of the original 145 placed in the groupings. in cases where countries show a surplus (where projected domestic spending is larger than estimated costs), this is simply counted as a zero gap so total gaps are not affected by surpluses in certain countries.
Sources: Authors’ calculations based on iCtd, odi,uis, unesCo gMr, and World bank data.
There are many risks involved in supporting fragile countries, which may make fur-ther increases in allocations difficult—but recent analyses and experience show it is possible. If the international community is sincere about achieving the education SDGs and leaving no child behind, stronger support for fragile states will be critical. Recent stud-ies highlight that effectively supporting fragile states is possible if there is sufficient coun-try ownership, attention to the political economy of reform, flexibility and innovation in the approach,9 a realistic expectation of risk combined with a long-term commitment, local ca-
FinAnCing eduCAtion: opportunities For globAl ACtion
13
Con
stan
t 201
2 $,
bill
ions
Con
stan
t 201
2 $,
bill
ions
70.0
60.0
50.0
40.0
30.0
20.0
10.0
0.0
350.0
300.0
250.0
200.0
150.0
100.0
50.0
0.0
■ Projected basic education aid in 2020, all donors■ Projected domestic public spending on basic education
in 2020, using tax potential and 12% of budgets● Total estimated annual cost of basic education in 2020
Fragile
LDCs
Resource
-Rich
Fragile
LDCs
Nonfragile
LDCs
Fragile
LMICs
Resource
-Rich
Fragile
LMICs
Nonfragile
LMICs
SIDS
LDCs, LMICs and SIDS (Groups 1-4, 6) Mainly UMICs (Group 5)
UMICs
pacity building and effective coordination of support (including across humanitarian and development spaces).
Opportunities for ActionA renewed commitment to a global effort is needed to address some of the challenges laid out in this report. We recommend four opportunities for action that could be considered at the Oslo Summit and other key fora this year. These proposed actions focus on the global level, and they of course are not the only actions needed. Making progress will require a range of efforts from all the actors, in particular from the participating countries themselves, which are and will remain the main drivers of progress.
Action 1: Establish a Global Commission on Education and Financing—Making a Compelling Case for Investment in Education Using Evidence and High-Level Lead-ership The evidence has made it clear that unless the global community significantly scales up its investments in education, the world faces the risk of not meeting many of the SDGs. Failed education systems, especially at the basic level, will perpetuate the current vicious circle of poverty, violence, inequality, disease and environmental degradation. Though the world’s governments know this, as do global business and finance leaders, they have not taken sufficient action to increase the scale and effectiveness of investments in education. Action has been held back by a lack of consensus about the steps that can fulfill education goals, by a limited understanding of the financing needs and trade-offs and by a lack of high-level political leadership.
A Global Commission on Education and Financing could be a major new international initia-tive with the power and insight to analyze and communicate strategies and actions to de-velop high-quality education systems and support the needs of the rapidly changing global economy and society. Building on a detailed analysis of the costs of delivery, it could ana-lyze the potential of different sources of finance and how they could best be harnessed (i.e., raised, allocated, managed and monitored) to achieve the education SDGs. The analysis of external resources could include the questions of whether the GPE needs to be scaled up and whether a potential Global Fund for Education building on the GPE could raise the momentum, mobilize additional resources and provide greater coordination and monitoring of impact (see action 2 just below). The work of the commission could be phased, based on a prioritization of the current education goals as part of the SDGs and the constituencies it decides to serve, but with its first key outputs delivered within 12 months.
Through its high-level status, the commission could raise global awareness of the education goals and promote action-oriented partnerships between governments, business leaders and civil society. Similar initiatives in other sectors can provide examples of how this can
FinAnCing eduCAtion: opportunities For globAl ACtion
14
be done. For example, the ongoing Global Commission on the Economy and Climate has shown how a compelling and evidenced-based message—that smart climate policies can actually promote better economic growth—can change attitudes and decisionmaking.
Action 2: Create a Global Platform for Coordination and Scale Up of External Sup-port This paper and others have identified a number of key issues that need analysis and coor-dinated decisionmaking. While progress in coordinating financing at the country level has been good, progress has been much less at the global level. Prospects of financing the SDGs would be much greater if there were a senior (ministerial level) platform to discuss key issues:
1. How to Scale Up External Support for Education and Focus on Achieving Re-sults?Even under optimistic scenarios of domestic resource mobilization and allocation, a number of country groups will require substantial external support. Current aid levels will be insufficient to fill the gaps, and a significant scaling up of all forms of external financing will be needed.
2. How to Strengthen Multilateralism in the Education Sector? Only 25 percent of total aid for education is delivered through multilateral channels. In addition, the only dedicated multilateral fund for education, the GPE, does not have a global mandate (it is currently focused mainly on LICs, with an initial focus on basic education), and it has not been able to attract the support needed to coordinate the education sector through a financially strong, pooled fund. Other pooling mechanisms to coordinate and muster financing at the country level have also developed, but with mixed success.
3. How to Better Tailor the Global Response to the Needs of Different Types of CountriesOur analysis shows that the allocation of both concessional and nonconcessional ex-ternal financing needs be aligned with countries’ needs and capacity to raise financing through domestic resource mobilization. Currently, no global coordination mechanism has an explicit mandate to highlight these financing gaps and to coordinate and scale up financing for education. The Incheon Declaration reaffirms UNESCO’s role, as the UN specialized agency for education, as a broad coordinator of the global education agenda, but without specific reference to aid coordination.10 Other mechanisms also currently do not have the mandate or the scope to take on this task.
FinAnCing eduCAtion: opportunities For globAl ACtion
15

4. How to Harness the Potential of All Actors, Including Nonstate Actors Clearly, solutions beyond traditional funding are needed. Nonstate actors are becoming bigger players in education in developing countries, and private financing flows have been growing rapidly in MICs. The education community needs to resolve the question of the potential role of nonstate actors as financiers and providers of education.
This platform could potentially be integrated in a Global Education Fund that builds off the GPE. Several proposals have been made to establish such a fund but further work is needed to explore the modalities. To add value it would need to have a global scope, global coordination and representation, flexible financing and delivery modalities, and provide a platform for the development of global public goods.
Action 3: Commit to a Data Revolution in Education Linking Financing and LearningThe way money is spent is just as important, if not more important, than the amount that is being spent. Compared to most sectors the quality of data on financing and impact in education is unacceptably weak. Comprehensive financing data do not exist and many countries lack the capacity to measure and track financing and learning outcomes system-atically over time. As a result, decisions are often uninformed by evidence. This is unneces-sary and must be addressed.
A major initiative is needed that would seek to catalyze a data revolution in education, linking data on financing, school characteristics, access, and learning. Building on ex-isting experiences, this initiative would aim to bring together lessons learned from ongoing initiatives, pilot the approach in selected countries, and build a global coalition engaging a range of partners in education.
Action 4: Seize Opportunities to Mobilize and Manage Domestic Finances for Educa-tion. This report recommends a dedicated effort to seek out opportunities to support the more ef-fective mobilization and use of domestic financing for education. Given the vast importance of domestic public finances for basic education, the education community urgently needs to engage more proactively with public finance reforms. This could include an agenda for the mobilization and effective allocation of public spending, as well as monitoring it. If donors could play a greater role in catalyzing the mobilization and allocation of domestic resources, financing gaps in many countries could be filled.
Increase the Amount of Domestic Resources for Education The amount of resources could be increased by enlarging the budget or by allocating a greater share of the budget to education:
FinAnCing eduCAtion: opportunities For globAl ACtion
16
FinAnCing eduCAtion: opportunities For globAl ACtion
17
■ This and other studies show that in many countries, modest tax-raising efforts could help raise education spending to required levels. Education policymakers and donors should engage and support action on this.
■ Increasing education’s share of the budget will require spending less in other ar-eas. The education community should look for win–win opportunities to make this happen. One such area could be distortionary energy subsidies. In some countries, such as Indonesia, this has been done successfully with a significant positive impact on edu-cation outcomes. An analysis of this experience points to the importance of increased investment in education during this period. A major boost in education financing resulted from the decision to cut fuel subsidies—specifically, the decision to eliminate school fees and to improve education through nationally funded programs.
Improve the Use and Allocation of Domestic ResourcesSimply providing more resources for education will not necessarily improve education sys-tems. The way education financing is allocated and spent has a critical bearing on the qual-ity and equity of education provision. As we press the case for increased domestic financing for education, we should also encourage public financial management reform that will sup-port improvements in the quality of public expenditures. For example, very few donors are giving attention to how financing for education is being allocated within countries. In many countries, allocations are highly in-transparent and inequitable. Our understanding of the use and impact of financing formulas and how the distribution of financial responsibilities across levels of government could potentially improve the delivery of education is still lim-ited. This would include an agenda to better analyze the allocation of public resources to dif-ferent levels of education and opportunities for cost recovery at higher levels of education.
introduction
he SDGs build on substantial progress made since the beginning of the millennium. Between 1999 and 2012, the number of out-of-school chil-dren decreased from 106 million to 58 million; two-thirds more children were
enrolled in primary school; gender parity improved, with the number of countries with fewer than 90 girls enrolled in primary school for every 100 boys falling from 33 to 16; transition and retention rates improved, with the lower secondary gross enrollment ratio increasing from 71 to 85 percent; and LICs and LMICs allocated a higher percentage of gross national product to education (UNESCO 2015). The pace of progress has accelerated compared with earlier trends, revealing the benefits gained from increased investment in education goals following the reaffirmation of the EFA goals and the MDGs.
However, progress has been uneven, and the remaining challenges disproportionally affect the most marginalized populations. Children in rural areas are twice as likely as those in urban areas to never go to school; the poorest children are five times less likely to complete primary school than the richest; 36 percent of out-of-school children are in conflict affected zones; and 16 of the 20 countries furthest from reaching the Education for All goals are in Sub-Saharan Africa (UNESCO 2015).
The new SDGs set out an ambitious agenda for education in the next 15 years to ad-dress remaining challenges and achieve sustainable development across all coun-tries. After a long and highly consultative process, the United Nations General Assembly’s Open Working Group on Sustainable Development Goals summarized the education goal (goal 4) in seven key targets (see annex 2). The goal and targets set out a broad set of as-pirations to “ensure inclusive and equitable quality education and promote lifelong learning opportunities for all.” These aspirations were also endorsed at this year’s World Education Forum and in the resulting Incheon Declaration.11
This report focuses on how a subset of the targets related to basic education—that is, that all children should complete high-quality pre-primary, primary and lower sec-ondary education—can be financed. These are the goals that have been shown to have the highest social returns in developing countries (Psacharopoulos 2014). Using UNESCO GMR (2015) and our own estimates of costs to achieve universal pre-primary, primary and lower secondary education by 2030, and assuming resources will increase gradually over time, we take a look at what LICs and MICs will need to be spending by 2020 to meet these goals and how different financing strategies may be required in different types of countries.
In most countries, education is predominantly financed and provided by the govern-ment. The expansion of education depends therefore primarily on domestic fiscal revenues.
T
FinAnCing eduCAtion: opportunities For globAl ACtion
18

However, in many developing countries, these revenues are not sufficient to support the delivery of high-quality education across the education cycle. Additional sources of both external public and nonstate financing are needed to fill the gap.
The right mix of resources will be dependent on the country context and on the lev-els of education in most need of financing. LICs will continue to rely heavily on aid, but for most countries in the middle-income bracket (105 are MICs today), a wider variety of financing resources, including but not exclusively aid, could be tapped. Rather than merely filling gaps, aid could play a role in unlocking these other sources of finance.
Merely increasing financing will not be enough, however. Governments will need to make smart choices on how to allocate and spend scarce domestic and international con-cessional finance. And at least in the short to medium terms, most developing countries will not be able to publicly finance education across all education levels, even with international support. Decisions about spending allocations will need to be tailored to country contexts and informed by evidence on where this spending is likely to have the biggest impact. Data on social rates of return suggest that public investments in lower levels of education are likely to generate the largest benefit for society as a whole and to build the necessary foun-dations for equitable schooling throughout the education cycle.
We recognize that the financing of basic education will depend on the extent to which actors can address financing constraints at higher levels of education, which are currently absorbing large shares of public resources in many countries. Solutions to increase financing for basic education need to go hand in hand with developing alternative financing options (e.g., loan programs and selective scholarships) at higher levels of educa-tion.
This report provides an overview of how governments, donors and nonstate actors have been investing in education over the past decade (sections 1 to 3). Based on this analysis, it highlights the need for a multipronged approach to education financing whereby the optimal use of all resources and different country contexts are considered (section 4). Finally, the re-port proposes four opportunities for international action to enhance investment in education in developing countries that could be considered in the short to medium terms (section 5).
This report draws on a substantial amount of data from a variety of sources, including the OECD-DAC Credit Reporting System, the UNESCO Institute for Statistics, ICTD’s Govern-ment Revenue data set, the World Bank’s World Development Indicators, the International Monetary Fund’s World Economic Outlook data (for projections) and a survey of CSR by the Business Backs Education Initiative. The data sources and the methodology used are pro-vided in annex 3. In addition, the study includes findings from five country case studies—for Afghanistan, Lebanon, Malawi, Nigeria, and Pakistan.
FinAnCing eduCAtion: opportunities For globAl ACtion
19
1. domestic public spending on education: Key Facts
Education Spending Has Been Rising in Low-Income Countries
etween 2002 and 2012, average spending on total education as a share of GDP grew from 3.1 to 3.8 percent in LICs.12 Spending in LMICs rose from 4.4 to 5.1 percent, with UMICs recording slight increases, from 5.0 to
5.2 percent (figure 1.1). However, there are significant variations between countries. Of the 70 countries with available data for 2002 to 2012, two-thirds increased education spending as a share of GDP. Of concern is the fact that some countries, such as the Central African Republic and Chad, that already had low spending ratios of less than 2.5 percent of GDP, recorded a further decline during the decade.
The general positive trend in education spending as a share of GDP in low income countries was also reflected in spending on primary education. While data are more limited, low income countries increased their spending for primary education as a share of GDP from 1.5 percent to 2 percent from 2002 to 2012. Primary spending as a share of GDP remained fairly steady in lower and upper middle income countries.13
B
FinAnCing eduCAtion: opportunities For globAl ACtion
20
Key Messages ■ On average, between 2002 and 2012, spending on education as a share of GDP grew
in all country income groups—driven by improved tax collection.
■ However, prioritization of education spending within domestic budgets has declined, particularly in LICs.
■ A limited number of countries globally are meeting both the recommended share of budget and share of GDP spending targets, none of which are low-income countries.
■ Low-income and lower-middle income countries will need to increase education spending by 50 percent and 30 percent, respectively, to achieve the new and more ambitious SDGs.
■ Public spending is often not pro-poor. It favors higher levels of education and dispro-portionately benefits children from the wealthiest households and regions.
■ Even when it has increased, public spending has often not resulted in sufficient learn-ing outcomes. How money is used is key to improved learning.
■ Systemic reform is urgently required, rather than relying on pointed interventions directed at single issues.
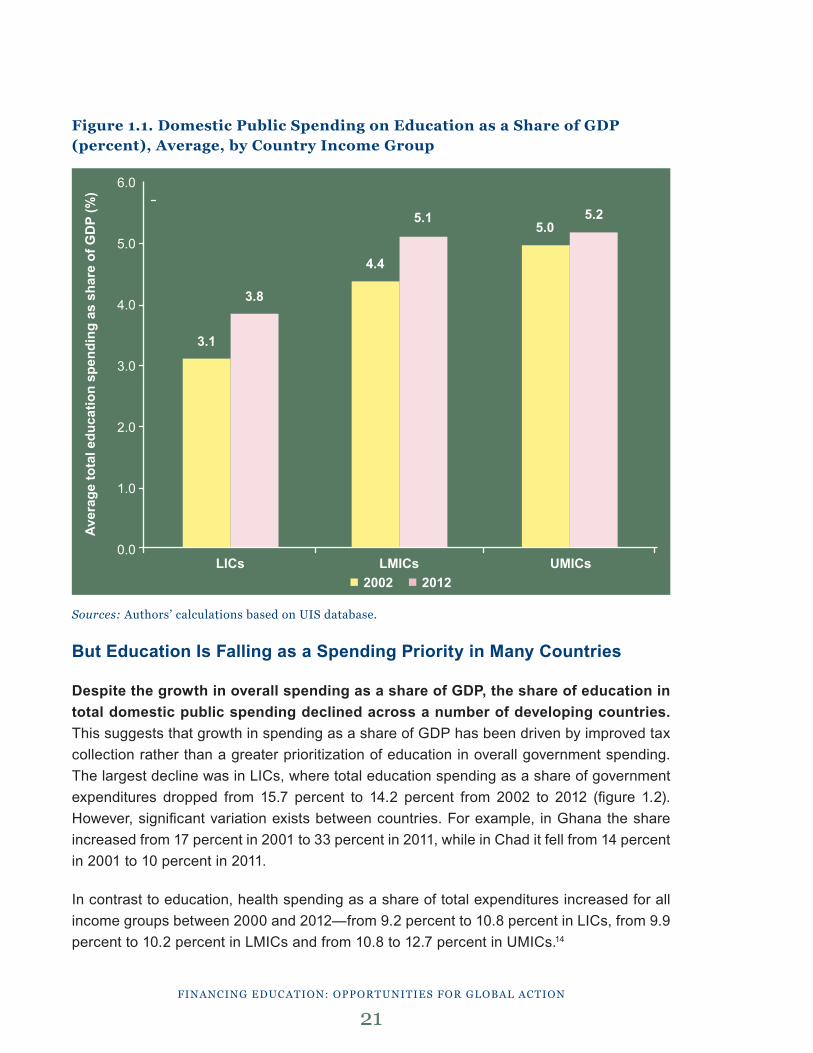
Figure 1.1. Domestic Public Spending on Education as a Share of GDP (percent), Average, by Country Income Group
Sources: Authors’ calculations based on uis database.
But Education Is Falling as a Spending Priority in Many Countries
Despite the growth in overall spending as a share of GDP, the share of education in total domestic public spending declined across a number of developing countries. This suggests that growth in spending as a share of GDP has been driven by improved tax collection rather than a greater prioritization of education in overall government spending. The largest decline was in LICs, where total education spending as a share of government expenditures dropped from 15.7 percent to 14.2 percent from 2002 to 2012 (figure 1.2). However, significant variation exists between countries. For example, in Ghana the share increased from 17 percent in 2001 to 33 percent in 2011, while in Chad it fell from 14 percent in 2001 to 10 percent in 2011.
In contrast to education, health spending as a share of total expenditures increased for all income groups between 2000 and 2012—from 9.2 percent to 10.8 percent in LICs, from 9.9 percent to 10.2 percent in LMICs and from 10.8 to 12.7 percent in UMICs.14
FinAnCing eduCAtion: opportunities For globAl ACtion
21
Aver
age
tota
l edu
catio
n sp
endi
ng a
s sh
are
of G
DP
(%)
6.0
5.0
4.0
3.0
2.0
1.0
0.0 LICs LMICs UMICs
■ 2002 ■ 2012
3.1
3.8
4.4
5.15.0
5.2
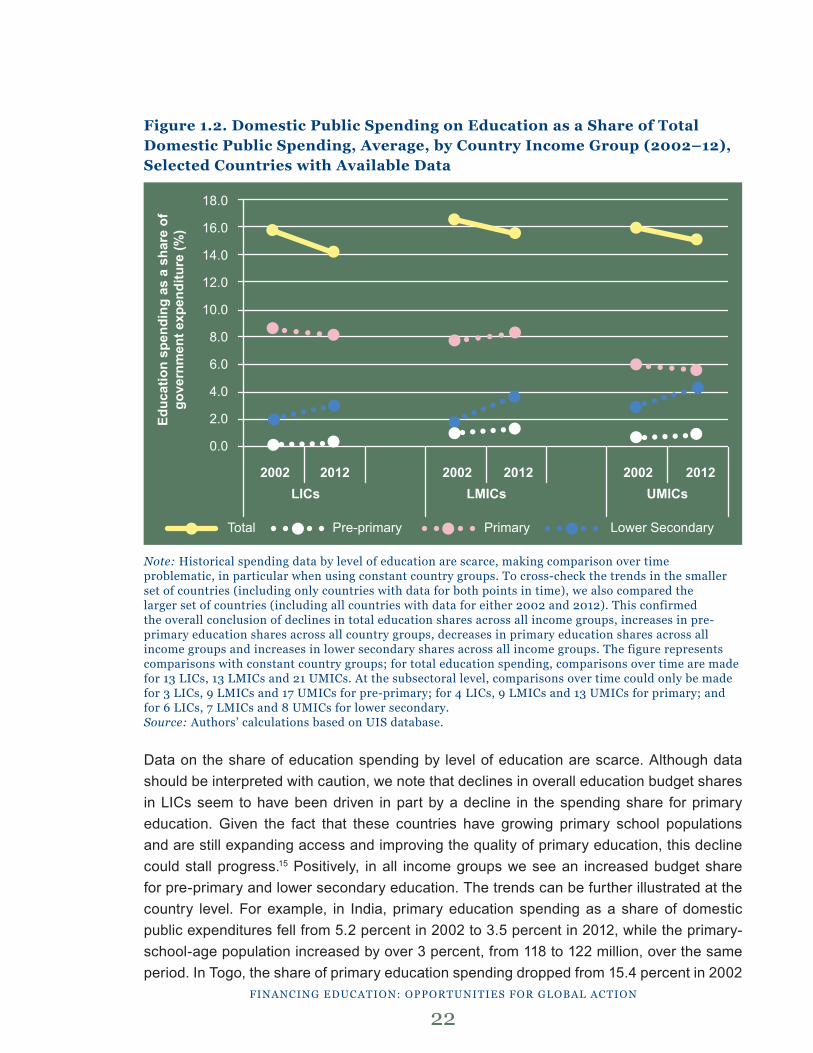
Figure 1.2. Domestic Public Spending on Education as a Share of Total Domestic Public Spending, Average, by Country Income Group (2002–12), Selected Countries with Available Data
Note: Historical spending data by level of education are scarce, making comparison over time problematic, in particular when using constant country groups. to cross-check the trends in the smaller set of countries (including only countries with data for both points in time), we also compared the larger set of countries (including all countries with data for either 2002 and 2012). this confirmed the overall conclusion of declines in total education shares across all income groups, increases in pre-primary education shares across all country groups, decreases in primary education shares across all income groups and increases in lower secondary shares across all income groups. the figure represents comparisons with constant country groups; for total education spending, comparisons over time are made for 13 liCs, 13 lMiCs and 21 uMiCs. At the subsectoral level, comparisons over time could only be made for 3 liCs, 9 lMiCs and 17 uMiCs for pre-primary; for 4 liCs, 9 lMiCs and 13 uMiCs for primary; and for 6 liCs, 7 lMiCs and 8 uMiCs for lower secondary.Source: Authors’ calculations based on uis database.
Data on the share of education spending by level of education are scarce. Although data should be interpreted with caution, we note that declines in overall education budget shares in LICs seem to have been driven in part by a decline in the spending share for primary education. Given the fact that these countries have growing primary school populations and are still expanding access and improving the quality of primary education, this decline could stall progress.15 Positively, in all income groups we see an increased budget share for pre-primary and lower secondary education. The trends can be further illustrated at the country level. For example, in India, primary education spending as a share of domestic public expenditures fell from 5.2 percent in 2002 to 3.5 percent in 2012, while the primary-school-age population increased by over 3 percent, from 118 to 122 million, over the same period. In Togo, the share of primary education spending dropped from 15.4 percent in 2002
FinAnCing eduCAtion: opportunities For globAl ACtion
22
Educ
atio
n sp
endi
ng a
s a
shar
e of
gove
rnm
ent e
xpen
ditu
re (%
)18.0
16.0
14.0
12.0
10.0
8.0
6.0
4.0
2.0
0.0
2002 2012 2002 2012 2002 2012 LICs LMICs UMICs
Total Pre-primary Primary Lower Secondary
to 7.1 percent in 2012, while the primary-school-age-population expanded by 23 percent, from 835,000 to 1 million.
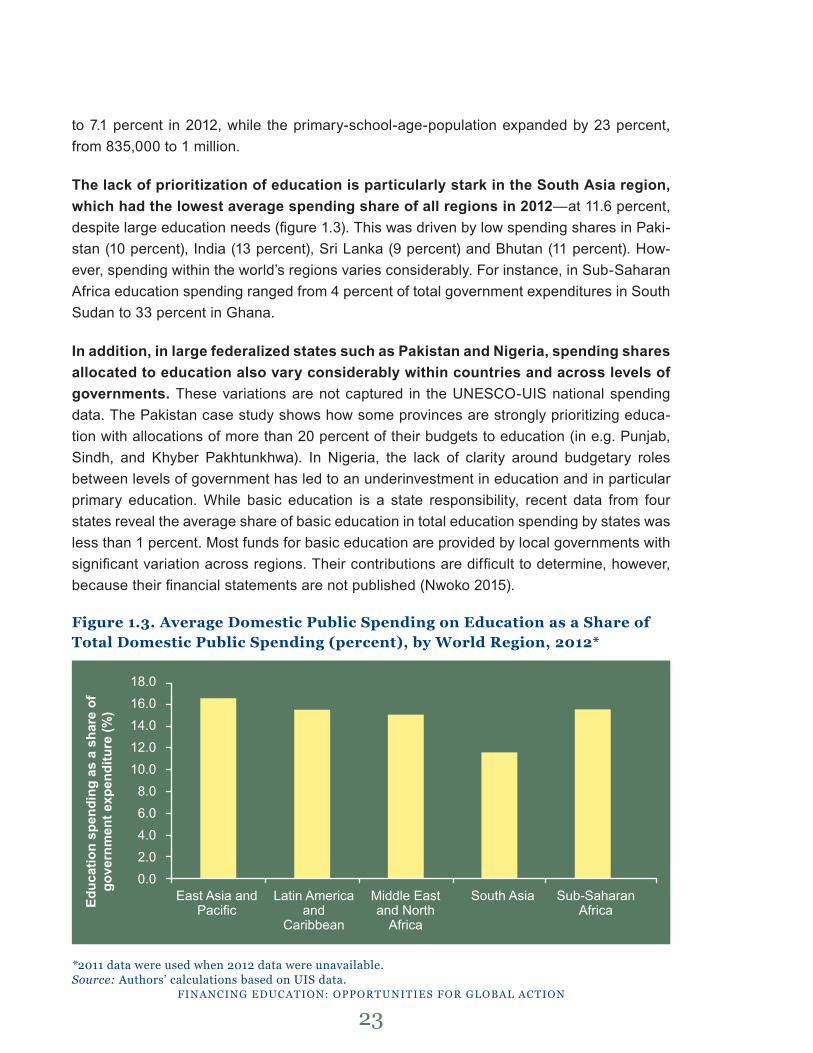
The lack of prioritization of education is particularly stark in the South Asia region, which had the lowest average spending share of all regions in 2012—at 11.6 percent, despite large education needs (figure 1.3). This was driven by low spending shares in Paki-stan (10 percent), India (13 percent), Sri Lanka (9 percent) and Bhutan (11 percent). How-ever, spending within the world’s regions varies considerably. For instance, in Sub-Saharan Africa education spending ranged from 4 percent of total government expenditures in South Sudan to 33 percent in Ghana.
In addition, in large federalized states such as Pakistan and Nigeria, spending shares allocated to education also vary considerably within countries and across levels of governments. These variations are not captured in the UNESCO-UIS national spending data. The Pakistan case study shows how some provinces are strongly prioritizing educa-tion with allocations of more than 20 percent of their budgets to education (in e.g. Punjab, Sindh, and Khyber Pakhtunkhwa). In Nigeria, the lack of clarity around budgetary roles between levels of government has led to an underinvestment in education and in particular primary education. While basic education is a state responsibility, recent data from four states reveal the average share of basic education in total education spending by states was less than 1 percent. Most funds for basic education are provided by local governments with significant variation across regions. Their contributions are difficult to determine, however, because their financial statements are not published (Nwoko 2015).
Figure 1.3. Average Domestic Public Spending on Education as a Share of Total Domestic Public Spending (percent), by World Region, 2012*
*2011 data were used when 2012 data were unavailable.Source: Authors’ calculations based on uis data.
FinAnCing eduCAtion: opportunities For globAl ACtion
23
Educ
atio
n sp
endi
ng a
s a
shar
e of
go
vern
men
t exp
endi
ture
(%)
18.016.014.012.010.0
8.06.04.02.00.0
East Asia and Latin America Middle East South Asia Sub-Saharan Pacific and and North Africa Caribbean Africa
The insufficient allocation of resources to education is particularly concerning given education has been widely recognized as the top development priority. More than 7.5 million people voted in the global My World Survey,16 and education was voted as one of the most important development issues by more than two-thirds of respondents. Similarly, in World Bank client surveys education has consistently been identified as the top development priority by 40 percent of respondents, the highest of any sector.17 The next most important development issue, identified by 28 percent of respondents, is public sector governance.
Domestic spending will need to accelerate to achieve the new, more ambitious SDGs. Achieving the SDGs by 2030 will require significant increases in spending. UNESCO’s GMR costing estimates and spending projections for the next 15 years for the achievement of ba-sic education targets suggest that, on average, countries will need to spend about 5.5 per-cent of GDP or 20 percent of budgets on education by 2030 (just under two-thirds of these totals—3.3 percent of GDP and 12 percent of budgets—would be spent on pre-primary, primary and lower secondary education). LICs will need to increase their total education spending from 3.7 percent to 5.5 percent, and LMICs will need to increase their education spending from 4.2 percent to 5.3 percent, equivalent to a nearly 50 percent increase in LICs and nearly 30 percent increase in LMICs. This will be a challenging task, given that spend-ing as a share of GDP only increased by 23 and 17 percent, respectively, in those country groups over the past decade. Less than 15 percent (4 out of 29) of LICs and 40 percent of LMICs for which we have data at present spend more than 5.5 percent of GDP on educa-tion.18
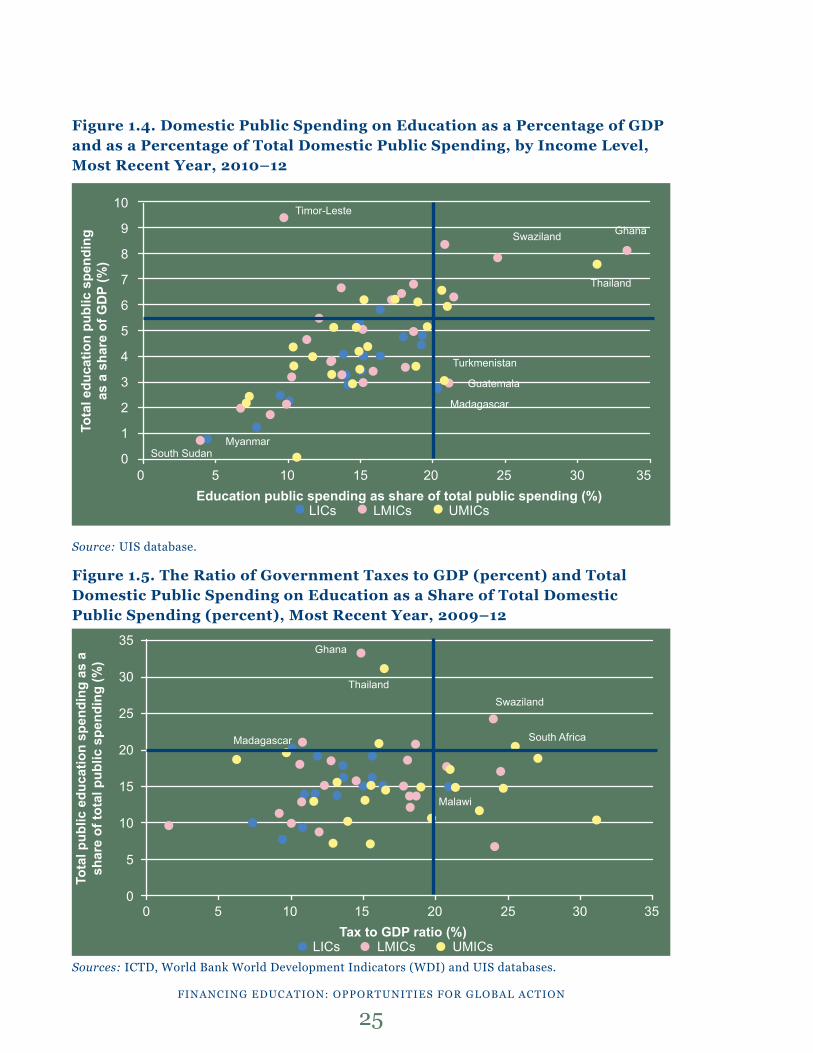
Globally, a limited number of countries—none of which are LICs—are currently meet-ing both spending targets (figure 1.4). India and Pakistan, both LMICs with large out-of-school populations, have very low spending levels, despite greater financial capacity. India allocates 12.9 percent of government expenditures and 3.8 percent of GDP to education, while Pakistan spends, respectively, 9.9 percent and 2.1 percent.
Increasing spending on education will require both bolstering tax revenues and pri-oritizing education in budgets. The International Monetary Fund estimates that develop-ing countries could raise 20 percent of their GDP in tax revenues; but only a limited number of countries manage to raise resources at this level. In Pakistan, for example, tax revenues have not improved for several years and stand at just above 8 percent, one of the lowest pro-portions in the world (Malik and Rose 2015). In addition, when countries do raise sufficient resources, they often do not allocate a large enough share to education (figure 1.5).
FinAnCing eduCAtion: opportunities For globAl ACtion
24
FinAnCing eduCAtion: opportunities For globAl ACtion
25
Figure 1.4. Domestic Public Spending on Education as a Percentage of GDP and as a Percentage of Total Domestic Public Spending, by Income Level, Most Recent Year, 2010–12
Source: uis database.
Figure 1.5. The Ratio of Government Taxes to GDP (percent) and Total Domestic Public Spending on Education as a Share of Total Domestic Public Spending (percent), Most Recent Year, 2009–12
Sources: iCtd, World bank World development indicators (Wdi) and uis databases.
Tota
l edu
catio
n pu
blic
spe
ndin
gas
a s
hare
of G
DP
(%)
10
9
8
7
6
5
4
3
2
1
00 5 10 15 20 25 30 35
Education public spending as share of total public spending (%)LICs LMICs UMICs
Timor-Leste
Swaziland Ghana
Thailand
Turkmenistan
Guatemala
Madagascar
MyanmarSouth Sudan
Tota
l pub
lic e
duca
tion
spen
ding
as
a sh
are
of to
tal p
ublic
spe
ndin
g (%
)
35
30
25
20
15
10
5
0 0 5 10 15 20 25 30 35
Tax to GDP ratio (%)LICs LMICs UMICs
Swaziland
Ghana
Thailand
Madagascar
Malawi
South Africa
FinAnCing eduCAtion: opportunities For globAl ACtion
26
Figure 1.5 shows that just two countries have both a ratio of taxes to GDP above 20 percent and a share of total education expenditures above 20 percent: Swaziland and South Africa. The bulk of countries with available data fall below both targets. Ten countries with ratios of taxes to GDP above 20 percent spend less than 20 percent on education, including one LIC, Malawi. Six countries spend above 20 percent on education without meeting the target 20 percent ratio of taxes to GDP. Again, just one country—Madagascar—is an LIC.
Public Spending Has Not Been Pro-Poor in Many Countries
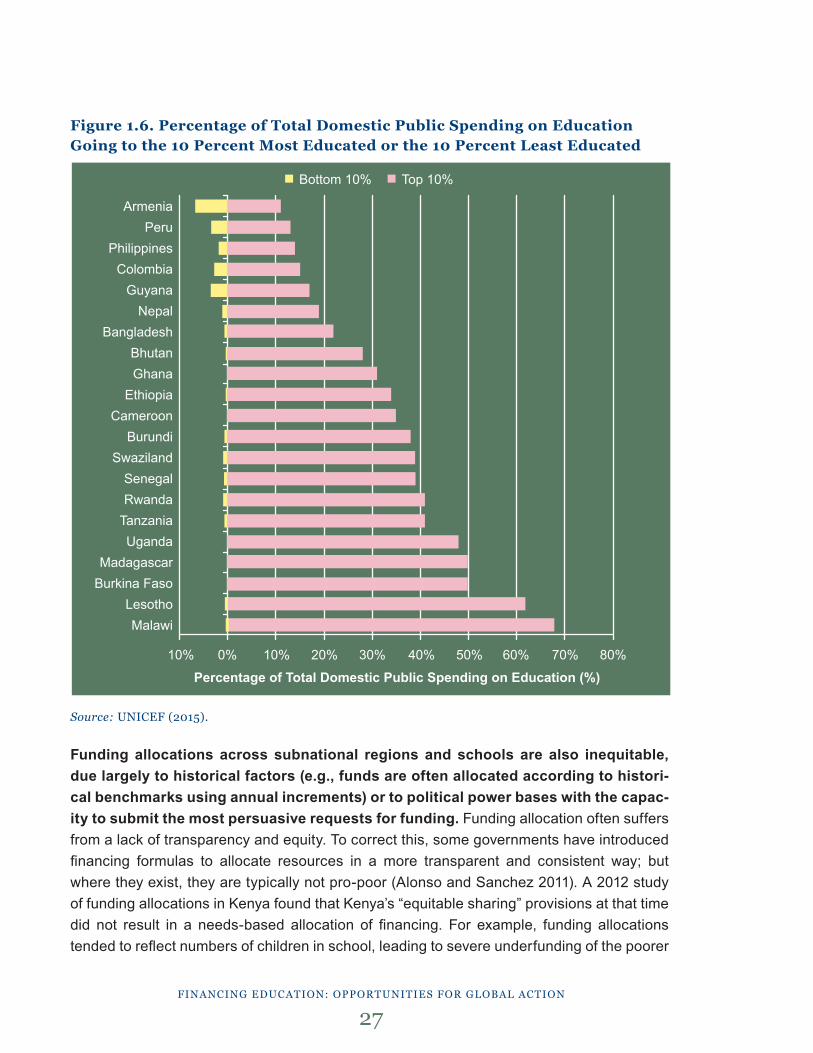
In a number of developing countries, distributions across levels of education and be-tween regions within countries have exacerbated already-existing inequities among socioeconomic groups and have limited the provision of schooling to poor and mar-ginalized populations. Distributing scarce funding across levels of education is a politi-cally challenging process. Difficult trade-offs between investing in lower and higher levels of education, which often benefit different economic classes of the population, need to be con-sidered. Rates of return and cost/benefit analyses suggest that in LICs, public investments in lower levels of education typically have higher rates of return than investments in higher levels.19 In some LICs, allocations reflect this recognition; but in many countries, spending allocations have disproportionately favored higher levels of education (figure 1.6). A recent UNICEF study shows that in LICs, on average, 46 percent of public resources are allocated to the 10 percent of students who are most educated. In LMICs, the percentage is 26, while in UMICs it is only 13. Inequities in public spending disproportionately favor children from the wealthiest households since they tend to represent a higher share of more educated children (UNICEF 2015b). More work is needed to fully understand the impact of spending allocations on education outcomes, in particular among the poor.
Detailed spending data from the Malawi case study further highlight the problem, revealing that government subsidies become increasingly regressive at higher levels of edu-cation. At the primary level, subsidies are progressive, with 54 percent going to the lowest two wealth quintiles and only 9 percent going to the highest. However, at the secondary level, only 18 percent goes to the lowest two quintiles. The situation is extremely inequitable at tertiary level, where only 3 percent goes to the lowest two quintiles and 82 percent to the highest. Thus, government expenditures favor those in higher education compared with those at the primary and secondary levels, where expenditures are very low. Nonsalary annual spending per pupil is only $1.5 at the primary level and $27 at the secondary level, while it is $807 per student at the tertiary level. Malawi’s unit cost for higher education is the second highest in the region (Hall 2015).
FinAnCing eduCAtion: opportunities For globAl ACtion
27
Figure 1.6. Percentage of Total Domestic Public Spending on Education Going to the 10 Percent Most Educated or the 10 Percent Least Educated
Source: uniCeF (2015).
Funding allocations across subnational regions and schools are also inequitable, due largely to historical factors (e.g., funds are often allocated according to histori-cal benchmarks using annual increments) or to political power bases with the capac-ity to submit the most persuasive requests for funding. Funding allocation often suffers from a lack of transparency and equity. To correct this, some governments have introduced financing formulas to allocate resources in a more transparent and consistent way; but where they exist, they are typically not pro-poor (Alonso and Sanchez 2011). A 2012 study of funding allocations in Kenya found that Kenya’s “equitable sharing” provisions at that time did not result in a needs-based allocation of financing. For example, funding allocations tended to reflect numbers of children in school, leading to severe underfunding of the poorer
Armenia Peru
PhilippinesColombia
GuyanaNepal
BangladeshBhutanGhana
EthiopiaCameroon
BurundiSwaziland
SenegalRwanda
TanzaniaUganda
MadagascarBurkina Faso
LesothoMalawi
10% 0% 10% 20% 30% 40% 50% 60% 70% 80%
■ Bottom 10% ■ Top 10%
Percentage of Total Domestic Public Spending on Education (%)

FinAnCing eduCAtion: opportunities For globAl ACtion
28
Arid and Semi-Arid regions with large out-of-school populations (Watkins and Alemayehu 2012).20 Similarly, until a few years ago, provinces in Pakistan received funds based on the share of their populations. The formula did not account for levels of deprivation in the prov-inces or their ability to raise their own taxes. In 2009, the government reformed its funding allocation formula and introduced three additional criteria for determining provincial shares (poverty, revenue collection, and population density). As a result, allocations have become much more needs-based. Poorer provinces such as Baluchistan have noted the positive impact of this measure in their education sector plans (Malik & Rose 2015).
Financing formulas are very prevalent in debates about education spending in devel-oped countries, but their characteristics and impact on education outcomes have re-ceived much less attention in developing countries. Their application needs to be better understood within particular countries’ unique central or decentralized governance contexts. For example, while the formula allocating financing to provinces in Pakistan is now needs-based, the allocations within provinces are much less so. District budgets tend to be the lowest where out-of-school populations are the highest. In Punjab, for example, two districts receive 9 percent of the total education budget while the eight least performing districts get only 8 percent of the budget (Malik & Rose 2015). Improving equitable distribution requires paying attention to distributions among and within provinces.
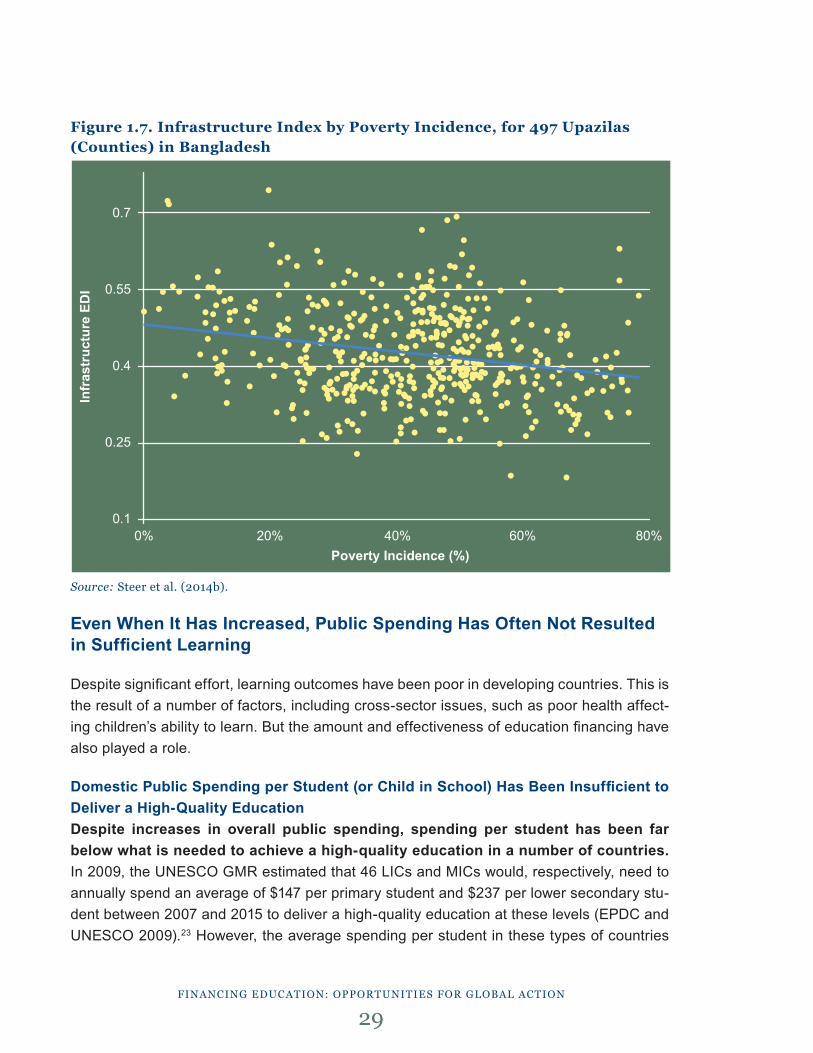
Inequities are also found in capital expenditures. A study in Bangladesh shows that while recurrent spending in education is pro-poor, capital expenditures are not, resulting in significant disparities in the quality of infrastructure (Steer et al. 2014b). Figure 1.7 shows the quality of infrastructure, measured by an Infrastructure Education Development Index (EDI) across different counties (upazilas) in Bangladesh.21 The EDI is a composite index with values between 0 and 1. Upazilas with values closer to 1 have better infrastructure con-ditions.22 The figure shows the wide spread in the quality of infrastructure across upazilas, with much worse conditions in poorer areas (where the incidence of poverty is high).
FinAnCing eduCAtion: opportunities For globAl ACtion
29
Figure 1.7. Infrastructure Index by Poverty Incidence, for 497 Upazilas (Counties) in Bangladesh
Source: steer et al. (2014b).
Even When It Has Increased, Public Spending Has Often Not Resulted in Sufficient Learning
Despite significant effort, learning outcomes have been poor in developing countries. This is the result of a number of factors, including cross-sector issues, such as poor health affect-ing children’s ability to learn. But the amount and effectiveness of education financing have also played a role.
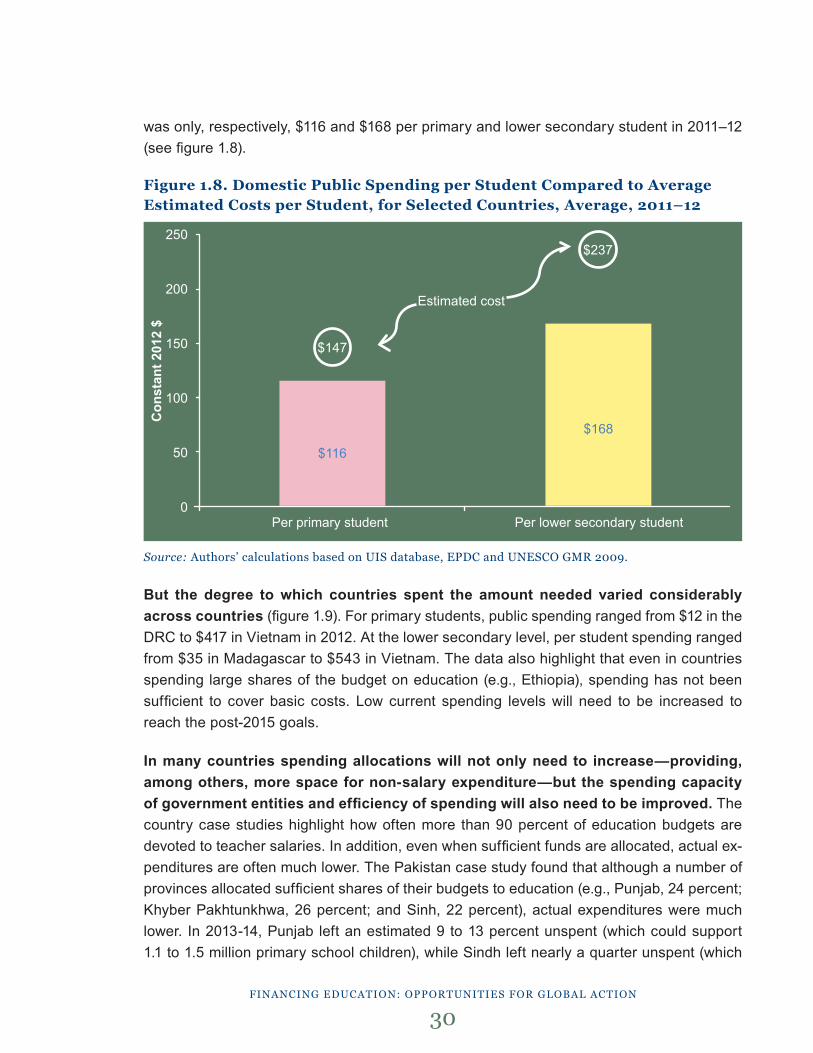
Domestic Public Spending per Student (or Child in School) Has Been Insufficient to Deliver a High-Quality EducationDespite increases in overall public spending, spending per student has been far below what is needed to achieve a high-quality education in a number of countries. In 2009, the UNESCO GMR estimated that 46 LICs and MICs would, respectively, need to annually spend an average of $147 per primary student and $237 per lower secondary stu-dent between 2007 and 2015 to deliver a high-quality education at these levels (EPDC and UNESCO 2009).23 However, the average spending per student in these types of countries
Infr
astr
uctu
re E
DI
0.7
0.55
0.4
0.25
0.10% 20% 40% 60% 80%
Poverty Incidence (%)
FinAnCing eduCAtion: opportunities For globAl ACtion
30
was only, respectively, $116 and $168 per primary and lower secondary student in 2011–12 (see figure 1.8).
Figure 1.8. Domestic Public Spending per Student Compared to Average Estimated Costs per Student, for Selected Countries, Average, 2011–12
Source: Authors’ calculations based on uis database, epdC and unesCo gMr 2009.
But the degree to which countries spent the amount needed varied considerably across countries (figure 1.9). For primary students, public spending ranged from $12 in the DRC to $417 in Vietnam in 2012. At the lower secondary level, per student spending ranged from $35 in Madagascar to $543 in Vietnam. The data also highlight that even in countries spending large shares of the budget on education (e.g., Ethiopia), spending has not been sufficient to cover basic costs. Low current spending levels will need to be increased to reach the post-2015 goals.
In many countries spending allocations will not only need to increase—providing, among others, more space for non-salary expenditure—but the spending capacity of government entities and efficiency of spending will also need to be improved. The country case studies highlight how often more than 90 percent of education budgets are devoted to teacher salaries. In addition, even when sufficient funds are allocated, actual ex-penditures are often much lower. The Pakistan case study found that although a number of provinces allocated sufficient shares of their budgets to education (e.g., Punjab, 24 percent; Khyber Pakhtunkhwa, 26 percent; and Sinh, 22 percent), actual expenditures were much lower. In 2013-14, Punjab left an estimated 9 to 13 percent unspent (which could support 1.1 to 1.5 million primary school children), while Sindh left nearly a quarter unspent (which
Con
stan
t 201
2 $
250
200
150
100
50
0 Per primary student Per lower secondary student
$116
$168
$147
$237
Estimated cost
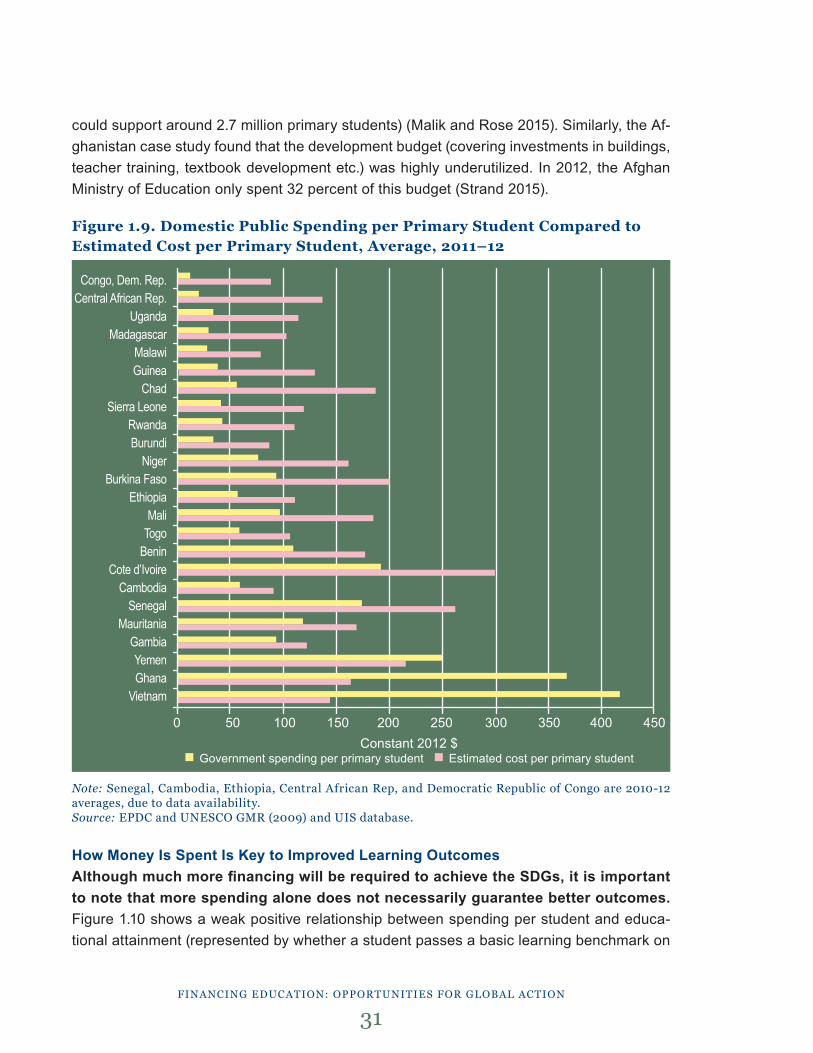
FinAnCing eduCAtion: opportunities For globAl ACtion
31
could support around 2.7 million primary students) (Malik and Rose 2015). Similarly, the Af-ghanistan case study found that the development budget (covering investments in buildings, teacher training, textbook development etc.) was highly underutilized. In 2012, the Afghan Ministry of Education only spent 32 percent of this budget (Strand 2015).
Figure 1.9. Domestic Public Spending per Primary Student Compared to Estimated Cost per Primary Student, Average, 2011–12
Note: senegal, Cambodia, ethiopia, Central African rep, and democratic republic of Congo are 2010-12 averages, due to data availability.Source: epdC and unesCo gMr (2009) and uis database.
How Money Is Spent Is Key to Improved Learning OutcomesAlthough much more financing will be required to achieve the SDGs, it is important to note that more spending alone does not necessarily guarantee better outcomes. Figure 1.10 shows a weak positive relationship between spending per student and educa-tional attainment (represented by whether a student passes a basic learning benchmark on
Congo, Dem. Rep.Central African Rep.
UgandaMadagascar
MalawiGuinea
Chad Sierra Leone
RwandaBurundi
NigerBurkina Faso
EthiopiaMali
Togo Benin
Cote d’IvoireCambodia
SenegalMauritania
GambiaYemenGhana
Vietnam
0 50 100 150 200 250 300 350 400 450Constant 2012 $
■ Government spending per primary student ■ Estimated cost per primary student
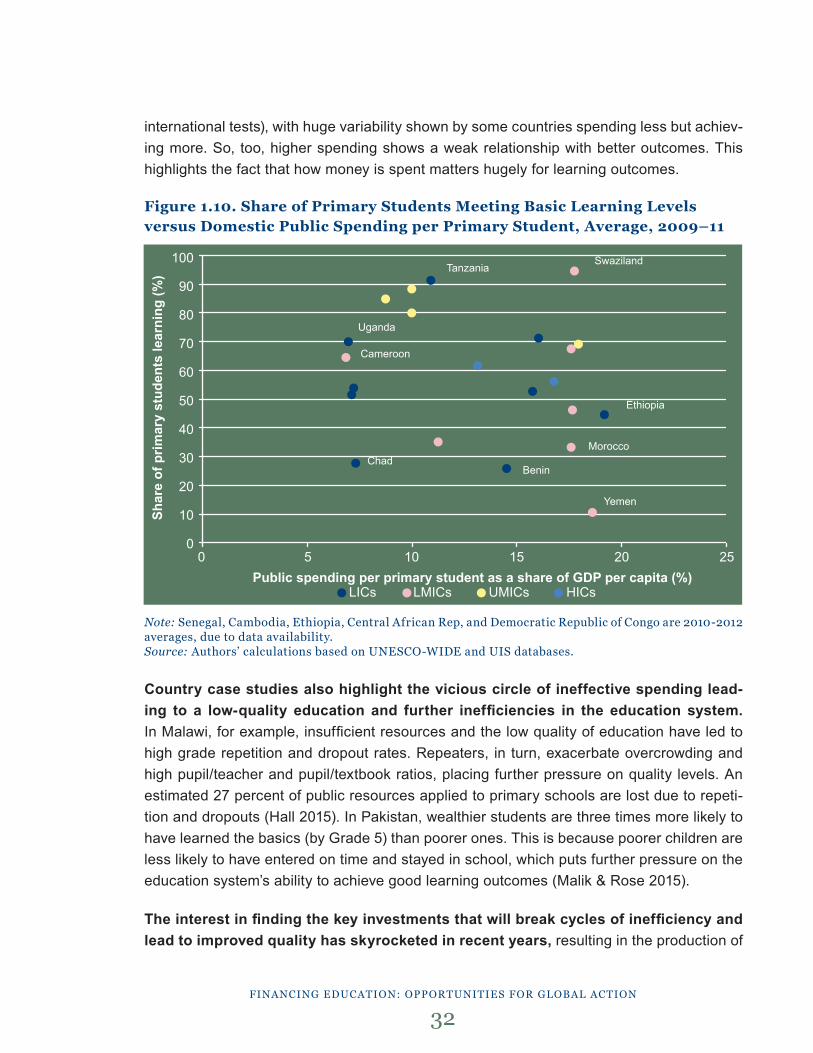
FinAnCing eduCAtion: opportunities For globAl ACtion
32
international tests), with huge variability shown by some countries spending less but achiev-ing more. So, too, higher spending shows a weak relationship with better outcomes. This highlights the fact that how money is spent matters hugely for learning outcomes.
Figure 1.10. Share of Primary Students Meeting Basic Learning Levels versus Domestic Public Spending per Primary Student, Average, 2009–11
Note: senegal, Cambodia, ethiopia, Central African rep, and democratic republic of Congo are 2010-2012 averages, due to data availability.Source: Authors’ calculations based on unesCo-Wide and uis databases.
Country case studies also highlight the vicious circle of ineffective spending lead-ing to a low-quality education and further inefficiencies in the education system. In Malawi, for example, insufficient resources and the low quality of education have led to high grade repetition and dropout rates. Repeaters, in turn, exacerbate overcrowding and high pupil/teacher and pupil/textbook ratios, placing further pressure on quality levels. An estimated 27 percent of public resources applied to primary schools are lost due to repeti-tion and dropouts (Hall 2015). In Pakistan, wealthier students are three times more likely to have learned the basics (by Grade 5) than poorer ones. This is because poorer children are less likely to have entered on time and stayed in school, which puts further pressure on the education system’s ability to achieve good learning outcomes (Malik & Rose 2015).
The interest in finding the key investments that will break cycles of inefficiency and lead to improved quality has skyrocketed in recent years, resulting in the production of
Shar
e of
prim
ary
stud
ents
lear
ning
(%)
100
90
80
70
60
50
40
30
20
10
0 0 5 10 15 20 25
Public spending per primary student as a share of GDP per capita (%)LICs LMICs UMICs HICs
Tanzania
Uganda
Cameroon
Ethiopia
Morocco
Yemen
BeninChad
Swaziland
FinAnCing eduCAtion: opportunities For globAl ACtion
33
dozens of experimental and quasi-experimental studies aimed at identifying the effective-ness of education interventions. In 2013 and 2014 alone, at least six comprehensive reviews of studies on how to improve student learning in primary schools were produced (Evans and Popova 2015).24 Although broad support could be found for some interventions,25 definitive evidence on how to achieve learning at scale, in particular in developing countries, remains scarce and contradictory. In response, rather than trying to define a blueprint, many devel-opment practitioners have been promoting tools found in complex systems research, al-lowing for iterative and adaptive approaches to education interventions that are specifically suited to local contexts.26
However, there is a growing recognition that particular interventions that fix par-ticular problems are often not enough and that more attention to systemic reform is urgently required. This includes paying greater attention to reforming school management systems (e.g., policy and planning, performance management, financing), to the development of and support for teachers, and to the creation of effective information and accountability mechanisms within a broader societal and political context. There is a need to address the misaligned incentives that are behind the system’s poor performance. Managing these in-centives is particularly important when more complex results, such as learning (rather than purely access to school), need to be achieved. The financing of education systems should be examined within this context. There is currently a gap in the availability of more macro- / system-level evidence on how education systems can deliver the required outcomes. New research is trying to fill this gap, including the multiyear RISE research program on effective education systems sponsored by the UK’s DFID and the World Bank’s Systems Approach for Better Education Results (SABER) program.27

FinAnCing eduCAtion: opportunities For globAl ACtion
34
2. What investments Are donors Making? Key Facts
he MDG period has seen a substantial increase in international efforts to finance development. During the past decade, gross ODA has more than doubled in real terms (in constant 2012 dollars), from $82 billion to $168 bil-
lion (figure 2.1). Multilateral aid grew faster than bilateral aid—146 percent versus 83 per-cent, respectively. Greater attention has also been paid to aid effectiveness. The Paris, Ac-cra and Busan declarations formulated global agendas to improve the impact of aid. There is much evidence that aid has contributed to development progress over the past decade, including in education.28 This chapter examines the trends in education aid and lays out the main challenges.
ln 2012, domestic spending on basic education in LICs was $11 billion, while it was $110 bil-lion in LMICs and $263 billion in UMICs (excluding China). Between 2011 and 2013, donors
T
Key Messages ■ Aid to education increased substantially over the MDG period, following overall growth
trends in total ODA, but is suffering from a recent decline.
■ Recent declines in aid stand in contrast to results of global surveys with citizens and World Bank client countries, which highlight education as a top development priority and area for World Bank support.
■ Recent declines have more acutely affected primary education and regions with high education and financing needs, particularly Sub-Saharan Africa.
■ Only 70 percent of sector-allocable aid for all levels of education are available for spending at the country level, compared to 86 percent for health.
■ Positively, emerging donors and nonconcessional sources of finance are growing and could be important additional sources of finance for education.
■ Donor fragmentation has increased over time, with one-third of donor relationships in education remaining insignificant.
■ Significant changes in the main players of aid to education have negative implications for sustained country partnerships and predictable allocations.
■ Lack of high-level donor coordination and geopolitical factors result in allocations not being targeted at countries most in need.
■ In addition to a greater focus on results, new financing approaches also include new and more flexible delivery mechanisms.

FinAnCing eduCAtion: opportunities For globAl ACtion
35
spent an annual average of $5.6 billion on basic education in all LICs and MICs (including budget support). This represents roughly 1.5 percent of the amount of total public spending (and less than 1 percent, if China is included). For LICs, ODA accounted for more than 20 percent (or $2.3 billion) of all domestic spending on basic education; for LMICs, ODA ac-counted for 2 percent (or $2.6 billion); and for UMICs, it accounted for less than 0.3 percent (or $0.7 billion; less than 0.1 percent, including China). Thus, though ODA has played an important part in resource flows in some LICs, in most developing country contexts, it must be judged by its catalytic role.
Important note on data: All aid figures in this section are expressed as gross disbursements. Unless otherwise noted, aid to education includes sector-allocable aid as well as a share of budget support. Education aid by level (e.g. primary, secondary, etc.) includes the level allo-cable aid as well as a share of education aid that is not allocable by level (level unspecified). Primary education aid includes aid to pre-primary education. This is labeled “basic” educa-tion aid in OECD DAC statistics. All figures are expressed in constant 2012 dollars. Further details about the methodology used for the aid estimates are given in annex 3.
Early Enthusiasm but Recent Decline in Aid for Education
Sector-allocable aid to total education increased substantially over the MDG period, rising from $5.3 billion in 2002 to $11.6 billion in 2013, which was more or less in stride with growth in overall aid. When accounting for budget support, trends in total education aid hold, increasing from $6.5 billion to $13.5 billion over the same period (figure 2.1).29
Figure 2.1. Total ODA (Left-Hand Panel) and Total Education Aid (Right-Hand Panel), 2002-2013
Source: oeCd-dAC Crs database.
200
180
160
140
120
100
80
60
40
20
-
16
14
12
10
8
6
4
2
-
2002
2003
2004
2005
2006
2007
2008
2009
2010
2011
2012
2013
2002
2003
2004
2005
2006
2007
2008
2009
2010
2011
2012
2013Dis
bure
sem
ents
con
stan
t 201
2 $,
bill
ions
Dis
bure
sem
ents
con
stan
t 201
2 $,
bill
ions
Total ODA Total Sector Allocable ODA
Total education (incl. budget support)
Total education - sector allocable
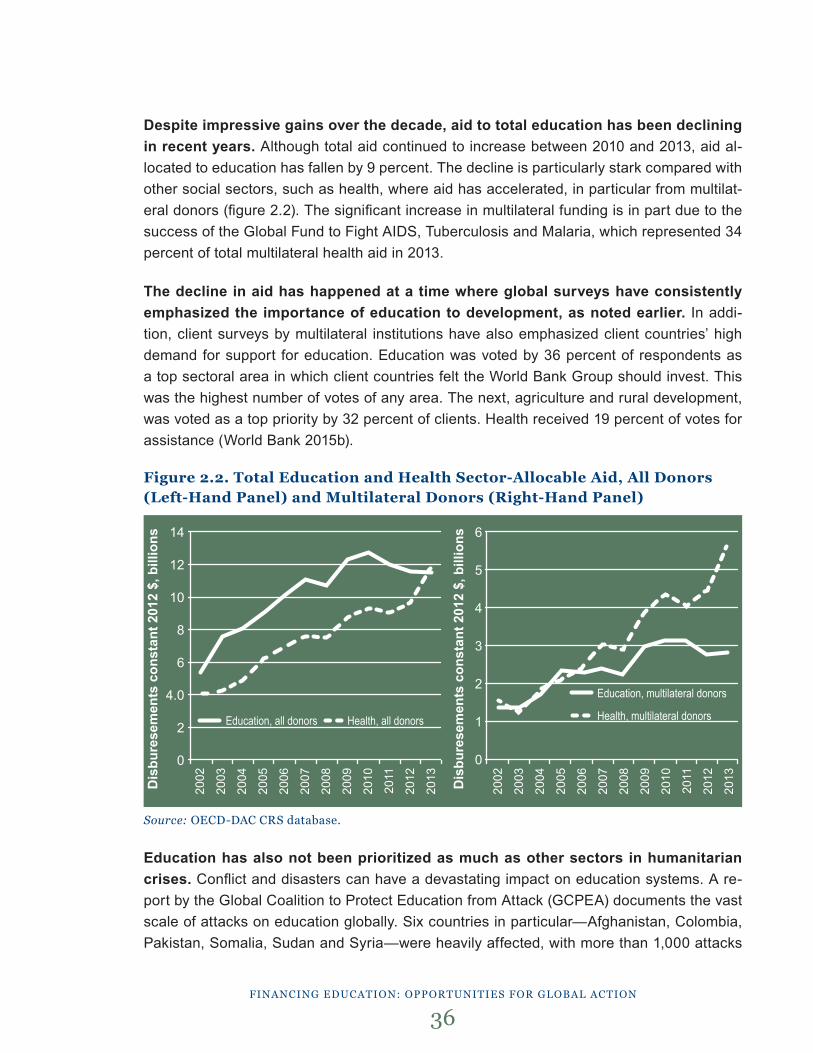
FinAnCing eduCAtion: opportunities For globAl ACtion
36
Despite impressive gains over the decade, aid to total education has been declining in recent years. Although total aid continued to increase between 2010 and 2013, aid al-located to education has fallen by 9 percent. The decline is particularly stark compared with other social sectors, such as health, where aid has accelerated, in particular from multilat-eral donors (figure 2.2). The significant increase in multilateral funding is in part due to the success of the Global Fund to Fight AIDS, Tuberculosis and Malaria, which represented 34 percent of total multilateral health aid in 2013.
The decline in aid has happened at a time where global surveys have consistently emphasized the importance of education to development, as noted earlier. In addi-tion, client surveys by multilateral institutions have also emphasized client countries’ high demand for support for education. Education was voted by 36 percent of respondents as a top sectoral area in which client countries felt the World Bank Group should invest. This was the highest number of votes of any area. The next, agriculture and rural development, was voted as a top priority by 32 percent of clients. Health received 19 percent of votes for assistance (World Bank 2015b).
Figure 2.2. Total Education and Health Sector-Allocable Aid, All Donors (Left-Hand Panel) and Multilateral Donors (Right-Hand Panel)
Source: oeCd-dAC Crs database.
Education has also not been prioritized as much as other sectors in humanitarian crises. Conflict and disasters can have a devastating impact on education systems. A re-port by the Global Coalition to Protect Education from Attack (GCPEA) documents the vast scale of attacks on education globally. Six countries in particular—Afghanistan, Colombia, Pakistan, Somalia, Sudan and Syria—were heavily affected, with more than 1,000 attacks
14
12
10
8
6
4.0
2
0
6
5
4
3
2
1
0
2002
2003
2004
2005
2006
2007
2008
2009
2010
2011
2012
2013
2002
2003
2004
2005
2006
2007
2008
2009
2010
2011
2012
2013Dis
bure
sem
ents
con
stan
t 201
2 $,
bill
ions
Dis
bure
sem
ents
con
stan
t 201
2 $,
bill
ions
Education, all donors Health, all donors
Education, multilateral donors
Health, multilateral donors
FinAnCing eduCAtion: opportunities For globAl ACtion
37
on schools, staff and students from 2009 to 2012 (GCPEA 2014). In Afghanistan alone, 553 schools (almost 10 percent) with 275,000 students were closed due to insecurity in 2012, and the number is probably higher today (Strand 2015). A recent review highlighted that conflict has a “strong negative impact” on education, including on enrollment, attendance, teachers and the education system (Nicolai and Hine 2015). Yet despite the great education needs in fragile and conflict-affected states, humanitarian aid for education remains limited. The visibility and importance of education in emergencies have grown, particularly with attention given to the Syrian refugee crisis, but education is not yet established as a key humanitarian sector (Avenir Analytics 2014).
Although humanitarian aid to education has grown significantly since 2000, it ac-counted for only 1.6 percent of total humanitarian aid in 2013 (figure 2.3). In addition, the education sector has a relatively large share of unmet requests—receiving an aver-age of only 37 percent of requested funding from 2011 to 2013, compared with an overall average rate of 63 percent for Consolidated Appeals Process and Flash Appeals. Since the establishment of the Common Humanitarian Fund, which is a pooled fund designed to increase responsiveness to emergencies, education received $106 million in funding from 2010 to 2012—or 3 percent of the total funding (Avenir Analytics 2014). For example, the 2015 Syria Response Plan has so far received $7.2 million in education funding, compared with the plan’s requirement of $224 million. Recent reports provide further details on edu-cation financing in humanitarian crises (Nicolai et al. 2015). Aid for education in emergen-cies is hampered by a number of factors. It is not seen as a humanitarian priority, it arrives through multiple channels, complicating coordination and effective delivery, and it tends to favor Western-based nongovernmental organizations (NGOs) over regional and local actors that may be better placed to deliver support (Greenhill et al. 2015; Nicolai et al. 2015; Avenir Analytics 2014). Limited funding, combined with significant coordination challenges, mean that the international aid architecture is ill-designed to respond to the longer-term needs resulting from humanitarian crises (GPE 2015).
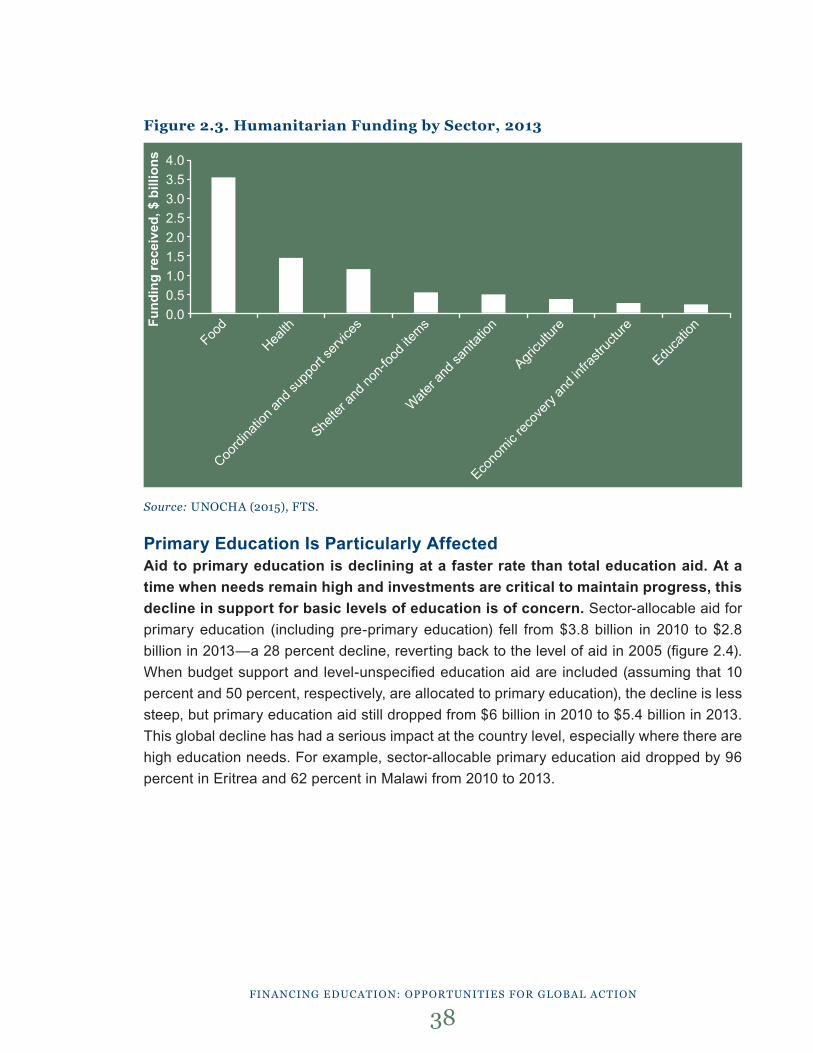
FinAnCing eduCAtion: opportunities For globAl ACtion
38
Figure 2.3. Humanitarian Funding by Sector, 2013
Source: unoCHA (2015), Fts.
Primary Education Is Particularly AffectedAid to primary education is declining at a faster rate than total education aid. At a time when needs remain high and investments are critical to maintain progress, this decline in support for basic levels of education is of concern. Sector-allocable aid for primary education (including pre-primary education) fell from $3.8 billion in 2010 to $2.8 billion in 2013—a 28 percent decline, reverting back to the level of aid in 2005 (figure 2.4). When budget support and level-unspecified education aid are included (assuming that 10 percent and 50 percent, respectively, are allocated to primary education), the decline is less steep, but primary education aid still dropped from $6 billion in 2010 to $5.4 billion in 2013. This global decline has had a serious impact at the country level, especially where there are high education needs. For example, sector-allocable primary education aid dropped by 96 percent in Eritrea and 62 percent in Malawi from 2010 to 2013.
4.03.53.02.52.01.51.00.50.0Fu
ndin
g re
ceiv
ed, $
bill
ions
Econo
mic rec
overy
and i
nfras
tructu
re
Agricu
lture
Water a
nd sa
nitati
on
Shelte
r and
non-f
ood i
tems
Coordi
natio
n and
supp
ort se
rvice
s
Health
Food
Educa
tion
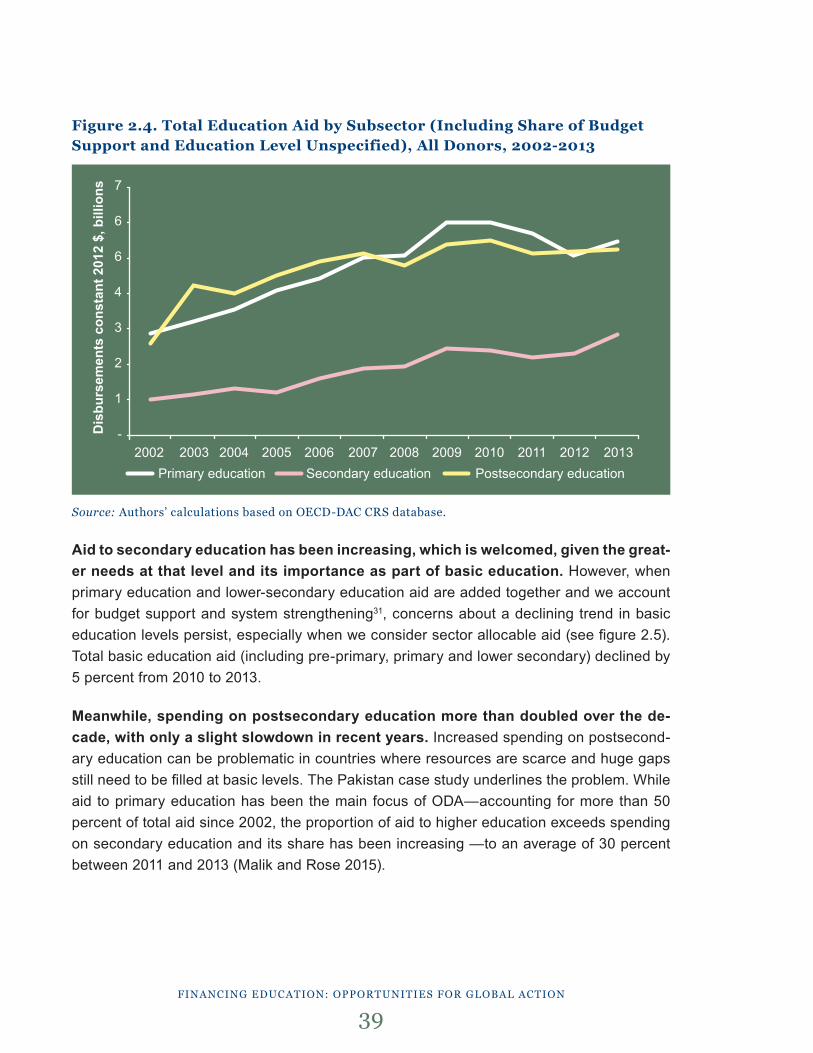
FinAnCing eduCAtion: opportunities For globAl ACtion
39
Figure 2.4. Total Education Aid by Subsector (Including Share of Budget Support and Education Level Unspecified), All Donors, 2002-2013
Source: Authors’ calculations based on oeCd-dAC Crs database.
Aid to secondary education has been increasing, which is welcomed, given the great-er needs at that level and its importance as part of basic education. However, when primary education and lower-secondary education aid are added together and we account for budget support and system strengthening31, concerns about a declining trend in basic education levels persist, especially when we consider sector allocable aid (see figure 2.5). Total basic education aid (including pre-primary, primary and lower secondary) declined by 5 percent from 2010 to 2013.
Meanwhile, spending on postsecondary education more than doubled over the de-cade, with only a slight slowdown in recent years. Increased spending on postsecond-ary education can be problematic in countries where resources are scarce and huge gaps still need to be filled at basic levels. The Pakistan case study underlines the problem. While aid to primary education has been the main focus of ODA—accounting for more than 50 percent of total aid since 2002, the proportion of aid to higher education exceeds spending on secondary education and its share has been increasing —to an average of 30 percent between 2011 and 2013 (Malik and Rose 2015).
7
6
6
4
3
2
1
-Dis
burs
emen
ts c
onst
ant 2
012
$, b
illio
ns
2002 2003 2004 2005 2006 2007 2008 2009 2010 2011 2012 2013Primary education Secondary education Postsecondary education
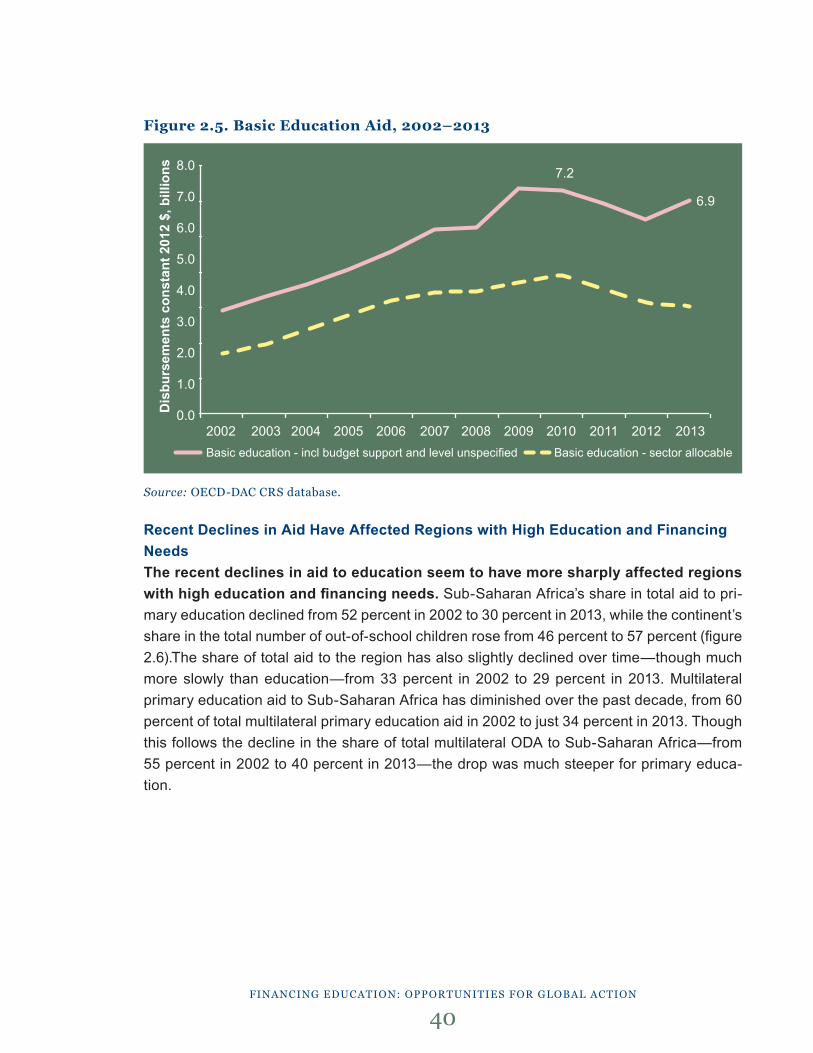
FinAnCing eduCAtion: opportunities For globAl ACtion
40
Figure 2.5. Basic Education Aid, 2002–2013
Source: oeCd-dAC Crs database.
Recent Declines in Aid Have Affected Regions with High Education and Financing NeedsThe recent declines in aid to education seem to have more sharply affected regions with high education and financing needs. Sub-Saharan Africa’s share in total aid to pri-mary education declined from 52 percent in 2002 to 30 percent in 2013, while the continent’s share in the total number of out-of-school children rose from 46 percent to 57 percent (figure 2.6).The share of total aid to the region has also slightly declined over time—though much more slowly than education—from 33 percent in 2002 to 29 percent in 2013. Multilateral primary education aid to Sub-Saharan Africa has diminished over the past decade, from 60 percent of total multilateral primary education aid in 2002 to just 34 percent in 2013. Though this follows the decline in the share of total multilateral ODA to Sub-Saharan Africa—from 55 percent in 2002 to 40 percent in 2013—the drop was much steeper for primary educa-tion.
8.0
7.0
6.0
5.0
4.0
3.0
2.0
1.0
0.0Dis
burs
emen
ts c
onst
ant 2
012
$, b
illio
ns
2002 2003 2004 2005 2006 2007 2008 2009 2010 2011 2012 2013Basic education - incl budget support and level unspecified Basic education - sector allocable
7.2
6.9
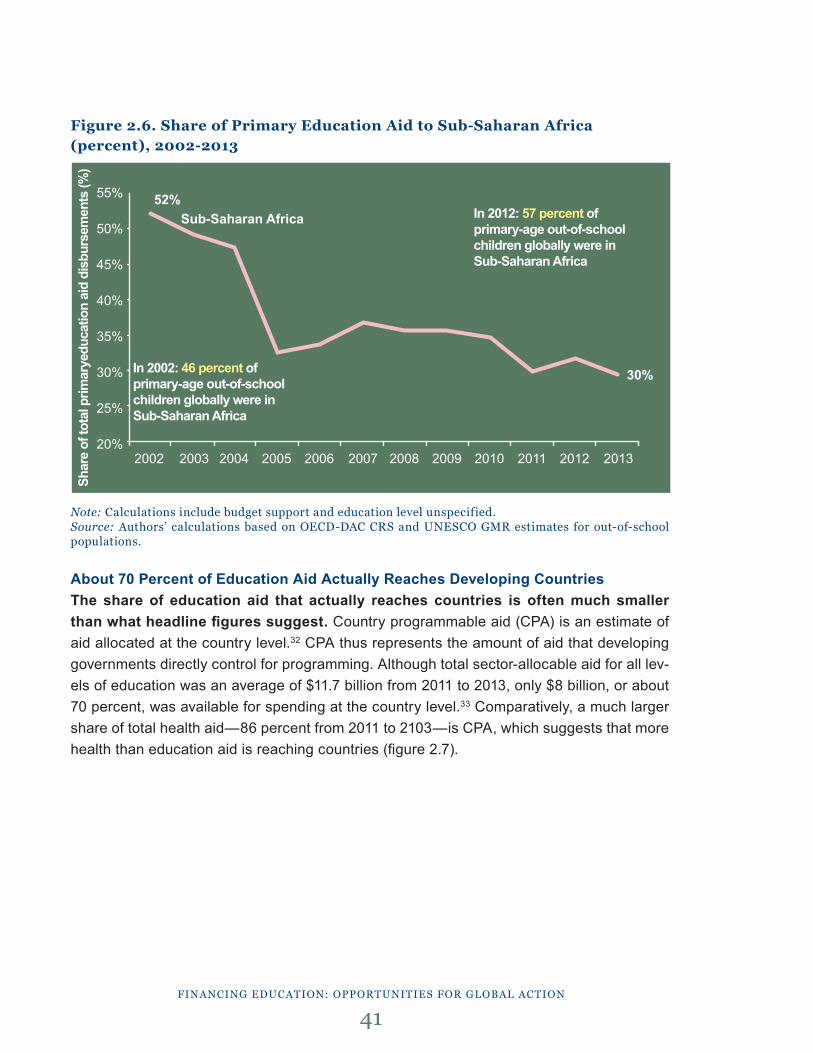
FinAnCing eduCAtion: opportunities For globAl ACtion
41
Figure 2.6. Share of Primary Education Aid to Sub-Saharan Africa (percent), 2002-2013
Note: Calculations include budget support and education level unspecified.Source: Authors’ calculations based on oeCd-dAC Crs and unesCo gMr estimates for out-of-school populations.
About 70 Percent of Education Aid Actually Reaches Developing CountriesThe share of education aid that actually reaches countries is often much smaller than what headline figures suggest. Country programmable aid (CPA) is an estimate of aid allocated at the country level.32 CPA thus represents the amount of aid that developing governments directly control for programming. Although total sector-allocable aid for all lev-els of education was an average of $11.7 billion from 2011 to 2013, only $8 billion, or about 70 percent, was available for spending at the country level.33 Comparatively, a much larger share of total health aid—86 percent from 2011 to 2103—is CPA, which suggests that more health than education aid is reaching countries (figure 2.7).
55%
50%
45%
40%
35%
30%
25%
20%
Shar
e of
tota
l prim
arye
duca
tion
aid
disb
urse
men
ts (%
)
2002 2003 2004 2005 2006 2007 2008 2009 2010 2011 2012 2013
In 2002: 46 percent of primary-age out-of-school children globally were in Sub-Saharan Africa
In 2012: 57 percent of primary-age out-of-school children globally were in Sub-Saharan Africa
52%
30%
Sub-Saharan Africa
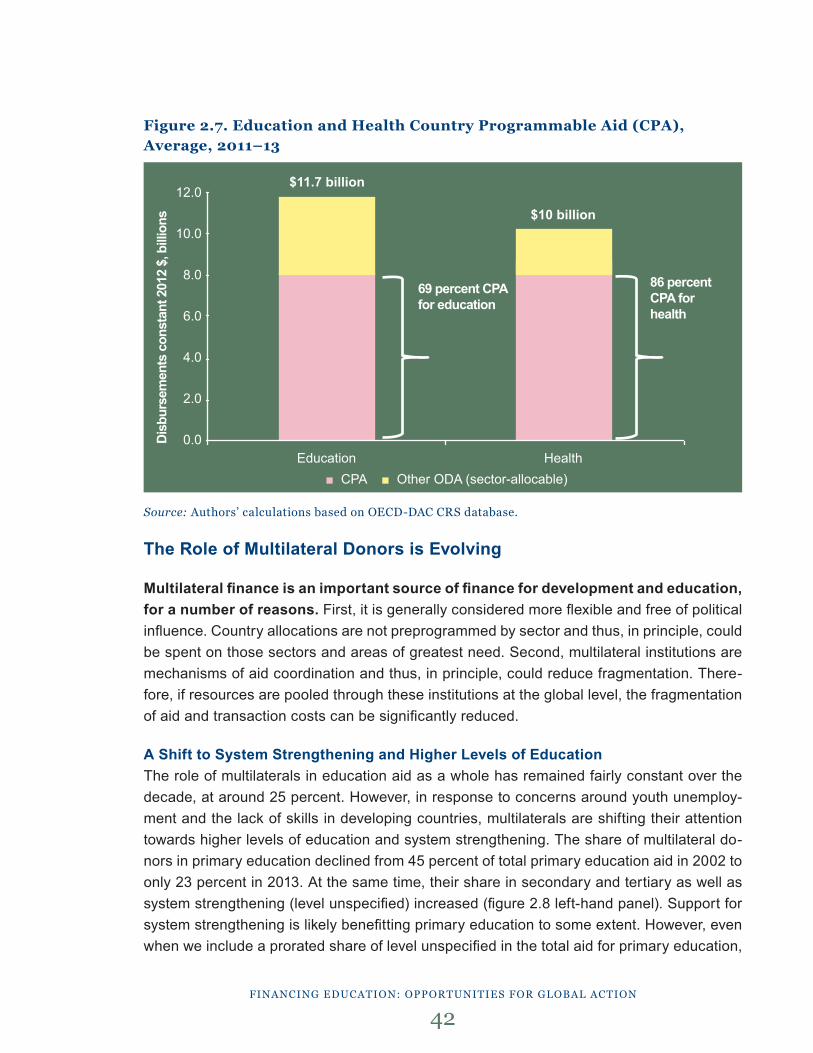
FinAnCing eduCAtion: opportunities For globAl ACtion
42
Figure 2.7. Education and Health Country Programmable Aid (CPA), Average, 2011–13
Source: Authors’ calculations based on oeCd-dAC Crs database.
The Role of Multilateral Donors is Evolving
Multilateral finance is an important source of finance for development and education, for a number of reasons. First, it is generally considered more flexible and free of political influence. Country allocations are not preprogrammed by sector and thus, in principle, could be spent on those sectors and areas of greatest need. Second, multilateral institutions are mechanisms of aid coordination and thus, in principle, could reduce fragmentation. There-fore, if resources are pooled through these institutions at the global level, the fragmentation of aid and transaction costs can be significantly reduced.
A Shift to System Strengthening and Higher Levels of EducationThe role of multilaterals in education aid as a whole has remained fairly constant over the decade, at around 25 percent. However, in response to concerns around youth unemploy-ment and the lack of skills in developing countries, multilaterals are shifting their attention towards higher levels of education and system strengthening. The share of multilateral do-nors in primary education declined from 45 percent of total primary education aid in 2002 to only 23 percent in 2013. At the same time, their share in secondary and tertiary as well as system strengthening (level unspecified) increased (figure 2.8 left-hand panel). Support for system strengthening is likely benefitting primary education to some extent. However, even when we include a prorated share of level unspecified in the total aid for primary education,
12.0
10.0
8.0
6.0
4.0
2.0
0.0Disb
urse
men
ts c
onst
ant 2
012
$, b
illio
ns
Education Health■ CPA ■ Other ODA (sector-allocable)
69 percent CPA for education
86 percent CPA for health
$11.7 billion
$10 billion
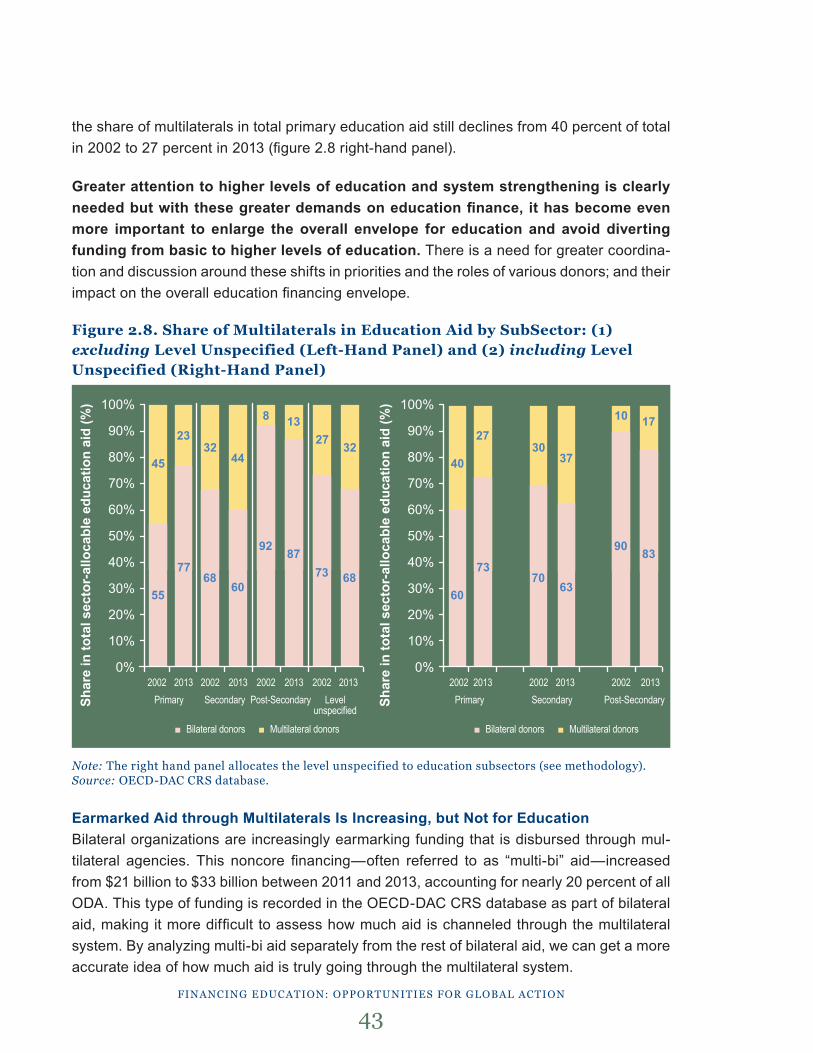
FinAnCing eduCAtion: opportunities For globAl ACtion
43
the share of multilaterals in total primary education aid still declines from 40 percent of total in 2002 to 27 percent in 2013 (figure 2.8 right-hand panel).
Greater attention to higher levels of education and system strengthening is clearly needed but with these greater demands on education finance, it has become even more important to enlarge the overall envelope for education and avoid diverting funding from basic to higher levels of education. There is a need for greater coordina-tion and discussion around these shifts in priorities and the roles of various donors; and their impact on the overall education financing envelope.
Figure 2.8. Share of Multilaterals in Education Aid by SubSector: (1) excluding Level Unspecified (Left-Hand Panel) and (2) including Level Unspecified (Right-Hand Panel)
Note: the right hand panel allocates the level unspecified to education subsectors (see methodology).Source: oeCd-dAC Crs database.
Earmarked Aid through Multilaterals Is Increasing, but Not for EducationBilateral organizations are increasingly earmarking funding that is disbursed through mul-tilateral agencies. This noncore financing—often referred to as “multi-bi” aid—increased from $21 billion to $33 billion between 2011 and 2013, accounting for nearly 20 percent of all ODA. This type of funding is recorded in the OECD-DAC CRS database as part of bilateral aid, making it more difficult to assess how much aid is channeled through the multilateral system. By analyzing multi-bi aid separately from the rest of bilateral aid, we can get a more accurate idea of how much aid is truly going through the multilateral system.
Shar
e in
tota
l sec
tor-
allo
cabl
e ed
ucat
ion
aid
(%)
Shar
e in
tota
l sec
tor-
allo
cabl
e ed
ucat
ion
aid
(%)100%
90%
80%
70%
60%
50%
40%
30%
20%
10%
0%
100%
90%
80%
70%
60%
50%
40%
30%
20%
10%
0% 2002 2013 2002 2013 2002 2013 2002 2013 Primary Secondary Post-Secondary Level unspecified
■ Bilateral donors ■ Multilateral donors
2002 2013 2002 2013 2002 2013 Primary Secondary Post-Secondary
■ Bilateral donors ■ Multilateral donors
45 4032 30
8 10
2723 27
44 37
13 17
32
55 6068 70
92 90
7377 7360 63
87 83
68
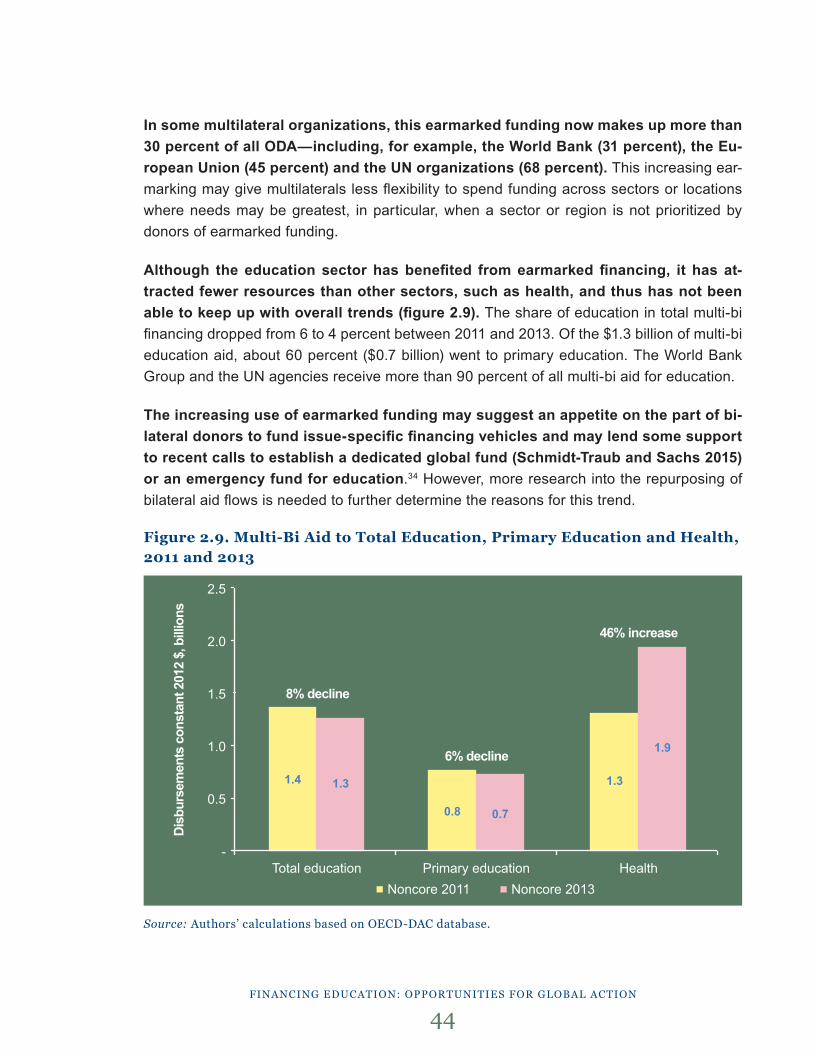
FinAnCing eduCAtion: opportunities For globAl ACtion
44
In some multilateral organizations, this earmarked funding now makes up more than 30 percent of all ODA—including, for example, the World Bank (31 percent), the Eu-ropean Union (45 percent) and the UN organizations (68 percent). This increasing ear-marking may give multilaterals less flexibility to spend funding across sectors or locations where needs may be greatest, in particular, when a sector or region is not prioritized by donors of earmarked funding.
Although the education sector has benefited from earmarked financing, it has at-tracted fewer resources than other sectors, such as health, and thus has not been able to keep up with overall trends (figure 2.9). The share of education in total multi-bi financing dropped from 6 to 4 percent between 2011 and 2013. Of the $1.3 billion of multi-bi education aid, about 60 percent ($0.7 billion) went to primary education. The World Bank Group and the UN agencies receive more than 90 percent of all multi-bi aid for education.
The increasing use of earmarked funding may suggest an appetite on the part of bi-lateral donors to fund issue-specific financing vehicles and may lend some support to recent calls to establish a dedicated global fund (Schmidt-Traub and Sachs 2015) or an emergency fund for education.34 However, more research into the repurposing of bilateral aid flows is needed to further determine the reasons for this trend.
Figure 2.9. Multi-Bi Aid to Total Education, Primary Education and Health, 2011 and 2013
Source: Authors’ calculations based on oeCd-dAC database.
Disb
urse
men
ts c
onst
ant 2
012
$, b
illio
ns
2.5
2.0
1.5
1.0
0.5
-
1.4
0.8
1.31.3
0.7
1.9
Total education Primary education Health■ Noncore 2011 ■ Noncore 2013
8% decline
6% decline
46% increase
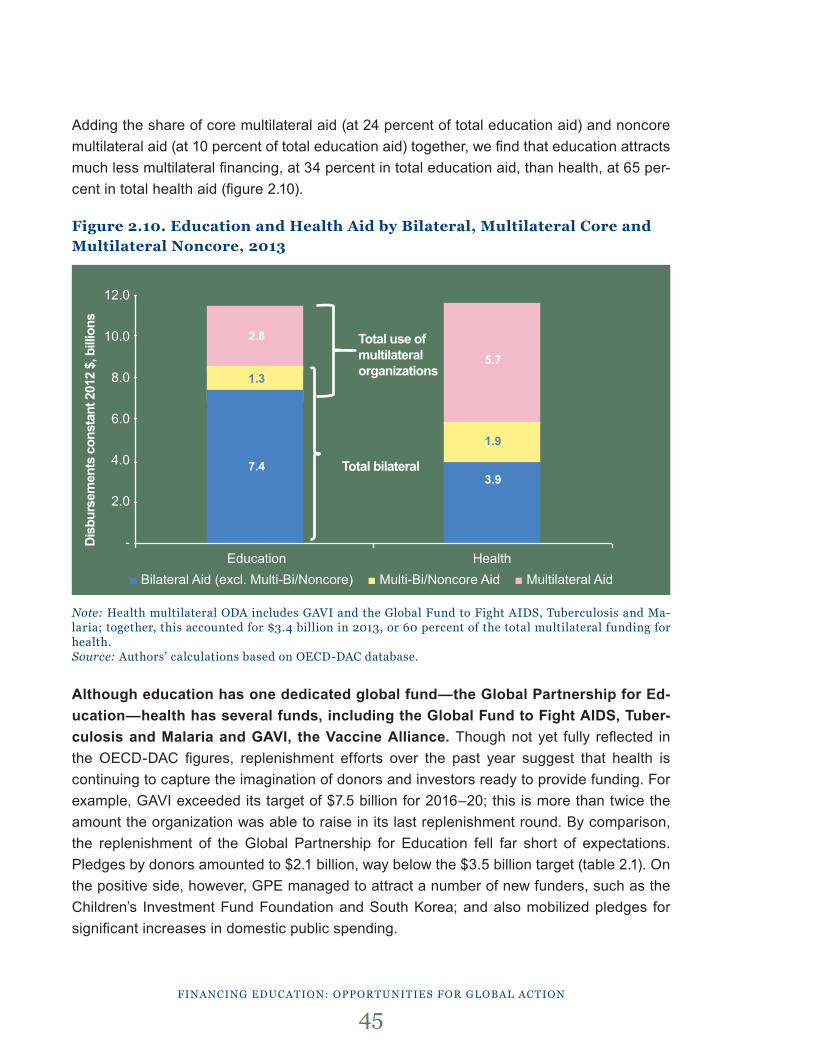
Adding the share of core multilateral aid (at 24 percent of total education aid) and noncore multilateral aid (at 10 percent of total education aid) together, we find that education attracts much less multilateral financing, at 34 percent in total education aid, than health, at 65 per-cent in total health aid (figure 2.10).
Figure 2.10. Education and Health Aid by Bilateral, Multilateral Core and Multilateral Noncore, 2013
Note: Health multilateral odA includes gAVi and the global Fund to Fight Aids, tuberculosis and Ma-laria; together, this accounted for $3.4 billion in 2013, or 60 percent of the total multilateral funding for health.Source: Authors’ calculations based on oeCd-dAC database.
Although education has one dedicated global fund—the Global Partnership for Ed-ucation—health has several funds, including the Global Fund to Fight AIDS, Tuber-culosis and Malaria and GAVI, the Vaccine Alliance. Though not yet fully reflected in the OECD-DAC figures, replenishment efforts over the past year suggest that health is continuing to capture the imagination of donors and investors ready to provide funding. For example, GAVI exceeded its target of $7.5 billion for 2016–20; this is more than twice the amount the organization was able to raise in its last replenishment round. By comparison, the replenishment of the Global Partnership for Education fell far short of expectations. Pledges by donors amounted to $2.1 billion, way below the $3.5 billion target (table 2.1). On the positive side, however, GPE managed to attract a number of new funders, such as the Children’s Investment Fund Foundation and South Korea; and also mobilized pledges for significant increases in domestic public spending.
FinAnCing eduCAtion: opportunities For globAl ACtion
45
12.0
10.0
8.0
6.0
4.0
2.0
-Disb
urse
men
ts c
onst
ant 2
012
$, b
illio
ns
Education Health■ Bilateral Aid (excl. Multi-Bi/Noncore) ■ Multi-Bi/Noncore Aid ■ Multilateral Aid
Total bilateral
Total use of multilateral organizations
2.8
5.7
3.97.4
1.3
1.9
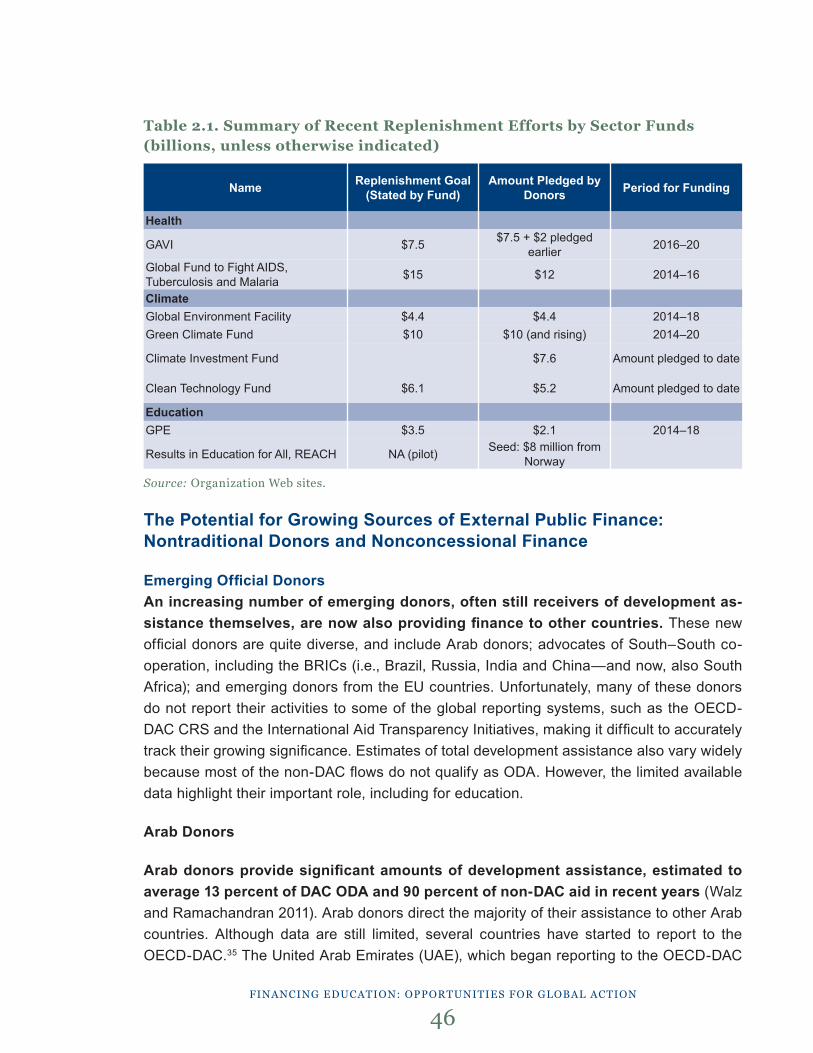
FinAnCing eduCAtion: opportunities For globAl ACtion
46
Table 2.1. Summary of Recent Replenishment Efforts by Sector Funds (billions, unless otherwise indicated)
Source: organization Web sites.
The Potential for Growing Sources of External Public Finance: Nontraditional Donors and Nonconcessional Finance
Emerging Official DonorsAn increasing number of emerging donors, often still receivers of development as-sistance themselves, are now also providing finance to other countries. These new official donors are quite diverse, and include Arab donors; advocates of South–South co-operation, including the BRICs (i.e., Brazil, Russia, India and China—and now, also South Africa); and emerging donors from the EU countries. Unfortunately, many of these donors do not report their activities to some of the global reporting systems, such as the OECD-DAC CRS and the International Aid Transparency Initiatives, making it difficult to accurately track their growing significance. Estimates of total development assistance also vary widely because most of the non-DAC flows do not qualify as ODA. However, the limited available data highlight their important role, including for education.
Arab Donors
Arab donors provide significant amounts of development assistance, estimated to average 13 percent of DAC ODA and 90 percent of non-DAC aid in recent years (Walz and Ramachandran 2011). Arab donors direct the majority of their assistance to other Arab countries. Although data are still limited, several countries have started to report to the OECD-DAC.35 The United Arab Emirates (UAE), which began reporting to the OECD-DAC
Name
Health
GAVI
Climate
Green Climate Fund
Clean Technology Fund
GPE
Global Fund to Fight AIDS, Tuberculosis and Malaria
Global Environment Facility
Climate Investment Fund
Education
Results in Education for All, REACH
Replenishment Goal (Stated by Fund)
$7.5
$10
$6.1
$3.5
$15
$4.4
NA (pilot)
Amount Pledged by Donors
$7.5 + $2 pledged earlier
$10 (and rising)
$5.2
$2.1
$12
$4.4
$7.6
Seed: $8 million from Norway
Period for Funding
2016–20
2014–20
Amount pledged to date
2014–18
2014–16
2014–18
Amount pledged to date
in 2010, highlights the potential of these new actors. Though starting from a low base, the UAE’s sector-allocable aid to education more than quadrupled between 2009 and 2013, from $23 million to $100 million. The growth in the UAE’s overall aid has been driven by large allocations of general budget support (GBS), however, which was 56 percent of the country’s total lending in 2013. When including GBS, the UAE’s total education aid would jump to $709 million in 2013. Some of this GBS is likely benefiting education, but it should be noted that less than 2 percent of the UAE’s sector-allocable aid was allocated to education, compared with 5 percent to health and 19 percent to production services. The Lebanese case study also highlights that while a significant amount of financing for the Syrian crisis has come from Gulf countries, education has not been a priority. Only 1.5 percent of total regional donor funds36 to the Syria crisis have been allocated to education and less than 0.1 percent of these funds went to education in Lebanon (Jalbout 2015).
Various types of other official Arab donors also offer opportunities for increased education financing. From 2010 to 2012, the Islamic Development Bank and the Saudi Fund for Development contributed $740 million and $690 million, respectively, to education, though the bulk of these contributions were loans, nonconcessional financing and technical expertise (Jalbout 2014).
South–South Cooperation
South–South donors follow a distinctly different model of development assistance from that of the OECD-DAC. Southern donors, primarily the BRICs, are largely developing MICs that provide assistance in the form of expertise and technical assistance (Walz and Ramachandran 2011). In addition to the BRICs, Colombia, Egypt and Thailand provide de-velopment assistance through similar modalities. Aid from these donors is extremely difficult to calculate, however, because they do not yet report to the DAC.
China, along with other emerging donors like India, is increasingly engaging in fi-nancing development in Africa, Latin America and part of Southeast Asia. According to estimates, China gave more than $3 billion in ODA-like financial aid in 2013, or 34 per-cent of the aid given by the 19 DAC donors.37 According to AidData,38 China has launched 258 programs (including completed and implementing ones) of ODA-like financial aid in the education sector, mostly in African countries, compared with 390 programs in the health sector. Interestingly, and in contrast to other bilateral donors, the number of new education programs that China began increased from 2010 to 2013.
The EU and Emerging Donors
Emerging donors, primarily new European Union member states, are establishing or reviving aid programs that are largely aligned with the DAC model of assistance.
FinAnCing eduCAtion: opportunities For globAl ACtion
47
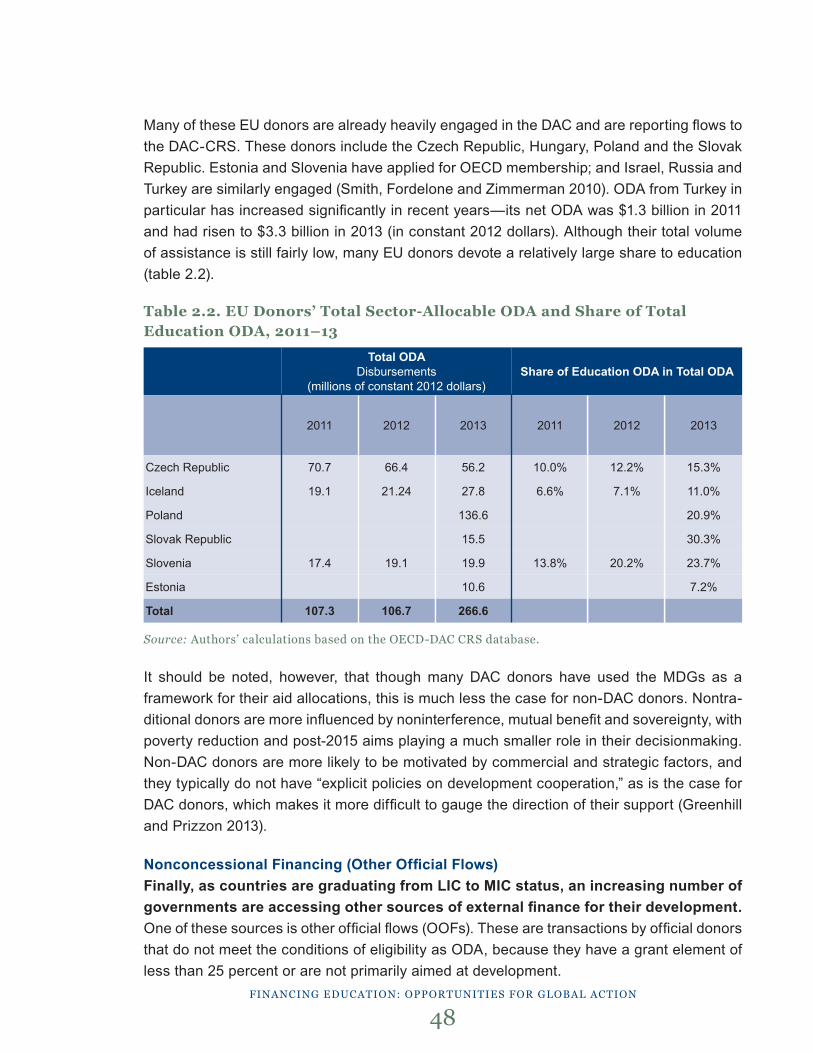
FinAnCing eduCAtion: opportunities For globAl ACtion
48
Many of these EU donors are already heavily engaged in the DAC and are reporting flows to the DAC-CRS. These donors include the Czech Republic, Hungary, Poland and the Slovak Republic. Estonia and Slovenia have applied for OECD membership; and Israel, Russia and Turkey are similarly engaged (Smith, Fordelone and Zimmerman 2010). ODA from Turkey in particular has increased significantly in recent years—its net ODA was $1.3 billion in 2011 and had risen to $3.3 billion in 2013 (in constant 2012 dollars). Although their total volume of assistance is still fairly low, many EU donors devote a relatively large share to education (table 2.2).
Table 2.2. EU Donors’ Total Sector-Allocable ODA and Share of Total Education ODA, 2011–13
Source: Authors’ calculations based on the oeCd-dAC Crs database.
It should be noted, however, that though many DAC donors have used the MDGs as a framework for their aid allocations, this is much less the case for non-DAC donors. Nontra-ditional donors are more influenced by noninterference, mutual benefit and sovereignty, with poverty reduction and post-2015 aims playing a much smaller role in their decisionmaking. Non-DAC donors are more likely to be motivated by commercial and strategic factors, and they typically do not have “explicit policies on development cooperation,” as is the case for DAC donors, which makes it more difficult to gauge the direction of their support (Greenhill and Prizzon 2013).
Nonconcessional Financing (Other Official Flows)Finally, as countries are graduating from LIC to MIC status, an increasing number of governments are accessing other sources of external finance for their development. One of these sources is other official flows (OOFs). These are transactions by official donors that do not meet the conditions of eligibility as ODA, because they have a grant element of less than 25 percent or are not primarily aimed at development.
Czech Republic
Iceland
Poland
Slovak Republic
Slovenia
Estonia
Total
Total ODADisbursements
(millions of constant 2012 dollars) Share of Education ODA in Total ODA
2011
70.7
19.1
17.4
107.3
2012
66.4
21.24
19.1
106.7
2013
56.2
27.8
136.6
15.5
19.9
10.6
266.6
2011
10.0%
6.6%
13.8%
2012
12.2%
7.1%
20.2%
2013
15.3%
11.0%
20.9%
30.3%
23.7%
7.2%
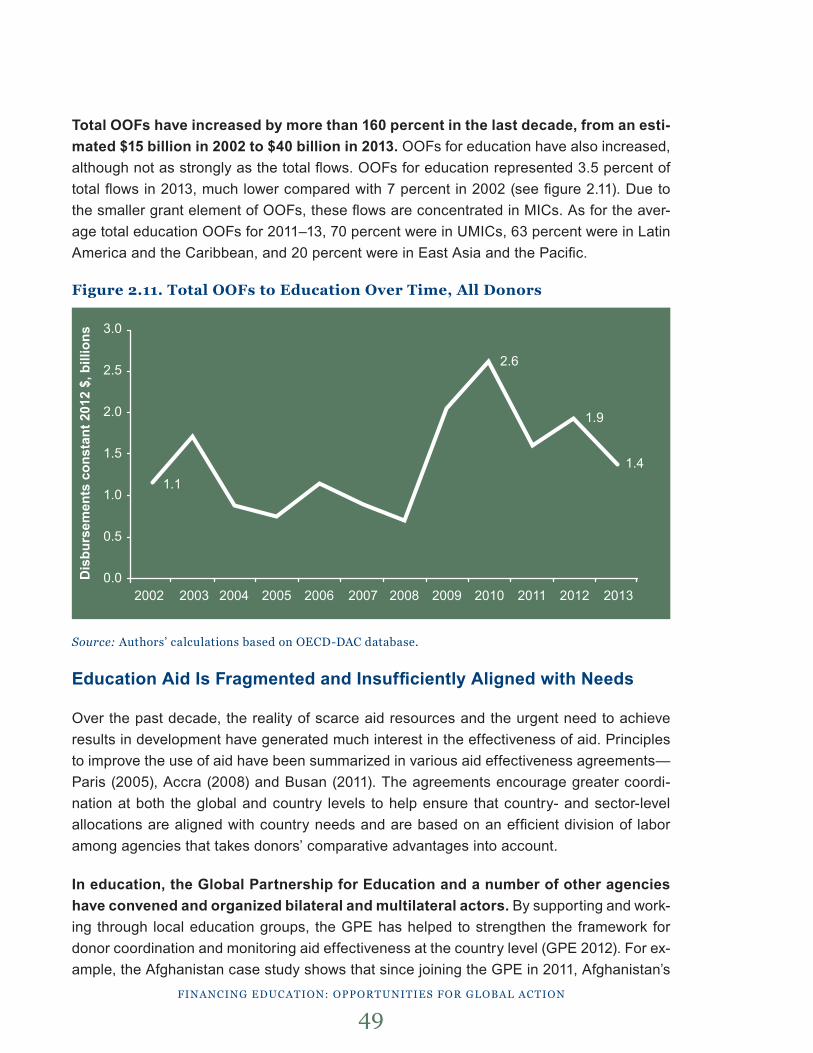
FinAnCing eduCAtion: opportunities For globAl ACtion
49
Total OOFs have increased by more than 160 percent in the last decade, from an esti-mated $15 billion in 2002 to $40 billion in 2013. OOFs for education have also increased, although not as strongly as the total flows. OOFs for education represented 3.5 percent of total flows in 2013, much lower compared with 7 percent in 2002 (see figure 2.11). Due to the smaller grant element of OOFs, these flows are concentrated in MICs. As for the aver-age total education OOFs for 2011–13, 70 percent were in UMICs, 63 percent were in Latin America and the Caribbean, and 20 percent were in East Asia and the Pacific.
Figure 2.11. Total OOFs to Education Over Time, All Donors
Source: Authors’ calculations based on oeCd-dAC database.
Education Aid Is Fragmented and Insufficiently Aligned with Needs
Over the past decade, the reality of scarce aid resources and the urgent need to achieve results in development have generated much interest in the effectiveness of aid. Principles to improve the use of aid have been summarized in various aid effectiveness agreements—Paris (2005), Accra (2008) and Busan (2011). The agreements encourage greater coordi-nation at both the global and country levels to help ensure that country- and sector-level allocations are aligned with country needs and are based on an efficient division of labor among agencies that takes donors’ comparative advantages into account.
In education, the Global Partnership for Education and a number of other agencies have convened and organized bilateral and multilateral actors. By supporting and work-ing through local education groups, the GPE has helped to strengthen the framework for donor coordination and monitoring aid effectiveness at the country level (GPE 2012). For ex-ample, the Afghanistan case study shows that since joining the GPE in 2011, Afghanistan’s
3.0
2.5
2.0
1.5
1.0
0.5
0.0Dis
burs
emen
ts c
onst
ant 2
012
$, b
illio
ns
2002 2003 2004 2005 2006 2007 2008 2009 2010 2011 2012 2013
1.1
2.6
1.9
1.4
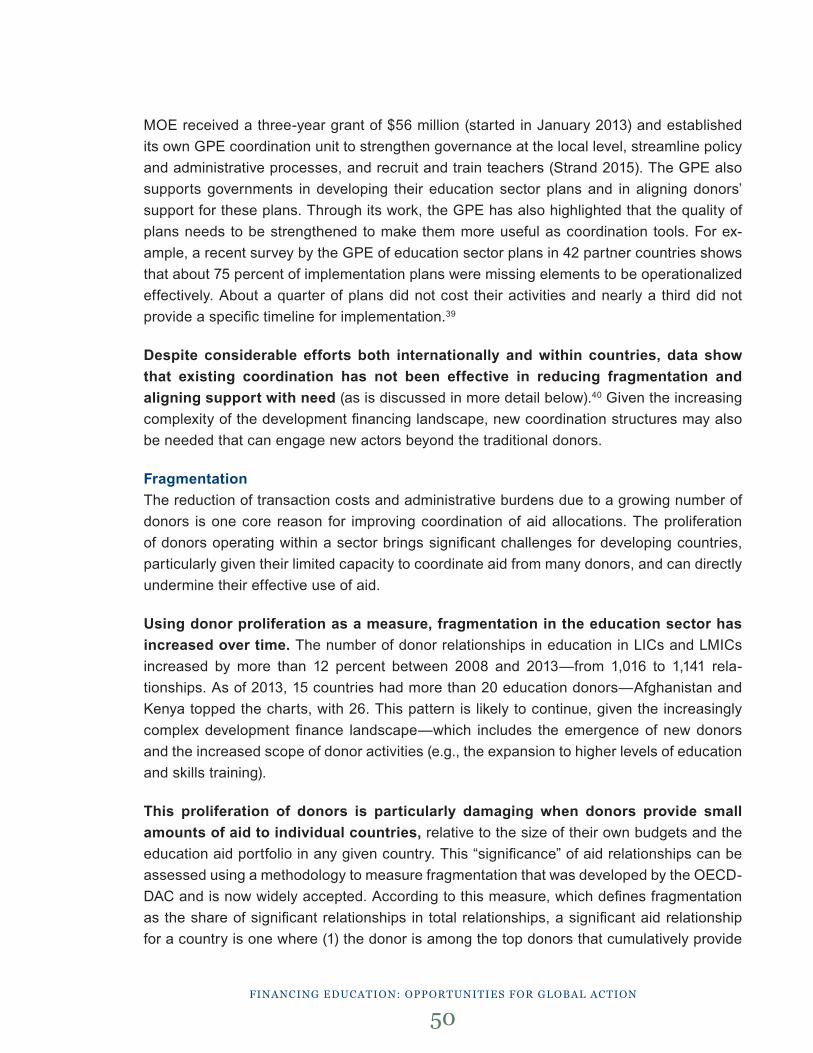
FinAnCing eduCAtion: opportunities For globAl ACtion
50
MOE received a three-year grant of $56 million (started in January 2013) and established its own GPE coordination unit to strengthen governance at the local level, streamline policy and administrative processes, and recruit and train teachers (Strand 2015). The GPE also supports governments in developing their education sector plans and in aligning donors’ support for these plans. Through its work, the GPE has also highlighted that the quality of plans needs to be strengthened to make them more useful as coordination tools. For ex-ample, a recent survey by the GPE of education sector plans in 42 partner countries shows that about 75 percent of implementation plans were missing elements to be operationalized effectively. About a quarter of plans did not cost their activities and nearly a third did not provide a specific timeline for implementation.39
Despite considerable efforts both internationally and within countries, data show that existing coordination has not been effective in reducing fragmentation and aligning support with need (as is discussed in more detail below).40 Given the increasing complexity of the development financing landscape, new coordination structures may also be needed that can engage new actors beyond the traditional donors.
FragmentationThe reduction of transaction costs and administrative burdens due to a growing number of donors is one core reason for improving coordination of aid allocations. The proliferation of donors operating within a sector brings significant challenges for developing countries, particularly given their limited capacity to coordinate aid from many donors, and can directly undermine their effective use of aid.
Using donor proliferation as a measure, fragmentation in the education sector has increased over time. The number of donor relationships in education in LICs and LMICs increased by more than 12 percent between 2008 and 2013—from 1,016 to 1,141 rela-tionships. As of 2013, 15 countries had more than 20 education donors—Afghanistan and Kenya topped the charts, with 26. This pattern is likely to continue, given the increasingly complex development finance landscape—which includes the emergence of new donors and the increased scope of donor activities (e.g., the expansion to higher levels of education and skills training).
This proliferation of donors is particularly damaging when donors provide small amounts of aid to individual countries, relative to the size of their own budgets and the education aid portfolio in any given country. This “significance” of aid relationships can be assessed using a methodology to measure fragmentation that was developed by the OECD-DAC and is now widely accepted. According to this measure, which defines fragmentation as the share of significant relationships in total relationships, a significant aid relationship for a country is one where (1) the donor is among the top donors that cumulatively provide
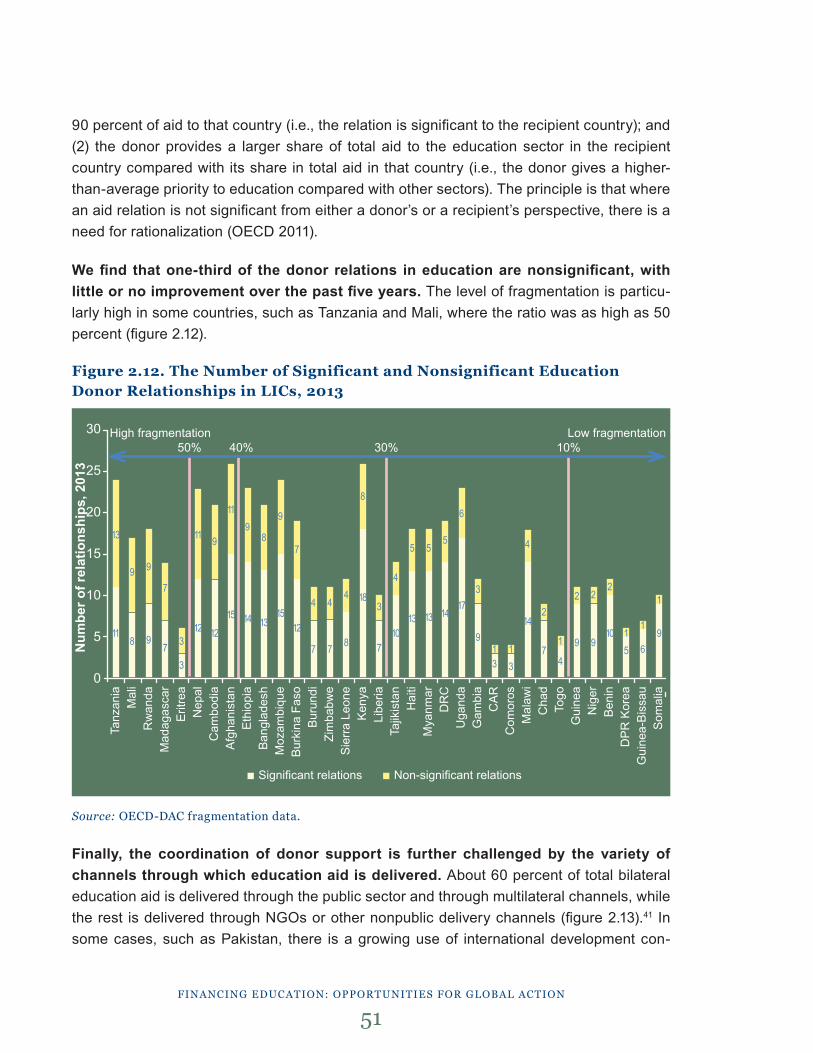
FinAnCing eduCAtion: opportunities For globAl ACtion
51
90 percent of aid to that country (i.e., the relation is significant to the recipient country); and (2) the donor provides a larger share of total aid to the education sector in the recipient country compared with its share in total aid in that country (i.e., the donor gives a higher-than-average priority to education compared with other sectors). The principle is that where an aid relation is not significant from either a donor’s or a recipient’s perspective, there is a need for rationalization (OECD 2011).
We find that one-third of the donor relations in education are nonsignificant, with little or no improvement over the past five years. The level of fragmentation is particu-larly high in some countries, such as Tanzania and Mali, where the ratio was as high as 50 percent (figure 2.12).
Figure 2.12. The Number of Significant and Nonsignificant Education Donor Relationships in LICs, 2013
Source: oeCd-dAC fragmentation data.
Finally, the coordination of donor support is further challenged by the variety of channels through which education aid is delivered. About 60 percent of total bilateral education aid is delivered through the public sector and through multilateral channels, while the rest is delivered through NGOs or other nonpublic delivery channels (figure 2.13).41 In some cases, such as Pakistan, there is a growing use of international development con-
Tanz
ania
Mal
iR
wan
daM
adag
asca
rE
ritre
aN
epal
Cam
bodi
aA
fgha
nist
anE
thio
pia
Ban
glad
esh
Moz
ambi
que
Bur
kina
Fas
oB
urun
diZi
mba
bwe
Sie
rra
Leon
eK
enya
Libe
riaTa
jikis
tan
Hai
tiM
yanm
arD
RC
Uga
nda
Gam
bia
CA
RC
omor
osM
alaw
iC
had
Togo
Gui
nea
Nig
erB
enin
DP
R K
orea
Gui
nea-
Bis
sau
Som
alia
13
9 9
7
3
11 9
119
8
9
7
4 44
8
3
4
5 55
6
3
1 1
4
2
1
2 22
11
1
118 9
73
12 12
15 14 1315
12
7 7 8
18
710
13 13 1417
9
3 3
14
74
9 910
5 69
High fragmentation Low fragmentation 50% 40% 30% 10%
■ Significant relations ■ Non-significant relations
Num
ber o
f rel
atio
nshi
ps, 2
013
30
25
20
15
10
5
0
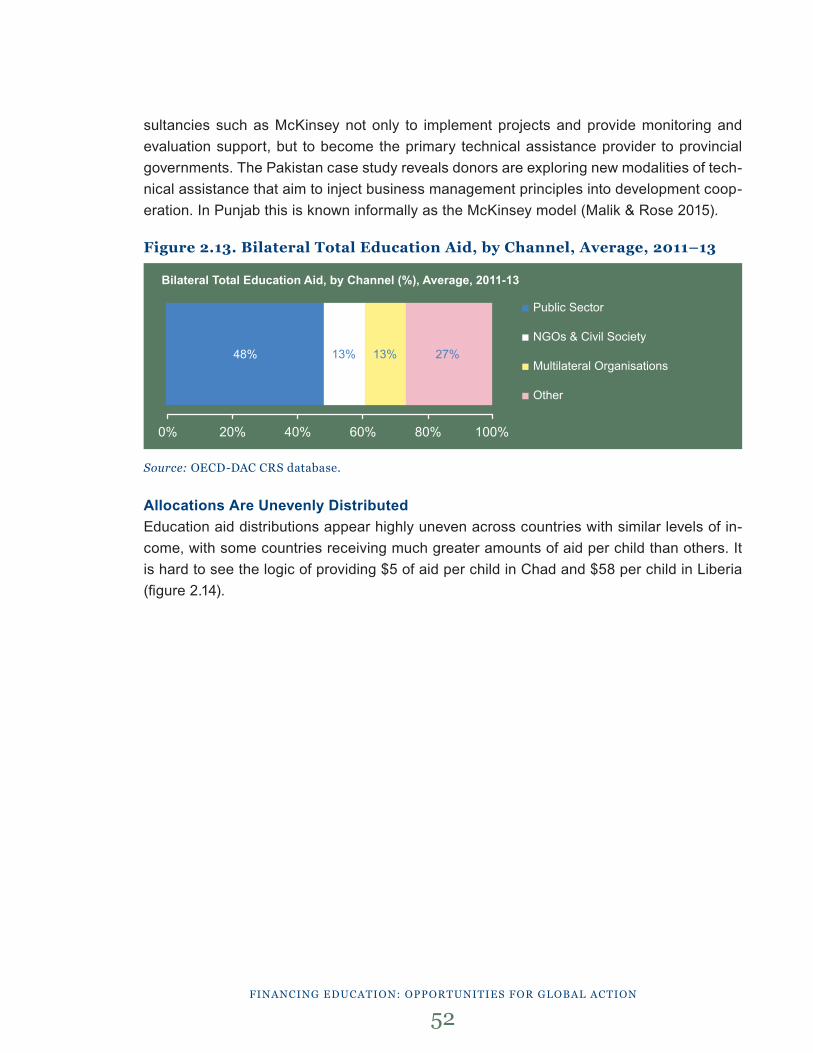
FinAnCing eduCAtion: opportunities For globAl ACtion
52
sultancies such as McKinsey not only to implement projects and provide monitoring and evaluation support, but to become the primary technical assistance provider to provincial governments. The Pakistan case study reveals donors are exploring new modalities of tech-nical assistance that aim to inject business management principles into development coop-eration. In Punjab this is known informally as the McKinsey model (Malik & Rose 2015).
Figure 2.13. Bilateral Total Education Aid, by Channel, Average, 2011–13
Source: oeCd-dAC Crs database.
Allocations Are Unevenly DistributedEducation aid distributions appear highly uneven across countries with similar levels of in-come, with some countries receiving much greater amounts of aid per child than others. It is hard to see the logic of providing $5 of aid per child in Chad and $58 per child in Liberia (figure 2.14).
48% 13% 13% 27%
■ Public Sector
■ NGOs & Civil Society
■ Multilateral Organisations
■ Other
Bilateral Total Education Aid, by Channel (%), Average, 2011-13
0% 20% 40% 60% 80% 100%
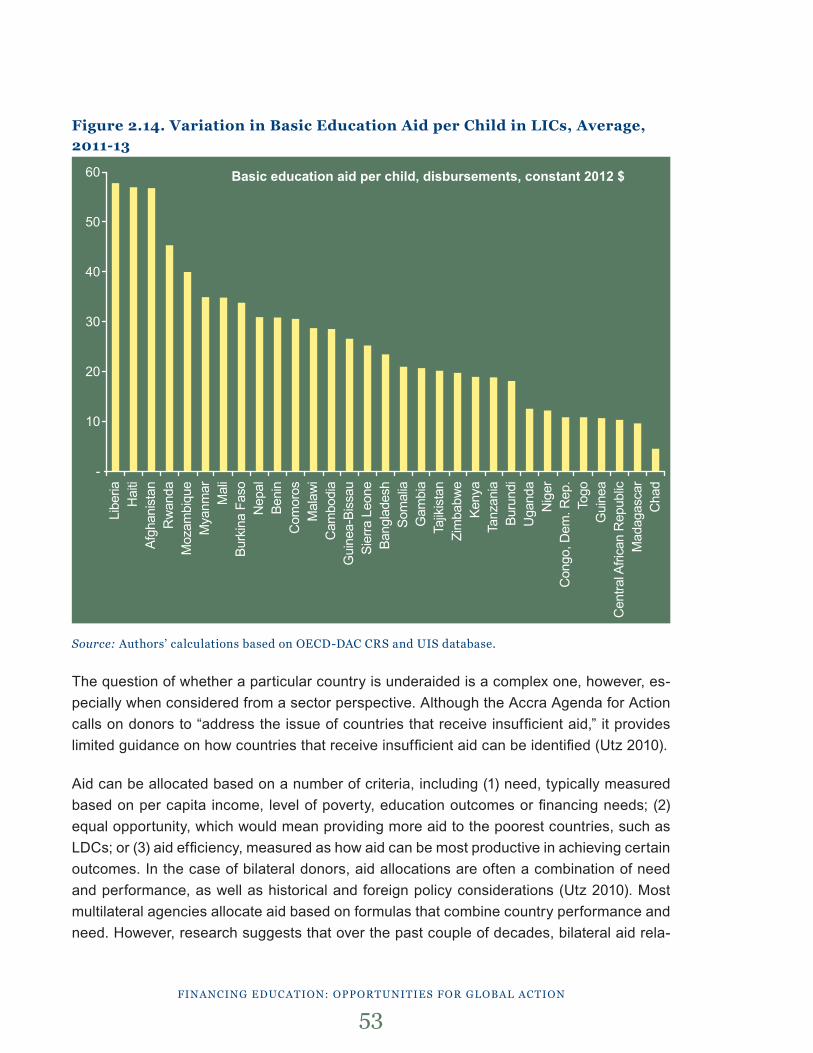
FinAnCing eduCAtion: opportunities For globAl ACtion
53
Figure 2.14. Variation in Basic Education Aid per Child in LICs, Average, 2011-13
Source: Authors’ calculations based on oeCd-dAC Crs and uis database.
The question of whether a particular country is underaided is a complex one, however, es-pecially when considered from a sector perspective. Although the Accra Agenda for Action calls on donors to “address the issue of countries that receive insufficient aid,” it provides limited guidance on how countries that receive insufficient aid can be identified (Utz 2010).
Aid can be allocated based on a number of criteria, including (1) need, typically measured based on per capita income, level of poverty, education outcomes or financing needs; (2) equal opportunity, which would mean providing more aid to the poorest countries, such as LDCs; or (3) aid efficiency, measured as how aid can be most productive in achieving certain outcomes. In the case of bilateral donors, aid allocations are often a combination of need and performance, as well as historical and foreign policy considerations (Utz 2010). Most multilateral agencies allocate aid based on formulas that combine country performance and need. However, research suggests that over the past couple of decades, bilateral aid rela-
Libe
riaH
aiti
Afgh
anis
tan
Rw
anda
Moz
ambi
que
Mya
nmar
Mal
iBu
rkin
a Fa
soN
epal
Beni
nC
omor
osM
alaw
iC
ambo
dia
Gui
nea-
Biss
auSi
erra
Leo
neBa
ngla
desh
Som
alia
Gam
bia
Tajik
ista
nZi
mba
bwe
Keny
aTa
nzan
iaBu
rund
iU
gand
aN
iger
Con
go, D
em. R
ep.
Togo
Gui
nea
Cen
tral A
frica
n R
epub
licM
adag
asca
rC
had
60
50
40
30
20
10
-
Basic education aid per child, disbursements, constant 2012 $
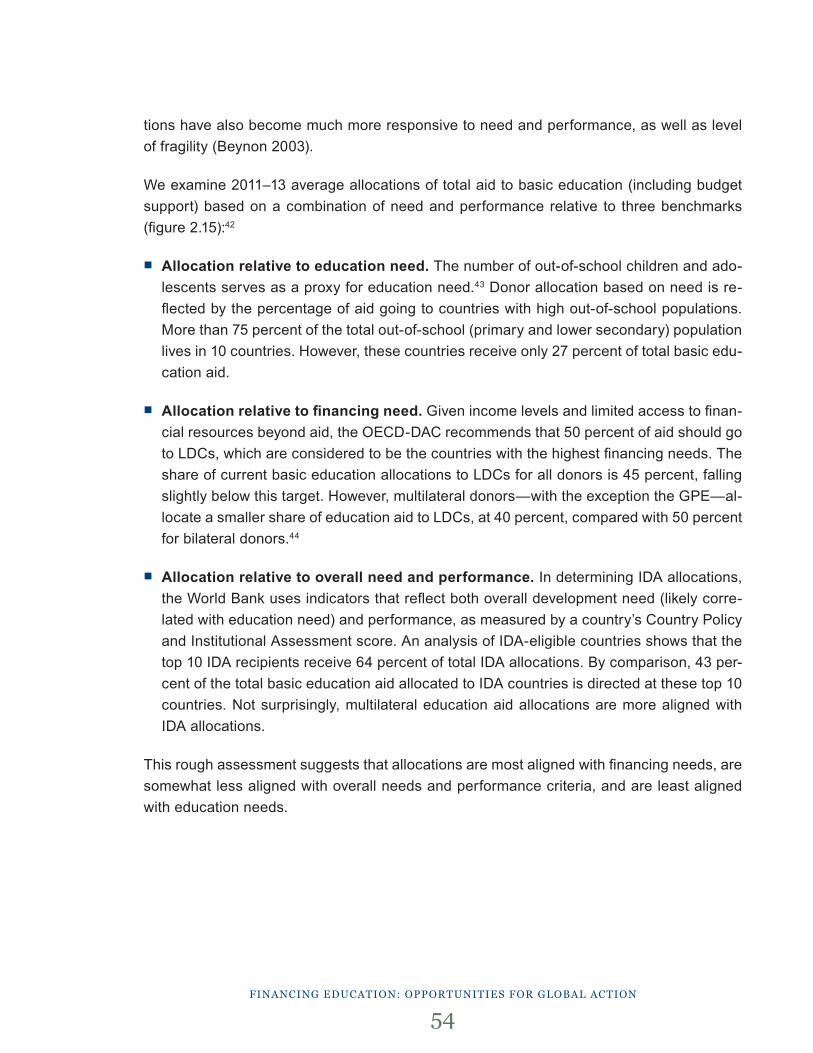
FinAnCing eduCAtion: opportunities For globAl ACtion
54
tions have also become much more responsive to need and performance, as well as level of fragility (Beynon 2003).
We examine 2011–13 average allocations of total aid to basic education (including budget support) based on a combination of need and performance relative to three benchmarks (figure 2.15):42
■ Allocation relative to education need. The number of out-of-school children and ado-lescents serves as a proxy for education need.43 Donor allocation based on need is re-flected by the percentage of aid going to countries with high out-of-school populations. More than 75 percent of the total out-of-school (primary and lower secondary) population lives in 10 countries. However, these countries receive only 27 percent of total basic edu-cation aid.
■ Allocation relative to financing need. Given income levels and limited access to finan-cial resources beyond aid, the OECD-DAC recommends that 50 percent of aid should go to LDCs, which are considered to be the countries with the highest financing needs. The share of current basic education allocations to LDCs for all donors is 45 percent, falling slightly below this target. However, multilateral donors—with the exception the GPE—al-locate a smaller share of education aid to LDCs, at 40 percent, compared with 50 percent for bilateral donors.44
■ Allocation relative to overall need and performance. In determining IDA allocations, the World Bank uses indicators that reflect both overall development need (likely corre-lated with education need) and performance, as measured by a country’s Country Policy and Institutional Assessment score. An analysis of IDA-eligible countries shows that the top 10 IDA recipients receive 64 percent of total IDA allocations. By comparison, 43 per-cent of the total basic education aid allocated to IDA countries is directed at these top 10 countries. Not surprisingly, multilateral education aid allocations are more aligned with IDA allocations.
This rough assessment suggests that allocations are most aligned with financing needs, are somewhat less aligned with overall needs and performance criteria, and are least aligned with education needs.
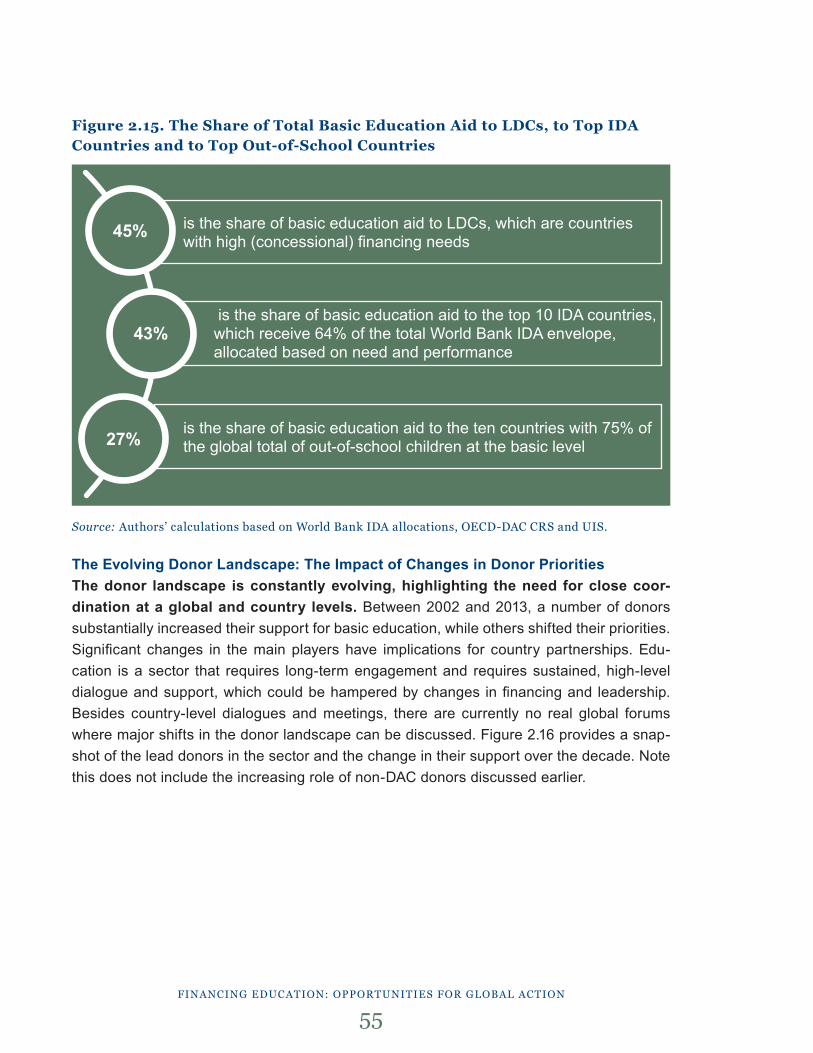
Figure 2.15. The Share of Total Basic Education Aid to LDCs, to Top IDA Countries and to Top Out-of-School Countries
Source: Authors’ calculations based on World bank idA allocations, oeCd-dAC Crs and uis.
The Evolving Donor Landscape: The Impact of Changes in Donor PrioritiesThe donor landscape is constantly evolving, highlighting the need for close coor-dination at a global and country levels. Between 2002 and 2013, a number of donors substantially increased their support for basic education, while others shifted their priorities. Significant changes in the main players have implications for country partnerships. Edu-cation is a sector that requires long-term engagement and requires sustained, high-level dialogue and support, which could be hampered by changes in financing and leadership. Besides country-level dialogues and meetings, there are currently no real global forums where major shifts in the donor landscape can be discussed. Figure 2.16 provides a snap-shot of the lead donors in the sector and the change in their support over the decade. Note this does not include the increasing role of non-DAC donors discussed earlier.
FinAnCing eduCAtion: opportunities For globAl ACtion
55
is the share of basic education aid to LDCs, which are countries with high (concessional) financing needs
is the share of basic education aid to the top 10 IDA countries, which receive 64% of the total World Bank IDA envelope, allocated based on need and performance
is the share of basic education aid to the ten countries with 75% of the global total of out-of-school children at the basic level
45%
43%
27%
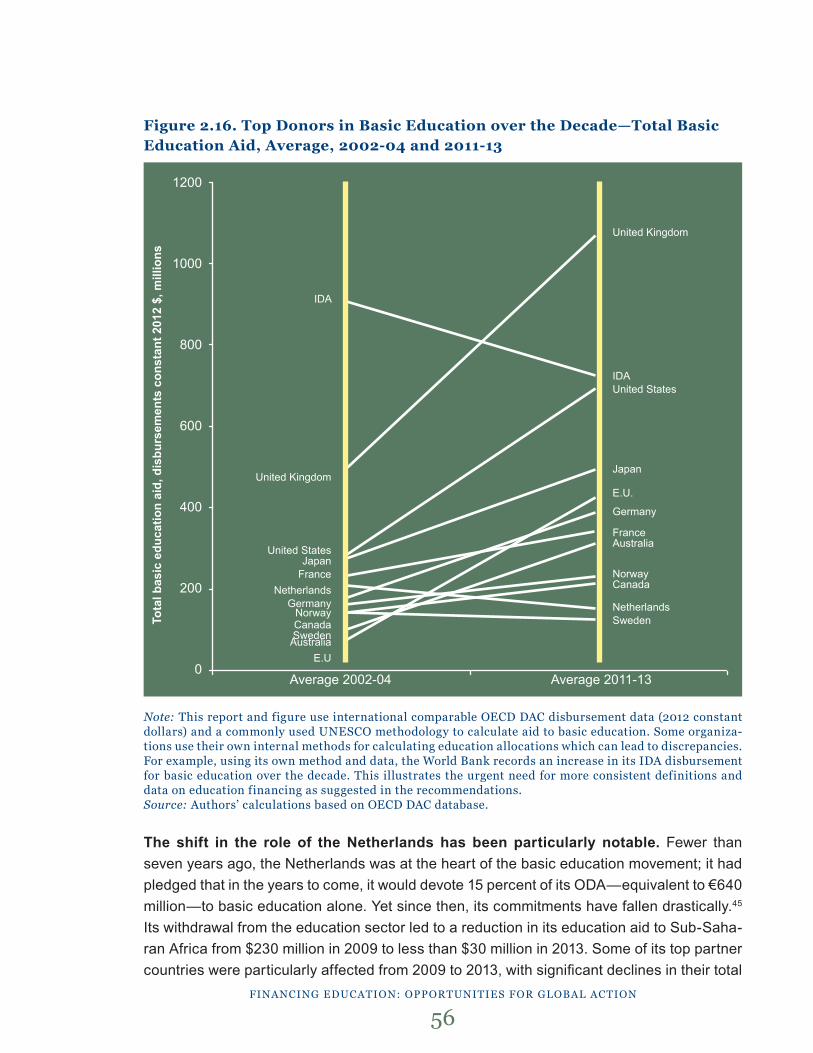
Figure 2.16. Top Donors in Basic Education over the Decade—Total Basic Education Aid, Average, 2002-04 and 2011-13
Note: this report and figure use international comparable oeCd dAC disbursement data (2012 constant dollars) and a commonly used unesCo methodology to calculate aid to basic education. some organiza-tions use their own internal methods for calculating education allocations which can lead to discrepancies. For example, using its own method and data, the World bank records an increase in its idA disbursement for basic education over the decade. this illustrates the urgent need for more consistent definitions and data on education financing as suggested in the recommendations. Source: Authors’ calculations based on oeCd dAC database.
The shift in the role of the Netherlands has been particularly notable. Fewer than seven years ago, the Netherlands was at the heart of the basic education movement; it had pledged that in the years to come, it would devote 15 percent of its ODA—equivalent to €640 million—to basic education alone. Yet since then, its commitments have fallen drastically.45 Its withdrawal from the education sector led to a reduction in its education aid to Sub-Saha-ran Africa from $230 million in 2009 to less than $30 million in 2013. Some of its top partner countries were particularly affected from 2009 to 2013, with significant declines in their total
FinAnCing eduCAtion: opportunities For globAl ACtion
56
Tota
l bas
ic e
duca
tion
aid,
dis
burs
emen
ts c
onst
ant 2
012
$, m
illio
ns
Average 2002-04 Average 2011-13
1200
1000
800
600
400
200
0
IDA
United Kingdom
United StatesJapan
FranceNetherlands
Germany Norway Canada Sweden Australia
E.U
United Kingdom
IDAUnited States
Japan
E.U.
Germany
FranceAustralia
Norway Canada
NetherlandsSweden
FinAnCing eduCAtion: opportunities For globAl ACtion
57
sector-allocable education aid, including Mali (by 92 percent), Burkina Faso (by 46 percent) and Uganda (by 77 percent).The impact of the Netherlands’ withdrawal, and the subsequent ability of other donors to fill the resulting gaps, varied by country. For example, total sector-allocable education aid from the Netherlands fell by 68 percent from 2009 to 2013 in Mali and by 44 percent in Burkina Faso, but rose by 16 percent in Uganda.
The Growing Interest in Financing Mechanisms That Can Achieve Better Results and Catalyze Other Sources of Finance
For the past decade, donors have been developing new financing approaches to raise funds from unconventional sources (e.g., by linking aid to other forms of public or private finance) and to make existing funds go further. Although there is clearly potential, education has per-haps not benefited from these efforts as much as it could have.46 A number of recent reviews of experiences with innovative financing mechanisms for education highlight their potential (Bellinger and Fletcher 2014; Filipp et al. 2014). Two initiatives stand out: results-based aid and efforts to blend financing from different sources.
Results-Based AidResults-based aid approaches are gaining traction in education, with a number of initiatives currently under implementation. In an ideal scenario, donors would pay for measurable and verifiable progress on specific outcomes, such as $100 for every child above baseline expectations who completes primary school and takes a test.47 Such initia-tives are more likely to produce results because politicians and bureaucrats would pay more attention to results, accountability is enhanced by making the results visible to different stakeholders (including policymakers and citizens) and recipients are given greater flexibility to design and implement their own strategies (Perakis and Savedoff 2015).
The Program for Results (P4R) is a major results-based financing initiative developed by the World Bank that links financing to results. The program focuses on strengthen-ing the institutional capacity needed to achieve the desired results. The instrument aims to support the performance of a government program, using government’s own systems, when risks are related to the capacity of systems to achieve better results. It is considered to be particularly well suited to education and health, as it limits burdensome procurement processes that are not necessary or effective in the context of the social sector. By pooling support through government programs in collaboration with other development partners, it also aims to promote donor coordination and catalyze partnerships and other sources of funding. Other examples of results-based aid or results-based finance are the Girls’ Educa-tion Challenge program, implemented by DFID; a World Bank output-based aid program in Vietnam subsidizing the tuition costs of secondary education; and two pilot projects for Cash on Delivery Aid in Ethiopia and Rwanda (Bellinger and Fletcher 2014).

FinAnCing eduCAtion: opportunities For globAl ACtion
58
Although many applications of results based aid are still under development, initial findings from the P4R suggest it is not yet widely used in education. A recent review highlights the implementation of 22 P4R operations amounting to $3.5 billion of World Bank (IDA and International Bank for Reconstruction and Development) financing. However, only one program has been developed in education. Another three are in pipeline (of which at least two are on higher education). This amounts to only 5 percent of the total portfolio and pipeline for P4R lending (World Bank 2015). The active P4R approach in Tanzania shows good promise and could potentially be replicated in other countries (see box 2.1). The new results-based financing trust fund at the World Bank, Results in Education for All Children (REACH), aims to accelerate applications of P4R in education and the World Bank has com-mitted to double investments in result-based financing over the next five years.
Figure 2.17. Program for Results Portfolio and Pipeline, by Global Practice, Percentage in Total
Source: World bank (2015).
Education
■ Finance
■ Governance
■ Health
■ Poverty
■ Social Protection
■ Social, Urban, Rural & Resilience
■ Transport & ICT
■ Water
■ Agriculture
■ Trade & Competitiveness
5%
17%
4%
4%
4%
1%
17%
14%
1%11%
23%
Box 2.1. Big Results Now in Education (Tanzania)This Program for Results supports the government’s Big Results Now in Education Program, which is a major initiative, supported by eight development partners, to track the improvement in the quality of basic education delivery, which in turn is expected to produce tangible improvements in students’ learning outcomes. The program supports a number of interventions with a proven impact on learning, including official school rankings, national learning assessments, school incentive grants, school improvement toolkits focused on school management, teacher training and motivation interventions.
Source: World Bank (2014).
FinAnCing eduCAtion: opportunities For globAl ACtion
59
The impact of these projects and other results-based financing initiatives has yet to be determined. A recent review of results-based aid finds that existing initiatives have only been cautious adaptations of traditional aid program approaches. They have enhanced at-tention to results but are not really focused on accountability or flexibility (Perakis and Save-doff 2015). The greater attention to results is welcome, however, and seems to be leading to greater investment in information management systems (e.g. in Pakistan) that will likely have positive effects on the government’s capacity to more effectively plan and manage their education systems.
Blending and Leveraging FinanceDonors are developing partnerships and mechanisms that blend financing from dif-ferent sources. This can take many forms. A number of donors have been looking into opportunities to blend loan and grant financing to promote country demand for loans (in the case of multilateral development banks) or to leverage financing by crowding in market-based financing from both the private and public sectors (see recent proposals in World Bank and IMF 2015). The EU, a major donor for education, has been particularly active in this area. In 2012, it launched the Platform for Blending in External Cooperation, a forum to track experiences with blending mechanisms. Meanwhile, the GPE has been exploring a partnership with the Islamic Development Bank to buy down loans (Burnett 2013). Progress in this area could be important for the education sector, because so far it has not benefited as much as it potentially could from nonconcessional finance. The GPE buy-down review finds that LICs that are unable to borrow on hard terms and MICs that are reluctant to borrow for basic education on hard terms could benefit from these new instruments.
Recently established initiatives in other sectors have also introduced innovative matching mechanisms to leverage funding from other sources. For example, the Pow-er of Nutrition Fund aims to act as a catalyst to multiply resources going into nutrition. The fund has developed an innovative matching offer that guarantees that every dollar in private funding is multiplied up to six times with new financing secured from other funders including domestic and international public financing. Encouraged by the UK government pledge to match every £2 in new funding for nutrition with £1 in UK funding, the Bill & Melinda Gates Foundation pledged an additional $770 million for malnutrition in the next six years.48 While an equivalent global mechanism for education does not exist, there is much experimenta-tion within countries to leverage financing through new types of partnerships. For example, in Nigeria, the Safe Schools Initiative and its Multi-Donor Trust Fund Nigeria (SSI MDTF), a partnership between the Nigerian Government, the U.N. special envoy for global education, the private sector, and donors, pools and matches financing for children and schools af-fected by militants in the North Eastern States of Nigeria (Nwoko 2015). Finally, the GPE has made significant recent efforts to leverage domestic sources of financing, both in its recent replenishment round and through its new resource allocation model, but the on-the-ground impact of these initiatives will take some time to develop.
3. private development Assistance: Key Facts
here is broad agreement that if the global community is to meet the Sustainable Development Goals, all sources of finance will need to be harnessed and targeted where they are most needed (Henon 2014;
OECD 2014). One source that has grown substantially in recent years is private develop-ment assistance—that is, international concessional finance from nonstate sources that is given for international development purposes and is chaneled by formal organizations.49 “Nonstate” covers a wide range of actors—including faith-based organizations, civil society organizations (CSOs), foundations and corporations—as well as a wide range of support mechanisms. In addition, while much attention has been focused on private sources that
T
Key Messages ■ In 2012, private development assistance (PDA) was equivalent to about 25 percent of
total ODA.
■ PDA has been growing at a much faster pace than ODA, with a 51 percent increase between 2006 and 2011.
■ Corporate giving to education is insufficiently prioritized, with Fortune 500 companies spending only 3 percent of their total global CSR on education in developing countries.
■ PDA to education is much below levels given to health.
■ Only 1 percent of total U.S. foundation grants to developing countries relevant to the MDGs were directed to the universal primary education goal, the lowest of any goal.
■ Of the 15 countries showing the largest increase in the 2013 giving index, only one was a high income country, illustrating a trend of increased giving by emerging econo-mies. Emerging nonstate actors show strong potential to support education.
■ While charitable giving through foundations and CSOs tends to be focused on low-in-come countries, corporate giving is typically focused on middle-income and emerging markets and higher levels of education.
■ Disagreements and blurred definitions of the role of nonstate actors as providers and financiers need to be resolved to properly harness their potential.
■ New financing mechanisms, such as impact bonds, are opening up opportunities for collaboration across nonstate and state actors.
■ Households are filling financing gaps, bolstered by exponential growth in remittances over the past decade. Nonstate actors are experimenting with new mechanisms to leverage remittance flows for education.
FinAnCing eduCAtion: opportunities For globAl ACtion
60

are transferred internationally, domestic voluntary contributions within developing countries have also grown substantially.
It is difficult to estimate precisely how much PDA is being devoted to development as a whole, and to education in particular. Definitional differences about basic terms and a lack of data have led to sharply different estimates in various studies.50 Future efforts to enhance PDA’s potential should include a commitment to improve data and transparency.
Private Development Assistance Is Growing, but Education Is Insufficiently Prioritized
According to OECD data, PDA from OECD member countries to developing countries stood at $30 billion in 2012, which, in the same year, was equivalent to about 25 percent of total net ODA (10 percent of total foreign direct investment) and about 15 percent of re-mittances (OECD 2014) (figure 3.1). Due to incomplete reporting, this is likely a significant underestimation.51 Other sources, such as the Hudson institute and Development Initiatives, estimate that PDA to developing countries falls into the range of $45–60 billion (Henon 2014; Hudson Institute 2013). Although historical data are hard to come by, one survey shows that PDA has been growing at a much faster pace than ODA, with a 51 percent increase between 2006 and 2011. This growth is primarily concentrated in corporate giving, followed by fund-ing from foundations and NGOs (Henon 2014).
Figure 3.1. Total Net Resource Flows from DAC Donors to Developing Countries (billions of dollars), 2012
Source: oeCd (2014).
FinAnCing eduCAtion: opportunities For globAl ACtion
61
■ Official development assistance (ODA)
■ Other official flows (OOF)
■ Private flows at market terms, including FDI
■ Private grants, including philanthropic flows from foundations and NGOs’ own grants
308
30
127
10
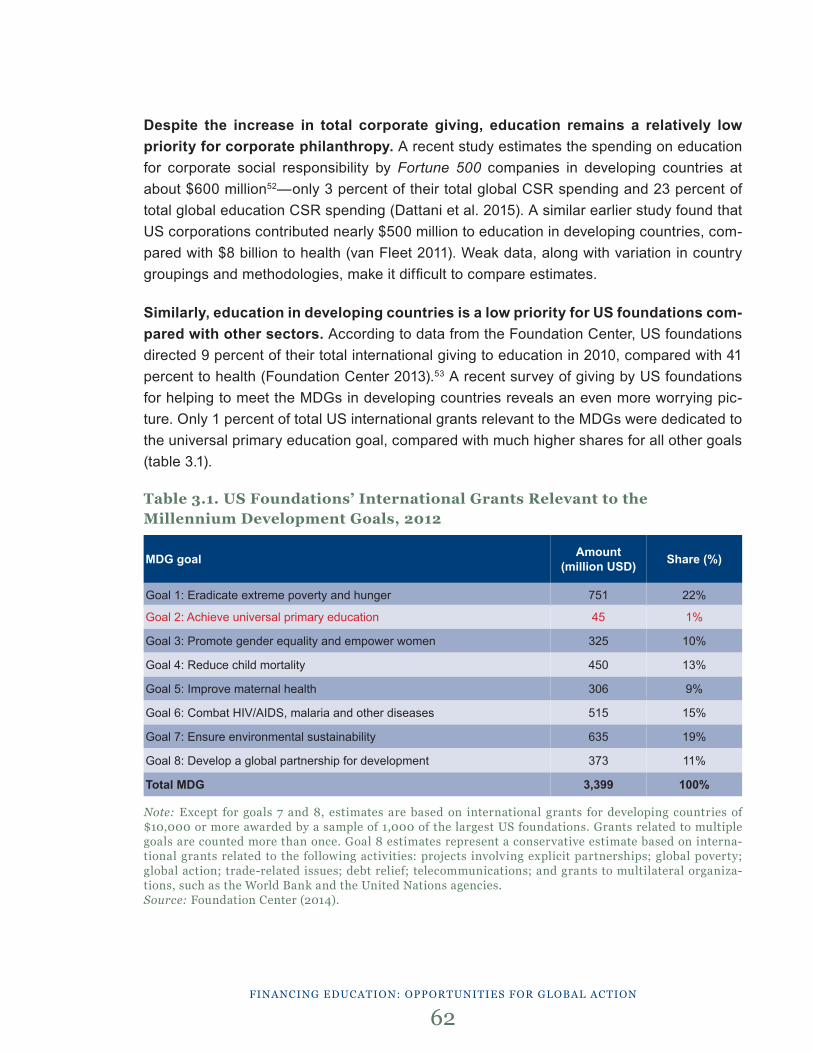
Despite the increase in total corporate giving, education remains a relatively low priority for corporate philanthropy. A recent study estimates the spending on education for corporate social responsibility by Fortune 500 companies in developing countries at about $600 million52—only 3 percent of their total global CSR spending and 23 percent of total global education CSR spending (Dattani et al. 2015). A similar earlier study found that US corporations contributed nearly $500 million to education in developing countries, com-pared with $8 billion to health (van Fleet 2011). Weak data, along with variation in country groupings and methodologies, make it difficult to compare estimates.
Similarly, education in developing countries is a low priority for US foundations com-pared with other sectors. According to data from the Foundation Center, US foundations directed 9 percent of their total international giving to education in 2010, compared with 41 percent to health (Foundation Center 2013).53 A recent survey of giving by US foundations for helping to meet the MDGs in developing countries reveals an even more worrying pic-ture. Only 1 percent of total US international grants relevant to the MDGs were dedicated to the universal primary education goal, compared with much higher shares for all other goals (table 3.1).
Table 3.1. US Foundations’ International Grants Relevant to the Millennium Development Goals, 2012
Note: except for goals 7 and 8, estimates are based on international grants for developing countries of $10,000 or more awarded by a sample of 1,000 of the largest us foundations. grants related to multiple goals are counted more than once. goal 8 estimates represent a conservative estimate based on interna-tional grants related to the following activities: projects involving explicit partnerships; global poverty; global action; trade-related issues; debt relief; telecommunications; and grants to multilateral organiza-tions, such as the World bank and the united nations agencies. Source: Foundation Center (2014).
FinAnCing eduCAtion: opportunities For globAl ACtion
62
MDG goal
Goal 1: Eradicate extreme poverty and hunger
Goal 2: Achieve universal primary education
Goal 3: Promote gender equality and empower women
Goal 4: Reduce child mortality
Goal 5: Improve maternal health
Goal 6: Combat HIV/AIDS, malaria and other diseases
Goal 7: Ensure environmental sustainability
Goal 8: Develop a global partnership for development
Total MDG
Amount(million USD) Share (%)
751
45
325
450
306
515
635
373
3,399
22%
1%
10%
13%
9%
15%
19%
11%
100%
Inadequate financing for education in developing countries is often supplemented by charitable giving from individuals, who often channel their gifts through CSOs, including religious organizations. Estimates of the size of this giving for education are imprecise and contested. It is clear, however, that NGOs and individuals deliver a larger share of PDA, about twice the amount given by foundations and corporations (Henon 2014). Assuming that this pattern also applies to education, it is likely that an additional $1.5 billion in charitable giving through CSOs and individuals in OECD countries is directed toward edu-cation in developing countries,54 suggesting that PDA for education is likely nearly equiva-lent to sector-allocable ODA for primary education, which currently stands at an average of $3 billion from 2011-13.55
Foundations and individuals in developing and emerging economies are becoming increasingly notable sources of finance for education (e.g., the MTN Foundation in Ni-geria and the Bharti Foundation in India) (Bellinger and Fletcher 2014). Illustrating a wider trend of increased giving by emerging economies, of the 15 countries showing the largest in-crease in the 2013 giving index, only one was a high-income country (CAF 2014). Recently, African philanthropists and social investors gathered to share knowledge and coordinate efforts at the first African Philanthropy Forum in Addis Ababa. Anecdotal evidence sug-gests that donors in emerging economies are more interested in supporting education than their OECD counterparts, suggesting that further engagement with donors in developing and emerging economies could present an opportunity to substantially grow philanthropic flows to education. For example, a survey of Arab donors found that cultural and religious traditions—Islamic guidelines strongly encourage giving to education—provide a strong foundation for greater engagement in the future (Jalbout 2014).56 A recent survey of Indian philanthropists showed that education is the most important cause for support (Sheth et al. 2013). Similarly, a 2011 survey of the 100 largest Latin American multinationals estimated their giving to education in the region as totaling $600 million, more than US Fortune 500 companies give to all developing countries (van Fleet and Zinny 2012).
A Large Share of Nonstate Financing for Education Is Fragmented and Not Focused on Areas of Highest Need
Although charitable giving through foundations and CSOs tends to be focused on low income countries or groups, corporate giving is typically focused on middle-income and emerging markets, which tend to be regions of business or strategic interest. One study, for example, highlights that the most frequent recipients of the technology sec-tor’s giving to education are emerging economies such as Argentina, Brazil, Chile, China, India and Mexico (van Fleet 2011). Only half the total CSR from global Fortune 500 compa-nies was directed to regions with a large presence of developing countries (Africa, Asia and the Pacific and Latin America) (Dattani et al. 2015).
FinAnCing eduCAtion: opportunities For globAl ACtion
63
Data also suggest that charitable grants (in particular, from corporations and some foundations) are often focused on higher levels of education—vocational training, tertiary education and teacher training. The recent survey of corporate giving by Fortune 500 companies shows that only 30 percent of total education CSR between 2011 and 2013 was focused on primary and secondary education, while more than 40 percent was devoted to higher education and 18 percent to infrastructure.57 In addition, though comprehensive evidence on the focus of foundations does not exist, two foundations giving the most to edu-cation (the Carnegie Corporation and the Ford Foundation) directed more then 80 percent of their grants toward scholarships and support for higher education in 2010. Exceptions include the Open Society Foundation, the Children’s Investment Fund Foundation and the Bernard van Leer Foundation, which have a special focus on early childhood; and others, such as the William and Flora Hewlett Foundation, which has long supported programs to improve the quality of basic education (UNESCO 2013a).
In addition, charitable grants geared toward education are highly fragmented, both geographically and between thematic areas, stifling potential impact and limiting opportunities for future invesment. When corporations give to education in developing countries, grants are often small, geared toward short-term projects, are divided between various NGOs working in different thematic areas and tend not to be coordinated with recipi-ent country governments, international aid agencies and the other entities working to sup-port education. In recognition of the current limitations of collaboration, the Global Business Coalition for Education (2014) has taken strides to coordinate the business community’s efforts to work toward the delivery of a high-quality education in unison with identified best practices and existing development initiatives.
Private Development Assistance Is Taking New Forms
Impact investments and shared-value approaches are increasingly complementing traditional philanthropy. Traditionally, the focus of PDA has been on charitable giving and grants—which are private flows with an explicit social motive and no expectation of finan-cial returns. A new class of social investors has emerged, however, which seek to combine social and financial returns. They differ from regular commercial investors because they explicitly aim to generate social impact as well as financial returns and because they are will-ing to accept lower financial returns than could be gained from more traditional commercial investments (Noble and Drexler 2013).
Impact investments—which were initially developed by private foundations and in-dividuals and families with a high net worth—are now attracting an increasingly di-verse set of actors. A recent survey revealed that development finance institutions were now the largest suppliers of funds for impact investing (42 percent), followed by fund manag-
FinAnCing eduCAtion: opportunities For globAl ACtion
64
ers (34 percent) (Saltuk 2014). Development finance institutions entered the space through investments in microfinance, which is a subset of impact investing focused on economically active low-income families (Martin 2013), but are expanding in scope. For example, the In-ternational Finance Corporation (IFC)—a private-sector-oriented member of the World Bank Group that makes commitments across sectors in the form of loans, equity investments and guarantees—recently shifted its focus to the world’s poorest countries. Large financial institutions, such as banks and pension funds, have been more hesitant to join, but they are now also gradually taking an interest. Official donors, as well, are showing increasing inter-est. For example, the UK’s DFID recently established the DFID Impact Programme58, which aims to catalyze the market for impact investments in South Asia and Sub-Saharan Africa through support for the broader ecosystem and the creation of an impact fund that supports businesses that reach low-income individuals. If donors combine social and financial re-turns, the amount of capital available to achieve education goals could potentially be many times larger than traditional philanthropic budgets.
FinAnCing eduCAtion: opportunities For globAl ACtion
65
Box 3.1. Impact Bonds for EducationThe social impact bond (SIB), or pay-for-success (PFS) financing, as it is generally known in the United States, is a type of impact investing mechanism whereby private capital is used to finance social services, with repayment from the government being contingent on the achievement of an outcome. “Development impact bond” (DIB) is a term used for a SIB in LICs and MICs where a donor agency or a foundation makes re-payments once the outcome is achieved, as opposed to the government (although some combination of government with a third party is also possible).
Since the first SIB was implemented in 2010 in the UK for the purpose of reducing prison recidivism, more than 40 SIBs and 1 DIB have been contracted globally for a range of social services. Of these, only 4 SIBs have focused on education, with 1 focusing on education in a developing country—a DIB for girls’ education in Rajasthan, India. An additional handful of DIB transactions are currently in development, but none had been fully contracted as of March 1, 2015.
The main benefits attributed to SIBs are that they (1) crowd in private funding; (2) priori-tize prevention; (3) reduce risk for government; (4) shift focus to achievement of out-comes; (5) achieve an operationally sustainable scale; (6) foster innovation in the de-livery of social services; (7) drive performance management; (8) stimulate collaboration across stakeholders; (9) build a culture of monitoring and evaluation; and (10) sustain impact.
However, the evidence of better outcomes and sustained impact remains to be seen, because only a handful of programs have reached the point of repayment. Nevertheless, the lessons from existing transactions should be used to explore the potential for innova-tive financing mechanisms to harness private capital for education.
Source: Gustafsson-Wright et al. (2015).

New financing mechanisms are also opening up opportunities for collaboration across both nonstate and state actors. Impact bonds (see box 3.1), for example, harness private capital to social services such as education while maintaining a focus on achieving outcomes. With these bonds, performance management expertise from the private sector has the potential to improve both quality and equity, though it remains to be seen whether or not this mechanism will be able to achieve an operationally sustainable larger scale and efficiencies beyond the individual project (Goodall 2014).
Although there has been clear growth in the field of impact investing, reliable esti-mates of the total size of investments do not exist, especially for investments in de-veloping countries or that are directed to education. The most comprehensive survey of 125 investors (with assets under management of $10 million or above) by JP Morgan and the Global Impact Investing Network found that investors had $46 billion in impact invest-ments under management globally, of which $32 billion was invested in developing countries (equivalent to about 70 percent).59 In 2013, global impact investments in education were estimated at $1.4 billion, of which an estimated $1 billion may be invested in developing countries (Saltuk 2014).60
The Growing Engagement of Nonstate Actors in Delivery Is Raising Questions about Their Overall Role
In addition to financing education, nonstate actors are increasingly engaging in the provision of education. Although still a relatively small percentage of total enrollments, nonstate schools have been growing in both LICs and MICs over the past two decades. The share of nonstate enrollments in total primary education enrollment rose by 5 percent-age points between 1990 and 2012, and now stands at 16 percent in LICs and 12 percent in LMICs (figure 3.2). The case studies confirm the growing importance of private provid-ers. In Lebanon, for example, around two-thirds of primary students attend private schools. Nonstate providers are operating under various forms and are receiving funding from a variety of resources including some from the government (Jalbout 2015). In Nigeria, more than one-third of all educational institutions are private institutions. In contrast to Lebanon, they do not receive public financing. Their main source of financing is the fees they charge (Nwoko 2015).
FinAnCing eduCAtion: opportunities For globAl ACtion
66
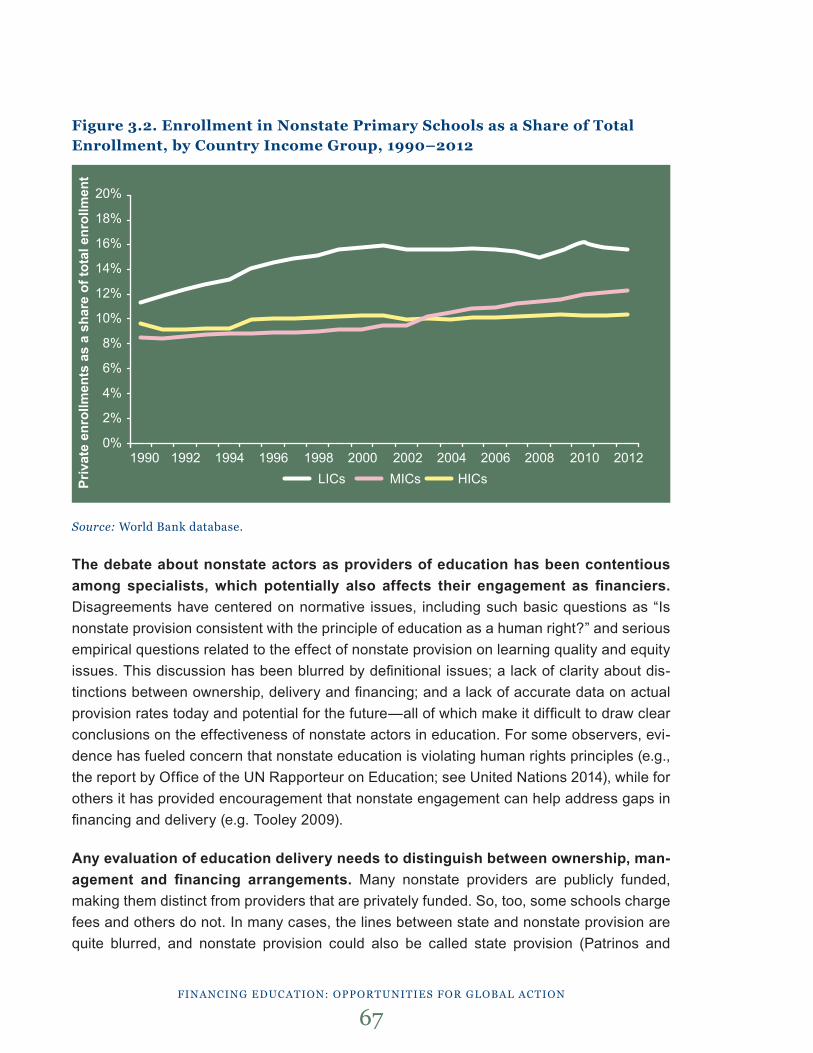
Figure 3.2. Enrollment in Nonstate Primary Schools as a Share of Total Enrollment, by Country Income Group, 1990–2012
Source: World bank database.
The debate about nonstate actors as providers of education has been contentious among specialists, which potentially also affects their engagement as financiers. Disagreements have centered on normative issues, including such basic questions as “Is nonstate provision consistent with the principle of education as a human right?” and serious empirical questions related to the effect of nonstate provision on learning quality and equity issues. This discussion has been blurred by definitional issues; a lack of clarity about dis-tinctions between ownership, delivery and financing; and a lack of accurate data on actual provision rates today and potential for the future—all of which make it difficult to draw clear conclusions on the effectiveness of nonstate actors in education. For some observers, evi-dence has fueled concern that nonstate education is violating human rights principles (e.g., the report by Office of the UN Rapporteur on Education; see United Nations 2014), while for others it has provided encouragement that nonstate engagement can help address gaps in financing and delivery (e.g. Tooley 2009).
Any evaluation of education delivery needs to distinguish between ownership, man-agement and financing arrangements. Many nonstate providers are publicly funded, making them distinct from providers that are privately funded. So, too, some schools charge fees and others do not. In many cases, the lines between state and nonstate provision are quite blurred, and nonstate provision could also be called state provision (Patrinos and
FinAnCing eduCAtion: opportunities For globAl ACtion
67
20%
18%
16%
14%
12%
10%
8%
6%
4%
2%
0%
Priv
ate
enro
llmen
ts a
s a
shar
e of
tota
l enr
ollm
ent
1990 1992 1994 1996 1998 2000 2002 2004 2006 2008 2010 2012LICs MICs HICs
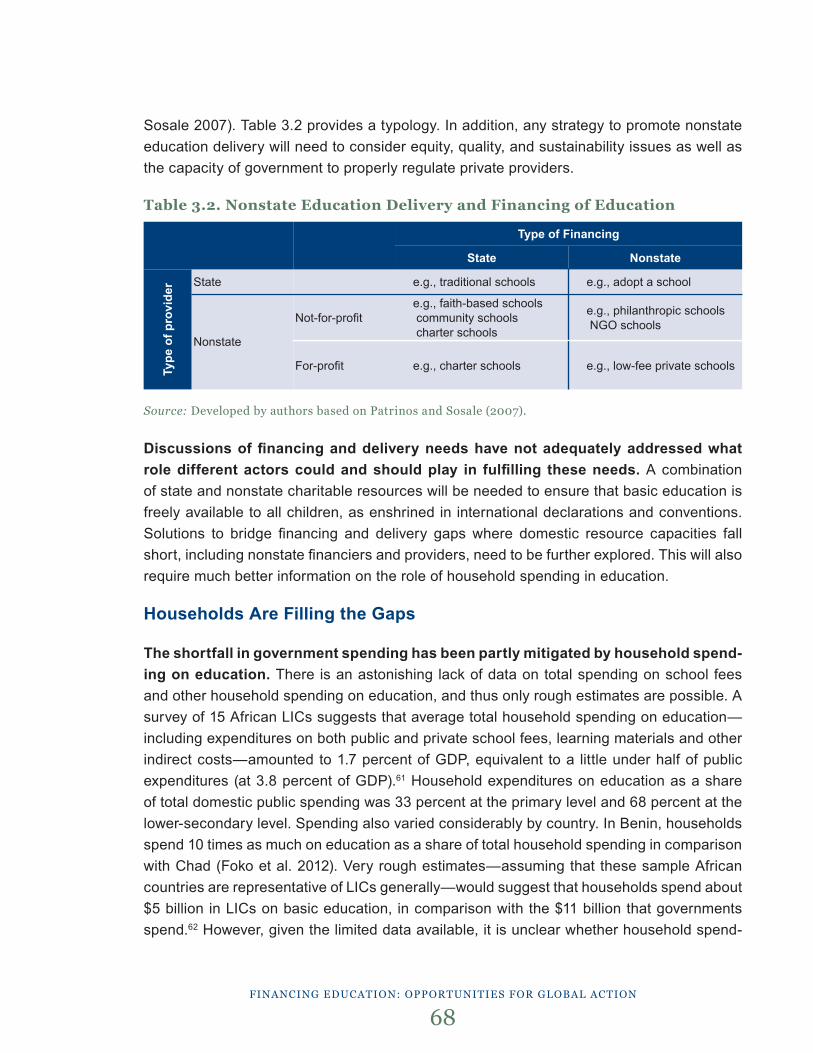
Sosale 2007). Table 3.2 provides a typology. In addition, any strategy to promote nonstate education delivery will need to consider equity, quality, and sustainability issues as well as the capacity of government to properly regulate private providers.
Table 3.2. Nonstate Education Delivery and Financing of Education
Source: developed by authors based on patrinos and sosale (2007).
Discussions of financing and delivery needs have not adequately addressed what role different actors could and should play in fulfilling these needs. A combination of state and nonstate charitable resources will be needed to ensure that basic education is freely available to all children, as enshrined in international declarations and conventions. Solutions to bridge financing and delivery gaps where domestic resource capacities fall short, including nonstate financiers and providers, need to be further explored. This will also require much better information on the role of household spending in education.
Households Are Filling the Gaps
The shortfall in government spending has been partly mitigated by household spend-ing on education. There is an astonishing lack of data on total spending on school fees and other household spending on education, and thus only rough estimates are possible. A survey of 15 African LICs suggests that average total household spending on education—including expenditures on both public and private school fees, learning materials and other indirect costs—amounted to 1.7 percent of GDP, equivalent to a little under half of public expenditures (at 3.8 percent of GDP).61 Household expenditures on education as a share of total domestic public spending was 33 percent at the primary level and 68 percent at the lower-secondary level. Spending also varied considerably by country. In Benin, households spend 10 times as much on education as a share of total household spending in comparison with Chad (Foko et al. 2012). Very rough estimates—assuming that these sample African countries are representative of LICs generally—would suggest that households spend about $5 billion in LICs on basic education, in comparison with the $11 billion that governments spend.62 However, given the limited data available, it is unclear whether household spend-
FinAnCing eduCAtion: opportunities For globAl ACtion
68
State
Nonstate
Not-for-profit
For-profit
State
Type of Financing
Nonstate
e.g., traditional schools
e.g., faith-based schools community schools charter schools
e.g., charter schools
e.g., adopt a school
e.g., philanthropic schools NGO schools
e.g., low-fee private schoolsType
of p
rovi
der
ing decreases as governments invest more in education, or whether household spending complements public spending.
Evidence from the case studies also underlines the significance of household spend-ing in MICs. In Lebanon, for example, private expenditure, including from households, ex-ceeds public expenditure. Over the past decade, an estimated 4 percent of Lebanon’s GDP has been devoted to private schooling, compared to an average of just over 2 percent of GDP of government spending. Private schools are funded by families or in some cases by political and religious groups (Jalbout 2015).
The exponential growth in remittances during the past decade also seems to factor significantly in household decisions about children’s schooling. In Sub-Saharan Af-rica alone, remittance inflows grew from $20 billion to $30 billion between 2005 and 2012, a significant share of which was directed toward education (Sy and Rakotondrazaka 2014). A recent survey of households in Nigeria, for example, revealed that families spend almost one quarter of total remittances received on education (Watkins and Quattri 2014). These direct inflows of money enable households to pay for both direct and indirect costs that are not fully subsidized by governments, provide some households with access to better-quality schools with higher fees and pay for the high opportunity costs of keeping children—partic-ularly girls—in school.
A number of donors are pursuing ideas to better harness the potential of remit-tance flows for education. For example, the Educate a Child Foundation is developing an Educate a Child Remittance Fund, which will seek to leverage the considerable private remittances sent home by migrant workers every year to pay for education as well as other household costs. The fund is being developed in collaboration with one of the UK’s largest online money transfer companies, and it will seek to offer a discount to remitters who opt to use the program as well as making a direct contribution to a local education fund to target families and communities that cannot afford to send their children to school.
FinAnCing eduCAtion: opportunities For globAl ACtion
69
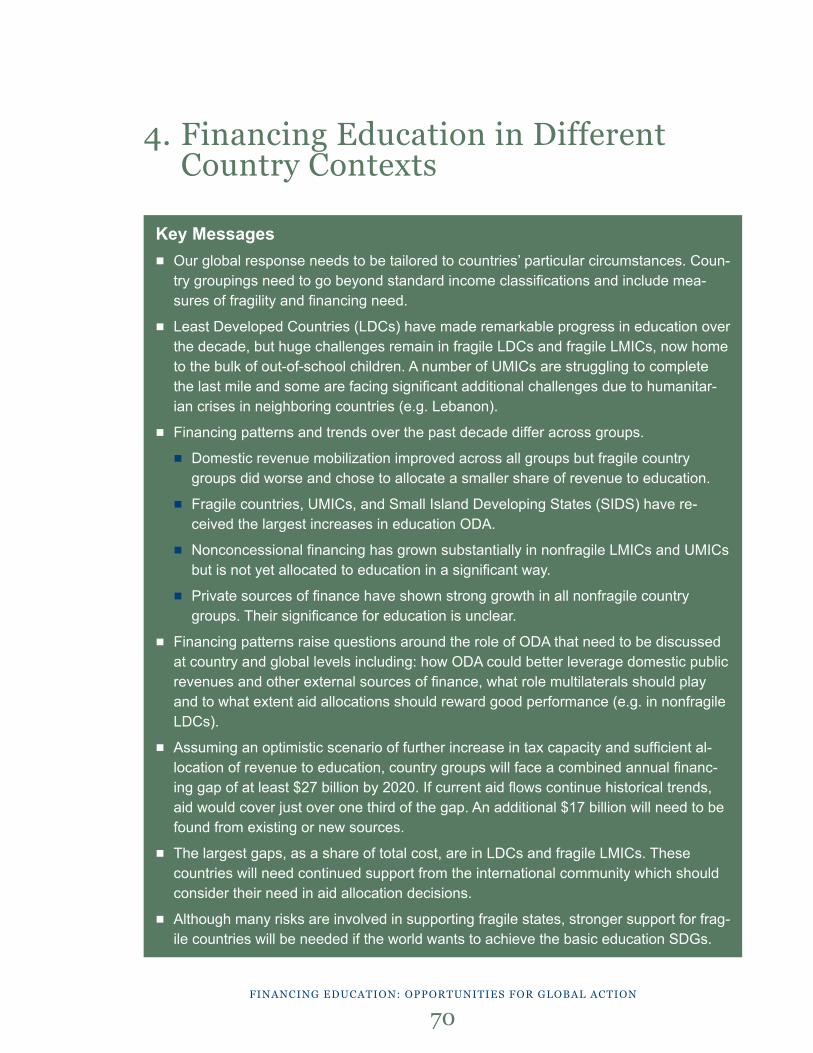
FinAnCing eduCAtion: opportunities For globAl ACtion
70
4. Financing education in different Country Contexts
Key Messages ■ Our global response needs to be tailored to countries’ particular circumstances. Coun-
try groupings need to go beyond standard income classifications and include mea-sures of fragility and financing need.
■ Least Developed Countries (LDCs) have made remarkable progress in education over the decade, but huge challenges remain in fragile LDCs and fragile LMICs, now home to the bulk of out-of-school children. A number of UMICs are struggling to complete the last mile and some are facing significant additional challenges due to humanitar-ian crises in neighboring countries (e.g. Lebanon).
■ Financing patterns and trends over the past decade differ across groups.
■ Domestic revenue mobilization improved across all groups but fragile country groups did worse and chose to allocate a smaller share of revenue to education.
■ Fragile countries, UMICs, and Small Island Developing States (SIDS) have re-ceived the largest increases in education ODA.
■ Nonconcessional financing has grown substantially in nonfragile LMICs and UMICs but is not yet allocated to education in a significant way.
■ Private sources of finance have shown strong growth in all nonfragile country groups. Their significance for education is unclear.
■ Financing patterns raise questions around the role of ODA that need to be discussed at country and global levels including: how ODA could better leverage domestic public revenues and other external sources of finance, what role multilaterals should play and to what extent aid allocations should reward good performance (e.g. in nonfragile LDCs).
■ Assuming an optimistic scenario of further increase in tax capacity and sufficient al-location of revenue to education, country groups will face a combined annual financ-ing gap of at least $27 billion by 2020. If current aid flows continue historical trends, aid would cover just over one third of the gap. An additional $17 billion will need to be found from existing or new sources.
■ The largest gaps, as a share of total cost, are in LDCs and fragile LMICs. These countries will need continued support from the international community which should consider their need in aid allocation decisions.
■ Although many risks are involved in supporting fragile states, stronger support for frag-ile countries will be needed if the world wants to achieve the basic education SDGs.
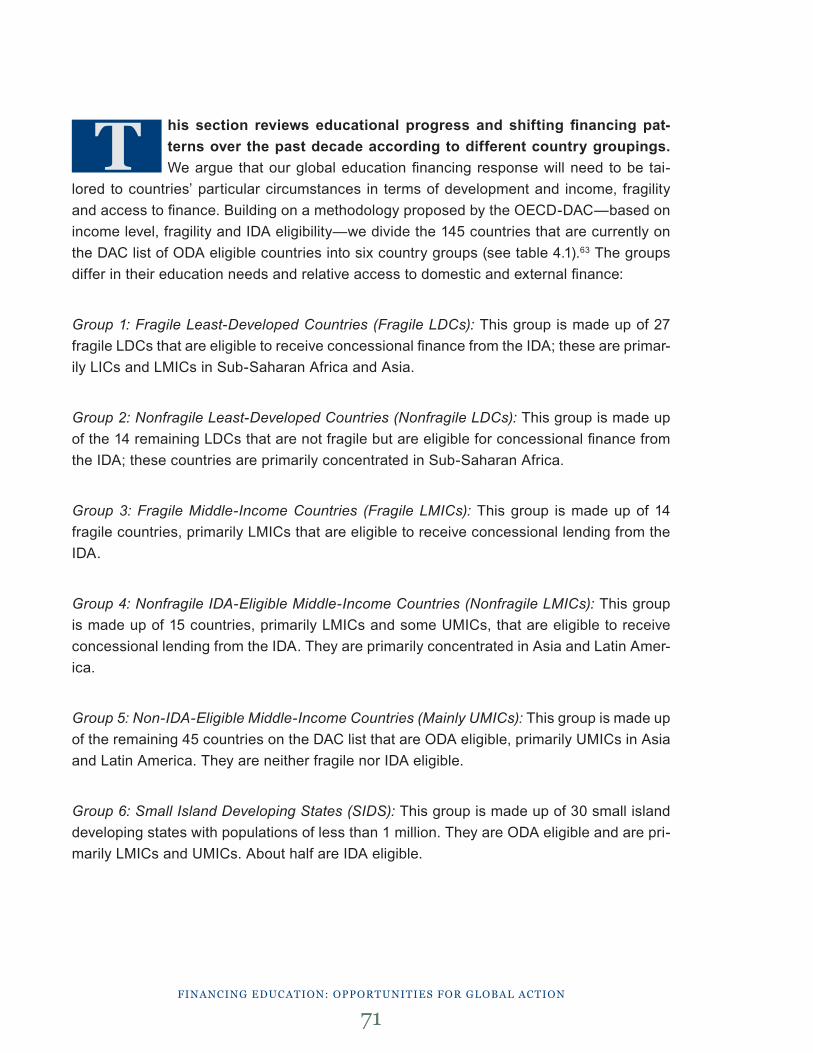
his section reviews educational progress and shifting financing pat-terns over the past decade according to different country groupings. We argue that our global education financing response will need to be tai-
lored to countries’ particular circumstances in terms of development and income, fragility and access to finance. Building on a methodology proposed by the OECD-DAC—based on income level, fragility and IDA eligibility—we divide the 145 countries that are currently on the DAC list of ODA eligible countries into six country groups (see table 4.1).63 The groups differ in their education needs and relative access to domestic and external finance:
Group 1: Fragile Least-Developed Countries (Fragile LDCs): This group is made up of 27 fragile LDCs that are eligible to receive concessional finance from the IDA; these are primar-ily LICs and LMICs in Sub-Saharan Africa and Asia.
Group 2: Nonfragile Least-Developed Countries (Nonfragile LDCs): This group is made up of the 14 remaining LDCs that are not fragile but are eligible for concessional finance from the IDA; these countries are primarily concentrated in Sub-Saharan Africa.
Group 3: Fragile Middle-Income Countries (Fragile LMICs): This group is made up of 14 fragile countries, primarily LMICs that are eligible to receive concessional lending from the IDA.
Group 4: Nonfragile IDA-Eligible Middle-Income Countries (Nonfragile LMICs): This group is made up of 15 countries, primarily LMICs and some UMICs, that are eligible to receive concessional lending from the IDA. They are primarily concentrated in Asia and Latin Amer-ica.
Group 5: Non-IDA-Eligible Middle-Income Countries (Mainly UMICs): This group is made up of the remaining 45 countries on the DAC list that are ODA eligible, primarily UMICs in Asia and Latin America. They are neither fragile nor IDA eligible.
Group 6: Small Island Developing States (SIDS): This group is made up of 30 small island developing states with populations of less than 1 million. They are ODA eligible and are pri-marily LMICs and UMICs. About half are IDA eligible.
T
FinAnCing eduCAtion: opportunities For globAl ACtion
71
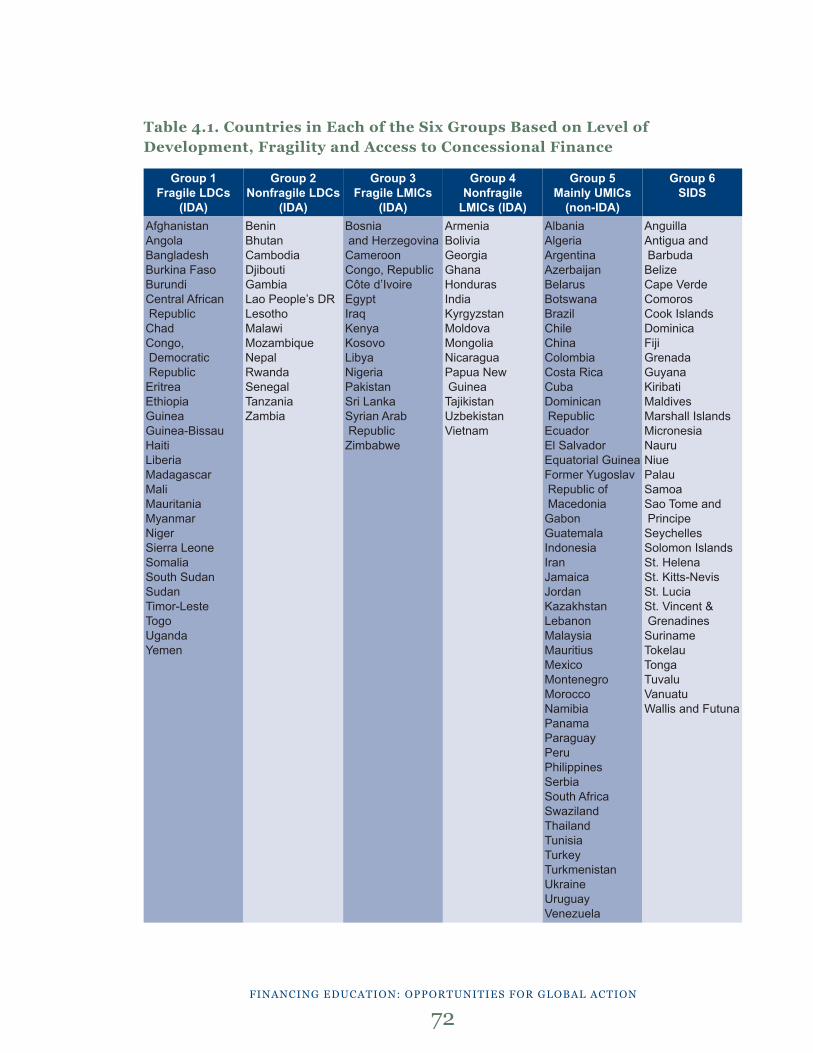
Table 4.1. Countries in Each of the Six Groups Based on Level of Development, Fragility and Access to Concessional Finance
FinAnCing eduCAtion: opportunities For globAl ACtion
72
Group 1Fragile LDCs
(IDA)
Group 2Nonfragile LDCs
(IDA)
Group 3Fragile LMICs
(IDA)
Group 4Nonfragile
LMICs (IDA)
Group 5Mainly UMICs
(non-IDA)
Group 6SIDS
AfghanistanAngolaBangladeshBurkina FasoBurundiCentral African RepublicChadCongo, Democratic RepublicEritreaEthiopiaGuineaGuinea-BissauHaitiLiberiaMadagascarMaliMauritaniaMyanmarNigerSierra LeoneSomaliaSouth SudanSudanTimor-LesteTogoUgandaYemen
BeninBhutanCambodiaDjiboutiGambiaLao People’s DRLesothoMalawiMozambiqueNepalRwandaSenegalTanzaniaZambia
Bosnia and HerzegovinaCameroonCongo, RepublicCôte d’IvoireEgyptIraqKenyaKosovoLibyaNigeriaPakistanSri LankaSyrian Arab RepublicZimbabwe
ArmeniaBoliviaGeorgiaGhanaHondurasIndiaKyrgyzstanMoldovaMongoliaNicaraguaPapua New GuineaTajikistanUzbekistanVietnam
AlbaniaAlgeriaArgentinaAzerbaijanBelarusBotswanaBrazilChileChinaColombiaCosta RicaCubaDominican RepublicEcuadorEl SalvadorEquatorial GuineaFormer Yugoslav Republic of MacedoniaGabonGuatemalaIndonesiaIranJamaicaJordanKazakhstanLebanonMalaysia MauritiusMexicoMontenegroMoroccoNamibiaPanamaParaguayPeruPhilippinesSerbiaSouth AfricaSwazilandThailandTunisiaTurkeyTurkmenistanUkraineUruguayVenezuela
AnguillaAntigua and BarbudaBelizeCape VerdeComorosCook IslandsDominicaFiji Grenada GuyanaKiribatiMaldivesMarshall IslandsMicronesiaNauruNiuePalauSamoaSao Tome and PrincipeSeychellesSolomon IslandsSt. HelenaSt. Kitts-NevisSt. LuciaSt. Vincent & GrenadinesSurinameTokelauTongaTuvaluVanuatuWallis and Futuna
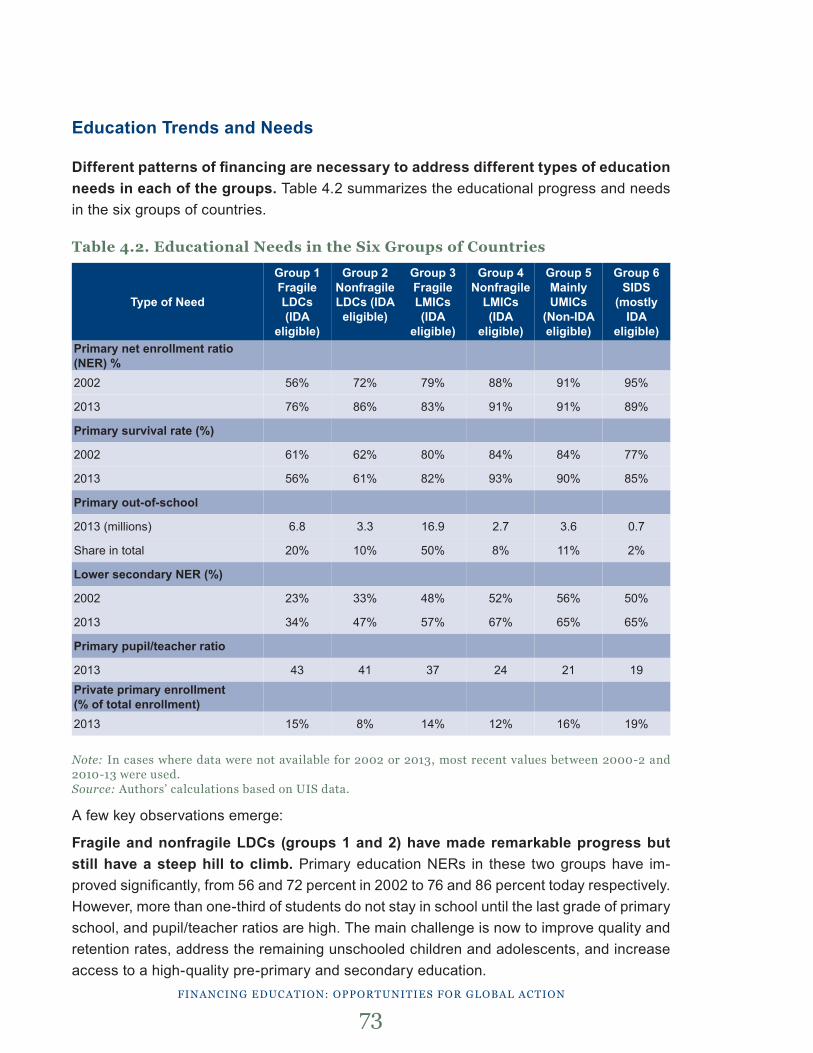
FinAnCing eduCAtion: opportunities For globAl ACtion
73
Education Trends and Needs
Different patterns of financing are necessary to address different types of education needs in each of the groups. Table 4.2 summarizes the educational progress and needs in the six groups of countries.
Table 4.2. Educational Needs in the Six Groups of Countries
Note: in cases where data were not available for 2002 or 2013, most recent values between 2000-2 and 2010-13 were used.Source: Authors’ calculations based on uis data.
A few key observations emerge:
Fragile and nonfragile LDCs (groups 1 and 2) have made remarkable progress but still have a steep hill to climb. Primary education NERs in these two groups have im-proved significantly, from 56 and 72 percent in 2002 to 76 and 86 percent today respectively. However, more than one-third of students do not stay in school until the last grade of primary school, and pupil/teacher ratios are high. The main challenge is now to improve quality and retention rates, address the remaining unschooled children and adolescents, and increase access to a high-quality pre-primary and secondary education.
Type of Need
Group 1Fragile LDCs(IDA
eligible)
Group 2Nonfragile LDCs (IDA
eligible)
Group 3Fragile LMICs(IDA
eligible)
Group 4Nonfragile
LMICs(IDA
eligible)
Group 5Mainly UMICs
(Non-IDA eligible)
Group 6SIDS
(mostly IDA
eligible)Primary net enrollment ratio (NER) %2002
2013
Primary survival rate (%)
2002
2013
Primary out-of-school
2013 (millions)
Share in total
Lower secondary NER (%)
2002
2013
Primary pupil/teacher ratio
2013Private primary enrollment (% of total enrollment)2013
56%
76%
61%
56%
6.8
20%
23%
34%
43
15%
72%
86%
62%
61%
3.3
10%
33%
47%
41
8%
79%
83%
80%
82%
16.9
50%
48%
57%
37
14%
88%
91%
84%
93%
2.7
8%
52%
67%
24
12%
91%
91%
84%
90%
3.6
11%
56%
65%
21
16%
95%
89%
77%
85%
0.7
2%
50%
65%
19
19%
Fragile LDCs and fragile LMICs (groups 1 and 3) have the largest numbers of out-of-school children. Although both fragile LDCs and fragile LMICs have low primary NERs—76 and 83 percent, respectively—the rate of progress has been particularly slow in fragile LMICs. Average NERs have improved by less than 5 percentage points since the beginning of the decade, when the primary NER stood at 79 percent. Fragile LMICs (including Nigeria and Pakistan) are now home to more than 16 million out-of-school children, about half the total for which we have country-level data.64
Group 5 of mainly UMICs is struggling to complete the last mile, and there is some regression in SIDS (group 6). Although both survival rates and access to secondary edu-cation have improved, average primary NERs remained unchanged (at 91 percent) between 2002 and 2013 in group 5. This highlights the fact that even in countries with higher levels of income, stubborn pockets of education poverty still need to be addressed. Attention will also need to be given to the apparent regression in SIDS, where primary NERs declined over the decade, from near-universal status to below 90 percent.
Progress in a number of UMICs has also been stalled by the effects of conflict and humanitarian crises in neighboring fragile countries. For example, the Syrian crisis has had major impacts on Lebanon, Jordan, and Turkey.65 The huge influx of refugees in those countries is presenting a dual education challenge for governments, one related to improving their own education systems and another related to providing education to a large number of refugee children that are suddenly putting additional pressures on already weak systems (see box 4.1).
FinAnCing eduCAtion: opportunities For globAl ACtion
74
Box 4.1 – Lebanon’s Dual Education Crisis: Long Term Education Re-form and Immediate Response to Syrian CrisisAs of May 2015, there are approximately 1.2 million refugees registered in Lebanon, of which half are children. These children are putting considerable pressure on the Leba-nese education system, which has been recovering from the country’s civil war in 1975 and wars with Israel in 1982 and 2006. Despite significant challenges, the government is committed to meet the additional education needs of the Syrian population. This commitment is reflected in the Reaching All Children with Education (RACE) strategy. About 1,000 public schools have been opened to non-Lebanese students and close to 110,000 out of 512,000 Syrian school-age children have been enrolled in Lebanese public schools. Non-formal education opportunities are being provided through local and international NGOs. Besides expanding provision for refugees, the Lebanese govern-ment also needs to consider the impact of the influx of refugees on its broader education system including school participation by Lebanese children. While formal assessments have not yet been completed, anecdotal evidence suggests Lebanese children are leav-ing public schools in areas with high density of refugees (Jalbout 2015).
Financing Trends and Issues
Table 4.3 summarizes financing needs for the six country groups and illustrates some im-portant trends, in turn raising questions for domestic resource mobilization and international support strategies.
■ Domestic revenue mobilization has improved across all country groupings. Nonfragile LDCs (group 2) did particularly well, increasing their ratio of taxes to GDP from an aver-age of 14 percent to 17 percent between 2002 and 2010.
■ Nonfragile LDCs (group 2) and nonfragile MICs (groups 4 and 5) chose to allocate a high-er share to education, but fragile countries (groups 1 and 3) and SIDS (group 6) chose to allocate a smaller share of their increased revenues to education—even as total ODA and education ODA rose in these countries, raising questions of possible substitution.
■ Compared with domestic resources, ODA plays a particularly large role in LDCs (groups 1 and 2), where ODA represents between 10 and 11 percent of gross national income.
■ Fragile countries (groups 1 and 3), UMICs (group 5) and SIDS (group 6) have received the largest increases in education ODA, and in support for basic education. The nonfrag-ile LDCs have experienced a decline in education ODA, even though the needs for pre-primary and quality improvements remain very large. Nonfragile LMICs (group 4) saw a slight but limited increase in ODA for total and primary education.
■ Nonconcessional financing has grown substantially in nonfragile LMICs and UMICs. However, this new source of finance is not yet benefiting education.
■ Capturing the significance of private finance flows for education is challenging because of the lack of reliable data. However, using available data, we note the growth of foreign direct investment in nonfragile developing countries—including LDCs, LMICs and UMICs (groups 2, 4, and 5). This highlights the potential to engage international private actors in innovative financing and impact investing. Growth in remittance flows has been signifi-cant in almost all countries, including in fragile states.
FinAnCing eduCAtion: opportunities For globAl ACtion
75
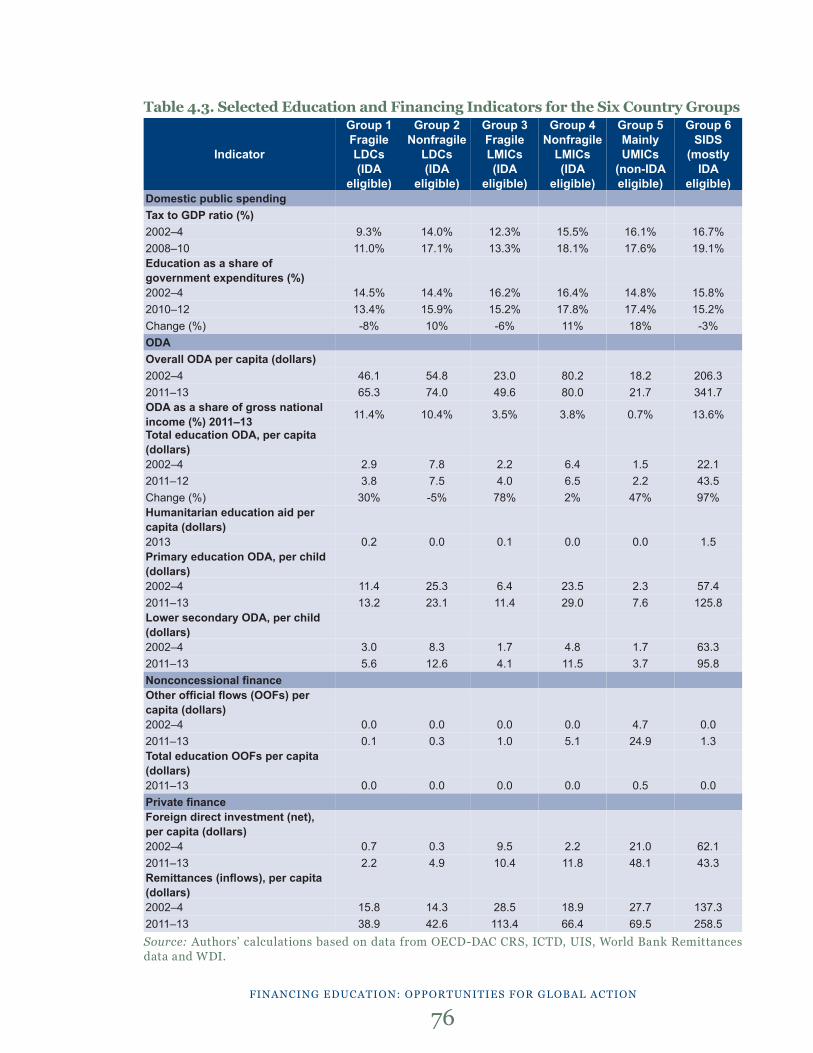
Table 4.3. Selected Education and Financing Indicators for the Six Country Groups
Source: Authors’ calculations based on data from oeCd-dAC Crs, iCtd, uis, World bank remittances data and Wdi.
FinAnCing eduCAtion: opportunities For globAl ACtion
76
Indicator
Group 1Fragile LDCs(IDA
eligible)
Group 2Nonfragile
LDCs (IDA
eligible)
Group 3Fragile LMICs(IDA
eligible)
Group 4Nonfragile
LMICs(IDA
eligible)
Group 5Mainly UMICs
(non-IDA eligible)
Group 6SIDS
(mostly IDA
eligible)Domestic public spendingTax to GDP ratio (%)2002–42008–10Education as a share of government expenditures (%)2002–42010–12Change (%)ODAOverall ODA per capita (dollars)2002–42011–13ODA as a share of gross national income (%) 2011–13Total education ODA, per capita (dollars)2002–42011–12Change (%)Humanitarian education aid per capita (dollars)2013Primary education ODA, per child (dollars)2002–42011–13Lower secondary ODA, per child (dollars)2002–42011–13Nonconcessional financeOther official flows (OOFs) per capita (dollars)2002–42011–13Total education OOFs per capita (dollars)2011–13Private financeForeign direct investment (net), per capita (dollars)2002–42011–13Remittances (inflows), per capita (dollars)2002–42011–13
9.3%11.0%
14.5%13.4%-8%
46.165.3
11.4%
2.93.8
30%
0.2
11.413.2
3.05.6
0.00.1
0.0
0.72.2
15.838.9
14.0%17.1%
14.4%15.9%10%
54.874.0
10.4%
7.87.5-5%
0.0
25.323.1
8.312.6
0.00.3
0.0
0.34.9
14.342.6
12.3%13.3%
16.2%15.2%-6%
23.049.6
3.5%
2.24.0
78%
0.1
6.411.4
1.74.1
0.01.0
0.0
9.510.4
28.5113.4
15.5%18.1%
16.4%17.8%11%
80.280.0
3.8%
6.46.52%
0.0
23.529.0
4.811.5
0.05.1
0.0
2.211.8
18.966.4
16.1%17.6%
14.8%17.4%18%
18.221.7
0.7%
1.52.2
47%
0.0
2.37.6
1.73.7
4.724.9
0.5
21.048.1
27.769.5
16.7%19.1%
15.8%15.2%-3%
206.3341.7
13.6%
22.143.597%
1.5
57.4125.8
63.395.8
0.01.3
0.0
62.143.3
137.3258.5
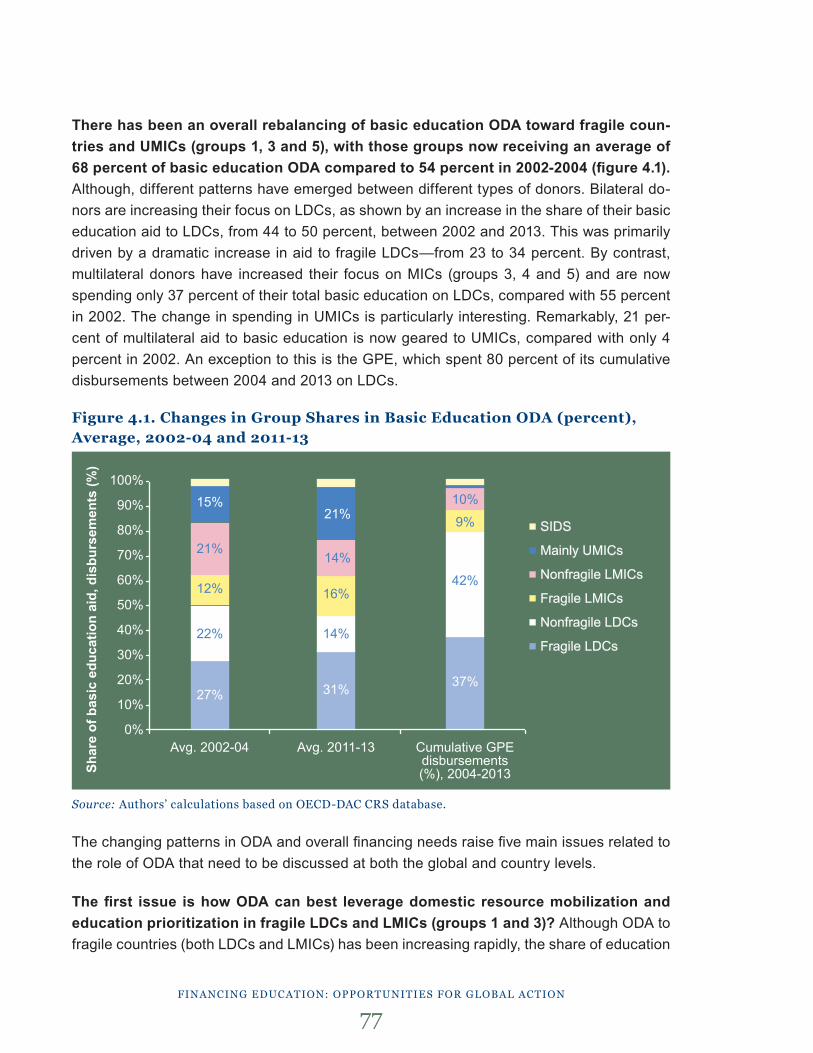
There has been an overall rebalancing of basic education ODA toward fragile coun-tries and UMICs (groups 1, 3 and 5), with those groups now receiving an average of 68 percent of basic education ODA compared to 54 percent in 2002-2004 (figure 4.1). Although, different patterns have emerged between different types of donors. Bilateral do-nors are increasing their focus on LDCs, as shown by an increase in the share of their basic education aid to LDCs, from 44 to 50 percent, between 2002 and 2013. This was primarily driven by a dramatic increase in aid to fragile LDCs—from 23 to 34 percent. By contrast, multilateral donors have increased their focus on MICs (groups 3, 4 and 5) and are now spending only 37 percent of their total basic education on LDCs, compared with 55 percent in 2002. The change in spending in UMICs is particularly interesting. Remarkably, 21 per-cent of multilateral aid to basic education is now geared to UMICs, compared with only 4 percent in 2002. An exception to this is the GPE, which spent 80 percent of its cumulative disbursements between 2004 and 2013 on LDCs.
Figure 4.1. Changes in Group Shares in Basic Education ODA (percent), Average, 2002-04 and 2011-13
Source: Authors’ calculations based on oeCd-dAC Crs database.
The changing patterns in ODA and overall financing needs raise five main issues related to the role of ODA that need to be discussed at both the global and country levels.
The first issue is how ODA can best leverage domestic resource mobilization and education prioritization in fragile LDCs and LMICs (groups 1 and 3)? Although ODA to fragile countries (both LDCs and LMICs) has been increasing rapidly, the share of education
FinAnCing eduCAtion: opportunities For globAl ACtion
77
100%
90%
80%
70%
60%
50%
40%
30%
20%
10%
0%
Shar
e of
bas
ic e
duca
tion
aid,
dis
burs
emen
ts (%
)
Avg. 2002-04 Avg. 2011-13 Cumulative GPE disbursements (%), 2004-2013
■ SIDS
■ Mainly UMICs
■ Nonfragile LMICs
■ Fragile LMICs
■ Nonfragile LDCs
■ Fragile LDCs
27% 31% 37%
22% 14%
42%12% 16%
9%
21%14%
10%15%21%
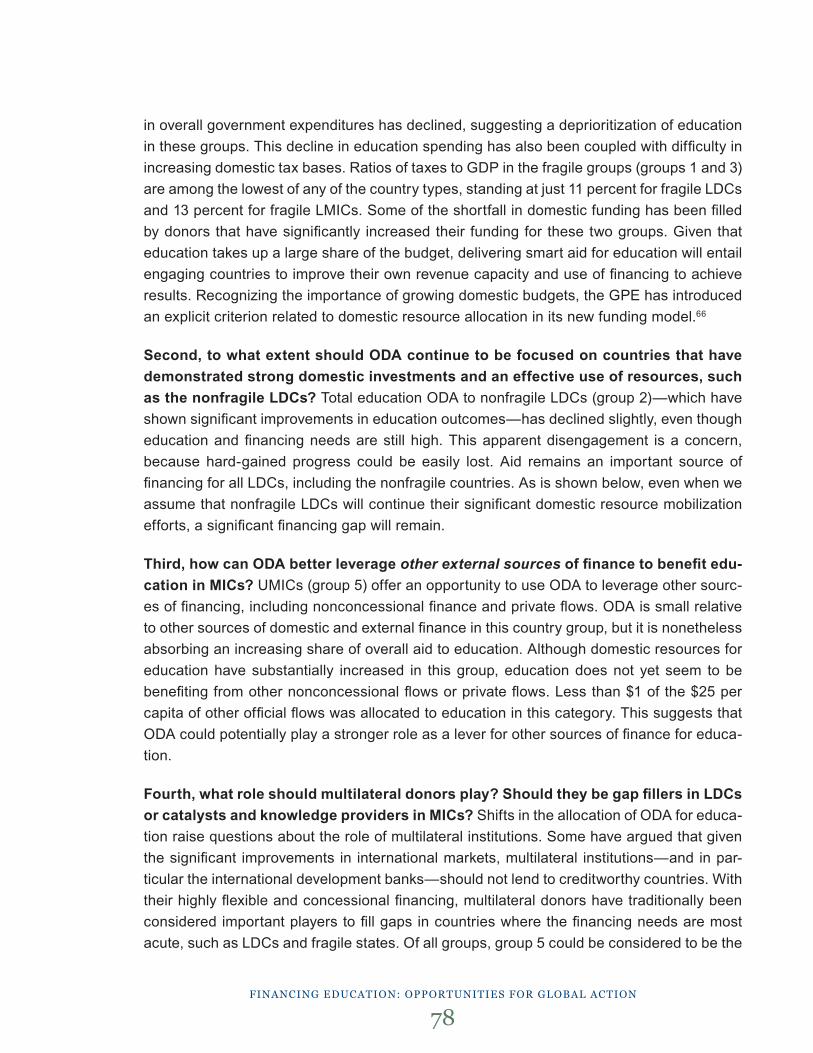
in overall government expenditures has declined, suggesting a deprioritization of education in these groups. This decline in education spending has also been coupled with difficulty in increasing domestic tax bases. Ratios of taxes to GDP in the fragile groups (groups 1 and 3) are among the lowest of any of the country types, standing at just 11 percent for fragile LDCs and 13 percent for fragile LMICs. Some of the shortfall in domestic funding has been filled by donors that have significantly increased their funding for these two groups. Given that education takes up a large share of the budget, delivering smart aid for education will entail engaging countries to improve their own revenue capacity and use of financing to achieve results. Recognizing the importance of growing domestic budgets, the GPE has introduced an explicit criterion related to domestic resource allocation in its new funding model.66
Second, to what extent should ODA continue to be focused on countries that have demonstrated strong domestic investments and an effective use of resources, such as the nonfragile LDCs? Total education ODA to nonfragile LDCs (group 2)—which have shown significant improvements in education outcomes—has declined slightly, even though education and financing needs are still high. This apparent disengagement is a concern, because hard-gained progress could be easily lost. Aid remains an important source of financing for all LDCs, including the nonfragile countries. As is shown below, even when we assume that nonfragile LDCs will continue their significant domestic resource mobilization efforts, a significant financing gap will remain.
Third, how can ODA better leverage other external sources of finance to benefit edu-cation in MICs? UMICs (group 5) offer an opportunity to use ODA to leverage other sourc-es of financing, including nonconcessional finance and private flows. ODA is small relative to other sources of domestic and external finance in this country group, but it is nonetheless absorbing an increasing share of overall aid to education. Although domestic resources for education have substantially increased in this group, education does not yet seem to be benefiting from other nonconcessional flows or private flows. Less than $1 of the $25 per capita of other official flows was allocated to education in this category. This suggests that ODA could potentially play a stronger role as a lever for other sources of finance for educa-tion.
Fourth, what role should multilateral donors play? Should they be gap fillers in LDCs or catalysts and knowledge providers in MICs? Shifts in the allocation of ODA for educa-tion raise questions about the role of multilateral institutions. Some have argued that given the significant improvements in international markets, multilateral institutions—and in par-ticular the international development banks—should not lend to creditworthy countries. With their highly flexible and concessional financing, multilateral donors have traditionally been considered important players to fill gaps in countries where the financing needs are most acute, such as LDCs and fragile states. Of all groups, group 5 could be considered to be the
FinAnCing eduCAtion: opportunities For globAl ACtion
78
one that has access to alternative sources of finance and should be less dependent on con-cessional finance from multilateral donors. However, it receives a relatively large share of multilateral aid, mainly provided by the EU (to Indonesia, Morocco, South Africa and Tunisia) and by the United Nations Relief and Works Agency for Palestine Refugees in the Near East (to Lebanon). Given that stubborn problems still exist in these countries, this raises ques-tions about the potential role of multilaterals in playing a catalytic and knowledge-creation role in these countries.
And fifth, how should the international community respond to humanitarian crises, in particular in MICs with limited access to concessional finance? The experience in Lebanon has highlighted a significant weakness in the international architecture to respond to protected crises in MICs. The U.N. can provide short emergency support but longer term concessional finance is much more limited for these higher income countries as they are not IDA eligible, do not currently fall under the GPE mandate, and have limited access to grant financing from traditional donors. Given countries are unlikely to borrow at market terms to educate refugees, other financing solutions need to be found involving a range of international actors and types of financing. Proposed solutions include an expansion of GPE’s mandate into a Global Fund, new practices in development banks, and a possible humanitarian fund.
Implications for Financing the Post-2015 Education Goals
It is clear that achieving the basic education SDGs will require additional efforts from both governments and external actors. More domestic public resources will need to be raised, and a greater share of resources will need to be allocated to education. External actors will need to fill resource gaps in some cases and to play a catalytic role in others.
Figure 4.2 shows the average annual spending per child on basic education that will be required in 2020 compared with the average domestic public spending per child in 2012 in the six country groups. Each country group will need to raise and spend more resources to cover costs. LDCs have the biggest gap to fill. Current spending per child in fragile and nonfragile LDCs stands at about 55 percent of what will be required in 2020 i.e., spending per child will need to almost double between 2015 and 2020.
FinAnCing eduCAtion: opportunities For globAl ACtion
79
Figure 4.2. The Estimated Cost of Basic Education in 2020 Compared with Domestic Public Spending in 2012, per child (weighted)
Note: per child estimates were calculated by dividing spending and cost by the total population of children age 5–14 years in 2012 and 2020, using un population data (see annex 3 on methodology).Source: Authors’ calculations based on World bank, iCtd, uis and unesCo gMr data.
External Actors Are Needed to Fill Gaps in Particular in LDCs and Fragile StatesUsing costing and tax capacity estimates for 2020, we compare the total annual spending required by all actors to achieve basic education goals with the domestic public resource capacity of different country groups. The assumption here is that the tax effort could rise to the “optimal tax effort” identified by the IMF and World Bank, which is ambitious to achieve over the 2015-2020 period in some countries.67 In addition, we assume that countries would spend the recommended 12 percent of their total revenues on basic education.68 We also separate resource-rich countries in the LDCs and LMICs country groups (groups 1 and 3) to highlight revenue capacity in these countries.
But even with optimal tax mobilization and allocation efforts, financing gaps still remain, adding to an annual total of at least $27 billion across all country groups by 2020 (figure 4.3).69 The largest gaps between total annual costs and projected annual domestic spending, as a share of total cost, are in LDCs and fragile middle-income countries (groups 1, 2, and 3):
■ Fragile LDCs (group 1) will need an additional $7.9 billion to cover total annual costs of $21.7 billion in 2020, equivalent to 36 percent of total cost;
FinAnCing eduCAtion: opportunities For globAl ACtion
80
SIDS
Mainly UMICs
Nonfragile LMICs
Fragile LMICs
Nonfragile LDCs
Fragile LDCs
0 200 400 600 800 1000 1200 1400 1600Per child weighted, constant 2012 $
■ Public spending on basic education, 2012
■ Total estimated cost of basic eduation, 2020
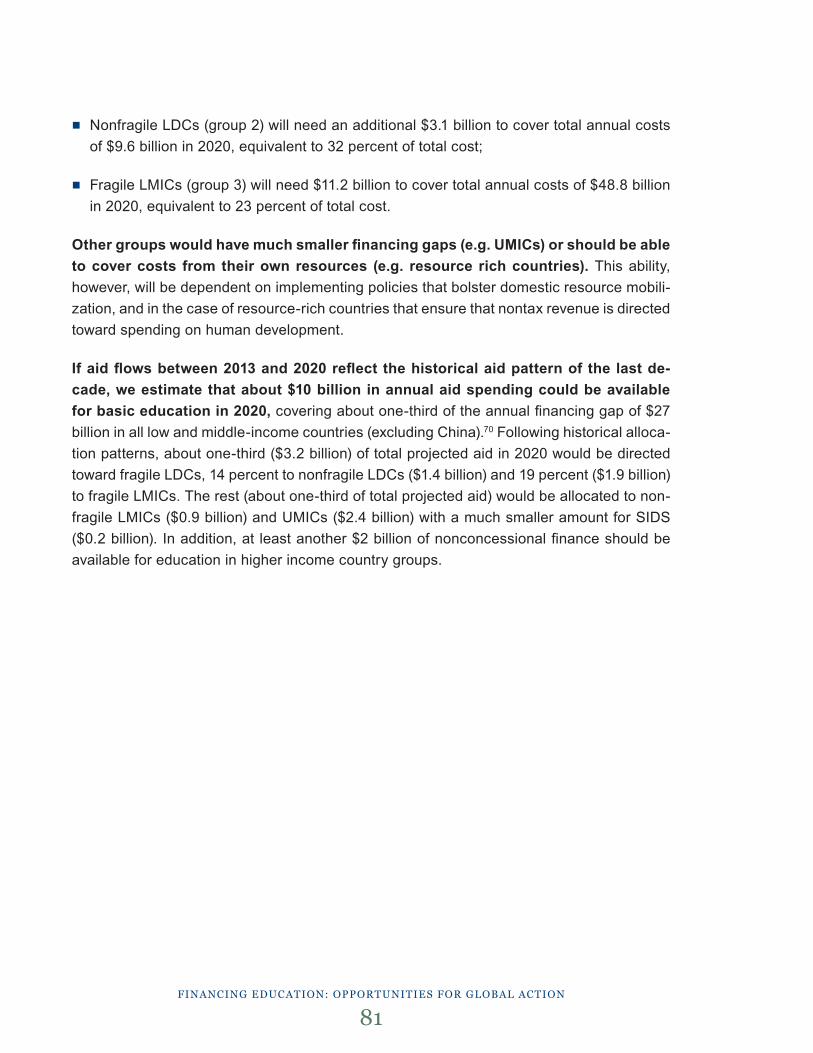
■ Nonfragile LDCs (group 2) will need an additional $3.1 billion to cover total annual costs of $9.6 billion in 2020, equivalent to 32 percent of total cost;
■ Fragile LMICs (group 3) will need $11.2 billion to cover total annual costs of $48.8 billion in 2020, equivalent to 23 percent of total cost.
Other groups would have much smaller financing gaps (e.g. UMICs) or should be able to cover costs from their own resources (e.g. resource rich countries). This ability, however, will be dependent on implementing policies that bolster domestic resource mobili-zation, and in the case of resource-rich countries that ensure that nontax revenue is directed toward spending on human development.
If aid flows between 2013 and 2020 reflect the historical aid pattern of the last de-cade, we estimate that about $10 billion in annual aid spending could be available for basic education in 2020, covering about one-third of the annual financing gap of $27 billion in all low and middle-income countries (excluding China).70 Following historical alloca-tion patterns, about one-third ($3.2 billion) of total projected aid in 2020 would be directed toward fragile LDCs, 14 percent to nonfragile LDCs ($1.4 billion) and 19 percent ($1.9 billion) to fragile LMICs. The rest (about one-third of total projected aid) would be allocated to non-fragile LMICs ($0.9 billion) and UMICs ($2.4 billion) with a much smaller amount for SIDS ($0.2 billion). In addition, at least another $2 billion of nonconcessional finance should be available for education in higher income country groups.
FinAnCing eduCAtion: opportunities For globAl ACtion
81
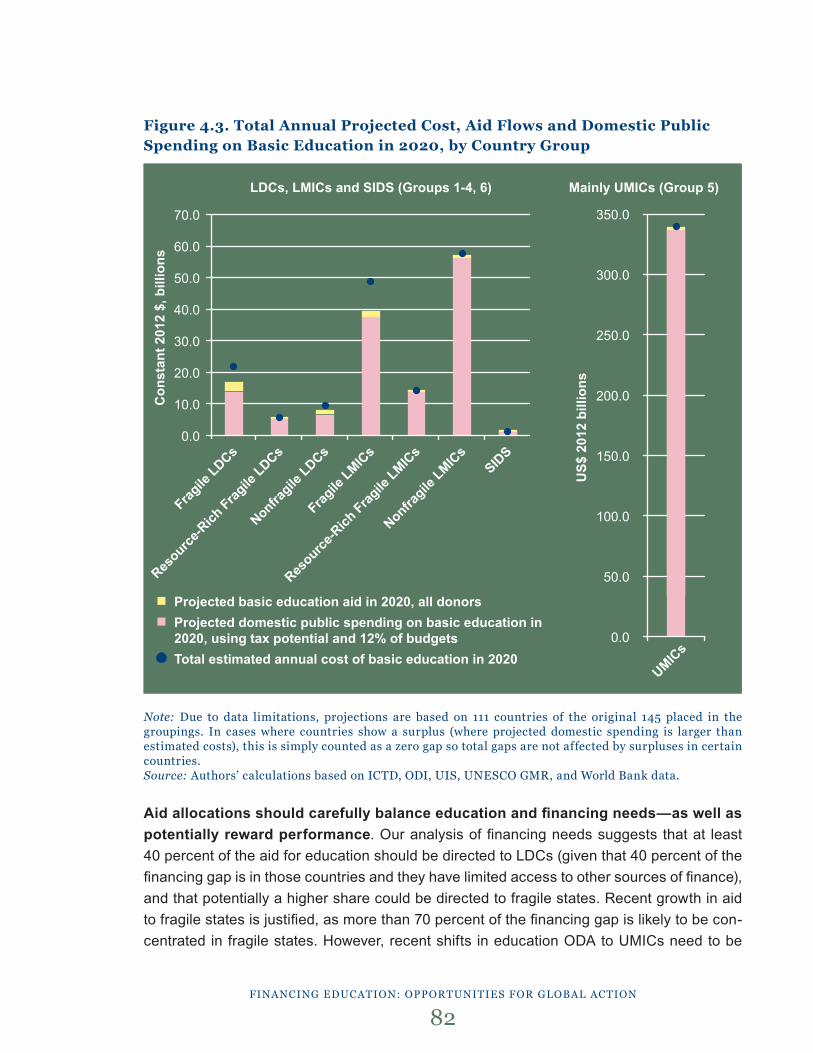
Figure 4.3. Total Annual Projected Cost, Aid Flows and Domestic Public Spending on Basic Education in 2020, by Country Group
Note: due to data limitations, projections are based on 111 countries of the original 145 placed in the groupings. in cases where countries show a surplus (where projected domestic spending is larger than estimated costs), this is simply counted as a zero gap so total gaps are not affected by surpluses in certain countries.Source: Authors’ calculations based on iCtd, odi, uis, unesCo gMr, and World bank data.
Aid allocations should carefully balance education and financing needs—as well as potentially reward performance. Our analysis of financing needs suggests that at least 40 percent of the aid for education should be directed to LDCs (given that 40 percent of the financing gap is in those countries and they have limited access to other sources of finance), and that potentially a higher share could be directed to fragile states. Recent growth in aid to fragile states is justified, as more than 70 percent of the financing gap is likely to be con-centrated in fragile states. However, recent shifts in education ODA to UMICs need to be
FinAnCing eduCAtion: opportunities For globAl ACtion
82
Con
stan
t 201
2 $,
bill
ions
US$
201
2 bi
llion
s
70.0
60.0
50.0
40.0
30.0
20.0
10.0
0.0
350.0
300.0
250.0
200.0
150.0
100.0
50.0
0.0
■ Projected basic education aid in 2020, all donors■ Projected domestic public spending on basic education in
2020, using tax potential and 12% of budgets● Total estimated annual cost of basic education in 2020
Fragile
LDCs
Resource
-Rich
Fragile
LDCs
Nonfragile
LDCs
Fragile
LMICs
Resource
-Rich
Fragile
LMICs
Nonfragile
LMICs
SIDS
LDCs, LMICs and SIDS (Groups 1-4, 6) Mainly UMICs (Group 5)
UMICs
examined. If historical patterns continue, UMICs are set to receive the second-highest share of total basic education aid ($2.4 billion annually) in 2020.This substantial amount of funding needs to be set against persistent needs in nonfragile LDCs where aid has been declining and alternative financing options are limited. Any concessional financing allocated to non-fragile higher-income countries should also have a clear focus on catalyzing the volume and effectiveness of domestic resources. In addition, other sources of finance could be tapped, such as nonconcessional lending and various types of innovative finance (impact invest-ment, blended finance and social investment). In this area, there is much innovation, which could be evaluated and scaled up.
We recognize that there are many risks involved in supporting fragile countries—which may make further increases in allocations difficult—but recent analyses and experience show that it is possible. It is extremely challenging to effectively deliver aid in fragile contexts. However, if the international community is sincere about achieving the education SDGs and leaving no child behind, stronger support for fragile states will be critical. Recent analyses have also highlighted that supporting fragile states in an effective way is possible if there is sufficient country ownership, attention to the political economy of reform, flexibility and innovation in the approach,71 a realistic expectation of risk combined with a long-term commitment, local capacity building and effective coordination of support (including across humanitarian and development spaces) (Greenhill et al. 2015). Some of these characteristics have also been highlighted as reasons why the World Bank’s projects in fragile and conflict-affected states have outperformed projects in the rest of the portfolio, as judged by both internal and independent evaluations.72
Within country groups, some countries will need to fill larger gaps than others, in particular when aid is taken into account. Table 4.4 presents the five countries in each group that will face the largest financing gaps (as a percentage of total cost) if countries mo-bilize resources up to their tax capacity and historical aid levels and allocation patterns are maintained leading up to 2020. (Detailed country data are presented in annex 1.) It should be noted that costing estimates do not account for additional costs due to humanitarian crises, especially when involving a cross-border influx of refugees. For example, costing estimates for Lebanon do not include additional costs due to the Syrian refugee crisis. In addition, historical aid patterns for some countries (e.g. Afghanistan) are unlikely to continue in the future so actual financing gaps may be larger.
FinAnCing eduCAtion: opportunities For globAl ACtion
83
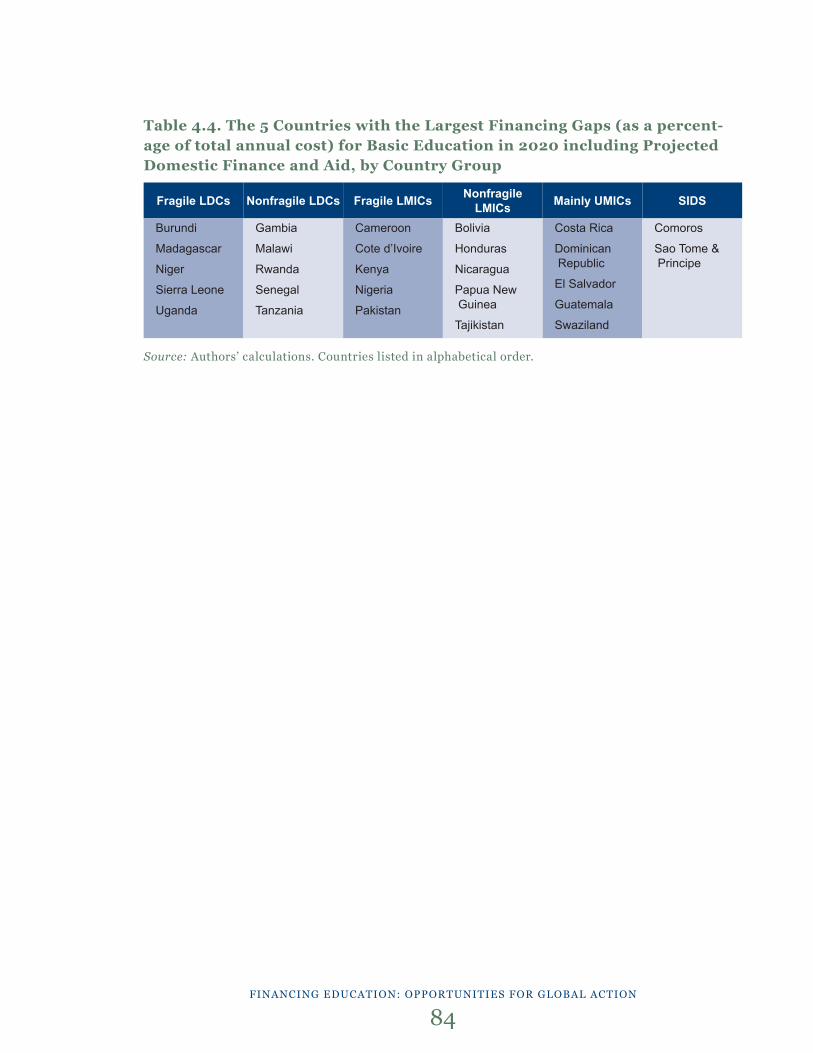
Table 4.4. The 5 Countries with the Largest Financing Gaps (as a percent-age of total annual cost) for Basic Education in 2020 including Projected Domestic Finance and Aid, by Country Group
Source: Authors’ calculations. Countries listed in alphabetical order.
FinAnCing eduCAtion: opportunities For globAl ACtion
84
Fragile LDCs Nonfragile LDCs Fragile LMICs Nonfragile LMICs Mainly UMICs SIDS
Burundi
Madagascar
Niger
Sierra Leone
Uganda
Gambia
Malawi
Rwanda
Senegal
Tanzania
Cameroon
Cote d’Ivoire
Kenya
Nigeria
Pakistan
Bolivia
Honduras
Nicaragua
Papua New Guinea
Tajikistan
Costa Rica
Dominican Republic
El Salvador
Guatemala
Swaziland
Comoros
Sao Tome & Principe

5. Four opportunities for global Action
chieving SDGs 4.1 and 4.2—as quoted in annex 2—will require more and better finance, focused on equitable learning outcomes and tai-lored to country circumstances. Under current trends and behaviors, it is
unlikely that these goals will be reached. Most of the heavy lifting will of course need to be done within countries, but important action will also be required internationally. This section presents four opportunities for action for global and national leaders to consider, as they gather for the Oslo Summit and the Financing for Development Conference in Addis Ababa, to improve the volume and effectiveness of financing for education.
Action 1: Establish a Global Commission on Education and Financing —Making a Compelling Case for Investment in Education Using Evidence and High-Level Leadership
The evidence has made it clear that without significantly scaling up investments in educa-tion, the world faces the risk of not meeting many of the SDGs. Failed education systems, especially at the basic level, will perpetuate the vicious cycle of poverty, violence, inequality, disease and environmental degradation. The world’s governments know this, as do global business and finance leaders; but sufficient action has not been taken to increase the scale and effectiveness of investments in education.
A number of reasons have held back action. Three stand out.
The first reason is the lack of a consensus about policies and actions that can deliver education goals. The education sector lacks a clear narrative on what kinds of invest-ments are critical to achieve learning at an operationally sustainable scale. What critical investments should ministers of finance and education, or donors, make to achieve access with learning? The recent UNESCO GMR highlights more than 35 policy options; but given scarce resources and even scarcer political opportunities, there is a need to prioritize and create a stronger narrative about the key actions and policies that governments and donors could pursue.
A
FinAnCing eduCAtion: opportunities For globAl ACtion
85
This report recommends establishing a global High-Level Commission on Education and Financing. The commission could help develop a common vision of what kind of education systems will be needed in developing countries and how they could be built through more and more effective financing. Through its high-level status, it could raise global awareness of the need to prioritize education goals and promote action-oriented partnerships be-tween governments, business leaders and civil society organizations.
The second reason is a limited understanding of financing needs and trade-offs. An important part of the evidence has to do with how much the delivery of education costs and how it can be financed. Although the data on education systems and outcomes have im-proved significantly in recent years, reliable and consistent estimates of funding needs and analyses of different cost recovery and financing arrangements are still missing. In most countries, an increase in education spending in the short term will require spending less on something else. Financing targets, such as the recommendation to spend 20 percent of total public spending on education, are strongly advocated. But it is less clear what those coun-tries that are not currently meeting this goal should spend less on—infrastructure, health or defense?73 What are the opportunity costs? The education community is failing to grapple with these larger questions of trade-offs, especially when the benefits from marginal dollars spent are not clear.
And the third reason is a lack of high-level political leadership. When education has secured the support of top leaders, it has generally resulted in a significant increase in at-tention and action in the sector. A series of country studies on progress in education in developing countries have highlighted the importance of such leadership (Steer et al. 2010; Rabinowitz and Prizzon 2014). Studies of education reforms in Kenya and Indonesia, for example, show how high-level political commitment, often in the form of election promises and accompanied with increased financial resources, was a major factor in making prog-ress (Nicolai et al. 2014; Tobias et al. 2014). Equally, since the Dakar meeting, the leaders of donor agencies have been very effective in calling attention to education. For example, Gordon Brown’s leadership on global education since 2002 led the United Kingdom to com-mit £8.5 billion to education over the following 10 years; and James Wolfensohn’s leadership at the World Bank led to a significant increase in the Bank’s investment in education and to the creation of the Fast Track Initiative, now the GPE, in 2002.
How a Global Commission on Education Could HelpA Global Commission on investment in education would be a major new international ini-tiative with the power and insight to analyze and communicate the actions and financing required to develop high-quality education systems and support the needs of the rapidly changing global economy and society. Building on a detailed analysis of the costs of deliv-ery, it could analyze the potential of different sources of finance and how they could be best harnessed (i.e., raised, allocated, managed and monitored) to achieve the education SDGs. The analysis of external resources could include the question of whether the GPE needs to be scaled up, and whether a potential Global Fund for Education building on the GPE could raise the momentum, mobilize additional resources and provide greater coordination and monitoring of impact (see action 2). The work of the commission could be phased, based on a prioritization of the current education goals as part of the SDGs and the constituencies it decides to serve, but with its first key outputs delivered within 12 months.
FinAnCing eduCAtion: opportunities For globAl ACtion
86
Through the work of an international team of high-level political leaders and technical ex-perts from both developed and developing countries, the commission would aim to encour-age robust and evidence-based decisionmaking by governments and nonstate actors alike to address key global challenges in education. A number of coalitions between the private and public actors could be formed to champion the findings of the research and take action on them in their areas of responsibility.
Similar initiatives in other sectors can provide examples of how this can be done. For example, the ongoing Global Commission on the Economy and Climate is showing the way. Its report explains how countries at all income levels can create lasting economic growth, while at the same time reducing the risk of climate change. It shows how smart climate poli-cies can actually promote better economic growth, and sets out a 10-point action plan for governments and businesses to achieve this end (Commission on the Economy and Climate 2014). Similarly, the Lancet Commission on Investing in Health, prompted by the 20th anni-versary of World Development Report 1993,74 revisited the case for investment in health and developed a new investment framework to achieve dramatic health gains by 2035 (Lancet Commission 2013).
The last equivalent initiative for education dates back to 1996, when the International Commission on Education for the Twenty-First Century, headed by Jacques Delors, was established. The commission and its report Learning: The Treasure Within (UNESCO 1996) had a profound impact on putting education on the agenda within the United Nations (Steer and Wathne 2009). A new commission report could be prompted by the 20th anni-versary of the initial report and provide a vision for education investment as we look toward 2030.75
Action 2: Create a Global Platform for Coordination and Scale Up of External Support
This paper and others have identified a number of key issues that need analysis and coordinated decisionmaking. While progress in coordinating financing at the country level has been good, progress has been much less at the global level. Prospects of financing the
FinAnCing eduCAtion: opportunities For globAl ACtion
87
Achieving the SDGs will be enhanced with a stronger mechanism for coordination and scale up at the global level to match the improvements that are occurring within coun-tries. There is a need to convene decisionmakers to address financial needs, donor fragmentation and delivery, with a special focus on country groups with special needs, such as LDCs, fragile states and MICs. Such a mechanism should build on the exist-ing mechanisms recognized in the Incheon Declaration rather than creating a separate structure.
SDGs would be much greater if there were a senior (ministerial level) platform to discuss key issues:
1. How to Scale Up External Support for Education and Focus on Achieving ResultsOur analysis highlights that even under optimistic scenarios of domestic resource mobiliza-tion and allocation, a number of country groups will require substantial external support. Current aid levels will be insufficient to fill the gaps and a significant scaling up of all forms of external financing will be needed. If the SDGs are to be achieved, additional resources will need to be found, and they will need to be spent in the most effective way possible, building on existing results-based financing approaches
2. How to Strengthen Multilateralism in the Education SectorAs shown in this report and earlier research (Rose and Steer 2013), only about one quar-ter of total aid to education is delivered through multilateral channels. In addition, the only dedicated multilateral fund for education, the GPE, does not have a global mandate (it is currently focused mainly on LICs, and had an initial focus on basic education) and has not been able to attract the support it would need to coordinate the education sector through a financially strong pooled fund. The GPE has been going through substantial reforms, however—including a change in leadership, a new funding model, a more inclusive partner-ship (involving partner countries, civil society and the private sector, in addition to traditional donors), stronger capacity in the secretariat and a stronger focus on monitoring and evalua-tion. An evaluation of the organization is currently ongoing, but based on the progress made so far, it could potentially be transformed into a much more ambitious organization.76
Other pooling mechanisms to coordinate and crowd in financing at the country level have also developed. These include various forms of program-based or sector-wide approaches, pooled funding mechanisms, delegated cooperation, silent partnerships and general or sec-tor budget support. In contrast to a global pooled funding mechanism, each of these mecha-nisms has had to develop its own modality, depending on the country context. Donors have often struggled to identify the most effective pooling mechanisms. In some cases, this has led to significant start-up costs and delays in response, which may have been a further limiting factor in effectively scaling up aid (Steer and Baudienville 2010). In addition, the case studies show that country-level multi-donor trust funds (MDTFs) have not necessar-ily helped reduce fragmentation. In Lebanon, for example, MDTFs appear to have further fragmented education financing and pose new challenges for coordinating funding. This has been driven—at least in part—by differences in delivery channels and the desire on the part of donor partners to be recognized as leaders in the response to the crisis (Jalbout 2015).
Many questions remain around the scope for scale up of current global multilateral institutions as well as the scope and impact of country level multilateral financing mechanisms.
FinAnCing eduCAtion: opportunities For globAl ACtion
88
3. How to Better Tailor the Global Response to the Needs of Different Types of CountriesOur analysis shows that the allocation of both concessional and nonconcessional external financing needs be aligned with countries’ needs and capacity to raise financing through domestic resource mobilization. The gap analysis suggests that at least 40 percent of all concessional financing for education should be directed to LDCs (groups 1 and 2), and potentially a higher share should be targeted to fragile states (groups 1 and 3). Stronger ef-forts in fragile states are critical if the goal of universal, high-quality basic education is to be reached. Efforts in higher income developing countries could include support through other types of financing, such as nonconcessional lending and innovative financing mechanisms (impact investment, blended finance, etc.). Finally, the international community needs to develop an adequate and better coordinated response to protracted humanitarian crises, in particular in MICs with limited access to concessional finance (e.g. Lebanon).
There is currently no global coordination mechanism that has an explicit mandate to highlight these financing gaps, and to coordinate and increase the scale of financing for education around the world. The Incheon Declaration reaffirms UNESCO’s role, as the UN specialized agency for education, as a broad coordinator of the global education agenda, but without specific reference to aid coordination: “…in particular by: undertaking advocacy to sustain political commitment; facilitating policy dialogue, knowledge sharing and standard setting; monitoring progress toward the education targets; convening global, regional and national stakeholders to guide the implementation of the agenda; and functioning as a focal point for education within the overall SDG coordination architecture” (UNESCO 2015).
Other mechanisms also currently do not have the mandate or the scope to take on this task. The GPE has played a valuable role in convening actors to pay attention to basic education issues. However, its sectoral and geographical scope has limited its global presence. In an attempt to further bolster attention to education, the secretary-general of the United Na-tions, Ban Ki-moon, also established the Global Education First Initiative (GEFI). The GEFI is primarily an advocacy initiative that aims to bring together different players in education. The secretary-general also appointed the former UK prime minister, Gordon Brown, as his special envoy for global education. Under the auspices of the special envoy and the GEFI, a number of ministerial meetings have been held to highlight financing challenges and to encourage higher-level engagement in a coordinated response. Yet all these efforts, though valuable, have not been able to match the scale of the challenge—as has been demon-strated by this report’s analysis, and as has also been highlighted in recent experiences that have caught the global education community’s attention (e.g., the exit of the Netherlands and the Syrian refugee crisis).
FinAnCing eduCAtion: opportunities For globAl ACtion
89
Finally, the lack of high-level global leadership has affected the strength of advocacy for donor engagement in education. There is no agency with sufficient clout to identify gaps and hold individual donors to account. This is in contrast to the health sector, where the combined effects of strong multilateral agencies (e.g., the World Health Organization; the Global Fund to Fight AIDS, Tuberculosis and Malaria; and GAVI) and significant philan-thropic backing have resulted in much a stronger global appeal for support. Numerous civil society initiatives, such as the Action for Global Health, have complemented these efforts by raising awareness of global health and bringing donors to account.
4. How to Harness the Potential of All Actors, Including Nonstate Actors? Clearly, solutions beyond more traditional funding will be needed. In addition to improv-ing the effectiveness and allocation of governments and donors, new sources of finance need to be found. Nonstate actors are becoming bigger players in education in developing countries, and private financing flows have been growing rapidly in MICs. However, the education community has not managed to sufficiently capture the attention of these actors to help support the education goals. Vigorous disagreements about the role of private ac-tors as providers and financiers may be one of the reasons for their limited engagement to date. Common ground urgently needs to be found and opportunities for nonstate engage-ment need to be explored, in a way that protects the rights of children to a high-quality and equitable education.
Could a Global Fund for Education Help?The proposed global platform could potentially be integrated in a Global Education Fund that builds off the GPE. A number of recent calls have been made to establish a Global Fund for Education that could improve the scale, coordination and allocation of investment in education. The Oslo Summit and Addis Ababa Financing for Development Conference offer opportunities to discuss the form such a global mechanism could take. The first draft of the Addis Ababa outcome document calls for the GPE to “be strengthened and scaled up to ensure that all girls and boys complete free, equitable and quality primary and secondary education.” It also identifies the need to “explore the most effective, efficient and coherent funding modalities, including the possibility of global funds, building on experi-ences of existing mechanisms” (Addis Ababa Accord; United Nations 2015). Two concrete proposals for a global fund have been made: a Global Fund for Education, building on the GPE; and a Humanitarian Fund for Education in Emergencies (Schmidt-Traub and Sachs 2015; Brown 2012, 2015).
Proposals and discussions in the framework of this report have highlighted that such funds, if established, should have a number of characteristics. The precise framework for such a fund could be further examined, as part of the Global Commission on Education and Financing proposed above:
FinAnCing eduCAtion: opportunities For globAl ACtion
90
■ Global scope and scale, including all actors. The fund would need to have the scope and scale to support education needs in LICs and MICs. Given the scale of the challenge and the need for innovative solutions, the fund would need to include all actors from both the public and private sectors. In order to be successful, the fund would also need significant financial support from all actors, ranging from philanthropists and the busi-ness community to official donors, including emerging donors (e.g., China) and country governments. Concessional financing could also be supplemented with investment-type funding, such as social impact bonds.
■ Global coordination and representation. The fund would have the representation and reputation of a global leader in education, enabling it to organize and advocate for action at the global level, complementing coordination and advocacy activities at the country level. The initiative should be able to bring together high-level leaders of key agencies, including from governments, donors, civil society and the private sector.
■ Flexible financing and delivery modalities. The fund would need to be able to adapt its financing modalities to country contexts and needs. This would include modalities to address the needs of children in the different country contexts identified in this report—including fragile states, LDCs, nonfragile LMICs, UMICs and SIDS. Financing allocations would have a strong results orientation, and proposals would be reviewed by a technical review panel based on costed implementation plans. The fund should have the flexibility to engage with a range of delivery partners, including governments, NGOs and other nonstate actors working alongside governments.
■ Global public goods. Although many organizations are already playing an important role in monitoring progress and advancing the evidence base in education (including the UNESCO GMR, through its high-quality EFA Global Monitoring Report), a potential fund could, through its programs, play a critical role in building an evidence base for what works in education. Building on this knowledge, it could develop tools that could increase the effectiveness and efficiency of education delivery, such as learning assessment tools, book production models and education accounting and transparency tools.77
Action 3: Commit to a Data Revolution in Education Linking Financing and Learning
FinAnCing eduCAtion: opportunities For globAl ACtion
91
This report recommends developing an international initiative (possibly linked to the commission on education investment or global coordination platform) to help overcome the significant lack of consistent basic data on education and financing that is needed by policymakers, parents and funders alike. The initiative would seek to catalyze a data revolution in education, linking disaggregated data on school characteristics, learning
The report highlights in a number of places that the way money is spent is just as important, if not more important, than the amount that is being spent. Our data show that in many countries, spending allocations are not sufficiently needs based and that even when spending increases, it often does not achieve the required minimum levels of learning. A number of the country case studies also underline the need for much greater attention to the effectiveness of spending.
Addressing inequities and inefficiencies in education delivery will require a systemic approach. As noted above, an important part of this approach includes addressing failures in information and accountability systems. These mechanisms are essential to making sure that governments spend enough money on poor people, money reaches front-line providers and incentives for effective delivery are in place (e.g., teachers are paid on time and their presence is monitored) (World Bank 2004). In addition, as resources become more productive, the argument for more resources also becomes much more persuasive. It should be noted, however, that the connection between data collection and the improvement of learning is not automatic or simple; it means collecting the right data and using them ef-fectively. Information can be used in two ways: for management and policy decisionmaking, and for accountability. It can also be collected and used at the national, subnational and school levels.
Action is urgently needed to improve the availability and use of data on education outcomes and financing in an integrated way. Although data are now available on an unprecedented scale, education remains a laggard and a global data gap is holding back progress. Most countries lack the capacity to systematically measure and track financing and learning outcomes over time. As highlighted in the discussion on domestic spending, disaggregated financing data by level of education, geographical area and schools are also extremely weak, making it much harder to assess the equity of spending patterns. Initiatives to improve the disaggregation of education indicators should also include financing data.
In recent years, various initiatives have developed to improve the availability and use of information on education indicators and financing:
■ A number of developing countries have developed Education Management Information Systems (EMIS) that are used to monitor progress on a regular basis.
FinAnCing eduCAtion: opportunities For globAl ACtion
92
and financing. Building on existing experiences, this initiative would aim to bring together lessons learned from ongoing initiatives and build a global coalition engaging private sector partners (e.g., technology companies) in education.
■ Data on learning have been collected through international and national learning assess-ments and school-level report cards.
■ Transparency about education financing has also increased through expenditure-tracking surveys, public expenditure reviews and open and participatory budget processes. An important initiative led by UIS and the International Institute for Educational Planning’s Pôle de Dakar, supported by the GPE, is developing a methodology to implement Na-tional Education Accounts in education (UIS et al. 2015). Such accounts could provide detailed information on education financing. Similar accounts have already improved re-source tracking in the health sector. National health accounts have been institutionalized in 190 countries (van der Gaag and Abetti 2011).
■ Finally, greater participation and voice have been encouraged through decentralization and participatory mechanisms, such as school-based committees and parent–teacher associations. Many of these initiatives have been evaluated through randomized con-trolled trials. However, the initiatives are often undertaken only on a small scale and are implemented under the careful supervision of external actors, and there is much less evi-dence on how these initiatives could be scaled up using public sector structures (Bruns et al. 2011).
In very few countries, education outcomes and financing data are integrated and pre-sented with the detail and disaggregation needed to systematically link information about resources with outcomes at either the subnational or national level. In many cases, information about school-level inputs and outputs, learning outcomes and financing are collected through different mechanisms or held by different organizations and depart-ments, which makes it hard to bring them together in a common platform. There is an urgent need to better understand how this can be done. The information and mobile technology revolution that is taking place in many countries could provide opportunities to make this happen.
Experiences in some developing as well as developed countries may provide useful lessons. In Australia, for example, the government, in partnership with the teacher unions and civil society, has introduced a Web-based platform called My School. The platform integrates, in an intuitive and easily digestible format, data about the financing, learning outcomes and socioeconomic characteristics of each school in Australia. The combination of these data in one place allows for a comparison of how effectively different schools are using financial resources to provide learning. In addition, it allows parents and other educa-tion stakeholders to make like-with-like comparisons between schools serving similar popu-lations to identify best practices.78
FinAnCing eduCAtion: opportunities For globAl ACtion
93
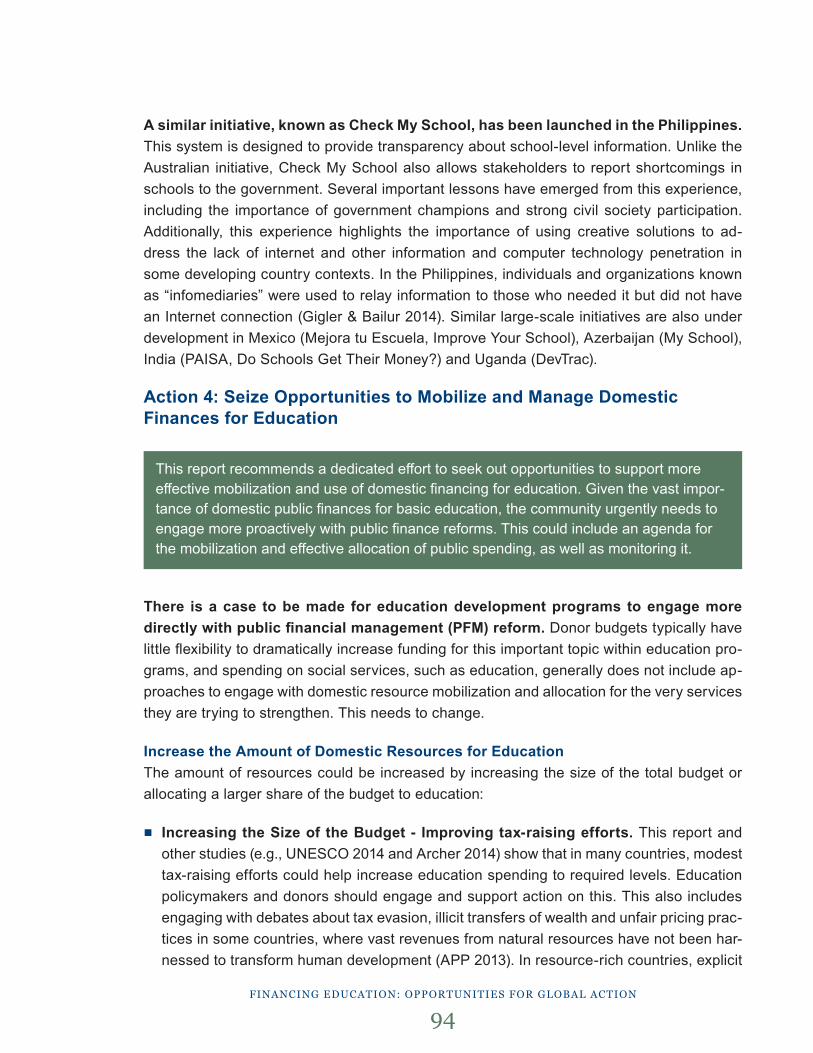
A similar initiative, known as Check My School, has been launched in the Philippines. This system is designed to provide transparency about school-level information. Unlike the Australian initiative, Check My School also allows stakeholders to report shortcomings in schools to the government. Several important lessons have emerged from this experience, including the importance of government champions and strong civil society participation. Additionally, this experience highlights the importance of using creative solutions to ad-dress the lack of internet and other information and computer technology penetration in some developing country contexts. In the Philippines, individuals and organizations known as “infomediaries” were used to relay information to those who needed it but did not have an Internet connection (Gigler & Bailur 2014). Similar large-scale initiatives are also under development in Mexico (Mejora tu Escuela, Improve Your School), Azerbaijan (My School), India (PAISA, Do Schools Get Their Money?) and Uganda (DevTrac).
Action 4: Seize Opportunities to Mobilize and Manage Domestic Finances for Education
There is a case to be made for education development programs to engage more directly with public financial management (PFM) reform. Donor budgets typically have little flexibility to dramatically increase funding for this important topic within education pro-grams, and spending on social services, such as education, generally does not include ap-proaches to engage with domestic resource mobilization and allocation for the very services they are trying to strengthen. This needs to change.
Increase the Amount of Domestic Resources for Education The amount of resources could be increased by increasing the size of the total budget or allocating a larger share of the budget to education:
■ Increasing the Size of the Budget - Improving tax-raising efforts. This report and other studies (e.g., UNESCO 2014 and Archer 2014) show that in many countries, modest tax-raising efforts could help increase education spending to required levels. Education policymakers and donors should engage and support action on this. This also includes engaging with debates about tax evasion, illicit transfers of wealth and unfair pricing prac-tices in some countries, where vast revenues from natural resources have not been har-nessed to transform human development (APP 2013). In resource-rich countries, explicit
FinAnCing eduCAtion: opportunities For globAl ACtion
94
This report recommends a dedicated effort to seek out opportunities to support more effective mobilization and use of domestic financing for education. Given the vast impor-tance of domestic public finances for basic education, the community urgently needs to engage more proactively with public finance reforms. This could include an agenda for the mobilization and effective allocation of public spending, as well as monitoring it.
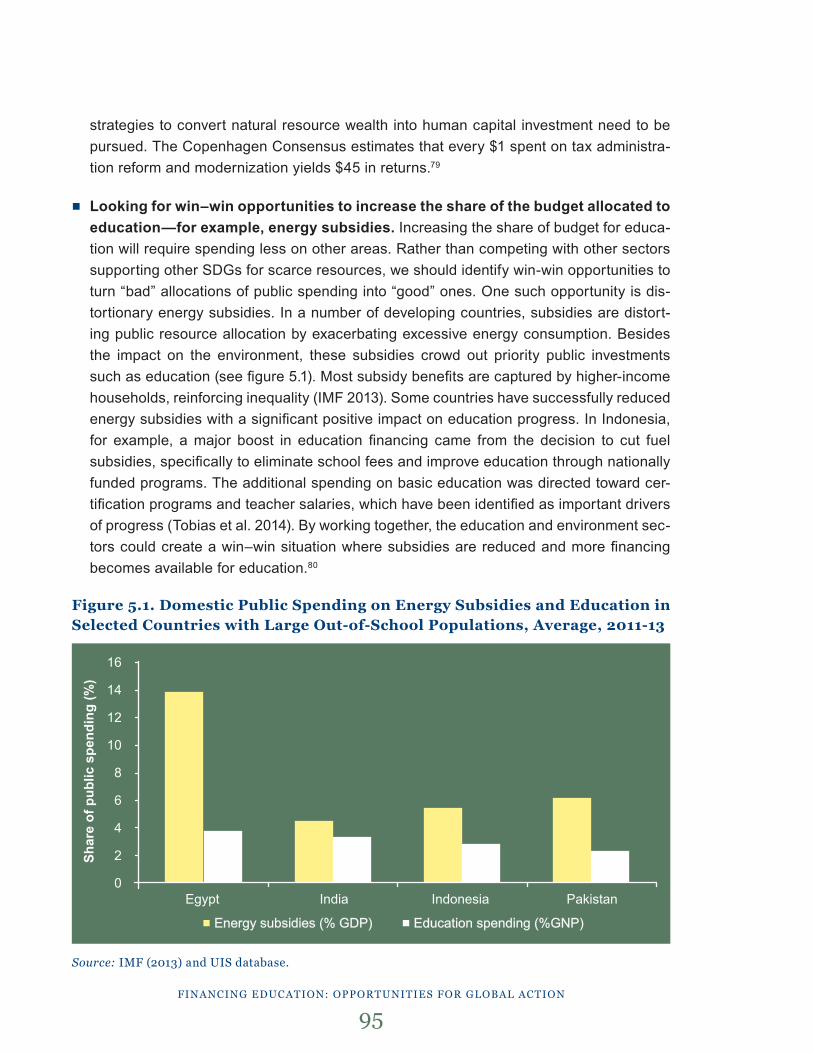
strategies to convert natural resource wealth into human capital investment need to be pursued. The Copenhagen Consensus estimates that every $1 spent on tax administra-tion reform and modernization yields $45 in returns.79
■ Looking for win–win opportunities to increase the share of the budget allocated to education—for example, energy subsidies. Increasing the share of budget for educa-tion will require spending less on other areas. Rather than competing with other sectors supporting other SDGs for scarce resources, we should identify win-win opportunities to turn “bad” allocations of public spending into “good” ones. One such opportunity is dis-tortionary energy subsidies. In a number of developing countries, subsidies are distort-ing public resource allocation by exacerbating excessive energy consumption. Besides the impact on the environment, these subsidies crowd out priority public investments such as education (see figure 5.1). Most subsidy benefits are captured by higher-income households, reinforcing inequality (IMF 2013). Some countries have successfully reduced energy subsidies with a significant positive impact on education progress. In Indonesia, for example, a major boost in education financing came from the decision to cut fuel subsidies, specifically to eliminate school fees and improve education through nationally funded programs. The additional spending on basic education was directed toward cer-tification programs and teacher salaries, which have been identified as important drivers of progress (Tobias et al. 2014). By working together, the education and environment sec-tors could create a win–win situation where subsidies are reduced and more financing becomes available for education.80
Figure 5.1. Domestic Public Spending on Energy Subsidies and Education in Selected Countries with Large Out-of-School Populations, Average, 2011-13
Source: iMF (2013) and uis database.
FinAnCing eduCAtion: opportunities For globAl ACtion
95
16
14
12
10
8
6
4
2
0 Egypt India Indonesia Pakistan
■ Energy subsidies (% GDP) ■ Education spending (%GNP)
Shar
e of
pub
lic s
pend
ing
(%)
Improve the Use and Allocation of Education Public Spending Simply providing more resources for education will not necessarily improve education sys-tems. The way education financing is allocated and spent has a critical bearing on the qual-ity and equity of education provision. As we press the case for increased domestic financing for education, we should also encourage public financial management reform that will sup-port improvements in the quality of public expenditures.
PFM reforms have ranged from improvements in budget formulation and execution (through medium-term expenditure frameworks) to decentralization of financing and decisionmaking and reform of procurement systems. However, these reforms do not necessarily translate into improved education delivery. Standard PFM reform programs tend to be focused on the ministries of finance, with insufficient attention given to line ministries, including ministries of education. The links between PFM functions and service delivery are not yet well under-stood (Welham et al. 2013). For example, very few donors are engaging in the way financing for education is allocated within countries. In many countries, allocations are opaque and inequitable. Our understanding of the use and impact of financing formulas and how the dis-tribution of financial responsibilities across levels of government could potentially improve the delivery of education is still limited. This would include an agenda to better analyze the allocation of public resources to different levels of education and opportunities for cost re-covery at higher levels of education.
Enhancing the Transparency and Accountability of Education BudgetsFinally, education spending needs to be better understood and monitored. One way to do this is through a data revolution in education linking financing to education outcomes (see action 3).
FinAnCing eduCAtion: opportunities For globAl ACtion
96
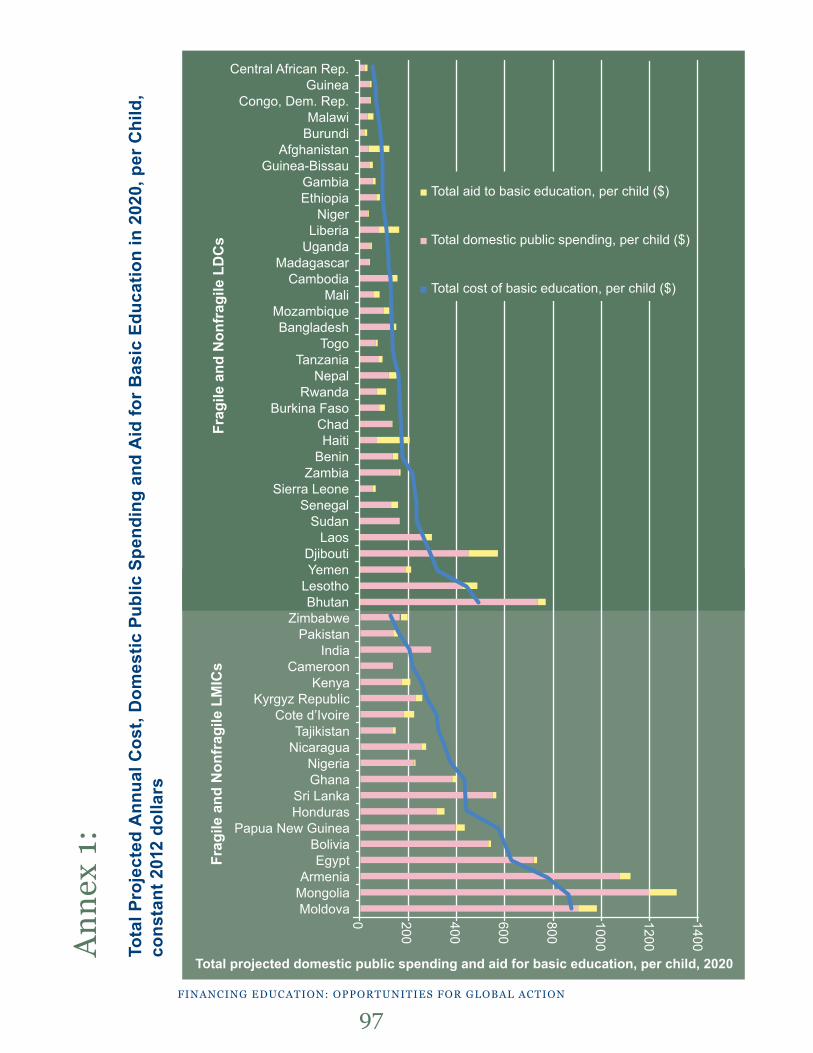
Ann
ex 1
: To
tal P
roje
cted
Ann
ual C
ost,
Dom
estic
Pub
lic S
pend
ing
and
Aid
for B
asic
Edu
catio
n in
202
0, p
er C
hild
, co
nsta
nt 2
012
dolla
rs
FinAnCing eduCAtion: opportunities For globAl ACtion
97
ZimbabwePakistan
IndiaCameroon
KenyaKyrgyz Republic
Cote d’IvoireTajikistan
NicaraguaNigeriaGhana
Sri LankaHonduras
Papua New GuineaBoliviaEgypt
ArmeniaMongoliaMoldova
1400
1200
1000
800
600
400
2000
Central African Rep.Guinea
Congo, Dem. Rep.Malawi
BurundiAfghanistan
Guinea-BissauGambiaEthiopia
NigerLiberia
UgandaMadagascar
CambodiaMali
MozambiqueBangladesh
TogoTanzania
NepalRwanda
Burkina FasoChadHaiti
BeninZambia
Sierra LeoneSenegal
SudanLaos
DjiboutiYemen
LesothoBhutan
1400
1200
1000
800
600
400
200
0
■ Total aid to basic education, per child ($)
■ Total domestic public spending, per child ($)
■ Total cost of basic education, per child ($)
Frag
ile a
nd N
onfr
agile
LD
Cs
Frag
ile a
nd N
onfr
agile
LM
ICs
Total projected domestic public spending and aid for basic education, per child, 2020
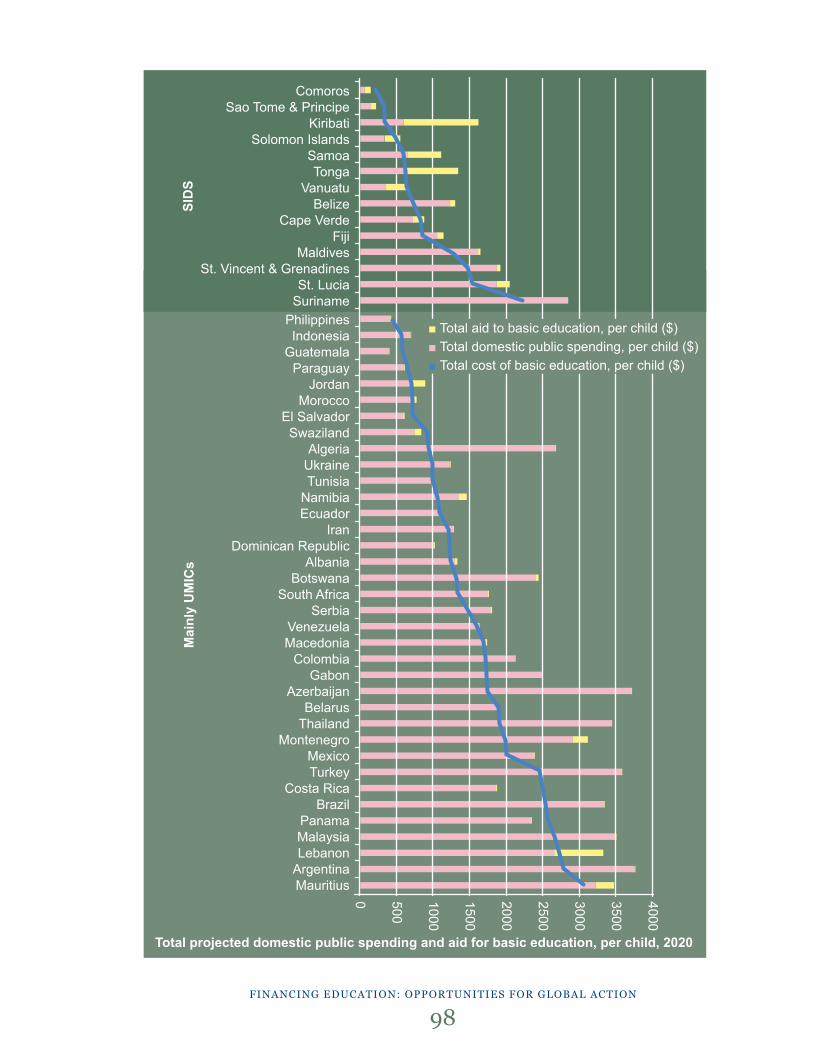
FinAnCing eduCAtion: opportunities For globAl ACtion
98
PhilippinesIndonesia
GuatemalaParaguay
JordanMorocco
El SalvadorSwaziland
AlgeriaUkraineTunisia
NamibiaEcuador
IranDominican Republic
AlbaniaBotswana
South AfricaSerbia
VenezuelaMacedonia
ColombiaGabon
AzerbaijanBelarus
ThailandMontenegro
MexicoTurkey
Costa RicaBrazil
PanamaMalaysiaLebanon
ArgentinaMauritius
ComorosSao Tome & Principe
KiribatiSolomon Islands
SamoaTonga
VanuatuBelize
Cape VerdeFiji
MaldivesSt. Vincent & Grenadines
St. LuciaSuriname
4000
3500
3000
2500
2000
1500
1000
500
0
■ Total aid to basic education, per child ($)■ Total domestic public spending, per child ($)■ Total cost of basic education, per child ($)
SID
SM
ainl
y U
MIC
s
Total projected domestic public spending and aid for basic education, per child, 2020

FinAnCing eduCAtion: opportunities For globAl ACtion
99
Annex 2: Goal 4 of the United Nations General Assembly’s Open Working Group on Sustainable Development Goals: Ensure Inclusive and Equitable High-Quality Education and Promote Lifelong Learning Opportunities for All
4.1 By 2030, ensure that all girls and boys complete free, equitable and [high-]quality pri-mary and secondary education leading to relevant and effective learning outcomes
4.2 By 2030, ensure that all girls and boys have access to [a high-]quality early childhood development, care and pre-primary education so that they are ready for primary edu-cation
4.3 By 2030, ensure equal access for all women and men to affordable and [high-]quality technical, vocational and tertiary education, including university
4.4 By 2030, increase by [x] per cent the number of youth and adults who have relevant skills, including technical and vocational skills, for employment, decent jobs and entre-preneurship
4.5 By 2030, eliminate gender disparities in education and ensure equal access to all levels of education and vocational training for the vulnerable, including persons with disabilities, indigenous peoples and children in vulnerable situations
4.6 By 2030, ensure that all youth and at least [x] per cent of adults, both men and women, achieve literacy and numeracy
4.7 By 2030, ensure that all learners acquire the knowledge and skills needed to promote sustainable development, including, among others, through education for sustainable development and sustainable lifestyles, human rights, gender equality, promotion of a culture of peace and non-violence, global citizenship and appreciation of cultural diversity and of culture’s contribution to sustainable development
4.a Build and upgrade education facilities that are child, disability and gender sensitive and provide safe, non-violent, inclusive and effective learning environments for all
4.b By 2020, expand by [x] per cent globally the number of scholarships available to devel-oping countries, in particular least developed countries, small island developing states and African countries, for enrollment in higher education, including vocational training
FinAnCing eduCAtion: opportunities For globAl ACtion
100
and information and communications technology, technical, engineering and scientific programmes, in developed countries and other developing countries
4.c By 2030, increase by [x] per cent the supply of qualified teachers, including through international cooperation for teacher training in developing countries, especially least developed countries and small island developing states

FinAnCing eduCAtion: opportunities For globAl ACtion
101
Annex 3: Methodology
Country coverageThe paper utilizes the OECD Development Assistance Committee (DAC)’s list of ODA-eligi-ble countries.
Income classifications. For ODA-eligible countries, the paper uses the World Bank 2015 fiscal year classifications based on GNI per capita for 2013 calculated using the World Bank Atlas method. Countries are grouped for Fiscal Year 2015 as low income (GNI per capita of $1,045 or less), middle income (GNI per capita of more than $1,045 but less than $12,746), high income (GNI per capita of more than $12,746). Lower-middle and upper-middle income countries are separated at GNI per capita of $4,125. Note: While Kosovo (lower middle income) and American Samoa, Bulgaria, Hungary and Romania (upper middle income) ap-pear on the World Bank list, they are excluded from this analysis due to ineligibility for ODA. See: http://www.oecd.org/dac/stats/daclist.htm, http://data.worldbank.org/about/country-and-lending-groups
Regional classifications. The paper uses the World Bank regional classification (for de-veloping countries only): East Asia and Pacific (EAP) (24 countries), Europe and Central Asia (ECA) (21 countries), Latin America and the Caribbean (LAC) (26 countries), Middle East and North Africa (13 countries), South Asia (8 countries) and Sub-Saharan Africa (47 countries).
Least Developed Countries (LDCs). The paper uses the United Nations’ list of 48 Least Developed Countries (LDCs). LDCs are low-income countries with severe structural impedi-ments to sustainable development. The UN Committee for Development Policy reviews the LDC list every three years. LDCs are designated based on three criteria: gross national income (GNI) per capita, the human asset index (HAI) and the economic vulnerability index (EVI). See: http://www.un.org/en/development/desa/policy/cdp/ldc/ldc_list.pdf
Domestic Public Spending on EducationData on domestic spending are highly incomplete, making comparisons over time problem-atic, particularly for income-based country groups and regions. Domestic public spending figures come from UIS data. Figures include education spending as a share of GDP (%), education spending as a share of total domestic public spending for total education, pre-primary, primary and lower secondary education, and per student spending (constant 2012 US$). Due to limited data availability, over time estimates use most recent data from 2000
FinAnCing eduCAtion: opportunities For globAl ACtion
102
to 2002 for the base year and from 2011 to 2012 for the most recent year. In some cases, figures use most recent years for 2010-2012. Country income and regional groups are aver-ages of available data.
Aid to EducationThe main source of aid data in this report is the OECD-DAC CRS database. All aid figures are gross disbursements unless otherwise mentioned, and are expressed in 2012 constant dollars. For gross disbursements, data are available from 2002 to 2013.
Calculations of aid to education are expressed in two ways: (1) sector allocable aid only and (2) complete aid that includes non-sector allocable aid. Sector allocable aid refers to aid di-rectly allocated to a sector or sub-sector. The inclusion of non-sector allocable aid attempts to account for General Budget Support (GBS) which may benefit education. At the education sub-sector level, these figures also include a share of education level unspecified aid.
Calculations for sector and non-sector education aid are based on UNESCO-GMR’s meth-odology, using the following formulae:
■ Total education aid = total education sector allocable ODA + 20 percent GBS
■ Primary education aid = basic/primary education sector allocable ODA + 50 percent edu-cation level unspecified ODA + 10 percent GBS
■ Secondary education aid = secondary education sector allocable ODA + 25 percent edu-cation level unspecified ODA + 5 percent GBS
■ Post-Secondary education aid = post-secondary sector allocable ODA + 25 percent level unspecified + 5 percent GBS
■ Lower secondary education aid = 50 percent sector and non-sector allocable secondary education ODA
The CRS does not report lower secondary education ODA specifically. All lower secondary education figures used in this paper—both sector allocable and sector/non-sector allocable- are calculated using 50 percent of secondary education aid.
To compensate for the volatility of aid flows, most figures are represented as three year averages. Regional allocations based on OECD-DAC regions are considered as ‘other al-locations’ and do not factor into country-level allocations.

FinAnCing eduCAtion: opportunities For globAl ACtion
103
Basic education aid is inclusive of both primary education and lower secondary edu-cation aid. Primary education aid includes early childhood education and basic life skills for youth and adults, based on OECD-DAC categorization.
Bilateral donors are defined in this paper as the 29 DAC donors only. Non-DAC donors are referred to separately as emerging or nontraditional donors, but are included in total aid figures.
Financing Education in Different Country ContextsCountry groups utilized to examine different country contexts in this analysis builds on a methodology developed by the OECD-DAC that classifies countries based on fragility, IDA eligibility and income level. The 145 ODA-eligible countries are divided into 6 categories: Fragile LDCs, Nonfragile LDCs, Fragile LMICs, Nonfragile LMICs, Mainly UMICs, and SIDS. Keeping with the OECD-DAC categorization, the West Bank and Gaza and Equatorial Guin-ea are excluded. The country groups have been adjusted in two significant ways: (i) SIDS with populations under 1 million are placed in a separate category and (ii) Malawi and Nepal were removed from the fragile LDC category to the nonfragile LDC category, as they were no longer on the World Bank 2014 fragile states list and were below (Malawi) or very close to the cutoff point (Nepal) on the OECD Fragile States Index. A range of education and finance indicators were analyzed based on averages by country groupings. Domestic public spend-ing data and aid data were determined based on the description in the previous section. Shares of aid are calculated based on totals from country level allocations, and thus exclude regional allocations and aid unallocated by country. Education indicators were taken from UIS; base years are most recent data from 2000-2002 while data for the most recent year range from 2009-2013.
Per capita figures are calculated using World Bank population data which are derived from United Nations population data. Per child basic education aid is calculated using the prima-ry-age population and the lower secondary-age population from UIS.
ProjectionsCurrent domestic spending on education: Current education spending estimates sums most recent UIS data (between years 2009 and 2012) on education expenditure as percent of GDP for pre-primary, primary and secondary. Data for pre-primary and secondary are both halved to represent spending on one year of pre-primary and spending on lower-sec-ondary. Income group averages are used where observations are missing. Current expendi-ture is calculated by applying these data to 2012 World Bank GDP values.
Domestic spending projections for 2020: Projections for domestic expenditure on basic education combine GDP projections with improved revenues and an increase in spending

FinAnCing eduCAtion: opportunities For globAl ACtion
104
on basic education to 12 percent of budgets, which represents 62 percent of the 20 percent of budgets recommended by the GMR to be spent on total education.
Revenues are predicted by combining a country’s tax capacity, which captures capability rather than actual tax performance, and non-tax data from the ICTD. Tax capacity is calcu-lated using ODI’s estimate of “tax effort” (tax as percent of tax capacity) applied to current tax rates. For example, if a country’s tax effort is said to be 80 percent and its current tax rate is 20 percent of GDP, the country’s tax capacity would be 25 percent of GDP. ODI’s analysis uses a model-based prediction of each country’s tax capacity combining two stud-ies, Minh Le et al. (2012) from the World Bank and Fenochietto and Pessino (2013) from the IMF. Both studies estimate tax capacity on the basis of country characteristics such as income, the size of the agricultural sector, demographic growth rates, trade openness, and governance quality. Regional averages are used when observations are missing and current tax rates are used when ‘tax effort’ values exceed 100 percent.
As there are no existing projections for non-tax revenues, most recent ICTD non-tax data (percent of GDP) are assumed to remain constant until year 2020. Non-tax revenue incorpo-rates all revenue from natural resource production as well as revenue from state enterprises and licenses.
To calculate potential future revenues, tax capacities (percent of GDP) and non-tax reve-nues (percent of GDP) are applied to projected GDP values to the year 2020, which are cal-culated using IMF percent change estimates from the World Economic Outlook Database. Observations are dropped when either tax or non-tax revenue data are missing. 81
Current tax revenues (percent of GDP) come from the most recent World Bank and ICTD data available (between 2009 and 2012) with the following exceptions: 1) Samoa’s tax rate is assumed to be the 2010 ICTD estimate of 22.6 percent instead of the World Bank 2012 estimate of 0.02 percent, and 2) Tax data for Brazil, Colombia, Costa Rica and Mexico are taken from OECD Revenue Statistic for Latin America and the Caribbean, using data from 2012 and not including social security contributions.82 World Bank tax data capture compul-sory transfers to the central government for public purposes. Certain compulsory transfers such as fines, penalties, and most social security contributions are excluded. ICTD tax data exclude social contributions and natural resource revenue.
Domestic expenditure on basic education is assumed to be 12 percent of total revenues, except in cases where current spending already exceeds this goal. Current spending is cal-culated using UIS data on expenditure on education as percent of total government expen-diture. As this data is sparse, current spending was calculated using three different methods and an average was taken when calculations yielded more than one result: 1) Summing
FinAnCing eduCAtion: opportunities For globAl ACtion
105
expenditure on pre-primary, primary, and lower-secondary, 2) Subtracting expenditure on upper secondary and tertiary from total education expenditure, and 3) Taking 62 percent of total education expenditure.
Aid Projections by 2020: Projections for aid levels in the year 2020 are calculated by applying the historical growth rate in total ODA between an average of 2002 to 2004 and an average of 2011 to 2013, to account for volatility, to 2013 total ODA values.83, 84 Current shares of total aid directed toward basic education, using an average of 2011 to 2013 rates, are applied to projected total ODA values to calculate a predicted amount of aid that would be available for spending on basic education. Basic education aid includes both sector al-locable aid and a share of sector unspecified and budget support.
Costs to achieve basic education goals by 2020: Predicted future costs of education for low and lower-middle income countries are taken directly from GMR estimates. To calculate similar costs for upper-middle income countries, we estimated a cost of 3 percent of GDP based on the assumption that costs would remain lower than what is estimated for LMICs, which is about 3.5 percent of GDP. Future GDP values are calculated using IMF percent change estimates to the year 2020 from the World Economic Outlook Database.85
FinAnCing eduCAtion: opportunities For globAl ACtion
106
referencesAlonso, J. D., and A. Sanchez, eds. 2011. Reforming Education Finance in Transition Coun-
tries: Six Case Studies in Per Capita Financing Systems. Washington: World Bank.
Andrews, M., Pritchett, L., & Woolcock, M. 2013. “Escaping capability traps through problem driven iterative adaptation (PDIA).” World Development. 51: 234-244.
APP (Africa Progress Panel). 2013. Equity in Extractives: Stewarding Africa’s Natural Re-sources for All. Geneva: Africa Progress Panel.
Archer, D. 2014. The Sustainability of the Global Partnership for Education: The Role of Domestic Resource Mobilization. London: Actionaid.
Avenir Analytics. 2014. “A Review of Donors’ Humanitarian Policies on Education.” Commis-sioned by the Norwegian Refugee Council and Save the Children, August 2014
Barder, O. 2012. “The Implications of Complexity for Development: The Kapuściński Lec-ture.” Washington: Center for Global Development.
Bellinger, A., and B. Fletcher. 2014. “Non-Traditional Financing for Education.” EPS Peaks, UK Department for International Development.
Beynon, J. 2003. Poverty Efficient Allocations: Collier/Dollar Revisited. London: Overseas Development Institute.
Birdsall, Nancy, and William D. Savedoff. 2010. Cash on Delivery: A New Ap-proach to Foreign Aid. Washington: Center for Global Development. http://www.cgdev.org/sites/default/files/1423949_file_CODAid_SECOND_web.pdf.
Brown, G. 2012. Delivering on the Promis, Building Opportunity: the Case for a Global Fund for Education. A Review by Gordon Brown.
Brown, G. 2015. “Gordon Brown Calls for a Global Emergency Fund.” Office of Gordon and Sarah Brown, January 26, 2015. http://gordonandsarahbrown.com/2015/01/gordon-brown-calls-global-emergency-education-fund/.
Bruns, B., et al. 2011. Making Schools Work: New Evidence from Accountability Platforms. Washington: World Bank.
Burnett, N. 2013. “Buy-Downs for Education.” Presentation to the Global Partnership for Education Board Meeting, Addis Ababa, November 2013.
FinAnCing eduCAtion: opportunities For globAl ACtion
107
CAF – Charities Aid Foundation. 2014. World Giving Index 2014. Alexandria: The Charities Aid Foundation.
Carnoy, Martin. 2006 “Rethinking the comparative—and the international.” Comparative Education Review 50, No 4, 2006: 551-570.
Commission on the Economy and Climate. 2014. The New Climate Economy. Washington: WRI and partners.
Conn, K. (2014). “Identifying Effective Education Interventions in Sub-Saharan Africa: A meta-analysis of rigorous impact evaluations.” Unpublished manuscript. New York: Co-lumbia University.
Dattani, P., et al. 2015. Business Backs Education: Creating a Baseline for Corporate CSR Spending on Global Education Initiatives. Report of Business Backs Education campaign, launched by Varkey Foundation in partnership with Dubai Cares and UNESCO. http://www.unesco.org/education/BBE-EPG-Report2015.pdf.
EPDC (Education Policy and Data Center) and UNESCO. 2009. Estimating the Costs of Achieving Education for All in Low-Income Countries. Background paper prepared for Education for All Global Monitoring Report 2010. Washington and Paris: EPDC and UNESCO.
Evans, D. K., and A. Popova 2015. What Really Works to Improve Learning in Developing Countries? An Analysis of Divergent Findings in Systematic Reviews. Washington: World Bank.
Fenochietto, R. and Pessino, C. 2013. Understanding countries’ tax effort. IMF Working Paper 13/244. Washington, DC: International Monetary Fund.
Flipp, R. and L. Lerer 2013. Innovative Financing for Education. Baden, Switzerland: Innova-tive Finance Foundation.
Foko, B., et al. 2012. Household Education Spending: An Analytical and Comparative Per-spective for 15 African Countries. Dakar: UNESCO and Pôle de Dakar.
Foundation Center. 2014. “Foundation stats”, http://data.foundationcenter.org (2011 and 2012 data, accessed on 12 February 2014).
GCPEA (Global Coalition to Protect Education from Attack). 2014. Education Under Attack 2014. New York: GCPEA.
FinAnCing eduCAtion: opportunities For globAl ACtion
108
Gigler, B.S. and S.Bailur (eds.). 2014. Closing the Feedback Loop. Can Technology Bridge the Accountability Gap? Directions in Development. Public Sector Governance. Washing-ton: World Bank.
Girishankar, N. 2009. “Innovating Development Finance. From Financing Sources to Finan-cial Solutions.” CFP Working Paper Series No.1. Washington: World Bank
Glewwe, P. W., Hanushek, E. A., Humpage, S. D., & Ravina, R. 2014. “School resources and educational outcomes in developing countries: a review of the literature from 1990 to 2010.” Education Policy in Developing Countries, ed. Glewwe, P. Chicago and London: University of Chicago Press.
Global Business Coalition for Education. 2014. Cooperating with Multilaterals for Global Education: Opportunities for the Business Community. http://issuu.com/gbceducation/docs/final_policybriefgpereplenishment_f/1?e=13809657/9570236
Goodall, E. 2014. Choosing Social Impact Bonds A Practitioner’s Guide. Bridges Impact and Bank of America Merrill Lynch.
GPE (Global Partnership for Education). 2012. Making Education Aid More Effective: Moni-toring Exercise on Aid Effectiveness in the Education Sector—Synthesis Report. Wash-ington: GPE.
Greenhill, R., A. Prizzon, A. Rogerson. 2013. The Age of Choice: Developing Countries in the New Aid Landscape. London: ODI.
Greenhill, R., P.Carter, M. Manuel, and C. Hoy. 2015. Financing the Future: How Interna-tional Finance Should Fund a Global Compact to Eradicate Poverty. London: Overseas Development Institute.
Gustafsson-Wright, E., et al. 2015. The Potential and Limitations of Impact Bonds: Lessons from The First Five Years of Deals Worldwide. Washington: Brookings Institution.
Hagen-Zanker, J., and A. McCord. 2011. The Feasibility of Financing Sectoral Development Targets. Project Briefing 55. London: Overseas Development Institute.
Hall, N. with M. Mambo. 2015. Financing Education in Malawi: Opportunities for Action. Pa-per Prepared for the Oslo Summit on Education and Development. Oslo, Norway.
Henon, S. 2014. “Measuring Private Development Assistance: Emerging Trends and Chal-lenges.” Paper for Development Initiatives.
FinAnCing eduCAtion: opportunities For globAl ACtion
109
Hudson Institute. 2013. The Index of Global Philanthropy and Remittances 2013, with a Spe-cial Report on Emerging Economies. Washington: Hudson Institute.
IMF (International Monetary Fund). 2013. Energy Subsidy Reform: Lessons and Implica-tions. Washington: IMF.
Jalbout, M. 2014. The Case for Engaging Arab Donors in Financing Global Education. Wash-ington: Brookings Institution.
Jalbout, M. with Steven Zyck. 2015. Financing Education in Pakistan: Opportunities for Ac-tion. Paper Prepared for the Oslo Summit on Education and Development. Oslo, Nor-way.
Kremer, M., Brannen, C., & Glennerster, R. 2013. “The challenge of education and learning in the developing world.” Science, 340: 297-300.
Krishnaratne, S., White, H., & Carpenter, E. 2013. “Quality education for all children? What works in education in developing countries.” 3ie Working Paper 20, International Initiative for Impact Evaluation.
Lancet Commission. 2013. “Global Health 2035: A World Converging within a Generation.” The Lancet 382: 1898–1955.
Le, T.M., Moreno-Dodson, B. and Bayraktar, N. 2012. Tax capacity and tax effort: Extended cross-country analysis from 1994 to 2009. Policy Research Working Paper 6242. Wash-ington, DC: World Bank.
Majgaard, K. and A. Mingat. 2012. Education in Sub-Saharan Africa. A Comparative Analy-sis. Washington: World Bank.
Malik, R. & Rose, P. 2015. Financing Education in Pakistan: Opportunities for Action. Paper Prepared for the Oslo Summit on Education and Development. Oslo, Norway.
Martin, M. 2013. “Making Impact Investible.” Impact Economy Working Papers Vol. 4. Impact Economy.
McEwan, P. 2012. “Improving Learning in Primary Schools of Developing Countries: A Meta-Analysis of Randomized Experiments.” Review of Educational Research. 20: 1–42.
Murnane, R. J., & Ganimian, A.J. 2014a. “Improving Educational Outcomes in Developing Countries: Lessons from Rigorous Evaluations.” NBER Working Paper No. 20284. Cam-bridge, MA: National Bureau of Economic Research.
FinAnCing eduCAtion: opportunities For globAl ACtion
110
Nicolai, S., and Sebastien Hine. 2015a. Investment for Education in Emergencies: A Review of Evidence. London: Overseas Development Institute.
Nicolai, S., S. Hine and J. Wales. 2015b. Education in Emergencies and Protracted Crises. Towards a Strengthened Response. London: Overseas Development Institute.
Nicolai, S., et al. 2014. Beyond Basics: The Growth of Post-Primary Education in Kenya. London: Overseas Development Institute.
Noble, A., and M. Drexler. 2013. From the Margins to the Mainstream: Assessment of the Impact Investment Sector and Opportunities to Engage Mainstream Investors. Geneva: World Economic Forum.
Nwoko, C. 2015. Financing Education in Nigeria: Opportunities for Action. Paper Prepared for the Oslo Summit on Education and Development. Oslo, Norway.
OECD (Organization for Economic Cooperation and Development). 2011. 2011 OECD Re-port on Division of Labor: Addressing Cross-Country Fragmentation of Aid. Report for the 4th High-Level Forum on Aid Effectiveness, November 2011. Paris: OECD.
———. 2014. Development Cooperation Report 2014. Mobilizing Resources for Sustain-able Development. Paris: OECD.
———. 2015. States of Fragility 2015: Meeting Post-2015 Ambitions. Paris: OECD.
Patrinos, H. A., and S. Sosale. 2007. Mobilizing the Private Sector for Public Education. Washington: World Bank.
Perakis, R. and W. Savedoff. 2015. “Does Results-Based Aid Change Anything? Pecuni-ary Interests, Attention, Accountability and Discretion in Four Case Studies.” CGD Policy paper 52. Washington: Center for Global Development.
Psacharopoulos, G. and A. Patrinos. 2004. “Returns to Investment in Education: A Further Update”. Education Economics. 12, no. 2, 2004:111-135.
Psacharopoulos, G. 2014. Benefits and Costs of the Education Targets for the Post-2015 Development Agenda. Copenhagen: Copenhagen Consensus Center.
Rabinowitz, G., and A. Prizzon. 2014. Financing for Development: Lessons from Develop-ment Progress. Case Studies. London: Overseas Development Institute.
Ramalingam, B. 2013. Aid on the edge of chaos: rethinking international cooperation in a complex world. Oxford: Oxford University Press.
FinAnCing eduCAtion: opportunities For globAl ACtion
111
Reliefweb. 2015a. “Back to School After the Ebola Outbreak.” May 2 2015. http://reliefweb.int/report/sierra-leone/back-school-after-ebola-outbreak.
———. 2015b. “Nepal Humanitarian Dashboard.” http://reliefweb.int/sites/reliefweb.int/files/resources/humdashboard_02jun2015_0.pdf.
Rose, P., and L. Steer. 2013. Financing Global Education: Opportunities for Multilateral Ac-tion. Washington: Brookings Institution.
Ryoo, Jai-Kyung, Young-Sook Nam, and Martin Carnoy. 1993. “Changing rates of return to education over time: A Korean case study.” Economics of Education Review 12, No1. 1993:71-80.
Schmidt-Traub, G. and J. Sachs. 2015. Financing Sustainable Development: Implementing the SDGs through Effective Investment Strategies and Partnerships. New York: Sustain-able Development Solutions Network.
Saltuk, Y. 2014. “Spotlight on the Market: The Impact Investor Survey.” May 2014, JP Mor-gan. http://www.thegiin.org/binary-data/2014MarketSpotlight.PDF.
Sheth, A., et al. 2013. India Philanthropy Report 2013. Boston: Bain & Company.
Smith, K., T. Y. Fordelone, and F. Zimmerman. 2010. Beyond the DAC: The Welcome Role of Other Providers of Development Co-operation. Development Cooperation Directorate Issues Brief. May 20120. Paris: Development Assistance Committee of Organization for Economic Cooperation and Development.
Steensen, S. 2014. “Keeping ODA Focused in a Shifting World.” in OECD. 2014. Develop-ment Cooperation Report 2014. Mobilizing Reosurces in a Shifting World. Chapter 2. Paris: OECD.
Steer, L., and C. Wathne. 2009. Achieving Universal Basic Education: Constraints and Op-portunities in Donor Financing. London: Overseas Development Institute.
Steer, L. and G. Baudienville. 2010. What Drives Donor Financing of Basic Education. Proj-ect Briefing No 39. London: Overseas Development Institute.
Steer, L., J. Engel, A. McWilliam and M. Vandemoortele. 2010. Mapping Progress: Evidence for a New Development Outlook. London: Overseas Development Institute.
Steer, L., H. Ghanem and M. Jalbout. 2014a. Arab Youth: Missing Educational Foundations for a Productive Life? Washington: Brookings Institution.
FinAnCing eduCAtion: opportunities For globAl ACtion
112
Steer, L., F. Rabbani and A. Parker. 2014b. Primary Education Finance for Equity and Qual-ity: An Analysis of Past Success and Future Options in Bangladesh. Washington: Global Economy and Development and Brookings Institution.
Strand, A. 2015. Financing Education in Afghanistan: Opportunities for Action. Paper Pre-pared for the Oslo Summit on Education and Development. Oslo, Norway.
Sy, A. and F.M. Rakotondrazaka. 2015. Private Capital Flows, Official Development Assis-tance, and Remittances to Africa: Who Gets What?. Washington: Brookings Institution.
Tobias, J., et al. 2014. Towards Better Education Quality: Indonesia’s Promising Path. Lon-don: Overseas Development Institute.
Tooley, J. 2009. The Beautiful Tree. Washington: Cato Institute
UIS (UNESCO Institute for Statistics) et al. 2015. National Education Accounts: A Compre-hensive Framework to Improve Education Finance Statistics. Incheon: World Education Forum.
United Nations. 2014. Report of the Special Rapporteur on the Right to Education, Submit-ted to the UN General Assembly, A/69/402. New York: United Nations.
United Nations. 2015. Addis Ababa Accord. Zero Draft. http://www.un.org/esa/ffd/wp-con-tent/uploads/2015/03/1ds-zero-draft-outcome.pdf
UNESCO. 1996. Learning: The Treasure Within. Report to UNESCO of the International Commission on Education for the Twenty-First Century. Paris: UNESCO. http://unesdoc.unesco.org/images/0010/001095/109590eo.pdf.
———. 2000. The Dakar Framework for Action: Education for All—Meeting our Collective Commitments. Adopted by World Education Forum, Dakar, April 2000. Paris: UNESCO.
———. 2013a. Education for All Is Affordable—by 2015 and Beyond. Policy Paper 06, for EFA Global Monitoring Report. Paris: UNESCO.
———. 2013b. Rethinking Education in a Changing World: Meeting of the Senior Experts’ Group, Paris, 12–14 February 2013, Report Prepared by the UNESCO Secretariat. Paris: UNESCO. http://unesdoc.unesco.org/images/0022/002247/224743e.pdf.
———. 2014. EFA Global Monitoring Report 2013/14: Teaching and Learning—Achieving Quality for All. Paris: UNESCO.
FinAnCing eduCAtion: opportunities For globAl ACtion
113
———. 2015. 2015 Global Monitoring Report: Education for All 2000–2015—Achievements and Challenges. Paris: UNESCO.
UNICEF. 2015a. “Humanitarian Action for Children.” http://reliefweb.int/sites/reliefweb.int/files/resources/Final_2015_HAC_Nigeria_chapter.pdf.
———. 2015b. The Investment Case for Education and Equity. New York: UNICEF.
UNOCHA (United Nations Office for the Coordination of Humanitarian Affairs). 2015. “Syria Crisis: Regional Overview.” http://www.unocha.org/syrian-arab-republic/syria-country-profile/about-crisis.
Utz, R. 2010. Will Countries That Receive Insufficient Aid Please Stand Up? CFP Working Paper 7. Washington: World Bank.
van der Gaag, J., and P. Abetti. 2011. Using National Education Accounts to Help Address the Global Learning Crisis. Global Economy and Development Policy Paper 2011-03. Washington: Brookings Institution Press.
van Fleet, J. 2011. A Global Education Challenge. Washington: Brookings Institution.
van Fleet, J., et al. 2012. Africa Learning Barometer. Washington: Brookings Institution.
van Fleet, J., and G. Zinny. 2012. Corporate Social Investments in Education in Latin Ameri-can & the Caribbean: Mapping the Magnitude of Multilatinas’ Private Dollars for Public Good. Center for Universal Education Working Paper 5. Washington: Brookings Insti-tution. http://www.brookings.edu/~/media/research/files/papers/2012/8/investment-latin-america-van-fleet/08-investment-latin-america-van-fleet.pdf.
Walz, J., and V. Ramachandran. 2011. Brave New World: A Literature Review of Emerging Donors and the Changing Nature of Foreign Assistance. Working Paper 273. Washing-ton: Center for Global Develoment.
Watkins, K., and W. Alemayehu. 2012. Financing for a Fairer, More Prosperous Kenya: A Re-view of Public Spending Challenges and Options for Selected Arid and Semi-Arid Coun-ties. Center for Universal Education Working Paper 6. Washington: Brookings Institution.
Watkins, K. and M. Quattri. 2014. Lost in Intermediation: How Excessive Charges Under-mine the Benefits of Remittances for Africa. London: Overseas Development Institute.
Welham, B., et al. 2013. Linking PFM Dimensions to Development Priorities. London: Over-seas Development Institute.
FinAnCing eduCAtion: opportunities For globAl ACtion
114
World Bank. 2004. World Development Report 2004: Making Services Work for Poor Peo-ple. Washington: World Bank.
———. 2014. Tanzania Big Results Now in Education Program: Technical Assessment for Program for Results Financing, March 2014. Washington: World Bank.
———. 2015a. Program for Results: Two-Year Review, Operations Policy and Country Ser-vices, March 2017. Washington: World Bank.
———. 2015b. World Bank Group Country Opinion Survey Program. FY 2012-14 Review. Washington: World Bank.
World Bank and IMF. 2015. From Billions to Trillions: Transforming Development Financing. Post 2015 Financing for Development: Mulltilateral Finance. Report prepared for the April 2015 Development Committee meeting.
FinAnCing eduCAtion: opportunities For globAl ACtion
115
endnotesThis definition differs from the one used in the OECD-DAC CRS database, which defines 1. basic education as pre-primary and primary education (aid flows to pre-primary educa-tion are fairly limited, however, and are often counted as part of primary education).
Costs are consistent with estimates by the UNESCO GMR, which present average 2. costs over the 2015–30 period.
Support for system strengthening is recorded in the OECD-DAC CRS as aid to “educa-3. tion level unspecified”. To account for the value of this support to different levels of edu-cation, we add 50 percent of all education level unspecified to primary education aid, 25 percent to secondary and 25 percent to tertiary education. The share of multilateral donors in sector allocable primary education aid declined from 45 to 23 percent.
In addition, little is known about other forms of social investment beyond charitable giv-4. ing, such as through social investment, research and development, or the development of products to improve efficiency in education.
Fragility was calculated using the OECD-DAC list of fragile states, which combines the 5. World Bank list and the Fragile States Index.
Some countries already spend more as a share in total expenditure in which case we 6. assume they will keep this higher spending
Due to data limitations, projections are based on 111 countries of the original 145 placed 7. in the groupings. Quite a few of the missing observations (24) are in group 5 (UMICs) and 6 (SIDs) and are missing cost, current spending, revenue or child populations data.
Given the current economic and development climate in OECD DAC countries this 8. assumption may seem unrealistic particularly for countries that have seen significant inflows of aid over the past decade due to geopolitical reasons, such as Afghanistan. However, financing from emerging non-DAC donors could potentially fill the shortfalls in OECD DAC aid.
This is referred to as “adaptive programming”: a flexible, exploratory approach to over-9. coming bureaucratic and political constraints, enabling their local partners to discover ways around them. This recognizes that the pathways to development are too uncertain to be able to work with a preconceived plan of experts.
See https://en.unesco.org/world-education-forum-2015/incheon-declaration.10.
Ibid.11.
This section reports on public spending on education in developing countries. To the 12. extent that ODA for education is channeled through government accounts, this is in-cluded from these figures.
FinAnCing eduCAtion: opportunities For globAl ACtion
116
Domestic public spending on education as a share of GDP for primary and total educa-13. tion are calculated for countries with comparable data over time. Base year figures are most recent data from 2000-02 while most recent figures are latest available from 2010 to 2012.
World Bank, WDI, giving health expenditures as a percentage of government expenditures.14.
While the country spending data are limited, at the global level, primary school popula-15. tions increased by 7 percent for LICs and LMICs, and declined by 29 percent among UMICs, from 2002 to 2012. The population of adolescents of lower secondary-age increased by 4 percent in LICs and by 4 percent in LMICs, and declined by 35 percent in UMICs from 2002 to 2012.
http://vote.myworld2015.org/16.
Annual survey with World Bank Group clients including 111 countries and 22,000 re-17. spondents over a three year period (FY2012-FY2014) across a range of sectors (gov-ernments, NGOs, private sector, academia, media etc…)
It is worth noting that beyond education spending aims, governments face decisions 18. about the allocation of expenditures across other major social and economic sectors. A recent study highlights how the silo approach adopted in the construction of sector spending targets has led to unrealistic expenditure aims. An overview of six key targets (social protection, health, education, water and sanitation, agriculture and infrastruc-ture) in five low-income Sub-Saharan countries reveals that meeting the aims simulta-neously would require from 98 percent of current government expenditures in Kenya to 120 percent in Ethiopia and Uganda, underlining the infeasibility of the combined expenditure shares (Hagen-Zanker and McCord 2011).
According to widely recognized research, social rates of return decrease with the level 19. of education. A public dollar invested in lower levels will generate greater returns than one invested in higher levels of education. Private returns follow a different pattern. They are higher at primary and higher education level but lower at secondary level (Psacharopoulos and Patrinos 2004; Psacharopoulos 2014). Benefit/cost ratios of hu-man development effects by level of education suggest the highest benefits in terms of impact on poverty, health and empowerment variables occur at lower levels of education (Majgaard and Mingat 2012; UNICEF 2015b). However, it should be noted that some evidence exists that points to exceptions to this rule, owing to institutional differences across countries and regions. For example, in some countries that have witnessed sus-tained periods of rapid industrialization, returns to higher levels of education are greater than that of lower levels (Carnoy 2006; Ryoo, Nam and Carnoy 1993).
Following the study, the government reformed its funding formula to make it more needs 20. based.
FinAnCing eduCAtion: opportunities For globAl ACtion
117
The EDI is a composite index that summarizes education data over a number of in-21. dicators. The infrastructure EDI is a subindex that includes the following indicators: availability of safe water, availability of electricity, availability of at least 1 toilet per 100 students; average room condition of the school; and room size per student. The index is calculated using a principal component analysis.
With 1 being the score of a hypothetical upazila with maximum values on all indicators.22.
The estimate is based on the average of 46 LICs and LMICs included in a model used to 23. estimate the financing gap, including estimates for providing good-quality education.
These include Conn (2014); Glewwe et al. (2014); Kremer, Brannen, and Glennerster 24. (2013); Krishnaratne, White, and Carpenter (2013); McEwan (2014); and Murnane and Ganimian (2014). Between them, they review more than 300 studies across the devel-oping world.
These include pedagogical interventions (e.g., computer-assisted learning) that are 25. tailored to students’ needs; repeated teacher training interventions and improving ac-countability (Evans and Popova 2015).
See recent works on complexity systems by Ben Ramalingam (2013), Owen Barder 26. (2012) and Matt Andrews et al. (2012).
See http://www.rise.ox.ac.uk/ and http://saber.worldbank.org/.27.
Reviews of the large body of evidence on the impact of foreign aid have been collected 28. by the UNU WIDER initiative RECOM (Research and Communication on Foreign Aid).
This report utilizes the UNESCO GMR definition of total education, which includes 20 29. percent of general budget support. However, it should be that that this is highly opti-mistic, given that most countries spend much less than 20 percent of their budget on education.
The Syria conflict has had an impact on millions of children. Since 2011, school atten-30. dance in Syria has fallen by more than 50 percent and about 25 percent of schools have been damaged or destroyed.
By including a share of GBS and level unspecified (see methodology)31.
CPA, which has been calculated since 2007, excludes gross ODA flows that are (1) in-32. herently unpredictable, including humanitarian aid and debt relief; (2) do not encompass cross-border flows, including administrative costs, imputed student costs, promotion of awareness and costs related to research and refugees in donor countries; and (3) are not part of cooperation agreements between governments, including food aid, aid from local governments, core funding to NGOs, ODA equity investments, aid through sec-ondary agencies and aid that is not allocated by country or region. Source: http://www.oecd.org/development/aid-architecture/cpa.htm.
FinAnCing eduCAtion: opportunities For globAl ACtion
118
CPA is only available for the total education sector. 33.
See https://www.devex.com/news/a-humanitarian-fund-to-finance-emergency-education-85992.34.
Arab donors may be underrepresented by DAC statistics, as only specific government 35. branches are reporting. For instance, the UAE figures only increases aid from the Abu Dhabi Fund for Development and does not account for aid from other government divi-sions (Smith et. al 2011).
These primarily include Kuwait, Saudi Arabia, Qatar and the UAE–but also Oman and Iraq.36.
Due to the lack of transparency and consistent definitions, estimations of concessional 37. finance vary. For example, in the 2009 CRS Report to Congress, the scale of China’s financial aid was predicted to be much larger than the OECD data. The report (page 6) predicted that China’s aid activities in 2007 would reach $25 billion; see http://fas.org/sgp/crs/row/R40361.pdf.
Due to the lack of official publication of related data, AidData has developed a new meth-38. odology for tracking underreported financial flows by sharing, synthesizing and stan-dardizing diverse sources of development finance information from journalists, scholars, government officials, business professionals and local community stakeholders.
GPE Secretariat Education Sector Plan review to be released later this year. Plans were 39. developed under the FTI and are a baseline for GPE’s improved monitoring.
Donor coordination is particularly challenged by the fact that bilateral aid allocations are 40. often driven by geopolitical factors. For example, between 2003 and 2012, 22 percent of all ODA to countries on the fragile states list was allocated to Afghanistan and Iraq, concurrent with international military efforts (OECD 2015).
Note that the use of GBS in aid activities has declined slightly during the past decade 41. for all donors, from an average of 6 percent from 2002 to 2004 to 4 percent from 2011 to 2013.
In each case, the share of aid is taken from total country-allocable aid and excludes 42. regional and country unallocated aid.
This is defined as including out-of-school primary-age children and out-of-school lower-43. secondary-age adolescents.
Total basic education aid is taken from the sum of country allocations based on the 44. analysis of different country contexts in chapter 4 (see methodology).
See http://web.worldbank.org/WBSITE/EXTERNAL/TOPICS/EXTEDUCATION/.45.
Information on innovative financing initiatives promoted by donors is limited, but a re-46. view of the World Bank’s innovative financing found that while the Bank accounted for more than 40 percent of global official resources mobilized through innovative proj-ect between 2000 and 2008, the education sector received less than 2 percent, while health received 12 percent (Girishankar 2009).
FinAnCing eduCAtion: opportunities For globAl ACtion
119
See Birdsall and Savedoff (2010).47.
See https://www.devex.com/news/gates-pledges-776m-for-malnutrition-unlocks-uk-48. commitments-86284.
It should be noted that support from nonstate actors can come in other forms, in ad-49. dition to concessional finance, including as social investments, in-kind CSR, research and development, public relations and high-level advocacy.
Note that the problem with lack of good data on nonstate financing is not limited to just 50. the education sector, but to other areas of development as well; see Henon (2014).
A study by the Hudson institute compared OECD figures on private giving in 13 coun-51. tries (as reported by OECD member countries) with other sources and found that the figures reported to the OECD hugely underestimated the actual value of donations to overseas causes (Hudson Institute 2013).
This is broadly defined in the study as all Africa, Asia and the Pacific (excluding Japan 52. and South Korea) and Latin America and the Caribbean.
Interestingly, education features much more strongly in domestic grantmaking and was 53. the top-ranked field by share (at 23 percent) in total foundation giving in 2011.
Corporate giving from 54. Fortune 500 companies is about $0.6 billion. Estimates of foun-dation giving are highly incomplete. Based on a review of a limited number of founda-tions reports, van Fleet (2012) found that major foundations spent at least $135 million on education in 2011. Both company surveys and foundation surveys highly underesti-mate total giving by foundations and corporations.
Sector-allocable ODA disbursements to basic education stood at $2.95 billion in 2012 55. and $2.75 billion in 2013.
For example, the Qatar-based Education Above All Foundation has allocated more than 56. $360 million to primary education in LICs and secured match funding contributions of more than $500 million (EAA Annual Report 2014).
Authors’ calculations based on original data.57.
http://www.theimpactprogramme.org.uk/58.
This was the total amount of assets under management in 2013 in a survey of 125 in-59. vestors, of which 3 percent was devoted to education.
About 70 percent of total impact investments are allocated in developing countries. Ap-60. plying this same percentage to education generates an estimated $1 billion in impact investments in education in developing countries.
These include school fees, school supplies and other spending.61.
FinAnCing eduCAtion: opportunities For globAl ACtion
120
It should be noted that in some countries, household incomes and spending are sig-62. nificantly enhanced by remittances. Total remittances to developing countries are esti-mated to be nearly three times the size of ODA; and in a number of developing coun-tries, remittance flows represent more than 10 percent of GDP, twice the average 4 to 5 percent of GDP spent on education. Remittances are used for household consumption and investment, including in education.
See Steensen (2014). We have adjusted the categorization in two ways: (1) Malawi and 63. Nepal were moved to the nonfragile country list because they were no longer included in the World Bank’s fragile states list in fiscal year 2014 and were below (Malawi) or very close to the cutoff point (Nepal) on the Fragile States Index on which the OECD list is based; and (2) small island developing states with populations of less than 1 million were put in a separate category.
The share of out-of-school children and adolescents used here are based on avail-64. able data at the country level. Due to large gaps in national estimates, these aggre-gate country-level numbers vary significantly from the regional and global estimates of UNESCO’s GMRs. The GMRs estimate that approximately 58 million primary-age children were out of school in 2012.
as well as Egypt and Iraq—MICs who are fragile themselves65.
See http://www.globalpartnership.org/funding.66.
For example, compared to current tax to GDP ratios highlighted in table 4.3, average 67. tax to GDP ratios would need to increase to 13.3 percent in group 1, 20 percent in group 2, 15.6 percent in group 3, 20.5 percent in group 4, 22.7 percent in group 5 and 23.5 percent in group 6, by 2020.
UNESCO GMR (2015). Some countries already spend more as a share in total expen-68. diture in which case we assume they will keep this higher spending
Due to data limitations, projections are based on 111 countries of the original 145 placed 69. in the groupings. Quite a few of the missing observations (24) are in group 5 (UMICs) and 6 (SIDS) and are missing cost, current spending, revenue or child populations data.
Given the current economic and development climate in OECD DAC countries this as-70. sumption may seem unrealistic. However, financing from emerging non-DAC donors could potentially fill the shortfalls in OECD DAC aid.
This is referred to as “adaptive programming”: a flexible, exploratory approach to over-71. coming bureaucratic and political constraints, instead letting their local partners dis-cover ways around them. This recognizes that the pathways to development are too uncertain to be able to work with a preconceived plan of experts.
See http://blogs.worldbank.org/futuredevelopment/surprising-results-fragile-states.72.
FinAnCing eduCAtion: opportunities For globAl ACtion
121
In Pakistan, for example, spending on defense is 2.4 percent of GDP, compared with 2 73. percent of GDP spent on education (Malik and Rose 2015).
Note that education has not had a dedicated World Development Report!74.
The independent commission could build on the UNESCO report Rethinking Education 75. (UNESCO 2013b), which aimed to provide a broad vision of education in the 21st cen-tury, building on the Delors report. The proposed commission would harness indepen-dent technical evidence on the investments required to achieve the ambition proposed in the SDGs.
See http://www.brookings.edu/research/opinions/2014/06/23-global-partnership-76. education-winthrop-steer.
One of the key lessons from the health sector is that global funds can make a difference 77. to in-country activity by driving efficiency in the generation and delivery of needed inputs. The clearest example is what has happened with vaccine supply and delivery. Educa-tion is less susceptible to global standardization, but some key public goods are missing, which if generated and supplied would enable big gains to be made. A clear aim of this partnership approach would be, for example, to get education sector inputs into develop-ing countries cheaply and efficiently based on the experiences of the health sector.
http://www.myschool.edu.au/78.
http://blogs.worldbank.org/governance/financing-development-world-banks-role-79. supporting-tax-and-revenue-mobilization-reforms-critical
Worldwide, energy subsidies are currently estimated at $300 billion (World Bank & IMF 80. 2015).
This was the case of Guyana, Mauritania, Uzbekistan, Vietnam, Kazakhstan, and Peru. 81.
Data is available here: http://www.latameconomy.org/en/revenue-statistics/compare-82. your-country/.
The following years are excluded as outliers: Angola (2004); Congo, Dem Rep. (2003, 83. 2011); Cote d’Ivoire (2002, 2012); Egypt (2013); Ghana (2004); Guinea (2012); Liberia (2011); Libya (2011); Malaysia (2013); Mexico (2011); Montenegro (2002); Mozambique (2002); Nicaragua (2004); Senegal (2004); Serbia (2002); Togo (2011); Yemen (2013); Zimbabwe (2012).
In the absence of available data for 2002-2004, 2005 total ODA values are used in the 84. cases of Belarus, Libya, and Ukraine.
Since Venezuela is missing an estimated % change value in the year 2020, 2019’s pre-85. dicted value was used in its place.

1775 Massachusetts Ave., nWWashington, d.C. 20036202.797.6000www.brookings.edu/universal-education
The views expressed in this working paper do not necessarily reflect the official position of Brookings, its board or theadvisory council members.
© 2015 The Brookings Institution
ISSN: 1939-9383