financing class size reduction - eric · an orderly class size reduction start, beginning with...
TRANSCRIPT

Financing Class Size Reduction
First Printing, 2005
Produced throughThe Regional Educational Laboratory,The SERVE Center at the University of North Carolina at
Greensboro
Written for the SERVE Center at UNCG byC. M. Achilles
Content Editing by Art Hood
Editorial, Design, and Production Support Provided by The SERVE Center at UNCG Publications UnitDonna B. Nalley, Director of Publications Karen DeMeester, Senior Program Specialist Tracy Hamilton, Art Director
The content of this publication does not
necessarily reflect the views or policies of the Institute of Education Sciences, U.S. Department of Education, nor does mention of trade
names, commercial products, or organizations imply
endorsement by the U.S. Government.
This document was produced with funding from the Institute of Education
Sciences, U.S. Department of Education, under contract
no. ED-01-CO-0015.
SERVE is an education organization with the mission to promote and support the continuous improvement of educational opportunities for all learners in the Southeast. To further this mission, SERVE engages in research and devel-opment that address education issues of critical importance to educators in the region and provides technical assistance to SEAs and LEAs that are striv-ing for comprehensive school improvement. This critical research-to-practice linkage is supported by an experienced staff strategically located throughout the region. This staff is highly skilled in providing needs assessment services, conducting applied research in schools, and developing processes, products, and programs that inform educators and increase student achievement.
Associated with the School of Education, University of North
Carolina at Greensboro

Contents Author’s Note ........ 4
Chapter I—Background Information ........ 6
Chapter II—Examples of Class Size Reduction Funding ........ 13
Chapter III—Benefits of Class Size Reduction ........ 17
Conclusion ........ 20
References and Bibliography of Selected Sources ........ 21
Appendix ........ 27

4 Author’s NoteC. M. Achilles, Ed.D., is a professor of education administra-tion (Ed.Ad.) part-time at Seton Hall University (SHU) and Eastern Michigan University (EMU). He has taught education administration since 1967 at the University of Tennessee-Knoxville, the University of North Carolina-Greensboro, and part-time at Nova Southeastern University. 1
Class size reduction has been shown to, among other things, improve aca-demic achievement for all students and particularly for low-income and minority students. With the No Child Left Behind Act’s heavy emphasis on scientifically based research, adequate yearly progress, and disag-gregated results, one wonders why all children aren’t enrolled in small classes. Unfortunately, concerns about class size reduction’s expense and misunderstandings about the research discourage class size reduc-tion implementation. This document addresses these concerns by pro-viding an overview of class size reduction financing that includes:
◆ Definitions of class size reduction terminology with implications for class size research;
◆ Guidelines for financing class size reduction implementation;◆ Case studies of successful class size reduction implementations
at little or no extra expenditure;◆ A summary of class size reduction cost-benefit considerations;
and◆ A comprehensive bibliography.
The minimum base for informed decisions about class size costs and their computations is clarity that starts with careful definition of important terms and their consistent use throughout the discussion. For example, the terms class size and pupil-teacher ratio (PTR) are not the same. Thus, projections of class size costs that are based on PTR computations or estimates used as a proxy for class size data are not appropriate information about class size costs. Estimates of costs based on PTR data provide very high figures and shroud the actual costs of small classes that are addressed later.2 For clarity, terms used in this document are defined here:

5
Average Class Size—Derived from school-level data. Average class size is calculated by dividing the number of students in a school by the number of regular classroom teachers only.
Class Size—“The number of students for whom a teacher is primarily responsible during a school year” (Lewit & Baker, 1997, p. 113). Class size is an addition problem, solved by counting the number of students in a class or on the class roll.
Class Size Reduction—Includes efforts to achieve class sizes smaller than at present, such as from 25 to 18 pupils. Accurate pre and post data are needed for comparison and analyses of the class size reduction processes and outcomes.
Pupil-Teacher Ratio (PTR)—“The number of students in a school or district compared to the number of teaching professionals” (McRobbie et al., 1998, p. 4). In some venues, all educators are part of the compu-tation, including counselors, administrators, etc. Determining PTR is a division problem. In a room with 30 students and one teacher, the class size is 30, and the PTR is 30:1. If a second teacher is added, the PTR becomes 30:2 or 15:1, but the class size is still 30. In computing PTR, the divisor is very important.
Small classes or appropriate-sized classes refer to classes of about 14–18 in K, 15–18 in grades 1–3 or 1–4.
Discussions of cost issues often generate resistance to small classes. But dire predictions of high costs for small classes are often:
◆ Based on economic “models” and estimates rather than costs actually encountered in successful class size reduction efforts;
◆ Built on PTR equations and not actual class size data; and◆ Estimated for varying grade levels (e.g., grades 9–12) rather
than for the early primary grades, where most class size research has been done.
These theoretic predictions are not based on actual cases of small class use in primary grades where the research is most consistent and preva-lent. Determining actual small class costs is difficult because calcula-tions must be done on a school-to-school basis, rather than drawing data from large databases, a condition that produces PTR and not class size information. The finance case studies provided later in this docu-ment provide actual data and examples of class size implementations.

6 Chapter I—Background InformationLongitudinal research has shown that small classes begun early in the students’ education, for example in pre-school and PK or K (early inter-vention), and continued for at least three and preferably four years (sufficient duration), have continuing, demonstrable, increasing posi-tive benefits. This statement derives from two acclaimed education experiments. Those experiments are the Perry Pre-School study of 123 impoverished Michigan youth (Barnett, 1995) and the Tennessee STAR experiment with 11,601 students, which demonstrated the value of small classes (about n=15 students) over regular classes (about n=24 students or 24 students and a full-time teacher assistant) in grades K–3 (Word et al., 1990; Finn & Achilles, 1990, 1999; Gerber, et al., 2001).
Positive results of both experiments [and of the North Carolina Abece-darian early intervention study (Campbell & Ramey, 1995)] continued long after the treatment ceased. Researchers following STAR students’ progress found lasting and increasing cognitive benefits (test scores) as the students moved through the grades (Biddle & Berliner, 2002; Finn & Achilles, 1999; Finn et al., 2001; Finn, 2002; Nye et al., 1999). Benefits were evident in the rates of students taking college entrance examina-tions such as the Scholastic Aptitude Test (SAT) and the American Col-lege Testing Program (ACT), implying that students planned to attend college (Krueger & Whitmore, 2000).
An orderly class size reduction start, beginning with kindergarten and adding one grade per year through third or fourth grade, provides plan-ning time for careful class size reduction implementation. Meantime, central administration planning for system-wide small classes can be based on research and theory “checkpoints” of potential savings from small classes.
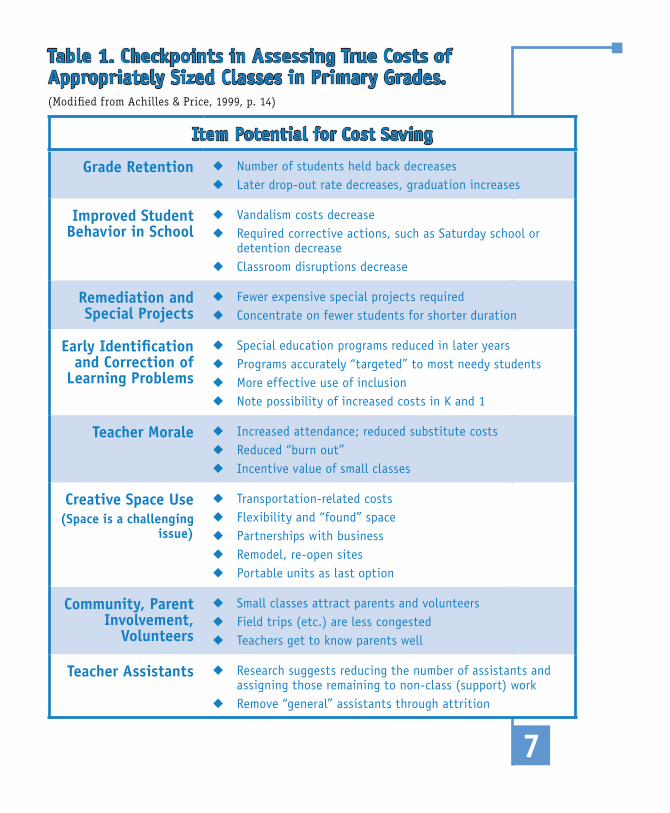
7
Table 1. Checkpoints in Assessing True Costs of Appropriately Sized Classes in Primary Grades.(Modified from Achilles & Price, 1999, p. 14)
Item Potential for Cost Saving
Grade Retention ◆ Number of students held back decreases◆ Later drop-out rate decreases, graduation increases
Improved Student Behavior in School
◆ Vandalism costs decrease◆ Required corrective actions, such as Saturday school or
detention decrease◆ Classroom disruptions decrease
Remediation and Special Projects
◆ Fewer expensive special projects required◆ Concentrate on fewer students for shorter duration
Early Identification and Correction of
Learning Problems
◆ Special education programs reduced in later years◆ Programs accurately “targeted” to most needy students◆ More effective use of inclusion◆ Note possibility of increased costs in K and 1
Teacher Morale ◆ Increased attendance; reduced substitute costs◆ Reduced “burn out”◆ Incentive value of small classes
Creative Space Use(Space is a challenging
issue)
◆ Transportation-related costs◆ Flexibility and “found” space◆ Partnerships with business◆ Remodel, re-open sites◆ Portable units as last option
Community, Parent Involvement,
Volunteers
◆ Small classes attract parents and volunteers◆ Field trips (etc.) are less congested◆ Teachers get to know parents well
Teacher Assistants ◆ Research suggests reducing the number of assistants and assigning those remaining to non-class (support) work
◆ Remove “general” assistants through attrition

8Findings from STAR longitudinal analyses (e.g., Finn et al., 2001) and from other research (e.g., Newmann et al., 2001) have also confirmed that intensity is important. Students in small classes benefit from coher-ent, stable, planned instruction with a competent teacher. Instructional time is not interrupted by confusing fragmentation caused by student comings and goings for endless “projects” (Achilles & Finn, 2002a, b; Achilles et al., 1995). These foundational findings (early intervention, duration, and intensity) provide a framework for small classes as a cor-nerstone for education improvement.
Sharp (2002) found that in elementary grades in United States schools (and in the schools of one Canadian Province) the difference between actual class size (counting students in a teacher’s classroom) and PTR (the number of students at a site divided by some combination of edu-cators and/or adults serving those students) was approximately 10 stu-dents in 1997 and nine students by 2001, after federal class size legis-lation. The difference between class size and PTR was larger in urban districts, confirming Boozer and Rouse’s (1995) finding that minority and low-achieving students were more likely than other students to be in schools with favorable PTRs but large classes, a condition occasioned by many “projects.”
Achilles and Sharp (1998) and Sharp (2002) demonstrated that know-ing and analyzing the differences between actual class size and PTR is key to class size reduction success. For example, if an elementary build-ing (grades K–5) has a PTR of 15:1, but the average class size in a regu-lar teacher’s room is 27 students, there may be personnel flexibility to achieve class sizes of 14–18 in grades K–1 for the first year of class size reduction with minimum—or no—extra costs above available funding if the process followed the class size research findings (Sharp, 2002). As the benefits of class size reduction become evident, additional options for personnel reallocations occur.
Class size reduction planning may include analyzing costs, estimating benefits and savings, identifying funding options (e.g., grants, federal sources, local sources, resource reallocation, and corporate giving), and finding space solutions. Typically, schools and districts rely on some combination of local, state, and federal funds to pay for class size reduc-tion. Categorical program dollars—special education, Title I, programs for students with limited-English proficiency, etc.—comprise the bulk of funds typically reallocated (Odden and Archibald, 2001). Shelden Ether-idge, Director of Federal Programs for Berkeley County (South Carolina)
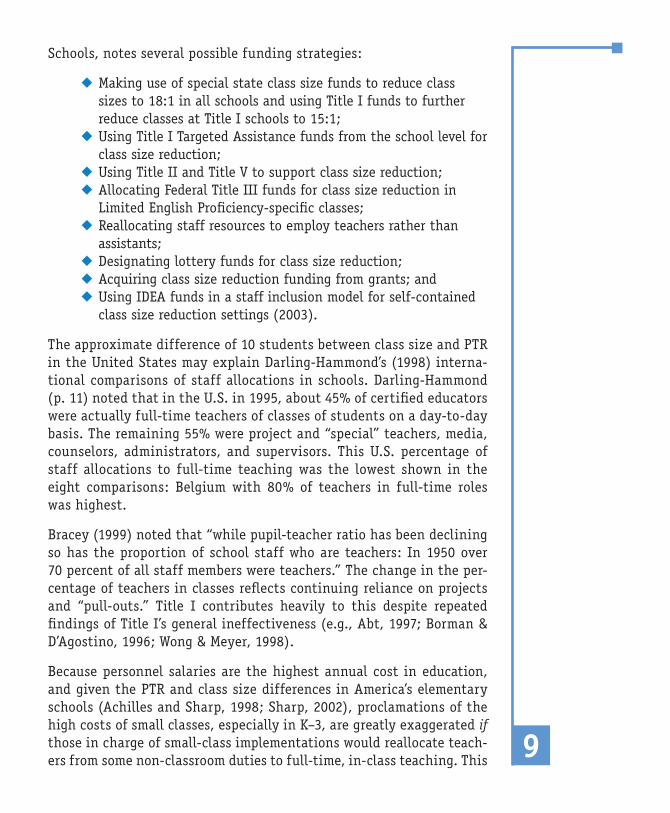
9
Schools, notes several possible funding strategies:
◆ Making use of special state class size funds to reduce class sizes to 18:1 in all schools and using Title I funds to further reduce classes at Title I schools to 15:1;
◆ Using Title I Targeted Assistance funds from the school level for class size reduction;
◆ Using Title II and Title V to support class size reduction; ◆ Allocating Federal Title III funds for class size reduction in
Limited English Proficiency-specific classes;◆ Reallocating staff resources to employ teachers rather than
assistants;◆ Designating lottery funds for class size reduction; ◆ Acquiring class size reduction funding from grants; and◆ Using IDEA funds in a staff inclusion model for self-contained
class size reduction settings (2003).
The approximate difference of 10 students between class size and PTR in the United States may explain Darling-Hammond’s (1998) interna-tional comparisons of staff allocations in schools. Darling-Hammond (p. 11) noted that in the U.S. in 1995, about 45% of certified educators were actually full-time teachers of classes of students on a day-to-day basis. The remaining 55% were project and “special” teachers, media, counselors, administrators, and supervisors. This U.S. percentage of staff allocations to full-time teaching was the lowest shown in the eight comparisons: Belgium with 80% of teachers in full-time roles was highest.
Bracey (1999) noted that “while pupil-teacher ratio has been declining so has the proportion of school staff who are teachers: In 1950 over 70 percent of all staff members were teachers.” The change in the per-centage of teachers in classes reflects continuing reliance on projects and “pull-outs.” Title I contributes heavily to this despite repeated findings of Title I’s general ineffectiveness (e.g., Abt, 1997; Borman & D’Agostino, 1996; Wong & Meyer, 1998).
Because personnel salaries are the highest annual cost in education, and given the PTR and class size differences in America’s elementary schools (Achilles and Sharp, 1998; Sharp, 2002), proclamations of the high costs of small classes, especially in K–3, are greatly exaggerated if those in charge of small-class implementations would reallocate teach-ers from some non-classroom duties to full-time, in-class teaching. This

10approach requires careful analysis because some “special” teachers are required in legislation, such as for special education.
Findings from STAR and other studies (e.g., Word, et al, 1990; Gerber, et al., 2001) also call into question the widespread use of teacher assistants beyond those required by legislation (the STAR study found that teacher assistants in classrooms had no consistent positive effect on student achievement). A RAND study (Grissmer, et al., 2000) concluded, “This estimate is nearly five times more expensive than class size reductions, so it is doubtful any set of changed assumptions could make assistants nearly as effective as class size reductions” (p. 254). Other researchers (e.g., Egelson et al., 2002) have reached similar conclusions. Analyses of class size reduction outcomes such as in Burke County, North Carolina, have shown that redirecting funds saved by phasing out some teacher assistants and using the money for class size reduction provide substan-tial student benefits.
Although costs for added personnel are the usual focus in class size dis-cussions, Witte (1999, p. 9) reported that the California class size reduc-tion study (1999) “found that space problems were listed as the number one problem by principals.…” Schools sometimes have extra space, but usually superintendents and principals must be creative in meeting the need for more classroom space.
Burke County (N.C.) Schools, for example, solved this problem in several ways. The district took advantage of a system-wide grade configuration change just prior to the implementation of the class size reduction pro-gram that made previous sixth-grade classrooms in elementary schools available for primary classroom space. Mobile units were also added in elementary schools where space was limited. Because parents support the reduced class size program, using mobile units for additional class-room space has not been an issue. In some cases, Burke County also remodeled and reopened older schools that previously had been closed (Egelson et al., 2002).
When Wisconsin’s Kenosha Public School District implemented a class size reduction program, some schools converted their art, music, or mul-tipurpose rooms to regular classrooms (Odden & Archibald, 2001). Other space solutions might include multiple-use possibilities or remote in-neighborhood sites connected by technology to the school of record and “found” space, such as the Downtown School in Winston-Salem, N.C.
11
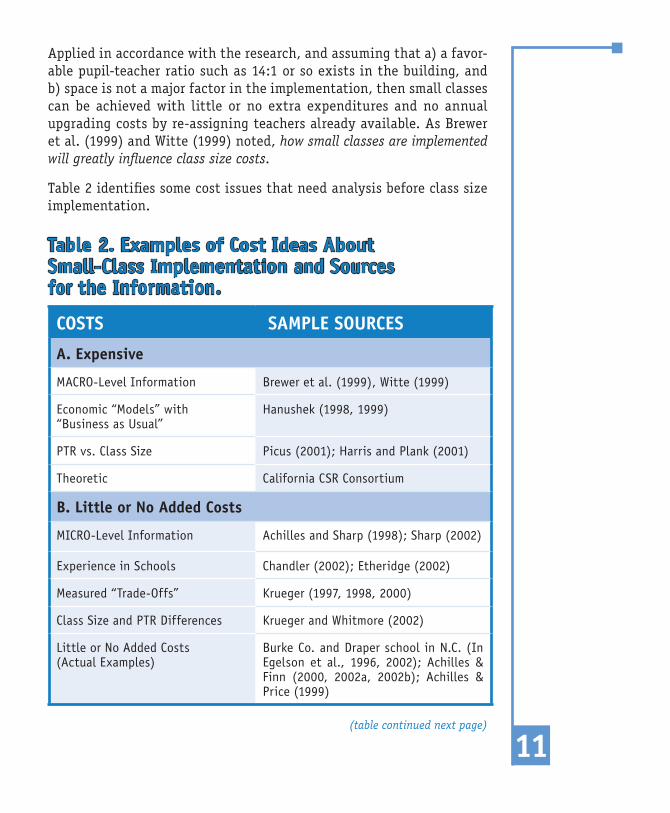
Applied in accordance with the research, and assuming that a) a favor-able pupil-teacher ratio such as 14:1 or so exists in the building, and b) space is not a major factor in the implementation, then small classes can be achieved with little or no extra expenditures and no annual upgrading costs by re-assigning teachers already available. As Brewer et al. (1999) and Witte (1999) noted, how small classes are implemented will greatly influence class size costs.
Table 2 identifies some cost issues that need analysis before class size implementation.
Table 2. Examples of Cost Ideas About Small-Class Implementation and Sources for the Information.
COSTS SAMPLE SOURCES
A. Expensive
MACRO-Level Information Brewer et al. (1999), Witte (1999)
Economic “Models” with “Business as Usual”
Hanushek (1998, 1999)
PTR vs. Class Size Picus (2001); Harris and Plank (2001)
Theoretic California CSR Consortium
B. Little or No Added Costs
MICRO-Level Information Achilles and Sharp (1998); Sharp (2002)
Experience in Schools Chandler (2002); Etheridge (2002)
Measured “Trade-Offs” Krueger (1997, 1998, 2000)
Class Size and PTR Differences Krueger and Whitmore (2002)
Little or No Added Costs (Actual Examples)
Burke Co. and Draper school in N.C. (In Egelson et al., 1996, 2002); Achilles & Finn (2000, 2002a, 2002b); Achilles & Price (1999)
(table continued next page)
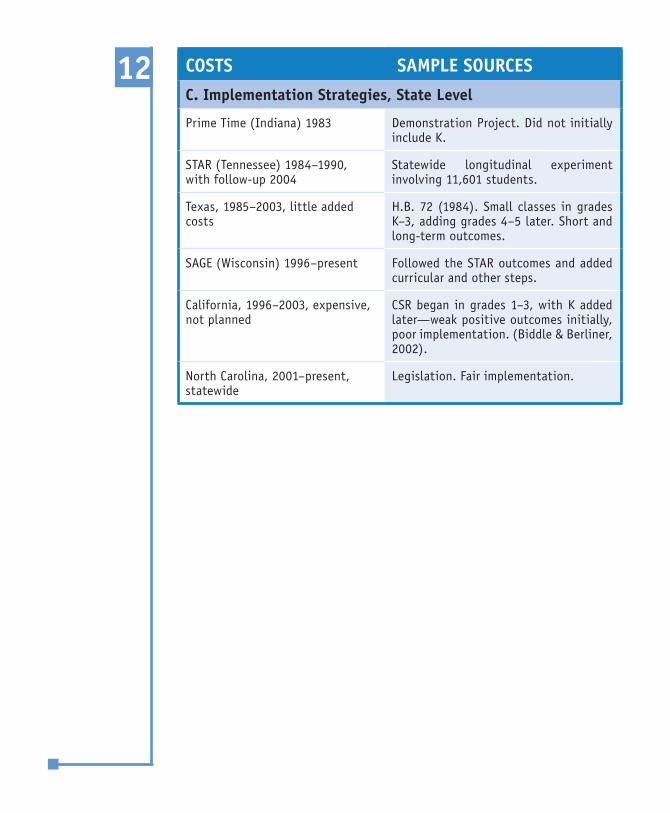
12 COSTS SAMPLE SOURCESC. Implementation Strategies, State Level
Prime Time (Indiana) 1983 Demonstration Project. Did not initially include K.
STAR (Tennessee) 1984–1990, with follow-up 2004
Statewide longitudinal experiment involving 11,601 students.
Texas, 1985–2003, little added costs
H.B. 72 (1984). Small classes in grades K–3, adding grades 4–5 later. Short and long-term outcomes.
SAGE (Wisconsin) 1996–present Followed the STAR outcomes and added curricular and other steps.
California, 1996–2003, expensive, not planned
CSR began in grades 1–3, with K added later—weak positive outcomes initially, poor implementation. (Biddle & Berliner, 2002).
North Carolina, 2001–present, statewide
Legislation. Fair implementation.

13
Chapter II— Examples of Class Size Reduction FundingAre smaller classes expensive? Do they require large numbers of new teachers (a major source of cost increases)? The answer: “It depends.”
Single-site studies of class size implementations have shown that small classes (15–18 students) in early grades can be achieved at little or no extra cost by staffing reallocations and changes in school organiza-tion. In every case, student outcomes improved; school and class size support grew—as shown by such things as increases in enrollment and parent/volunteer involvement.
One way to consider issues and costs of small classes in early schooling is to understand how successful districts and schools implement small classes. This section provides real-life examples from several states of small classes achieved at minimum or no extra cost.
Funding a district-wide CSR program since 1990Beginning in 1990, a North Carolina district (n=15,000 pupils) achieved class sizes of about 14–16 students incrementally, K–4, by careful planning, reductions in remediation projects as small-class outcomes allowed, by extending inclusion, and by reallocating funds through attrition of teacher assistants. After initial cost outlays for renova-tion, the small classes operate each year within normal state per-pupil expenditures. Achievement in this previously low-achieving district ranks among the highest in the state. The K–4 benefits extend into upper grades as shown by rising test outcomes and declining dropouts as cohorts of students who began school in small classes go through high school (Burke County, North Carolina. Test Results, 2002–2004; Egelson et al., 2002; Achilles, Harman & Egelson, 1995).
14 Feasibility planning for a district-wide CSR programWithin a large national study, Sharp (2002) analyzed one suburban Michigan district’s resources to determine if the district could imple-ment small classes in K–3 in all four elementary schools after receiving state class size reduction funds to achieve small classes in two high-need schools. Results affirmed that with planning, assessment of cur-rent and desired program outcomes, and reallocating resources, classes of about 15 students in all K–3 settings were attainable. Reallocations took into account the outcomes of small classes as determined by the class size research.
The importance of creative leadershipIn a case study, Odden and Archibald (2001) demonstrated that small classes could be funded by analyses of current resources, potentials for added revenues, planning, and reallocation based on actual and projected conditions. They found that a “medium-sized school district in Wisconsin was able to reallocate resources to reduce class sizes in K–5 without spending more money or increasing its tax rate” (Abstract. Emphasis added). Key to the district’s success were the leaders who had “full knowledge of the district budget and how that budget was derived” (p. 9) and who used that knowledge creatively.
Funding CSR through a combination of local, state, and federal fundsBerkeley County, South Carolina, originally obtained first-grade small classes (14–16 pupils) in 1998–1999 by combining federal, state and local resources. The first year of implementation required a collabo-ration of funding from Title I, a state class size reduction program, and funds from a state compensatory program. In addition to 93 staff funded from local resources for a 21:1 class size allocation, 41 teachers employed through special state funds reduced class size to a maximum of 18 students each in all 147 first-grade classrooms. Federal funds were used to employ an additional 13 teachers and further reduce first-grade class sizes in all Title I schools to a maximum of 15 students. At the conclusion of the 1998–1999 school year, class sizes in all first-grade classrooms (147) averaged 14.4 students with only two classes exceeding an enrollment of 15 students (Etheridge, 2002).

15
Funding CSR through personnel reallocationsA small district in Michigan achieved class sizes in K–4 of 15 or fewer pupils within the regular budget by re-assignment of personnel, job consolidations, reduction of teacher assistants via attrition, and reducing projects based on small-class benefits. The district funded the effort by using 100% of its At-Risk and Title I dollars and elim-inating teacher assistants and a transitional first-grade program. Achievement, teacher morale, and community support increased (Chandler, 2/02. Personal communication).
A prior SERVE publication featured North Carolina’s Draper Elementary School class size reduction program (Egelson, et al., pp. 23–27). In the multiple-year effort, “Draper’s principal used considerable ingenuity… to reduce class sizes without additional expenses” (p. 23). Personnel reallocations adjusted to instructional and educational needs of stu-dents and teachers primarily accomplished this class size reduction. The principal converted one and a half Title I positions, one Spanish teacher position, and portions of the physical education and music positions into regular classroom teacher positions. To ensure that the students still had physical education and music classes weekly, some classes were doubled up for those sessions. Monitoring showed that from pre-class size reduction, Draper outcomes improved over the years, so “students are able to meet state standards by the time they begin middle school” (p. 27).
Finally, a medium-sized suburban school system (6,000 students) in Rochester, New York, began planning in 2002 for small classes (approxi-mately 15 students) in grades K–4. The school board approved the plan that was built on reallocation of personnel and other resources, starting with grades K–1 in 2003, and adding grades 2, 3, and 4 in succeeding years. By February 2005, the district was ahead of schedule in imple-menting the plan, with very positive community and professional staff response and initial indicators of positive student outcomes. The district is employing a cohort model, with selected looping options, and the plan is being implemented with no added costs (Graham, J. K., 2005).
Examples in the second and third items above received initial assistance from state-level grants (a class size pilot study grant in Michigan and the SAGE initiative in Wisconsin) for some schools in the systems. The fourth and fifth examples used Title I funds to start. Parent requests encouraged administrators to seek ways to extend class sizes of about
1616 students, K–3, to all schools rather than just schools that received federal or state funds. Although state and federal funds can serve as incentives to initiate class size reduction, continuation relies on lead-ership, reallocations, planning, and flexibility provided by successful class size reduction outcomes.

17
Chapter III—Benefits of Class Size ReductionOne criterion for change in social programs is that benefits should outweigh costs and remain after the “treatment” ends. The Appendix includes Crane’s (1998) criteria for assessing benefits of social programs with STAR facts presented for each criterion. Because class size reduc-tion results last and increase if the student has at least three—and preferably four—years of continuous schooling in the small-class set-ting (K–3), short- and long-term actual costs of small classes require a longitudinal analysis that has not yet been done. Although not a cost-benefit analysis, the present material, organized by benefit head-ing, summarizes some efforts of economists and others who have made cost-benefit estimates linked to class size. Each study uses models that have assumptions and numerous caveats connected with them.
Broad economic benefits Krueger’s (2002) analysis of STAR’s class size experiment “suggest[s] that the internal real rate of return from a seven-student reduction [from 22 students to 15 students] in class size in the first four years of primary school is about 6%. At a 4% discount rate, every dollar invested in small classes yields about $2 in benefits” (p. 34).
After a detailed analysis of schools in the Stockholm area of Sweden and drawing on the STAR longitudinal data for comparisons, Krueger and Lindahl (2002), stated:
Lastly we calculated the costs and benefits of a class size reduction for the U.S., using the results from STAR, and for Sweden, using the results from the Stockholm pupil data. We found that decreasing class sizes can, with reasonable assumptions, indeed, have benefits that are larger than the costs. (pp. 96–97)
Early identification of learning disabilitiesA major potential savings is the early identification of learning prob-lems that usually occurs in small classes. In a small class with no teacher
18assistant, a teacher is more likely to refer for special education testing a difficult-to-teach student. If a problem is identified, early interven-tion in the small-class setting has the potential to reduce the number of students assigned to special classes later, providing cost-savings and requiring fewer special education teachers later. Teachers in reduced size classes also report having better opportunities to implement spe-cial needs students’ individualized learning plans (Achilles, 1999).
Improved high school graduation rates Using a sample of nearly 5,000 students from STAR, Finn, Gerber, and Boyd-Zaharias (2004, p. 4) calculated graduation rates for students by low and high socio-economic status (SES) using free and reduced-price lunch as the SES proxy. Graduation rates for lower SES students improved from 70.2% (no small classes) to 88.2% if students had small classes in grades K–3; graduation rates for higher SES students improved, but less dramatically (83.7% to 87%). Higher graduation rates have implications for incarceration rates and future earnings.
Increased college entrance test-taking rates Using the STAR database, Krueger and Whitmore (2000) noted that being in a small class in grades K–3 influenced whether or not a stu-dent took a college-entrance examination. There was a slight overall, but not significant, difference favoring all small-class students, but the positive difference in test-taking rates for African-American stu-dents who had been in a small class in K–3 was statistically significant (p < .001), reducing the gap between the rates of African-American and white students in taking the ACT or SAT college-entrance tests by 54%. If taking college-entrance exams equates with the person’s actually attending college, then the large gains for minority students can have economic benefit from earnings and reduced need for social services.
Improved student behaviorStudent behavior in school influences costs for discipline referrals and consequences such as detentions, removal from classes, and suspensions. Measures of student behavior provide inferences of cost savings. Success Starts Small (Achilles, et al., 1995) showed a 50% reduction in disci-pline referrals after class size reduction. Small classes in early grades influence student short-term and long-term school behavior positively,

19
increasing both academic and social engagement (Finn, et al., 2003). Using STAR students (n = 2,728) who had participation data in grades 4 and/or 8, Pannozzo, Finn, and Boyd-Zaharias (2004) demonstrated that students in small classes had more positive indicators of partici-pation and engagement, such as lower dropout and higher graduation rates than did students in larger classes.
Closing the racial achievement gapWhile class size reduction is beneficial to all students, low-income and African-American students tend to benefit more than white students (Achilles, Finn, Gerber, & Pannozzo, 2000). STAR results showed that average test scores for African-American students rose by 7-10 percen-tile points while they were in small classes, compared to an increase of 3–4 percentile points for white students. Gains decreased somewhat upon return to regular size classes in fourth grade, but the gap closure persisted. Krueger and Whitmore (2001) estimated that “if all students were in a small class in grades K–3 for one to four years…the black-white test-score gap would fall by 38 percent in grades K–3, and by 15 percent thereafter” (Executive Summary).
No recurring annual costs Once small classes are established, there are minimal extra costs for succeeding years, but other interventions, like some comprehensive whole school reforms, have extra costs each year (e.g., hardware/soft-ware and staff training).
Achilles and Price (1999) listed probable cost savings from appropriate implementation of small classes where “appropriate” meant following the class size research and phasing in small classes, one grade at a time, K–4. Table 1 (page 7), based on successful experiences with small classes to date, summarizes probable school and district savings when class size reduction is done thoughtfully.
Inferences drawn from positive cognitive outcomes for small class interventions and especially for long-term behavioral outcomes such as graduation rates, college-entrance test taking, grade retention, and dropout all support that for early grades (K–3), small classes provide substantial student benefits and economic returns.

20 ConclusionSmall classes have many positive benefits and powerful research and the-ory bases for being successful. This monograph should help policymakers and practitioners to judge and use class size research to improve schools for students and to consider appropriate class sizes in the early years of schooling as a cornerstone of sound education policy.
Small classes may be construed as more costly than larger classes if small classes mean: a) simply adding teachers and doing business as usual, b) no small-class benefits are subtracted from costs, and c) small class initiatives do not follow the research, such as starting in the earliest grades. But class size reduction can often be accomplished at little to no extra cost if the administrators know and correctly use the research and are committed and creative in their funding efforts.
21
References and Bibliography of Selected SourcesABT Associates. (1997, April). Prospects: Final Report on Student Outcomes. Cam-
bridge, MA: Author. Report prepared for U.S. Department of Education on Title I outcomes.
Achilles, C. M. (1999). Let’s put kids first finally: Getting class size right. Thou-sand Oaks, CA: Corwin Press.
Achilles, C. M. (2002). Class size in the early grades. Bloomington, IN: Phi Delta Kappa.
Achilles, C. M., & Finn, J. D. (2000). Should class size be a cornerstone for edu-cational policy? In M. C. Wang & J. D. Finn (Eds.). How small classes help teachers do their best (pp. 299-324). Philadelphia, PA: Temple University Center for Research in Human Development in Education.
Achilles, C. M., & Finn, J. D. (2002a). Constructing “common sense” from class size research, theory, and use. Paper Presented at Mid-South Educational Research Association (MSERA) Conference, Little Rock, AR, November 11, 2001.
Achilles, C. M., & Finn, J. D. (2002b). The varieties of small classes and their outcomes. In J. D. Finn & M. C. Wang (Eds.). Taking small classes one step further. Greenwich, CT: Information Age Publishing.
Achilles, C. M., Finn, J. D., Gerber, S. B., & Pannozzo, G. (2000, October). Small classes do reduce the test-score achievement gap. Paper presented at the Council of Great City Schools Conference, Los Angeles, CA. [ERIC ED 454601].
Achilles, C. M., Harman, P., & Egelson, P. (1995). Using research results on class size to improve pupil achievement outcomes. Research in Schools, 2, 23-30.
Achilles, C. M., Kiser-Kling, K., Aust, A., & Owen, J. (1995, April). A study of reduced class size in primary grades of a fully Chapter 1 eligible school: Success Starts Small (SSS). Paper presented at the American Educational Research Association, San Francisco. [ERIC ED 419-288].
Achilles, C. M., & Price, W. J. (1999). Can your district afford smaller classes in grades K–3? School Business Affairs, 65(1), 10-16.
Achilles, C. M., & Sharp M. A. (1998). Solve your puzzles using class size and pupil teacher ratio (PTR) differences. Catalyst for Change, 5, 5-10.
Barnett, W. S. (1995). Long-term effects of early childhood programs on cogni-tive and school outcomes. The Future of Children, 5(3), 25-50.

22Biddle, B. J., & Berliner, D. C. (2002). Small class size and its effects. Educational
Leadership, 59(5), 12-23.
Boozer, M., & Rouse, C. (1995, May). Intraschool variation in class size: Patterns and implications. (ED 385935). Princeton, NJ: Princeton University, Industrial Relations Section Paper #344. National Bureau of Economic Research, Cam-bridge, MA.
Borman, G. D., & D’Agostino, J. V. (1996). Title I and student achievement: A meta-analysis of federal evaluation results. Educational Evaluation and Policy Analysis, 18(4), 309-326.
Bracey, G. (1999). Education Disinformation Detection and Reporting Agency (EDDRA). www.america-tomorrow.com/bracey
Bracey, G. W., & Stellar, A. (2003). Long-term studies of preschool: Lasting ben-efits far outweigh costs. Phi Delta Kappan, 89(10), 780-783, 797.
Brewer, D., Krop, C., Gill, B. P., & Reichardt, R. (1999). Estimating the cost of national class size reductions under different policy alternatives. Educa-tional Evaluation and Policy Analysis, 21(2), 179-192.
Burke County North Carolina Public Schools. (2002, 2003, 2004). Results of the (annual) testing program. Morganton, NC: Author. Provided on CD.
Campbell, F. A., & Ramey, C. T. (1995). Cognitive and school outcomes for high-risk African-American students at middle adolescence: Positive effects of early intervention. American Educational Research Journal, 32(4), 743-772.
Crane, J. (Ed.). (1998). Social programs that work. New York: Russell Sage Foundation.
Darling-Hammond, L. (1998). Teachers and teaching: Testing policy hypotheses from a national commission report. Educational Researcher, 27(1), 5-15.
Egelson, P., Harman, P., & Achilles, C. M. (1996). Does class size make a difference? Greensboro, NC: SERVE.
Egelson, P., Harman, P., Hood, A., & Achilles, C. M. (2002). How class size makes a difference. Greensboro, NC: SERVE.
Etheridge, S. (2002). Class size reduction: Berkeley County outcomes. Paper Pre-sented at Mid-South Educational Research Association (MSERA) Conference, Chattanooga, TN, November 6-8, 2002.
Etheridge, S. (2003). Class size reduction: Berkeley County outcomes. Brief pre-sented at SERVE Research and Policy Symposium on Class Size Reduction and Beyond, Raleigh, NC, February 25, 2003.
Finn, J. D. (1998, April). Class size and students at risk: What is known? What is next? Washington, DC: U.S. Department of Education.
Finn, J. D. (2002). Small classes in American schools: Research, practice and pol-itics size. Phi Delta Kappan, 83(7), 551-560.
Finn, J., & Achilles, C. M. (1990). Answers and questions about class size: A state-wide experiment. American Educational Research Journal, 27(3), 557-577.

23
Finn, J. D., & Achilles, C. M. (1999). Tennessee’s class size study: Findings, implications, misconceptions. Educational Evaluation and Policy Analysis, 21(2), 97-107.
Finn, J., Gerber, S. B., Achilles, C. M., & Boyd-Zaharias, J. (2001). The enduring effects of small classes. Teachers College Record 103(2), 145-183.
Finn, J., Gerber, S. B., & Boyd-Zaharias, J. (2004, February). Small Classes in the Early Grades, Academic Achievement, and Dropping Out. Paper presented at the American Educational Research Association Conference, San Diego, CA, April 14, 2004.
Finn, J. D., Pannozzo, G. M., & Achilles, C. M. (2003). The “Whys” of class size: Student behavior in small classes. Review of Educational Research, 73(3), 321-368.
Finn, J. D., & Wang, M. C. (2002). Taking small classes one step further. Green-wich, CT: Information Age Publishing.
Gerber, S. B., Finn, J. D., Achilles, C. M., & Boyd-Zaharias, J. (2001). Teacher assistants and students’ academic achievement. Educational Evaluation and Policy Analysis, 23(2), 123-143.
Graham, J. K. (January 2005). Appropriate elementary class size. Rush-Henrietta Central School District: Rochester, NY.
Grissmer, D., Flanagan, A., Kawata, J., & Williamson, S., (2000). Improving student achievement: What state NAEP test scores tell us. Santa Monica, CA: RAND.
Hanushek, E. A. (1998). The evidence on class size. Occasional Paper No. 98-1. Rochester, NY: University of Rochester, W. Allen Wallis Institute of Political Economy.
Hanushek, E. A. (1999). Some findings from an independent investigation of the Tennessee STAR experiment and from other investigations of class size effects. Educational Evaluation and Policy Analysis, 21(2), 143-163.
Harris, D., & Plank, D. N. (2000). Making policy choices: Is class size reduction the best alternative? In S. W. M. Laine & J. G. Ward (Eds.). Using what we know: A review of the research on implementing class size reduction initiatives for state and local policy makers. Oak Brook, IL: North Central Regional Edu-cational Laboratory (NCREL).
Krueger, A. B. (1997, June). Experimental estimates of education production functions. Princeton, NJ: Princeton University, National Bureau of Eco-nomic Research Paper #6051.
Krueger, A. B. (1998, March). Reassessing the view that American schools are broken. FRNBY Economic Policy Review, 29-43.
Krueger, A. B. (1999). An economist’s view of class size research. M.C. Wang & J.D. Finn (Eds.), How small classes help teachers do their best. Washington, D.C.: U.S. Department of Education and Temple University.
Krueger, A. B. (2000). An economist’s view of class size research. CEIC Review, 9(2), 19-20.

24Krueger, A. B. (2002). Economic considerations and class size. [Working Paper
8875]. National Bureau of Economic Research. Cambridge, MA.
Krueger, A. B., & Lindahl, M. (2002, May). The school’s need for resources: A report on the importance of small classes. Stockholm: The Expert Group on Public Finance.
Krueger, A. B., & Whitmore, D. M. (2000, March). The effect of attending a small class in the early grades on college test-taking and middle school test results: Evidence from Project STAR. Princeton, NJ. Princeton University, Industrial Relations Section.
Krueger, A. B., & Whitmore, D. M. (2001, March). Would smaller classes help close the black-white achievement gap? [Working Paper 451]. Princeton, NJ. Princ-eton University, Industrial Relations Section.
Lewit, E. M., & Baker, L. S. (1997, Winter). Class size. The Future of Children: Financing Schools. 7(3), 112-121.
McRobbie, J., Finn, J., & Harman, P. (1998). Class-size reduction: Lessons learned from experience. Policy Brief No. 23. San Francisco, CA: WestEd.
Molnar, A. (1998). Smaller classes, not vouchers, increase student achievement. Harrisburg, PA: Keystone Research Center.
Newmann, F. M., Smith, B., Allensworth, E., & Bryk, A. S. (2001). Instructional program coherence: What it is and why it should guide school improvement policy. Educational Evaluation and Policy Analysis, 23(4), 297-322.
Nye, B. A., Hedges, L. V., & Konstantopoulos, S. (1999). The long-term effects of small classes: A five-year follow-up of the Tennessee class size experiment. Educational Evaluation and Policy Analysis, 21(2), 143-163.
Odden, A., & Archibald, S. (2001). Committing to class size reduction and finding the resources to implement it: A case study of resource allocation. Education Policy Archives, 9(30).
Pannozzo, G. M., Finn, J. D., & Boyd-Zaharias, J. (2004). Paper presented at American Educational Research Association (AERA) Conference, San Diego, CA, April 2004.
Picus, L. (2002). In search of more productive schools: A guide to resource alloca-tion in education. Eugene, OR: ERIC-CEM.
Sharp, M. A. (2002). An analysis of pupil-teacher ratio and class size. Unpub-lished doctoral dissertation, Eastern Michigan University, Ypsilanti, MI.
Slavin, R. E. (2002) Evidence-based education policies: Transforming educational practice and research. Educational Researcher, 3(7), 15-21.
Wang, M. C., & Finn, J. D. (Eds.). (2000). How small classes help teachers do their best. Philadelphia, PA: Temple University Center for Research in Human Development in Education.
Wenglinsky, H. (1997). When money matters. Princeton, NJ: Educational Testing Service, Policy Information Center.

25
Witte, J. F. (1999). Cost benefit issues and implications of reducing class size in public schools. Conference Summary. Oak Brook, IL: North Central Regional Educational Laboratory.
Wong, K. K., & Meyer, S. J. (1998). Title I schoolwide programs: A synthesis of findings from recent evaluations. Education Evaluation and Policy Analysis, 20(2), 115-136.
Word, E., Johnston, J., Bain, H., Fulton, D. B., Boyd-Zaharias, J., Achilles, C. M., Lintz, M. N., Folger, J., & Breda, C. (1990). Project STAR Final Technical Report. Nashville, TN: Tennessee State Department of Education.
Special Issues of Professional Publications◆ Educational Evaluation and Policy Analysis (1999, Summer). Issue on class
size. D. Grissmer, Guest Editor. Washington, D.C.: American Educational Research Association.
◆ Educational Leadership (2002, February). Issue on class size and school size. Alexandria, VA: Association for Supervision and Curriculum Development.
Books (See References) ◆ Achilles (1999)
◆ Finn & Wang (2002)
◆ Wang & Finn (2000)
Monographs (See References) ◆ Achilles, C. M. (2002). Phi Delta Kappa
◆ Egelson, P. Harman, P. Hood, A. & Achilles, C. M. (2002). SERVE (Also 1996)
◆ Finn, J. D. (1998). OERI. Washington, D.C.
◆ Molnar (1998). Keystone Research Center
◆ Wenglinsky, H. (1997). Educational Testing Service
Websites◆ PreSchool Longitudinal Study—www.highscope.org
◆ U.S. Department of Education—www.ed.gov/offices/OESE/ClassSize and http://nces.ed.gov/pubs2000/2000303pdf
◆ Project STAR—www.heros-inc.org and www.reduceclasssizenow.org
◆ Wisconsin’s Project SAGE—www.uwm.edu/Dept/CERAI/sage.html and www.educationanalysis.org
◆ Minnesota—www.mpls.k12.mn.us/Benefits_of_Reduced_Class_Size.html
26 E-mail (Personal Communication)◆ J. Chandler, 2/02, 7/02
Advocacy Group◆ Class Size Matters, a clearinghouse for information on class size data.
www.classsizematters.org
Policy Briefs◆ “Class Size: Counting Students Can Count.” Research Points. American
Educational Research Association. www.aera.net/uploadedFiles/Journals_and_Publications/Research_Points/RP_Fall03.pdf
◆ “Class Size Reduction: Lessons Learned from Experience.” WestEd Policy Brief. www.wested.org/policy/pubs/full_text/pb_ft_csr23.htm
Notes1. C. M. Achilles was one of four principal investigators (PIs) of the Student
Teacher Achievement Ratio (STAR) experiment in Tennessee and PI of other class size studies. He has consulted on class size matters since 1983. He was a PI of several staff development studies, Project SHAL (An Effective Schools initiative in St. Louis), a researcher on the Phi Delta Kappa Commission on Confidence in Public Schools, etc. He is author or co-author of numerous books, chapters, monographs, articles, research reports and ERIC entries. Some material here has been adapted, paraphrased, or used verbatim from earlier papers, such as Achilles and Finn (2000, 2002a; 2002b).
2. These points have been made in other papers and articles. Material here is modified only slightly from Achilles & Finn (2002). The role of school and district leadership in reform: A case of validity as mistaken identity. Paper at AERA, New Orleans, LA 4/2/02. pp. 4–7.

27
AppendixCritique of STAR Results Using Crane’s (1998) Criteria. STAR is a Class Size Reduction (CSR) Experiment, Not a Pupil-Teacher Ratio (PTR) Effort.*
Crane Criteria and Questions STAR’s Facts
1. Do the benefits outweigh the costs? Yes
In the short term (K–3), there were no definitive data. In the “follow-up studies,” yes; in the STAR reanalysis, yes; in alternative implementations, yes. See (Krueger, 1999; Finn & Achilles, 1999; Finn et al., 2001).
2. Does the program have a statistically significant effect on the treatment group? Yes
Yes. This statistically significant difference was found each year, all years, and in many combinations of analyses done by STAR persons and by others (as far away as London).
3. What is the magnitude of the program’s effect? Shown in effect size or ES
Effect-size (ES) results were .17–.40 in the early analyses. Effects were about twice as high for minority children as for Anglo children, grades K–3 (each year, all years). Grade-equivalent analyses show continuing growth even after students leave small classes (see #4). (Finn & Achilles, 1999; Finn et al., 2001).
4. How long do the effects of the program last? At least into high school and beyond
Positive academic and social effects of K–3 small classes are highly visible in H.S. and beyond including in college-entrance tests. (Boyd-Zaharias & Pate-Bain, 2000; Krueger, 1999; Krueger & Whitmore, 2000).
5. What is the relationship of the evaluator to the program? Independent
The STAR evaluator was a contracted independent expert. STAR personnel did secondary analyses. The external expert’s work is (and was) the primary analysis accepted and published. Others have re-analyzed STAR data with similar results.
6. Can the program and its results be replicated? Yes
7. Can the program maintain its effectiveness on a larger scale? Still being assessed—but yes, if well implemented
They have been consistently replicated in well-designed class size analyses. Replications of STAR have been achieved in single districts, and in general policy implementations. Reported gains and ES for well-conducted studies are similar. Evaluations of statewide small-class efforts in CA and the results in Texas (HB 72, 1984) suggest large-scale benefits, but these results are less definitive than STAR or SAGE in Wisconsin, probably because of less controlled implementations.
* Social Programs That Work (1998) edited by J. Crane. Russell Sage Foundation. 324 pages.

The SERVE Center at UNCGP.O. Box 5367
Greensboro, NC 27435