financial s r november 2018 - nbs.sk · portant aspect of its contribution to financial stability...
TRANSCRIPT

Financial
Stability RepoRt
novembeR 2018

Published by:© Národná banka Slovenska 2018
Address:Národná banka SlovenskaImricha Karvaša 1813 25 BratislavaSlovakia
Contact:[email protected]
http://www.nbs.sk
All rights reserved.Reproduction for educational and non-commercial purposes is permitted provided that the source is acknowledged.
ISSN 1338-6352 (online)

3NBS
Financial Stability RepoRtNovemBer 2018
Contents
FOREWORD 4
OVERVIEW 5
1 MACROECONOMIC ENVIRONMENT AND FINANCIAL MARKETS 10
1.1 Slightly worsening outlooks for the global economy and increasing risks 10
Box 1 The withdrawal of the United Kingdom from the European Union is not expected to have a major impact on the financial stability of the Slovak financial sector 15
1.2 Strong growth in the domestic economy 17
2 FINANCIAL SECTOR TRENDS AND RISKS 22
2.1 Increasing household debt 222.2 Business model sustainability
of financial institutions 282.3 Lending to the corporate sector 312.4 Lending to the commercial real estate
(CRE) sector 33
2.5 Liquidity risk in the banking sector has increased 37
2.6 Trends in other financial market segments 39
2.7 Current EU-level issues with macroprudential policy relevance 41
3 FINANCIAL SECTOR RESILIENCE 443.1 Solvency and financial position
of the financial sector 443.1.1 Financial position of the banking
sector 443.1.2 Profitability in other financial market
segments 463.2 Macroprudential policy
responsiveness 49
ABBREVIATIONS 52
LIST OF CHARTS 54
LIST OF TABLES 55

4NBS
Financial Stability RepoRtNovemBer 2018
Foreword
The financial sector is deemed to be stable when it is able to smoothly fulfil its core functions, even amid substantial adverse shocks in the external or domestic economic and financial environ-ment. At the same time, financial sector stability is perceived as a necessary condition for sound functioning of the real economy. Národná ban-ka Slovenska (NBS) contributes to the stability of the whole financial system in Slovakia, in par-ticular through its role as the financial market su-pervisory authority.
Národná banka Slovenska believes that an im-portant aspect of its contribution to financial stability is to keep the public regularly informed about financial sector stability and about any trends which could jeopardise that stability. Awareness and discussion of such issues is es-
sential, particularly since financial stability is af-fected not only by financial sector institutions, but also by the behaviour of non-financial cor-porations and individuals. NBS therefore pub-lishes a biannual Financial Stability Report (FSR), the main purpose of which is to examine, on the one hand, the principal threats to financial sector stability in Slovakia and, on the other hand, the sector’s resilience.
The FSR is intended to provide clear and easy to follow information about the development of factors affecting financial stability in Slovakia, with particular attention paid to the most sig-nificant risks to financial sector stability and re-silience. The FSR also includes a section on the implementation of macroprudential policy in Slovakia.
5NBS
Financial Stability RepoRtNovemBer 2018
overview
the reCent period has seen a slight deterioration in the global maCroeConomiC outlook and a simultaneous inCrease in risks to FinanCial stability After its relatively strong performance in the previous year, global economic growth slowed slightly in 2018. In both industrial production and foreign trade, growth moderated. Further-more, several risks related to economic trends be-came more pronounced and could also have an adverse impact on financial stability. One of the most significant threats facing the global econ-omy is the imposition of protectionist measures and the risk of a full-blown trade war breaking out. The impact of such measures may be further exacerbated if they are accompanied by falling confidence among households and firms and by an increase in financial market nervousness. An ongoing risk is the mounting uncertainty and unease related to Brexit, although an agreement between the UK and the EU is expected to be finalised. An in-depth analysis has shown that the stability of Slovakia’s financial sector is not expected to be significantly affected even by a “hard Brexit” scenario. As for emerging market economies, China in particular, they could face future negative repercussions from their strong debt growth.
the optimism that prevailed aCross most FinanCial markets in 2017 has begun to Fade Several episodes of volatility have appeared during 2018. The corrections concerned mainly prices of emerging market bonds and later also stock markets. The ebbing of investor optimism has also been related to the unwinding of quan-titative easing and the raising of interest rates by several central banks. Investor aversion in the fi-nancial markets has increased with respect to cer-tain countries, most notably Argentina and Turkey (in both of which the domestic currency has sub-sequently depreciated sharply). In Italy, the rein-ing-in of efforts to continue consolidating public debt has been reflected in substantial increases in credit risk premia. These investor concerns have not yet spread to other countries to a significant extent. In the light of past experience, however, such risk cannot be ruled out and it could poten-tially have a considerably negative impact.
the slovak eConomy has aCCelerated in 2018 and is operating above potential Domestic economic growth has continued accelerating in 2018, accompanied by falling unemployment and growth in corporate sales and profits. The unemployment rate is at his-torical lows. Although these trends help reduce non-performing loan (NPL) ratios, the increasing rate of economic overheating is becoming a risk. Pressures are most acute in the labour market, where the degree of overheating is the third highest in the European Union. There is an in-creasing risk that a proportion of the jobs creat-ed on the back of the economy’s expansion may not be sustainable over the long term. Moreover, the optimism stemming from the favourable economic trends could lead to the underestima-tion and excessive build-up of risks that may ma-terialise in the longer term.
total housing loans and aggregate household debt Continue to rise Faster in slovakia than in any other eu Country Despite easing slightly in year-on-year terms, retail credit growth in Slovakia remains higher than that in other EU countries (including central and eastern European countries) and may still be considered excessive. The slowdown was largely attributable to consumer loans, while housing loan growth maintained a pace of 11.5% year on year.
Household debt growth in Slovakia in 2018 has been the highest in the EU. Slovak households’ vulnerability is heightened by the fact that the ratio of their net financial assets to GDP is the lowest in the EU. In Slovakia, moreover, the con-centration of housing loans among lower-in-come households is greater than in the EU as a whole.
The unsustainability of certain current long-term trends in the housing sector is also indicated by international comparison; Slovakia has one of the highest rates of property ownership in the EU. Such a high rate, however, is unsustainable, and in the long term would require a substantial increase in the share of households that have a housing loan. In that hypothetical scenario, the

6NBS
Financial Stability RepoRtNovemBer 2018
O V E R V I E W
household debt-to-GDP ratio could rise above 100%. It is therefore important that other alter-natives, such as the housing rental market, are gradually developed.
Národná banka Slovenska began tightening regulatory lending standards with effect from 1 July 2018. But although this tightening will be phased in over a year, credit demand escalated in the run up to its introduction owing to several media outlets unduly warning about a sudden deterioration in the availability of credit. Credit growth has accelerated in recent months, fur-ther supported by favourable economic trends as well as by the continuing decline in interest rates.
As regulatory lending standards are further tightened, household debt growth is expected to moderate. Looking further ahead, other fac-tors such as demographic developments and gradual market saturation are also expected to dampen growth in housing loans.
non-FinanCial Corporation (nFC) Credit growth has stabilised Lending activity to the NFC sector has remained largely unchanged in 2018, although the largest banking groups have increased their share of this market. Interest margins on large loans has stabi-lised after their previous period on compression, and this significant change has had a positive im-pact on bank profits. Interest margins on smaller loans, however, has undergone further compres-sion, and lending to the SME sector has picked up after a slowing trend.
The NFC debt-to-GDP ratio has not increased in 2018 and the upward trend in the volume of cor-porate bond issues has come to an end. Even so, firms in Slovakia are among the more leveraged compared with firms in other CEE countries.
the CommerCial real estate market remained in an expansionary phase; Credit growth piCked up Strong investment activity has returned to the commercial real estate (CRE) sector. Total CRE investment in 2018 could be close to the his-torical high of 2016. At the same time, end-user demand remains elevated, which is evident from office space occupancy rates that are at all-time highs. In the residential segment of the CRE mar-
ket, prices of new builds have continued to rise and are gradually approaching pre-crisis levels, and the number of empty new-build flats in the supply stock is falling.
The annual growth rate for total CRE loans has accelerated to 6.5%. Compared with the pre-crisis period, however, banks are taking a more cautious approach to lending in several areas. Lending growth is now more in line with economic funda-mentals, such as GDP and property price growth rates. The average amount of loans has declined.
Given the CRE sector’s more acute sensitivity to the general economic situation – as seen in the previous crisis – developments in this sector have a significant impact on the stability of the banking sector.
At the same time, CRE financing is not provided only by banks. There is major investment in the sector from investment funds and, even more so, from households, mainly through the purchase of bonds issued by firms in or involved with the sector.
banks have managed to maintain proFitability in reCent years only at the Cost oF rapidly expanding their lending aCtivity and simultaneously reduCing Credit risk Costs
The banking sector’s aggregate profit for the first nine months of 2018 was slightly higher year on year (by 7.6%). The increase was partly accounted for by a structural change, namely the assumption of part of the portfolio of one con-sumer credit company.
Profitability in the Slovak banking sector has long been among the highest in EU’s banking union; however, its upward trend has lost some momentum, and other countries’ banking sec-tors are beginning to catch up. Slovak banks are reporting the highest provisioning coverage for non-performing loans (NPLs).
Profit growth has been underpinned by the sta-bilisation of the interest margin on the sector’s corporate loan book. By contrast, the interest margin on the retail portfolio has continued to fall, and it is becoming increasingly difficult for banks to compensate for that compression by expanding their loan books.

7NBS
Financial Stability RepoRtNovemBer 2018
O V E R V I E W
Another key factor in banks’ recent profit growth has been their low losses on NPLs. This trend may not, however, be sustainable over the long term, and the potential negative impact of any increase in these losses is steadily increasing as a result of the rapid loan book growth.
the adverse eFFeCts oF low interest rates are also aFFeCting other FinanCial market segments In the pension fund sector, the ratio of interest income to net asset value (NAV) has fallen by more than half over the past eight years. Funds have therefore had to replace this income with other, more volatile sources of income, and consequently their exposure to market risks is rising markedly. In the life insurance sector, a long-standing risk has been that falling returns on assets will not be sufficient to cover returns guaranteed under life insurance contracts.
Banks and other financial institutions have in re-cent years responded in several ways to declin-ing interest income. They have focused mainly on improving operational efficiency, increasing the extent of process digitisation and automa-tisation, increasing fee generation capacity, and extending product portfolios and access to new customers via acquisitions or by creating new brands. Despite these efforts, developments in interest margins and credit risk costs remain cru-cial to the banking sector’s profitability.
banks’ solvenCy has Fallen slightly
As in 2017, the banking sector’s aggregate to-tal capital ratio fell in the first half of 2018, from 18.6% to 18.2%, notwithstanding the continua-tion of more conservative dividend policies. The decline is partly caused by banks’ transition to the new accounting standard IFRS 9. An increas-ingly important factor is banks’ efforts to opti-mise the level and structure of their capital and gradually reduce voluntary capital buffers above the level of regulatory requirements. The sector’s capital ratios have fallen close to the lower quar-tile of the EU range.
Owing to the extended period of strong credit growth, relatively substantial risks have been building up in banks’ loan books, while falling interest margins have reduced the capacity of banks to absorb losses in a normal way, through current income. Going forward, therefore, banks will have to take a more prudent approach to
dividend policy. At the same time, macropruden-tial measures designed to bolster the resilience of both banks and customers are playing an in-creasingly important role.
In response to a persistently elevated cyclical risk, Národná banka Slovenska decided in June 2018 to further increase the countercyclical cap-ital buffer (CCyB) rate with effect from 1 August 2019. The possibility of another increase next year cannot be ruled out, particularly if there continues to be excessive credit growth and eco-nomic overheating.
the inCrease in liquidity risk in the banking seCtor has been largely related to a strong upward trend in long-term loans and to the low interest rate environment The maturity mismatch between assets and lia-bilities in the banking sector has reached a new historical high in 2018. At the same time, the sec-tor’s ratio of liquid assets to total assets ratio has fallen this year, as has the total volume of liquid assets. Thus, there has been a long downward trend in the share of total deposits that could be covered by liquid assets in event of a sudden outflow of deposits. Banks have therefore had to be increasingly reliant on the stability of fund-ing sources. On the other hand, the aggregate loan-to-deposit (LTD) ratio has been increasing. During the past three years credit growth has been outpacing deposit growth, and in 2018 the LTD ratio exceeded 100% for the first time. The Slovak banking sector’s vulnerability in terms of liquidity has also increased in comparison with the situation in the EU. It is therefore becoming ever more important for banks to mitigate the rising risks related to their diminishing capacity to maintain stable funding in a low interest rate environment.
the insuranCe seCtor FaCes signiFiCant risks in the Form oF unCertainty about non-material damage and oF shortComings in Capital quality One of the principal risks now facing the in-surance sector concerns insurance claims for non-material damage and the sizes of such claims, most of which are made under motor third party liability insurance policies. Although the costs related to these claims are not high, they are rising. Moreover, the uncertainty about the actual amount of compensation is an obsta-cle to efficient insuring of the risk.

8NBS
Financial Stability RepoRtNovemBer 2018
O V E R V I E W
The capital structure of insurance undertakings represents another risk in the sector. Several in-surers meet the solvency requirement only be-cause they have been able since 2016 to include the new item ‘expected profits included in future premiums (EPIFP)’ in their capital; the risk, how-ever, is that the expected profits will not be re-alised. These future profits constitute a share of insurers’ capital, 60%, which is five times higher than the EU median.
in investment Funds, the share oF riskier assets and illiquid assets is inCreasing In Slovakia’s investment fund sector, which has experienced strong growth in recent years, inves-
tor inflows have for a few years been accompa-nied by the targeting of fund portfolios on riskier and less liquid assets. The clearest example of this is the rapid growth in the amount of assets under management in real estate funds. The liquidity of investment funds is also being reduced by an increasing share of investments in Slovak and, to a lesser extent, Czech bonds and notes, for which there is almost no liquid secondary market. The risk related to mounting illiquidity materialises mainly when financial market headwinds trig-ger a sudden wave of redemptions, thereby in-creasing the risk of losses on the redemption of fund shares/units, or even of the redeemability of shares/units being completely suspended.

1
MACROECONOMIC ENVIRONMENT AND FINANCIAL MARKETS
C H A P T E R 1

10NBS
Financial Stability RepoRtNovemBer 2018
C H A P T E R 1
Chart 1 Industrial activity is moderating amid rising political uncertainty
Source: Bloomberg.
65
60
55
50
400
300
200
100
0
Manufacturing PMI – worldManufacturing PMI – euro areaGlobal Political Uncertainty Index (right-hand scale)
1. N
ov. 2
015
1. Ja
n. 2
016
1. M
ar. 2
016
1. M
ay 2
016
1. Ju
ne 2
016
1. Se
p. 2
016
1. N
ov. 2
016
1. Ja
n. 2
017
1. M
ar. 2
017
1. M
ay 2
017
1. Ju
ne 2
017
1. Se
p. 2
017
1. N
ov. 2
017
1. Ja
n. 2
018
1. M
ar. 2
018
1. M
ay 2
018
1. Ju
ne 2
018
1. Se
p. 2
018
1 maCroeConomiC environment and FinanCial markets
1.1 SLIGHTLY WORSENING OUTLOOKS FOR THE GLOBAL ECONOMY AND INCREASING RISKS
Key trends in risks from the external envi-ronment
• The recent period has seen a slight deteri-oration in the global macroeconomic out-look and a simultaneous increase in risks to financial stability.
• Among the most noted threats to the global economy is the current spate of pro-tectionist measures and the risk of a full-blown trade war breaking out.
• The moderate tightening of global finan-cial conditions has led to greater volatility and less favourable trends in financial mar-kets.
• Market attention has shifted to emerging market economies, with these most vul-nerable economies coming under increas-ing pressure.
maCroeConomiC developments in 2018 have begun having a negative impaCt on FinanCial stability A moderate deterioration in the macroeco-nomic outlook has been accompanied by increasing risks. The solid growth recorded by the global economy in 2018 is among the high-est rates observed in the post-crisis period. The greater number of advanced economies have actually been operating above potential and this situation is expected to continue over the next two years, albeit on the somewhat uncertain assumption of no serious shocks appearing. In fact, the year to date has been marked by sever-al portents of a systemically important adverse event and the probability of such an event in the future has increased. In this context, finan-cial stability has come under increasing pressure and the threats that could disrupt it have gained momentum. Behind this situation is the gradu-ally turning global business cycle coupled with increasing structural risks and mounting uncer-tainty.
The global economy does not appear to have maintained in 2018 the momentum it showed in the second half of 2017, and there has also been a diminution of what had been a large degree of business cycle synchronisa-tion across countries. This loss of momentum has been most pronounced in several advanced economies that at the turn of the year were still in an expansionary phase. The euro area as a whole clearly falls into this category, although its GDP growth this year has still been solid, at around 2%. The previous prevailing view that 2018 might even see a slight acceleration of global activity is now seen to have been overly optimistic. The business cycle seems to have re-cently peaked. Growth rates for industrial pro-duction and foreign trade – pillars of the recent wave of global recovery – have been moderat-ing since the beginning of 2018. A similar trend has been seen in many ‘soft’ indicators, such as confidence indicators. These facts have already been reflected in the projections of official in-stitutions, including, for example, the Interna-tional Monetary Fund (IMF). What is even more

11NBS
Financial Stability RepoRtNovemBer 2018
C H A P T E R 1
Chart 2 US interest rate increases and their spillover effects on emerging market economies
Source: Bloomberg.
E�ective federal funds rateYield on 5-year US government bonds EMBI spread (right-hand scale)
2.5
2.0
1.5
1.0
0.5
0
600
500
400
300
200
100
0
31. D
ec. 2
012
31. D
ec. 2
013
31. D
ec. 2
014
31. D
ec. 2
015
31. D
ec. 2
016
31. D
ec. 2
017
(b.p.) (%)
important for financial stability than the adjust-ment in the central path of economic growth is the increasing probability of significant adverse scenarios materialising. In other words, the risks to the outlook have shifted from being relative-ly balanced to clearly on the downside. Among the most frequently mentioned risks are those with a political or geopolitical dimension, in particular the risks of trade war escalation, fur-ther inflation of asset prices, excessive indebt-edness in certain countries, and a tightening of financial conditions.
the risk oF a Full-blown trade war breaking out has been mounting The area of uncertainty that currently has most significance for the global economy is the deviation from the consensus support for the rules-based international system of free trade. Criticisms of this model, and of globali-sation more broadly, have been increasing for some time. It was not until this year, however, that such rhetoric began significantly to trans-late into actual protectionist measures. The Unit-ed States has been the principal initiator of these measures. In the first phase, the US Administra-tion levied tariffs on imports of aluminium, steel and certain other products, and then imposed tariffs on USD 50 billion worth of imports from China. Subsequently, it imposed a further round of tariffs on another USD 200 million worth of Chinese goods. As a result of the two rounds, tar-iffs were applied to around half of all Chinese im-ports into the United States. In each case, China responded with retaliatory measures. The United States is also considering imposing tariffs on ve-hicle and vehicle component imports from any country.
The greatest risk related to escalating pro-tectionism is the increasing, albeit still rela-tively low, probability of a full-blown global trade war breaking out and the adverse impact of this threat to economic and financial market sentiment. This is further confirmed by IMF sim-ulations that attempted to quantify the reper-cussions using a number of graduated scenarios. The first scenario shows that the direct impact of the measures currently in place concerns only the United States and China, and that even in those countries, GDP growth is not expected to be dented by more than 0.5 percentage point.
Almost the same can be said of a scenario in which tariffs are extended to all US imports from China, except that the impact on China is twice as large. In a scenario assuming the imposition of tariffs targeted at the automotive industry, the negative long-term impact on euro area GDP growth is minimal. GDP growth moder-ates the most under another scenario, which, besides all the above tariffs, includes also the impact of ebbing confidence in the real econo-my and nervousness in financial markets. In that case, the short-term impact on global econom-ic growth reaches up to around 0.8 percentage point, and the long-term impact is half of that. In this most complex of the scenarios, the euro area is also relatively sensitive to the assump-tions and, according to the IMF, its GDP growth could temporarily decrease by half of a percent-age point. It is necessary to note, however, the difficulty in modelling the scenarios, particularly those featuring secondary effects.
the moderate tightening oF global FinanCial Conditions has led to greater volatility and, exCept in the united states, less Favourable trends in FinanCial markets.The monetary policy cycle has continued turning slowly. Low interest rates, maintained

12NBS
Financial Stability RepoRtNovemBer 2018
C H A P T E R 1
Chart 3 Non-US equity markets are no longer rising as fast as they recently were
Source: Bloomberg.Note: Rescaled (31 December 2017 = 100).
Euro Stoxx 50S&P 500 MSCI Global excluding the United States
110
105
100
95
90
85
80
30. D
ec. 2
016
28. F
eb. 2
017
30. A
pr. 2
017
30. J
une 2
017
31. A
ug. 2
017
31. O
ct. 2
017
31. D
ec. 2
017
28. F
eb. 2
018
30. A
pr. 2
018
30. J
une 2
018
31. A
ug. 2
018
31. O
ct. 2
018
mainly by central banks in advanced econo-mies have contributed significantly to stimu-lating economic activity. After almost ten years in which monetary policy has been extremely loose, however, there is increasing scope for its gradual normalisation. This process is being led by the United States, where the federal funds rate has been hiked from zero to above two per cent and will in all likelihood go even higher. A number of other major central banks have also begun taking their first steps in raising interest rates. In the euro area, the ECB has still not gone down this path, but it has reduced its volumes of government bond purchases. Given this ap-proach and that of the Federal Reserve (which has even started to unwind its balance sheet), global quantitative easing is gradually morphing into quantitative tightening, even after taking into account Japan’s still expansionary monetary policy.
Although the United States is the main source of the impulse for raising interest rates, it is also one of the few countries where overall financial conditions have continued to ease. The increase in risk-free interest rates in the form of higher yields on government bonds has been fully offset by strong risk appetite, as reflected in the rising prices of most domestic financial assets. The bulk of attention in this regard has focused on the US benchmark equity index, the S&P 500, which regardless of some brief non-negligible corrections has continued to hit historical highs and recently set a new record for the length of time it has been rising without any significant decline. In the almost ten years since the depths of the financial crisis, US equities have increased in price by around fourfold. But although their recent growth has been support-ed by the exceptionally strong performance of the US economy and elevated corporate profits, several metrics have for a while been indicat-ing they are overvalued. Nor is this view much altered by the fact the S&P 500 index fell by 7% in October. Strong demand and low risk premia indicates a potential underpricing of risk in the non-investment grade bond market, especially given the high indebtedness of issuers.
In most of the financial markets in other re-gions, the optimism that prevailed during 2017 has faded in recent months. European equity indices have been on a downward trend
so far in 2018. Furthermore, the required risk premia for euro denominated corporate bonds has increased. Price declines have been even more marked, however, in the financial markets of emerging market economies. In contrast to the situation not so long ago, foreign investor sentiment towards these countries has cooled, with resulting outflows of portfolio investments. The turnaround began in spring, when inflows into emerging-market bonds abated in connec-tion with rising interest rates in the United States and appreciation of the US dollar. Risk aversion subsequently spread more to equity markets, on fears that protectionist measures could have se-rious repercussions for the economic condition of EMEs. In general, compared with the calm pre-vious period, global financial markets have since the start of 2018 been marked by sudden stress episodes coupled with significant asset price corrections. Nevertheless, the increase in actual volatility has had only a slight impact on implied volatility expressing expectations for the future.
less Favourable FinanCial Conditions together with high indebtedness, deteriorating eConomiC Fundamentals, and politiCal risks have brought about a shiFt in FinanCial market sentiment towards emes
The most marked turbulence has been seen in Argentina and Turkey. The outflows of funds from EMEs have not amounted to flight and have

13NBS
Financial Stability RepoRtNovemBer 2018
C H A P T E R 1
been concentrated in certain economies, ones that have a vulnerable external position com-bined with idiosyncratic political risks and un-certainty. The most pronounced outflows have been observed in Argentina and Turkey. In each of these cases, investor reaction was so severe that the domestic currency slumped by tens of per cent and domestic government bond pric-es fell sharply. In order to stabilise the situation, the countries’ central banks hiked interest rates significantly. The turbulence triggered by the problems in these two countries briefly spread to some extent to global financial markets, but systemic contagion has so far been avoided. Investors have clearly been discriminating be-tween countries according to their economic fundamentals, as is seen, for example, in the cor-relation between increases in government bond spreads and balance of payment current account positions.
On the whole, however, EMEs have in recent years become increasingly sensitive to the tightening of external financial conditions. This is related to the substantial build-up of debt, stimulated by the post-crisis environment of low interest rates. In emerging markets, the debt burden of non-financial private sector entities, including mainly NFCs, has increased in the past ten years from 120% to 180% of GDP. The debt-ors seen as most vulnerable are those who are increasingly obtaining financing in other than domestic currencies. Such sources account for around a quarter of the total debt in EMEs, and they are largely denominated in US dollars. If the domestic currency depreciates against the dol-lar, as has happened virtually throughout 2018, debt servicing becomes costlier unless the po-sition is financially, or otherwise economically, hedged. At the same time, however, debt de-nominated in domestic currency may also carry elevated risk if the creditor is a non-resident that in stress periods tends to reduce its exposure to currency and credit risk.
The issue of excessive debt amid tightening financial conditions is a global one that also encompasses advanced economies. According to IMF data, the aggregate debt of households, NFCs and general government for countries that have a systemically important financial sector has climbed from 210% of GDP in 2008 to 250% now.
Cheap financing and demand for higher-yield-ing opportunities have enabled the leveraging of less creditworthy entities. A proportion of the added debt burden is serviceable only under the low interest rates that have been prevailing in re-cent years. When interest rates rise, and they are already doing so to some extent, the solvency of a significant share of customers may be jeopard-ised. Higher default rates would lead to apprecia-ble losses in the financial sector and threaten the financial health of its participants.
The greatest concerns about debt accumula-tion and its repercussions for the world have in recent years focused on China. This is due both to the high rate of debt growth in China, especially in the corporate sector, and to the large size of the Chinese economy. Another ag-gravating circumstance is the questionable level of credit standards and the efficiency with which borrowed funds are used, since the credit boom has been largely underpinned by efforts to pro-vide short-term stimulation to economic activity. The significance of these risk factors is increasing amid a gradual softening of Chinese economic performance. In the event of a crisis, the adverse trends could be accelerated by uncertainty re-sulting from the complicated and unclear struc-ture of financial instruments and from interlink-ages in the non-bank financial sector, which accounts for a significant share of new lending in the country.
If interest rates increased appreciably in the relatively near future, it would most prob-ably happen due to overheating of the US economy. The rate increases seen so far in the United States, and their pass-through to market rates elsewhere in the world, have been moder-ate and were announced sufficiently in advance. However, the US economy is in a boom and has for some time now been operating above poten-tial. The already strong cyclical position has been further amplified by fiscal stimulus. Unemploy-ment is at its lowest level for almost half century, and labour shortages are finally beginning to put upward pressure on wages. It may be that these pressures will mount, and that maintaining price stability will require the central bank to respond more swiftly than expected, thereby raising not only the global level of risk-free interest rates but probably also the level of risk premia.

14NBS
Financial Stability RepoRtNovemBer 2018
C H A P T E R 1
Chart 4 Increasing risk aversion towards Italy has not spilled over to other countries (percentage points)(Yields on 10-year government bonds)
Source: Bloomberg.
Italy Spain Portugal
4
3
2
1
0
30. 1
2. 20
16
30. 3
. 201
7
30. 6
. 201
7
30. 9
. 201
7
31. 1
2. 20
17
31. 3
. 201
8
30. 6
. 201
8
30. 9
. 201
8
besides global threats, the euro area has reCently seen an inCrease also in internal risks to FinanCial stability Italy’s announced deviation from public fi-nance consolidation has been penalised by the markets through increases in risk premia on both government bonds and private sec-tor debt. The return of unfavourable financial market sentiment towards Italy stemmed ini-tially from political uncertainty about the new government’s formation and its commitment to fiscal discipline. The required yield on ten-year Italian government bonds jumped from a stable level of around two per cent, to three per cent, and it has remained around that mark while showing increased volatility. At the end of September this yield increased further by half of a percentage point. Currently, the prices of Ital-ian government bonds are at their lowest level since the beginning of 2014 and their spread over German Bunds is at a five-year high. The re-cent increase in risk aversion towards the coun-try has been driven by a new draft budget that envisages increasing the fiscal deficit to 2.4% of GDP, which is a deviation from the original commitment to public finance consolidation.
Under the submitted draft budget, government spending would be raised to support econom-ic growth and thus ultimately to reduce mod-erately the public debt-to-GDP ratio. However, the rates of GDP growth projected in the draft budget are notably higher than those projected by most other official institutions. If, therefore, the fiscal stimulus projected by the govern-ment is not as effective as expected, the deficit could push up a public debt-to-GDP ratio that, although stabilised in recent years, is already highly elevated at just over 130% of GDP. And if bond market funding costs remain high, the prospects for further growth of Italian govern-ment debt will probably become even more pronounced.
The situation could be further exacerbated if fears of a negative feedback loop between sovereign solvency and the domestic bank-ing sector are fully rekindled. The conditions for such interaction are in place, since the capi-tal position of the banking sector in Italy is the second worst in the euro area, and Italian banks have in recent months been buying large vol-umes of domestic government debt, increasing its share in their aggregate balance sheet to close to the historical high of 2015. A positive as-pect of the turbulence surrounding Italy is that the unfavourable sentiment towards the country has so far not spread to other more vulnerable euro area countries.
Another major geopolitical risk for Europe is the United Kingdom’s approaching with-drawal from the European Union (Brexit). The extent of this risk depends on what form Brexit takes and on whether any deal can be reached on an agreement governing the UK’s new post-Brexit relations with the EU. Even after months of negotiations, a final agreement has yet to be reached, and given the narrowing time window until withdrawal, uncertainty and nerv-ousness are increasing. It is this indirect channel that, even more so than any direct loss of export opportunities, could cause significant economic damage to the euro area, as increased caution from the NFC sector may lead to the deferral of investment decisions and dampening of domes-tic demand.

15NBS
Financial Stability RepoRtNovemBer 2018
C H A P T E R 1
Box 1
THE WITHDRAWAL OF THE UNITED KINGDOM FROM THE EUROPEAN UNION IS NOT EXPECTED TO HAVE A MAJOR IMPACT ON THE FINANCIAL STABILITY
OF THE SLOVAK FINANCIAL SECTOR
the uk’s withdrawal From the eu (brexit)Following the outcome of a referendum held in June 2016, the United Kingdom activated Article 50 of the Treaty on European Union and notified the European Council of its in-tention to leave the EU on 29 March 2019. The EU and UK are currently close to finalis-ing the draft of the Brexit agreement, which should be approved by the UK Parliament in the weeks to come, and according to which the UK would retain access to the European Single Market and remain in the European Union Customs Union. At the same time, how-ever, the UK would continue to be required to comply with several EU trade rules and stand-ards. Alternatively, under a ‘hard’ Brexit, the UK would leave the Single Market and Cus-toms Union, and UK-EU trade relations would be governed solely in accordance with their agreements with the World Trade Organisa-tion. Brexit, particularly if hard, could be detri-mental to EU countries’ financial systems and to their financial stability, via various transmis-sion mechanisms.
potential direCt and indireCt reperCussions oF hard brexit Potential direct and indirect repercussions of a hard Brexit may have both a direct and in-direct impact on balance sheets in the bank-ing sector and other sectors of the financial system, weighing on both the assets and li-abilities sides and having the potential to set off a chain reaction of contagion. The direct repercussions concern exposures that Euro-pean financial institutions have to counter-parties in the UK. The indirect effects relate to the possibility that UK economic growth will moderate, that certain assets will be repriced, and that European financial institutions will need to reduce their use of UK financial ser-vices, which is currently extensive. Although
the timescale and extent of the effects are difficult to estimate at present, it may be as-sumed that if the probability of a hard Brexit increases, market reactions and the materi-alisation of several risks may be seen before March 2019.
Given the current increase in uncertainty, fi-nancial market turbulence could become far more pronounced. Market reaction has so far been quite moderate, contained largely in the currency markets: the British pound depreciated by 18% in response to the ref-erendum result, but its exchange rate since September 2017 has remained within a rel-atively narrow band. This situation implies that markets are not at present pricing ex-isting risks in the form of higher exchange rate volatility. That could change rapidly, however, particularly if there is a hard Brexit with a potential strong rise in risk aversion, reflected in increasing risk premia and rising market volatility. The result of that would be a tightening of financing conditions, in-cluding higher haircuts and margins that would heighten the pressure on the euro area banking sector. Higher haircuts and margins on banks’ eligible collateral could give rise to a negative liquidity spiral and exacerbate market stress, which may in turn make bank funding even more difficult. At the same time, bond market risk premia may increase, and the impact of such increase on the sovereign bond market could be to re-draw attention to the sustainability of pub-lic debt levels in certain highly indebted EU countries.
A hard Brexit would also be expected to weigh on UK economic growth, with negative reper-cussions for euro area financial institutions that have exposures to the UK. The institutions

16NBS
Financial Stability RepoRtNovemBer 2018
C H A P T E R 1
facing the largest risk in this regard are those that have concluded financial derivatives transactions and credit agreements with UK counterparties. A Brexit-related decline in as-set prices may also adversely affect non-bank financial institutions (insurers, pension funds, money market funds and investment funds). The non-bank financial institutions with the largest such exposures are non-money market investment funds.
the signiFiCant position oF uk Capital and derivatives markets
Owing to the size and importance of UK cap-ital and derivatives markets, many European companies use their services and infrastruc-ture for the issuance of equity or debt instru-ments or for hedging purposes. Derivatives transactions conducted in the UK accounted for around one-fifth of euro area hedging transactions in 2017. After a hard Brexit, Eu-ropean entities could continue using some (largely unregulated) financial services, but generally their access to UK capital and de-rivatives markets would be restricted, since access to financial products and services pro-vided in the UK would be subject to EU rules vis-à-vis third countries. This situation would increase the funding costs of the entities af-fected.
Central counterparty clearing houses (CCPs)1 established in the UK currently clear a signif-icant share of derivatives transactions and repo transactions, whether denominated in euro or other currencies. Euro area banks and end-users would have to reduce their use of such services provided in the UK if there were no agreement or regulation mit-igating the impact of Brexit; they would be burdened by higher capital charges for bank exposures to third-country CCPs, higher transaction costs, and an increase in hair-cuts.
Euro area financial institutions have a signifi-cant volume of financial contracts concluded under UK law, which will certainly have an im-pact on the euro area financial system.
1 A total of 16 CCPs are currently established in EU, including three in the UK and 13 in another ten countries.
the slovak FinanCial seCtor’s direCt exposure to a hard brexit is minimal Looking at the geographic breakdown of Slo-vak banks’ direct exposures to counterparties, the UK is firmly established in the top six; nev-ertheless, the total amount of the banks’ expo-sures to UK counterparties is not large, stand-ing at around €300 million, or roughly 0.4% of the banks’ total assets, for the past year and a half. The Slovak banking sector’s exposure to the UK consists mainly of NFC loans and cor-porate bonds.
Brexit is also not expected to have a major im-pact on other financial market segments (in-surers, investment funds, PFMCs, and SPMCs). These sectors report exposures to UK-issued corporate bonds (amounting to €360 million as at June 2018). The largest such exposure is reported by PFMCs, constituting the second pillar of the pension system, and it represents 3.5% of the sector’s total assets. In none of the other sector’s does the share of total assets ex-ceed 1%.
moderate impaCt on domestiC Firms FinanCed by domestiC banks A possible channel through which Brexit may affect the Slovak banking sector is the sector’s exposure to domestic firms that ex-port to the UK. In 2017 the UK was the fifth largest destination for exports of goods and services from Slovakia, and the share of these exports in Slovakia’s GDP in 2017 was 5.3%. The sector accounting for the largest share of Slovak exports to the UK is the car industry (around 40%), followed by other industry (especially electronics manufac-turing), and the energy sector. Furthermore, Slovak exports to the UK are relatively con-centrated, with the ten largest exporters from these sectors producing around 60% of the exports in 2017. Brexit, in particular a hard one, could hinder the access of ex-porters to the UK market, mainly owing to higher trade barriers and tariffs. Firms that export to the UK while also having credit ex-posure to the Slovak banking sector reliably produce around 60% of total Slovak exports

17NBS
Financial Stability RepoRtNovemBer 2018
C H A P T E R 1
Chart 5 The output gap in Slovakia: its estimated level for 2018 and its growth rate since 2015 (as a percentage of potential GDP) do not exceed the EU average
Sources: AMECO, European Commission and NBS.
Output gap in 2018Output gap evolution in the period 2015-2018
7
6
5
4
3
2
1
0
-1
-2
-3
-4
-5
-6
Slov
enia
Esto
nia
Lith
uani
a Hu
ngar
yCr
oatia
Cypr
usLa
tvia
Pola
ndSp
ain
Rom
ania
Czec
h Re
publ
icNe
ther
land
sPo
rtuga
lM
alta
Irela
ndUn
ited
King
dom
Slov
akia
Aust
ria EUGe
rman
yBu
lgar
iaEu
ro ar
eaFi
nlan
dLu
xem
bour
gBe
lgiu
mFr
ance
Swed
en Italy
Denm
ark
Gree
ce
7
6
5
4
3
2
1
0
-1
-2
-3
-4
-5
-6
to the UK. The total loans to these firms from the Slovak banking sector amounted to around €1.2 billion at the end of the first half of 2018, or 2.1% of the sector’s aggregate loan book and 3.7% of its aggregate loans to NFCs. At the same time, these credit ex-posures are relatively concentrated, with 85% of them spread between five banks. For most firms that have exposures to the Slo-vak banking sector, however, their exports to the UK do not constitute a sizeable share
of their total exports. Of such firms total ex-ports in the second quarter of 2018, exports to the UK made up 5.7%. It may therefore be expected that any drop in exports to the UK resulting from a hard Brexit will not have a major impact on most firms liabilities to the Slovak banking sector. As for the firms that could be worst affected by a hard Brex-it,2 their total exposure to the Slovak bank-ing sector amounts to €23 million (0.1% of the sector’s corporate loan book).
1.2 STRONG GROWTH IN THE DOMESTIC ECONOMY
Key trends in the domestic environment
• The Slovak economy is operating above potential and, going forward, its overheat-ing is expected to accelerate.
• Pressures are most pronounced in the la-bour market, where the unemployment rate is recording historical lows.
• Labour market overheating entails risks to financial stability.
like most eu Countries, slovakia is experienCing good eConomiC times with its eConomy in an expansion phase. pressures are beginning to be most pronounCed in the slovak labour market. Like most European countries, Slovakia is in an expansionary phase of the economic cycle. In all but one EU country,3 the economy expanded year on year in the first half of 2018, and in Slovakia it grew by 4.5%, the seventh highest rate in the EU. Average GDP growth for in EU as a whole was 2.2%, similar to the rate for the euro area, but whereas EU and euro area growth rates remained stable at the previous year’s levels, Slovakia’s GDP growth accelerated. Most EU countries are experiencing economic expansion. In as many as 25 EU countries, GDP growth for the whole of 20184 is expected to be above potential. Slovakia’s output gap in 2018 is projected to be close to the EU and euro area
averages, while 16 other EU countries are ex-pected to record a greater degree of economic overheating. In fully 26 EU countries, the output gap has within the past three years begun to indicate overheating. By this measure, too, the Slovak economy has remained relatively close to the EU average.
2 Firms whose exports to the UK make up more than 30% of their to-tal exports and whose outstanding loans to the Slovak banking sector amount to more than €10,000.
3 Denmark’s GDP stagnated in the first half of 2018.
4 Spring 2018 Economic Forecast, European Commission.

18NBS
Financial Stability RepoRtNovemBer 2018
C H A P T E R 1
Chart 7 Slovakia’s annual GDP growth has been gradually accelerating (percentages)
Source: SO SR and NBS.
Chart 6 Labour market overheating is far greater in Slovakia than in most other EU countries
Sources: AMECO, European Commission and NBS.Notes: The rate of labour market overheating is measured as the difference between the non-accelerating wage rate of un-employment (NAWRU) – representing the unemployment rate that does not lead to an increase in overall wage inflation – and the current unemployment rate. Positive values indicate over-heating of the labour market, while negative values indicate cooling, with the unemployment higher than structural unem-ployment.
Interquartile rangeEU median Slovakia
5
4
3
2
1
0
-1
-2
-3
2001
2002
2003
2004
2005
2006
2007
2008
2009
2010
2011
2012
2013
2014
2015
2016
2017
2018
5
4
3
2
1
0
-1
-2
-3
Household consumptionGovernment nal consumption Gross xed capital formationNet exports Changes in inventoriesGDP
10
8
6
4
2
0
-2
-4
-6
Q1 20
16
Q2 20
16
Q3 20
16
Q4 20
16
Q1 20
17
Q2 20
17
Q3 20
17
Q4 20
17
Q1 20
18
Q2 20
18
3.5%
3.7%
2.5%
2.9%
2.6%
3.4%3.0% 3.7% 3.7%
4.5%
While the extent of economic overheating and the output gap growth rate in Slovakia have not differed significantly from the EU av-erage, labour market overheating in Slovakia has been notably greater. As regards labour market overheating,5 Slovakia is now reporting the third highest rate in the EU.6 Since 2015 the rate of labour market overheating in Slovakia has been notably higher than the EU median (Chart 6). A similar trend was observed during the previous economic expansion, approximate-ly two years before the peak of the business cy-cle in 2008.
Labour market overheating entails risks to financial stability. When the business cycle turns there will be a decline in job vacancies that are not sustainable over the long term, since the creation and maintenance of these jobs has been contingent on business cycle developments. This situation may also have ad-verse effects on the financial cycle where bor-
5 The rate of labour market over-heating measured as the difference between the non-accelerating wage rate of unemployment (NAWRU) – representing the unemployment rate that does not lead to an increase in overall wage inflation – and the current unemployment rate.
6 After Croatia and Poland.
rowers whose debt servicing depends on these jobs default.
the slovak eConomy is already beneFiting From elevated investment and household Consumption and is expeCted to be Further boosted by exports. eConomiC overheating is projeCted to Continue in the period ahead Slovakia’s economic growth in the first half of 2018 was driven mainly by domestic demand. Investment made the largest contribution to economic growth and its share has been grad-ually increasing. Investment activity has been boosted considerably by investment in the au-tomotive industry related to the establishment of a new car plant and by increasing public in-vestment, particularly in the local government sector. Household consumption has been stably contributing to GDP growth for several years, with households having been able to increase their consumption as a result of increasing em-ployment and resulting growth in disposable income; nevertheless, the contribution of their consumption to GDP growth has been gradually falling in 2018. After moderating in 2017, gov-ernment consumption also had a positive im-pact on economic growth in the first half of the year, largely due to higher expenditure on wag-

19NBS
Financial Stability RepoRtNovemBer 2018
C H A P T E R 1
Chart 8 The size of the economically active population has been falling moderately in recent years, and there have been demographic changes in its 20-34 and 55-64 year cohorts (in thousands of persons)
Sources: SO SR and NBS.
Year-on-year change in the 20-34 year cohort (right-hand scale)Year-on-year change in the 55-64 year cohort (right-hand scale)Economically active population
2,800
2,750
2,700
2,650
2,600
2,550
2,500
2,450
2,400
2,350
Q1 1
996
Q1 1
997
Q1 1
998
Q1 1
999
Q1 2
000
Q1 2
001
Q1 2
002
Q1 2
003
Q1 2
004
Q1 2
005
Q1 2
006
Q1 2
007
Q1 2
008
Q1 2
009
Q1 2
010
Q1 2
011
Q1 2
012
Q1 2
013
Q1 2
014
Q1 2
015
Q1 2
016
Q1 2
017
Q1 2
018
40
20
0
-20
-40
-60
-80
es and on the purchase of goods and services. Changes in inventories contributed negatively to growth in the first half of the year, while net ex-ports, after a poor performance in the first quar-ter, made a positive contribution in the second quarter, with Slovakia’s exports being supported not only by rising foreign demand, but also by the production launch of new car models in the automotive industry.
Looking ahead, the Slovak economy is expected to be operating above potential, with the effects of its overheating seen mainly in increasing la-bour market pressures and accelerating prices of goods and services. Domestic demand, ris-ing on the back of an improving labour market situation and increasing disposable income, is expected to support economic growth, and so too is foreign trade, buoyed by production from Slovakia’s newest car plant. The financial cycle risks related to macroeconomic development are therefore expected to grow further in the pe-riod ahead.
the unemployment rate is at historiCal lows, and the labour market situation is putting upward pressure on wages; at the same time, the labour market is experienCing signiFiCant struCtural Changes The expansionary phase and incipient over-heating of the economy are most apparent in the labour market. Headcount employment in Slovakia stood at more than 2.4 million at the end of the first half of 2018, and the unemployment rate, after hitting new lows over some eighteen months, was down to 6.9% in the second half of the year.7 Most of the job growth in the past year has been in the sectors of services, industry and construction. The labour market has also been undergoing several structural changes in recent years. Pressures in the labour market have been mitigated by a decline in the number of Slovak cit-izens working abroad, which compared with sum-mer 2016 was around 22,000 lower.8 In response to increasing labour shortages, firms are, among oth-er things, hiring more foreign workers, the number of whom has trebled, up to more than 62,000 in August 2018. This may also create a certain buff-er for Slovak households when the business cycle turns, as it is expected that firms needing to re-duce their workforce will, in the environment of an ample domestic labour supply, rather release foreign workers than Slovak employees.
7 Labour Force Survey data.8 Measured using Labour Force
Survey methodology.9 People aged 15-64 who are em-
ployed or who are unemployed but actively seeking work and able to start work within the next 14 days. It does not include, for example, students, pensioners, homemak-ers, people on parental leave and people not looking for work. This figure is the denominator for the unemployment rate
At the same time, changes have been taking place within the development and struc-ture of the economically active population (EAP).9 The size of the EAP has been falling moderately since the third quarter of 2016, when, at the peak of a rising trend, it stood at 2,766,000. Furthermore, the age structure of the EAP has been changing, with the size of its 20-30 year cohort having decreased by more than 63,000 since the beginning of 2015 and the size of its 55-64 year cohort having in-creased by more than 32,000. Although these trends have been present for a longer period, they have become far more pronounced in the past ten years.
Shortages of skilled labour have been putting upward pressure on annual wage growth, which in the first half of 2018 averaged 7.2% in nominal terms and, despite rising inflation, 4.4% in real terms. Thus, the labour market situation and wage growth are now factors stimulating household demand for loans. At the same time, they are having a positive impact on house-holds’ debt servicing capacity, as reflected in low non-performing low ratios. Although the current outlook for the further development of wages and the labour market is positive, the risk going

20NBS
Financial Stability RepoRtNovemBer 2018
C H A P T E R 1
forward is that of a turn of the cycle and conse-quent deterioration in the labour market.
Firms are experienCing good times, with growth in their sales and proFits
The favourable economic situation has also been reflected in the performance of non-fi-nancial corporations, which reported increas-ing sales in the first half of 2018. Although sales growth was seen in all sectors of the econo-my, it was most pronounced in services, industry and construction. It is also these sectors, how-ever, which are usually the most sensitive to the economy’s cyclical trends. The economic expan-sion has also been reflected in corporate prof-its, which increased significantly in the second quarter of 2018. Thus, recent economic devel-opments have been supporting firms’ demand for loans, both for operational and investment purposes.
goods and serviCes priCes have been aCCelerating, and most goods and serviCes beCame more expensive in the First halF oF 2018The economy’s expansionary phase has be-gun having an impact on the price level, whose rate of increase has been accelerating continuously since 2017. Prices of most goods and services increased in the first half of 2018, and the annual inflation rate in June stood at 2.9 %. Food prices showed the largest increase, but energy inflation, too, after five years in negative territory, was increasing, as a result of rising oil prices. Headline inflation excluding energy also increased significantly, and its rate in June was 2.8%. The recent price level growth has therefore been higher than the average in-terest rate charged on certain types of loan (in particular, housing loans and loans to NFCs). This situation is stimulating private sector bor-rowing.

2
FINANCIAL SECTOR TRENDS
AND RISKS
C H A P T E R 2

22NBS
Financial Stability RepoRtNovemBer 2018
C H A P T E R 2
Chart 10 NBS Decree amendments were followed by loans being frontloaded in anticipation of new rules coming into force (Annual growth in total housing loans)
Source: NBS.
Chart 9 Household credit growth in Slovakia has in the past year continued to be the highest in the EU (percentages)
Source: ECB SDW.Note: The data show the relative rates of change in total loans to households between August 2012 and August 2018 and between August 2017 and August 2018. The chart excludes the data for Bel-gium, which are skewed by intragroup securitisations.
Growth for last six years Growth in last year (right-hand scale)
120
90
60
30
0
-30
SK CZ SE MT LU PL LT RO EE BG FR DE FI AT SI NL HR IT IE CY LV ES GR PL HU
12
9
6
3
0
-3
3.5
3.0
2.5
2.0
1.5
1.0
0.5
0.0
16
14
12
10
8
6
4
2
0
(%) (EUR billions)
Dec.
2012
June
2013
Dec.
2013
Jún
2014
Dec.
2014
June
2015
Dec.
2015
June
2016
Dec.
2016
June
2017
Dec.
2017
June
2018
NBS
Rec
omm
enda
tion
Stat
utor
y ca
p on
ear
ly re
paym
ent f
ees
Entr
y in
to fo
rce
of se
vera
l par
tsof
NBS
Dec
ree
on H
ousin
g Lo
ans
NBS
Dec
ree
on C
onsu
mer
Loa
ns
Amen
dmen
ts to
NBS
Dec
rees
Absolute year-on-year credit growthRelative year-on-year credit growth
2 FinanCial seCtor trends and risks
2.1 INCREASING HOUSEHOLD DEBT
Key trends in regard to household borrowing
• Housing loan growth remains the highest in the EU, and indebtedness is elevated.
• Household borrowing growth is outpacing economic fundamentals.
• Credit growth is being supported by sever-al long-term and one-off factors.
• In order to mitigate imbalances, NBS has made a number of changes to regulatory lending requirements.
household Credit growth has moderated, but remains strong
Household credit growth has remained the main trend in the Slovak credit market and is clearly higher than that in other EU countries. Household credit growth for past six years in Slo-vakia has been more than twice as high as the
EU’s second highest rate, in the Czech Republic. This trend continued in the last year, too. Even though the year-on-year increase in total house-hold loans in Slovakia has eased by 1.5 percent-age points, it has continued to outpace the rates in other central and eastern European (CEE) countries, as well in the rest of the EU.
The growth rate for total housing loans has been experiencing abrupt changes due to one-off market interventions, but neverthe-less remains elevated. One such change result-ed from market reaction to amendments to NBS Decrees on housing loans and consumer loans. Despite the central bank’s typically gradual ap-proach to the tightening of lending rules, the months before the first phase of tightening took effect were marked by an upsurge in lending ac-tivity that continued into the summer months.
Despite the tightening, total housing loans have in recent months remained close to their histor-ical highs for year-on-year absolute growth, and their annual rate of change in September 2018 stood at 11.5%.
23NBS
Financial Stability RepoRtNovemBer 2018
C H A P T E R 2
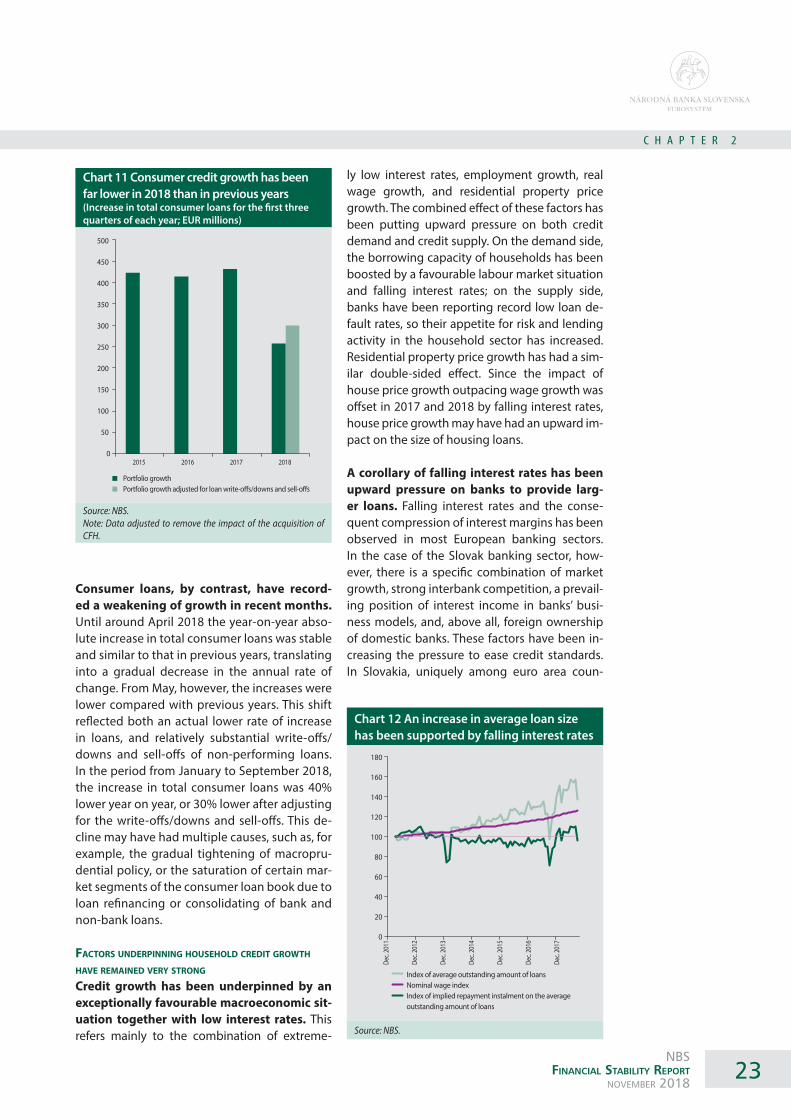
Chart 12 An increase in average loan size has been supported by falling interest rates
Source: NBS.
Chart 11 Consumer credit growth has been far lower in 2018 than in previous years(Increase in total consumer loans for the first three quarters of each year; EUR millions)
Source: NBS.Note: Data adjusted to remove the impact of the acquisition of CFH.
500
450
400
350
300
250
200
150
100
50
02015 2016 2017 2018
Portfolio growthPortfolio growth adjusted for loan write-o�s/downs and sell-o�s
Index of average outstanding amount of loansNominal wage indexIndex of implied repayment instalment on the averageoutstanding amount of loans
180
160
140
120
100
80
60
40
20
0
Dec.
2011
Dec.
2012
Dec.
2013
Dec.
2014
Dec.
2015
Dec.
2016
Dec.
2017
Consumer loans, by contrast, have record-ed a weakening of growth in recent months. Until around April 2018 the year-on-year abso-lute increase in total consumer loans was stable and similar to that in previous years, translating into a gradual decrease in the annual rate of change. From May, however, the increases were lower compared with previous years. This shift reflected both an actual lower rate of increase in loans, and relatively substantial write-offs/downs and sell-offs of non-performing loans. In the period from January to September 2018, the increase in total consumer loans was 40% lower year on year, or 30% lower after adjusting for the write-offs/downs and sell-offs. This de-cline may have had multiple causes, such as, for example, the gradual tightening of macropru-dential policy, or the saturation of certain mar-ket segments of the consumer loan book due to loan refinancing or consolidating of bank and non-bank loans.
FaCtors underpinning household Credit growth have remained very strong Credit growth has been underpinned by an exceptionally favourable macroeconomic sit-uation together with low interest rates. This refers mainly to the combination of extreme-
ly low interest rates, employment growth, real wage growth, and residential property price growth. The combined effect of these factors has been putting upward pressure on both credit demand and credit supply. On the demand side, the borrowing capacity of households has been boosted by a favourable labour market situation and falling interest rates; on the supply side, banks have been reporting record low loan de-fault rates, so their appetite for risk and lending activity in the household sector has increased. Residential property price growth has had a sim-ilar double-sided effect. Since the impact of house price growth outpacing wage growth was offset in 2017 and 2018 by falling interest rates, house price growth may have had an upward im-pact on the size of housing loans.
A corollary of falling interest rates has been upward pressure on banks to provide larg-er loans. Falling interest rates and the conse-quent compression of interest margins has been observed in most European banking sectors. In the case of the Slovak banking sector, how-ever, there is a specific combination of market growth, strong interbank competition, a prevail-ing position of interest income in banks’ busi-ness models, and, above all, foreign ownership of domestic banks. These factors have been in-creasing the pressure to ease credit standards. In Slovakia, uniquely among euro area coun-

24NBS
Financial Stability RepoRtNovemBer 2018
C H A P T E R 2
Chart 14 Weakening demographics will support a dampening of credit growth over the long term
Sources: NBS, SO SR and Infostat.Notes: The year-on-year increase in total credit is reduced by the increase in the average nominal wage. The simulation of the number of workers assumes no change in the current employ-ment rate.
Chart 13 Domestic banks have been maintaining high interest income despite interest margin compression (percentages)
Source: ECB.
90
80
70
60
50
40
30
20
10
0
Interest margin on new housing loans (SDW)
Ratio
of i
nter
est i
ncom
e to
tota
l inc
ome
(CBD
)
ATBE
CY
DE
EEES
FIFR
GR
IE
IT
LI
LU
LV
MT
NL
PT
SI
SK
0.0 0.5 1.0 1.5 2.0 2.5 3.0 3.5
Number of workers aged 25-44Number of workers aged 25-44 (simulation)Year-on-year credit growth adjusted for wage growth(right-hand scale)
1,400
1,350
1,300
1,250
1,200
1,150
1,100
1,050
1,000
Dec.
2003
Dec.
2004
Dec.
2005
Dec.
2006
Dec.
2007
Dec.
2008
Dec.
2009
Dec.
2010
Dec.
2011
Dec.
2012
Dec.
2013
Dec.
2014
Dec.
2015
Dec.
2016
Dec.
2017
Dec.
2018
Dec.
2019
Dec.
2020
Dec.
2021
Dec.
2022
Dec.
2023
Dec.
2024
Dec.
2025
Dec.
2026
Dec.
2027
2.0
1.8
1.6
1.4
1.2
1.0
0.8
0.6
0.4
0.2
0.0
(EUR billions) (thousands)
tries, banks face a combination of low interest margins and a high share of interest income in their profits, which is naturally causing excessive lending growth.
NBS measures and certain long-term factors have been the principal curbs on excessive credit growth. Regulatory limits on retail lend-ing have been the main counterweight to ex-cessive credit growth. In the context of falling interest rates, an important step has been to set for household borrowers a maximum loan term and a maximum debt-to-income ratio (i.e. to set a ceiling on the ratio of a borrower’s total out-standing loans to the borrower’s annual income). Another limit, which is contingent on the size of a household’s savings, is that on the loan-to-value (LTV) ratio. As for the long-term view, the household credit market is starting to be affect-ed by unfavourable demographic developments and by gradual saturation of household borrow-ing. Even assuming that employment continues its current, exceptionally strong trend, the num-ber of workers in the core age group of borrow-ers will gradually decline and, consequently, so will credit demand.
indebtedness has Continued to inCrease during 2018Household debt growth in Slovakia in 2018 has been the highest in the EU in 2018. The increase is not only higher in year-on-year terms, but also as a ratio to GDP. Furthermore, Slova-kia’s ratio of household debt to GDP has been among the highest in the EU for several years now, as is consistent with the country’s mul-ti-year leading ranking for credit growth. On the other hand, the increases in the household debt ratio in Slovakia have still been lower than those seen in most EU countries in the 2005-06 period, including in such countries as Austria, Belgium and France.
Slovak households’ sensitivity is heightened by the fact that the ratio of their net financial assets to GDP is the lowest in the EU. Because they have insufficient liquid assets, Slovak households have diminishing scope to cope with a loss of in-come. To a large extent, however, this is related to a structural feature of Slovak households.
In Slovakia, housing loans are concentrated among lower-income households to a greater extent than in the EU as a whole. Household indebtedness in Slovakia remains lower than the EU average in terms of both the debt-to-GDP ratio and the share of households that have a loan. According to Eurostat data, Slovakia is

25NBS
Financial Stability RepoRtNovemBer 2018
C H A P T E R 2
Chart 16 In Slovakia, the concentration of housing loans among households whose income is less than 60% of the median is far higher than the EU average
Sources: Eurostat and EU SILC.Note: The data are for 2017.
Chart 15 Slovak households have been reporting the highest debt growth while having limited net financial assets
Source: Eurostat.
Chart 17 The share of Slovak households that have a housing loan could in the long term rise as high as 52%
Source: Eurostat.Note: The data are for 2017.
250
200
150
100
50
0
Change in debt-to-GDP ratio from December 2016 to March 2018
Net
�na
ncia
l ass
ets-
to-G
DP
ratio
UK
SE
FI
SK
SI
RO
PT
PL
AT
NL
MT
HULU
LT
LV
IT
CR
FR
ES
GR
IE EE
DE
DK
CZ
BG
BE
-7.0 -6.0 -5.0 -4.0 -3.0 -2.0 -1.0 0.0 1.0 2.0 3.0 4.0
(%)
(p.p.)
25.0
20.0
15.0
10.0
5.0
0.0
Share of households with a housing loan in total households
Shar
e of
hou
seho
lds
with
a h
ousi
ng lo
an in
hou
seho
lds
who
se in
com
e is
bel
ow 6
0% o
f the
med
ian
BE
BG
CZ
DK
DE
EE
GR
ES
FR
HR
ITCY
LVLT
HU
MT
NL
AT
PL
PT
RO
SI
SK FI
SE
NO
0.0 10.0 20.0 30.0 40.0 50.0 60.0 70.0
Percentage of total households that are owner-occupierswithout a housing loanPercentage of total households that are owner-occupierswith a housing loan
100
90
80
70
60
50
40
30
20
10
0DE AT FR NL BE LU SK
still a country with relatively low housing loan penetration across the population as a whole. From a financial stability perspective, however, it is important to break down the debt by in-come group. In Slovakia, compared with other EU countries, households whose income is less
than 60% of the national median and whose ac-commodation is financed with a housing loan is relatively higher compared to the total share of households whose accommodation is financed with a housing loan. In other words, in Slova-kia, households with a housing loan make up a share of total households which is lower than the EU average, but a greater proportion of those households belong to the low-income category. Similar housing loan distributions are found in, for example, Greece, Hungary, Spain and Por-tugal. The percentage of households that have a housing loan and an income below 60% of the median is higher in Slovakia than in any other CEE country, and also higher than in, for exam-ple, Germany, Austria and Italy.
This may be partly explained by looser credit standards in Slovakia or by the fact that hous-ing loans are concentrated among the younger demographic group that overlaps with the low-er-income group.
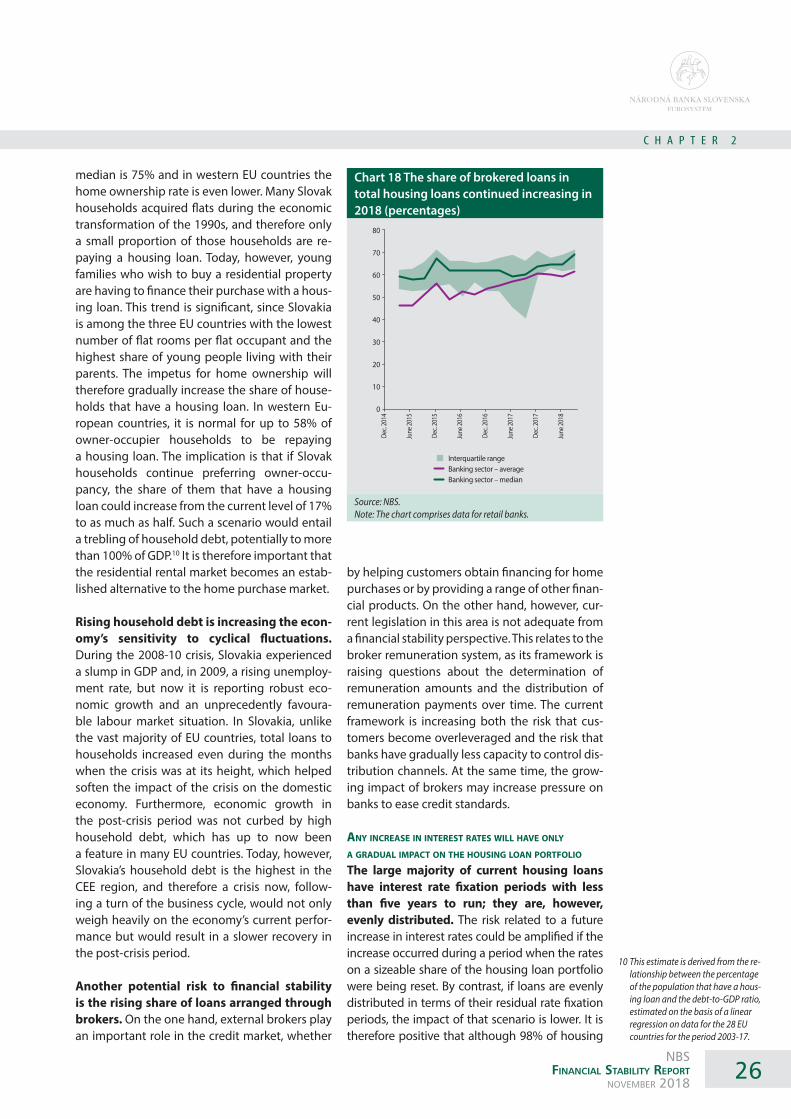
The currently high home ownership rate in Slovakia could in future result in extreme levels of household debt. A feature of Slovak households is their elevated home ownership rate. In Slovakia, fully 90% of households are owner-occupiers, while in the EU as a whole the
26NBS
Financial Stability RepoRtNovemBer 2018
C H A P T E R 2
Chart 18 The share of brokered loans in total housing loans continued increasing in 2018 (percentages)
Source: NBS.Note: The chart comprises data for retail banks.
Interquartile rangeBanking sector – averageBanking sector – median
80
70
60
50
40
30
20
10
0
Dec.
2014
June
2015
Dec.
2015
June
2016
Dec.
2016
June
2017
Dec.
2017
June
2018
median is 75% and in western EU countries the home ownership rate is even lower. Many Slovak households acquired flats during the economic transformation of the 1990s, and therefore only a small proportion of those households are re-paying a housing loan. Today, however, young families who wish to buy a residential property are having to finance their purchase with a hous-ing loan. This trend is significant, since Slovakia is among the three EU countries with the lowest number of flat rooms per flat occupant and the highest share of young people living with their parents. The impetus for home ownership will therefore gradually increase the share of house-holds that have a housing loan. In western Eu-ropean countries, it is normal for up to 58% of owner-occupier households to be repaying a housing loan. The implication is that if Slovak households continue preferring owner-occu-pancy, the share of them that have a housing loan could increase from the current level of 17% to as much as half. Such a scenario would entail a trebling of household debt, potentially to more than 100% of GDP.10 It is therefore important that the residential rental market becomes an estab-lished alternative to the home purchase market.
Rising household debt is increasing the econ-omy’s sensitivity to cyclical fluctuations. During the 2008-10 crisis, Slovakia experienced a slump in GDP and, in 2009, a rising unemploy-ment rate, but now it is reporting robust eco-nomic growth and an unprecedently favoura-ble labour market situation. In Slovakia, unlike the vast majority of EU countries, total loans to households increased even during the months when the crisis was at its height, which helped soften the impact of the crisis on the domestic economy. Furthermore, economic growth in the post-crisis period was not curbed by high household debt, which has up to now been a feature in many EU countries. Today, however, Slovakia’s household debt is the highest in the CEE region, and therefore a crisis now, follow-ing a turn of the business cycle, would not only weigh heavily on the economy’s current perfor-mance but would result in a slower recovery in the post-crisis period.
Another potential risk to financial stability is the rising share of loans arranged through brokers. On the one hand, external brokers play an important role in the credit market, whether
10 This estimate is derived from the re-lationship between the percentage of the population that have a hous-ing loan and the debt-to-GDP ratio, estimated on the basis of a linear regression on data for the 28 EU countries for the period 2003-17.
by helping customers obtain financing for home purchases or by providing a range of other finan-cial products. On the other hand, however, cur-rent legislation in this area is not adequate from a financial stability perspective. This relates to the broker remuneration system, as its framework is raising questions about the determination of remuneration amounts and the distribution of remuneration payments over time. The current framework is increasing both the risk that cus-tomers become overleveraged and the risk that banks have gradually less capacity to control dis-tribution channels. At the same time, the grow-ing impact of brokers may increase pressure on banks to ease credit standards.
any inCrease in interest rates will have only a gradual impaCt on the housing loan portFolio The large majority of current housing loans have interest rate fixation periods with less than five years to run; they are, however, evenly distributed. The risk related to a future increase in interest rates could be amplified if the increase occurred during a period when the rates on a sizeable share of the housing loan portfolio were being reset. By contrast, if loans are evenly distributed in terms of their residual rate fixation periods, the impact of that scenario is lower. It is therefore positive that although 98% of housing

27NBS
Financial Stability RepoRtNovemBer 2018
C H A P T E R 2
Chart 20 The growth rate of prices of existing flats in Slovakia has remained stable (percentages)(Year-on-year increase in prices of flats in Slovak regions)
Source: CMN.
Chart 19 The resetting of housing loan interest rates will be evenly distributed over the next five years (Distribution of housing loans by residual interest rate fixation period as at September 2018; EUR billions)
Source: NBS.
6
5
4
3
2
1
0Up to 1 year 1-2 years 2-3 years 3-4 years 4-5 years Over 5 years
Interquartile rangeMedianAverage
20
18
16
14
12
10
8
6
4
2
0
Jan.
2015
Apr. 2
015
July
2015
Oct. 2
015
Jan.
2016
Apr. 2
016
July
2016
Oct. 2
016
Jan.
2017
Apr. 2
017
July
2017
Oct. 2
017
Jan.
2018
Apr. 2
018
July
2018
loans have residual rate fixation periods of less than five years, these loans have a relatively uni-form distribution. As a result, each of the next five years should see the resetting of interest rates on around one-fifth of the current housing loan port-folio. Where there are years with a slightly higher share, it will probably be the result of anniversa-ries of certain changes in the market, such as the introduction of a cap on early repayment fees for housing loans (2016) or expectations of the im-pact of amendments to NBS Decrees (2018).
As regards new lending business, almost all new loans are provided at an interest rate that is fixed for a period of not less than one year and not more than five years. In the case of housing loans, however, borrowers are assessed against a stressed interest of two percentage points, to ensure they have a financial buffer if interest rates rise. Therefore, most of the housing loans in banks’ portfolios have either included this test, or were provided before 2015, when interest rates, on average, were at least 1.5 percentage points higher than they are now.
ongoing growth trends in the property market
Prices of new-build flats in Bratislava have maintained their growth trend and are grad-
ually approaching pre-crisis levels. Prices of flats free for sale increased 8.7%, year on year, in the third quarter of 2018, while prices of sold new-builds increased even more, by 9.4%. The recent growth in prices of flats free for sale has been due to higher prices of new property de-velopments (or their parts) coming on to the market, a decreasing number of cheaper flats on the market, and the upward repricing of flats in existing developments.
The price growth reflects strong demand for new builds in conjunction with falling sup-ply. Despite a year-on-year fall in units sold, demand for new builds remains elevated amid falling supply and a tightening of financing conditions for property purchases. The ratio of sales to total supply is at historically high levels, while the velocity of property develop-ment sales has remained similar to its level in the previous period. Thus, the main factors un-derpinning demand continue to be macroeco-nomic conditions and low interest rates. In 2018 demand outpaced supply, and consequently the number of new-build flats on the market decreased by 24% during the period under re-view. Supply fell because the number of new-build flats sold was far higher than the number

28NBS
Financial Stability RepoRtNovemBer 2018
C H A P T E R 2
Chart 21 The credit risk cost ratio has fallen to a historical low (percentages)
Source: NBS.Note: The credit risk cost ratio is calculated as the ratio between, on the one hand, costs related to loan loss provisioning, to loan write-offs/downs and sell-offs, and to creating reserves for the previous 12 months, and, on the other hand, the average stock of loans for that period.
1.0
0.9
0.8
0.7
0.6
0.5
0.4
0.3
0.2
0.1
0.0
Dec.
2013
Mar
. 201
4Ju
ne 20
14Se
p. 20
14De
c. 20
14M
ar. 2
015
June
2015
Sep.
2015
Dec.
2015
Mar
. 201
6Ju
ne 20
16Se
p. 20
16De
c. 20
16M
ar. 2
017
June
2017
Sep.
2017
De
c. 20
17M
ar. 2
018
June
2018
Sep.
2018
coming on to the market. In fact, the number sold fell by 15%, year on year, in the first three quarters of 2018, while the number coming on to the market slumped by 42%. This trend may be indicative of increasing uncertainty and cau-tion among developers.
Prices of existing flats in Slovakia have con-tinued increasing at a stable pace, although there were breaks in that trend in certain seg-ments of the market. Prices of existing flats in Slovakia have for more than two years been in-creasing at around 10% year on year, while the number of such properties on the market has fallen sharply. The growth trend has remained relatively homogenous across Slovak regions and flat sizes.
In certain segments of the market, however, especially in Bratislava, there have been signs of a slowdown in property price growth. These trends will probably remain present, given the phasing-in of NBS Decrees.
2.2 BUSINESS MODEL SUSTAINABILITY OF FINANCIAL INSTITUTIONS
Key trends
• Banks have in recent years managed to maintain profitability only at the cost of combining rapid credit growth with a de-crease in credit risk costs.
• The current low level of loan impairment losses may not, however, be sustainable over the long term; their adverse impact is constantly increasing owing to the rapidly increasing credit portfolio.
• The pressure of low interest rates is also being felt by other financial market seg-ments.
• Financial institutions are responding to falling interest income by increasing op-erational efficiency, increasing fee genera-tion capacity, and extending product port-folios and access to new customers.
The low interest rate environment is putting strong pressure on the sustainability of fi-nancial institutions’ business models. This is particularly evident in the banking sector, where
net interest income constitutes more than three quarters of total gross income. Banks have been ramping up their lending activity in order to com-pensate for ongoing interest margin compres-sion accompanied by strong interbank competi-tion. This approach is also related to the fact that domestic banks are under pressure from parent undertakings to maintain a high level of profita-bility. Although the banking sector’s profitability has remained broadly stable and is among the highest in the EU’s banking union, its sensitivity to any deterioration in the economic situation is gradually increasing. It can also be expected that there will be less and less scope for robust retail credit growth in the longer term, given the ef-fects of gradual market saturation, demographic trends (Chart 14), and measures taken by NBS to mitigate the risk of excessive credit growth. It is therefore assumed that in terms of profitability, the lead that significant banks in Slovakia have over other significant banks in the banking un-ion will gradually diminish.
Banks have so far managed to maintain prof-itability levels thanks mainly to falling credit risk costs. The Slovak banking sector’s credit risk cost ratio has fallen significantly over the past three years and is now at a historical low. The ra-

29NBS
Financial Stability RepoRtNovemBer 2018
C H A P T E R 2
Chart 22 Sensitivity to credit risk growth is gradually increasing (percentages)(Estimated impact on banks’ net profit of an increase in the credit risk cost ratio)
Source: NBS.
0
-5
-10
-15
-20
-25
Dec.
2013
June
2014
Dec.
2014
June
2015
Dec.
2015
June
2016
Dec.
2016
June
2017
Dec.
2017
June
2018
Dec.
2018
June
2019
Dec.
2019
June
2020
Dec.
2020
June
2021
Dec.
2021
Impact of a 0.1 p.p. risein the credit risk costratio
Impact of the creditrisk cost ratio risingto its 2016 level
Simulation
tio of credit risk costs to total loans is less than 0.4% per year. It can be assumed, however, that such a low credit risk cost ratio is unsustainable in the long term, especially if the economic sit-uation deteriorates. The risk to business model sustainability is even greater for less significant banks, which have higher credit risk costs and less leeway to modify their business model.
Banks’ sensitivity to credit risk growth has been gradually increasing. At present, an in-crease of 0.1 percentage point in the banking sector’s credit risk cost ratio would cause a 7% decline in its net profit. Given increasing sensi-tivity, the impact of such increase could rise to as much as 10% of the net profit.
The significance of falling credit risk costs in is illustrated by a simple sensitivity analysis. If the credit risk cost ratio increased to its 2016 lev-el (0.6%), the banking sector’s net profit would be 17% lower than its current level. On current trends, this impact becomes more pronounced over the period until 2021, when it reduces the profit by almost a quarter.
Low interest rates are also having an adverse impact on other segments of the financial mar-ket. In the pension fund sector, the ratio of funds’ interest income to their net asset value (NAV) has
been gradually declining. Back in 2011 this ratio stood 2% in the second pillar and even higher in third pillar. Since then, however, it has been grad-ually declining, down to 0.8% in both pillars (an-nualised data as at 30 June 2018). Pension funds have therefore gradually had to offset the decline in their interest income with other sources of in-come (mainly through asset repricing). Unlike in-terest income, however, these sources are more volatile, hence the increasing riskiness of invest-ments. The generation of interest income itself is linked with higher risk, given that the increase in the duration of pension funds’ bond portfolio has made the real value of that portfolio more sensi-tive to interest rate movements. In the life insur-ance sector there is a long-running risk that falling returns on assets will not be sufficient to cover returns guaranteed under life insurance contracts.
banks have sought to Compensate For Falling interest inCome One way to compensate for interest mar-gin compression is to increase operational efficiency. The number of bank branches has decreased by 6% over the past two years, and a similar trend has been observed at the level of the EU as a whole. The majority of domestic banks have been engaged in streamlining their branch networks, and this activity has been most in evidence among the banks with the largest networks. As a result, several banks have reduced their number of employees. These efforts to opti-mise branch networks are being made even while demand for loans remains elevated. At the same time, however, the impact of fewer brick-and-mortar branches is being offset, as banks make increasing use of financial brokers. The share of brokered loans in total new loans has risen over the past two years, from 53% to 59%. The trim-ming of the total number of branches was further supported by the mid-2017 merger of Sberbank Slovensko with Prima banka, where previously the two banks had been operating separately as part of the same group. Such rationalising of operations has not been confined to the banking sector. In April 2018 there was a merger of the in-surance undertakings Kooperatíva and Poisťovňa Slovenskej sporiteľne, which previously had also been operating as part of the same group.
Another aspect of efforts to increase operation-al efficiency is the increasing extent of process digitisation and automatisation. At the same

30NBS
Financial Stability RepoRtNovemBer 2018
C H A P T E R 2
Chart 23 The importance of fee income is gradually increasing, but remains below the EU average (percentages)(Ratio of net fee income to the sum of net interest income and net fee income)
Sources: ECB SDW and NBS.Note: 1) The data shown for 2018 are for August 2018.
Table 1 Share of total households investing in particular investment vehicles
EU
(2013)SK
(2013)SK
(2016)
Voluntary pension insurance or whole life insurance
30.3% 15.5% NA
Investment funds 9.4% 2.0% 4.0%
Bonds 4.6% 0.3% 0.8%Source: HFCS.Note: Data for Slovakia for 2016 are provisional and may be subject to revision.
35
30
25
20
15
10
5
0
2009
2010
2011
2012
2013
2014
2015
2016
2017
2018
1)
EU
SK
time, institutions are modifying their fee schemes so as to incentivise customers to make greater use of services that are more amenable to digitisation than services requiring manual activity.
In the area of digital innovation, however, fi-nancial institutions are exposed to increasing competition from firms outside the regulated financial market, notably from those firms in the information technology sector which are in-creasingly focusing on the provision of financial services via financial technology (fintech). Their activity in the Slovak market centres on payment services, peer-to-peer lending, and virtual cur-rencies. Financial innovation can help improve financial products and services in terms of their quality, availability, diversity and prices. From a financial stability perspective, however, fintech companies may represent a risk at multiple lev-els. Besides the impact that direct competition with fintech companies will have on the business strategy of financial institutions, the risks mainly concern financial consumer protection, regula-tory arbitrage and the need to amend the regu-latory framework, and operational risk.
Financial institutions are also focusing on how to improve their ability to generate fee
income and other income not directly de-pendent on interest rate movements. In the Slovak banking sector, the ratio of interest in-come to fee income is now 3:1. The importance of fee income has been rising continuously; the ratio of interest income to fee income was 4:1 four years ago. Nevertheless, the share of fee income in total income remains lower than the average in the EU, where the ratio of interest in-come to fee income stands at 2:1.
The trend decline in the importance of interest income is to some extent a natural consequence of interest margin compression. At the same time, however, financial institutions have been expand-ing their portfolio of products and services, target-ing on those that will generate higher fee income, in particular products related to bancassurance and asset management. Examples include prod-ucts combining a deposit and investment fund investment or the intermediation of investments in corporate or bank bonds. It is assumed that demand for such products will be increasing – owing partly to their currently low penetration of the Slovak market, compared with the EU average (Table 1), and partly to the expected long-term trend of population aging, which will see increas-ing demand for investment/savings products.
Financial institutions are also striving to tap new customer segments, to establish alter-native distribution channels, and to expand product portfolios. This is evident from several of the commercial activities that financial institu-tions have recently performed, are still perform-ing, or plan to perform in the near future. Insti-tutions are conducting this expansion in three ways: first, by the acquisition of firms whose
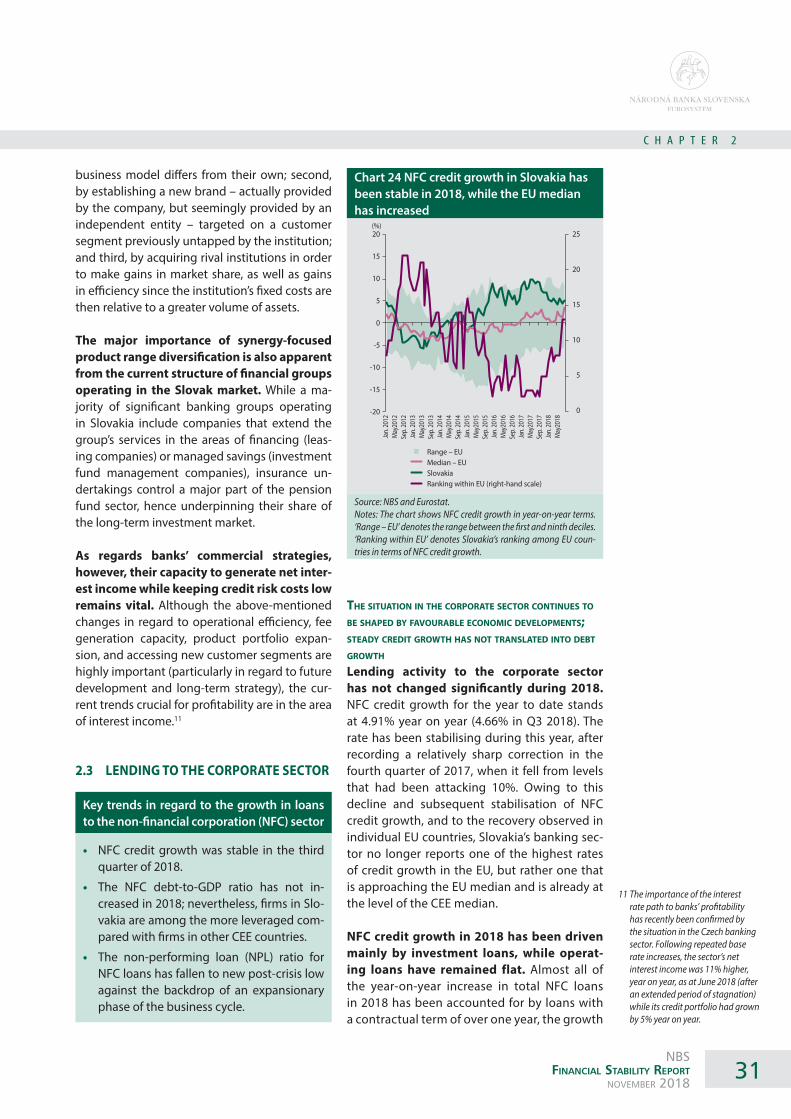
31NBS
Financial Stability RepoRtNovemBer 2018
C H A P T E R 2
Chart 24 NFC credit growth in Slovakia has been stable in 2018, while the EU median has increased
Source: NBS and Eurostat.Notes: The chart shows NFC credit growth in year-on-year terms. ‘Range – EU’ denotes the range between the first and ninth deciles. ‘Ranking within EU’ denotes Slovakia’s ranking among EU coun-tries in terms of NFC credit growth.
20
15
10
5
0
-5
-10
-15
-20
25
20
15
10
5
0
Range – EUMedian – EUSlovakiaRanking within EU (right-hand scale)
Jan.
2012
May
2012
Sep.
2012
Jan.
2013
May
2013
Sep.
2013
Jan.
2014
May
2014
Sep.
2014
Jan.
2015
May
2015
Sep.
2015
Jan.
2016
May
2016
Sep.
2016
Jan.
2017
May
2017
Sep.
2017
Jan.
2018
May
2018
(%)
business model differs from their own; second, by establishing a new brand – actually provided by the company, but seemingly provided by an independent entity – targeted on a customer segment previously untapped by the institution; and third, by acquiring rival institutions in order to make gains in market share, as well as gains in efficiency since the institution’s fixed costs are then relative to a greater volume of assets.
The major importance of synergy-focused product range diversification is also apparent from the current structure of financial groups operating in the Slovak market. While a ma-jority of significant banking groups operating in Slovakia include companies that extend the group’s services in the areas of financing (leas-ing companies) or managed savings (investment fund management companies), insurance un-dertakings control a major part of the pension fund sector, hence underpinning their share of the long-term investment market.
As regards banks’ commercial strategies, however, their capacity to generate net inter-est income while keeping credit risk costs low remains vital. Although the above-mentioned changes in regard to operational efficiency, fee generation capacity, product portfolio expan-sion, and accessing new customer segments are highly important (particularly in regard to future development and long-term strategy), the cur-rent trends crucial for profitability are in the area of interest income.11
2.3 LENDING TO THE CORPORATE SECTOR
Key trends in regard to the growth in loans to the non-financial corporation (NFC) sector
• NFC credit growth was stable in the third quarter of 2018.
• The NFC debt-to-GDP ratio has not in-creased in 2018; nevertheless, firms in Slo-vakia are among the more leveraged com-pared with firms in other CEE countries.
• The non-performing loan (NPL) ratio for NFC loans has fallen to new post-crisis low against the backdrop of an expansionary phase of the business cycle.
the situation in the Corporate seCtor Continues to be shaped by Favourable eConomiC developments; steady Credit growth has not translated into debt growth Lending activity to the corporate sector has not changed significantly during 2018. NFC credit growth for the year to date stands at 4.91% year on year (4.66% in Q3 2018). The rate has been stabilising during this year, after recording a relatively sharp correction in the fourth quarter of 2017, when it fell from levels that had been attacking 10%. Owing to this decline and subsequent stabilisation of NFC credit growth, and to the recovery observed in individual EU countries, Slovakia’s banking sec-tor no longer reports one of the highest rates of credit growth in the EU, but rather one that is approaching the EU median and is already at the level of the CEE median.
NFC credit growth in 2018 has been driven mainly by investment loans, while operat-ing loans have remained flat. Almost all of the year-on-year increase in total NFC loans in 2018 has been accounted for by loans with a contractual term of over one year, the growth
11 The importance of the interest rate path to banks’ profitability has recently been confirmed by the situation in the Czech banking sector. Following repeated base rate increases, the sector’s net interest income was 11% higher, year on year, as at June 2018 (after an extended period of stagnation) while its credit portfolio had grown by 5% year on year.
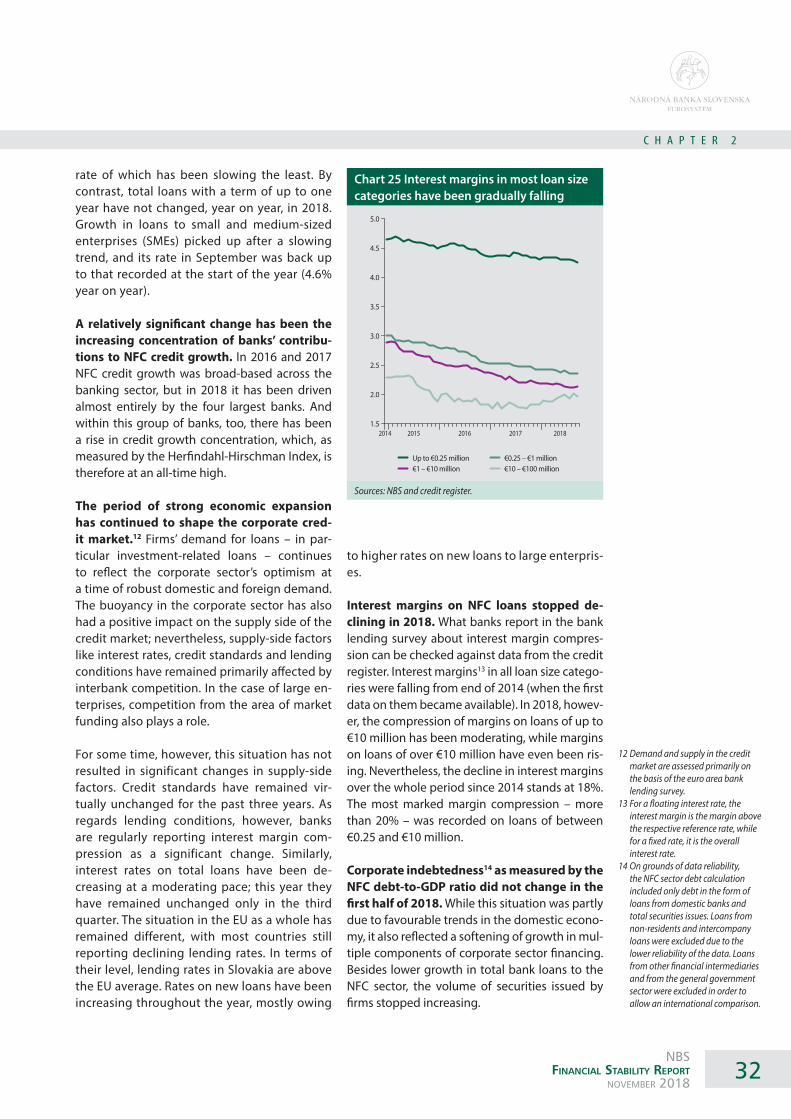
32NBS
Financial Stability RepoRtNovemBer 2018
C H A P T E R 2
Chart 25 Interest margins in most loan size categories have been gradually falling
Sources: NBS and credit register.
5.0
4.5
4.0
3.5
3.0
2.5
2.0
1.5
Up to €0.25 million€1 – €10 million
€0.25 – €1 million€10 – €100 million
20152014 2016 2017 2018
rate of which has been slowing the least. By contrast, total loans with a term of up to one year have not changed, year on year, in 2018. Growth in loans to small and medium-sized enterprises (SMEs) picked up after a slowing trend, and its rate in September was back up to that recorded at the start of the year (4.6% year on year).
A relatively significant change has been the increasing concentration of banks’ contribu-tions to NFC credit growth. In 2016 and 2017 NFC credit growth was broad-based across the banking sector, but in 2018 it has been driven almost entirely by the four largest banks. And within this group of banks, too, there has been a rise in credit growth concentration, which, as measured by the Herfindahl-Hirschman Index, is therefore at an all-time high.
The period of strong economic expansion has continued to shape the corporate cred-it market.12 Firms’ demand for loans – in par-ticular investment-related loans – continues to reflect the corporate sector’s optimism at a time of robust domestic and foreign demand. The buoyancy in the corporate sector has also had a positive impact on the supply side of the credit market; nevertheless, supply-side factors like interest rates, credit standards and lending conditions have remained primarily affected by interbank competition. In the case of large en-terprises, competition from the area of market funding also plays a role.
For some time, however, this situation has not resulted in significant changes in supply-side factors. Credit standards have remained vir-tually unchanged for the past three years. As regards lending conditions, however, banks are regularly reporting interest margin com-pression as a significant change. Similarly, interest rates on total loans have been de-creasing at a moderating pace; this year they have remained unchanged only in the third quarter. The situation in the EU as a whole has remained different, with most countries still reporting declining lending rates. In terms of their level, lending rates in Slovakia are above the EU average. Rates on new loans have been increasing throughout the year, mostly owing
to higher rates on new loans to large enterpris-es.
Interest margins on NFC loans stopped de-clining in 2018. What banks report in the bank lending survey about interest margin compres-sion can be checked against data from the credit register. Interest margins13 in all loan size catego-ries were falling from end of 2014 (when the first data on them became available). In 2018, howev-er, the compression of margins on loans of up to €10 million has been moderating, while margins on loans of over €10 million have even been ris-ing. Nevertheless, the decline in interest margins over the whole period since 2014 stands at 18%. The most marked margin compression – more than 20% – was recorded on loans of between €0.25 and €10 million.
Corporate indebtedness14 as measured by the NFC debt-to-GDP ratio did not change in the first half of 2018. While this situation was partly due to favourable trends in the domestic econo-my, it also reflected a softening of growth in mul-tiple components of corporate sector financing. Besides lower growth in total bank loans to the NFC sector, the volume of securities issued by firms stopped increasing.
12 Demand and supply in the credit market are assessed primarily on the basis of the euro area bank lending survey.
13 For a floating interest rate, the interest margin is the margin above the respective reference rate, while for a fixed rate, it is the overall interest rate.
14 On grounds of data reliability, the NFC sector debt calculation included only debt in the form of loans from domestic banks and total securities issues. Loans from non-residents and intercompany loans were excluded due to the lower reliability of the data. Loans from other financial intermediaries and from the general government sector were excluded in order to allow an international comparison.

33NBS
Financial Stability RepoRtNovemBer 2018
C H A P T E R 2
Chart 26 Corporate indebtedness is higher in Slovakia than in surrounding countries (percentages)
Sources: ECB SDW and EUROSTAT. Note: Indebtedness is calculated as the ratio to GDP of total NFC loans from domestic banks and total securities issued by the cor-porate sector.
Chart 27 NPL ratio and default rate for NFC loans (percentages)
Source: NBS. Note: The right-hand scale shows the three-month moving aver-age of the default rate for NFC loans, measured on the basis of the number of loans. The chart shows the average and interquartile range across economic sectors.
70
60
50
40
30
20
10
0
Min-max range – CEEMedian – EU
SlovakiaMedian – CEE
2006
2007
2008
2009
2010
2011
2012
2013
2014
2015
2016
2017
2018
Range AverageNPL ratio (right-hand scale)
14
12
10
8
6
4
2
0
10
9
8
7
6
5
4
3
2
1
0
Mar
. 200
6Se
p. 20
06M
ar. 2
007
Sep.
2007
Mar
. 200
8Se
p. 20
08M
ar. 2
009
Sep.
2009
Mar
. 201
0Se
p. 20
10M
ar. 2
011
Sep.
2011
Mar
. 201
2Se
p. 20
12M
ar. 2
013
Sep.
2013
Mar
. 201
4Se
p. 20
14M
ar. 2
015
Sep.
2015
Mar
. 201
6Se
p. 20
16M
ar. 2
017
Sep.
2017
Mar
. 201
8Se
p. 20
18
Corporate debt in Slovakia remains, how-ever, higher than that in surrounding coun-tries. Although their debt-to-GDP ratio has stopped rising this year, Slovak firms are over-leveraged compared with firms in other CEE countries. This is because in most EU coun-tries – as well as in the EU as a whole – overall corporate debt has been maintaining a down-ward trend.
the expansionary phase oF the business CyCle has Continued to have a signiFiCant impaCt on Firms’ debt serviCing CapaCity The credit quality of the banking sector’s cor-porate loan book continues to improve in the third quarter of 2018. The period under review saw a continuation of the factors that were put-ting downward pressure on the non-perform-ing loan ratio: NFC credit growth; low default rates; and a substantial volume of loans reclas-sified from impaired to performing. As a result, the NPL ratio for NFC loans decreased further, down to 4.17% as at September 2018. This oc-curred despite a slight increase in the amount of NPLs, which, however, was heavily concentrated among certain banks.
2.4 LENDING TO THE COMMERCIAL REAL ESTATE (CRE) SECTOR
Key trends in the CRE portfolio
• The CRE market remains in an expansionary phase.
• Banks’ approach to CRE lending has been more cautious than it was in the pre-crisis period.
• This portfolio nevertheless remains a major source of risk.
• Investment funds and households also have relatively high direct exposure to the CRE sector.
the Cre market has Continued showing growth trends Trends supporting an acceleration of the CRE market’s expansionary phase have been con-tinuing. The signs of an overheating economy and the low interest rate environment have continued to shape developments in the CRE market. The first half of the year saw positive
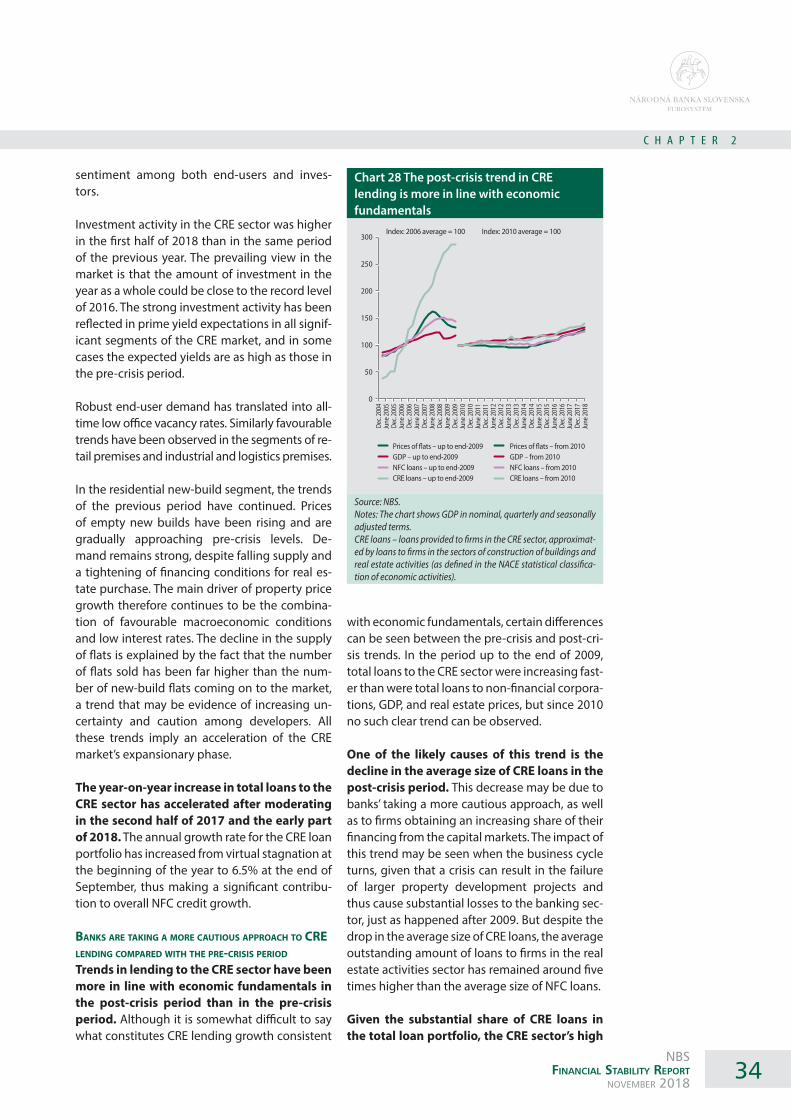
34NBS
Financial Stability RepoRtNovemBer 2018
C H A P T E R 2
Chart 28 The post-crisis trend in CRE lending is more in line with economic fundamentals
Source: NBS.Notes: The chart shows GDP in nominal, quarterly and seasonally adjusted terms. CRE loans – loans provided to firms in the CRE sector, approximat-ed by loans to firms in the sectors of construction of buildings and real estate activities (as defined in the NACE statistical classifica-tion of economic activities).
Prices of �ats – up to end-2009GDP – up to end-2009NFC loans – up to end-2009CRE loans – up to end-2009
Index: 2006 average = 100 Index: 2010 average = 100300
250
200
150
100
50
0
Dec.
2004
June
2005
Dec.
2005
June
2006
Dec.
2006
June
2007
Dec.
2007
June
2008
Dec.
2008
June
2009
Dec.
2009
June
2010
Dec.
2010
June
2011
Dec.
2011
June
2012
Dec.
2012
June
2013
Dec.
2013
June
2014
Dec.
2014
June
2015
Dec.
2015
June
2016
Dec.
2016
June
2017
Dec.
2017
June
2018
Prices of �ats – from 2010GDP – from 2010NFC loans – from 2010CRE loans – from 2010
sentiment among both end-users and inves-tors.
Investment activity in the CRE sector was higher in the first half of 2018 than in the same period of the previous year. The prevailing view in the market is that the amount of investment in the year as a whole could be close to the record level of 2016. The strong investment activity has been reflected in prime yield expectations in all signif-icant segments of the CRE market, and in some cases the expected yields are as high as those in the pre-crisis period.
Robust end-user demand has translated into all-time low office vacancy rates. Similarly favourable trends have been observed in the segments of re-tail premises and industrial and logistics premises.
In the residential new-build segment, the trends of the previous period have continued. Prices of empty new builds have been rising and are gradually approaching pre-crisis levels. De-mand remains strong, despite falling supply and a tightening of financing conditions for real es-tate purchase. The main driver of property price growth therefore continues to be the combina-tion of favourable macroeconomic conditions and low interest rates. The decline in the supply of flats is explained by the fact that the number of flats sold has been far higher than the num-ber of new-build flats coming on to the market, a trend that may be evidence of increasing un-certainty and caution among developers. All these trends imply an acceleration of the CRE market’s expansionary phase.
The year-on-year increase in total loans to the CRE sector has accelerated after moderating in the second half of 2017 and the early part of 2018. The annual growth rate for the CRE loan portfolio has increased from virtual stagnation at the beginning of the year to 6.5% at the end of September, thus making a significant contribu-tion to overall NFC credit growth.
banks are taking a more Cautious approaCh to Cre lending Compared with the pre-Crisis period Trends in lending to the CRE sector have been more in line with economic fundamentals in the post-crisis period than in the pre-crisis period. Although it is somewhat difficult to say what constitutes CRE lending growth consistent
with economic fundamentals, certain differences can be seen between the pre-crisis and post-cri-sis trends. In the period up to the end of 2009, total loans to the CRE sector were increasing fast-er than were total loans to non-financial corpora-tions, GDP, and real estate prices, but since 2010 no such clear trend can be observed.
One of the likely causes of this trend is the decline in the average size of CRE loans in the post-crisis period. This decrease may be due to banks’ taking a more cautious approach, as well as to firms obtaining an increasing share of their financing from the capital markets. The impact of this trend may be seen when the business cycle turns, given that a crisis can result in the failure of larger property development projects and thus cause substantial losses to the banking sec-tor, just as happened after 2009. But despite the drop in the average size of CRE loans, the average outstanding amount of loans to firms in the real estate activities sector has remained around five times higher than the average size of NFC loans.
Given the substantial share of CRE loans in the total loan portfolio, the CRE sector’s high
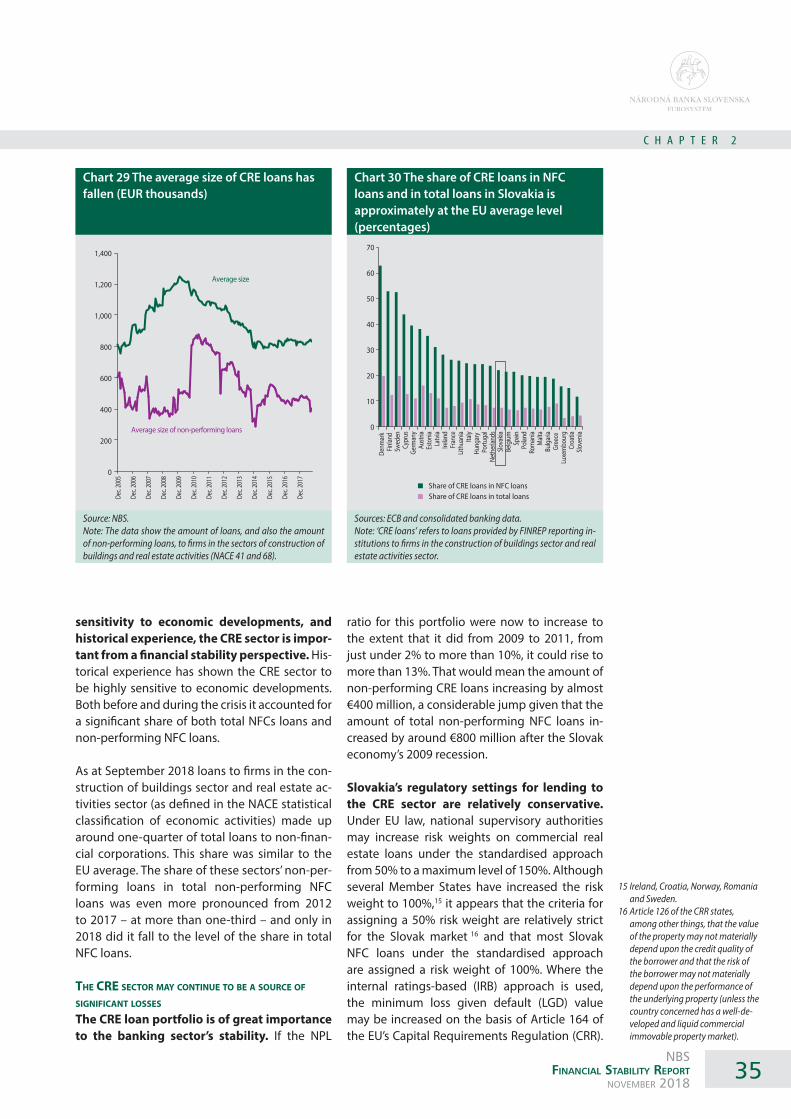
35NBS
Financial Stability RepoRtNovemBer 2018
C H A P T E R 2
Chart 30 The share of CRE loans in NFC loans and in total loans in Slovakia is approximately at the EU average level (percentages)
Sources: ECB and consolidated banking data.Note: ‘CRE loans’ refers to loans provided by FINREP reporting in-stitutions to firms in the construction of buildings sector and real estate activities sector.
Chart 29 The average size of CRE loans has fallen (EUR thousands)
Source: NBS.Note: The data show the amount of loans, and also the amount of non-performing loans, to firms in the sectors of construction of buildings and real estate activities (NACE 41 and 68).
1,400
1,200
1,000
800
600
400
200
0
Dec.
2005
Dec.
2006
Dec.
2007
Dec.
2008
Dec.
2009
Dec.
2010
Dec.
2011
Dec.
2012
Dec.
2013
Dec.
2014
Dec.
2015
Dec.
2016
Dec.
2017
Average size
Average size of non-performing loans
Share of CRE loans in NFC loansShare of CRE loans in total loans
70
60
50
40
30
20
10
0
Denm
ark
Finlan
d Sw
eden
Cypr
usGe
rman
yAu
stria
Esto
nia
Latv
iaIre
land
Fran
ceLit
huan
iaIta
lyHu
ngar
y Po
rtuga
lNe
ther
lands
Slova
kiaBe
lgiu
mSp
ainPo
land
Rom
ania
Malt
aBu
lgar
iaGr
eece
Lu
xem
bour
gCr
oatia
Slove
nia
sensitivity to economic developments, and historical experience, the CRE sector is impor-tant from a financial stability perspective. His-torical experience has shown the CRE sector to be highly sensitive to economic developments. Both before and during the crisis it accounted for a significant share of both total NFCs loans and non-performing NFC loans.
As at September 2018 loans to firms in the con-struction of buildings sector and real estate ac-tivities sector (as defined in the NACE statistical classification of economic activities) made up around one-quarter of total loans to non-finan-cial corporations. This share was similar to the EU average. The share of these sectors’ non-per-forming loans in total non-performing NFC loans was even more pronounced from 2012 to 2017 – at more than one-third – and only in 2018 did it fall to the level of the share in total NFC loans.
the Cre seCtor may Continue to be a sourCe oF signiFiCant losses The CRE loan portfolio is of great importance to the banking sector’s stability. If the NPL
ratio for this portfolio were now to increase to the extent that it did from 2009 to 2011, from just under 2% to more than 10%, it could rise to more than 13%. That would mean the amount of non-performing CRE loans increasing by almost €400 million, a considerable jump given that the amount of total non-performing NFC loans in-creased by around €800 million after the Slovak economy’s 2009 recession.
Slovakia’s regulatory settings for lending to the CRE sector are relatively conservative. Under EU law, national supervisory authorities may increase risk weights on commercial real estate loans under the standardised approach from 50% to a maximum level of 150%. Although several Member States have increased the risk weight to 100%,15 it appears that the criteria for assigning a 50% risk weight are relatively strict for the Slovak market 16 and that most Slovak NFC loans under the standardised approach are assigned a risk weight of 100%. Where the internal ratings-based (IRB) approach is used, the minimum loss given default (LGD) value may be increased on the basis of Article 164 of the EU’s Capital Requirements Regulation (CRR).
15 Ireland, Croatia, Norway, Romania and Sweden.
16 Article 126 of the CRR states, among other things, that the value of the property may not materially depend upon the credit quality of the borrower and that the risk of the borrower may not materially depend upon the performance of the underlying property (unless the country concerned has a well-de-veloped and liquid commercial immovable property market).

36NBS
Financial Stability RepoRtNovemBer 2018
C H A P T E R 2
Chart 31 Share of domestic sectors in the total exposure to the CRE sector
Source: NBS.Notes: PFMCs – pension fund management companies.The data for investment funds cover exposures in the form of loans, bonds, and equity; data for other segments cover exposures in the form of loans and bonds.
Chart 32 The largest bond exposure to the Slovak CRE sector is held by households (EUR millions)
Source: NBS.
Banks – 74%Investment funds – 13%Households – 6%
NFCs – 6%Insurers – 1%PFMCs – 0%
500
450
400
350
300
250
200
150
100
50
0Households NFCs Investment funds Banks
Among Slovak banks using the IRB approach, however, such LGD estimates are generally not used and the majority of exposures are assigned a risk weight of between 70% and 90%.
non-bank seCtors are also exposed to the slovak Cre seCtor Although domestic bank loans remain one of the principal sources of financing for the Slovak CRE sector (accounting for almost 75% of its to-tal financing from domestic sectors), other seg-ments of the domestic financial market are also exposed to this sector, mainly through bonds, equity, and loans.
Investment funds have significant exposure to the domestic CRE sector, not least owing to the existence of real estate funds. Investment funds, mainly real estate ones, reported an ex-posure to this sector in the form of equity, bond investments, and direct lending. This exposure amounted to almost €1 billion as at the end of June 2018.
Other sectors’ exposures to the CRE sector are largely bond exposures.
Among domestic segments, households have the largest bond exposure to the CRE sector. The increasing volume of household bond hold-ings was previously highlighted in NBS’s Novem-ber 2017 Financial Stability Report. As at June 2018 household bond holdings related to the Slovak CRE sector amounted to between around €400 and €450 million. The higher returns on such investments in the current low interest rate environment are probably making them attrac-tive for retail investors, too. It is important, how-ever, that households investing directly in this segment, or indirectly via real estate funds, are aware of the risks associated with such invest-ments.
Firms’ overall exposure to the CRE sector is more difficult to gauge, since much of their bond ex-posure is owned by groups that have also issued these bonds.

37NBS
Financial Stability RepoRtNovemBer 2018
C H A P T E R 2
Chart 33 The liquid asset coverage of deposits has continued falling in 2018 (percentages)
Source: NBS.Note: The chart shows the median for retail banks.
35
30
25
20
15
10
5
0
Dec.
2016
Mar
. 201
7
June
2017
Sep.
2017
Dec.
2017
Mar
. 201
8
June
2018
Sep.
2018
Liquid asset coverage of deposits as a percentage (median)Liquid asset-to-total asset ratio
2.5 LIQUIDITY RISK IN THE BANKING SECTOR HAS INCREASED
Risk assessment summary
• The combination of a growing liquidity gap and declining liquid assets is increas-ing banks’ sensitivity to systemic liquidity risk.
• The share of deposits that are fully covered by liquid assets has continued to fall.
• The loan-to-deposit ratio (excluding cov-ered bonds) has exceeded 100% for the first time.
• The Slovak banking sector’s liquidity-re-lated vulnerability has been increasing in comparison with the EU average.
liquidity risk in the banking seCtor has inCreased largely in ConneCtion with the strong growth trend in long-term loans and with the low interest rate environment
This trend has resulted in three factors ad-versely affecting banks systemic liquidity: (i) an increasing maturity mismatch between assets and liabilities; (ii) a decline in the liquid asset ra-tio; and (iii) and a deterioration in the funding of illiquid loans with stable funds.
The maturity mismatch between assets and liabilities has reached a new historical high. While the average maturity of assets has con-tinued to increase amid the ongoing strong growth in illiquid housing loans, the increase in liabilities has been concentrated among those with the shortest maturities. Virtually 100% of the changes in the structure of assets and liabil-ities which occurred in the first three quarters of 2018 were attributable to changes in assets with a residual maturity of over two years or liabilities with a residual maturity of less than seven days. Owing to this trend, the ratio of the 12-month liquidity gap to net assets exceeded 50% for the first time. Such developments high-light the need to maintain a liquidity buffer, or the need to have sufficient stable primary de-posits.
Not only has the ratio of liquid assets to total assets fallen during 2018, so has the absolute amount of liquid assets. The declining impor-tance of investments in liquid assets is the logical
consequence of the prolonged low interest rate environment and resulting growth in long-term loans. In the traditional business model of the Slovak banking sector, the main role of liquid as-sets is to offset the maturity mismatch between assets and liabilities. Hence the combination of a widening liquidity gap and decreasing liquid assets implies a further increase in systemic li-quidity risk.
Since the liquidity buffer is declining, banks have been becoming more reliant on the stability of funding sources. However, loan-to-deposit (LTD) ratios have also been falling. In the period 2010-16 year-on-year changes in total loans to customers and total deposits from customers were on a par. In oth-er words, the increase in illiquid assets, i.e. loans, was almost fully funded by the increase in stable sources of funding, i.e. deposits. This period saw only a slight rise in the banking sector’s aggre-gate LTD ratio. Since 2016 the gap between the annual growth rates for loans and deposits has been increasing, as it did similarly in the pre-cri-sis period of 2004–08.
In the past two years, the LTD ratio has increased markedly, and in August and September 2018 it exceeded 100% for the first time ever.

38NBS
Financial Stability RepoRtNovemBer 2018
C H A P T E R 2
Chart 36 Relatively vulnerable position of the Slovak banking sector: less liquid assets and less stable funding sources
Source: NBS.Note: The chart does not include data for all EU countries owing mainly to differences in the availability of data.
Chart 35 The continuing decline in stable funding sources has been slowed slightly by issues of covered bonds (percentages)
Source: NBS.
Chart 34 The gap between the growth rates for loans and deposits has increased in the past two years (EUR billions)
Source: NBS.Notes: The growth rates are calculated as the three-month mov-ing average of the absolute year-on-year change.
7
6
5
4
3
2
1
0
Deposits Loans
Dec.
2003
Dec.
2004
Dec.
2005
Dec.
2006
Dec.
2007
Dec.
2008
Dec.
2009
Dec.
2010
Dec.
2011
Dec.
2012
Dec.
2013
Dec.
2014
Dec.
2015
Dec.
2016
Dec.
2017
120
100
80
60
40
20
0
Dec.
2003
Dec.
2004
Dec.
2005
Dec.
2006
Dec.
2007
Dec.
2008
Dec.
2009
Dec.
2010
Dec.
2011
Dec.
2012
Dec.
2013
Dec.
2014
Dec.
2015
Dec.
2016
Dec.
2017
Loan-to-deposit ratio including covered bondsLoan-to-deposit ratio
70
60
50
40
30
20
10
0
Loan-to-deposit ratio
Ratio
of l
iqui
d as
sets
to sh
ort-
term
liab
ilitie
s
AT
BE
BGCY
CZ
DE
EE
ES
FI
GR
CR
IE
IT
LT
LULV
MT
PLPT
RO
SI
SK
60 65 70 75 80 85 90 95 100 105
The role of covered bonds as a source of stable funding during this period has been relatively positive. As a result of issues by certain banks, the ratio of loans to the sum of deposits and cov-ered bonds has been slowly increasing during
2018, up to 92%. But while the option of issuing covered bonds may help to maintain a target lev-el of stable funding, it will probably not result in significant changes in the composition of liabil-ities at the largest banks. It remains to be seen to what extent the option of covered bond issu-ance will be taken up by medium-sized banks, which may find the minimum issue amount of €250 million to be too high.
systemiC liquidity risk in the slovak banking seCtor has inCreased also in Comparison with that in other eu Countries
The Slovak banking sector’s capacity to cover short-term liabilities with liquid assets, or to maintain sufficient sources of stable funding, has been deteriorating. The sector’s ratio of liq-uid assets to short-term liabilities has been falling for a long time. In the first quarter of 2018 it fell to the second lowest level in the EU. This means that banks in Slovakia need to rely on the stabil-ity of these short-term liabilities to a greater ex-tent than do banks in other EU countries. On the other hand, the stability of the funding of illiquid claims in the Slovak banking sector, as expressed by the loan-to-deposit ratio, is among the high-est in the EU. The risk is that the deviation of the Slovak banking sector’s position from the EU av-erage will become even more pronounced.

39NBS
Financial Stability RepoRtNovemBer 2018
C H A P T E R 2
Chart 37 The share of EPIFP in the aggregate capital of insurers is much higher in Slovakia than in any other EU country (percentages)
Source: EIOPA.Notes: The data are for the year 2017. EPIFP – expected profits in-cluded in future premiums.
Share of EPIFP in total capitalEU median
60
50
40
30
20
10
0
SK HU EE CZ LT SI MT PL ES NL IT AT UK DE HR RO CY BG FI IE BE PT GR FR LV LU DK SE
2.6 TRENDS IN OTHER FINANCIAL MARKET SEGMENTS
non-material damage represents a low, but inCreasing, risk to the proFitability oF motor insuranCe Among the risks now facing the insurance sector are insurance claims for non-material damage and the sizes of such claims, most of which are made under motor third party liability insurance policies. The claims are for compensa-tion for moral, emotional or other non-physical injury resulting from physical injury or death. Non-material damage is insufficiently regulated by legislation, so it is mainly courts that award and determine the amount of compensation payable for such damage. Experience to date, however, shows somewhat mixed outcomes among the cases litigated in this area. Uncertain-ty about the actual amounts of compensation for non-material damage is undermining one of the principal conditions of risk insurability, i.e. the insurer’s ability to estimate the loss.
Actions concerning claims for compensation for non-material damage currently number in the tens per year, with around half of the cases result-ing in the court awarding compensation to the injured party. The average amount of such awards is around €30,000, less than half of which is paid by insurers. However, the number of such actions, their success rates, and the amount of compen-sation awarded differ markedly between Slovak regions.
In Slovakia, compensation awarded for non-ma-terial damage amounts to hundreds of thou-sands of euro per year, which represents an in-crease of around one-half of a percentage point in the combined ratio in motor insurance. This trend, however, is growing: in both 2016 and 2017 there was almost a doubling of the amount of such compensation paid by the insurance sec-tor. Still, the number of cases remains low and, moreover, individual insurers do not have infor-mation about cases involving other insurers. This shrinks the sample on which the insurance risk estimation is based. If, furthermore, the amount of compensation maintains an upward trend, non-material damage could represent a further risk to the profitability of motor third party liabil-ity insurance, which has been under downward pressure for an extended period.
the insuranCe seCtor’s unFavourable Capital struCture is reduCing its ability to absorb unexpeCted losses In the insurance sector, unexpected losses are covered mainly by own funds, which are im-portant not only in terms of their amount, but also their structure, ranging from Tier 1 (high-est quality) to Tier 3 in accordance with the reg-ulatory classification. One formal component of the highest-quality capital is known as ‘expect-ed profits included in future premiums (EPIFP)’, which, however, does not meet the general qual-ity criteria for inclusion in Tier 1 capital. In most EU countries the EPIFP accounts for a low share of the capital and its impact on capital quality is marginal. In the Slovak insurance sector, howev-er, it makes up fully 61% of total own funds eligi-ble to cover the solvency capital requirement (as at June 2018). Furthermore, this share has been increasing – up from 54% in December 2017. The EPIFP share in Slovakia is far higher than that in any other EU country and five times higher than the EU median.
EPIFP by its nature should rather be included in Tier 3 capital. If it were, only 20 % of EPIFP would be eligible to cover the solvency capital require-ment (SCR). In that case, the overall solvency mar-

40NBS
Financial Stability RepoRtNovemBer 2018
C H A P T E R 2
Chart 38 The overall growth in domestic investment funds has included particularly strong growth in demand for real estate funds
Source: NBS.Note: The left-hand scale shows NAV rescaled (31 December 2010 = 100).
700
600
500
400
300
200
100
0
1. De
c. 20
10
1. Ju
ne 20
11
1. De
c. 20
11
1. Ju
ne 20
12
1. De
c. 20
12
1. Ju
ne 20
13
1. De
c. 20
13
1. Ju
ne 20
14
1. De
c. 20
14
1. Ju
ne 20
15
1. De
c. 20
15
1. Ju
ne 20
16
1. De
c. 20
16
1. Ju
ne 20
17
1. De
c. 20
17
1. Ju
ne 20
18
Real estate fundsDomestic investment funds in total
gin would fall to just over 100% and half of the insurers in Slovakia would fail to meet the SCR.
in the slovak FinanCial market segments FoCused on asset management, the moderately rising trend in market risks Continued in the First halF oF the year Looking at the investment fund sector and the second and third pillars of the pension fund sector,17 the broadest recent trend, observed across all segments, has been an increase in the funds’ equity exposure. The rate of increase in the equity component of pension and invest-ment funds’ asset portfolios slowed during the first six months of 2018, after rising sharply in the previous year. As at 30 June 2018, equities and in-vestment fund shares/units accounted for around 44% of the total net asset value (NAV) of third-pil-lar pension funds and investment funds, and for around one-quarter of the NAV of second-pillar funds. The residual maturity and duration of debt securities holdings also increased. Their increase was larger in third-pillar funds, although in this case they were rebounding from a decline in 2017. In the second pension pillar, the average value of interest rate sensitivity indicators increased mod-erately; the median, however, fell, since the in-crease was driven by only a small group of funds and most of the rest actually recorded a slight drop in these values. In the investment fund sec-tor, the duration of the aggregate portfolio in-creased. At the same time, this sector was the only one to record an increase – albeit it only modest – in open foreign exchange positions.
in the investment Fund seCtor, investor inFlows have For some years been aCCompanied by the targeting oF Fund portFolios on riskier and less liquid assets Recent years have seen surging demand for investment funds in Slovakia. The most notable rise in inflows into investment funds has been in those from households. This has stemmed partly from households’ increasing disposable income, but also partly from other reasons, including the subdued returns on bank deposits, in comparison with which investment funds have been viewed as a higher-yielding alternative. In addition, fund investments should, at least in theory, be almost as liquid as current account investments, since they are redeemable immediately. But although that is the case in ‘normal times’, it may cease to apply during times of stress or panic in financial markets. If a wave of redemptions is triggered by financial market headwinds, investors who sell
17 The second pillar of the Slovak pension system – the old-age pension scheme – is a largely compulsory defined-contribution scheme operated by pension fund management companies (PFMCs). The third pillar – the supplementa-ry pension scheme – is a voluntary defined-contribution scheme op-erated by supplementary pension management companies (SPMCs).
their fund shares/units at such time (assuming that redemptions are not suspended) may suffer losses due to the fall in value of the shares/units. This risk increases where less liquid assets are a growing component of investment fund portfolios. Just such a trend has been seen in the domestic invest-ment fund sector in recent years. On the one hand, fund managers have been increasing the risk pro-file of their investment funds in order to meet ris-ing performance expectations; on the other hand, investors themselves have been shifting the bulk of their investments to higher-risk funds.
These trends and risks have been particularly apparent in the rapid growth in the amount of assets under management in real estate funds. The aggregate net asset value of these funds has increased sixfold since 2011, to €1.2 billion, while the aggregate NAV of all domestic investment funds has only doubled in that time. As at 30 June 2018 around half of the aggregate portfo-lio of real estate funds consisted of participating interests in real estate companies and more than 20% comprised claims, largely in the form of loans to the same companies. Altogether, as much as three-quarters of the overall NAV of real estate funds was highly illiquid. Furthermore, the value of these assets may be more prone to decline when the real estate cycle in Slovakia begins to turn.

41NBS
Financial Stability RepoRtNovemBer 2018
C H A P T E R 2
Another trend having a downward impact on investment fund liquidity is the increase in investments in Slovak and, to a lesser extent, Czech bonds and notes issued by non-bank private companies. This is because the second-ary market in these instruments is highly illiquid. A not insignificant share of them are issues from the CRE sector. The amount of such debt secu-rities held by domestic investment funds at the end of June 2018 amounted to more than €330 million, an increase from €125 million over not-quite-four years. It is true that much of this in-crease was accounted for by three investment funds whose share in the sector’s total such ex-posure is almost three-quarters. However, in sev-eral investment funds from different categories, the share of non-bank bonds in the asset portfo-lio has been increasing, but not to an extent that would be systemically significant for the sector as a whole.
2.7 CURRENT EU-LEVEL ISSUES WITH MACROPRUDENTIAL POLICY RELEVANCE
disCussions Continue on amendments to eu legislation ConCerning maCroprudential poliCy In November 2016 the European Commission published proposals for amending EU legal acts (the CRR, CRD IV, BRRD and SRMR) in order to re-duce risks in the banking sector. The purpose of the measures is to implement into EU law inter-national standards in the area of prudential and resolution policy. The subsequent legislative process has seen fast-tracking of discussions on the proposed transition period for the introduc-tion of IFRS 9 (part of the draft CRR amendment) and creditor hierarchy harmonisation (BRRD). The legislative process has now moved to the fi-nal phase – the ‘trialogue’ negotiations. Achiev-ing agreement on a compromise wording of the whole package of measures by the end of 2018 is a priority for both the Austrian Presi-dency of the Council of the European Union and for the European Parliament. What matters most to Slovakia is that a balance is maintained between home and host Member States, espe-cially in regard to the possible introduction of cross-border capital and liquidity waivers and to the setting of macroprudential instruments and resolution policies.
The most important of the proposed changes relating to macroprudential policy can be sum-marised as follows:• to give also national macroprudential authori-
ties power to increase risk weights or the min-imum loss given default for loans secured by immovable property (Articles 124 and 164 of the CRR);
• to increase the maximum potential O-SII buff-er (to 3% of risk exposures, or, in the case of subsidiaries, to the level of the parent group +1%);
• to abolish the option of using a systemic risk buffer (SRB) for the same purpose as an O-SII buffer, i.e. to increase the resilience of domes-tic systemically important institutions;
• to add together the SRB and O-SII buffer (at present the higher of the two values is taken into account; they are added together only where the SRB is applied only to domestic ex-posures).
in the First halF oF 2018 the single resolution board took its First deCisions on the determination oF the minimum requirement For own Funds and eligible liabilities (mrel) Decisions on MREL requirements and related matters are taken by resolution authorities. For institutions in Slovakia, which participates in the banking union, MREL decisions are taken by two authorities: the Resolution Council, which has di-rect competence for decisions concerning small banks; and the EU’s Single Resolution Board, which has competence for larger banks operat-ing in Slovakia.
In the first half of 2018 the SRB took its first MREL determination decisions, at the level of the EU consolidating parent. These decisions were based on the SRB’s 2017 MREL Policy, which provide a more detailed interpretation and ap-plication of legislative requirements in this area. In 2018 the SRB (in cooperation with national resolution authorities participating in the Sin-gle Resolution Mechanism) has been working on updating the original 2017 MREL Policy by adding details about how to determine require-ments for subsidiaries on an individual basis, so as to ensure the feasibility of group resolution plans in the event of a crisis. The SRB expects that updated MREL decisions at the consolidated level and new MREL decisions at the individual
42NBS
Financial Stability RepoRtNovemBer 2018
C H A P T E R 2
level – which should cover banks in Slovakia that fall directly within the competence of the SRB – will start being issued from around the middle of 2019.
The Resolution Council’s MREL decisions con-cerning smaller domestic banks will be taken within a framework aligned with the SRB policy (so as to ensure a level playing field in the do-mestic market). Furthermore, the timing of the decisions’ adoption vis-à-vis the domestic banks concerned will be coordinated as far as possible with the SRB’s decisions in 2019.
the importanCe oF the insuranCe seCtor to FinanCial stability is expeCted to be Further reCognized through maCroprudential instruments For insurers Although the insurance sector is also significant from a financial stability perspective, there is at present a lack of instruments designed to miti-gate systemic risk in the sector. Hence the ESRB and EIOPA have been working together on pro-
posals for macroprudential instruments to be included in a future revision of the Solvency II regulatory framework.
The most significant effects of the proposed in-struments on the domestic insurance sector are expected to result from:• extending Solvency II reporting requirements;• increasing capital requirements for systemi-
cally significant insurers;• harmonising banking and insurance regu-
lations in regard to the provision of banking products by insurers;
• implementing new measures that are impor-tant for the domestic insurance sector;
• limiting the inclusion in Tier 1 capital of ex-pected profits included in future premiums (the current regualtory rules in this area are leading to the impairment of capital struc-tures);
• applying an accounting-based leverage ratio not affected by mispricing under Solvency II.

3
FINANCIAL SECTOR
RESILIENCE
C H A P T E R 3
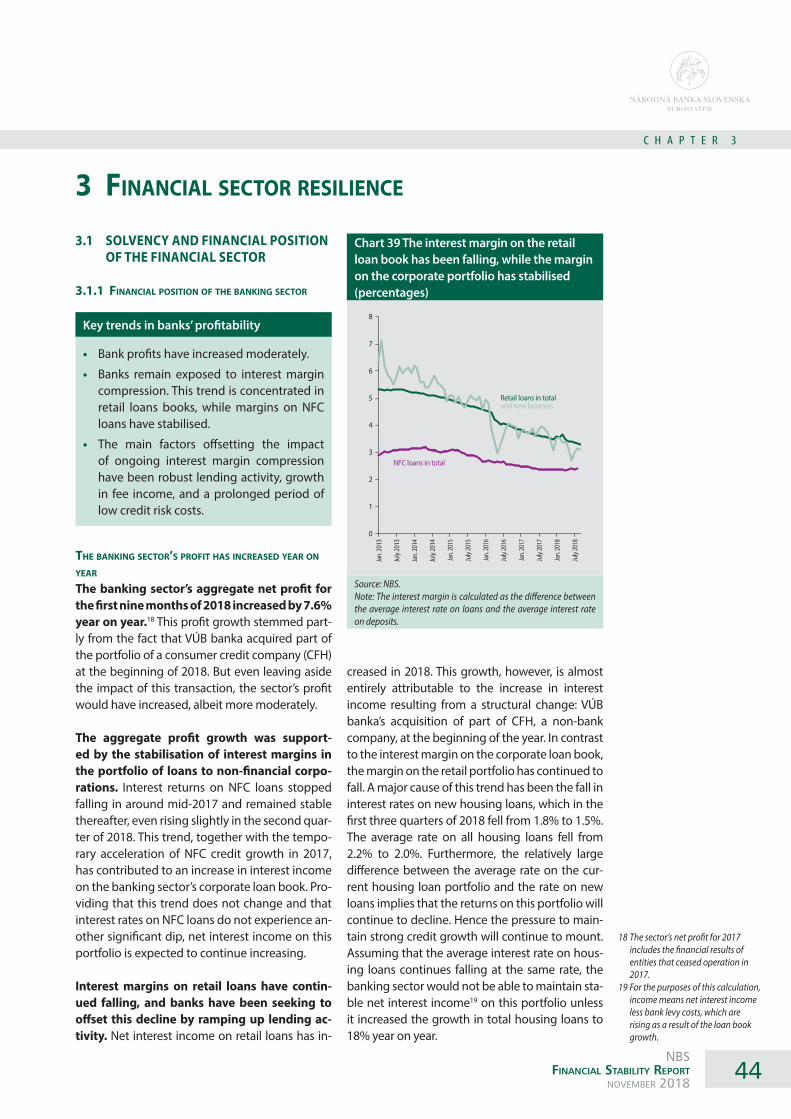
44NBS
Financial Stability RepoRtNovemBer 2018
C H A P T E R 3
Chart 39 The interest margin on the retail loan book has been falling, while the margin on the corporate portfolio has stabilised (percentages)
Source: NBS.Note: The interest margin is calculated as the difference between the average interest rate on loans and the average interest rate on deposits.
8
7
6
5
4
3
2
1
0
Jan.
2013
July
2013
Jan.
2014
July
2014
Jan.
2015
July
2015
Jan.
2016
July
2016
Jan.
2017
July
2017
Jan.
2018
July
2018
NFC loans in total
Retail loans in total and new business
3 FinanCial seCtor resilienCe
3.1 SOLVENCY AND FINANCIAL POSITION OF THE FINANCIAL SECTOR
3.1.1 FinanCial position oF the banking seCtor
Key trends in banks’ profitability
• Bank profits have increased moderately.
• Banks remain exposed to interest margin compression. This trend is concentrated in retail loans books, while margins on NFC loans have stabilised.
• The main factors offsetting the impact of ongoing interest margin compression have been robust lending activity, growth in fee income, and a prolonged period of low credit risk costs.
the banking seCtor’s proFit has inCreased year on year The banking sector’s aggregate net profit for the first nine months of 2018 increased by 7.6% year on year.18 This profit growth stemmed part-ly from the fact that VÚB banka acquired part of the portfolio of a consumer credit company (CFH) at the beginning of 2018. But even leaving aside the impact of this transaction, the sector’s profit would have increased, albeit more moderately.
The aggregate profit growth was support-ed by the stabilisation of interest margins in the portfolio of loans to non-financial corpo-rations. Interest returns on NFC loans stopped falling in around mid-2017 and remained stable thereafter, even rising slightly in the second quar-ter of 2018. This trend, together with the tempo-rary acceleration of NFC credit growth in 2017, has contributed to an increase in interest income on the banking sector’s corporate loan book. Pro-viding that this trend does not change and that interest rates on NFC loans do not experience an-other significant dip, net interest income on this portfolio is expected to continue increasing.
Interest margins on retail loans have contin-ued falling, and banks have been seeking to offset this decline by ramping up lending ac-tivity. Net interest income on retail loans has in-
18 The sector’s net profit for 2017 includes the financial results of entities that ceased operation in 2017.
19 For the purposes of this calculation, income means net interest income less bank levy costs, which are rising as a result of the loan book growth.
creased in 2018. This growth, however, is almost entirely attributable to the increase in interest income resulting from a structural change: VÚB banka’s acquisition of part of CFH, a non-bank company, at the beginning of the year. In contrast to the interest margin on the corporate loan book, the margin on the retail portfolio has continued to fall. A major cause of this trend has been the fall in interest rates on new housing loans, which in the first three quarters of 2018 fell from 1.8% to 1.5%. The average rate on all housing loans fell from 2.2% to 2.0%. Furthermore, the relatively large difference between the average rate on the cur-rent housing loan portfolio and the rate on new loans implies that the returns on this portfolio will continue to decline. Hence the pressure to main-tain strong credit growth will continue to mount. Assuming that the average interest rate on hous-ing loans continues falling at the same rate, the banking sector would not be able to maintain sta-ble net interest income19 on this portfolio unless it increased the growth in total housing loans to 18% year on year.
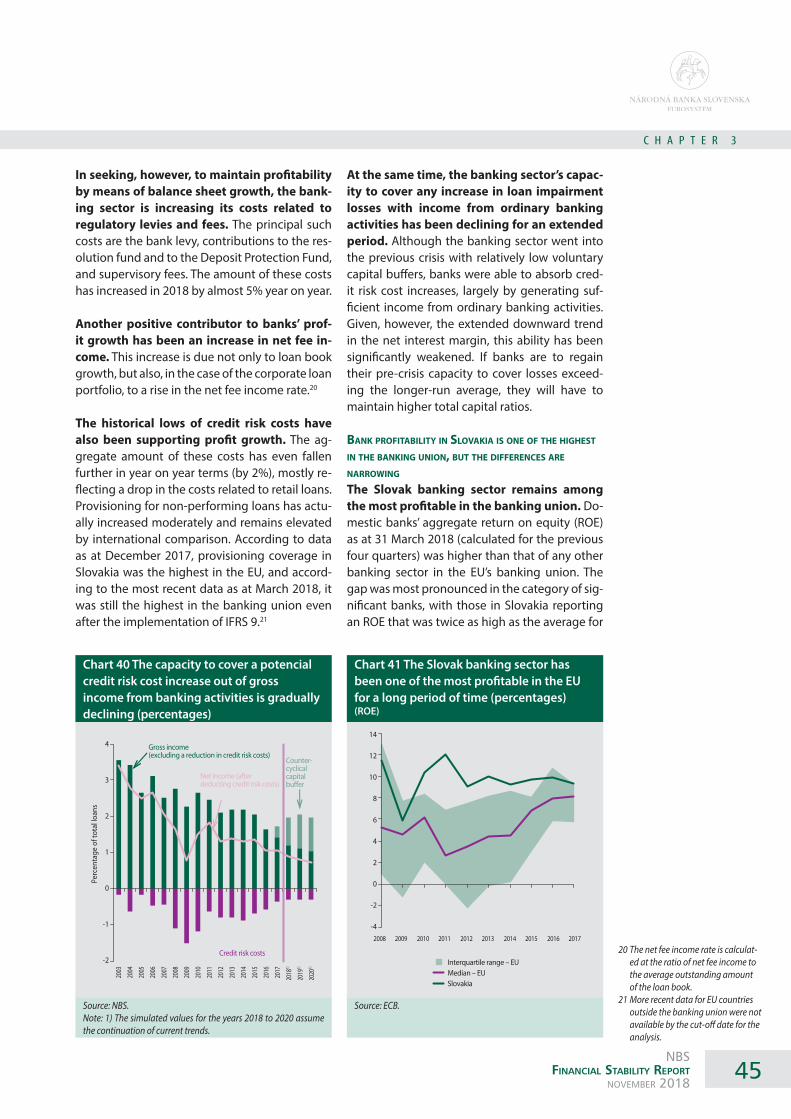
45NBS
Financial Stability RepoRtNovemBer 2018
C H A P T E R 3
Chart 41 The Slovak banking sector has been one of the most profitable in the EU for a long period of time (percentages)(ROE)
Source: ECB.
Chart 40 The capacity to cover a potencial credit risk cost increase out of gross income from banking activities is gradually declining (percentages)
Source: NBS.Note: 1) The simulated values for the years 2018 to 2020 assume the continuation of current trends.
4
3
2
1
0
-1
-2
2003
2004
2005
2006
2007
2008
2009
2010
2011
2012
2013
2014
2015
2016
2017
2018
1)
2019
1)
2020
1)
Credit risk costs
Counter-cyclical capitalbuffer
Perc
enta
ge o
f tot
al lo
ans
Gross income(excluding a reduction in credit risk costs)
Net income (afterdeducting credit risk costs)
Interquartile range – EUMedian – EUSlovakia
14
12
10
8
6
4
2
0
-2
-42008 2009 2010 2011 2012 2013 2014 2015 2016 2017
In seeking, however, to maintain profitability by means of balance sheet growth, the bank-ing sector is increasing its costs related to regulatory levies and fees. The principal such costs are the bank levy, contributions to the res-olution fund and to the Deposit Protection Fund, and supervisory fees. The amount of these costs has increased in 2018 by almost 5% year on year.
Another positive contributor to banks’ prof-it growth has been an increase in net fee in-come. This increase is due not only to loan book growth, but also, in the case of the corporate loan portfolio, to a rise in the net fee income rate.20
The historical lows of credit risk costs have also been supporting profit growth. The ag-gregate amount of these costs has even fallen further in year on year terms (by 2%), mostly re-flecting a drop in the costs related to retail loans. Provisioning for non-performing loans has actu-ally increased moderately and remains elevated by international comparison. According to data as at December 2017, provisioning coverage in Slovakia was the highest in the EU, and accord-ing to the most recent data as at March 2018, it was still the highest in the banking union even after the implementation of IFRS 9.21
At the same time, the banking sector’s capac-ity to cover any increase in loan impairment losses with income from ordinary banking activities has been declining for an extended period. Although the banking sector went into the previous crisis with relatively low voluntary capital buffers, banks were able to absorb cred-it risk cost increases, largely by generating suf-ficient income from ordinary banking activities. Given, however, the extended downward trend in the net interest margin, this ability has been significantly weakened. If banks are to regain their pre-crisis capacity to cover losses exceed-ing the longer-run average, they will have to maintain higher total capital ratios.
bank proFitability in slovakia is one oF the highest in the banking union, but the diFFerenCes are narrowing The Slovak banking sector remains among the most profitable in the banking union. Do-mestic banks’ aggregate return on equity (ROE) as at 31 March 2018 (calculated for the previous four quarters) was higher than that of any other banking sector in the EU’s banking union. The gap was most pronounced in the category of sig-nificant banks, with those in Slovakia reporting an ROE that was twice as high as the average for
20 The net fee income rate is calculat-ed at the ratio of net fee income to the average outstanding amount of the loan book.
21 More recent data for EU countries outside the banking union were not available by the cut-off date for the analysis.

46NBS
Financial Stability RepoRtNovemBer 2018
C H A P T E R 3
significant banks in the banking union. On the other hand, the levels of profitability are on a par if the comparison is made only with those signif-icant banks in the banking union which follow a business model similar to that of domestic sig-nificant banks. (i.e. a model focused on lending to the domestic economy and involving a low level of cross-border activities).
Compared, however, with the banking union as a whole, profitability trends in the Slovakia have deteriorated slightly. In 2017 the banking sectors in more than half of the countries partici-pating in the banking union reported higher ROE growth than did the Slovak banking sector. In 2018 growth in the domestic sector’s net interest income (less the impact of the CFH acquisition) has been lower than the banking union average. In several banking union countries, however, weak provisioning for NPLs remains a problem, while in Slovakia the level of such provisions has long been among the highest in the union. An-other issue among banks in the banking union is their low level of operational efficiency. In fact, their operating costs continued rising in the first half of 2018. The operational efficiency of do-mestic banks is close to the median for banking union banks.
3.1.2 proFitability in other FinanCial market segments22
The insurance sector’s profit for the first six months of 2018 fell by 4% year on year. The main cause of that decline was a deterioration in financial results; by contrast, the impact of tech-nical results on the aggregate profit was mar-ginal. In non-life insurance there was relatively strong growth in premiums, but that was largely accounted for by motor third party liability insur-ance, which reports elevated loss and expense ratios. Another cause of the non-life premium growth was the reclassification of existing con-tracts. Looking ahead, there remains the risk that investment returns, which are on a long down-ward trend, will not be sufficient to cover returns guaranteed under life insurance contract.
Fund management companies in both the third pillar of the pension system (SPMCs) and investment fund sector have, on aggre-gate, increased their profitability in 2018; in the second pension pillar, however, the prof-itability of the fund management companies
22 For further details on the capital structure of the insurance sector, see the November 2017 Financial Stability Report.
23 Banks retained 33% of the earnings for 2017 in order to increase their capital.
24 Except for France, they were EU periphery countries which in the past had faced greater banking sector risks (Greece, Cyprus, Spain, Italy and Portugal).
(PFMCs) has fallen slightly. All three sectors have recorded a rise in fee and commission in-come. As regards individual fund management companies, profitability in all three sectors has been somewhat heterogeneous.
3.1.3 solvenCy and leverage
Key trends
• Banks’ solvency fell slightly in the first half of 2018.
• The Slovak banking sector’s total capital ra-tio has fallen close to the lower quartile of the EU range.
• Dividend policies will have to be further tightened in the future.
Capital and leverage ratios in the banking seCtor have Fallen slightly The banking sector’s total capital ratio and leverage ratio fell slightly in the first half of 2018. This decline followed increases in both ra-tios in 2017. Although banks’ dividend policies23 in 2018, as in 2017, have been more conserva-tive than those in the years 2014 to 2016, the impact of increasing capital requirements amid strong lending activity has been greater. Already in 2017, several banks included a planned reten-tion of earnings in their accounting.
Table 2 Capital and leverage ratios (percentages)
December
2016December
2017June2018
Common Equity Tier 1 capital ratio
15.8 16.2 15.9
Tier 1 capital ratio 16.2 16.6 16.3
Total capital ratio 18.0 18.6 18.2
Leverage ratio 8.1 8.3 8.2Source: NBS.
Compared with EU trends, the domestic bank-ing sector’s capital ratio levels have been falling slightly behind. By March 2018 the sec-tor’s capital ratios had fallen close to the lower quartile of the EU range, after being just below the EU median for several years. In only six other banking union countries24 was the banking sec-tor’s total capital ratio lower.

47NBS
Financial Stability RepoRtNovemBer 2018
C H A P T E R 3
Chart 44 Slovakia reports one of the lowest gaps between the capital requirement for the banking sector and the sector’s total capital ratio (percentages)
Source: ECB.Notes: Data were not available for certain countries (France, Hun-gary, Bulgaria and Romania). The chart does not show Pillar II capital requirements, set on the basis of the Supervisory Review and Evaluation Process. Data are as at March 2018. 1) Data for Italy and Spain are as at December 2017.
Chart 43 Total capital ratios have been rising since the crisis but remain below the median for EU countries (Total capital ratio and Cyclogram indicator)
Source: ECB.Notes: 1) Data for 2018 are as at 31 March 2018.Data for other EU countries have been available only since 2008.
Chart 42 Capital ratios have fallen close to the lower quartile of the EU range
Sources: NBS and ECB.Note: Data are as at March 2018.
25
20
15
10
5
0
Interquartile range – EUMedian – EUSlovakia
Common EquityTier 1 capital ratio
Tier 1 capitalratio
Total capitalratio
25
20
15
10
5
0
8
7
6
5
4
3
2
1
0
2005
2006
2007
2008
2009
2010
2011
2012
2013
2014
2015
2016
2017
2018
1)
Total capital ratio: SK, EU median, and interquartile range
Indicator of cyclical risks (Cyclogram; right-hand scale)
(%)
35
30
25
20
15
10
5
0
Capital requirement (8% + capital buffers)Total capital ratioDifference
Esto
nia
Irela
ndSw
eden
Luxe
mbo
urg
Finl
and
Latv
iaM
alta
Neth
erla
nds
Denm
ark
Unite
d Ki
ngdo
mSl
oven
iaAu
stria
Belg
ium
Croa
tiaLi
thua
nia
Gree
ceIta
ly1)
Spai
n1)
Cypr
us
Slov
akia
Portu
gal
Pola
ndCz
ech
Repu
blic
Insofar as the regulatory regime allows, significant banks are increasing the use of lower-quality capital to meet capital re-quirements. In the past, the Slovak banking sector’s capital structure consisted mostly of the highest-quality component – Common Equity Tier 1 (CET 1) capital. But while CET 1 still consti-tutes 97% of the total capital of less significant banks, its share of the capital of significant banks has gradually declined, down to 84% (below the EU median of 90%).
Banks’ efforts to optimise the level and struc-ture of their capital demonstrates the increas-ing importance of capital buffers. In previous years, Slovak banks had relatively large voluntary capital buffers (the difference between the cap-ital requirement and actual level of capital), but now several banks, acting in accordance with the requirements of their parent undertakings, ap-pear to be seeking to significantly reduce the size of these voluntary buffers. The sector, however is increasingly exposed to elevated cyclical risks, to banks’ mounting sensitivity to any deteriora-tion in the economic situation, and to a decline in its loss-absorption capacity amid long-run-ning interest margin compression. (Chart 40). The experience of the pre-crisis period (2006-07) shows that in years of stronger growth and profits, banks tend to reduce their total capital
ratios (through high dividend ratios and strong lending growth) and not to build-up reserves for

48NBS
Financial Stability RepoRtNovemBer 2018
C H A P T E R 3
difficult times. At the beginning of the last cri-sis, several banks reported total capital ratios at minimum levels. Therefore, capital requirements in the form of macroprudential capital require-ments are becoming increasingly important, as are the supervisory capital requirements. As continuing robust lending activity brings their capital ratios gradually closer to the regulatory minimum, several banks will find themselves having to follow dividend policies that are more conservative than those pursued in the past.
Capital ratio levels are being affected by sev-eral regulatory changes. The most significant change has been the transition to the new ac-counting standard IFRS 9 from 1 January 2018. Its implementation contributed to an immediate drop of 0.2 percentage point in the banking sec-tor’s total capital ratio, and its further cumulative downward impact over the period from 2019 to 2023 is estimated to be 0.3 percentage point. In the long term, banks’ capital requirements will also be affected by the phasing-in of the Basel III standards for the calculation of capital require-ments for credit risk and operational risk, due to be completed in 2027. According to a prelimi-nary estimate by the European Banking Author-ity (EBA),25 the most significant impact of the re-view on banks whose profile is similar to that of the Slovak banking sector,26 will be in the area of credit risk, increasing their capital requirement by possibly as much as 12%.
the immediate impaCt oF the implementation oF iFrs 9 on the banking seCtor has been relatively low Slovak banks are now subject to the new In-ternational Financial Reporting Standard (IFRS) 9, in force since the start of 2018. The new standard introduces changes in two main areas: the classification and measurement of financial assets; and the reporting of financial asset impairment losses. Under International Accounting Standard 39, which IFRS 9 replaced, provisions were created only for incurred losses. By contrast, IFRS 9 requires banks to apply an ex-pected credit loss (ECL) model. Loans on which credit risk has not increased significantly since initial recognition (Stage 1 loans) are required to be measured through a loss allowance at an amount equal to the 12-month expected losses. Loans on which credit risk has significantly in-creased since initial recognition (Stage 2 loans) are required to be measured through a loss al-
25 For further details, see https://www.eba.europa.eu/-/eba-publishes-the-prelimi-nary-impact-of-the-basel-re-forms-on-eu-banks-capital-and-updates-on-liquidity-measures-in-the-eu?doAsGroupId=10180
26 Classified as ‘Group 2 banks’, which do not include large internationally active banks.
27 For further details on these changes, see the November 2017 Financial Stability Report.
28 For further details see “Správa o stave a vývoji finančného trhu za prvý polrok 2018” (Financial Market Situation and Trend Report for the First Half of 2018), published only in Slovak.
lowance at an amount equal to the full lifetime expected credit losses. If a loan subsequently be-comes non-performing (or becomes a credit-im-paired financial asset – a Stage 3 loan), a change takes place in how interest income is calculated. Whereas for a performing loan, interest income is calculated on the gross carrying amount, for a non-performing loan it is calculated on the amortised cost, i.e. basically the net value of the loan.27
But while the changes concerning the classifica-tion and measurement of financial assets were of a more one-off nature – with banks switch-ing part of their bond holdings from the avail-able-for-sale portfolio to the held-to-maturity portfolio28 – the changes in the reporting of fi-nancial asset impairment losses, i.e. in the meth-od of provisioning, are expected to weigh on banks mainly during economic downturns and when credit risk is increasing.
The overall immediate impact on the banking sector’s capital of the IFRS 9 transition has been relatively low. According to banks’ calcu-lations, the negative impact of the IFRS 9 transi-tion on banks’ own funds is estimated to amount to €190 million, which as at 31 December 2017 was equivalent to just over 3% of the aggregate own funds. Although the impact on the banking sector as a whole is not substantial, the impact on certain individual banks could be greater. Since a number of banks have implemented IFRS 9 in full, without using the option of a five-year transition period, more than €80 million of the estimated impact is already accounted for. The rest of the IFRS 9 impact on banks’ capital will be phased in over the transition period, until 2023, as follows: • 5% by end-2018;• 15% by end-2019;• 30% by end-2020;• 50% by end- 2021;• 75% by end-2022.
The amount of provisions has increased, mainly for Stage 2 loans. The principal change in loan loss provisioning is that banks should now apply ECL provisioning for loans on which credit risk has significantly increased since initial recognition, on the basis of the expected credit losses during the lifetime of the loan. Hence the IFRS 9 transition impact related to the change

49NBS
Financial Stability RepoRtNovemBer 2018
C H A P T E R 3
in provisioning has been most pronounced on loans which from 1 January 2018 were classified as Stage 2 loans. On that date, banks in Slovakia reclassified around 6.5% of their total loan books as Stage 2 loans.29 The share reclassified was slightly higher in the sector’s portfolio of loans to households (8%) than in the portfolio of loans to NFCs (just over 5%). The amount of provisions for the loans reclassified as Stage 2 loans increased by around 68% from 31 December 2017 to 1 Jan-uary 2018, and the provisioning coverage for Stage 2 loans is now between 5.5% and 6.0%. The increase in both the amount of provisions and the provisioning coverage is similar for both household loans and NFC loans. In the house-hold segment, provisioning coverage was high-er for consumer loans (at around 17%) than for housing loans (around 3%), which are generally secured by immovable property.
In terms of their total amounts, Stage 3 loans and non-performing loans are similar, and the provision coverage for these loans is also comparable. The aggregate amounts of Stage 3 loans and non-performing loans which do-mestic banks reported as at 1 January were ap-proximately the same, at around 3.5% of total loans. The provisioning coverage for these loans is between 65% and 70%, so the amount of pro-visions for them did not increase significantly from 31 December 2017 to 1 January 2018. The amount of provisions for Stage 1 loans (with no significant increase in credit risk since initial rec-ognition) rose by around 12%. The provisioning coverage of these loans is, however, naturally lower, at just over 0.3%.
Although the immediate impact of the IFRS 9 transition on Slovak banks has not been sig-nificant, the new standards could weigh more heavily on banks in the event of a business cy-cle downturn. Under the new standards, banks are expected to increase provisioning at the onset of a crisis, with potentially positive impli-cations for transparency about the credit risk in their loan books. On the other hand, some stud-ies indicate that the new standards may have pr-ocyclical consequences.30 This procyclicality may be largely the result of the difficulty in predicting a crisis or economic downturn. In other words, when the business cycle declines and credit risks materialise, provisions may increase more than they would have done under the previous ac-
29 The data were obtained from a sur-vey conducted among all banks and subsidiaries of foreign banks, but not among branches of foreign banks.
30 For example, Abad, J. a Suarez, J., “Assessing the cyclical implications of IFRS 9 – a recursive model”, Oc-casional Paper Series, No 12, ESRB, July 2017.
31 For further details, see the July 2018 Quarterly Commentary on Macroprudential Policy, available at https://www.nbs.sk/_img/Doc-uments/_Dohlad/Makropolitika/WEB_Stvrtrocny_komentar_TRA-EN_July_2018.pdf
counting standards (the ‘cliff-edge effect’). Such a sudden impact right at the beginning of a crisis could dampen bank lending and therefore ex-acerbate the downturn. This aspect of the new standards needs to be taken into account when conducting microprudential and macropruden-tial supervision. One way of preventing a more pronounced impact of increasing provisioning on bank lending is, for example, to increase the countercyclical capital buffer.
insurers’ solvenCy has remained unChanged The aggregate solvency of insurers in Slovakia did not change during the first half of 2018. In year on year terms, however, it declined. The solvency margin remained twice as high as the regulatory minimum. Several insurers meet the solvency requirement only because they have been able since 2017 to include the item ‘expected profit included in future premiums (EPIFP)’ in their capital; the risk, however, is that the expected profits will not be realised. This risk is addressed in more detail in Section 2.6.
3.2 MACROPRUDENTIAL POLICY RESPONSIVENESS
Countercyclical capital buffer (CCyB)
• In July 2018 NBS increased the CCyB rate to 1.5% with effect from 1 August 2019.
• If credit growth remains excessive and the economy continues overheating, a further increase in CCyB rate next year cannot be ruled out.
• Compared with rate-setting decisions in oth-er countries, the calibration of the CCyB rate for Slovak exposures is relatively moderate.
the CCyb rate will be inCreased From its Current level (1.25%) to 1.5% with eFFeCt From 1 august 2019 In July 2018 Národná banka Slovenska in-creased the countercyclical capital buffer rate for a third time. The NBS Bank Board’s decision to bolster the banking sector’s resilience to cy-clical risks was taken largely in response to the financial cycle’s continuing expansionary phase, in which private sector credit growth remained relatively strong amid exceptionally favourable macroeconomic conditions.31

50NBS
Financial Stability RepoRtNovemBer 2018
C H A P T E R 3
Chart 45 Increasing benchmark rates for the countercyclical capital buffer, and NBS Bank Board decisions (percentages)
Source: NBS.Note: The NBS Decisions on the setting of the CCyB rate are plotted on the horizontal axis according to the date as at which the data underlying the decision were updated.
Benchmark buffer rate based on the Cyclogram (right-hand scale)Benchmark buffer rate based on the Domestic credit-to-GDP
trend gap
NBS CCyB rate-setting decision
3.50
3.00
2.50
2.00
1.50
1.00
0.50
0.00
3.50
3.00
2.50
2.00
1.50
1.00
0.50
0.00
Dec
. 200
3
Dec
. 200
4
Dec
. 200
5
Dec
. 200
6
Dec
. 200
7
Dec
. 200
8
Dec
. 200
9
Dec
. 201
0
Dec
. 201
1
Dec
. 201
2
Dec
. 201
3
Dec
. 201
4
Dec
. 201
5
Dec
. 201
6
Dec
. 201
7
Table 3 CCyB rates for Slovak exposures
Period of application Rate
1 August 2017 – 31 July 2018 0.50%
1 August 2018 – 31 July 2019 1.25%
1 August 2019 – 1.50%Source: NBS.
The decision to increase the CCyB rate took into account not only the size and duration of the excessive credit growth, but also banks’ overall capacity to withstand losses. The inter-est margin compression observed in the Slovak banking sector in recent years has been eroding banks’ capacity to use current earnings to cov-er any cyclical losses. A combination of narrow margins, high sensitivity to credit risk, and low diversification of income in the banking sector is increasing the importance of capital buffers.
The benchmark rates for the countercyclical capital buffer remained elevated when the next rate-setting decision was taken in Oc-tober 2018. The benchmark buffer rates based on the two core indicators for the CCyB – the do-mestic credit-to-GDPtrend gap and the Cyclogram – were each higher than the approved settings of the CCyB rate, at 1.75% and 2.50% respectively.
NBS does not exclude the possibility of rais-ing the CCyB rate again the future. The cur-rent benchmark rates based on the domestic credit-to-GDPtrend gap and the Cyclogram remain above the approved CCyB rate. When deciding in coming quarters whether to raise the CCyB rate again, three points will be key: first, credit mar-ket growth; second, the length of the period of elevated credit market growth; and, third, over-heating of the macroeconomic environment. All three have a direct impact on the level of credit losses incurred when the cycle turns. Since the CCyB is calibrated with the aim of covering these losses, each of these points will be analysed sep-arately. Recently there has been an increase in the potential impact of economic overheating on the level of future credit losses. For example, the labour market is above its equilibrium, so its correction would be a separate factor exacerbat-ing losses.
It will also be important to monitor the extent to which household credit growth at the end of the first half of 2018 was driven by tempo-rary factors. Besides an uptick in credit growth (related to the one-off impact of new NBS meas-ures), this period also saw a further decline in interest rates and strong competition between banks, two factors that may have a longer-last-

51NBS
Financial Stability RepoRtNovemBer 2018
C H A P T E R 3
Chart 46 Compared with CCyB rates and credit growth levels in selected other countries, Slovakia’s CCyB rate is not among the most stringent (percentages)
Sources: ESRB and ECB.
3.00
2.50
2.00
1.50
1.00
0.50
0.00
Private sector credit growth in year-on-year terms
CCyB
rate
BG
CZ
DK
FR
IS
LT
NO
SK
SE
UK
0.0 2.0 4.0 6.0 8.0 10.0 12.0
ing impact on the further build-up of risks. The question of raising the CCyB rate will also arise if the measures taken by NBS do not, as they are supposed to, help mitigate risks related to rapid-ly rising indebtedness.
The setting of the CCyB rate may also be af-fected by accounting standards. Although it is not yet clear whether the implementation of the IFRS 9 accounting standard will have a direct procyclical effect, there are strong grounds to expect that the new rules for provisioning will also affect the methodology for calibrating the CCyB rate. The tightening of provisioning rules in regard to forbearance for borrowers could also have a substantial impact. Both these account-ing changes would have a tightening effect on the calibration of the countercyclical capital buffer.
The CCyB rate for Slovak exposures is more moderate than the rates set by several other countries for domestic exposures. Although the indicators used as the basis for setting the CCyB rate may differ across EU countries, the
rate-setting decisions are always based heav-ily on developments in private sector credit. A simplified comparison of private sector credit growth and the CCyB rate in a sample of coun-tries where there is a non-zero buffer shows that the CCyB rate for Slovak exposures is, given the current rate of private sector credit growth in Slovakia, less stringent the rate for domestic ex-posures in half of the other countries.
regulatory standards For retail lending are gradually being tightened In May 2018 the NBS Bank Board approved a gradual tightening of regulatory standards for the provision of housing loans and con-sumer loans, with effect from 1 July 2018. The tightening has two aspects: • a tightening of limits on loan-to-value (LTV)
ratios, including a prohibition on the provi-sion of loans with an LTV ratio of more than 90% and a reduction in the share of new loans with an LTV ratio of more than 80%;
• the introduction of a new limit on borrowers’ debt-to-income (DTI) ratio (i.e. the ratio of to-tal debt to net annual income), set at 8. There is a general exemption from this limit that will gradually be tightened.
As per the approved schedule the share of new loans that may have an LTV ratio of more than 80% will be gradually reduced from 40% to 20%, and the share of new loans that may have a DTI ratio of more than 8 will be gradually reduced from 20% to 10%.
Further analysis of NBS’s measures in the area of regulatory lending standards and capital buffers has been conducted by the IMF, with the findings published in its 2018 Ar-ticle IV Consultation for Slovakia32 and in a sep-arate paper.33 This analysis confirms that debt growth in Slovakia is excessive. In the IMF’s view, the macroprudential measures taken to date are balanced in regard to their impact on the ongoing process of improving financial inter-mediation and financial stability. The IMF also welcomes Slovakia’s readiness to further tight-en macroprudential measures should this prove to be necessary.
32https://www.imf.org/en/Publi-cations/CR/Issues/2018/07/26/Slovak-Republic-2018-Article-IV-Consultation-Press-Release-Staff-Report-and-Statement-by-the-46122
33 Harrison, O., Jurča, P., Rychtárik, Š. and Yackovlev, I. “Credit growth and macroprudential policies in the Slovak Republic”, Selected Issues Paper, IMF, June 2018.
52NBS
Financial Stability RepoRtNovemBer 2018
abbreviations
BRRD Bank Recovery and Resolution Directive (Directive 2014/59/EU) of the European Parliament and of the Council of 15 May 2014 establishing a framework for the recovery and resolution of credit institutions and investment firms and amending Council Directive 82/891/EEC, and Directives 2001/24/EC, 2002/47/EC, 2004/25/EC, 2005/56/EC, 2007/36/EC, 2011/35/EU, 2012/30/EU and 2013/36/EU, and Regulations (EU) No 1093/2010 and (EU) No 648/2012, of the European Parliament and of the Council)
CCP central counterparty CET 1 Common Equity Tier 1 (capital)CMN Real Estate Price Map / Cenová mapa nehnuteľnostíCRD IV Fourth Capital Requirements Directive (Directive 2013/36/EU of the European Parliament
and of the Council of 26 June 2013 on access to the activity of credit institutions and the prudential supervision of credit institutions and investment firms, amending Directive 2002/87/EC and repealing Directives 2006/48/EC and 2006/49/EC)
CRE commercial real estateDSTI debt service-to-income (ratio) DTI debt-to-income (ratio)EAP economically active populationEBA European Banking AuthorityECB European Central BankEIOPA European Insurance and Occupational Pensions AuthorityEPIFP expected profit included in future premiumsESC SDW ECB Statistical Data WarehouseESRB European Systemic Risk BoardEU European UnionEU-SILC European Union Statistics on Income and Living ConditionsGDP gross domestic productIFRS 9 International Financial Reporting Standard 9 IMF International Monetary FundIRB internal ratings-based (approach)LGD loss given default LTV loan-to-value (ratio)MREL minimum requirement for own funds and eligible liabilitiesNAV net asset value NBS Národná banka Slovenska / National Bank of SlovakiaNFC non-financial corporationNPL non-performing loanO-SII other systemically important institution PFMC pension fund management company ROE return on equity SCR solvency capital requirement SO SR Statistical Office of the Slovak RepublicSPMC supplementary pension management companySRB Systemic Risk Board

53NBS
Financial Stability RepoRtNovemBer 2018
SRMR Single Resolution Mechanism Regulation (Regulation (EU) No 806/2014 of the European Parliament and of the Council of 15 July 2014 establishing uniform rules and a uniform procedure for the resolution of credit institutions and certain investment firms in the framework of a Single Resolution Mechanism and a Single Resolution Fund and amending Regulation (EU) No 1093/2010)
SSM Single Supervisory MechanismÚPSVaR SR Office of Labour Social Affairs and Family of the Slovak Republic / Ústredie práce,
sociálnych vecí a rodiny Slovenskej republiky

54NBS
Financial Stability RepoRtNovemBer 2018
list oF Charts
Chart 1 Industrial activity is moderating amid rising political uncertainty 10
Chart 2 US interest rate increases and their spillover effects on emerging market economies 11
Chart 3 Non-US equity markets are no longer rising as fast as they recently were 12
Chart 4 Increasing risk aversion towards Italy has not spilled over to other countries 14
Chart 5 The output gap in Slovakia: its estimated level for 2018 and its growth rate since 2015 do not exceed the EU average 17
Chart 6 Labour market overheating is far greater in Slovakia than in most other EU countries 18
Chart 7 Slovakia’s annual GDP growth has been gradually accelerating 18
Chart 8 The size of the economically active population has been falling moderately in recent years, and there have been demographic changes in its 20-34 and 55-64 year cohorts 19
Chart 9 Household credit growth in Slovakia has in the past year continued to be the highest in the EU 22
Chart 10 NBS Decree amendments were followed by loans being frontloaded in anticipation of new rules coming into force 22
Chart 11 Consumer credit growth has been far lower in 2018 than in previous years 23
Chart 12 An increase in average loan size has been supported by falling interest rates 23
Chart 13 Domestic banks have been maintaining high interest income despite interest margin compression 24
Chart 14 Weakening demographics will support a dampening of credit growth over the long term 24
Chart 15 Slovak households have been reporting the highest debt growth while having limited net financial assets 25
Chart 16 In Slovakia, the concentration of housing loans among households
whose income is less than 60% of the median is far higher than the EU average 25
Chart 17 The share of Slovak households that have a housing loan could in the long term rise as high as 52% 25
Chart 18 The share of brokered loans in total housing loans continued increasing in 2018 26
Chart 19 The resetting of housing loan interest rates will be evenly distributed over the next five years 27
Chart 20 The growth rate of prices of existing flats in Slovakia has remained stable 27
Chart 21 The credit risk cost ratio has fallen to a historical low 28
Chart 22 Sensitivity to credit risk growth is gradually increasing 29
Chart 23 The importance of fee income is gradually increasing, but remains below the EU average 30
Chart 24 NFC credit growth in Slovakia has been stable in 2018, while the EU median has increased 31
Chart 25 Interest margins in most loan size categories have been gradually falling 32
Chart 26 Corporate indebtedness is higher in Slovakia than in surrounding countries 33
Chart 27 NPL ratio and default rate for NFC loans 33
Chart 28 The post-crisis trend in CRE lending is more in line with economic fundamentals 34
Chart 29 The average size of CRE loans has fallen 35Chart 30 The share of CRE loans in NFC loans
and in total loans in Slovakia is approximately at the EU average level 35
Chart 31 Share of domestic sectors in the total exposure to the CRE sector 36
Chart 32 The largest bond exposure to the Slovak CRE sector is held by households 36
Chart 33 The liquid asset coverage of deposits has continued falling in 2018 37
Chart 34 The gap between the growth rates for loans and deposits has increased in the past two years 38

55NBS
Financial Stability RepoRtNovemBer 2018
list oF tables
Table 1 Share of total households investing in particular investment vehicles 30
Table 2 Capital and leverage ratios 46
Table 3 CCyB rates for Slovak exposures 50
Chart 35 The continuing decline in stable funding sources has been slowed slightly by issues of covered bonds 38
Chart 36 Relatively vulnerable position of the Slovak banking sector: less liquid assets and less stable funding sources 38
Chart 37 The share of EPIFP in the aggregate capital of insurers is much higher in Slovakia than in any other EU country 39
Chart 38 The overall growth in domestic investment funds has included particularly strong growth in demand for real estate funds 40
Chart 39 The interest margin on the retail loan book has been falling, while the margin on the corporate portfolio has stabilised 44
Chart 40 The capacity to cover a potencial credit risk cost increase out of gross income from banking activities is gradually declining 45
Chart 41 The Slovak banking sector has been one of the most profitable in the for a long period of time EU 45
Chart 42 Capital ratios have fallen close to the lower quartile of the EU range 47
Chart 43 Total capital ratios have been rising since the crisis but remain below the median for EU countries 47
Chart 44 Slovakia reports one of the lowest gaps between the capital requirement for the banking sector and the sector’s total capital ratio 47
Chart 45 Increasing benchmark rates for the countercyclical capital buffer, and NBS Bank Board decisions 50
Chart 46 Compared with CCyB rates and credit growth levels in selected other countries, Slovakia’s CCyB rate is not among the most stringent 51