financial stability report - office of financial...
TRANSCRIPT
OFFICE OF FINANCIAL RESEARCH
Financial Stability Report
2015
i
1 Executive Summary ..................................................................... 1
2 Assessing and Monitoring Threats to Financial Stability ............. 72.1 Assessment of Threats to U.S. Financial Stability ........................................................7
2.2 Focus on Selected Risks ..............................................................................................10
The Potential Role of ETFs in Generating and Propagating Liquidity Stress .............17
Data Deficiencies in Assessing Cyber Threats to Financial Stability ......................... 30
2.3 Financial Stability Monitoring: Progress and Challenges ...........................................32
Leverage, Borrowing, and Derivatives Activities of the 50 Largest Hedge Funds .....37
3 Evaluating Financial Stability Policies ........................................ 413.1 Micro- and Macroprudential Policy ............................................................................41
Possible Bank Responses to Binding Regulatory Ratios ............................................ 44
3.2 Addressing Risks in Systemically Important Financial Institutions..............................47
Categories of Systemic Importance for Banks ............................................................47
Rating Agencies Consider Expectation of Extraordinary Support in Rating Some Large Banks .......................................................................................................49
3.3 Addressing Risks in Nonbank Financial Institutions ....................................................53
Central Counterparty Links to Other Systemically Important Companies .................56
3.4 Potential Unintended Consequences of Macroprudential Policies ..........................59
4 Data Needs for Financial Stability Analysis ............................... 674.1 Addressing Gaps in Scope, Quality, and Accessibility ...............................................67
Scope, Quality, and Access ........................................................................................ 68
What are Financial Data Standards? ............................................................................69
Legal Entity Identifier Adoption Needs Regulatory Mandates .................................70
4.2 Analyzing Data Needs .................................................................................................73
Overview of U.S. Derivatives Trade Reporting ...........................................................78
Data Quality Analysis of Public Swap Data Repository Data ..................................... 84
5 Research on Financial Stability .................................................. 955.1 Research Agenda .........................................................................................................95
5.2 Central Counterparties ................................................................................................96
Central Counterparty Stress Tests: Research Questions ............................................96
Table of Contents
2015 OFR Financial Stability Reportii
5.3 Stress Testing: A Framework for Evaluation ................................................................97
Bank Stress Tests: Research Questions .......................................................................98
Asset Management Stress Tests: Research Questions .............................................. 99
Insurance Company Stress Tests: Research Questions .............................................100
5.4 Financial Networks ....................................................................................................102
5.5 Asset Management and Systemwide Risk.................................................................106
Liquidity and Leverage: Research Questions ............................................................106
Institutional Execution and Dark Markets: Research Questions ...............................108
6 Agenda Ahead .........................................................................113
Glossary .........................................................................................117
Bibliography .................................................................................. 127
Executive Summary 1
In our first Financial Stability Report, the Office of Financial Research (OFR) highlights key potential threats to U.S. financial stability, evaluates policy steps
taken or aimed at reducing those threats, describes actions to be taken to improve U.S. financial data, and reports on key findings from our research.
The OFR has a mandate under the Dodd-Frank Wall Street Reform and Consumer Protection Act of 2010 to assess and monitor threats to financial stability by assessing vulnerabilities in the financial system and weighing them against its resilience. Chapter 2 places current threats to U.S. financial stability in the medium range, focusing on elevated and rising credit risks in the U.S. nonfinancial business sector, investors’ reach for yield in a climate of persistently low interest rates, and the uneven resilience of the financial system.
The Office is charged with evaluating the effectiveness of tools designed to promote U.S. financial stability. Chapter 3 assesses progress in the development of these tools and potential unintended consequences of financial regulation and financial stability policies.
The Office also is mandated to improve the scope, quality, and accessibility of financial data for the benefit of the Financial Stability Oversight Council (FSOC) and the public. Chapter 4 discusses ways regulators can collectively better use financial data while minimizing burden on firms through up-front coordination on use of data standards, collaboration on data collections, and broader sharing of data with appropriate safeguards. The chapter also assesses the progress in improving financial data since the crisis, paying particular attention to data about securities financing transactions, derivatives, mortgage markets, insurance, and asset management activities.
In addition, the Office conducts research to improve our ability to monitor potential vulnerabilities in the financial system, assess causes and consequences of financial crises, and evaluate financial stability policy and risk management practices. Chapter 5 highlights key findings and ongoing research questions from several important OFR research initiatives or studies.
The primary responsibility of the Office of
Financial Research (OFR), an independent
office within the Department of the Treasury,
is to assess and monitor threats to financial
stability; improve the scope, quality, and
accessibility of financial data; perform essential
financial research; and evaluate policies
designed to improve resilience in the financial
system. This first Financial Stability Report
provides the in-depth analysis contained in the
OFR’s first three annual reports.
This report supplements and precedes the
OFR’s 2015 Annual Report to Congress, which
the OFR will publish in January. The annual
report will summarize the financial stability
assessment in this report, report on the results
of our research, and provide an update on the
efforts of the Office in meeting its mission,
which will fulfill the responsibility to report to
Congress and the public in Section 154(d) of
the Dodd-Frank Act.
It is hoped that by creating these two reports,
the Office can serve the needs of a wide array
of stakeholders, while fulfilling its commitment
to be transparent and accountable.
Richard BernerDirector, Office of Financial Research
Executive Summary 1
2015 OFR Financial Stability Report2
In the coming years, the Office will organize our efforts in data, financial research, and policy evaluation around core areas of concentration to promote coherence and coordina-tion in such initiatives. Chapter 6 describes that organiza-tional framework and the initiatives we will pursue in 2016.
Assessing and Monitoring Threats to Financial Stability
Overall threats to U.S. financial stability remain moderate — that is, in a medium range — similar to our assessment of six months and a year ago. But some have edged higher over the past year, as we discuss in Chapter 2. We discuss three major themes.
First and most important, credit risks are elevated and rising for U.S. nonfinancial businesses and many emerging markets. OFR’s past annual reports highlighted the rising credit risks in both U.S. corporates and emerging markets. In 2015, U.S. nonfinancial business debt continued to grow rapidly, fueled by highly accommodative credit and under-writing standards. The ratio of that debt to gross domestic product has moved above pre-crisis highs, and corporate leverage continues to rise. So far, distress in U.S. credit markets has been largely limited to the lowest-rated debt issuers and the energy and commodity industries. However, that distress may spread, because investors now appear to be reassessing the credit and liquidity risks in these markets. U.S. corporate bond spreads have risen from their narrow 2014 levels toward long-term averages, better compensating investors for some, but by no means all, of the increased credit risk.
The interplay of credit with other risks, such as macroeco-nomic risks, is also important. The combination of higher corporate leverage, slower global growth and inflation, a stronger dollar, and the plunge in commodity prices is pressuring corporate earnings and weakening the debt- service capacity of many U.S. and emerging market borrowers. A shock that significantly further impairs U.S. corporate or emerging market credit quality could poten-tially threaten U.S. financial stability.
Second, the low interest rate environment may persist for some time, with associated excesses that could pose finan-cial stability risks. Although the Federal Reserve is widely expected to begin raising interest rates imminently, both Federal Reserve policymakers and market participants expect the pace of tightening to be very gradual, and
long-term interest rates may remain suppressed for some time. The persistence of low rates contributes to excesses that could pose financial stability risks, including investor reach-for-yield behavior, tight risk premiums in U.S. bond markets, and, as noted, the high level and rapid growth of U.S. nonfinancial business debt.
Third, although the resilience of the financial system has improved significantly in the past five years, it is uneven. Since the financial crisis, regulatory reforms and changes in risk management practices have strengthened key institu-tions and markets critical to financial stability. Yet, existing vulnerabilities persist and some new ones have emerged. Financial activity and risks continue to migrate, challenging existing regulations and reporting requirements. Market liquidity appears to be episodically fragile in major U.S. financial markets, diminishing sharply under stress. Run and fire-sale risks persist in securities financing markets. Interconnections among financial firms are evolving in ways not fully understood, for example, in the growing use of central clearing.
Financial stability is now a widely shared policy objective. Policymakers have made significant progress on each of the critical elements of a proper monitoring system: the analytic framework and tools, systemwide data, qualitative informa-tion and intelligence, and reporting and governance.
The OFR and other U.S. and international agencies have developed monitoring and assessment frameworks with new tools, including the OFR’s Financial Stability Monitor. Qualitative intelligence gathering and information-sharing have been expanded through interagency and international forums, such as the FSOC and the international Financial Stability Board, as well as outreach to the financial industry and research communities.
However, substantial challenges to financial stability mon-itoring remain. The financial system is highly complex, dynamic, and interrelated, making it exceedingly challenging to monitor developments in every corner of the system and adequately assess the probability and magnitude of all important risks.
Evaluating Policy Tools
Chapter 3 discusses policies for addressing potential risks posed by systemically important firms, gaps in the post-crisis reform agenda, and potential unintended consequences of financial stability policies.
Executive Summary 3
The chapter discusses progress and pitfalls in subjecting systemically important banks and insurance companies to heightened supervision and prudential standards. Specifically, we note progress in reducing expectations of government support for large U.S. banks as a result of recent regulatory capital proposals that would set a total loss-absorbing capacity standard. At the same time, there are some indications of rising risks in the insurance sector, but progress on adopting heightened prudential standards for designated U.S. insurers remains slow. The relative lack of transparency about the process for identifying global system-ically important insurers precludes public evaluation of how the risks they pose are changing over time.
Next, the chapter discusses policies that address risks posed by three types of nonbank financial institutions: central counterparties, asset managers, and housing government- sponsored enterprises (GSEs). Central counterparties can concentrate risks. For example, our analysis shows that central counterparties have multiple links to each other and the largest banks. Second, regulators have proposed important new rules and disclosures for asset managers, which could improve transparency about public funds’ asset liquidity under normal market conditions. Further informa-tion would be helpful about firms’ assumptions about inflows from bank lines of credit and overdrafts from custodians. Third, the GSEs remain central in the provision of credit to the housing sector, even though they function increasingly like utilities rather than guarantors, because as they sell much of their credit risk to investors through a new type of security.
Finally, Chapter 3 discusses some potential unintended consequences of financial regulation and financial stability policies. For example, bank capital regulation faces a well-known trade-off between the leverage ratio and the various risk-based capital ratios. The leverage ratio requires capital against all exposures, creating an incentive to prefer high- return, high-risk assets that carry no extra capital charge. Risk-based capital ratios should better reflect the actual risk in banks’ portfolios but are subject to model risk. Banks’ risk-taking behavior will be affected by the incentives these and other policies create, so it is critical to understand which regulation is most binding on firms, both in normal times and in times of stress. We analyze developments in the tri-party repo market that appear to be influenced by responses by broker-dealer affiliates of bank holding companies to the introduction of the enhanced supplemental leverage ratio.
Data Needs for Financial Stability Analysis
Financial data must have three attributes to be useful: They must have sufficient scope (comprehensive and gran-ular), they must be of high quality (complete, accurate, and timely), and they must be accessible (shared and secured). Chapter 4 discusses progress made and remaining work needed toward achieving those attributes in financial data that measure activity in several key markets. The chapter discusses the challenges of using financial data, in partic-ular, the need to better coordinate internationally, given that markets are global, and domestically, given the multi-plicity of financial regulators. We discuss how standards and greater upfront coordination can help address challenges posed by regulatory fragmentation and help enhance data sharing and integration.
First, we discuss data describing securities financing trans-actions, including those in the repurchase agreement (repo) and securities lending markets. These markets were a source of contagion during the financial crisis. Although data have improved since the crisis, gaps remain in the scope, quality, and accessibility of data about these markets. To fill those gaps, the OFR, Federal Reserve, and Securities and Exchange Commission (SEC) in 2015 launched voluntary pilot data collections. A permanent data collection would provide needed information to help make these markets more transparent to regulators and market participants.
Second, we evaluate data related to derivatives markets. Global regulatory changes since the financial crisis have required more central clearing and that financial services companies report transactions to new trade repositories. However, these initiatives face key challenges, including differences in the scope of reporting requirements, data quality problems, and limited accessibility. In Chapter 4, we closely examine derivatives data made public by four U.S. registered swap data repositories on their websites and find a significant percentage of incomplete fields. This type of problem would be at least partially alleviated by better use of standards. The OFR is working with the U.S. Commodity Futures Trading Commission (CFTC) and international regulators to improve reporting standards for swap data repositories and develop shared taxonomies for categorizing derivatives products for analysis and regulatory action.
Regulators also now have significantly more granular information describing mortgage markets. There have been
2015 OFR Financial Stability Report4
improvements in the data related to individual loans held on banks’ balance sheets and mortgages securitized and owned by the GSEs. At the same time, the lack of data sharing can lead to redundant data collections and give each financial regulator an incomplete view of the mortgage market.
Progress has also been made in asset management. The SEC now collects highly granular data describing money market funds and recently proposed requiring mutual funds and many other investment companies to report information about their portfolios on a monthly basis in a machine-read-able format, similar to the information that money market funds currently report.
The chapter also notes that use of the Legal Entity Identifier (LEI) — a unique, 20-character code that identifies a counterparty in a financial trade — has been increasing around the world. More than 400,000 LEIs have been issued to entities in 195 countries. The OFR continues to play an active leadership role in promoting LEI adoption. However, the LEI’s growth to date has been led by regula-tors that have required its use in derivatives markets. Much work remains to make the LEI universal in all financial markets. The OFR is encouraging U.S. and international financial regulators to require companies to have and use an LEI when reporting financial data, especially for any new permanent data collections.
Research on Financial Stability
The OFR has a mandate to promote, conduct, and sponsor essential research that improves the understanding of the functioning of the financial system and threats to financial stability. In Chapter 5, we highlight our research in four different areas: central clearing and central counterparties, stress testing, networks, and asset management.
Central clearing for many over-the-counter derivative trans-actions has many benefits: It allows netting of risks to facili-tate risk management and transparency to previously opaque markets; it improves accounting for positions previously considered illiquid; and it allows for more frequent and reliable updating of prices compared to a bilateral market. At the same time, central clearing and central counterparties introduce challenges. The central counterparty becomes a potential single point of failure. Consequently, five U.S. central counterparties have been designated as systemically important. We focus our discussion on the incentives in the activities of central counterparties and challenges associated with designing an appropriate stress testing framework.
The Dodd-Frank Act mandated the OFR to evaluate and report on stress tests. In Chapter 5, we discuss the design and application of stress tests for banks and nonbanks in areas such as insurance and asset management and the chal-lenges associated with creating a systemwide perspective. A complementary point of view on stress testing is developed in the section on networks. When built from transac-tion-level data, networks can be used to model the propaga-tion of shocks through the financial system and capture risks in changing business models.
The last section of Chapter 5 discusses potential risks in asset management. Risks arise from high leverage, which exists in some hedge funds, and the liquidity mismatch for some funds between asset holdings and investors’ claims. The section evaluates the potential for the propagation of a shock in a scenario that assumes funds face large redemptions.
The Agenda Ahead
In 2016, we will continue initiatives to improve the scope, quality, and accessibility of financial data, advance financial stability monitoring and research, and evaluate financial stability policies. We will also continue to further orga-nize our efforts in data, financial monitoring and assess-ment, research, and policy evaluation around core areas of concentration.
The first such core area is our data agenda, discussed in Chapter 6, which includes:
• Expanding the scope of data available for financial stability analysis, including moving ahead with preparations for permanent bilateral repo and secu-rities lending data collections. We will also publish a report describing best practices for regulatory data collections, drawing in part on lessons learned from the pilot repo data collection in 2015 and from long-standing data collections among our domestic and global counterparts.
• Continuing to identify, develop, and implement data standards in areas critical to financial stability, such as in derivatives, repos, and mortgage markets. We will also make progress on developing a financial instrument reference database and related instrument identifiers.
• Improving data accessibility within the regulatory com-munity and between the official sector and the public.

Executive Summary 5
Another top priority is to develop tools to assess, measure, and monitor risks across the financial system. Activities in 2016 will include:
• Making public our Money Market Fund Monitor, which we previewed in a public meeting of our Financial Research Advisory Committee in February 2015.
• Developing monitors on credit default swap markets and hedge funds.
• Continuing to improve our ability to assess potential financial stability risks through tracking market inno-vations and changes in market structure.
A third OFR core area of concentration will evaluate and measure the vulnerabilities in central clearing and in central counterparties. The OFR has increasingly focused on the potential risks in central counterparties in our annual reports and in recent papers and speeches, as have the FSOC and our international counterparts. The Financial Research Advisory Committee recently recommended that we con-duct further analysis and engage relevant national and inter-national authorities to improve the quality of data available to evaluate these risks.
Assessing and Monitoring Threats to Financial Stability 7
Overall, threats to U.S. financial stability remain in the medium range, but they have edged higher within that range over the past year. Three
major themes stand out: elevated and rising credit risks; the persistent effects of low interest rates; and the uneven resilience of the financial system.
2.1 Assessment of Threats to U.S. Financial Stability Our assessment of financial stability focuses on the elevated and rising credit risks in the U.S. nonfinancial business sector and emerging markets, the persistence of extraordinarily low interest rates and their effects on financial risk-taking, and the uneven structural resilience of the financial system. This assessment is informed by our Financial Stability Monitor, as well as broad financial system surveillance, data analysis, and research into specific vulnerabilities.
We focus on three major themes:
Elevated and rising credit risks. Credit risks in the U.S. nonfinancial business sector and emerging markets have been rising for some time. Those risks are now elevated, and likely will continue to rise. U.S. nonfinancial business debt growth continues at a rapid pace, fueled by highly accommodative credit and underwriting stan-dards; the ratio of corporate debt to gross domestic product (GDP) is at a historically elevated level; and firm leverage ratios continue to rise.
So far, distress in U.S. credit markets has been largely limited to the lowest-rated debt issuers and the energy and commodity industries. However, that distress may spread as investors now appear to be reassessing the credit and liquidity risks in these markets. U.S. corporate bond spreads have risen from their narrow 2014 levels toward long-term averages, better compensating investors for some, but by no means all, of the increased credit risk.
Macroeconomic fundamentals, meanwhile, have deteriorated: Slower global growth and lower inflation, a stronger dollar, and the plunge in commodity prices are weakening the debt-service capacity of many U.S. and emerging market borrowers. And many emerging market economies face even more elevated credit risks, with private-sector debt levels at historic highs after years of rapid credit expansion. A shock that significantly further impairs U.S. corporate or emerging market credit quality could potentially threaten U.S. financial stability.
The persistence and effects of low U.S. and global interest rates. U.S. interest rates remain in a historically low range, which continues to incentivize financial risk-taking and borrowing. Although the Federal Reserve is widely expected to begin raising interest rates imminently, the pace of tightening is expected to be gradual, and long-term interest rates appear to be suppressed by factors that may endure for some time.
Excesses related to the low-interest-rate environment could pose financial stability risks:
• Investors continue to reach for yield, taking on significant duration, volatility, and credit risk.
• Risk premiums in U.S. fixed-income markets are suppressed, raising the potential for rapid and disorderly repricing.
• The low level of interest rates underlies the high level and rapid growth of U.S. nonfinancial business debt and the associated credit risk, as discussed.
Uneven resilience. Since the financial crisis, regulatory reforms and changes in risk management practices have strengthened key institutions and markets critical to financial stability, including banks and systemically
Assessing and Monitoring Threats to Financial Stability 2
2015 OFR Financial Stability Report8
important institutions, financial infrastructure, and deriv-atives markets. The results include greatly reduced leverage and stronger liquidity positions in many financial insti-tutions, greater transparency, and more resilient business models. Chapter 3 provides a more detailed assessment. Although the overall resilience of the financial system has improved, that resilience is uneven.
There are a number of areas of vulnerability:
• Financial risks have migrated outside the regulatory perimeter to institutions and markets that appear less systemically important but also may be less trans-parent and potentially less resilient. This migration of risk requires continued vigilance.
• Market liquidity appears fragile in recent years. Liquidity in major financial markets has diminished sharply in a number of episodes, amplifying market shocks. To date, this has not resulted in financial instability, but it could do so in the event of a much larger shock.
• Run and fire-sale risks persist in securities financing markets. Progress has been made to address these vulnerabilities, but opportunities for runs and asset fire sales to amplify stress still exist.
• Interconnections among financial firms are evolving in ways not fully understood. For example, the growing use of central clearing should enhance resil-ience by bringing netting, transparency, regulatory oversight, and more standardized risk management to markets and products that were previously cleared and settled bilaterally. However, central clearing also con-centrates risk in central counterparties, or CCPs, and may transmit or amplify stress in new ways that need to be fully examined and matched with the necessary risk management and regulatory standards.
Summary Financial Stability Assessment
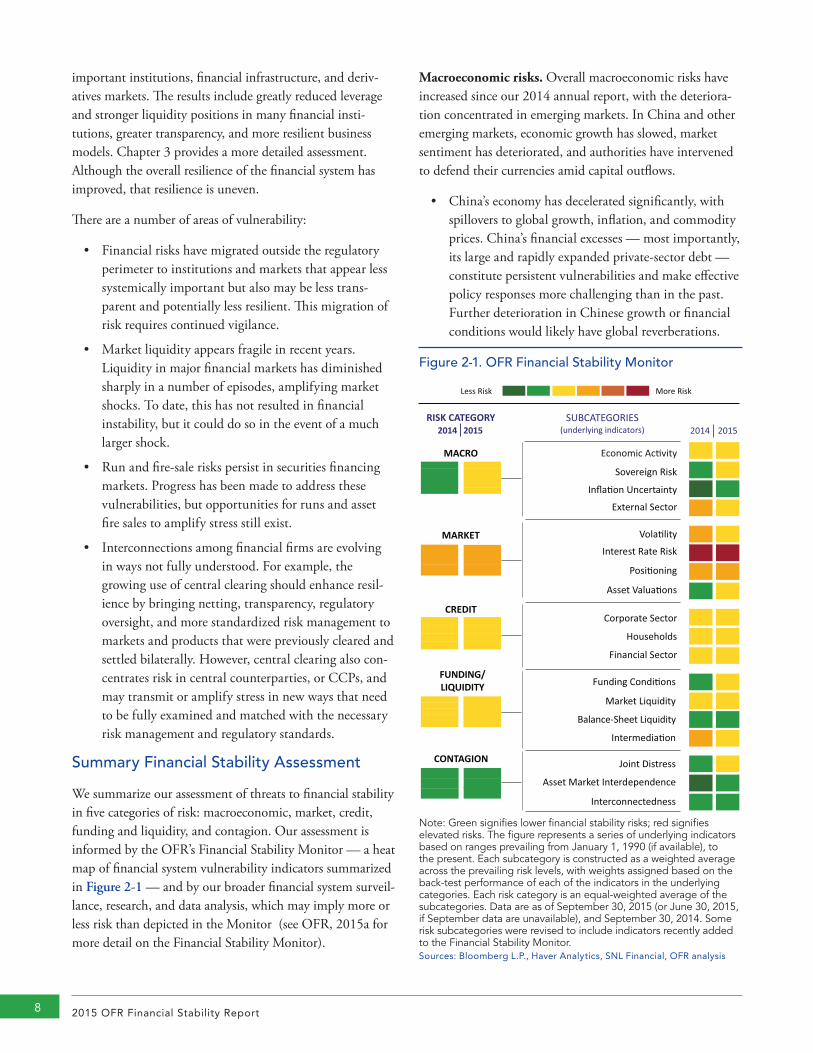
We summarize our assessment of threats to financial stability in five categories of risk: macroeconomic, market, credit, funding and liquidity, and contagion. Our assessment is informed by the OFR’s Financial Stability Monitor — a heat map of financial system vulnerability indicators summarized in Figure 2-1 — and by our broader financial system surveil-lance, research, and data analysis, which may imply more or less risk than depicted in the Monitor (see OFR, 2015a for more detail on the Financial Stability Monitor).
Macroeconomic risks. Overall macroeconomic risks have increased since our 2014 annual report, with the deteriora-tion concentrated in emerging markets. In China and other emerging markets, economic growth has slowed, market sentiment has deteriorated, and authorities have intervened to defend their currencies amid capital outflows.
• China’s economy has decelerated significantly, with spillovers to global growth, inflation, and commodity prices. China’s financial excesses — most importantly, its large and rapidly expanded private-sector debt — constitute persistent vulnerabilities and make effective policy responses more challenging than in the past. Further deterioration in Chinese growth or financial conditions would likely have global reverberations.
Figure 2-1. OFR Financial Stability Monitor
Note: Green signifies lower financial stability risks; red signifies elevated risks. The figure represents a series of underlying indicators based on ranges prevailing from January 1, 1990 (if available), to the present. Each subcategory is constructed as a weighted average across the prevailing risk levels, with weights assigned based on the back-test performance of each of the indicators in the underlying categories. Each risk category is an equal-weighted average of the subcategories. Data are as of September 30, 2015 (or June 30, 2015, if September data are unavailable), and September 30, 2014. Some risk subcategories were revised to include indicators recently added to the Financial Stability Monitor. Sources: Bloomberg L.P., Haver Analytics, SNL Financial, OFR analysis
2014 20152014 2015
Funding Condi�ons
Market Liquidity
Balance-Sheet Liquidity
Intermedia�on
Corporate Sector
Households
Financial Sector
Joint Distress
Asset Market Interdependence
Interconnectedness
Less Risk More Risk
Vola�lity
Interest Rate Risk
Posi�oning
Asset Valua�ons
Economic Ac�vity
Sovereign Risk
Infla�on Uncertainty
External Sector
SUBCATEGORIES(underlying indicators)
RISK CATEGORY
MACRO
CONTAGION
MARKET
FUNDING/LIQUIDITY
CREDIT
Assessing and Monitoring Threats to Financial Stability 9
• Other large emerging market economies have also faced growth slowdowns, capital outflows, shocks from commodity price declines, and spillover from China. Many of them face financial excesses after years of rapid private debt growth.
• U.S. economic and labor market expansion have remained resilient to the global growth slowdown. Consumer price inflation is low, but consumer inflation expectations appear well-anchored in their long-term range. However, U.S. growth and financial stability could be vulnerable in the case of instability in China and other emerging markets (see Emerging Market Spillover Risks in Section 2.2).
Market risks. A number of market risks — the risk of out-sized losses as a result of adverse movements in asset prices — remain elevated and important.
• U.S. Treasury term premiums remain close to zero by leading estimates, despite the conclusion of Federal Reserve Treasury purchases in 2014 and the expected approach of U.S. monetary tightening. Such low term premiums mean that long-term Treasury yields are scarcely pricing the interest rate and liquidity risk in these instruments, demonstrated most recently by the Treasury market sell-off in 2013 and liquidity stress on October 15, 2014. The underpricing of these risks also applies to the large universe of U.S.-dollar-denominated bonds that are priced based on U.S. Treasury yields. Furthermore, the factors now sup-pressing term premiums may persist even when the Federal Reserve tightens monetary policy, as occurred during the previous tightening cycle.
• Duration risk in U.S. bond portfolios remains at the upper end of its historical range, leaving investors vulnerable to losses from large changes in interest rates, whether caused by surprises in Federal Reserve monetary policy or other shocks (see Interest Rate Risk in Section 2.2).
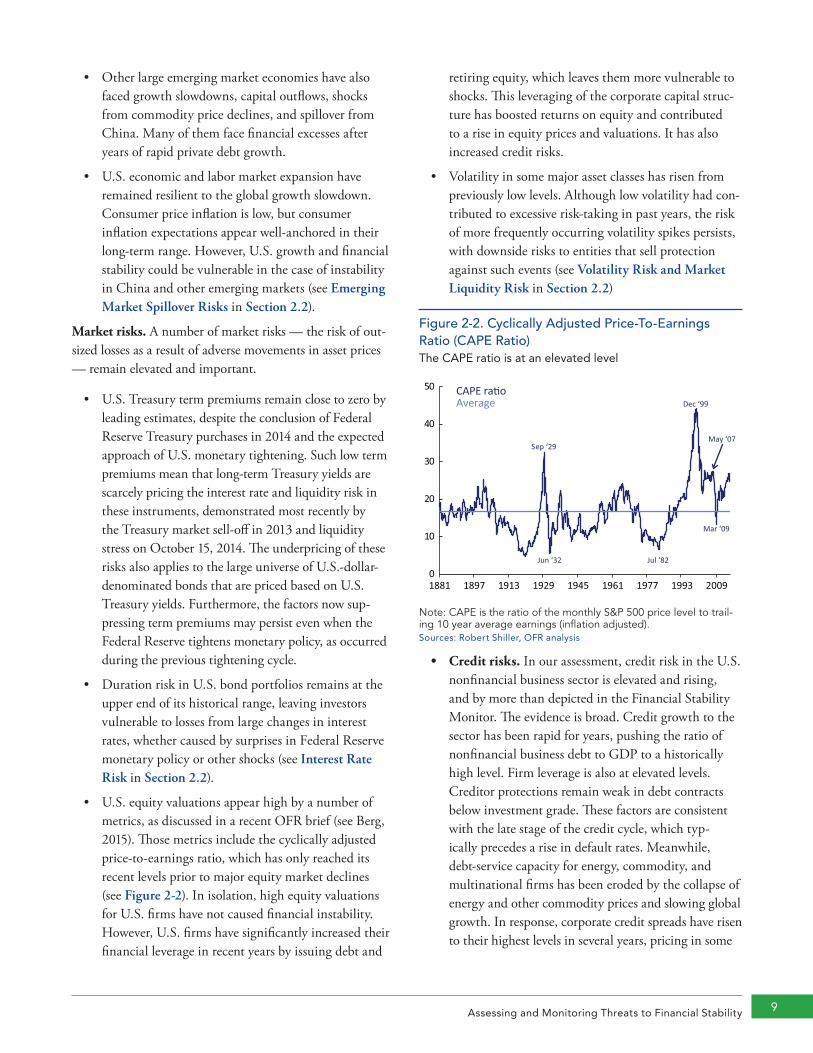
• U.S. equity valuations appear high by a number of metrics, as discussed in a recent OFR brief (see Berg, 2015). Those metrics include the cyclically adjusted price-to-earnings ratio, which has only reached its recent levels prior to major equity market declines (see Figure 2-2). In isolation, high equity valuations for U.S. firms have not caused financial instability. However, U.S. firms have significantly increased their financial leverage in recent years by issuing debt and
retiring equity, which leaves them more vulnerable to shocks. This leveraging of the corporate capital struc-ture has boosted returns on equity and contributed to a rise in equity prices and valuations. It has also increased credit risks.
• Volatility in some major asset classes has risen from previously low levels. Although low volatility had con-tributed to excessive risk-taking in past years, the risk of more frequently occurring volatility spikes persists, with downside risks to entities that sell protection against such events (see Volatility Risk and Market Liquidity Risk in Section 2.2)
Figure 2-2. Cyclically Adjusted Price-To-Earnings Ratio (CAPE Ratio)The CAPE ratio is at an elevated level
CAPE ra�oAverage
0
10
20
30
40
50
1881 1897 1913 1929 1945 1961 1977 1993 2009
Sep ‘29
Dec ‘99
May ‘07
Mar ‘09
Jun ‘32 Jul ‘82
Note: CAPE is the ratio of the monthly S&P 500 price level to trail-ing 10 year average earnings (inflation adjusted).Sources: Robert Shiller, OFR analysis
• Credit risks. In our assessment, credit risk in the U.S. nonfinancial business sector is elevated and rising, and by more than depicted in the Financial Stability Monitor. The evidence is broad. Credit growth to the sector has been rapid for years, pushing the ratio of nonfinancial business debt to GDP to a historically high level. Firm leverage is also at elevated levels. Creditor protections remain weak in debt contracts below investment grade. These factors are consistent with the late stage of the credit cycle, which typ-ically precedes a rise in default rates. Meanwhile, debt-service capacity for energy, commodity, and multinational firms has been eroded by the collapse of energy and other commodity prices and slowing global growth. In response, corporate credit spreads have risen to their highest levels in several years, pricing in some
2015 OFR Financial Stability Report10
of the increased credit risk, but not mitigating it (see Nonfinancial Corporate Credit Risk in Section 2.2).
Funding and liquidity risks. Funding conditions remain broadly stable, though market liquidity episodically appears to be fragile — an amplifier of financial stress. This fragility was evident in the 2010 U.S. equity flash crash, the 2013 U.S. Treasury market sell-offs, the October 2014 Treasury “flash rally,” and other episodes. Although this weakness is difficult to directly measure and quantify with time series data and many measures of steady-state liquidity appear ample, studies of these stress episodes revealed sharp reduc-tions in liquidity that amplified the shocks. In the event of much larger shocks, such reductions in liquidity could be destabilizing (see Market Liquidity Risk in Section 2.2).
Contagion risks. Overall contagion risk measured by the available indicators has increased since our last annual report. Measures of joint distress among the largest U.S. bank holding companies and asset market interdependence have increased since the OFR’s 2014 Annual Report due to pronounced financial market volatility in the third quarter. Overall, the risk reported by our contagion indicators is low, reflecting historically high capital and liquidity buffers among large U.S. financial institutions, as well as reduced market-implied expectations for a chain of defaults across firms. However, it is difficult to measure contagion risk in a forward-looking way, particularly across the entire finan-cial system. In our assessment, the financial system remains highly interconnected and the risks of cross-asset and cross-firm stress transmission are higher than the aggregate of available measures suggests.
2.2 Focus on Selected RisksNonfinancial Corporate Credit Risk
Signs of excess in U.S. nonfinancial corporate credit markets have persisted since our last report. Rapid debt growth continued, and the ratio of nonfinancial business debt to GDP reached a new post-crisis high. Balance sheet leverage, particularly for highly-rated firms, has continued to rise as new debt continued to increase and earnings fell. The rise in leverage is most pronounced among more vulnerable companies — firms with already elevated debt levels or weak repayment capacity.
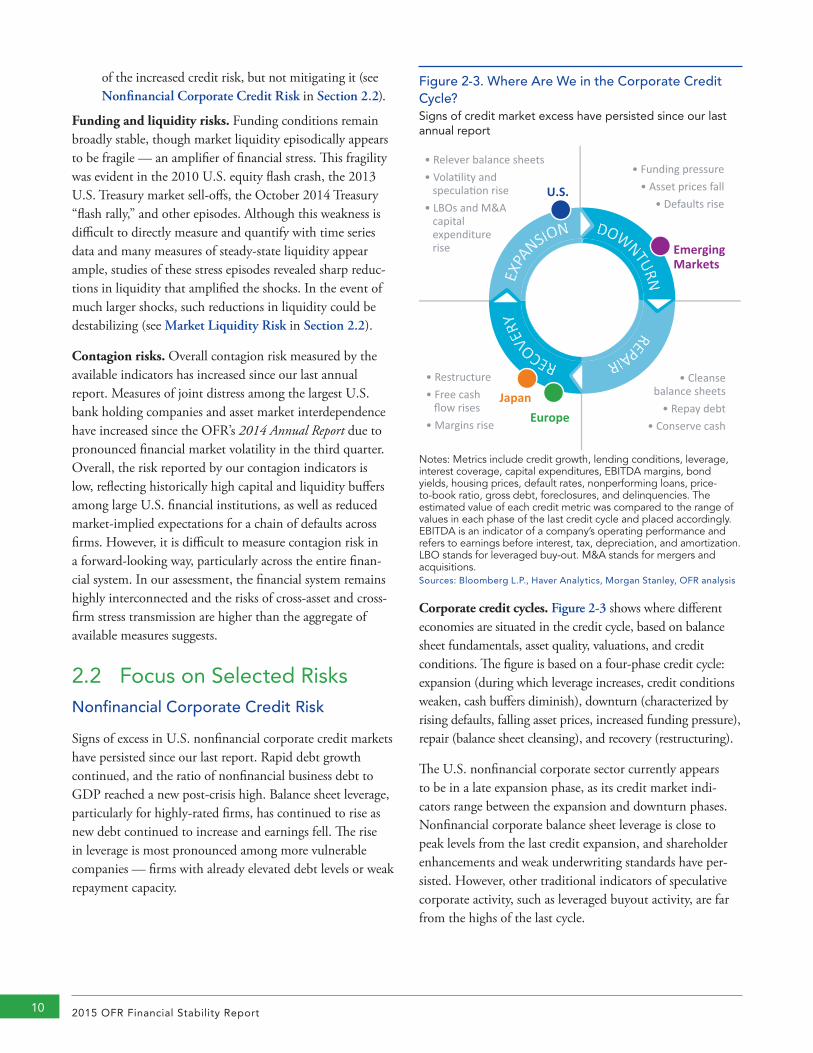
Corporate credit cycles. Figure 2-3 shows where different economies are situated in the credit cycle, based on balance sheet fundamentals, asset quality, valuations, and credit conditions. The figure is based on a four-phase credit cycle: expansion (during which leverage increases, credit conditions weaken, cash buffers diminish), downturn (characterized by rising defaults, falling asset prices, increased funding pressure), repair (balance sheet cleansing), and recovery (restructuring).
The U.S. nonfinancial corporate sector currently appears to be in a late expansion phase, as its credit market indi-cators range between the expansion and downturn phases. Nonfinancial corporate balance sheet leverage is close to peak levels from the last credit expansion, and shareholder enhancements and weak underwriting standards have per-sisted. However, other traditional indicators of speculative corporate activity, such as leveraged buyout activity, are far from the highs of the last cycle.
Figure 2-3. Where Are We in the Corporate Credit Cycle?Signs of credit market excess have persisted since our last annual report
Emerging Markets
Japan
U.S.
Europe
• Funding pressure• Asset prices fall
• Defaults rise
• Relever balance sheets• Vola�lity and specula�on rise • LBOs and M&A capital expenditure rise
• Restructure• Free cash flow rises • Margins rise
• Cleanse balance sheets
• Repay debt• Conserve cash
REPAPPIRRECOVERY
EXPAPP
NSION DOWNTURN
Notes: Metrics include credit growth, lending conditions, leverage, interest coverage, capital expenditures, EBITDA margins, bond yields, housing prices, default rates, nonperforming loans, price-to-book ratio, gross debt, foreclosures, and delinquencies. The estimated value of each credit metric was compared to the range of values in each phase of the last credit cycle and placed accordingly. EBITDA is an indicator of a company’s operating performance and refers to earnings before interest, tax, depreciation, and amortization. LBO stands for leveraged buy-out. M&A stands for mergers and acquisitions. Sources: Bloomberg L.P., Haver Analytics, Morgan Stanley, OFR analysis
Assessing and Monitoring Threats to Financial Stability 11
European corporations show signs of being in the early recovery phase of the credit cycle, as suggested by relatively conservative corporate behavior and improving economic momentum. Japan continues to move through the recovery phase, driven by a weaker yen, falling commodity prices, and a stable funding environment.
Credit conditions in emerging markets appear to be in the downturn phase of the credit cycle as exposure to commodity sectors weighs on fundamentals and attempts to deleverage are constrained by falling asset valuations. Emerging market companies that have borrowed heavily in foreign currency could eventually face balance-sheet strains, posing debt service and repayment risks (see Emerging Market Spillover Risks).
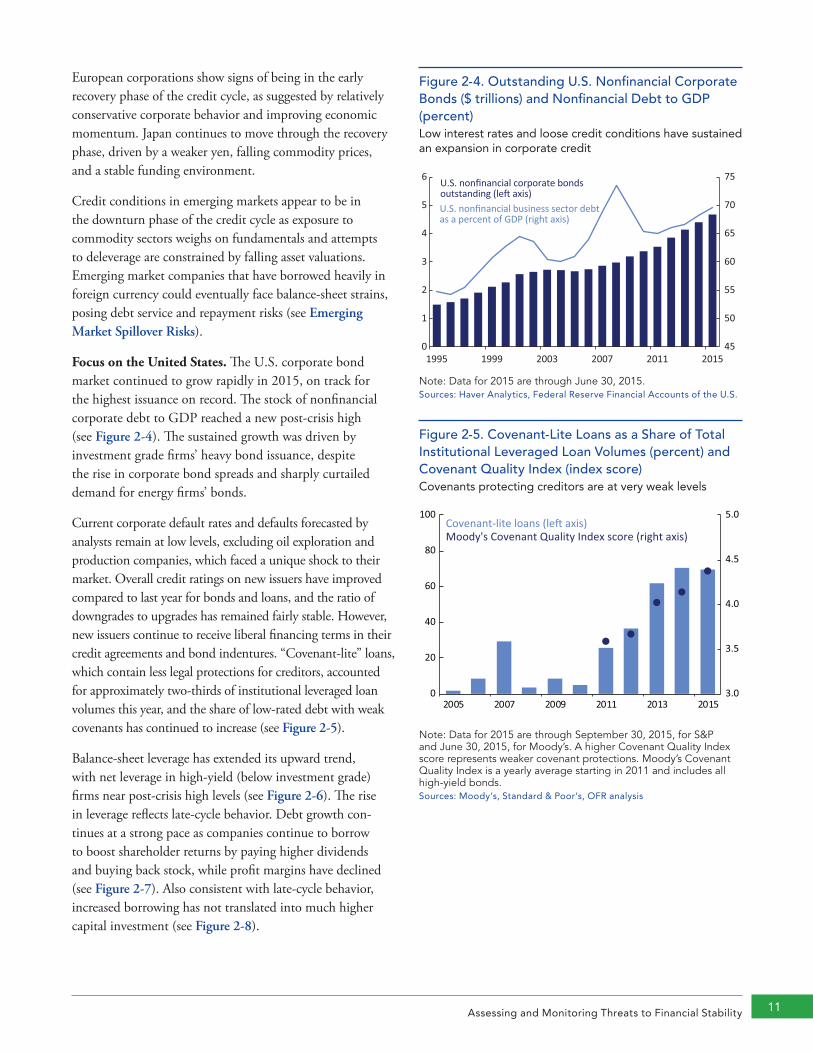
Focus on the United States. The U.S. corporate bond market continued to grow rapidly in 2015, on track for the highest issuance on record. The stock of nonfinancial corporate debt to GDP reached a new post-crisis high (see Figure 2-4). The sustained growth was driven by investment grade firms’ heavy bond issuance, despite the rise in corporate bond spreads and sharply curtailed demand for energy firms’ bonds.
Current corporate default rates and defaults forecasted by analysts remain at low levels, excluding oil exploration and production companies, which faced a unique shock to their market. Overall credit ratings on new issuers have improved compared to last year for bonds and loans, and the ratio of downgrades to upgrades has remained fairly stable. However, new issuers continue to receive liberal financing terms in their credit agreements and bond indentures. “Covenant-lite” loans, which contain less legal protections for creditors, accounted for approximately two-thirds of institutional leveraged loan volumes this year, and the share of low-rated debt with weak covenants has continued to increase (see Figure 2-5).
Balance-sheet leverage has extended its upward trend, with net leverage in high-yield (below investment grade) firms near post-crisis high levels (see Figure 2-6). The rise in leverage reflects late-cycle behavior. Debt growth con-tinues at a strong pace as companies continue to borrow to boost shareholder returns by paying higher dividends and buying back stock, while profit margins have declined (see Figure 2-7). Also consistent with late-cycle behavior, increased borrowing has not translated into much higher capital investment (see Figure 2-8).
Figure 2-4. Outstanding U.S. Nonfinancial Corporate Bonds ($ trillions) and Nonfinancial Debt to GDP (percent)Low interest rates and loose credit conditions have sustained an expansion in corporate credit
45
50
55
60
65
70
75
0
1
2
3
4
5
6
1995 1999 2003 2007 2011 2015
U.S. nonfinancial corporate bondsoutstanding (le� axis) U.S. nonfinancial business sector debtas a percent of GDP (right axis)
Note: Data for 2015 are through June 30, 2015.Sources: Haver Analytics, Federal Reserve Financial Accounts of the U.S.
Figure 2-5. Covenant-Lite Loans as a Share of Total Institutional Leveraged Loan Volumes (percent) and Covenant Quality Index (index score)Covenants protecting creditors are at very weak levels
Covenant-lite loans (le� axis)Moody's Covenant Quality Index score (right axis)
3.0
3.5
4.0
4.5
5.0
0
20
40
60
80
100
2005 2007 2009 2011 2013 2015
Note: Data for 2015 are through September 30, 2015, for S&P and June 30, 2015, for Moody’s. A higher Covenant Quality Index score represents weaker covenant protections. Moody’s Covenant Quality Index is a yearly average starting in 2011 and includes all high-yield bonds.Sources: Moody’s, Standard & Poor’s, OFR analysis

2015 OFR Financial Stability Report12
Figure 2-6. High-Yield U.S. Nonfinancial Median Debt-to-EBITDA (ratio)U.S. corporate net leverage continues its upward trend
Gross leverageNet leverage
2.0
2.5
3.0
3.5
4.0
4.5
2007 2008 2009 2010 2011 2012 2013 2014 2015
Note: Data for 2015 are through March 31, 2015. EBITDA is an indicator of a company’s operating performance; it stands for earn-ings before interest, taxes, depreciation, and amortization. Gross leverage is the ratio of total debt to EBITDA. Net leverage is the ratio of net debt to EBITDA, where net debt is total debt less cash and short-term investments.Source: Morgan Stanley
Figure 2-8. Growth in Median Capital Expenditures by High-Yield U.S. Nonfinancial Corporations (year-over-year percent change)Debt financing is not translating into strong growth in corporate investment
-20
-10
0
10
20
30
40
2005 2007 2009 2011 2013 2015
Note: Data for 2015 are through March 31, 2015.Source: Morgan Stanley
Figure 2-7. High-Yield U.S. Nonfinancial Median Year-Over-Year EBITDA Margin and Sales Growth (percent)Debt levels are rising, sales growth is weak, and EBITDA is diminishing
Year-over-year change in sales growthYear-over-year change in EBITDA margins
-20
-10
0
10
20
2007 2009 2011 2013 2015
Note: Data for 2015 are through March 31, 2015. EBITDA stands for earnings before interest, taxes, depreciation, and amortization.Sources: Morgan Stanley, OFR analysis
Figure 2-9. High-Yield U.S. Nonfinancial Interest Coverage and Cash-to-Debt (ratio, percent)Interest coverage is still high, but the cash-to-debt ratio has fallen, presaging balance sheet liquidity risk
Interest coverage (le� axis)Cash as a percent of debt (right axis)
2.0
4.0
6.0
8.0
10.0
12.0
14.0
16.0
2.00
2.50
3.00
3.50
4.00
4.50
5.00
1997 2000 2003 2006 2009 2012 2015
Note: Data for 2015 are through March 31, 2015.Sources: Morgan Stanley, OFR analysis
Assessing and Monitoring Threats to Financial Stability 13
Figure 2-10. High-Yield U.S. Bond and Leveraged Loan M&A/LBO-related Issuances ($ billions)Merger-and-acquisition volumes are approaching peak levels
0
100
200
300
400
500
2005 2007 2009 2011 2013 2015
High-yield bondsLeveraged loans
Note: Gray represents annualized figure as of September 30, 2015. M&A stands for mergers and aquisitions. LBO stands for leveraged buy-out.Sources: Standard & Poor’s, OFR analysis
Figure 2-11. Leveraged Loan Issuance by Use of Proceeds (percent)New issue proceeds have shifted from refinancing debt to funding acquisitions
0
20
40
60
80
100
2005 2007 2009 2011 2013 2015
Other
Refinancing
Dividend payment and share buyback
Mergers, acquisi�ons,and leveraged buy-outs
Sources: Standard & Poor’s, OFR analysis
On the other hand, interest coverage continues to improve for speculative grade firms because historically low interest rates have allowed firms to borrow more cheaply and refi-nance at lower rates (see Figure 2-9). Interest costs would likely rise as interest rates increase, although borrowing rates would need to rise substantially before interest coverage would become a broad concern.
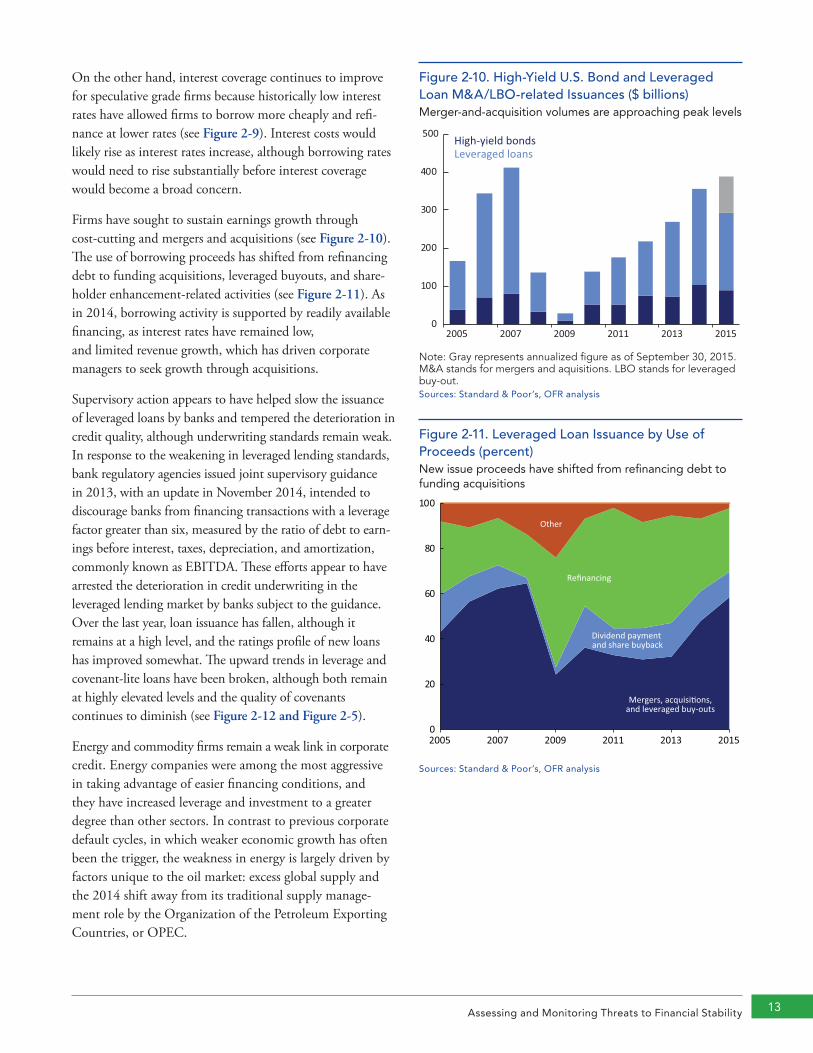
Firms have sought to sustain earnings growth through cost-cutting and mergers and acquisitions (see Figure 2-10). The use of borrowing proceeds has shifted from refinancing debt to funding acquisitions, leveraged buyouts, and share-holder enhancement-related activities (see Figure 2-11). As in 2014, borrowing activity is supported by readily available financing, as interest rates have remained low, and limited revenue growth, which has driven corporate managers to seek growth through acquisitions.
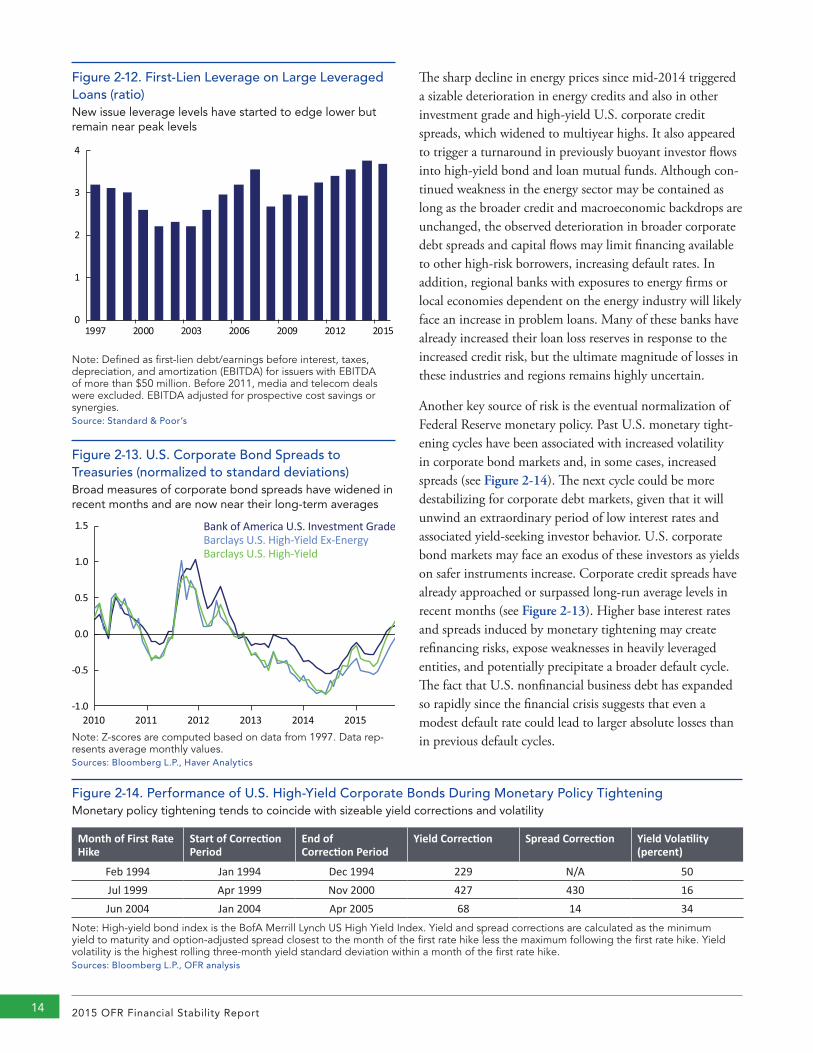
Supervisory action appears to have helped slow the issuance of leveraged loans by banks and tempered the deterioration in credit quality, although underwriting standards remain weak. In response to the weakening in leveraged lending standards, bank regulatory agencies issued joint supervisory guidance in 2013, with an update in November 2014, intended to discourage banks from financing transactions with a leverage factor greater than six, measured by the ratio of debt to earn-ings before interest, taxes, depreciation, and amortization, commonly known as EBITDA. These efforts appear to have arrested the deterioration in credit underwriting in the leveraged lending market by banks subject to the guidance. Over the last year, loan issuance has fallen, although it remains at a high level, and the ratings profile of new loans has improved somewhat. The upward trends in leverage and covenant-lite loans have been broken, although both remain at highly elevated levels and the quality of covenants continues to diminish (see Figure 2-12 and Figure 2-5).
Energy and commodity firms remain a weak link in corporate credit. Energy companies were among the most aggressive in taking advantage of easier financing conditions, and they have increased leverage and investment to a greater degree than other sectors. In contrast to previous corporate default cycles, in which weaker economic growth has often been the trigger, the weakness in energy is largely driven by factors unique to the oil market: excess global supply and the 2014 shift away from its traditional supply manage-ment role by the Organization of the Petroleum Exporting Countries, or OPEC.
2015 OFR Financial Stability Report14
Figure 2-12. First-Lien Leverage on Large Leveraged Loans (ratio)New issue leverage levels have started to edge lower but remain near peak levels
0
1
2
3
4
1997 2000 2003 2006 2009 2012 2015
Note: Defined as first-lien debt/earnings before interest, taxes, depreciation, and amortization (EBITDA) for issuers with EBITDA of more than $50 million. Before 2011, media and telecom deals were excluded. EBITDA adjusted for prospective cost savings or synergies.Source: Standard & Poor’s
Figure 2-13. U.S. Corporate Bond Spreads to Treasuries (normalized to standard deviations) Broad measures of corporate bond spreads have widened in recent months and are now near their long-term averages
Bank of America U.S. Investment GradeBarclays U.S. High-Yield Ex-EnergyBarclays U.S. High-Yield
-1.0
-0.5
0.0
0.5
1.0
1.5
2010 2011 2012 2013 2014 2015Note: Z-scores are computed based on data from 1997. Data rep-resents average monthly values. Sources: Bloomberg L.P., Haver Analytics
Figure 2-14. Performance of U.S. High-Yield Corporate Bonds During Monetary Policy Tightening Monetary policy tightening tends to coincide with sizeable yield corrections and volatility
Month of First Rate Hike
Start of Correction Period
End of Correction Period
Yield Correction Spread Correction Yield Volatility(percent)
Feb 1994 Jan 1994 Dec 1994 229 N/A 50Jul 1999 Apr 1999 Nov 2000 427 430 16Jun 2004 Jan 2004 Apr 2005 68 14 34
Note: High-yield bond index is the BofA Merrill Lynch US High Yield Index. Yield and spread corrections are calculated as the minimum yield to maturity and option-adjusted spread closest to the month of the first rate hike less the maximum following the first rate hike. Yield volatility is the highest rolling three-month yield standard deviation within a month of the first rate hike.Sources: Bloomberg L.P., OFR analysis
The sharp decline in energy prices since mid-2014 triggered a sizable deterioration in energy credits and also in other investment grade and high-yield U.S. corporate credit spreads, which widened to multiyear highs. It also appeared to trigger a turnaround in previously buoyant investor flows into high-yield bond and loan mutual funds. Although con-tinued weakness in the energy sector may be contained as long as the broader credit and macroeconomic backdrops are unchanged, the observed deterioration in broader corporate debt spreads and capital flows may limit financing available to other high-risk borrowers, increasing default rates. In addition, regional banks with exposures to energy firms or local economies dependent on the energy industry will likely face an increase in problem loans. Many of these banks have already increased their loan loss reserves in response to the increased credit risk, but the ultimate magnitude of losses in these industries and regions remains highly uncertain.
Another key source of risk is the eventual normalization of Federal Reserve monetary policy. Past U.S. monetary tight-ening cycles have been associated with increased volatility in corporate bond markets and, in some cases, increased spreads (see Figure 2-14). The next cycle could be more destabilizing for corporate debt markets, given that it will unwind an extraordinary period of low interest rates and associated yield-seeking investor behavior. U.S. corporate bond markets may face an exodus of these investors as yields on safer instruments increase. Corporate credit spreads have already approached or surpassed long-run average levels in recent months (see Figure 2-13). Higher base interest rates and spreads induced by monetary tightening may create refinancing risks, expose weaknesses in heavily leveraged entities, and potentially precipitate a broader default cycle. The fact that U.S. nonfinancial business debt has expanded so rapidly since the financial crisis suggests that even a modest default rate could lead to larger absolute losses than in previous default cycles.
Assessing and Monitoring Threats to Financial Stability 15
Market Liquidity Risk
Resilient market liquidity is essential to financial stability. It allows an asset to be traded quickly and in large volumes without substantially affecting its price. Severe or sustained shortages of liquidity can cause disorderly changes in market prices and large financial losses, which can become a self- reinforcing cycle.
Market liquidity appears to have been fragile in recent years, declining sharply during a number of market shocks even in the largest, most liquid markets. Such sharp declines in liquidity amplify market stress and could, in the event of a sufficiently large shock, threaten broader financial stability. Bond market participants sometimes attribute the deterioration of liquidity to changes in regulation — particularly increased capital requirements for banks — but closer analysis indicates a number of other factors have changed liquidity conditions since the financial crisis. Some factors are structural, such as the increase in auto-mated trading, changes in market-maker risk appetite, and changes in the investor base. Other factors are cyclical, such as lower returns in a period of extraordinarily low interest rates and changes in the supply of collateral. There is wide recognition that many of these factors have shaped market liquidity. Their relative importance is widely debated but not easily measured.
The post-crisis period has been characterized by long stretches of relatively ample liquidity and low volatility, punctuated by episodes of sizeable volatility and impaired market liquidity, even in traditionally deep, liquid markets. Although the fragility of market liquidity is difficult to mea-sure, the incidence of illiquidity amplifying shocks in major markets illustrates it:
• May 6, 2010, “Flash Crash:” The prices of many U.S. equities and equity-based products experienced a severe, short-lived sell-off, with many stocks falling 5 percent to 15 percent before reversing. The interagency report on the episode found that two “liquidity crises” amplified the effect of a large sell order on the market (see CFTC and SEC, 2010).
• Mid-2013 “Taper Tantrum:” U.S. Treasury yields sold off sharply, beginning in late May, triggered by a change in U.S. monetary policy expectations, with spillovers across U.S.-dollar denominated bond markets. Market participants cited impaired trading
liquidity, confirmed by subsequent studies (see Adrian and others, 2015b).
• October 15, 2014, “Flash Rally:” U.S. Treasury yields fell by seven to eight standard deviations during the day, despite the lack of a significant fundamental driver. The single-day trading range was the fourth-largest on record. The official report on the episode found that liquidity conditions were “significantly strained” (see U.S. Treasury and others, 2015).
• April-May 2015 Bund sell-off: After reaching historic lows, yields on German Bund futures rose sharply over several days as crowded trades associated with the European Central Bank’s asset purchase program were rapidly unwound. Price action on May 7 represented a four-standard-deviation move for a single trading day.
• August 24, 2015, equity and exchange-traded fund (ETF) dislocations: U.S. equities sold off sharply, triggering market circuit breakers that halted trading in futures and cash equities. This sell-off compli-cated trading and pricing for ETFs linked to the equities, creating price dislocations for some funds (see The Potential Role of ETFs in Generating and Propagating Liquidity Stress).
These episodes have not led to broad financial instability, but the fragility of market liquidity served to amplify the initial market shocks; in the event of a sufficiently large shock, the reduction of liquidity could prove destabilizing.
Many factors appear to be contributing to the observed fra-gility in market liquidity. The following discussion summa-rizes those factors, based on OFR discussions with industry participants and a review of studies and regulatory commu-nications, including Adrian and others (2013, 2015),BIS (2014b), Dudley (2015), IMF (2015a), Powell (2015b), PricewaterhouseCoopers (2015), and Oliver Wyman (2012).
• Regulatory reforms. Higher bank capital stan-dards increased the capital cost of trading books and securities financing activities, reducing their return on equity. The Volcker Rule requires banks and their affil-iates to refrain from proprietary trading, although the rule does not prohibit market making. These regula-tory reforms addressed critical systemic vulnerabilities revealed by the financial crisis; they have also affected trading and funding liquidity in securities markets.
2015 OFR Financial Stability Report16
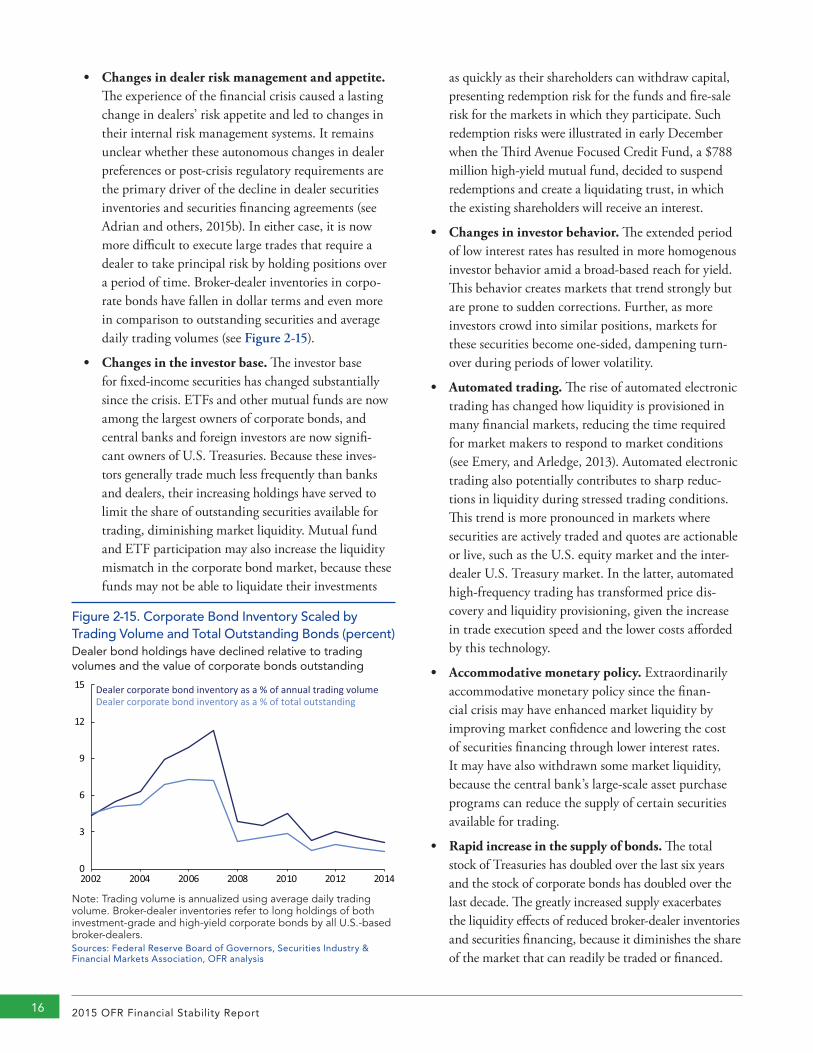
Figure 2-15. Corporate Bond Inventory Scaled by Trading Volume and Total Outstanding Bonds (percent)Dealer bond holdings have declined relative to trading volumes and the value of corporate bonds outstanding
0
3
6
9
12
15
2002 2004 2006 2008 2010 2012 2014
Dealer corporate bond inventory as a % of annual trading volumeDealer corporate bond inventory as a % of total outstanding
Note: Trading volume is annualized using average daily trading volume. Broker-dealer inventories refer to long holdings of both investment-grade and high-yield corporate bonds by all U.S.-based broker-dealers.Sources: Federal Reserve Board of Governors, Securities Industry & Financial Markets Association, OFR analysis
• Changes in dealer risk management and appetite. The experience of the financial crisis caused a lasting change in dealers’ risk appetite and led to changes in their internal risk management systems. It remains unclear whether these autonomous changes in dealer preferences or post-crisis regulatory requirements are the primary driver of the decline in dealer securities inventories and securities financing agreements (see Adrian and others, 2015b). In either case, it is now more difficult to execute large trades that require a dealer to take principal risk by holding positions over a period of time. Broker-dealer inventories in corpo-rate bonds have fallen in dollar terms and even more in comparison to outstanding securities and average daily trading volumes (see Figure 2-15).
• Changes in the investor base. The investor base for fixed-income securities has changed substantially since the crisis. ETFs and other mutual funds are now among the largest owners of corporate bonds, and central banks and foreign investors are now signifi-cant owners of U.S. Treasuries. Because these inves-tors generally trade much less frequently than banks and dealers, their increasing holdings have served to limit the share of outstanding securities available for trading, diminishing market liquidity. Mutual fund and ETF participation may also increase the liquidity mismatch in the corporate bond market, because these funds may not be able to liquidate their investments
as quickly as their shareholders can withdraw capital, presenting redemption risk for the funds and fire-sale risk for the markets in which they participate. Such redemption risks were illustrated in early December when the Third Avenue Focused Credit Fund, a $788 million high-yield mutual fund, decided to suspend redemptions and create a liquidating trust, in which the existing shareholders will receive an interest.
• Changes in investor behavior. The extended period of low interest rates has resulted in more homogenous investor behavior amid a broad-based reach for yield. This behavior creates markets that trend strongly but are prone to sudden corrections. Further, as more investors crowd into similar positions, markets for these securities become one-sided, dampening turn-over during periods of lower volatility.
• Automated trading. The rise of automated electronic trading has changed how liquidity is provisioned in many financial markets, reducing the time required for market makers to respond to market conditions (see Emery, and Arledge, 2013). Automated electronic trading also potentially contributes to sharp reduc-tions in liquidity during stressed trading conditions. This trend is more pronounced in markets where securities are actively traded and quotes are actionable or live, such as the U.S. equity market and the inter-dealer U.S. Treasury market. In the latter, automated high-frequency trading has transformed price dis-covery and liquidity provisioning, given the increase in trade execution speed and the lower costs afforded by this technology.
• Accommodative monetary policy. Extraordinarily accommodative monetary policy since the finan-cial crisis may have enhanced market liquidity by improving market confidence and lowering the cost of securities financing through lower interest rates. It may have also withdrawn some market liquidity, because the central bank’s large-scale asset purchase programs can reduce the supply of certain securities available for trading.
• Rapid increase in the supply of bonds. The total stock of Treasuries has doubled over the last six years and the stock of corporate bonds has doubled over the last decade. The greatly increased supply exacerbates the liquidity effects of reduced broker-dealer inventories and securities financing, because it diminishes the share of the market that can readily be traded or financed.
]Insert Section Title[ 17Assessing and Monitoring Threats to Financial Stability 17
Discretionary liquidity provided by exchange-traded funds (ETFs) may be prone to disruptions when market volatility increases.
Shares in ETFs are traded on an exchange throughout the day at market-determined prices, unlike mutual funds, whose shares can only be traded at the net asset value calculated at the end of each business day. Market makers facilitate trading and profit from a small margin they earn between the purchase and sale price of ETF shares.
Most ETFs provide daily information about their portfolio composition, and exchanges where ETF shares are traded frequently update the intraday indicative values of ETF shares. If traders notice a difference between the underlying portfolio value and the ETF share price in the market, they can arbitrage the difference, narrowing the gap. This arbitrage mechanism is primarily based on the assumption that accurate pricing of the ETF assets is available during the day and designed to minimize a potential discount to the net asset value an ETF investor would have to pay for ETF market liquidity.
To date, there have been no sustained disruptions in ETF secondary market liquidity. During the financial crisis and subsequent episodes of heightened market volatility, trading of ETF shares remained active. The resilience of the ETF market underscores the benefits that such funds offer to investors, including low cost, intraday liquidity, portfolio transparency, and electronic trading.
However, in our 2014 Annual Report, we illustrated how risks associated with liquidity mismatches in bank loan ETFs could lead to a self-reinforcing cycle of liquidity-in-duced price declines, owing to different settlement prac-tices. On August 24, extraordinary volatility in U.S. equity markets diminished the ability of market makers to price assets within ETF portfolios. During this episode, the arbi-trage mechanism failed to prevent the market price of some ETFs from diverging significantly from the value of their underlying portfolios, leading to significant volatility (see BlackRock, 2015). Although mutual fund investors were also affected by the asset price decline, ETF investors were more affected because ETF prices adjust throughout the trading day. There were also wide variations in this impact,
even among ETFs benchmarked to the same index. More research is needed to understand why seemingly similar ETFs may experience wide variations in trading.
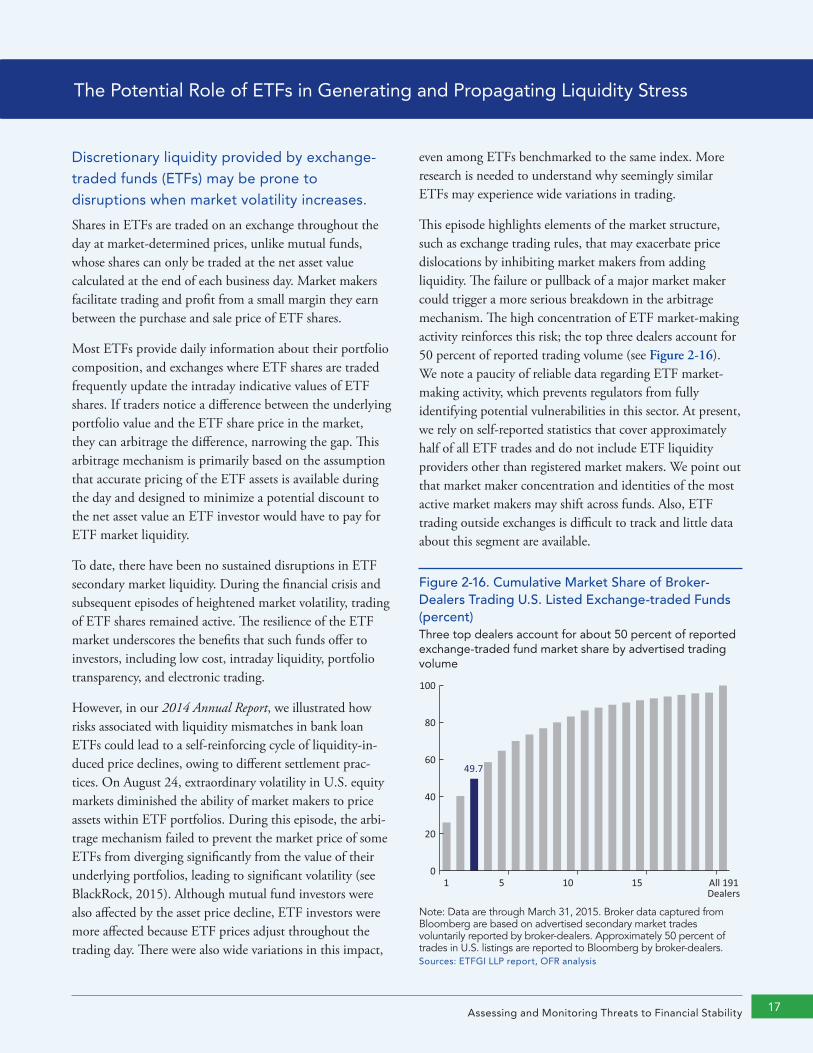
This episode highlights elements of the market structure, such as exchange trading rules, that may exacerbate price dislocations by inhibiting market makers from adding liquidity. The failure or pullback of a major market maker could trigger a more serious breakdown in the arbitrage mechanism. The high concentration of ETF market-making activity reinforces this risk; the top three dealers account for 50 percent of reported trading volume (see Figure 2-16). We note a paucity of reliable data regarding ETF market- making activity, which prevents regulators from fully identifying potential vulnerabilities in this sector. At present, we rely on self-reported statistics that cover approximately half of all ETF trades and do not include ETF liquidity providers other than registered market makers. We point out that market maker concentration and identities of the most active market makers may shift across funds. Also, ETF trading outside exchanges is difficult to track and little data about this segment are available.
Figure 2-16. Cumulative Market Share of Broker-Dealers Trading U.S. Listed Exchange-traded Funds (percent)Three top dealers account for about 50 percent of reported exchange-traded fund market share by advertised trading volume
49.7
1 5 10 15 All 191Dealers
0
20
40
60
80
100
Note: Data are through March 31, 2015. Broker data captured from Bloomberg are based on advertised secondary market trades voluntarily reported by broker-dealers. Approximately 50 percent of trades in U.S. listings are reported to Bloomberg by broker-dealers.Sources: ETFGI LLP report, OFR analysis
The Potential Role of ETFs in Generating and Propagating Liquidity Stress
2015 OFR Financial Stability Report18 2015 OFR Financial Stability Report18
Market making plays a critical role in the trading of ETFs. Industry research shows the volume of ETF shares traded on exchanges is substantially greater than the volume of shares issued or redeemed from ETF portfolios (see Antoniewicz, and Heinrichs, 2015, BlackRock, 2015). Around 90 percent of the daily activity in all ETF shares occurs on exchanges and is facilitated by dealers, who rely on their own sources of funding to facilitate this activity.
Some of the larger market makers in the ETF market also appear to gain access to liquidity by placing ETF shares as collateral in the repo market. This finding is based on the Securities and Exchange Commission’s (SEC’s) Form
N-MFP data on money market fund portfolio holdings. (Incomplete collateral information limits our visibility on the financing of ETF shares in relation to other types of cash investors.) Consequently, a disruption in the dealer funding markets could affect a market maker’s ability to finance its inventory in ETF shares and decrease the amount of liquidity it provides to support ETF trading. In May 2015, the SEC released a proposal to collect more granular data from investment companies on their repo market activity, as well as ETF trading activity. This information may provide better visibility into the use of ETF shares as collateral in repo markets.
Interest Rate Risk
Investor exposure to interest rate risk remains histori-cally high, making investment positions susceptible to greater losses in the event of large interest rate increases. Such increases could be caused by surprises in the Federal Reserve’s normalization of monetary policy — expected to be carried out over the next several years — or other shocks. The Federal Reserve itself faces challenges in normalizing monetary policy. And several factors are keeping interest rates well below past norms. If these factors changed sud-denly, an interest rate shock or the inability of the Federal Reserve to normalize policy as desired could threaten finan-cial stability.
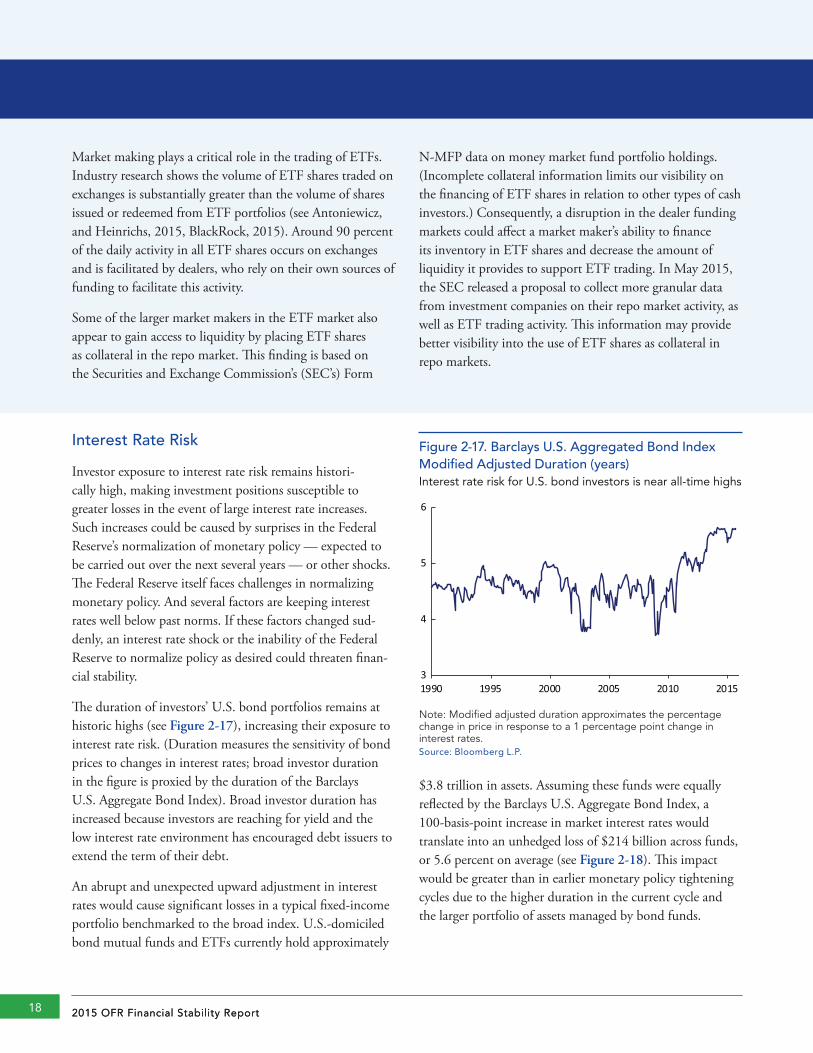
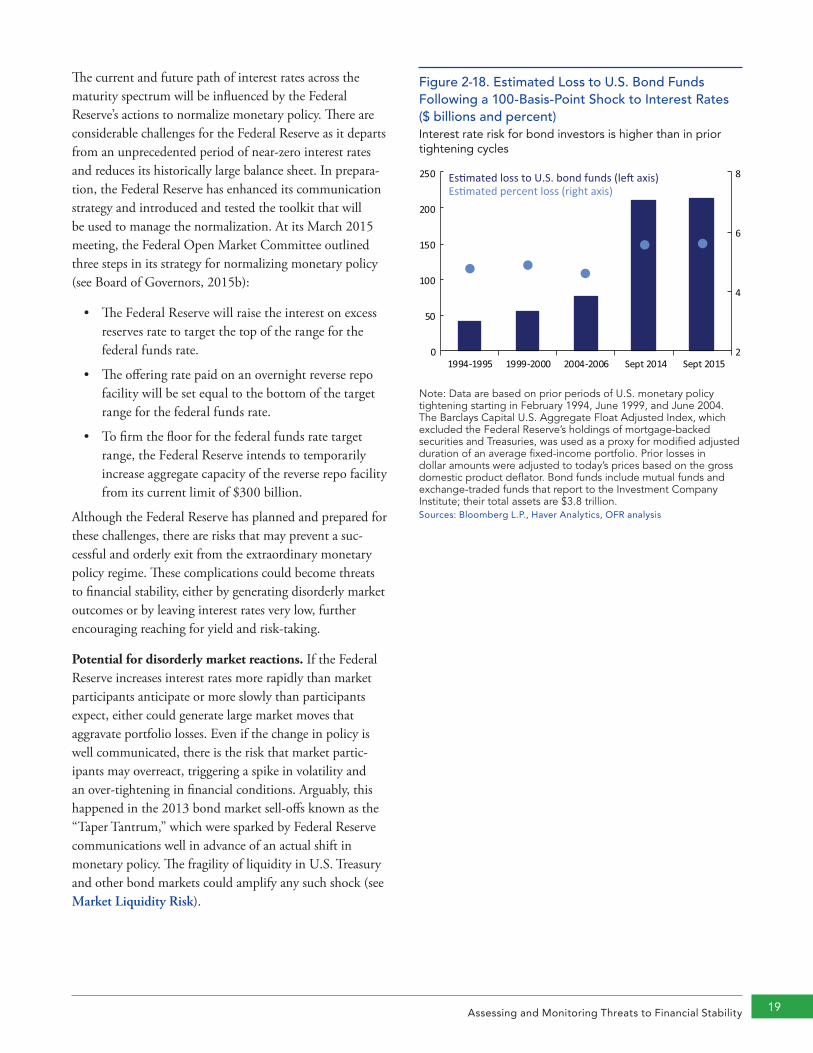
The duration of investors’ U.S. bond portfolios remains at historic highs (see Figure 2-17), increasing their exposure to interest rate risk. (Duration measures the sensitivity of bond prices to changes in interest rates; broad investor duration in the figure is proxied by the duration of the Barclays U.S. Aggregate Bond Index). Broad investor duration has increased because investors are reaching for yield and the low interest rate environment has encouraged debt issuers to extend the term of their debt.
An abrupt and unexpected upward adjustment in interest rates would cause significant losses in a typical fixed-income portfolio benchmarked to the broad index. U.S.-domiciled bond mutual funds and ETFs currently hold approximately
$3.8 trillion in assets. Assuming these funds were equally reflected by the Barclays U.S. Aggregate Bond Index, a 100-basis-point increase in market interest rates would translate into an unhedged loss of $214 billion across funds, or 5.6 percent on average (see Figure 2-18). This impact would be greater than in earlier monetary policy tightening cycles due to the higher duration in the current cycle and the larger portfolio of assets managed by bond funds.
Figure 2-17. Barclays U.S. Aggregated Bond Index Modified Adjusted Duration (years)Interest rate risk for U.S. bond investors is near all-time highs
3
4
5
6
1990 1995 2000 2005 2010 2015
Note: Modified adjusted duration approximates the percentage change in price in response to a 1 percentage point change in interest rates. Source: Bloomberg L.P.
Assessing and Monitoring Threats to Financial Stability 19
The current and future path of interest rates across the maturity spectrum will be influenced by the Federal Reserve’s actions to normalize monetary policy. There are considerable challenges for the Federal Reserve as it departs from an unprecedented period of near-zero interest rates and reduces its historically large balance sheet. In prepara-tion, the Federal Reserve has enhanced its communication strategy and introduced and tested the toolkit that will be used to manage the normalization. At its March 2015 meeting, the Federal Open Market Committee outlined three steps in its strategy for normalizing monetary policy (see Board of Governors, 2015b):
• The Federal Reserve will raise the interest on excess reserves rate to target the top of the range for the federal funds rate.
• The offering rate paid on an overnight reverse repo facility will be set equal to the bottom of the target range for the federal funds rate.
• To firm the floor for the federal funds rate target range, the Federal Reserve intends to temporarily increase aggregate capacity of the reverse repo facility from its current limit of $300 billion.
Although the Federal Reserve has planned and prepared for these challenges, there are risks that may prevent a suc-cessful and orderly exit from the extraordinary monetary policy regime. These complications could become threats to financial stability, either by generating disorderly market outcomes or by leaving interest rates very low, further encouraging reaching for yield and risk-taking.
Potential for disorderly market reactions. If the Federal Reserve increases interest rates more rapidly than market participants anticipate or more slowly than participants expect, either could generate large market moves that aggravate portfolio losses. Even if the change in policy is well communicated, there is the risk that market partic-ipants may overreact, triggering a spike in volatility and an over-tightening in financial conditions. Arguably, this happened in the 2013 bond market sell-offs known as the “Taper Tantrum,” which were sparked by Federal Reserve communications well in advance of an actual shift in monetary policy. The fragility of liquidity in U.S. Treasury and other bond markets could amplify any such shock (see Market Liquidity Risk).
Figure 2-18. Estimated Loss to U.S. Bond Funds Following a 100-Basis-Point Shock to Interest Rates ($ billions and percent)Interest rate risk for bond investors is higher than in prior tightening cycles
Es�mated loss to U.S. bond funds (le� axis)Es�mated percent loss (right axis)
0
50
100
150
200
250
1994-1995 1999-2000 2004-2006 Sept 2014 Sept 20152
4
6
8
Note: Data are based on prior periods of U.S. monetary policy tightening starting in February 1994, June 1999, and June 2004. The Barclays Capital U.S. Aggregate Float Adjusted Index, which excluded the Federal Reserve’s holdings of mortgage-backed securities and Treasuries, was used as a proxy for modified adjusted duration of an average fixed-income portfolio. Prior losses in dollar amounts were adjusted to today’s prices based on the gross domestic product deflator. Bond funds include mutual funds and exchange-traded funds that report to the Investment Company Institute; their total assets are $3.8 trillion.Sources: Bloomberg L.P., Haver Analytics, OFR analysis

2015 OFR Financial Stability Report20
Figure 2-19. Money Market and Policy Interest Rates (percent)Treasury GCF Repo rates diverge from policy rates near quarter ends
-0.25
0.00
0.25
0.50
0.75
1.00
2009 2010 2011 2012 2013 2014 2015
Treasury GCF repoFederal Reserve RRPFed funds effec�veInterest rate on excess reserves
Note: GCF stands for general collateral finance. RRP stands for reverse repurchase agreement.Source: Bloomberg L.P.
Figure 2-20. Treasury Bill and Triparty Repo Rates vs. Fed Funds Effective (basis points)Strong demand for high quality liquid assets has depressed Treasury bill yields and repo rates
Fed funds effec�veOne-month Treasury billBank of New York Mellon Treasury Triparty repo index
-5
0
5
10
15
20
25
30
Jan2013
Jun2013
Dec2013
Jun2014
Nov2014
May2015
Note: Repo is the abbreviation for repurchase agreement.Sources: Bank of New York Mellon, Bloomberg L.P.
Managing short-term market rates. Recent volatility in the overnight Treasury General Collateral Financing (GCF) repo rate, a benchmark for the cost of short-term secured funding, illustrates the current challenge of guiding market interest rates. Before the financial crisis, the Treasury GCF repo rate traded below the federal funds effective rate, reflecting the lower cost of collateralized funding. Since the financial crisis, the higher cost of dealer intermediation has pushed GCF repo rates above the federal funds effective rate, resulting in an inversion in the rates on secured and unse-cured funding (see Figure 2-19). The bifurcation between GCF repo rates and triparty repo rates is only one aspect of the way that post-crisis changes in money markets may add to the challenge of managing money market rates.
This dynamic increases uncertainty about the trajectory for other market rates once the Federal Reserve raises the target range for the policy rate. In theory, banks participating in the federal funds market and other short-term markets could arbitrage away the difference, allowing the policy and market rates to move in tandem. However, it is unclear how new regulatory liquidity requirements may affect banks’ ability to profitably arbitrage market rates (see Potter, 2015). Strong demand may depress short-term rates on short-term govern ment securities (see Figure 2-20). The Federal Reserve has indicated that it will expand its reverse repo facility sufficiently to firm up the floor under short-term market rates once policy tightening commences, while avoiding a persistent and too-large footprint from that facility in finan-cial markets that could affect financial stability.
Uncertainty associated with relying on a new, diverse set of counterparties. In 2013, the Federal Reserve expanded its list of authorized counterparties for its reverse repo oper-ations beyond primary dealers to include selected money market funds, banks, and government-sponsored enterprises. As a result, the Federal Reserve has since become one of the largest repo counterparties for money market funds and its role is likely to remain substantial, subject to the current cap.
The reverse repo operations play an important role in short-term markets, serving as a high-quality liquid investment for those money market funds that are reverse repo counterpar-ties of the Federal Reserve Bank of New York. Money market fund reform, which requires prime institutional funds to shift to a floating rate net asset value structure, is expected to drive a substantial amount of assets from prime funds to
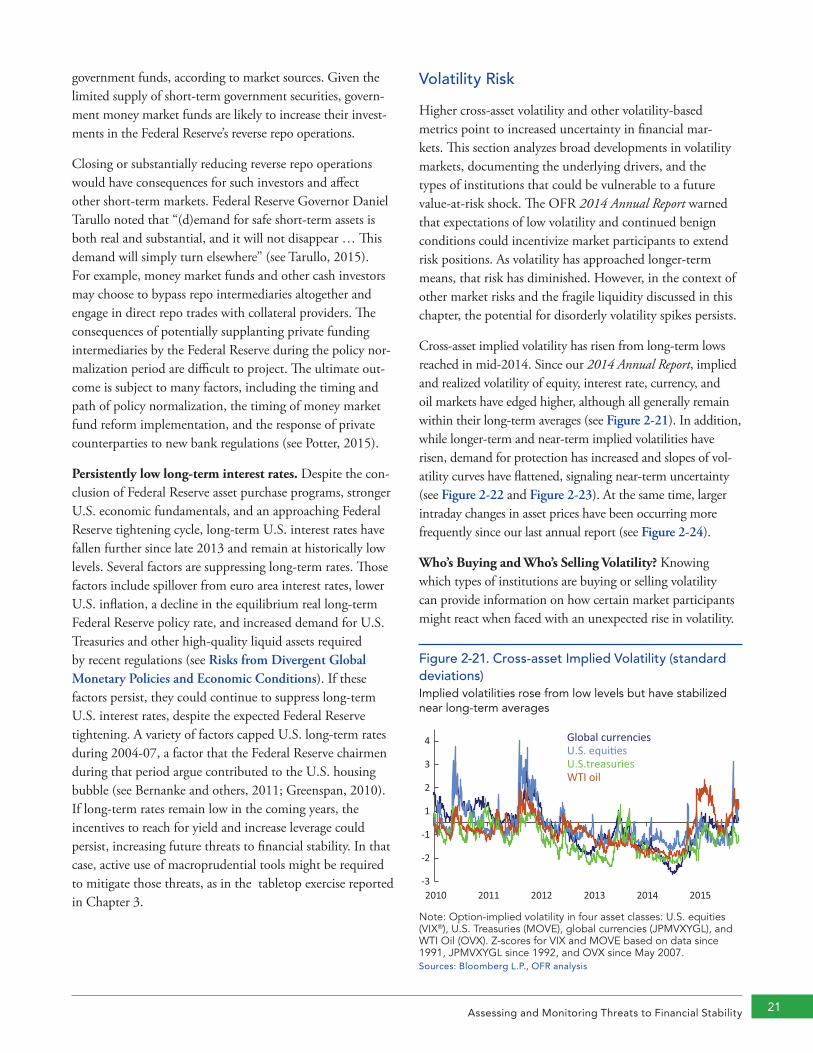
Assessing and Monitoring Threats to Financial Stability 21
government funds, according to market sources. Given the limited supply of short-term government securities, govern-ment money market funds are likely to increase their invest-ments in the Federal Reserve’s reverse repo operations.
Closing or substantially reducing reverse repo operations would have consequences for such investors and affect other short-term markets. Federal Reserve Governor Daniel Tarullo noted that “(d)emand for safe short-term assets is both real and substantial, and it will not disappear … This demand will simply turn elsewhere” (see Tarullo, 2015). For example, money market funds and other cash investors may choose to bypass repo intermediaries altogether and engage in direct repo trades with collateral providers. The consequences of potentially supplanting private funding intermediaries by the Federal Reserve during the policy nor-malization period are difficult to project. The ultimate out-come is subject to many factors, including the timing and path of policy normalization, the timing of money market fund reform implementation, and the response of private counterparties to new bank regulations (see Potter, 2015).
Persistently low long-term interest rates. Despite the con-clusion of Federal Reserve asset purchase programs, stronger U.S. economic fundamentals, and an approaching Federal Reserve tightening cycle, long-term U.S. interest rates have fallen further since late 2013 and remain at historically low levels. Several factors are suppressing long-term rates. Those factors include spillover from euro area interest rates, lower U.S. inflation, a decline in the equilibrium real long-term Federal Reserve policy rate, and increased demand for U.S. Treasuries and other high-quality liquid assets required by recent regulations (see Risks from Divergent Global Monetary Policies and Economic Conditions). If these factors persist, they could continue to suppress long-term U.S. interest rates, despite the expected Federal Reserve tightening. A variety of factors capped U.S. long-term rates during 2004-07, a factor that the Federal Reserve chairmen during that period argue contributed to the U.S. housing bubble (see Bernanke and others, 2011; Greenspan, 2010). If long-term rates remain low in the coming years, the incentives to reach for yield and increase leverage could persist, increasing future threats to financial stability. In that case, active use of macroprudential tools might be required to mitigate those threats, as in the tabletop exercise reported in Chapter 3.
Volatility Risk
Higher cross-asset volatility and other volatility-based metrics point to increased uncertainty in financial mar-kets. This section analyzes broad developments in volatility markets, documenting the underlying drivers, and the types of institutions that could be vulnerable to a future value-at-risk shock. The OFR 2014 Annual Report warned that expectations of low volatility and continued benign conditions could incentivize market participants to extend risk positions. As volatility has approached longer-term means, that risk has diminished. However, in the context of other market risks and the fragile liquidity discussed in this chapter, the potential for disorderly volatility spikes persists.
Cross-asset implied volatility has risen from long-term lows reached in mid-2014. Since our 2014 Annual Report, implied and realized volatility of equity, interest rate, currency, and oil markets have edged higher, although all generally remain within their long-term averages (see Figure 2-21). In addition, while longer-term and near-term implied volatilities have risen, demand for protection has increased and slopes of vol-atility curves have flattened, signaling near-term uncertainty (see Figure 2-22 and Figure 2-23). At the same time, larger intraday changes in asset prices have been occurring more frequently since our last annual report (see Figure 2-24).
Who’s Buying and Who’s Selling Volatility? Knowing which types of institutions are buying or selling volatility can provide information on how certain market participants might react when faced with an unexpected rise in volatility.
Figure 2-21. Cross-asset Implied Volatility (standard deviations)Implied volatilities rose from low levels but have stabilized near long-term averages
-3
-2
-1
1
2
3
4
2010 2011 2012 2013 2014 2015
Global currenciesU.S. equi�esU.S.treasuriesWTI oil
Note: Option-implied volatility in four asset classes: U.S. equities (VIX®), U.S. Treasuries (MOVE), global currencies (JPMVXYGL), and WTI Oil (OVX). Z-scores for VIX and MOVE based on data since 1991, JPMVXYGL since 1992, and OVX since May 2007. Sources: Bloomberg L.P., OFR analysis
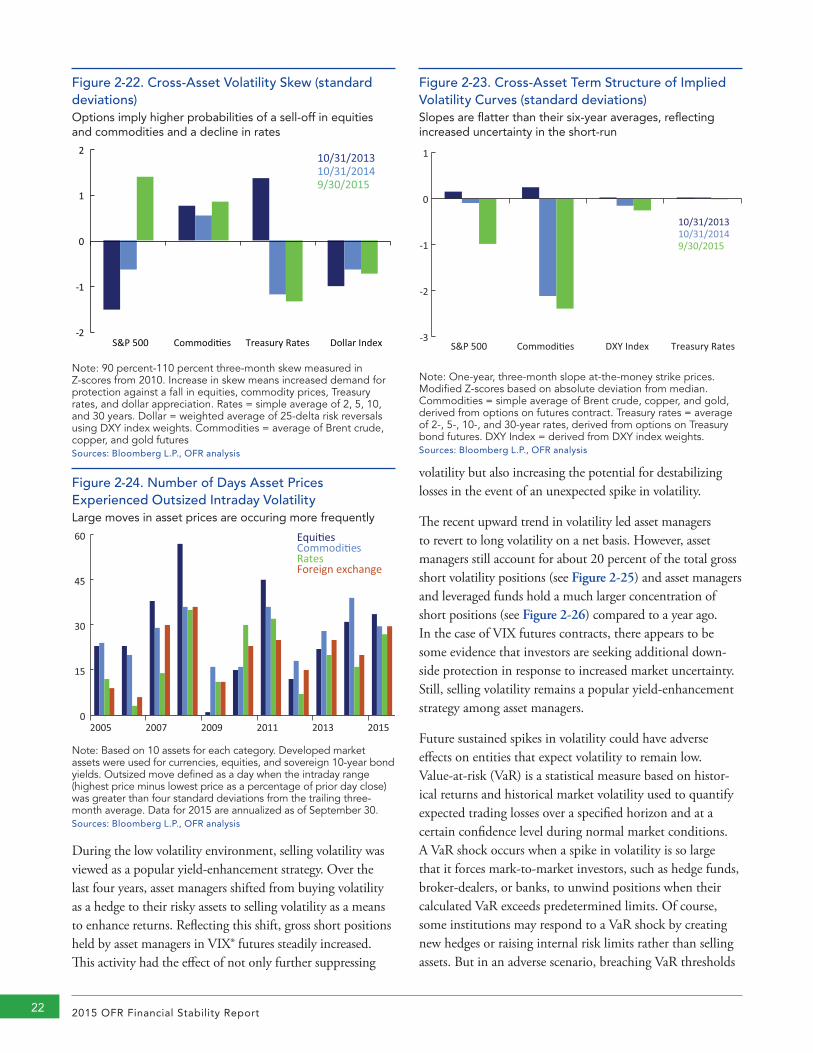
2015 OFR Financial Stability Report22
Figure 2-24. Number of Days Asset Prices Experienced Outsized Intraday VolatilityLarge moves in asset prices are occuring more frequently
0
15
30
45
60
2005 2007 2009 2011 2013 2015
Equi�esCommodi�esRatesForeign exchange
Note: Based on 10 assets for each category. Developed market assets were used for currencies, equities, and sovereign 10-year bond yields. Outsized move defined as a day when the intraday range (highest price minus lowest price as a percentage of prior day close) was greater than four standard deviations from the trailing three-month average. Data for 2015 are annualized as of September 30. Sources: Bloomberg L.P., OFR analysis
Figure 2-22. Cross-Asset Volatility Skew (standard deviations)Options imply higher probabilities of a sell-off in equities and commodities and a decline in rates
10/31/201310/31/20149/30/2015
-2
-1
0
1
2
S&P 500 Commodi�es Treasury Rates Dollar Index
Note: 90 percent-110 percent three-month skew measured in Z-scores from 2010. Increase in skew means increased demand for protection against a fall in equities, commodity prices, Treasury rates, and dollar appreciation. Rates = simple average of 2, 5, 10, and 30 years. Dollar = weighted average of 25-delta risk reversals using DXY index weights. Commodities = average of Brent crude, copper, and gold futuresSources: Bloomberg L.P., OFR analysis
Figure 2-23. Cross-Asset Term Structure of Implied Volatility Curves (standard deviations)Slopes are flatter than their six-year averages, reflecting increased uncertainty in the short-run
-3
-2
-1
0
1
S&P 500 Commodi�es DXY Index Treasury Rates
10/31/201310/31/20149/30/2015
Note: One-year, three-month slope at-the-money strike prices. Modified Z-scores based on absolute deviation from median. Commodities = simple average of Brent crude, copper, and gold, derived from options on futures contract. Treasury rates = average of 2-, 5-, 10-, and 30-year rates, derived from options on Treasury bond futures. DXY Index = derived from DXY index weights.Sources: Bloomberg L.P., OFR analysis
volatility but also increasing the potential for destabilizing losses in the event of an unexpected spike in volatility.
The recent upward trend in volatility led asset managers to revert to long volatility on a net basis. However, asset managers still account for about 20 percent of the total gross short volatility positions (see Figure 2-25) and asset managers and leveraged funds hold a much larger concentration of short positions (see Figure 2-26) compared to a year ago. In the case of VIX futures contracts, there appears to be some evidence that investors are seeking additional down-side protection in response to increased market uncertainty. Still, selling volatility remains a popular yield-enhancement strategy among asset managers.
Future sustained spikes in volatility could have adverse effects on entities that expect volatility to remain low. Value-at-risk (VaR) is a statistical measure based on histor-ical returns and historical market volatility used to quantify expected trading losses over a specified horizon and at a certain confidence level during normal market conditions. A VaR shock occurs when a spike in volatility is so large that it forces mark-to-market investors, such as hedge funds, broker-dealers, or banks, to unwind positions when their calculated VaR exceeds predetermined limits. Of course, some institutions may respond to a VaR shock by creating new hedges or raising internal risk limits rather than selling assets. But in an adverse scenario, breaching VaR thresholds
During the low volatility environment, selling volatility was viewed as a popular yield-enhancement strategy. Over the last four years, asset managers shifted from buying volatility as a hedge to their risky assets to selling volatility as a means to enhance returns. Reflecting this shift, gross short positions held by asset managers in VIX® futures steadily increased. This activity had the effect of not only further suppressing
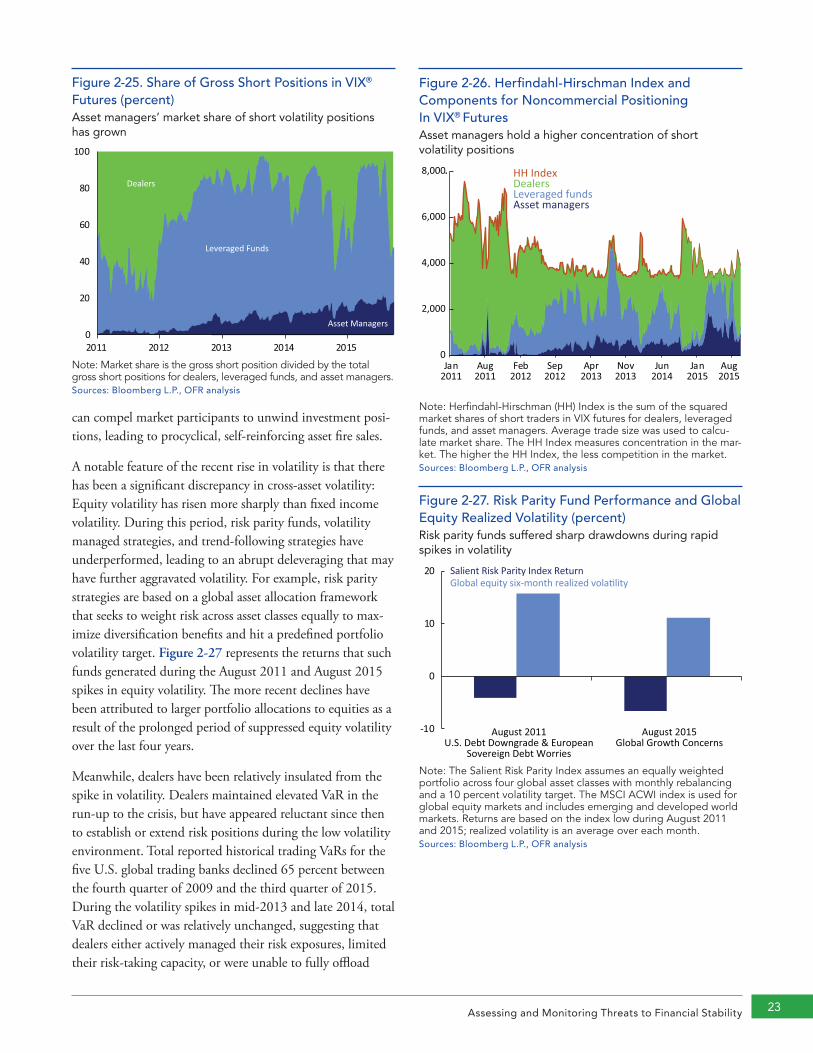
Assessing and Monitoring Threats to Financial Stability 23
can compel market participants to unwind investment posi-tions, leading to procyclical, self-reinforcing asset fire sales.
A notable feature of the recent rise in volatility is that there has been a significant discrepancy in cross-asset volatility: Equity volatility has risen more sharply than fixed income volatility. During this period, risk parity funds, volatility managed strategies, and trend-following strategies have underperformed, leading to an abrupt deleveraging that may have further aggravated volatility. For example, risk parity strategies are based on a global asset allocation framework that seeks to weight risk across asset classes equally to max-imize diversification benefits and hit a predefined portfolio volatility target. Figure 2-27 represents the returns that such funds generated during the August 2011 and August 2015 spikes in equity volatility. The more recent declines have been attributed to larger portfolio allocations to equities as a result of the prolonged period of suppressed equity volatility over the last four years.
Meanwhile, dealers have been relatively insulated from the spike in volatility. Dealers maintained elevated VaR in the run-up to the crisis, but have appeared reluctant since then to establish or extend risk positions during the low volatility environment. Total reported historical trading VaRs for the five U.S. global trading banks declined 65 percent between the fourth quarter of 2009 and the third quarter of 2015. During the volatility spikes in mid-2013 and late 2014, total VaR declined or was relatively unchanged, suggesting that dealers either actively managed their risk exposures, limited their risk-taking capacity, or were unable to fully offload
Figure 2-25. Share of Gross Short Positions in VIX®
Futures (percent)Asset managers’ market share of short volatility positions has grown
0
20
40
60
80
100
2011 2012 2013 2014 2015
Dealers
Leveraged Funds
Asset Managers
Note: Market share is the gross short position divided by the total gross short positions for dealers, leveraged funds, and asset managers.Sources: Bloomberg L.P., OFR analysis
Figure 2-26. Herfindahl-Hirschman Index and Components for Noncommercial Positioning In VIX® FuturesAsset managers hold a higher concentration of short volatility positions
0
2,000
4,000
6,000
8,000
Jan2011
Aug2011
Feb2012
Sep2012
Apr2013
Nov2013
Jun2014
Jan2015
Aug2015
HH IndexDealersLeveraged fundsAsset managers
Note: Herfindahl-Hirschman (HH) Index is the sum of the squared market shares of short traders in VIX futures for dealers, leveraged funds, and asset managers. Average trade size was used to calcu-late market share. The HH Index measures concentration in the mar-ket. The higher the HH Index, the less competition in the market.Sources: Bloomberg L.P., OFR analysis
Figure 2-27. Risk Parity Fund Performance and Global Equity Realized Volatility (percent)Risk parity funds suffered sharp drawdowns during rapid spikes in volatility
Salient Risk Parity Index ReturnGlobal equity six-month realized vola�lity
-10
0
10
20
August 2011U.S. Debt Downgrade & European
Sovereign Debt Worries
August 2015Global Growth Concerns
Note: The Salient Risk Parity Index assumes an equally weighted portfolio across four global asset classes with monthly rebalancing and a 10 percent volatility target. The MSCI ACWI index is used for global equity markets and includes emerging and developed world markets. Returns are based on the index low during August 2011 and 2015; realized volatility is an average over each month.Sources: Bloomberg L.P., OFR analysis
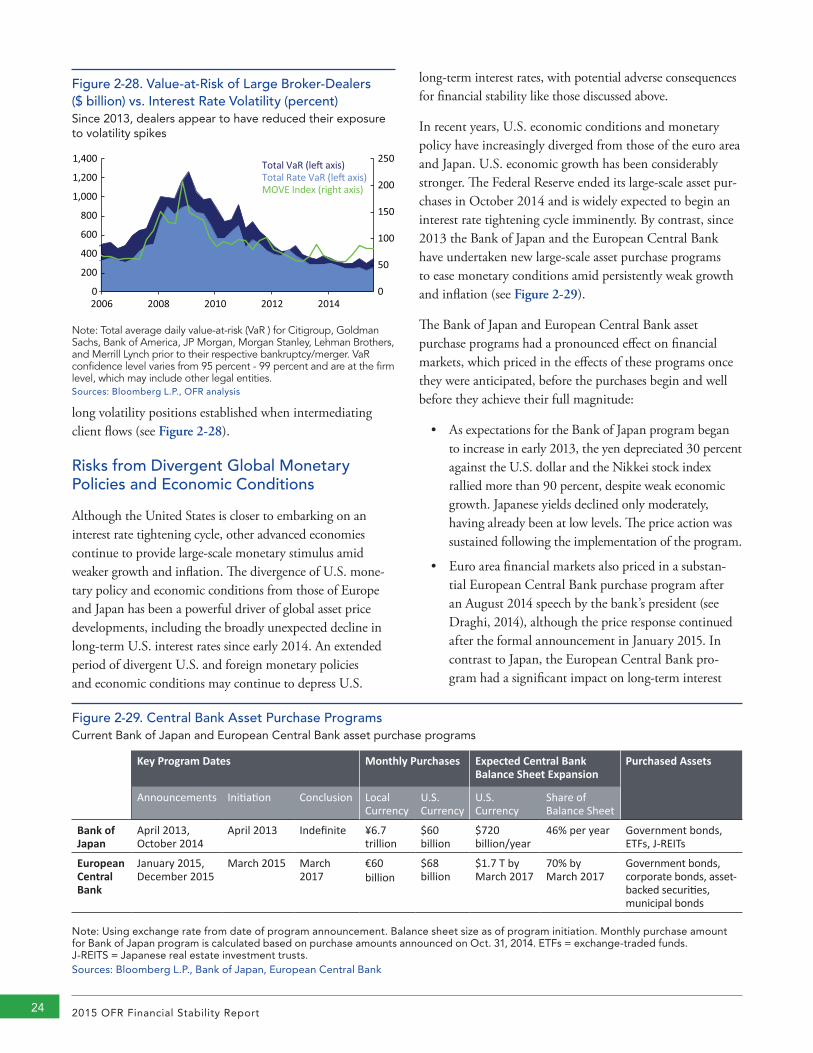
2015 OFR Financial Stability Report24
Figure 2-28. Value-at-Risk of Large Broker-Dealers ($ billion) vs. Interest Rate Volatility (percent)Since 2013, dealers appear to have reduced their exposure to volatility spikes
Total VaR (le� axis)Total Rate VaR (le� axis)MOVE Index (right axis)
0
50
100
150
200
250
0
200
400
600
800
1,000
1,200
1,400
2006 2008 2010 2012 2014
Note: Total average daily value-at-risk (VaR ) for Citigroup, Goldman Sachs, Bank of America, JP Morgan, Morgan Stanley, Lehman Brothers, and Merrill Lynch prior to their respective bankruptcy/merger. VaR confidence level varies from 95 percent - 99 percent and are at the firm level, which may include other legal entities. Sources: Bloomberg L.P., OFR analysis
long-term interest rates, with potential adverse consequences for financial stability like those discussed above.
In recent years, U.S. economic conditions and monetary policy have increasingly diverged from those of the euro area and Japan. U.S. economic growth has been considerably stronger. The Federal Reserve ended its large-scale asset pur-chases in October 2014 and is widely expected to begin an interest rate tightening cycle imminently. By contrast, since 2013 the Bank of Japan and the European Central Bank have undertaken new large-scale asset purchase programs to ease monetary conditions amid persistently weak growth and inflation (see Figure 2-29).
The Bank of Japan and European Central Bank asset purchase programs had a pronounced effect on financial markets, which priced in the effects of these programs once they were anticipated, before the purchases begin and well before they achieve their full magnitude:
• As expectations for the Bank of Japan program began to increase in early 2013, the yen depreciated 30 percent against the U.S. dollar and the Nikkei stock index rallied more than 90 percent, despite weak economic growth. Japanese yields declined only moderately, having already been at low levels. The price action was sustained following the implementation of the program.
• Euro area financial markets also priced in a substan-tial European Central Bank purchase program after an August 2014 speech by the bank’s president (see Draghi, 2014), although the price response continued after the formal announcement in January 2015. In contrast to Japan, the European Central Bank pro-gram had a significant impact on long-term interest
Figure 2-29. Central Bank Asset Purchase ProgramsCurrent Bank of Japan and European Central Bank asset purchase programs
Key Program Dates Monthly Purchases Expected Central Bank Balance Sheet Expansion
Purchased Assets
Announcements Initiation Conclusion Local Currency
U.S. Currency
U.S. Currency
Share of Balance Sheet
Bank of Japan
April 2013,October 2014
April 2013 Indefinite ¥6.7 trillion
$60 billion
$720 billion/year
46% per year Government bonds, ETFs, J-REITs
European Central Bank
January 2015, December 2015
March 2015 March 2017
€60 billion
$68 billion
$1.7 T by March 2017
70% by March 2017
Government bonds, corporate bonds, asset-backed securities, municipal bonds
Note: Using exchange rate from date of program announcement. Balance sheet size as of program initiation. Monthly purchase amount for Bank of Japan program is calculated based on purchase amounts announced on Oct. 31, 2014. ETFs = exchange-traded funds. J-REITS = Japanese real estate investment trusts. Sources: Bloomberg L.P., Bank of Japan, European Central Bank
long volatility positions established when intermediating client flows (see Figure 2-28).
Risks from Divergent Global Monetary Policies and Economic Conditions
Although the United States is closer to embarking on an interest rate tightening cycle, other advanced economies continue to provide large-scale monetary stimulus amid weaker growth and inflation. The divergence of U.S. mone-tary policy and economic conditions from those of Europe and Japan has been a powerful driver of global asset price developments, including the broadly unexpected decline in long-term U.S. interest rates since early 2014. An extended period of divergent U.S. and foreign monetary policies and economic conditions may continue to depress U.S.
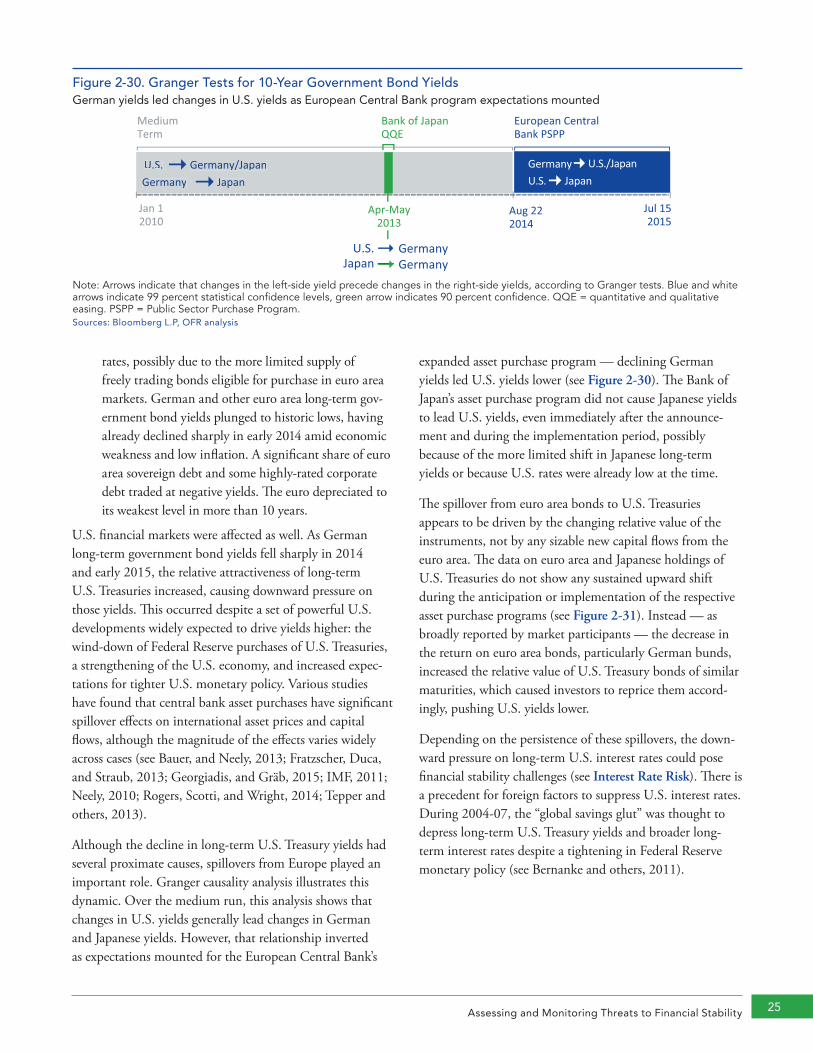
Assessing and Monitoring Threats to Financial Stability 25
rates, possibly due to the more limited supply of freely trading bonds eligible for purchase in euro area markets. German and other euro area long-term gov-ernment bond yields plunged to historic lows, having already declined sharply in early 2014 amid economic weakness and low inflation. A significant share of euro area sovereign debt and some highly-rated corporate debt traded at negative yields. The euro depreciated to its weakest level in more than 10 years.
U.S. financial markets were affected as well. As German long-term government bond yields fell sharply in 2014 and early 2015, the relative attractiveness of long-term U.S. Treasuries increased, causing downward pressure on those yields. This occurred despite a set of powerful U.S. developments widely expected to drive yields higher: the wind-down of Federal Reserve purchases of U.S. Treasuries, a strengthening of the U.S. economy, and increased expec-tations for tighter U.S. monetary policy. Various studies have found that central bank asset purchases have significant spillover effects on international asset prices and capital flows, although the magnitude of the effects varies widely across cases (see Bauer, and Neely, 2013; Fratzscher, Duca, and Straub, 2013; Georgiadis, and Gräb, 2015; IMF, 2011; Neely, 2010; Rogers, Scotti, and Wright, 2014; Tepper and others, 2013).
Although the decline in long-term U.S. Treasury yields had several proximate causes, spillovers from Europe played an important role. Granger causality analysis illustrates this dynamic. Over the medium run, this analysis shows that changes in U.S. yields generally lead changes in German and Japanese yields. However, that relationship inverted as expectations mounted for the European Central Bank’s
expanded asset purchase program — declining German yields led U.S. yields lower (see Figure 2-30). The Bank of Japan’s asset purchase program did not cause Japanese yields to lead U.S. yields, even immediately after the announce-ment and during the implementation period, possibly because of the more limited shift in Japanese long-term yields or because U.S. rates were already low at the time.
The spillover from euro area bonds to U.S. Treasuries appears to be driven by the changing relative value of the instruments, not by any sizable new capital flows from the euro area. The data on euro area and Japanese holdings of U.S. Treasuries do not show any sustained upward shift during the anticipation or implementation of the respective asset purchase programs (see Figure 2-31). Instead — as broadly reported by market participants — the decrease in the return on euro area bonds, particularly German bunds, increased the relative value of U.S. Treasury bonds of similar maturities, which caused investors to reprice them accord-ingly, pushing U.S. yields lower.
Depending on the persistence of these spillovers, the down-ward pressure on long-term U.S. interest rates could pose financial stability challenges (see Interest Rate Risk). There is a precedent for foreign factors to suppress U.S. interest rates. During 2004-07, the “global savings glut” was thought to depress long-term U.S. Treasury yields and broader long-term interest rates despite a tightening in Federal Reserve monetary policy (see Bernanke and others, 2011).
Figure 2-30. Granger Tests for 10-Year Government Bond Yields German yields led changes in U.S. yields as European Central Bank program expectations mounted
Jan 12010
Aug 222014
Jul 152015
U.S. GermanyGermanyJapan
European CentralBank PSPP
U.S./JapanGermanyU.S. Japan
Medium Term
Apr-May2013
Bank of JapanQQE
U.S. Germany/JapanJapanGermany
Note: Arrows indicate that changes in the le�-side yield precede changes in the right-side yields, according to Granger tests. Blue and white arrows indicate 99% sta�s�cal confidence levels, green arrow indicates 95% confidence.
Note: Arrows indicate that changes in the left-side yield precede changes in the right-side yields, according to Granger tests. Blue and white arrows indicate 99 percent statistical confidence levels, green arrow indicates 90 percent confidence. QQE = quantitative and qualitative easing. PSPP = Public Sector Purchase Program. Sources: Bloomberg L.P, OFR analysis
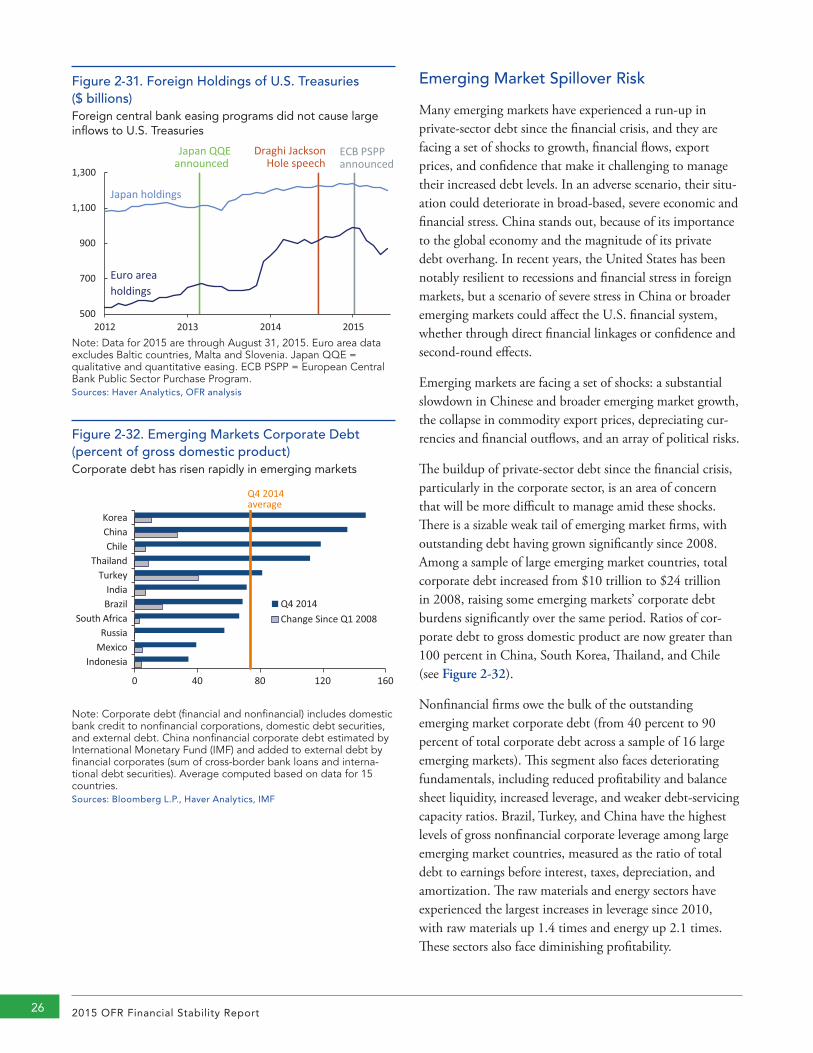
2015 OFR Financial Stability Report26
Emerging Market Spillover Risk
Many emerging markets have experienced a run-up in private-sector debt since the financial crisis, and they are facing a set of shocks to growth, financial flows, export prices, and confidence that make it challenging to manage their increased debt levels. In an adverse scenario, their situ-ation could deteriorate in broad-based, severe economic and financial stress. China stands out, because of its importance to the global economy and the magnitude of its private debt overhang. In recent years, the United States has been notably resilient to recessions and financial stress in foreign markets, but a scenario of severe stress in China or broader emerging markets could affect the U.S. financial system, whether through direct financial linkages or confidence and second-round effects.
Emerging markets are facing a set of shocks: a substantial slowdown in Chinese and broader emerging market growth, the collapse in commodity export prices, depreciating cur-rencies and financial outflows, and an array of political risks.
The buildup of private-sector debt since the financial crisis, particularly in the corporate sector, is an area of concern that will be more difficult to manage amid these shocks. There is a sizable weak tail of emerging market firms, with outstanding debt having grown significantly since 2008. Among a sample of large emerging market countries, total corporate debt increased from $10 trillion to $24 trillion in 2008, raising some emerging markets’ corporate debt burdens significantly over the same period. Ratios of cor-porate debt to gross domestic product are now greater than 100 percent in China, South Korea, Thailand, and Chile (see Figure 2-32).
Nonfinancial firms owe the bulk of the outstanding emerging market corporate debt (from 40 percent to 90 percent of total corporate debt across a sample of 16 large emerging markets). This segment also faces deteriorating fundamentals, including reduced profitability and balance sheet liquidity, increased leverage, and weaker debt-servicing capacity ratios. Brazil, Turkey, and China have the highest levels of gross nonfinancial corporate leverage among large emerging market countries, measured as the ratio of total debt to earnings before interest, taxes, depreciation, and amortization. The raw materials and energy sectors have experienced the largest increases in leverage since 2010, with raw materials up 1.4 times and energy up 2.1 times. These sectors also face diminishing profitability.
Figure 2-31. Foreign Holdings of U.S. Treasuries ($ billions)Foreign central bank easing programs did not cause large inflows to U.S. Treasuries
500
700
900
1,100
1,300
2012 2013 2014 2015
Euro area holdings
Japan holdings
Japan QQEannounced
Draghi Jackson Hole speech
ECB PSPP announced
Note: Data for 2015 are through August 31, 2015. Euro area data excludes Baltic countries, Malta and Slovenia. Japan QQE = qualitative and quantitative easing. ECB PSPP = European Central Bank Public Sector Purchase Program.Sources: Haver Analytics, OFR analysis
Figure 2-32. Emerging Markets Corporate Debt (percent of gross domestic product)Corporate debt has risen rapidly in emerging markets
IndonesiaMexicoRussia
South AfricaBrazilIndia
TurkeyThailand
ChileChinaKorea
0 40 80 120 160
Q4 2014Change Since Q1 2008
Q4 2014average
Note: Corporate debt (financial and nonfinancial) includes domestic bank credit to nonfinancial corporations, domestic debt securities, and external debt. China nonfinancial corporate debt estimated by International Monetary Fund (IMF) and added to external debt by financial corporates (sum of cross-border bank loans and interna-tional debt securities). Average computed based on data for 15 countries.Sources: Bloomberg L.P., Haver Analytics, IMF
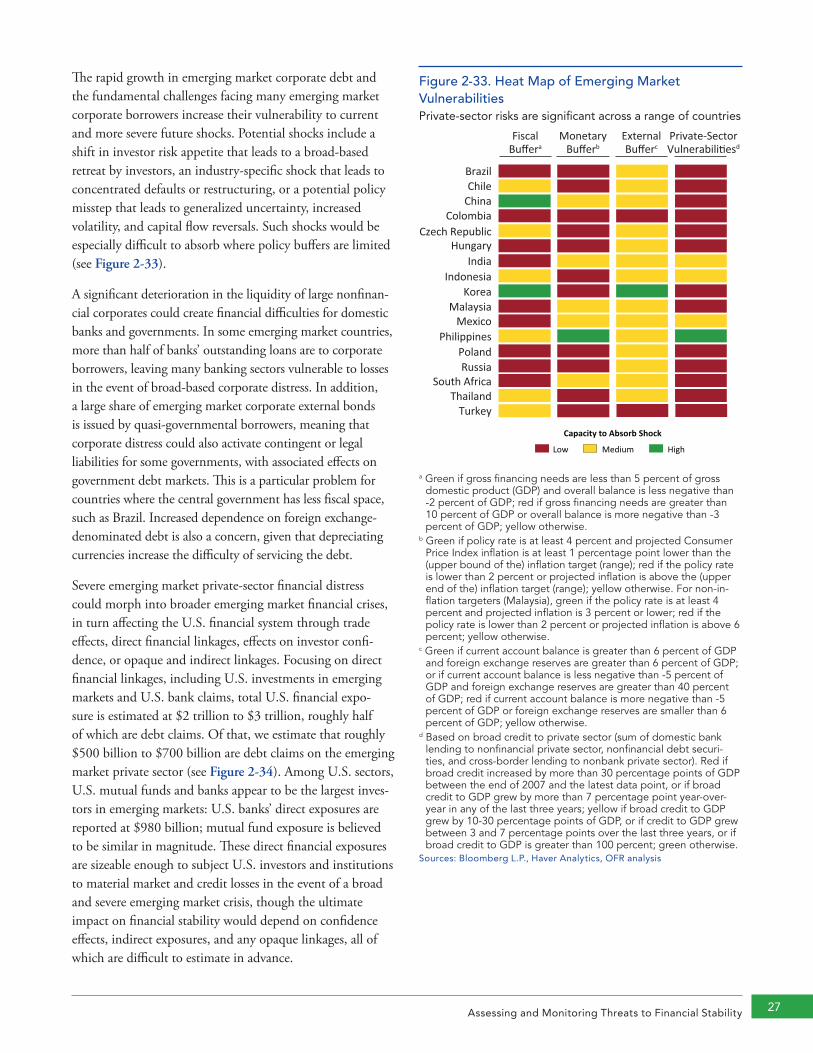
Assessing and Monitoring Threats to Financial Stability 27
The rapid growth in emerging market corporate debt and the fundamental challenges facing many emerging market corporate borrowers increase their vulnerability to current and more severe future shocks. Potential shocks include a shift in investor risk appetite that leads to a broad-based retreat by investors, an industry-specific shock that leads to concentrated defaults or restructuring, or a potential policy misstep that leads to generalized uncertainty, increased volatility, and capital flow reversals. Such shocks would be especially difficult to absorb where policy buffers are limited (see Figure 2-33).
A significant deterioration in the liquidity of large nonfinan-cial corporates could create financial difficulties for domestic banks and governments. In some emerging market countries, more than half of banks’ outstanding loans are to corporate borrowers, leaving many banking sectors vulnerable to losses in the event of broad-based corporate distress. In addition, a large share of emerging market corporate external bonds is issued by quasi-governmental borrowers, meaning that corporate distress could also activate contingent or legal liabilities for some governments, with associated effects on government debt markets. This is a particular problem for countries where the central government has less fiscal space, such as Brazil. Increased dependence on foreign exchange- denominated debt is also a concern, given that depreciating currencies increase the difficulty of servicing the debt.
Severe emerging market private-sector financial distress could morph into broader emerging market financial crises, in turn affecting the U.S. financial system through trade effects, direct financial linkages, effects on investor confi-dence, or opaque and indirect linkages. Focusing on direct financial linkages, including U.S. investments in emerging markets and U.S. bank claims, total U.S. financial expo-sure is estimated at $2 trillion to $3 trillion, roughly half of which are debt claims. Of that, we estimate that roughly $500 billion to $700 billion are debt claims on the emerging market private sector (see Figure 2-34). Among U.S. sectors, U.S. mutual funds and banks appear to be the largest inves-tors in emerging markets: U.S. banks’ direct exposures are reported at $980 billion; mutual fund exposure is believed to be similar in magnitude. These direct financial exposures are sizeable enough to subject U.S. investors and institutions to material market and credit losses in the event of a broad and severe emerging market crisis, though the ultimate impact on financial stability would depend on confidence effects, indirect exposures, and any opaque linkages, all of which are difficult to estimate in advance.
Figure 2-33. Heat Map of Emerging Market Vulnerabilities Private-sector risks are significant across a range of countries
BrazilChile
ChinaColombia
Czech RepublicHungary
IndiaIndonesia
KoreaMalaysia
MexicoPhilippines
PolandRussia
South AfricaThailand
Turkey
MonetaryBufferb
ExternalBufferc
Private-SectorVulnerabili�esd
FiscalBuffera
Capacity to Absorb Shock
High Low Medium
a Green if gross financing needs are less than 5 percent of GDP and overall balance is less nega�ve than -2 percent of GDP; red if gross financing needs are greater than 10 percent of GDP or overall balance is more nega�ve than -3 percent of GDP; yellow otherwise.
b Green if policy rate is at least 4 percent and projected Consumer Price Index infla�on is at least 1 percentage point lower than the (upper bound of the) infla�on target (range); red if the policy rate is lower than 2 percent or projected infla�on is above the (upper end of the) infla�on target (range); yellow otherwise. For non-infla�on targeters (Malaysia), green if the policy rate is at least 4 percent and projected infla�on is 3 percent or lower; red if the policy rate is lower than 2 percent or projected infla�on is above 6 percent; yellow otherwise.
c Green if current account balance is greater than 6 percent of GDP and foreign exchange reserves are greater than 6 percent of GDP; or if current account balance is less nega�ve than -5 percent of GDP and foreign exchange reserves are greater than 40 percent of GDP; red if current account balance is more nega�ve than -5 percent of GDP or foreign exchange reserves are smaller than 6 percent of GDP; yellow otherwise.
d Based on broad credit to private sector (sum of domes�c bank lending to nonfinancial private sector, nonfinancial debt securi�es, and cross-border lending to nonbank private sector). Red if broad credit increased by more than 30 percentage points of GDP between the end of 2007 and the latest data point, or if broad credit to GDP grew by more than 7 percentage point year-over-year in any of the last three years; Yellow if broad credit to GDP grew by 10-30 percentage points of GDP, or if credit to GDP grew between 3 and 7 percentage points over the last three years, or if broad credit to GDP is greater than 100 percent; green otherwise.
Sources: Bloomberg L.P., Haver Analy�cs, OFR analysis.
a Green if gross financing needs are less than 5 percent of gross domestic product (GDP) and overall balance is less negative than -2 percent of GDP; red if gross financing needs are greater than 10 percent of GDP or overall balance is more negative than -3 percent of GDP; yellow otherwise.
b Green if policy rate is at least 4 percent and projected Consumer Price Index inflation is at least 1 percentage point lower than the (upper bound of the) inflation target (range); red if the policy rate is lower than 2 percent or projected inflation is above the (upper end of the) inflation target (range); yellow otherwise. For non-in-flation targeters (Malaysia), green if the policy rate is at least 4 percent and projected inflation is 3 percent or lower; red if the policy rate is lower than 2 percent or projected inflation is above 6 percent; yellow otherwise.
c Green if current account balance is greater than 6 percent of GDP and foreign exchange reserves are greater than 6 percent of GDP; or if current account balance is less negative than -5 percent of GDP and foreign exchange reserves are greater than 40 percent of GDP; red if current account balance is more negative than -5 percent of GDP or foreign exchange reserves are smaller than 6 percent of GDP; yellow otherwise.
d Based on broad credit to private sector (sum of domestic bank lending to nonfinancial private sector, nonfinancial debt securi-ties, and cross-border lending to nonbank private sector). Red if broad credit increased by more than 30 percentage points of GDP between the end of 2007 and the latest data point, or if broad credit to GDP grew by more than 7 percentage point year-over-year in any of the last three years; yellow if broad credit to GDP grew by 10-30 percentage points of GDP, or if credit to GDP grew between 3 and 7 percentage points over the last three years, or if broad credit to GDP is greater than 100 percent; green otherwise.
Sources: Bloomberg L.P., Haver Analytics, OFR analysis

2015 OFR Financial Stability Report28
Run and Asset Fire Sale Risks in Wholesale Funding MarketsRuns in short-term wholesale funding markets were a key source of systemic stress during the financial crisis. Although progress has been made to address this vulnerability, run risk persists in these markets years later.
Regulatory reforms have forced banks to reduce their depen-dence on short-term wholesale funding and increase their capital positions, helping to reduce the probability of failure of an individual bank and the associated run risk. Many of the largest broker-dealers — which are at the center of securities financing markets — became part of bank holding companies subject to these enhanced capital and liquidity requirements. These structural changes, combined with changes in market participants’ preferences and risk manage-ment, dramatically reduced the size of securities financing markets since the crisis.
Banks’ reliance on repo financing has diminished and concentration risks have eased as these institutions have diversified their funding sources and reduced their client-financing operations. Broker-dealers have also reduced their reliance on repo financing, particularly in net terms, but overall these firms remain highly dependent on such financing and at risk of runs in a stress scenario (see Figure 2-35).
Meanwhile U.S.-based foreign bank offices have increased their financing through repurchase agreements in U.S. dollar terms (see Figure 2-36). That trend is partly due to differ-ences in regulation and the fact that foreign banks have a limited base of U.S. retail deposits. To address this, starting in mid-2016 the Federal Reserve’s Regulation YY will require any foreign bank with $50 billion or more in U.S. non-branch or agency assets to place all of its U.S. subsid-iaries within a U.S. intermediate holding company, which will be subject to the same enhanced prudential standards as U.S. banks.
The migration of securities financing activities to less- regulated sectors is also a potential risk. For repo and securities lending markets, this migration cannot be systematically tracked because of a lack of consolidated reporting. However, the Financial Stability Board’s frame-work for minimum haircuts on non-centrally cleared and certain nonbank securities financing could potentially be used to limit the leverage within these transactions, even outside the banking system.
Figure 2-34. Estimated U.S. Financial Exposure to Emerging Market Economies
Exposure ($ in trillions)
Percentage of U.S. Private Sector Financial Assets
All Emerging Market Debt and Equity
1.9 – 2.9 1.1%-1.6%
Debt Claims 1.0 – 1.5 0.5%-0.8%
Debt Claims on Corporate Sector
0.6 - 0.7 0.3%-0.4%
Note: This is the sum of (1) investment securities held by U.S. resi-dents and (2) U.S. bank claims. Because (1) may include some of (2), we estimate a range; the lower bound assumes (2) is fully included in (1). Emerging market countries include all of Latin America, Asia excluding Japan, emerging countries in Europe, African countries, and the Caribbean excluding Cayman Islands and Bermuda. Data as of the second quarter of 2015, though estimated exposure to corporate sector relied on some data from end of 2013.Sources: Haver Analytics, U.S. Treasury, Federal Reserve Form FFIEC 009
Figure 2-35. Broker-Dealers’ Reliance on Repo (percent of total liabilities)Repo remains a major source of financing for broker-dealers
Gross repoNet repo
0
20
40
60
80
2005 2007 2009 2011 2013 2015
Source: Haver Analytics
Figure 2-36. U.S.-Chartered Banks and U.S.-Based Foreign Bank Offices — Federal Funds and Repo Liabilities ($ billions)Repo is a growing source of financing for U.S.-based foreign bank offices
0
300
600
900
2005 2007 2009 2011 2013 2015
U.S.-based foreign bank officesU.S.-chartered banks
Note: Data as of June 30, 2015. Repo is an abbreviation for repur-chase agreement.Source: Haver Analytics

Assessing and Monitoring Threats to Financial Stability 29
Solutions are elusive to address the systemic consequences of a run in securities financing markets. The risk of a post-default asset fire sale if a major counterparty fails remains unaddressed. Various proposals are being considered to mitigate this risk. Some proposals include incentives to maximize the value of assets underpinning repo collateral. Such a solution would require some sort of arrangement for a party, such as a special resolution authority or a consor-tium of dealers, to take possession of the collateral, finance the portfolio of a failed firm, and then dispose the assets in an orderly manner once market conditions stabilized (see Chapter 3).
Other proposals recommend changes to the U.S. bank-ruptcy code that would involve restricting access of a nondefaulting party to certain types of less-liquid collateral upon counterparty default. Some legal scholars argue that the preferential treatment of financial contracts such as repo in bankruptcy encourages excessive use of short-term financing, mainly through repo borrowings. Instead, they propose eliminating safe harbor provisions for repo con-tracts backed by nongovernment securities and requiring such contracts to be resolved under the normal bankruptcy process. Momentum has stalled, though, and none of these proposals has generated a critical mass of support.
One potential mitigant to post-default fire sales would be to expand the central clearing of repo agreements, which has been discussed by policymakers and clearinghouse operators. Generally, in the event of a member default, the clearinghouse operator would seek to transfer the defaulting dealer’s transactions to another member willing to take over the trade, making collateral fire sales less likely. Additionally, netting of agreements in the clearinghouse would reduce the size of the portfolio subject to potential fire sales. To be clear, this would represent only a partial solution, as central counterparty liquidity buffers could be exhausted by suffi-ciently large defaults. Meanwhile, like all central clearing, it could create new concentration risks as the market transacts through a smaller set of counterparties.
Cybersecurity Risks
Cybersecurity breaches pose risks to the physical functioning of the U.S. financial system and to financial stability. The risks to these two areas may be mitigated in different degrees by the capital that banks must hold. A bank with sufficient capital reserves can survive a financial instability event, but it is not clear whether those same reserves can ensure
the continued business operations of an individual firm or market in a broad cyberattack that disrupts electronic trading, transaction processing, and other computer network functions that are the heart of the financial industry.
Under an Executive Order and a Presidential Policy Directive, the U.S. government is addressing functional risks with a multiagency effort that emphasizes information sharing and interoperability. The Department of Homeland Security (DHS) provides overall strategic guidance and direction and the U.S. Department of the Treasury leads an information-sharing effort through the Financial and Banking Information Infrastructure Committee to develop ways to enhance information sharing among the financial services sector regulators. The committee also partici-pates with the financial sector in the Financial Services Information Sharing and Analysis Center (see DHS, 2015; FSISAC, 2015; FSSCC, 2015). The center draws together U.S. regulatory, intelligence, and law enforcement agencies along with financial institutions and industry associations to share technical information with financial institutions on rapidly emerging cyber threats, provide expert analysis, and encourage collaboration. Although the information sharing is largely technical in nature, it may be useful in understanding operational risks to financial stability posed by cyber threats. Additionally, the Treasury, DHS, and regulators have collaborated in developing several tabletop exercises with financial institutions and government agencies to focus on responses to cyber events.
Regulators have recently moved to promulgate assessment standards that encourage financial sector firms to imple-ment the Cybersecurity Framework, which was released in 2014 by the National Institute of Standards and Technology (NIST). Though voluntary, the NIST Cybersecurity Framework is emerging as a de facto standard for firms seeking guidance in their efforts to counter cyber threats. The Federal Financial Institutions Examination Council released a Cybersecurity Assessment Tool in June 2015 that maps to the NIST Cybersecurity Framework (see FFIEC, 2015). Regulators also need to coordinate developing and collecting the analytic data needed to assess and quantify the impact of cybersecurity attacks on operational risks and financial stability. These data deficiencies were highlighted in a recent U.S. Government Accountability Office report (see GAO, 2015).
As a first step, regulatory agencies could consider regulatory disclosure requirements to collect data from the financial
2015 OFR Financial Stability Report30 2015 OFR Financial Stability Report30
Data Deficiencies in Assessing Cyber Threats to Financial Stability
Efforts to counter cyber threats to the functioning of the financial system are mostly guided by information technology (IT) data on tactics used by cyber criminals and others attempting to penetrate target companies in the financial system. Although significant public and private resources are devoted to the rapid identification and sharing of information on cyber threats, significant data gaps remain in measuring the frequency and costs of breaches at financial firms. These gaps hinder efforts to assess threats to financial stability and prioritize investments to address those threats. The data gaps also slow financial regulators’ development of appropriate assessment standards for companies they regulate.
Although the quantity and quality of threat information available to individual financial institutions has improved, information on the frequency and concentration of cyber- security incidents across the financial sector remains insuf-ficient to examine trends across the financial sector and prioritize investments. Sources of available information on the frequency of breaches fall within three broad categories — commercial, regulatory, and law enforcement — and
each has limits in data quality and scope (see Figure 2-37). Among the best known commercial sources of information are annual reports from the Ponemon Institute in cooper-ation with IBM and Symantec Corp. that include statistics on the frequency of attacks and summaries of the techniques used. Additionally, the “Information is Beautiful” website publishes a visualization of major cybersecurity incidents, compiled from news media reports (see Information is Beautiful, 2015). Though widely distributed, the website’s underlying data and collection methodologies are propri-etary, limiting further analysis.
Data collected by regulators and made public are more limited. The SEC requires public companies to address materially significant cybersecurity incidents in the man-agement discussion and analysis portion of quarterly and annual public filings (see SEC, 2011). The SEC disclosures give investors better qualitative information on cybersecu-rity risks, but the narrative format limits its usefulness in data analysis. The New York State Department of Financial Services recently released a survey on cybersecurity breaches at New York-based banks. Additionally, data on cyberse-curity incidents is collected on an ongoing basis by the Financial Services Information Sharing and Analysis Center, which is integral to the U.S. government’s effort to share information on cyber threats, but the center does not make the data public.
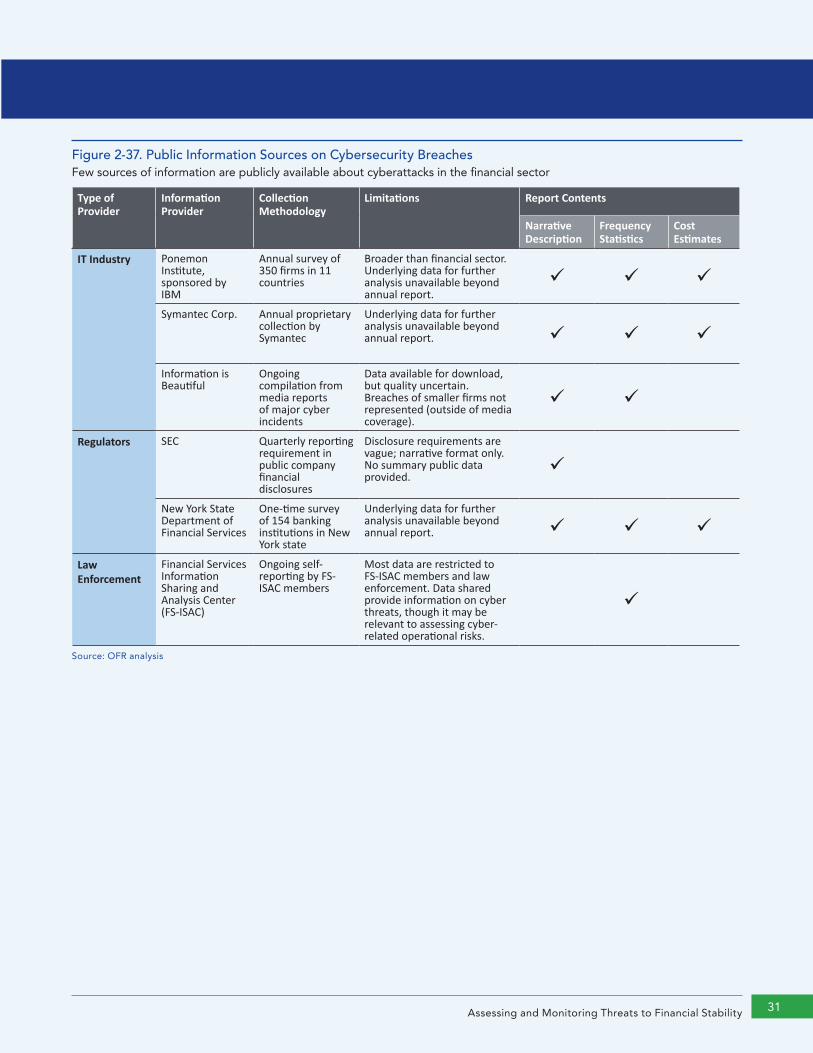
]Insert Section Title[ 3131Assessing and Monitoring Threats to Financial Stability
Figure 2-37. Public Information Sources on Cybersecurity BreachesFew sources of information are publicly available about cyberattacks in the financial sector
Type of Provider
Information Provider
Collection Methodology
Limitations Report Contents
Narrative Description
Frequency Statistics
Cost Estimates
IT Industry Ponemon Institute, sponsored by IBM
Annual survey of 350 firms in 11 countries
Broader than financial sector. Underlying data for further analysis unavailable beyond annual report.
Symantec Corp. Annual proprietary collection by Symantec
Underlying data for further analysis unavailable beyond annual report.
Information is Beautiful
Ongoing compilation from media reports of major cyber incidents
Data available for download, but quality uncertain. Breaches of smaller firms not represented (outside of media coverage).
Regulators SEC Quarterly reporting requirement in public company financial disclosures
Disclosure requirements are vague; narrative format only. No summary public data provided.
New York State Department of Financial Services
One-time survey of 154 banking institutions in New York state
Underlying data for further analysis unavailable beyond annual report.
Law Enforcement
Financial Services Information Sharing and Analysis Center (FS-ISAC)
Ongoing self-reporting by FS-ISAC members
Most data are restricted to FS-ISAC members and law enforcement. Data shared provide information on cyber threats, though it may be relevant to assessing cyber-related operational risks.
Source: OFR analysis
2015 OFR Financial Stability Report32
industry on the frequency and cost of cybersecurity incidents. The data are needed to support a more rigorous assessment of financial sector risks related to cybersecurity. NIST’s recent work studying the costs and benefits of cybersecurity infra-structure may also be useful in developing risk models and metrics to assess cybersecurity risks (see Data Deficiencies in Assessing Cyber Threats to Financial Stability).
The lack of data about the cost of cybersecurity incidents hinders the quantification of risks to financial companies and the broader financial system. U.S. regulators do not yet require firms to monitor and report on the cost of cybersecu-rity breaches or risks in a manner similar to other risk-mon-itoring requirements. The missing data also reflect financial companies’ reluctance to disclose cybersecurity breaches that could undermine their reputations with counterparties, investors, and customers. Developing data and reporting standards will facilitate the efforts of regulators and financial institutions to counter cyber threats, enabling faster identifi-cation of trends and more efficient prioritization of resources needed to address emerging threats.
2.3 Financial Stability Monitoring: Progress and Challenges The financial crisis demonstrated that existing policy man-dates and approaches were insufficient to protect the sta-bility of the financial system. Before the financial crisis, no authority had an explicit mandate to undertake systemic risk assessments. Financial stability is now a widely shared policy objective, and policymakers are creating new approaches and better tools to monitor, identify, and mitigate risks to the financial system.
A proper financial stability surveillance system contains four critical elements: (1) an analytic framework and tools for assessing and monitoring vulnerabilities, (2) data from across the financial system to monitor developments in time to permit effective policy responses, (3) qualitative information and intelligence to properly interpret data and monitor areas where data do not exist, and (4) appropriate governance to ensure maximum visibility of risks across authorities and communication channels to permit timely policy action.
Progress has been made in each of these four areas:
Framework and Tools. As part of our mandate, the OFR continues to build and refine our financial stability moni-toring and analytical toolkit through the development of a spectrum of monitors, models, metrics, and visualization
tools. Figure 2-38 summarizes the suite of monitoring tools we are developing to assess risks to the financial system. These tools are intended to help the OFR and other macro-prudential authorities monitor the condition of the financial system and identify vulnerabilities that may lead to financial instability. Figure 2-39 details some of the efforts by other official institutions to implement a framework and develop tools to monitor vulnerabilities.
Data. Filling gaps in the data available for monitoring and analyzing financial stability has advanced, as discussed in Chapter 4. The OFR and other regulators have launched data-sharing initiatives and new collections to fill identified gaps. For example, the OFR, working with the Federal Reserve and the SEC, launched a pilot data collection on bilateral repurchase and securities lending agreements, one of the key blind spots during the financial crisis. The SEC launched Form PF to collect unprecedented data on previ-ously opaque private funds, covering hedge funds, private equity funds, and others (see Leverage, Borrowing, and Derivatives Activities of the 50 Largest Hedge Funds).
Qualitative information and intelligence. Individual regulators and international institutions have expanded their sources of information through interagency briefings, surveys, and regular interactions with financial industry par-ticipants and subject-matter experts in academia. Examples include international working groups such as the Bank for International Settlements’ Committee on the Global Financial System and Committee on Payments and Market Infrastructures, as well as the Financial Stability Board working groups on data standards and vulnerability assess-ment. The OFR hosts biannual meetings of its Financial Research Advisory Committee to solicit recommendations from industry and academic experts on how the office should develop and employ best practices for data manage-ment, data standards, and research methodologies.
Governance and reporting. The Financial Stability Oversight Council (FSOC) has played an important role promoting enhanced communication, consultation, and coordination of its member agencies and other U.S. regula-tory authorities. Among its activities, the FSOC facilitates the process for identifying and prioritizing threats to finan-cial stability, including through its Systemic Risk Committee and other staff committees and working groups.
Meanwhile, substantial challenges to financial stability monitoring remain. The financial system is highly com-plex, dynamic, and interrelated, making it exceedingly
Assessing and Monitoring Threats to Financial Stability 33
challenging to monitor developments in every corner of the system and adequately assess the probability and magnitude of all important risks. Existing surveillance tools, data, and policies are incomplete, and a number of challenges have hampered risk identification efforts, as follows.
Shortcomings in the toolkit. Although the framework and monitoring tools can provide insight into the buildup of vulnerabilities, they do not yet adequately measure the probability and magnitude of contagion risks. The analytic tools are still in the early stages of development: network analysis, agent-based models, and macroprudential stress testing (see Chapter 5). For example, network analysis can enable policymakers to map and model interlinkages and exposures among financial institutions, identify central nodes in the system, and evaluate transmission channels. Agent-based models can be used to observe how an indi-vidual agent’s behavior can transform a crisis by withdrawing funding or selling assets. Unlike existing monitoring tools, dynamic agent-based simulations can help explain complex situations in which the relationships among variables do not necessarily follow historical patterns.
Data deficiencies. Significant data deficiencies remain, not just in terms of the availability but also the quality, scope, and ease of access. Although the FSOC’s member agencies collect a large amount of data through public filings and supervisory reports, no single regulator has a comprehensive view of the financial system as a whole. Cross-institutional data collections covering specific market sectors are gaining momentum but are still in early stages (see Chapter 4). Regulators also lack adequate real-time, high-frequency market data, such as quote, trade, and messaging data. Certain data are accessible by regulators on an ad hoc basis, such as interdealer trades executed on electronic platforms, but other data are not available, in particular dealer-to-client trades executed in over-the-counter markets. Large parts of the financial system, particularly in the nonbank sector, also face inconsistent coverage, insufficient granularity, and weak standardization, in turn limiting visibility of poten-tial threats (see Baklanova, Copeland, and McCaughrin, 2015). The Federal Reserve’s efforts to enhance the Financial Accounts of the United States should help to provide more granular, higher frequency data on financial intermediation.
Impediments to data sharing protocols. The process for collecting and sharing critical data can be slow. Legal frame-works governing individual data collections have inhibited data sharing among regulatory agencies (see FSOC, 2014;
IMF, 2015c). Oversight responsibilities are fragmented across multiple regulators. Regulatory frameworks that are informed by knowledge about specific institutions and markets are necessary, but fragmentation can limit the ability of macroprudential authorities to collectively monitor emerging threats and provide timely in-depth analyses. At the moment, there is no integrated platform to marry anal-ysis with large volumes of data across asset classes.
Risks that are difficult to measure. Threats to financial stability may arise from many sources, not all of which are well understood or easily measured. For instance, managing operational risk, such as cyberattacks, is an area the FSOC has highlighted as important to assure infrastructure resil-ience. Concerns over cybersecurity have increased as large-scale data breaches have become more common, reflecting the growing volume of data stored electronically and the increasing technical sophistication of cyber attackers. Significant work has already taken place to reduce risks related to cybersecurity and improve operational resilience through information sharing, promoting best practices, and developing response and recovery plans for a signifi-cant cyber incident. However, it is a challenge to monitor cyber-related vulnerabilities, assess the systemic impacts, and identify gaps in oversight. A number of federal agencies require public companies to disclose cybersecurity breaches, and many firms note breaches in their public regulatory filings. But firms are reluctant to provide details about the size or impact of cybersecurity breaches because of concerns about potential damage to the confidence of clients and business partners, as well as reputational damage.
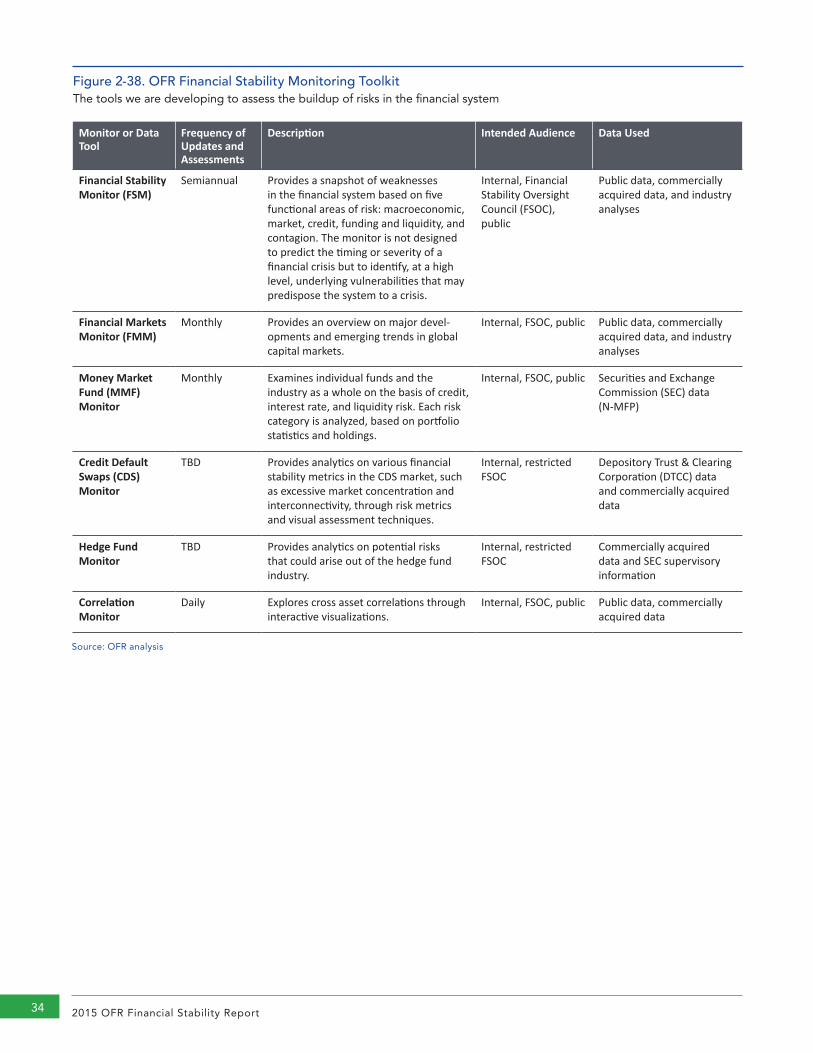
2015 OFR Financial Stability Report34
Monitor or Data Tool
Frequency of Updates and Assessments
Description Intended Audience Data Used
Financial Stability Monitor (FSM)
Semiannual Provides a snapshot of weaknesses in the financial system based on five functional areas of risk: macroeconomic, market, credit, funding and liquidity, and contagion. The monitor is not designed to predict the timing or severity of a financial crisis but to identify, at a high level, underlying vulnerabilities that may predispose the system to a crisis.
Internal, Financial Stability Oversight Council (FSOC), public
Public data, commercially acquired data, and industry analyses
Financial Markets Monitor (FMM)
Monthly Provides an overview on major devel-opments and emerging trends in global capital markets.
Internal, FSOC, public Public data, commercially acquired data, and industry analyses
Money Market Fund (MMF) Monitor
Monthly Examines individual funds and the industry as a whole on the basis of credit, interest rate, and liquidity risk. Each risk category is analyzed, based on portfolio statistics and holdings.
Internal, FSOC, public Securities and Exchange Commission (SEC) data (N-MFP)
Credit Default Swaps (CDS) Monitor
TBD Provides analytics on various financial stability metrics in the CDS market, such as excessive market concentration and interconnectivity, through risk metrics and visual assessment techniques.
Internal, restricted FSOC
Depository Trust & Clearing Corporation (DTCC) data and commercially acquired data
Hedge Fund Monitor
TBD Provides analytics on potential risks that could arise out of the hedge fund industry.
Internal, restricted FSOC
Commercially acquired data and SEC supervisory information
Correlation Monitor
Daily Explores cross asset correlations through interactive visualizations.
Internal, FSOC, public Public data, commercially acquired data
Figure 2-38. OFR Financial Stability Monitoring ToolkitThe tools we are developing to assess the buildup of risks in the financial system
Source: OFR analysis
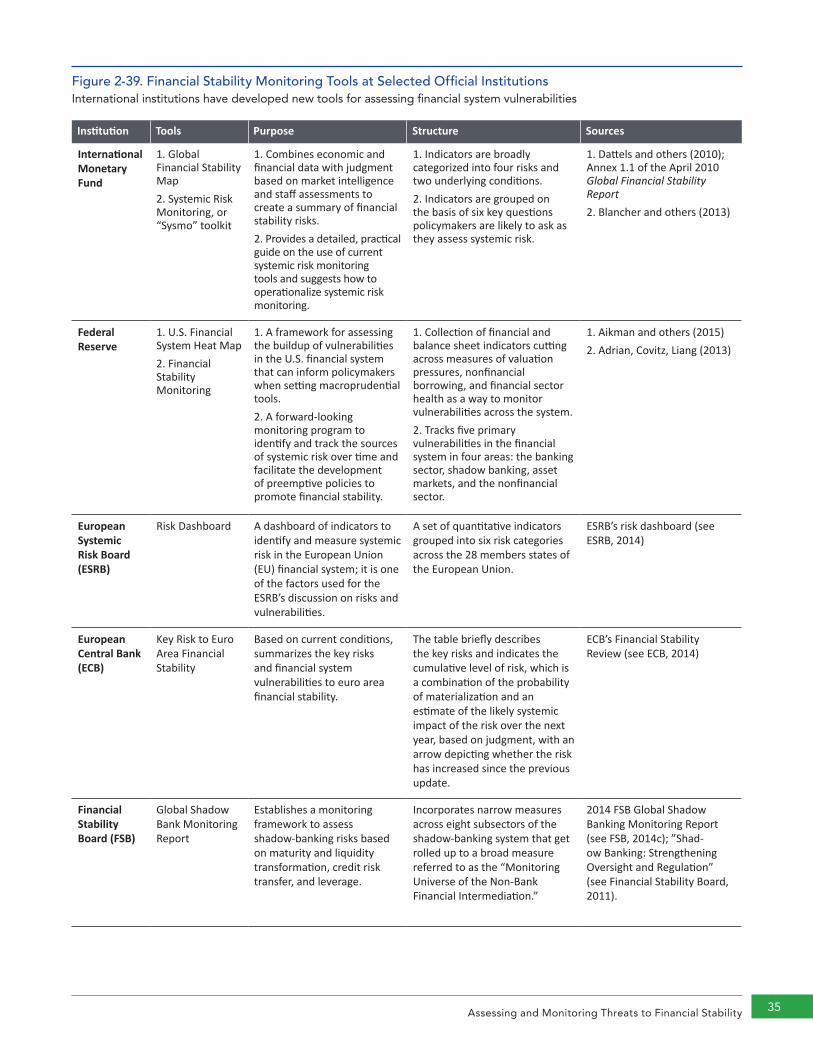
Assessing and Monitoring Threats to Financial Stability 35
Institution Tools Purpose Structure Sources
International Monetary Fund
1. Global Financial Stability Map2. Systemic Risk Monitoring, or “Sysmo” toolkit
1. Combines economic and financial data with judgment based on market intelligence and staff assessments to create a summary of financial stability risks.2. Provides a detailed, practical guide on the use of current systemic risk monitoring tools and suggests how to operationalize systemic risk monitoring.
1. Indicators are broadly categorized into four risks and two underlying conditions.2. Indicators are grouped on the basis of six key questions policymakers are likely to ask as they assess systemic risk.
1. Dattels and others (2010); Annex 1.1 of the April 2010 Global Financial Stability Report2. Blancher and others (2013)
Federal Reserve
1. U.S. Financial System Heat Map2. Financial Stability Monitoring
1. A framework for assessing the buildup of vulnerabilities in the U.S. financial system that can inform policymakers when setting macroprudential tools.2. A forward-looking monitoring program to identify and track the sources of systemic risk over time and facilitate the development of preemptive policies to promote financial stability.
1. Collection of financial and balance sheet indicators cutting across measures of valuation pressures, nonfinancial borrowing, and financial sector health as a way to monitor vulnerabilities across the system.2. Tracks five primary vulnerabilities in the financial system in four areas: the banking sector, shadow banking, asset markets, and the nonfinancial sector.
1. Aikman and others (2015)2. Adrian, Covitz, Liang (2013)
European Systemic Risk Board (ESRB)
Risk Dashboard A dashboard of indicators to identify and measure systemic risk in the European Union (EU) financial system; it is one of the factors used for the ESRB’s discussion on risks and vulnerabilities.
A set of quantitative indicators grouped into six risk categories across the 28 members states of the European Union.
ESRB’s risk dashboard (see ESRB, 2014)
European Central Bank (ECB)
Key Risk to Euro Area Financial Stability
Based on current conditions, summarizes the key risks and financial system vulnerabilities to euro area financial stability.
The table briefly describes the key risks and indicates the cumulative level of risk, which is a combination of the probability of materialization and an estimate of the likely systemic impact of the risk over the next year, based on judgment, with an arrow depicting whether the risk has increased since the previous update.
ECB’s Financial Stability Review (see ECB, 2014)
Financial Stability Board (FSB)
Global Shadow Bank Monitoring Report
Establishes a monitoring framework to assess shadow-banking risks based on maturity and liquidity transformation, credit risk transfer, and leverage.
Incorporates narrow measures across eight subsectors of the shadow-banking system that get rolled up to a broad measure referred to as the “Monitoring Universe of the Non-Bank Financial Intermediation.”
2014 FSB Global Shadow Banking Monitoring Report (see FSB, 2014c); ”Shad-ow Banking: Strengthening Oversight and Regulation” (see Financial Stability Board, 2011).
Figure 2-39. Financial Stability Monitoring Tools at Selected Official InstitutionsInternational institutions have developed new tools for assessing financial system vulnerabilities
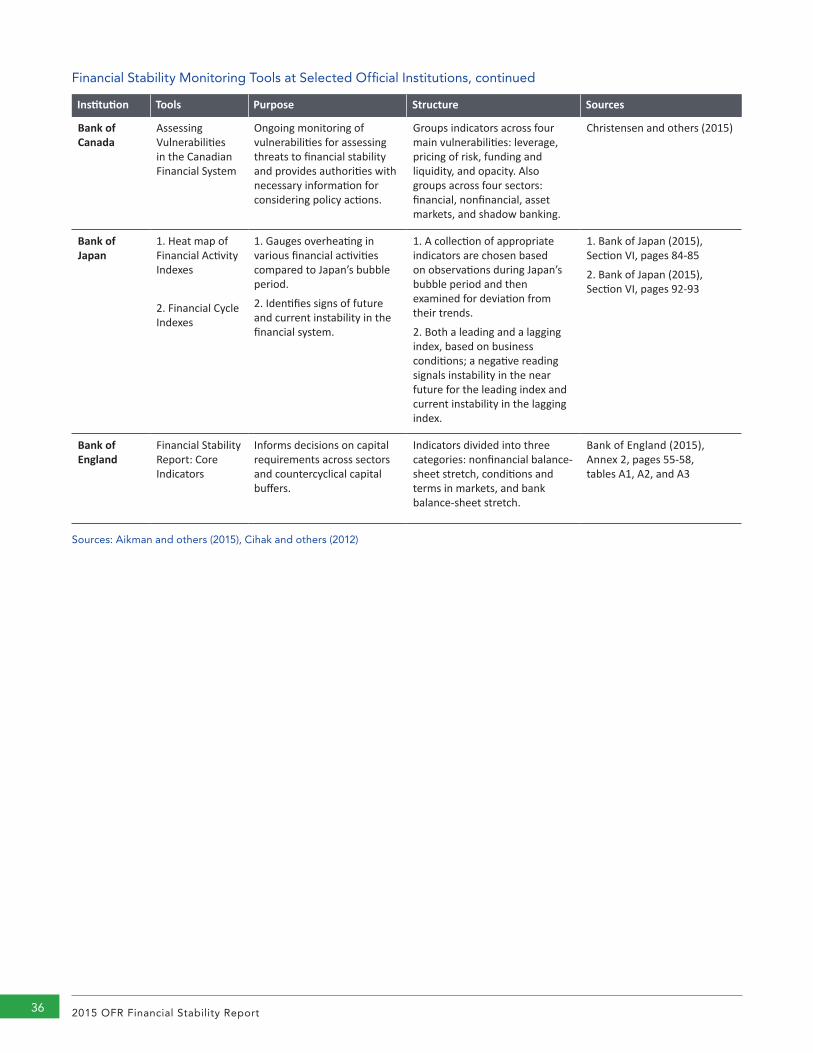
2015 OFR Financial Stability Report36
Institution Tools Purpose Structure Sources
Bank of Canada
Assessing Vulnerabilities in the Canadian Financial System
Ongoing monitoring of vulnerabilities for assessing threats to financial stability and provides authorities with necessary information for considering policy actions.
Groups indicators across four main vulnerabilities: leverage, pricing of risk, funding and liquidity, and opacity. Also groups across four sectors: financial, nonfinancial, asset markets, and shadow banking.
Christensen and others (2015)
Bank of Japan
1. Heat map of Financial Activity Indexes
2. Financial Cycle Indexes
1. Gauges overheating in various financial activities compared to Japan’s bubble period.
2. Identifies signs of future and current instability in the financial system.
1. A collection of appropriate indicators are chosen based on observations during Japan’s bubble period and then examined for deviation from their trends.
2. Both a leading and a lagging index, based on business conditions; a negative reading signals instability in the near future for the leading index and current instability in the lagging index.
1. Bank of Japan (2015), Section VI, pages 84-85
2. Bank of Japan (2015), Section VI, pages 92-93
Bank of England
Financial Stability Report: Core Indicators
Informs decisions on capital requirements across sectors and countercyclical capital buffers.
Indicators divided into three categories: nonfinancial balance-sheet stretch, conditions and terms in markets, and bank balance-sheet stretch.
Bank of England (2015), Annex 2, pages 55-58, tables A1, A2, and A3
Sources: Aikman and others (2015), Cihak and others (2012)
Financial Stability Monitoring Tools at Selected Official Institutions, continued
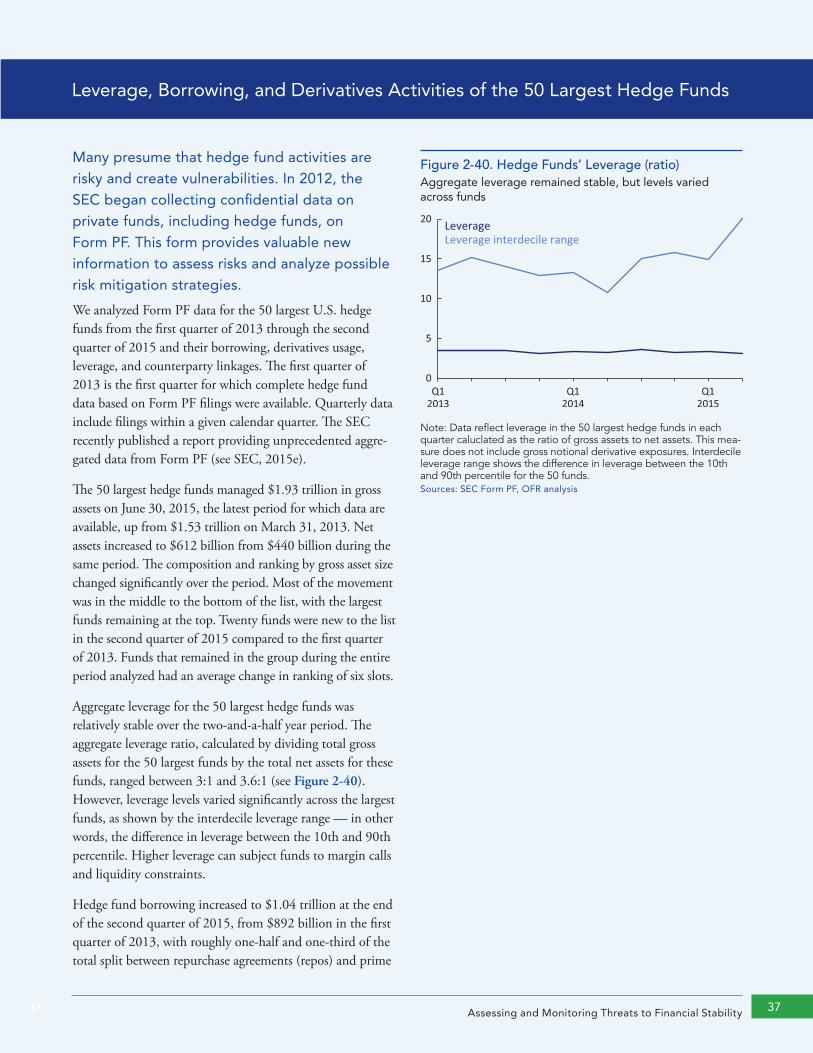
]Insert Section Title[ 37Assessing and Monitoring Threats to Financial Stability 373737
Leverage, Borrowing, and Derivatives Activities of the 50 Largest Hedge Funds
Many presume that hedge fund activities are risky and create vulnerabilities. In 2012, the SEC began collecting confidential data on private funds, including hedge funds, on Form PF. This form provides valuable new information to assess risks and analyze possible risk mitigation strategies.
We analyzed Form PF data for the 50 largest U.S. hedge funds from the first quarter of 2013 through the second quarter of 2015 and their borrowing, derivatives usage, leverage, and counterparty linkages. The first quarter of 2013 is the first quarter for which complete hedge fund data based on Form PF filings were available. Quarterly data include filings within a given calendar quarter. The SEC recently published a report providing unprecedented aggre-gated data from Form PF (see SEC, 2015e).
The 50 largest hedge funds managed $1.93 trillion in gross assets on June 30, 2015, the latest period for which data are available, up from $1.53 trillion on March 31, 2013. Net assets increased to $612 billion from $440 billion during the same period. The composition and ranking by gross asset size changed significantly over the period. Most of the movement was in the middle to the bottom of the list, with the largest funds remaining at the top. Twenty funds were new to the list in the second quarter of 2015 compared to the first quarter of 2013. Funds that remained in the group during the entire period analyzed had an average change in ranking of six slots.
Aggregate leverage for the 50 largest hedge funds was relatively stable over the two-and-a-half year period. The aggregate leverage ratio, calculated by dividing total gross assets for the 50 largest funds by the total net assets for these funds, ranged between 3:1 and 3.6:1 (see Figure 2-40). However, leverage levels varied significantly across the largest funds, as shown by the interdecile leverage range — in other words, the difference in leverage between the 10th and 90th percentile. Higher leverage can subject funds to margin calls and liquidity constraints.
Hedge fund borrowing increased to $1.04 trillion at the end of the second quarter of 2015, from $892 billion in the first quarter of 2013, with roughly one-half and one-third of the total split between repurchase agreements (repos) and prime
Figure 2-40. Hedge Funds’ Leverage (ratio)Aggregate leverage remained stable, but levels varied across funds
0
5
10
15
20
Q12013
Q12015
Q12014
LeverageLeverage interdecile range
Note: Data reflect leverage in the 50 largest hedge funds in each quarter caluclated as the ratio of gross assets to net assets. This mea-sure does not include gross notional derivative exposures. Interdecile leverage range shows the difference in leverage between the 10th and 90th percentile for the 50 funds.Sources: SEC Form PF, OFR analysis
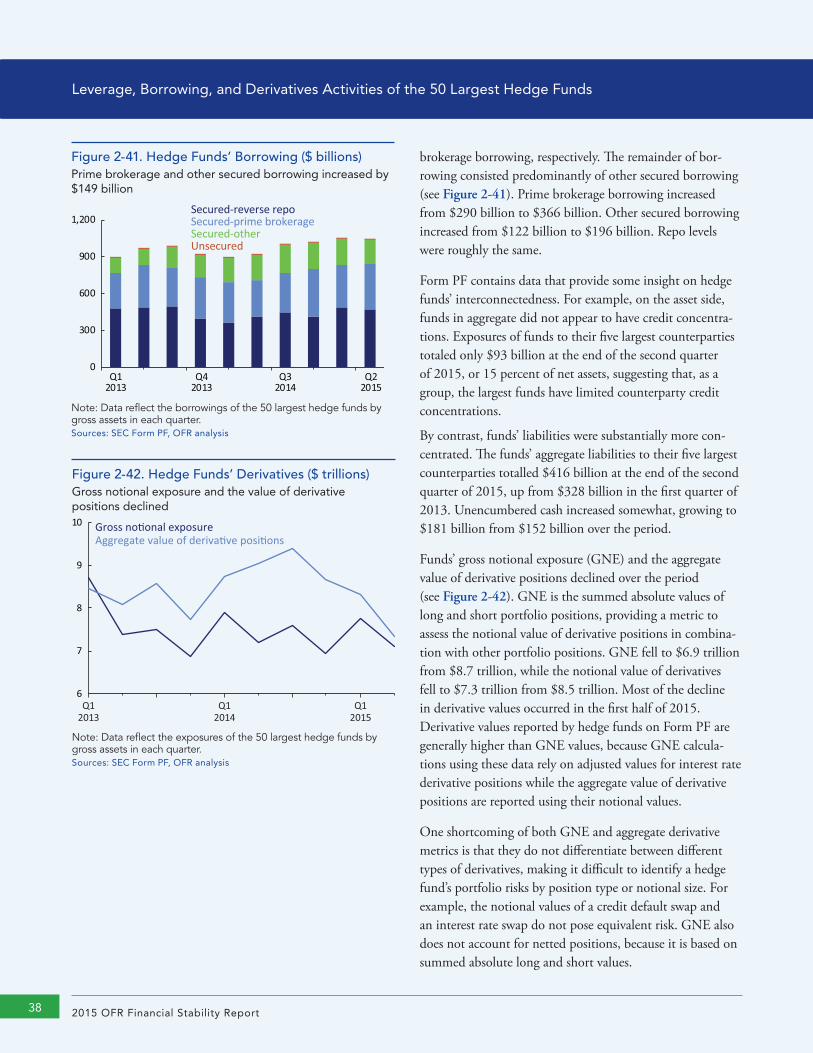
2015 OFR Financial Stability Report38 2015 OFR Financial Stability Report38
brokerage borrowing, respectively. The remainder of bor-rowing consisted predominantly of other secured borrowing (see Figure 2-41). Prime brokerage borrowing increased from $290 billion to $366 billion. Other secured borrowing increased from $122 billion to $196 billion. Repo levels were roughly the same.
Form PF contains data that provide some insight on hedge funds’ interconnectedness. For example, on the asset side, funds in aggregate did not appear to have credit concentra-tions. Exposures of funds to their five largest counterparties totaled only $93 billion at the end of the second quarter of 2015, or 15 percent of net assets, suggesting that, as a group, the largest funds have limited counterparty credit concentrations.
By contrast, funds’ liabilities were substantially more con-centrated. The funds’ aggregate liabilities to their five largest counterparties totalled $416 billion at the end of the second quarter of 2015, up from $328 billion in the first quarter of 2013. Unencumbered cash increased somewhat, growing to $181 billion from $152 billion over the period.
Funds’ gross notional exposure (GNE) and the aggregate value of derivative positions declined over the period (see Figure 2-42). GNE is the summed absolute values of long and short portfolio positions, providing a metric to assess the notional value of derivative positions in combina-tion with other portfolio positions. GNE fell to $6.9 trillion from $8.7 trillion, while the notional value of derivatives fell to $7.3 trillion from $8.5 trillion. Most of the decline in derivative values occurred in the first half of 2015. Derivative values reported by hedge funds on Form PF are generally higher than GNE values, because GNE calcula-tions using these data rely on adjusted values for interest rate derivative positions while the aggregate value of derivative positions are reported using their notional values.
One shortcoming of both GNE and aggregate derivative metrics is that they do not differentiate between different types of derivatives, making it difficult to identify a hedge fund’s portfolio risks by position type or notional size. For example, the notional values of a credit default swap and an interest rate swap do not pose equivalent risk. GNE also does not account for netted positions, because it is based on summed absolute long and short values.
Figure 2-42. Hedge Funds’ Derivatives ($ trillions)Gross notional exposure and the value of derivative positions declined
Gross no�onal exposureAggregate value of deriva�ve posi�ons
6
7
8
9
10
Q12013
Q12015
Q12014
Note: Data reflect the exposures of the 50 largest hedge funds by gross assets in each quarter.Sources: SEC Form PF, OFR analysis
Figure 2-41. Hedge Funds’ Borrowing ($ billions)Prime brokerage and other secured borrowing increased by $149 billion
Secured-reverse repoSecured-prime brokerageSecured-otherUnsecured
0
300
600
900
1,200
Q12013
Q42013
Q32014
Q22015
Note: Data reflect the borrowings of the 50 largest hedge funds by gross assets in each quarter.Sources: SEC Form PF, OFR analysis
Leverage, Borrowing, and Derivatives Activities of the 50 Largest Hedge Funds

]Insert Section Title[ 39Assessing and Monitoring Threats to Financial Stability 39
Figure 2-43. Hedge Funds’ Investment Strategies (percent)About 74 percent of assets were managed in relative value, equity, and macro strategies on June 30, 2015
0.5%
0.6%
3.2%
5.4%
15.9%
19.3%
22.6%
32.5%
0 200 400 600 800
ManagedFutures/CTA
Investment inOther Funds
Event Driven
Credit
Other
Macro
Equity
Rela�ve Value
Note: Data reflect strategies in the 50 largest hedge funds by gross assets as of June 30, 2015. Strategy percentages were calculated by normalizing the reported values of percentage of net asset value from Form PF’s question 20 for each fund and multiplying normalized percentages by fund gross assets from Form PF’s question 9. “Other” includes figures reported as “Other” on Form PF and percentage figures for reporting strategies with small values. Caution should be exercised in interpreting reported strategy results, since funds report-ing on Form PF may have different interpretations of the hedge fund strategies identified on Form PF.Sources: SEC Form PF, OFR analysis
Using data reported on Form PF, we calculated hedge fund strategy composition by normalizing the percentage of net asset value for each fund and multiplying normalized percentages by fund gross assets. A combined 74 percent of fund assets were managed on June 30, 2015, using one of three classes of investment strategies: relative value (33 percent), equity (23 percent) and macro (19 percent) (see Figure 2-43). “Other” investment strategies accounted for 17 percent of the assets held by the 50 largest hedge funds. The percentage of assets managed in reported strate-gies changed moderately. Between the first quarter of 2013 and the second quarter of 2015, macro investment strategies had the largest relative decline (24 percent to 18 percent of the total), while equity market neutral strategies had the largest relative increase (up from 5 percent to 8 percent of the total).
Evaluating Financial Stability Policies 41
The OFR has a statutory mandate to study and evaluate policies related to financial stability. This chapter reports on our work to fulfill that mandate.
Section 3.1 outlines recent policy developments, our framework for evaluating them, factors that complicate policy implementation, and pathways to understand such complexity. Section 3.2 evaluates the progress and considers remaining work to be done to address the risks posed by systemically important financial companies. Section 3.3 discusses some policies aimed at making nonbank financial entities more resilient, specifically, central counterparties, asset managers, and government-sponsored enterprises. Section 3.4 assesses potential unintended consequences of bank capital and liquidity standards and the Volcker Rule.
3.1 Micro- and Macroprudential Policy U.S. regulators have taken important steps to strengthen U.S. banks’ resilience against credit and liquidity shocks and to improve transparency and reduce vulnerabilities in money markets, derivatives, and other financial markets. But it is important to guard against unintended consequences. Some policies may create adverse incentives or encourage financial activities to migrate to more opaque or less resilient areas of the financial system. And important gaps remain in the macroprudential policy toolkit.
Financial stability policies seek to make the financial system more resilient to shocks, to ensure that the system can provide its basic functions even under stress and to minimize the adverse consequences of those shocks for economic activity.
Resilience has two aspects — the system’s shock-absorbing capacity, and market participants’ incentives to limit excessive risk-taking, which can be promoted by market discipline and transparent pricing of risk. Likewise, two sets of tools are needed to promote resilience. Shock absorbers are needed to buffer against shocks, and incentives that affect behavior, known as guardrails, are needed to increase the cost of — and thereby constrain — the risk-taking that can create financial vulnerabilities.
Policy tools can be microprudential (primarily aimed at the safety and soundness of institutions) or macropru-dential (primarily aimed at the resilience of the system as a whole). Regulators have deployed both to strengthen the financial system. Examples of macroprudential tools could include minimum haircut floors that aim to limit excessive reliance on short-term funding, and risk retention rules that require those involved in originating and selling assets for securitization to hold some of the risk, or “skin in the game.” But the line between micro- and macroprudential is hardly a bright one. Some tools, such as capital and liquidity buffers, contain elements of each.
Ideally, shock absorbers and guardrails as well as micro and macro tools, work together as part of the prudential toolkit. In our policy work, we analyze the available tools and how they function to address potential vulnerabilities in the financial system, while considering the alternatives, effectiveness, potential drawbacks, and unintended consequences of those tools.
Evaluating Financial Stability Policies 3
2015 OFR Financial Stability Report42
Policy Developments
The list of steps taken to make financial institutions more resilient is consequential (see Section 3.2 and Section 3.3). Banks hold bigger capital and liquidity buffers. Stress testing has helped identify vulnerabilities and calibrate buffers and has promoted improvements in firms’ risk management. Coming enhanced supervisory and prudential standards for certain large, complex nonbank financial companies could offset their risks. Resolution plans for designated firms will provide transparency to supervisors about their strategy for a rapid and orderly resolution in the event of material financial distress or failure.
Regulators have also begun to build resilience to address market vulnerabilities. For example, money market funds are subject to new rules that aim to address the risk of runs. To align incentives, the non residential mortgage securitization market and a small fraction of the residential mortgage market are subject to risk retention rules. Newly required central clearing and reporting for standard transactions have been implemented to strengthen derivatives markets and make them more transparent.
Key steps taken in 2015 include:
• In July, the Federal Reserve finalized rules for certain U.S. bank holding companies implementing a capital surcharge for U.S. global systemically important banks (G-SIBs), effective in 2016 (see Section 3.2). Two OFR briefs described the data used for the designation of G-SIBs (see Allahrakha, Glasserman, and Young, 2015; Glasserman, and Loudis, 2015).
• In May and September, the Securities and Exchange Commission (SEC) proposed rules that would set higher liquidity requirements and improve reporting and disclosures by funds and investment advisors subject to the Investment Company and Investment Advisors Acts of 1940 (see Section 3.3).
• In July, new limits on banks’ proprietary trading activi-ties took effect under the Volcker Rule (see Section 3.4).
• In October, the Federal Reserve Board proposed a draft rule that would require G-SIBs to maintain a mix of long-term debt and equity, together referred to as total loss absorbing capacity, to cover potential losses in the event of bank failure. The proposal seeks to ensure that extraordinary government support or taxpayer funds are not used to bail out these insti-tutions and that both debt and equity investors are
exposed to losses in the event of failure (see Board of Governors, 2015c).
• In November, the Farm Credit Administration, Federal Deposit Insurance Corporation (FDIC), Federal Housing Finance Agency (FHFA), Federal Reserve Board, and Office of the Comptroller of the Currency (OCC) finalized a rule to establish capital and initial and variation margin requirements for non-cleared swaps and security-based swaps at covered swap entities (see OCC and others, 2015). The rule is designed to offset the risk in and to encourage central clearing of such transactions and is consistent with the global margin regime for them.
Evaluation Framework
The OFR has a statutory mandate to study and evaluate policies related to financial stability. Our annual reports have recommended using a three-step analytical framework for evaluating potential macroprudential tools (see Figure 3-1). These steps are: (1) define the macroprudential toolkit, which could include quantitative limits, buffers, or other efforts to affect the incentives of market participants; (2) evaluate the effectiveness of the options, including intended results, drawbacks, and potential unintended consequences; and (3) select the right tools, while seeking to understand how their use may interact with each other and with other policies that affect the financial system. For example, when banks are subject to multiple capital and liquidity regu-lations, their decision-making in a crisis — for example, whether to sell assets or raise capital — could be affected by which limit they are closest to violating as well as the type of financial shock (see Possible Bank Responses to Binding Regulatory Ratios).
While both structural and cyclical macroprudential policy tools exist, in the United States all but one of our financial stability tools so far is structural in nature. That is, they are designed to make the financial system more resilient through the credit cycle, for example, by requiring greater buffers against loss. Cyclical — or more accurately, counter-cyclical — tools would respond to a cyclical buildup of risks. The one formal U.S. exception is the countercyclical capital buffer, which allows increased capital requirements to address cyclical excesses in bank lending; officials must clarify how and under what circumstances they would use it. Informal U.S. bank regulators’ guidance to limit risk-taking in leveraged lending markets is also countercyclical policy. Such measures appear to have limited banks’ leveraged
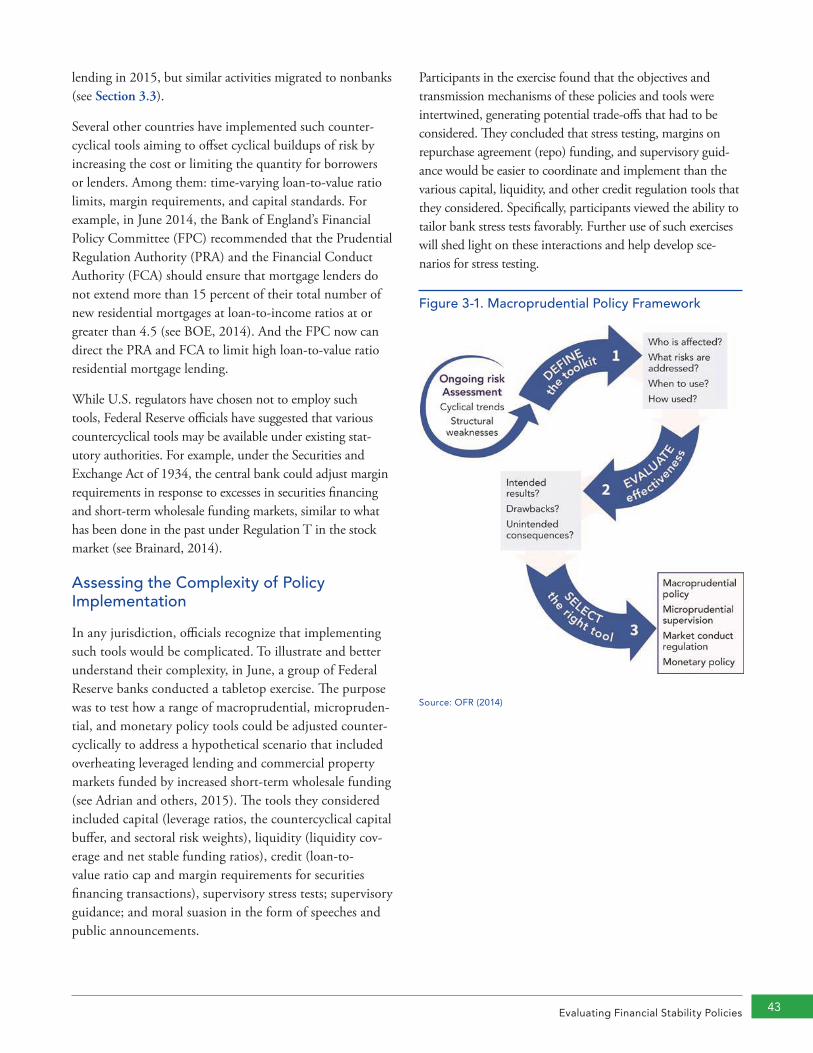
Evaluating Financial Stability Policies 43
lending in 2015, but similar activities migrated to nonbanks (see Section 3.3).
Several other countries have implemented such counter-cyclical tools aiming to offset cyclical buildups of risk by increasing the cost or limiting the quantity for borrowers or lenders. Among them: time-varying loan-to-value ratio limits, margin requirements, and capital standards. For example, in June 2014, the Bank of England’s Financial Policy Committee (FPC) recommended that the Prudential Regulation Authority (PRA) and the Financial Conduct Authority (FCA) should ensure that mortgage lenders do not extend more than 15 percent of their total number of new residential mortgages at loan-to-income ratios at or greater than 4.5 (see BOE, 2014). And the FPC now can direct the PRA and FCA to limit high loan-to-value ratio residential mortgage lending.
While U.S. regulators have chosen not to employ such tools, Federal Reserve officials have suggested that various countercyclical tools may be available under existing stat-utory authorities. For example, under the Securities and Exchange Act of 1934, the central bank could adjust margin requirements in response to excesses in securities financing and short-term wholesale funding markets, similar to what has been done in the past under Regulation T in the stock market (see Brainard, 2014).
Assessing the Complexity of Policy Implementation
In any jurisdiction, officials recognize that implementing such tools would be complicated. To illustrate and better understand their complexity, in June, a group of Federal Reserve banks conducted a tabletop exercise. The purpose was to test how a range of macroprudential, micropruden-tial, and monetary policy tools could be adjusted counter-cyclically to address a hypothetical scenario that included overheating leveraged lending and commercial property markets funded by increased short-term wholesale funding (see Adrian and others, 2015). The tools they considered included capital (leverage ratios, the countercyclical capital buffer, and sectoral risk weights), liquidity (liquidity cov-erage and net stable funding ratios), credit (loan-to- value ratio cap and margin requirements for securities financing transactions), supervisory stress tests; supervisory guidance; and moral suasion in the form of speeches and public announcements.
Participants in the exercise found that the objectives and transmission mechanisms of these policies and tools were intertwined, generating potential trade-offs that had to be considered. They concluded that stress testing, margins on repurchase agreement (repo) funding, and supervisory guid-ance would be easier to coordinate and implement than the various capital, liquidity, and other credit regulation tools that they considered. Specifically, participants viewed the ability to tailor bank stress tests favorably. Further use of such exercises will shed light on these interactions and help develop sce-narios for stress testing.
Figure 3-1. Macroprudential Policy Framework
Source: OFR (2014)
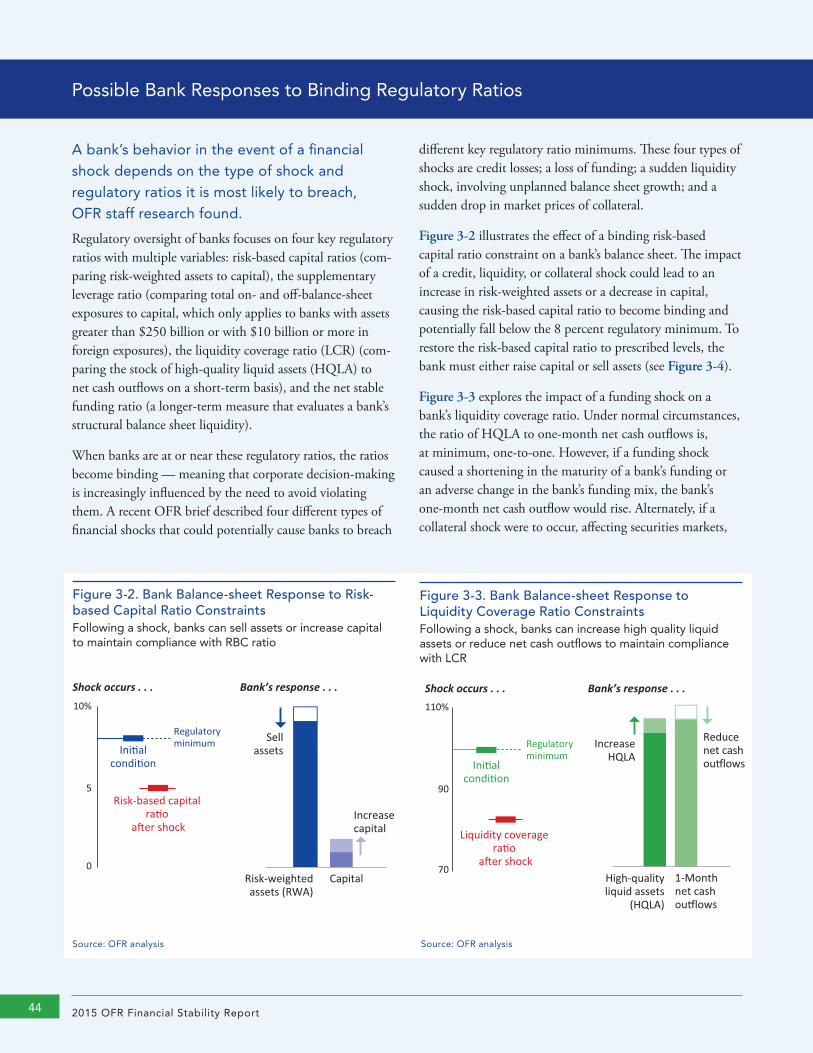
2015 OFR Financial Stability Report44 2015 OFR Financial Stability Report44
Figure 3-2. Bank Balance-sheet Response to Risk-based Capital Ratio ConstraintsFollowing a shock, banks can sell assets or increase capital to maintain compliance with RBC ratio
Capital
Ini�alcondi�on
Regulatory minimum
Risk-based capital ra�o
a�er shockIncreasecapital
Sellassets
Risk-weightedassets (RWA)
0
5
10%
Bank’s response . . .Shock occurs . . .
A bank’s behavior in the event of a financial shock depends on the type of shock and regulatory ratios it is most likely to breach, OFR staff research found.
Regulatory oversight of banks focuses on four key regulatory ratios with multiple variables: risk-based capital ratios (com-paring risk-weighted assets to capital), the supplementary leverage ratio (comparing total on- and off-balance-sheet exposures to capital, which only applies to banks with assets greater than $250 billion or with $10 billion or more in foreign exposures), the liquidity coverage ratio (LCR) (com-paring the stock of high-quality liquid assets (HQLA) to net cash outflows on a short-term basis), and the net stable funding ratio (a longer-term measure that evaluates a bank’s structural balance sheet liquidity).
When banks are at or near these regulatory ratios, the ratios become binding — meaning that corporate decision-making is increasingly influenced by the need to avoid violating them. A recent OFR brief described four different types of financial shocks that could potentially cause banks to breach
different key regulatory ratio minimums. These four types of shocks are credit losses; a loss of funding; a sudden liquidity shock, involving unplanned balance sheet growth; and a sudden drop in market prices of collateral.
Figure 3-2 illustrates the effect of a binding risk-based capital ratio constraint on a bank’s balance sheet. The impact of a credit, liquidity, or collateral shock could lead to an increase in risk-weighted assets or a decrease in capital, causing the risk-based capital ratio to become binding and potentially fall below the 8 percent regulatory minimum. To restore the risk-based capital ratio to prescribed levels, the bank must either raise capital or sell assets (see Figure 3-4).
Figure 3-3 explores the impact of a funding shock on a bank’s liquidity coverage ratio. Under normal circumstances, the ratio of HQLA to one-month net cash outflows is, at minimum, one-to-one. However, if a funding shock caused a shortening in the maturity of a bank’s funding or an adverse change in the bank’s funding mix, the bank’s one-month net cash outflow would rise. Alternately, if a collateral shock were to occur, affecting securities markets,
Possible Bank Responses to Binding Regulatory Ratios
Figure 3-3. Bank Balance-sheet Response to Liquidity Coverage Ratio ConstraintsFollowing a shock, banks can increase high quality liquid assets or reduce net cash outflows to maintain compliance with LCR
1-Monthnet cashou�lows
Ini alcondi on
Regulatory minimum
Liquidity coverage ra o
a�er shock
Reducenet cashou�lows
IncreaseHQLA
High-qualityliquid assets
(HQLA)
70
90
110%
Bank’s response . . .Shock occurs . . .
Source: OFR analysis Source: OFR analysis
]Insert Section Title[ 45Evaluating Financial Stability Policies 45
the value of the bank’s stock of HQLA could fall. In these scenarios, the bank’s liquidity coverage ratio could fall below the regulatory minimum of 100 percent. The bank could respond by either changing its funding mix, extending the maturity of its funding (if able), or selling less-liquid assets to obtain HQLA or cash (see Figure 3-4).
If a bank has no options other than to sell assets, the delever-aging strategy might vary depending on which regulatory ratio is most at risk of being breached. For example, when facing the risk-based capital ratio as a binding constraint, a bank can sell non-zero risk-weighted securities, such as Level 2 assets, to reduce risk-weighted assets as a first line of defense. By contrast, a bank cannot improve its supplemen-tary leverage ratio through asset sales because cash counts as part of total exposures, the leverage ratio’s denominator. Banks can only sell assets on their balance sheets to improve the leverage ratio if they can also retire outstanding liabili-ties, for example, through exercising a call option and using the cash to retire a bond. By contrast, a bank could quickly and easily improve its leverage ratio denominator by shed-ding off-balance-sheet items, such as repurchase agreements, derivatives, and loan commitments.
Although the liquidity coverage ratio and net stable funding ratio encourage banks to hold substantial amounts of Level 1 HQLA, a bank’s sale of Level 1 assets would not improve either of these regulatory ratios because Level 1 HQLA is marked-to-market and is fully credited as if it were cash in both regulatory calculations. A liquidity-constrained firm would sell its assets that are not Level 1 first, if forced to deleverage. Similarly, a bank facing a risk-based capital ratio constraint would also tend to sell its most liquid non-Level-1 assets, which generally have higher risk weights.
Figure 3-4 shows that the net stable funding ratio is unique among the four regulatory standards in that it can be impacted by all four types of shocks to banks. The risk-based capital ratio and the leverage ratio can also be impacted by unplanned balance sheet growth.
This analysis highlights the importance of greater integra-tion of liquidity and funding risk in supervisory stress tests for banks.
Most of this material appeared previously in OFR Brief 15-06, “Incorporating Liquidity Shocks and Feedbacks in Bank Stress Tests” (see Cetina, 2015).
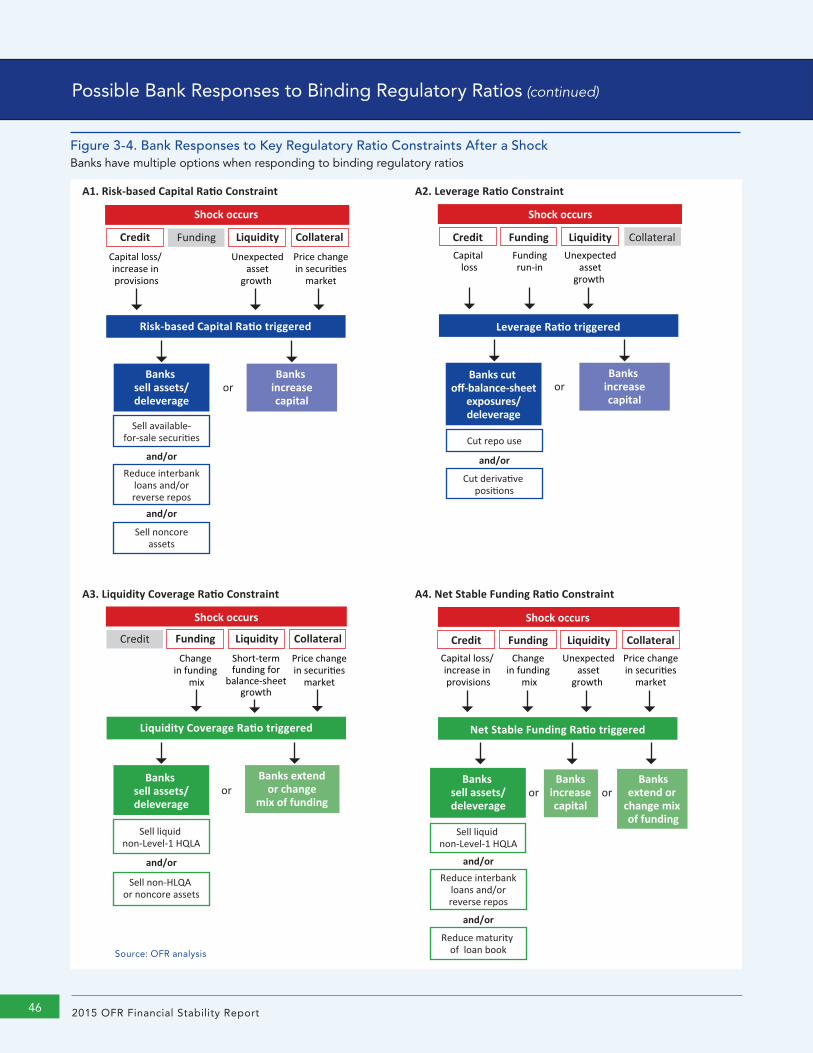
2015 OFR Financial Stability Report46
Figure 3-4. Bank Responses to Key Regulatory Ratio Constraints After a ShockBanks have multiple options when responding to binding regulatory ratios
or
and/or
and/or
Capital loss/ increase in provisions
Price change in securi�es
market
Credit CollateralFunding
Shock occurs
Risk-based Capital Ra�o triggered
Banks increasecapital
Banks sell assets/deleverage
Sell available-for-sale securi�es
Reduce interbankloans and/orreverse repos
Sell noncoreassets
Unexpected asset
growth
Liquidity
A1. Risk-based Capital Ra�o Constraint A2. Leverage Ra�o Constraint
or
and/or
Capital loss
Unexpected asset
growth
Credit Liquidity Collateral
Leverage Ra�o triggered
Banks increasecapital
Banks cut off-balance-sheet
exposures/deleverage
Cut repo use
Cut deriva�ve posi�ons
Fundingrun-in
Funding
Shock occurs
or
and/or
Change in funding
mix
Price change in securi�es
market
Credit CollateralFunding
Shock occurs
Liquidity Coverage Ra�o triggered
Banks extendor change
mix of funding
Banks sell assets/deleverage
Sell liquid non-Level-1 HQLA
Sell non-HLQA or noncore assets
A3. Liquidity Coverage Ra�o Constraint
Short-termfunding for
balance-sheetgrowth
Liquidity
Banksextend or
change mix of funding
A4. Net Stable Funding Ra�o Constraint
or orBanks
increasecapital
Capital loss/ increase in provisions
Reduce interbankloans and/orreverse repos
and/or
and/or
Change in funding
mix
Price change in securi�es
market
Credit CollateralFunding
Shock occurs
Net Stable Funding Ra�o triggered
Banks sell assets/deleverage
Sell liquid non-Level-1 HQLA
Reduce maturity of loan book
Unexpected asset
growth
Liquidity
Source: OFR analysis
Possible Bank Responses to Binding Regulatory Ratios (continued)
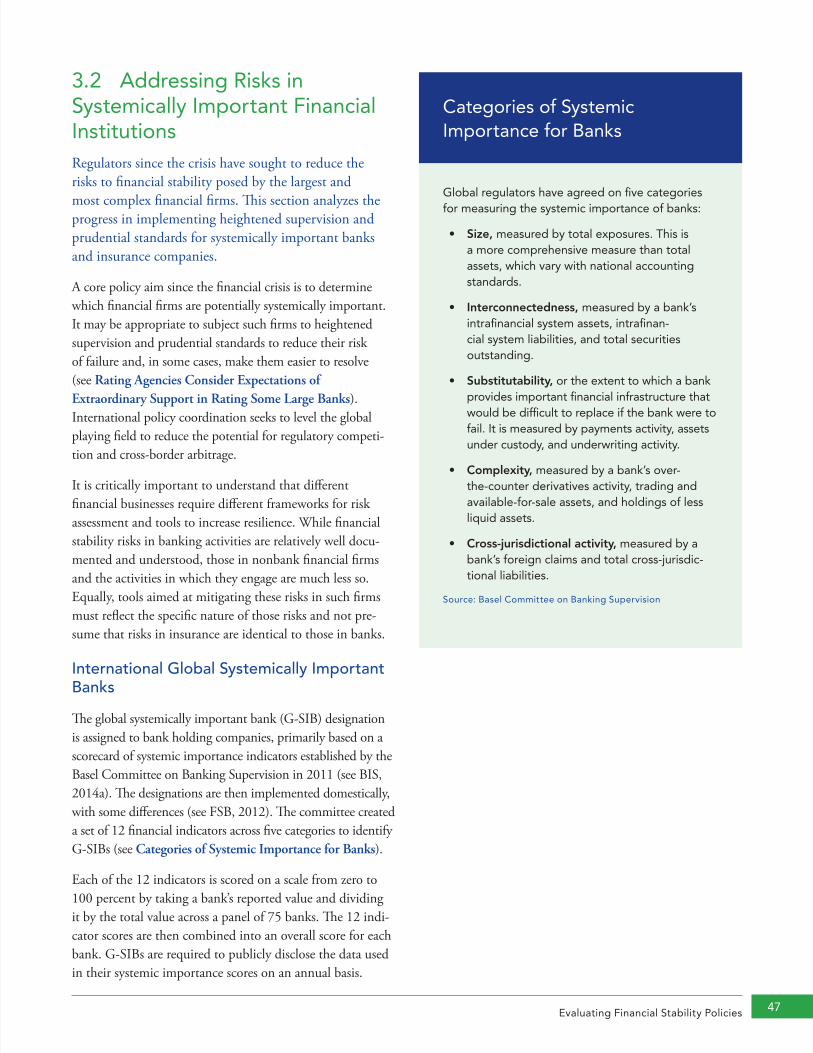
Evaluating Financial Stability Policies 47
3.2 Addressing Risks in Systemically Important Financial InstitutionsRegulators since the crisis have sought to reduce the risks to financial stability posed by the largest and most complex financial firms. This section analyzes the progress in implementing heightened supervision and prudential standards for systemically important banks and insurance companies.
A core policy aim since the financial crisis is to determine which financial firms are potentially systemically important. It may be appropriate to subject such firms to heightened supervision and prudential standards to reduce their risk of failure and, in some cases, make them easier to resolve (see Rating Agencies Consider Expectations of Extraordinary Support in Rating Some Large Banks). International policy coordination seeks to level the global playing field to reduce the potential for regulatory competi-tion and cross-border arbitrage.
It is critically important to understand that different financial businesses require different frameworks for risk assessment and tools to increase resilience. While financial stability risks in banking activities are relatively well docu-mented and understood, those in nonbank financial firms and the activities in which they engage are much less so. Equally, tools aimed at mitigating these risks in such firms must reflect the specific nature of those risks and not pre-sume that risks in insurance are identical to those in banks.
International Global Systemically Important Banks
The global systemically important bank (G-SIB) designation is assigned to bank holding companies, primarily based on a scorecard of systemic importance indicators established by the Basel Committee on Banking Supervision in 2011 (see BIS, 2014a). The designations are then implemented domestically, with some differences (see FSB, 2012). The committee created a set of 12 financial indicators across five categories to identify G-SIBs (see Categories of Systemic Importance for Banks).
Each of the 12 indicators is scored on a scale from zero to 100 percent by taking a bank’s reported value and dividing it by the total value across a panel of 75 banks. The 12 indi-cator scores are then combined into an overall score for each bank. G-SIBs are required to publicly disclose the data used in their systemic importance scores on an annual basis.
Categories of Systemic Importance for Banks
Global regulators have agreed on five categories for measuring the systemic importance of banks:
• Size,measured by total exposures. This is a more comprehensive measure than total assets, which vary with national accounting standards.
• Interconnectedness,measured by a bank’s intrafinancial system assets, intrafinan-cial system liabilities, and total securities outstanding.
• Substitutability, or the extent to which a bank provides important financial infrastructure that would be difficult to replace if the bank were to fail. It is measured by payments activity, assets under custody, and underwriting activity.
• Complexity, measured by a bank’s over-the-counter derivatives activity, trading and available-for-sale assets, and holdings of less liquid assets.
• Cross-jurisdictionalactivity, measured by a bank’s foreign claims and total cross-jurisdic-tional liabilities.
Source: Basel Committee on Banking Supervision
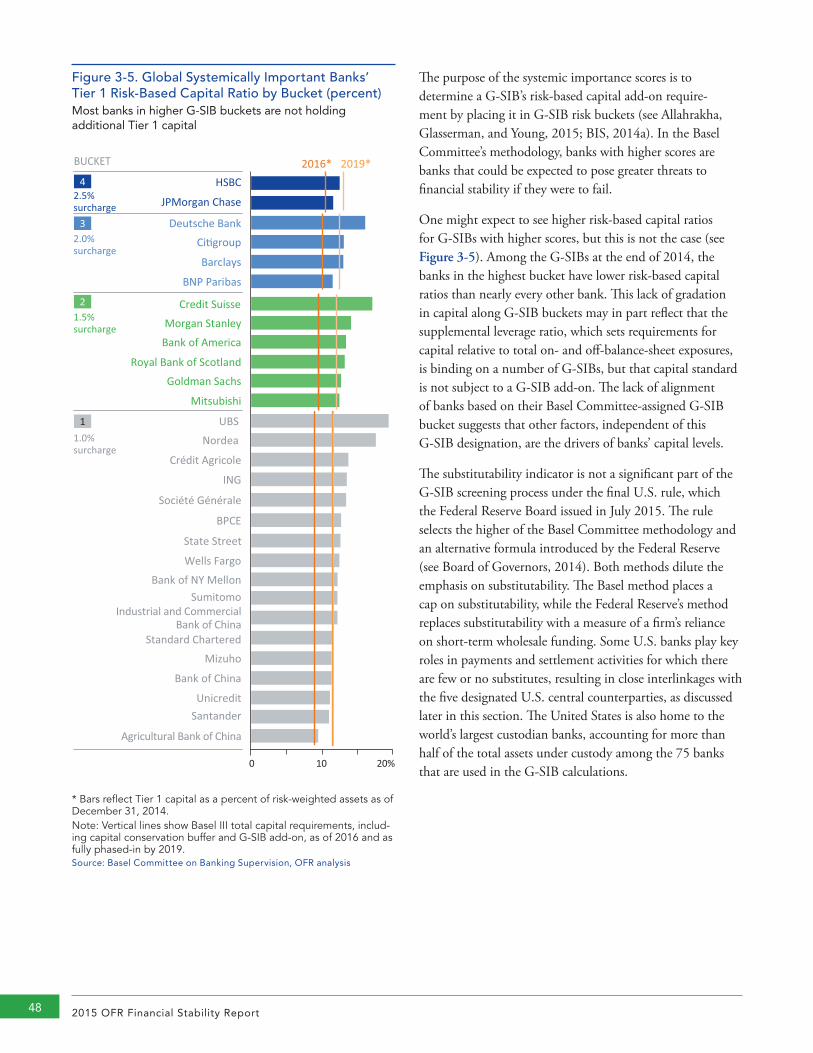
2015 OFR Financial Stability Report48
The purpose of the systemic importance scores is to determine a G-SIB’s risk-based capital add-on require-ment by placing it in G-SIB risk buckets (see Allahrakha, Glasserman, and Young, 2015; BIS, 2014a). In the Basel Committee’s methodology, banks with higher scores are banks that could be expected to pose greater threats to financial stability if they were to fail.
One might expect to see higher risk-based capital ratios for G-SIBs with higher scores, but this is not the case (see Figure 3-5). Among the G-SIBs at the end of 2014, the banks in the highest bucket have lower risk-based capital ratios than nearly every other bank. This lack of gradation in capital along G-SIB buckets may in part reflect that the supplemental leverage ratio, which sets requirements for capital relative to total on- and off-balance-sheet exposures, is binding on a number of G-SIBs, but that capital standard is not subject to a G-SIB add-on. The lack of alignment of banks based on their Basel Committee-assigned G-SIB bucket suggests that other factors, independent of this G-SIB designation, are the drivers of banks’ capital levels.
The substitutability indicator is not a significant part of the G-SIB screening process under the final U.S. rule, which the Federal Reserve Board issued in July 2015. The rule selects the higher of the Basel Committee methodology and an alternative formula introduced by the Federal Reserve (see Board of Governors, 2014). Both methods dilute the emphasis on substitutability. The Basel method places a cap on substitutability, while the Federal Reserve’s method replaces substitutability with a measure of a firm’s reliance on short-term wholesale funding. Some U.S. banks play key roles in payments and settlement activities for which there are few or no substitutes, resulting in close interlinkages with the five designated U.S. central counterparties, as discussed later in this section. The United States is also home to the world’s largest custodian banks, accounting for more than half of the total assets under custody among the 75 banks that are used in the G-SIB calculations.
Figure 3-5. Global Systemically Important Banks’ Tier 1 Risk-Based Capital Ratio by Bucket (percent) Most banks in higher G-SIB buckets are not holding additional Tier 1 capital
Agricultural Bank of China
SantanderUnicredit
Bank of China
MizuhoStandard Chartered
Industrial and CommercialBank of China
SumitomoBank of NY Mellon
Wells Fargo
State Street
BPCE
Société Générale
ING
Crédit Agricole
Nordea UBS
2016* 2019*
20%100
1.0%surcharge
1
BUCKET
* Tier 1 capital as a percent of risk-weighted assets. Note: Ver�cal lines show Basel III total capital requirements, including capital conserva�on buffer and G-SIB add-on, as of 2014 and as fully phased-in by 2019.Sources: Company G-SIB disclosures, SNL Financial LC, Bank for Interna�onal Se�lements, OFR analysis
JPMorgan Chase
HSBC42.5%surcharge
BNP Paribas
Barclays
Ci�groupDeutsche Bank
2.0%surcharge
3
Mitsubishi
Goldman SachsRoyal Bank of Scotland
Bank of America
Morgan StanleyCredit Suisse
1.5%surcharge
2
* Bars reflect Tier 1 capital as a percent of risk-weighted assets as of December 31, 2014. Note: Vertical lines show Basel III total capital requirements, includ-ing capital conservation buffer and G-SIB add-on, as of 2016 and as fully phased-in by 2019. Source: Basel Committee on Banking Supervision, OFR analysis
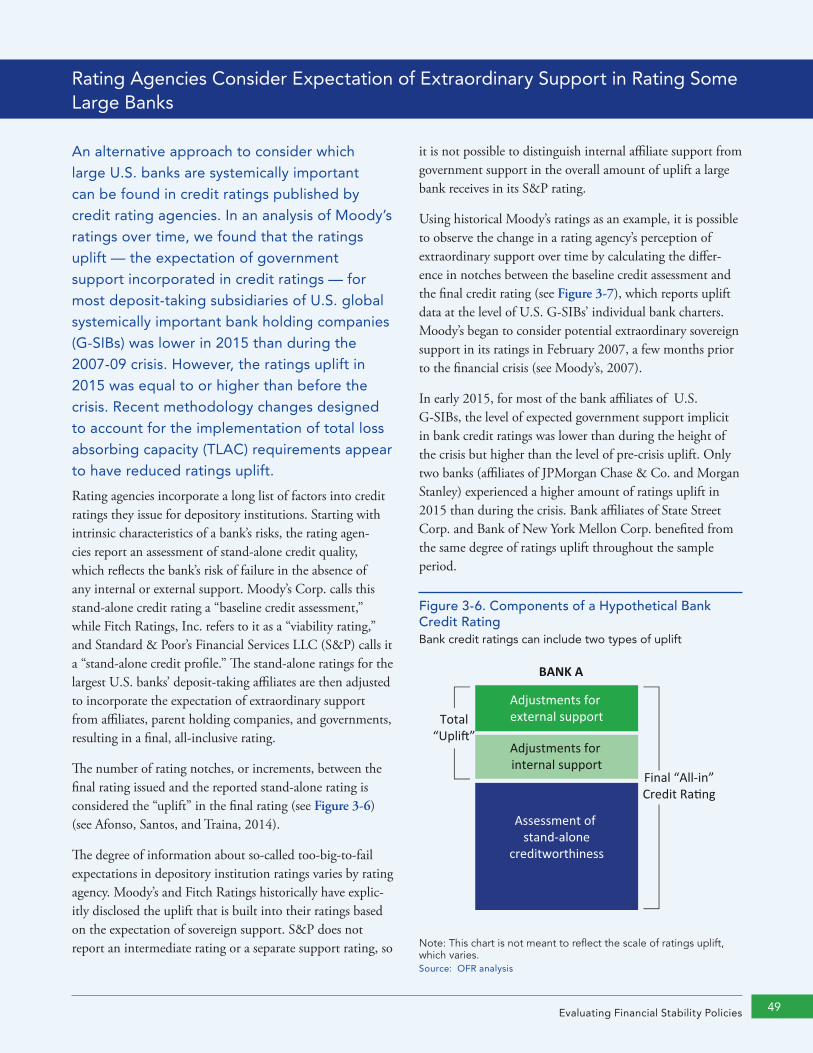
Evaluating Financial Stability Policies 49
An alternative approach to consider which large U.S. banks are systemically important can be found in credit ratings published by credit rating agencies. In an analysis of Moody’s ratings over time, we found that the ratings uplift — the expectation of government support incorporated in credit ratings — for most deposit-taking subsidiaries of U.S. global systemically important bank holding companies (G-SIBs) was lower in 2015 than during the 2007-09 crisis. However, the ratings uplift in 2015 was equal to or higher than before the crisis. Recent methodology changes designed to account for the implementation of total loss absorbing capacity (TLAC) requirements appear to have reduced ratings uplift.
Rating agencies incorporate a long list of factors into credit ratings they issue for depository institutions. Starting with intrinsic characteristics of a bank’s risks, the rating agen-cies report an assessment of stand-alone credit quality, which reflects the bank’s risk of failure in the absence of any internal or external support. Moody’s Corp. calls this stand-alone credit rating a “baseline credit assessment,” while Fitch Ratings, Inc. refers to it as a “viability rating,” and Standard & Poor’s Financial Services LLC (S&P) calls it a “stand-alone credit profile.” The stand-alone ratings for the largest U.S. banks’ deposit-taking affiliates are then adjusted to incorporate the expectation of extraordinary support from affiliates, parent holding companies, and governments, resulting in a final, all-inclusive rating.
The number of rating notches, or increments, between the final rating issued and the reported stand-alone rating is considered the “uplift” in the final rating (see Figure 3-6) (see Afonso, Santos, and Traina, 2014).
The degree of information about so-called too-big-to-fail expectations in depository institution ratings varies by rating agency. Moody’s and Fitch Ratings historically have explic-itly disclosed the uplift that is built into their ratings based on the expectation of sovereign support. S&P does not report an intermediate rating or a separate support rating, so
it is not possible to distinguish internal affiliate support from government support in the overall amount of uplift a large bank receives in its S&P rating.
Using historical Moody’s ratings as an example, it is possible to observe the change in a rating agency’s perception of extraordinary support over time by calculating the differ-ence in notches between the baseline credit assessment and the final credit rating (see Figure 3-7), which reports uplift data at the level of U.S. G-SIBs’ individual bank charters. Moody’s began to consider potential extraordinary sovereign support in its ratings in February 2007, a few months prior to the financial crisis (see Moody’s, 2007).
In early 2015, for most of the bank affiliates of U.S. G-SIBs, the level of expected government support implicit in bank credit ratings was lower than during the height of the crisis but higher than the level of pre-crisis uplift. Only two banks (affiliates of JPMorgan Chase & Co. and Morgan Stanley) experienced a higher amount of ratings uplift in 2015 than during the crisis. Bank affiliates of State Street Corp. and Bank of New York Mellon Corp. benefited from the same degree of ratings uplift throughout the sample period.
Figure 3-6. Components of a Hypothetical Bank Credit RatingBank credit ratings can include two types of uplift
Adjustments for external supportTotal
“Upli�”
BANK A
Assessment of stand-alone
creditworthiness
Adjustments for internal support
Final “All-in”Credit Ra�ng
Note: This chart is not meant to reflect the scale of ratings uplift, which varies.Source: OFR analysis
Rating Agencies Consider Expectation of Extraordinary Support in Rating Some Large Banks
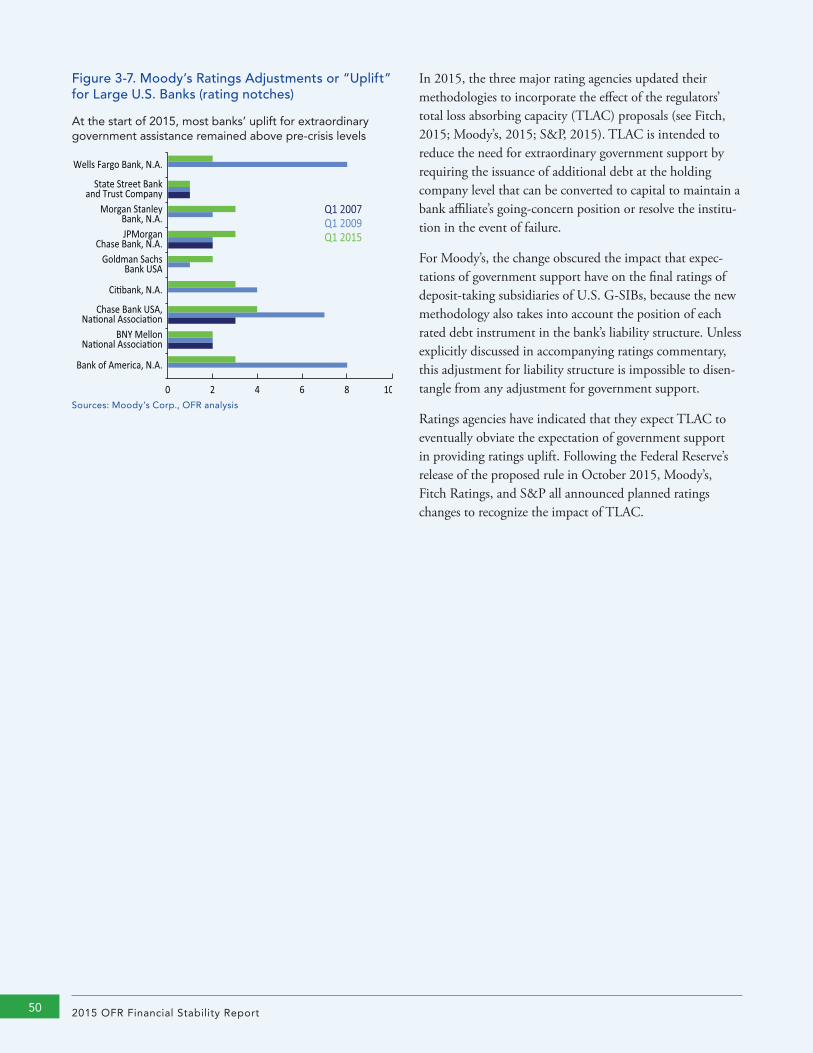
2015 OFR Financial Stability Report50
Figure 3-7. Moody’s Ratings Adjustments or “Uplift” for Large U.S. Banks (rating notches)
At the start of 2015, most banks’ uplift for extraordinary government assistance remained above pre-crisis levels
Bank of America, N.A.
BNY MellonNa�onal Associa�on
Chase Bank USA,Na�onal Associa�on
Ci�bank, N.A.
Goldman SachsBank USA
JPMorganChase Bank, N.A.
Morgan StanleyBank, N.A.
State Street Bankand Trust Company
Wells Fargo Bank, N.A.
0 2 4 6 8 10
Q1 2007Q1 2009Q1 2015
Sources: Moody’s Corp., OFR analysis
In 2015, the three major rating agencies updated their methodologies to incorporate the effect of the regulators’ total loss absorbing capacity (TLAC) proposals (see Fitch, 2015; Moody’s, 2015; S&P, 2015). TLAC is intended to reduce the need for extraordinary government support by requiring the issuance of additional debt at the holding company level that can be converted to capital to maintain a bank affiliate’s going-concern position or resolve the institu-tion in the event of failure.
For Moody’s, the change obscured the impact that expec-tations of government support have on the final ratings of deposit-taking subsidiaries of U.S. G-SIBs, because the new methodology also takes into account the position of each rated debt instrument in the bank’s liability structure. Unless explicitly discussed in accompanying ratings commentary, this adjustment for liability structure is impossible to disen-tangle from any adjustment for government support.
Ratings agencies have indicated that they expect TLAC to eventually obviate the expectation of government support in providing ratings uplift. Following the Federal Reserve’s release of the proposed rule in October 2015, Moody’s, Fitch Ratings, and S&P all announced planned ratings changes to recognize the impact of TLAC.
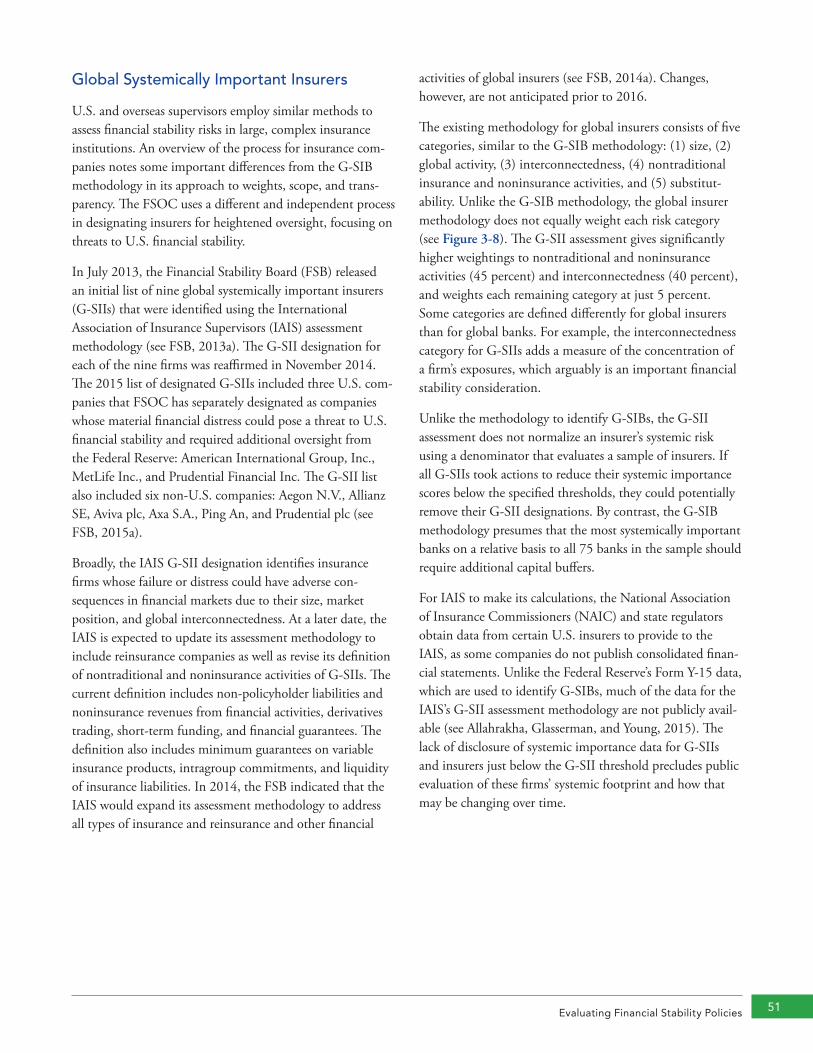
Evaluating Financial Stability Policies 51
Global Systemically Important Insurers
U.S. and overseas supervisors employ similar methods to assess financial stability risks in large, complex insurance institutions. An overview of the process for insurance com-panies notes some important differences from the G-SIB methodology in its approach to weights, scope, and trans-parency. The FSOC uses a different and independent process in designating insurers for heightened oversight, focusing on threats to U.S. financial stability.
In July 2013, the Financial Stability Board (FSB) released an initial list of nine global systemically important insurers (G-SIIs) that were identified using the International Association of Insurance Supervisors (IAIS) assessment methodology (see FSB, 2013a). The G-SII designation for each of the nine firms was reaffirmed in November 2014. The 2015 list of designated G-SIIs included three U.S. com-panies that FSOC has separately designated as companies whose material financial distress could pose a threat to U.S. financial stability and required additional oversight from the Federal Reserve: American International Group, Inc., MetLife Inc., and Prudential Financial Inc. The G-SII list also included six non-U.S. companies: Aegon N.V., Allianz SE, Aviva plc, Axa S.A., Ping An, and Prudential plc (see FSB, 2015a).
Broadly, the IAIS G-SII designation identifies insurance firms whose failure or distress could have adverse con-sequences in financial markets due to their size, market position, and global interconnectedness. At a later date, the IAIS is expected to update its assessment methodology to include reinsurance companies as well as revise its definition of nontraditional and noninsurance activities of G-SIIs. The current definition includes non-policyholder liabilities and noninsurance revenues from financial activities, derivatives trading, short-term funding, and financial guarantees. The definition also includes minimum guarantees on variable insurance products, intragroup commitments, and liquidity of insurance liabilities. In 2014, the FSB indicated that the IAIS would expand its assessment methodology to address all types of insurance and reinsurance and other financial
activities of global insurers (see FSB, 2014a). Changes, however, are not anticipated prior to 2016.
The existing methodology for global insurers consists of five categories, similar to the G-SIB methodology: (1) size, (2) global activity, (3) interconnectedness, (4) nontraditional insurance and noninsurance activities, and (5) substitut-ability. Unlike the G-SIB methodology, the global insurer methodology does not equally weight each risk category (see Figure 3-8). The G-SII assessment gives significantly higher weightings to nontraditional and noninsurance activities (45 percent) and interconnectedness (40 percent), and weights each remaining category at just 5 percent. Some categories are defined differently for global insurers than for global banks. For example, the interconnectedness category for G-SIIs adds a measure of the concentration of a firm’s exposures, which arguably is an important financial stability consideration.
Unlike the methodology to identify G-SIBs, the G-SII assessment does not normalize an insurer’s systemic risk using a denominator that evaluates a sample of insurers. If all G-SIIs took actions to reduce their systemic importance scores below the specified thresholds, they could potentially remove their G-SII designations. By contrast, the G-SIB methodology presumes that the most systemically important banks on a relative basis to all 75 banks in the sample should require additional capital buffers.
For IAIS to make its calculations, the National Association of Insurance Commissioners (NAIC) and state regulators obtain data from certain U.S. insurers to provide to the IAIS, as some companies do not publish consolidated finan-cial statements. Unlike the Federal Reserve’s Form Y-15 data, which are used to identify G-SIBs, much of the data for the IAIS’s G-SII assessment methodology are not publicly avail-able (see Allahrakha, Glasserman, and Young, 2015). The lack of disclosure of systemic importance data for G-SIIs and insurers just below the G-SII threshold precludes public evaluation of these firms’ systemic footprint and how that may be changing over time.
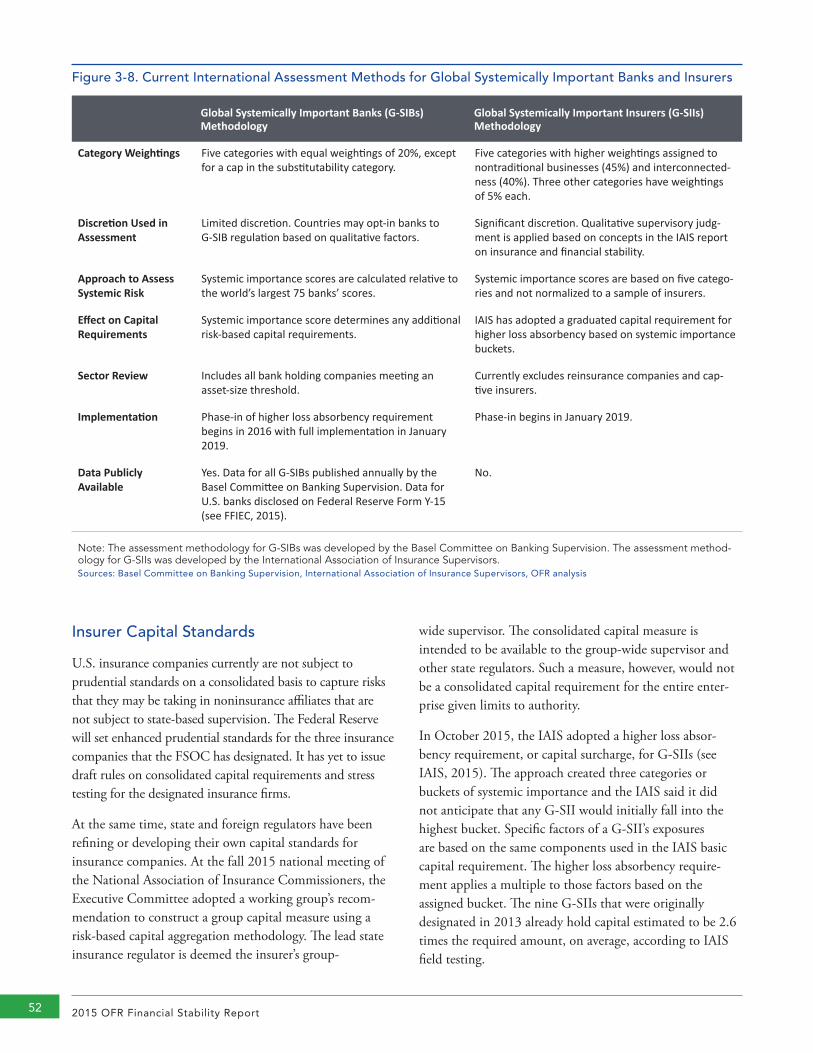
2015 OFR Financial Stability Report52
Insurer Capital Standards
U.S. insurance companies currently are not subject to prudential standards on a consolidated basis to capture risks that they may be taking in noninsurance affiliates that are not subject to state-based supervision. The Federal Reserve will set enhanced prudential standards for the three insurance companies that the FSOC has designated. It has yet to issue draft rules on consolidated capital requirements and stress testing for the designated insurance firms.
At the same time, state and foreign regulators have been refining or developing their own capital standards for insurance companies. At the fall 2015 national meeting of the National Association of Insurance Commissioners, the Executive Committee adopted a working group’s recom-mendation to construct a group capital measure using a risk-based capital aggregation methodology. The lead state insurance regulator is deemed the insurer’s group-
wide supervisor. The consolidated capital measure is intended to be available to the group-wide supervisor and other state regulators. Such a measure, however, would not be a consolidated capital requirement for the entire enter-prise given limits to authority.
In October 2015, the IAIS adopted a higher loss absor-bency requirement, or capital surcharge, for G-SIIs (see IAIS, 2015). The approach created three categories or buckets of systemic importance and the IAIS said it did not anticipate that any G-SII would initially fall into the highest bucket. Specific factors of a G-SII’s exposures are based on the same components used in the IAIS basic capital requirement. The higher loss absorbency require-ment applies a multiple to those factors based on the assigned bucket. The nine G-SIIs that were originally designated in 2013 already hold capital estimated to be 2.6 times the required amount, on average, according to IAIS field testing.
Figure 3-8. Current International Assessment Methods for Global Systemically Important Banks and Insurers
Global Systemically Important Banks (G-SIBs) Methodology
Global Systemically Important Insurers (G-SIIs) Methodology
Category Weightings Five categories with equal weightings of 20%, except for a cap in the substitutability category.
Five categories with higher weightings assigned to nontraditional businesses (45%) and interconnected-ness (40%). Three other categories have weightings of 5% each.
Discretion Used in Assessment
Limited discretion. Countries may opt-in banks to G-SIB regulation based on qualitative factors.
Significant discretion. Qualitative supervisory judg-ment is applied based on concepts in the IAIS report on insurance and financial stability.
Approach to Assess Systemic Risk
Systemic importance scores are calculated relative to the world’s largest 75 banks’ scores.
Systemic importance scores are based on five catego-ries and not normalized to a sample of insurers.
Effect on Capital Requirements
Systemic importance score determines any additional risk-based capital requirements.
IAIS has adopted a graduated capital requirement for higher loss absorbency based on systemic importance buckets.
Sector Review Includes all bank holding companies meeting an asset-size threshold.
Currently excludes reinsurance companies and cap-tive insurers.
Implementation Phase-in of higher loss absorbency requirement begins in 2016 with full implementation in January 2019.
Phase-in begins in January 2019.
Data Publicly Available
Yes. Data for all G-SIBs published annually by the Basel Committee on Banking Supervision. Data for U.S. banks disclosed on Federal Reserve Form Y-15 (see FFIEC, 2015).
No.
Note: The assessment methodology for G-SIBs was developed by the Basel Committee on Banking Supervision. The assessment method-ology for G-SIIs was developed by the International Association of Insurance Supervisors.Sources: Basel Committee on Banking Supervision, International Association of Insurance Supervisors, OFR analysis

Evaluating Financial Stability Policies 53
Meanwhile, the risks that some large life insurers pose to financial stability may be rising, according to certain mar-ket-based measures. In the third quarter of 2015, two large life insurance companies were among the top five U.S. financial firms based on a systemic risk measure calculated by New York University economists (see NYU, 2015). The measure, known as SRISK, incorporates a financial compa-ny’s leverage, size, and expected capital shortfall in the event of a substantial market decline to estimate its contribution to the deterioration of the financial system during a crisis. The measure provides a cross-sectional, contemporaneous comparison of systemic risk across diverse financial services companies (see Figure 3-9).
3.3 Addressing Risks in Nonbank Financial InstitutionsThis section considers risk mitigants in three types of nonbank financial institutions, specifically, central coun-terparties, asset managers, and housing government-spon-sored enterprises (GSEs).
Central Counterparties
One of the notable features of the Dodd-Frank Act is a requirement to increase the use of central counterparties (CCPs) for derivatives transactions. A CCP is a financial market utility that interposes itself between counterparties to financial transactions, becoming the buyer to every seller and the seller to every buyer. CCPs can reduce a firm’s expo-sure to individual counterparties and can mitigate overall credit risk through multilateral trade netting and imposing risk controls on clearing members. At the same time, the increased volume of centrally cleared transactions can con-centrate counterparty credit risk rather than eliminate it.
In 2012, the FSOC designated five CCPs as systemically important financial market utilities, consistent with the criteria for designation under Title VIII of the Dodd-Frank Act (see FSOC, 2015b). Under Title VIII, the supervisory agency of a domestic CCP is the CFTC or SEC, depending on the company’s activities (see Figure 3-10). The Federal Reserve also has certain authorities under Title VIII with all five systemically important CCPs; however, its systemically important financial market utility standards do not apply to designated CCPs for which the CFTC or the SEC is the supervisory agency.
Figure 3-9. Top Five U.S. Financial Institutions by Systemic Risk Ranking ScoreSystemic importance scores for insurers and banks have increased
5
4
3
2
1 JPMorgan
FreddieMac
MerrillLynch
BearStearns
LehmanBros.
FreddieMac
FannieMae
MorganStanley
JPMorgan
Bank ofAmerica
Morgan Stanley*
AmericanInternat’l
Group
MerrillLynch
GoldmanSachs
Ci�group
Bank ofAmerica
MetLife
Pruden�al
Ci�group JPMorgan
Investment bank Government-sponsored enterprise
Insurance companyBank holding company
Q3 2015Q4 2009Q4 2005Q4 2001Ranking
Score
* Morgan Stanley converted into a bank holding company in September 2008.
Source: New York University Volatility Institute
2015 OFR Financial Stability Report54
In 2013, the CFTC issued a final rule implementing new CCP regulations consistent with international standards in the Principles for Financial Market Infrastructures, which U.S. regulators helped craft (see BIS-IOSCO, 2012; CFTC, 2013a). These principles include standards for risk man-agement, including financial resource requirements, default rules and loss allocation procedures, stress testing, and plans for an orderly wind down or recovery. The SEC proposed a rule in 2014 to bring its standards for covered clearing agen-cies into greater alignment with the international standards but has not yet issued a final rule (see SEC, 2014b).
U.S. regulators are involved in efforts to coordinate interna-tional work on various aspects of CCP resilience, recovery, and resolution as part of the Financial Stability Board’s CCP work plan. Separately, U.S. and European regulators are currently discussing differences in regulatory regimes in connection with the European Union’s equivalency
determination under its Regulation on OTC Derivatives, Central Counterparties and Trade Repositories (see CFTC, 2013b). One of the key issues under discussion is how the methodologies used to determine certain margin require-ments could affect competition between CCPs located in different jurisdictions (see Massad, 2012).
The OFR staff has done research identifying potential risks to CCPs arising from competition related to initial margin requirements. Although practices differ across CCPs, typi-cally a CCP would cover losses from a defaulting member by first using the financial resources of that member, including margin and default fund contributions. If losses still exist, the CCP would next use its own capital (in most cases), followed by the default fund contributions of surviving members. Further losses could be absorbed by additional assessments on surviving members (see Powell, 2015a).
Name Parent Financial Instruments Supervisory Agency
Other Regulators
Chicago Mercantile Exchange, Inc.
CME Group, Inc. Futures, options, and swaps CFTC Also registered with the SEC as a clearing agency, although CME recently filed a writ-ten request to withdraw from registration as a clearing agency under Section 17A of the Exchange Act. The SEC has published notice of that request to solicit comments (see SEC, 2015b). The Federal Reserve has certain authorities under Title VIII.
Fixed Income Clearing Corp.
Depository Trust & Clearing Corp.
U.S. Treasury and agency debt securities and U.S. agency pass-through mortgage-backed securities
SEC The Federal Reserve has certain authorities under Title VIII.
ICE Clear Credit L.L.C.
Indirect subsidiary of Intercontinental Exchange, Inc.
Standardized credit default swaps
CFTC Also registered with the SEC as a clearing agency. The Federal Reserve has certain authorities under Title VIII.
National Securities Clearing Corp.
Depository Trust & Clearing Corp.
U.S. equities, corporate and municipal bonds, exchange-traded funds, and unit investment trusts
SEC The Federal Reserve has certain authorities under Title VIII.
Options Clearing Corp.
None Futures, options, and options on futures
SEC Also registered with the CFTC as a deriva-tives clearing organization. The Federal Re-serve has certain authorities under Title VIII.
Note: CFTC = Commodity Futures Trading Commission. SEC = Securities and Exchange Commission.Sources: Financial Stability Oversight Council, Federal Reserve, OFR analysis
Figure 3-10. Regulators of U.S. Central Counterparties that are Designated Financial Market Utilities

Evaluating Financial Stability Policies 55
For example, one OFR paper found that in a swaps market with two CCPs, initial margin requirements need to increase more than linearly with position size to properly capture liquidity costs in the event of a default by a CCP member (see Glasserman, Moallemi, and Yuan, 2015). Otherwise, swap dealers have an incentive to hide potential liquidation costs from each CCP. If CCP views on liquidity costs differ, there can be a race to the bottom that underprices liquidity risk in setting initial margin requirements. The CFTC’s final rule for margin requirements does not require position concentration to be factored into margin calculations.
International standards for credit risk management, as stated in the Principles for Financial Market Infrastructures, require a CCP that is involved in activities with a more complex risk profile or that is systemically important in multiple jurisdictions to meet a “cover 2” requirement (see BIS-IOSCO, 2012). This means the CCP must maintain additional financial resources sufficient to cover defaults by two participants, including affiliates, that combined would cause the largest aggregate credit losses to the CCP under extreme, but plausible stress scenarios. Consistent with the approach taken by regulators around the world, the CFTC interprets the international standard as applying to credit derivatives CCPs under its jurisdiction, and the SEC inter-prets the international standard as applying to security-based swaps CCPs under its jurisdiction. Accordingly, the CCPs currently clearing these products, CME Clearing and ICE Clear Credit, are required to meet the cover 2 standard. The other three designated U.S. CCPs must only adhere to a cover 1 requirement.
International standards also call for a CCP to hold suffi-cient net liquid assets funded by equity to cover potential general business losses so that it can continue operations and services as a going concern if those losses materialize. This business risk requirement provides an additional layer of protection against the potential risk of a CCP suddenly ceasing operations. The SEC has proposed a rule that would require CCPs to maintain net liquid assets funded by equity equal to the greater of six months’ operating expenses or an amount set by a CCP’s board of directors to facilitate an orderly recovery or wind down of critical services (see SEC, 2014b). Under the CFTC’s final rule requiring designated CCPs to prepare recovery and wind-down plans, these CCPs must maintain sufficient unencumbered liquid assets to implement these plans. The CFTC rules did not include a minimum quantitative requirement. Additionally, in limited circumstances, the CFTC rule allows CCPs to use lines of
credit to meet potential liquidity needs and cover losses (see CFTC, 2013a).
Supervisors require CCPs to conduct stress tests to eval-uate the adequacy of CCPs’ financial resources. There is an ongoing international dialogue to determine the degree to which such testing should be standardized. Standardization could address potential market participant concerns about inconsistencies across CCPs, but could also fail to account for diversity across CCP products and services that could affect the best approach for a particular CCP. The Committee on Payments and Market Infrastructures and the International Organization of Securities Commissions began a review of CCP stress testing in March to see how the relevant standards are being implemented and whether additional guidance is needed (see CPMI-IOSCO, 2015a).
Another area of heightened focus is CCP recovery and reso-lution. The CFTC rule requires, and the SEC proposed rule would require, CCPs to develop and maintain recovery and orderly wind-down plans to ensure they continue providing critical services to market participants in the event of an uncovered credit loss, liquidity shortfall, capital inadequacy, or other business, operational, or structural weakness. Federal Reserve Board Governor Daniel Tarullo said in January that the typical CCP recovery strategy does not take a systemwide perspective and is premised on imposing losses on, or drawing liquidity from, large CCP members that may be systemically important and experiencing significant losses during a period of systemic stress (see Tarullo, 2015). Also, the FSOC has observed that, over the short term, it can be impractical for one CCP to transfer critical services to another. For example, CME Clearing clears most U.S. futures, options on futures, and commodity options, while Fixed Income Clearing Corp. is the only CCP for cash-settled U.S. Treasury and agency securities (see Central Counterparty Links to Other Systemically Important Companies).

2015 OFR Financial Stability Report56
Central Counterparty Links to Other Systemically Important Companies
Asset Management
The OFR’s 2013 study, Asset Management and Financial Stability, proposed an activities-based approach to examine potential risks posed by funds, products, and business models in the asset management industry (see OFR, 2013). Key activities undertaken by some asset managers that were identified as potentially presenting risks included the reinvestment of cash collateral in securities lending transac-tions, the use of leverage through derivatives and borrowing, activities in separately managed accounts, and redemption risks in funds investing in less liquid assets. The activities of private funds also may pose financial stability risks, as dis-cussed in Leverage, Borrowing, and Derivatives Activities of the 50 Largest Hedge Funds (see Chapter 2).
Following a request for public comment in December 2014, the FSOC is currently evaluating potential financial stability risks in asset management products and activities. The anal-ysis focuses on six categories: liquidity and redemption risk, leverage, securities lending, data and disclosure, operational risks of service provider concentrations, and resolvability and transition planning. The FSOC’s evaluation is intended to identify and assess the materiality of potential risks to finan-cial stability and the extent to which existing or proposed regulations, where applicable, address the identified risks and whether there are financial stability risks that have not been addressed. Separately, the Financial Stability Board decided in July 2015 to delay finalization of its assessment method-ology for nonbank, noninsurer global systemically important financial institutions pending the outcome of its analysis
The Financial Stability Oversight Council (FSOC) has designated five systemically important central coun-terparties (CCPs): CME Clearing, the Fixed Income Clearing Corp., ICE Clear Credit, the National Securities Clearing Corp., and the Options Clearing Corp. Some of the five have direct links with each other, and all five are interconnected with global systemically important banks (see FSOC, 2015b).
Cross-margining and cross-guarantee relationships exist among CME Clearing, Options Clearing Corp., and Fixed Income Clearing Corp. These three CCPs also have such relationships with foreign CCPs and with CCPs not desig-nated as systemically important.
CCPs also have links to global systemically important banks (G-SIBs) that serve as settlement banks and fund deposi-tories for CCPs and their members. The failure of a CCP’s settlement bank could potentially lead to a CCP default. All U.S. G-SIBs are clearing members of multiple CCPs (see Figure 3-11). Default by a G-SIB could strain multiple CCPs simultaneously in ways that an individual CCP’s stress testing scenarios may fail to capture.
Figure 3-11. Links Among Designated U.S. Central Counterparties and U.S. G-SIBsContagion risks may not be adequately captured in individual CCP stress tests
1
2
3
4
5
Ci�groupInc.
Goldman Sachs Group, Inc.
State Street Corp.
WellsFargo & Co.
Bank ofAmerica
Corp.
JPMorganChase & Co.
MorganStanley
Bank ofNew York
Mellon Corp.
Op�ons Clearing Corp.ICE Clear US, Inc.CME ClearingNa�onal Securi�es Clearing Corp.Fixed Income Clearing Corp.
1
2
3
4
5
Central Counterpar�es
Sources: Membership data from individual CCP websites, OFR analysis
Evaluating Financial Stability Policies 57
of potential financial stability risks from asset management activities.
Over the course of 2015, the SEC proposed several major new rules focused on registered investment companies and registered investment advisers. These proposed rules may help to address some components of the risky activities cited in the OFR’s 2013 study and strengthen disclosure around other areas of perceived risk (see Chapter 4). The SEC also plans rule proposals concerning derivatives use in registered investment companies, transition planning, and stress testing.
In September, the SEC proposed a liquidity rule for open-ended mutual funds and ETFs (see SEC, 2015c). Under the rule, funds would be required to establish and maintain liquidity risk management programs, including a catego-rization of assets by the time required to convert positions into cash and establishment of minimum holdings of liquid assets. Each fund’s liquidity risk management program would be subject to fund board review and approval. The rule would also permit mutual funds to use swing pricing when calculating net asset values, allowing funds to account for market impact costs and trading costs when computing end-of-day portfolio values in order to pass those costs on to the purchasing and redeeming shareholders. The proposed rule would make it easier for investors and regulators to evaluate mutual funds’ and ETFs’ liquidity practices and draw more meaningful conclusions about the liquid assets available to meet mutual fund redemptions.
Funds would be required under the rule to categorize portfolio assets by the length of time needed to convert them to cash and report asset holdings monthly on the new Form N-PORT. A fund would be required to determine a minimum percentage of net assets that must be held in cash and assets that are convertible to cash within three busi-ness days to meet expected immediate liquidity needs on a non-stressed basis. Existing guidelines under the Investment Company Act of 1940 require funds to maintain at least 85 percent of their assets (95 percent for money market funds) in securities that can be sold within seven days at or near the carrying value of the asset, but funds are not required to report their categorization of liquid and illiquid assets (except for money market funds that report whether the asset is illiquid on Form N-MFP) (see U.S. Congress, 1940). Increased reporting would improve visibility into the practices of funds that hold less liquid assets, such as bank loans, emerging market debt, certain corporate bonds, and catastrophe bonds.
It is important to consider the ways liquidity can dry up during periods of market stress. Bank lines of credit may not be available when needed and custodian banks may not have capacity to extend overdraft credit to meet redemp-tion demands for pending securities settlement. A further, continuing challenge is to coordinate rulemaking so asset managers with similar business practices operating under different regulatory regimes are subject to comparable regu-latory rules, recognizing that asset managers are regulated by various federal and state authorities.
Housing GSEs
The FHFA, in its role as conservator of the Federal National Mortgage Association (Fannie Mae) and the Federal Home Loan Mortgage Corporation (Freddie Mac), has pushed them to reduce the risk they pose to taxpayers by offering credit risk-sharing deals to private investors and functioning more like mortgage market utilities.
These credit risk-sharing deals have attracted significant interest in part because they give secondary-market investors a way to take mortgage credit risk with minimal exposure to agency problems — where parties in the securitization chain are not necessarily motivated to act in the best interest of the investor. As discussed below, our analysis of the data suggests that these deals do help solve incentive problems.
Risk-sharing by Fannie Mae and Freddie Mac is a relatively low-cost solution to the principal-agent problems that have stifled a revival of the private-label mortgage-backed securities (MBS) market. The GSEs’ credit risk transfer deals are noteworthy because they expose investors to GSE default risk and indicate how private housing finance remains crip-pled since the crisis.
The credit risk transfer deals are GSE debt offerings linked to the credit performance of a specified pool of 30-year fixed-rate agency mortgages. The GSEs retain at least 5 percent of the pools. Due to their special position in the housing market, the GSEs are able to minimize their expo-sure to incentive problems in origination and servicing. In particular, servicing is dynamically controlled, and infor-mation asymmetries about loan quality are remedied by putback clauses that force loan originators to repurchase loans with underwriting defects.
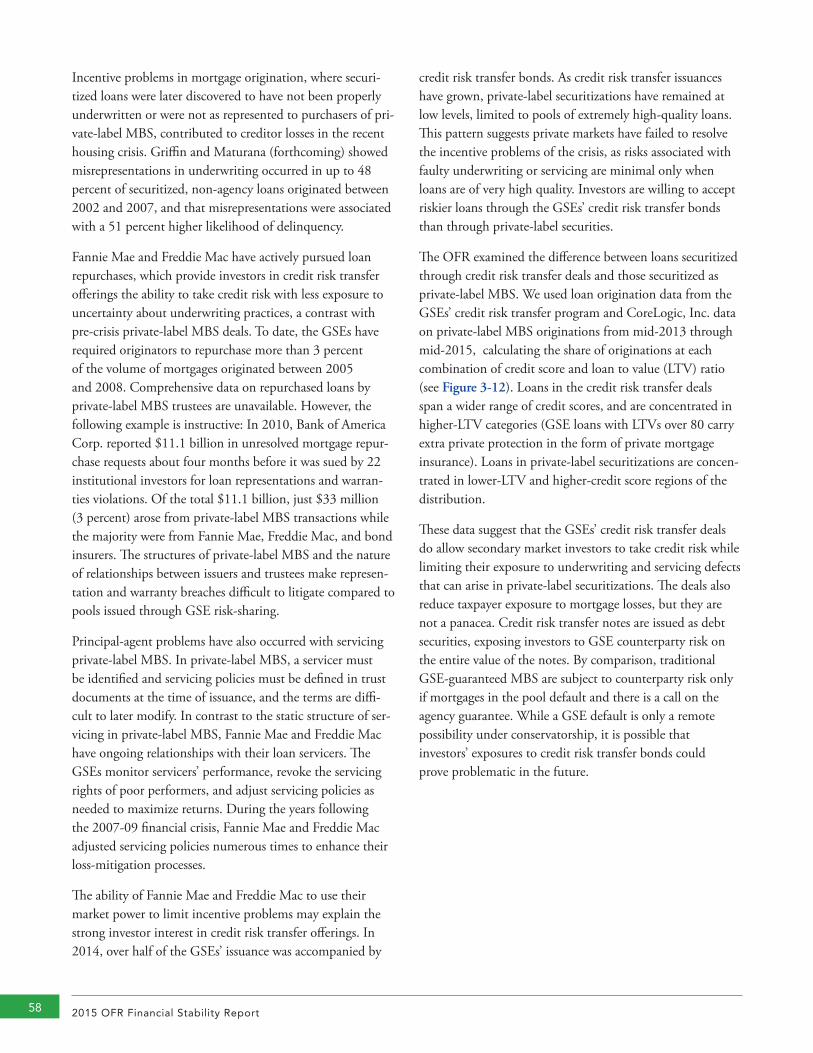
2015 OFR Financial Stability Report58
Incentive problems in mortgage origination, where securi-tized loans were later discovered to have not been properly underwritten or were not as represented to purchasers of pri-vate-label MBS, contributed to creditor losses in the recent housing crisis. Griffin and Maturana (forthcoming) showed misrepresentations in underwriting occurred in up to 48 percent of securitized, non-agency loans originated between 2002 and 2007, and that misrepresentations were associated with a 51 percent higher likelihood of delinquency.
Fannie Mae and Freddie Mac have actively pursued loan repurchases, which provide investors in credit risk transfer offerings the ability to take credit risk with less exposure to uncertainty about underwriting practices, a contrast with pre-crisis private-label MBS deals. To date, the GSEs have required originators to repurchase more than 3 percent of the volume of mortgages originated between 2005 and 2008. Comprehensive data on repurchased loans by private-label MBS trustees are unavailable. However, the following example is instructive: In 2010, Bank of America Corp. reported $11.1 billion in unresolved mortgage repur-chase requests about four months before it was sued by 22 institutional investors for loan representations and warran-ties violations. Of the total $11.1 billion, just $33 million (3 percent) arose from private-label MBS transactions while the majority were from Fannie Mae, Freddie Mac, and bond insurers. The structures of private-label MBS and the nature of relationships between issuers and trustees make represen-tation and warranty breaches difficult to litigate compared to pools issued through GSE risk-sharing.
Principal-agent problems have also occurred with servicing private-label MBS. In private-label MBS, a servicer must be identified and servicing policies must be defined in trust documents at the time of issuance, and the terms are diffi-cult to later modify. In contrast to the static structure of ser-vicing in private-label MBS, Fannie Mae and Freddie Mac have ongoing relationships with their loan servicers. The GSEs monitor servicers’ performance, revoke the servicing rights of poor performers, and adjust servicing policies as needed to maximize returns. During the years following the 2007-09 financial crisis, Fannie Mae and Freddie Mac adjusted servicing policies numerous times to enhance their loss-mitigation processes.
The ability of Fannie Mae and Freddie Mac to use their market power to limit incentive problems may explain the strong investor interest in credit risk transfer offerings. In 2014, over half of the GSEs’ issuance was accompanied by
credit risk transfer bonds. As credit risk transfer issuances have grown, private-label securitizations have remained at low levels, limited to pools of extremely high-quality loans. This pattern suggests private markets have failed to resolve the incentive problems of the crisis, as risks associated with faulty underwriting or servicing are minimal only when loans are of very high quality. Investors are willing to accept riskier loans through the GSEs’ credit risk transfer bonds than through private-label securities.
The OFR examined the difference between loans securitized through credit risk transfer deals and those securitized as private-label MBS. We used loan origination data from the GSEs’ credit risk transfer program and CoreLogic, Inc. data on private-label MBS originations from mid-2013 through mid-2015, calculating the share of originations at each combination of credit score and loan to value (LTV) ratio (see Figure 3-12). Loans in the credit risk transfer deals span a wider range of credit scores, and are concentrated in higher-LTV categories (GSE loans with LTVs over 80 carry extra private protection in the form of private mortgage insurance). Loans in private-label securitizations are concen-trated in lower-LTV and higher-credit score regions of the distribution.
These data suggest that the GSEs’ credit risk transfer deals do allow secondary market investors to take credit risk while limiting their exposure to underwriting and servicing defects that can arise in private-label securitizations. The deals also reduce taxpayer exposure to mortgage losses, but they are not a panacea. Credit risk transfer notes are issued as debt securities, exposing investors to GSE counterparty risk on the entire value of the notes. By comparison, traditional GSE-guaranteed MBS are subject to counterparty risk only if mortgages in the pool default and there is a call on the agency guarantee. While a GSE default is only a remote possibility under conservatorship, it is possible that investors’ exposures to credit risk transfer bonds could prove problematic in the future.
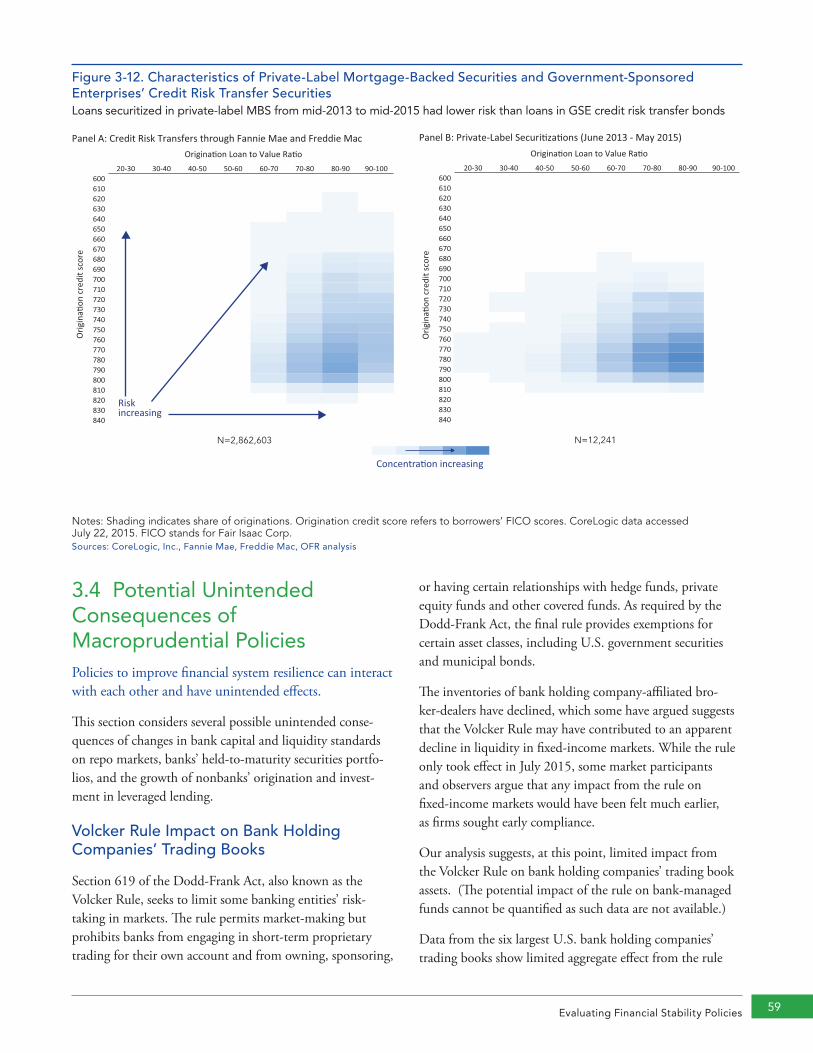
Evaluating Financial Stability Policies 59
Figure 3-12. Characteristics of Private-Label Mortgage-Backed Securities and Government-Sponsored Enterprises’ Credit Risk Transfer SecuritiesLoans securitized in private-label MBS from mid-2013 to mid-2015 had lower risk than loans in GSE credit risk transfer bonds
Panel B: Private-Label Securi za ons (June 2013 - May 2015)Origina on Loan to Value Ra o
Orig
ina
on c
redi
t sco
re
20-30 30-40 40-50 50-60 60-70 70-80 80-90 90-100600610620630640650660670680690700710720730740750760770780790800810820830840
Origina on Loan to Value Ra o
Orig
ina
on c
redi
t sco
re
20-30 30-40 40-50 50-60 60-70 70-80 80-90 90-100600610620630640650660670680690700710720730740750760770780790800810820830840
Panel A: Credit Risk Transfers through Fannie Mae and Freddie Mac
Risk increasing
Concentra on increasing
Notes: Shading indicates share of originations. Origination credit score refers to borrowers’ FICO scores. CoreLogic data accessed July 22, 2015. FICO stands for Fair Isaac Corp.Sources: CoreLogic, Inc., Fannie Mae, Freddie Mac, OFR analysis
3.4 Potential Unintended Consequences of Macroprudential Policies Policies to improve financial system resilience can interact with each other and have unintended effects.
This section considers several possible unintended conse-quences of changes in bank capital and liquidity standards on repo markets, banks’ held-to-maturity securities portfo-lios, and the growth of nonbanks’ origination and invest-ment in leveraged lending.
Volcker Rule Impact on Bank Holding Companies’ Trading Books
Section 619 of the Dodd-Frank Act, also known as the Volcker Rule, seeks to limit some banking entities’ risk-taking in markets. The rule permits market-making but prohibits banks from engaging in short-term proprietary trading for their own account and from owning, sponsoring,
or having certain relationships with hedge funds, private equity funds and other covered funds. As required by the Dodd-Frank Act, the final rule provides exemptions for certain asset classes, including U.S. government securities and municipal bonds.
The inventories of bank holding company-affiliated bro-ker-dealers have declined, which some have argued suggests that the Volcker Rule may have contributed to an apparent decline in liquidity in fixed-income markets. While the rule only took effect in July 2015, some market participants and observers argue that any impact from the rule on fixed-income markets would have been felt much earlier, as firms sought early compliance.
Our analysis suggests, at this point, limited impact from the Volcker Rule on bank holding companies’ trading book assets. (The potential impact of the rule on bank-managed funds cannot be quantified as such data are not available.)
Data from the six largest U.S. bank holding companies’ trading books show limited aggregate effect from the rule
N=2,862,603 N=12,241
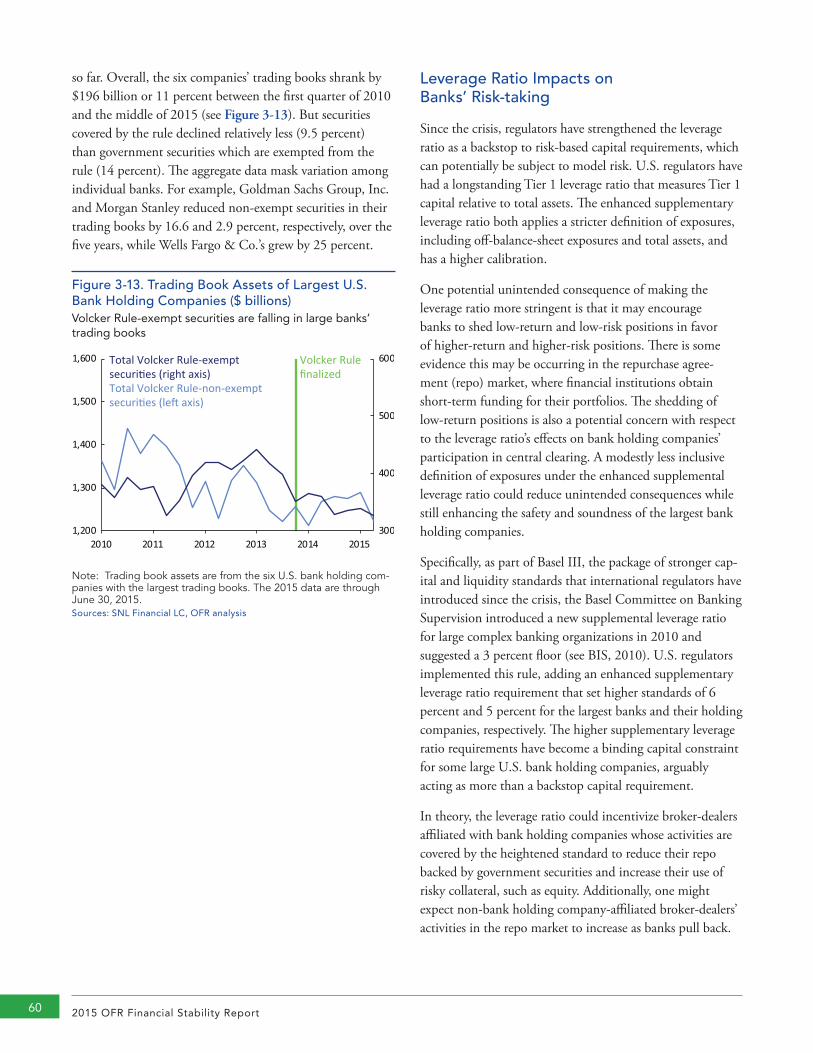
2015 OFR Financial Stability Report60
so far. Overall, the six companies’ trading books shrank by $196 billion or 11 percent between the first quarter of 2010 and the middle of 2015 (see Figure 3-13). But securities covered by the rule declined relatively less (9.5 percent) than government securities which are exempted from the rule (14 percent). The aggregate data mask variation among individual banks. For example, Goldman Sachs Group, Inc. and Morgan Stanley reduced non-exempt securities in their trading books by 16.6 and 2.9 percent, respectively, over the five years, while Wells Fargo & Co.’s grew by 25 percent.
Figure 3-13. Trading Book Assets of Largest U.S. Bank Holding Companies ($ billions)Volcker Rule-exempt securities are falling in large banks’ trading books
Volcker Rulefinalized
Total Volcker Rule-exempt securi�es (right axis)Total Volcker Rule-non-exempt securi�es (le� axis)
300
400
500
600
2010 2011 2012 2013 2014 20151,200
1,300
1,400
1,500
1,600
Note: Trading book assets are from the six U.S. bank holding com-panies with the largest trading books. The 2015 data are through June 30, 2015.Sources: SNL Financial LC, OFR analysis
Leverage Ratio Impacts on Banks’ Risk-taking
Since the crisis, regulators have strengthened the leverage ratio as a backstop to risk-based capital requirements, which can potentially be subject to model risk. U.S. regulators have had a longstanding Tier 1 leverage ratio that measures Tier 1 capital relative to total assets. The enhanced supplementary leverage ratio both applies a stricter definition of exposures, including off-balance-sheet exposures and total assets, and has a higher calibration.
One potential unintended consequence of making the leverage ratio more stringent is that it may encourage banks to shed low-return and low-risk positions in favor of higher-return and higher-risk positions. There is some evidence this may be occurring in the repurchase agree-ment (repo) market, where financial institutions obtain short-term funding for their portfolios. The shedding of low-return positions is also a potential concern with respect to the leverage ratio’s effects on bank holding companies’ participation in central clearing. A modestly less inclusive definition of exposures under the enhanced supplemental leverage ratio could reduce unintended consequences while still enhancing the safety and soundness of the largest bank holding companies.
Specifically, as part of Basel III, the package of stronger cap-ital and liquidity standards that international regulators have introduced since the crisis, the Basel Committee on Banking Supervision introduced a new supplemental leverage ratio for large complex banking organizations in 2010 and suggested a 3 percent floor (see BIS, 2010). U.S. regulators implemented this rule, adding an enhanced supplementary leverage ratio requirement that set higher standards of 6 percent and 5 percent for the largest banks and their holding companies, respectively. The higher supplementary leverage ratio requirements have become a binding capital constraint for some large U.S. bank holding companies, arguably acting as more than a backstop capital requirement.
In theory, the leverage ratio could incentivize broker-dealers affiliated with bank holding companies whose activities are covered by the heightened standard to reduce their repo backed by government securities and increase their use of risky collateral, such as equity. Additionally, one might expect non-bank holding company-affiliated broker-dealers’ activities in the repo market to increase as banks pull back.
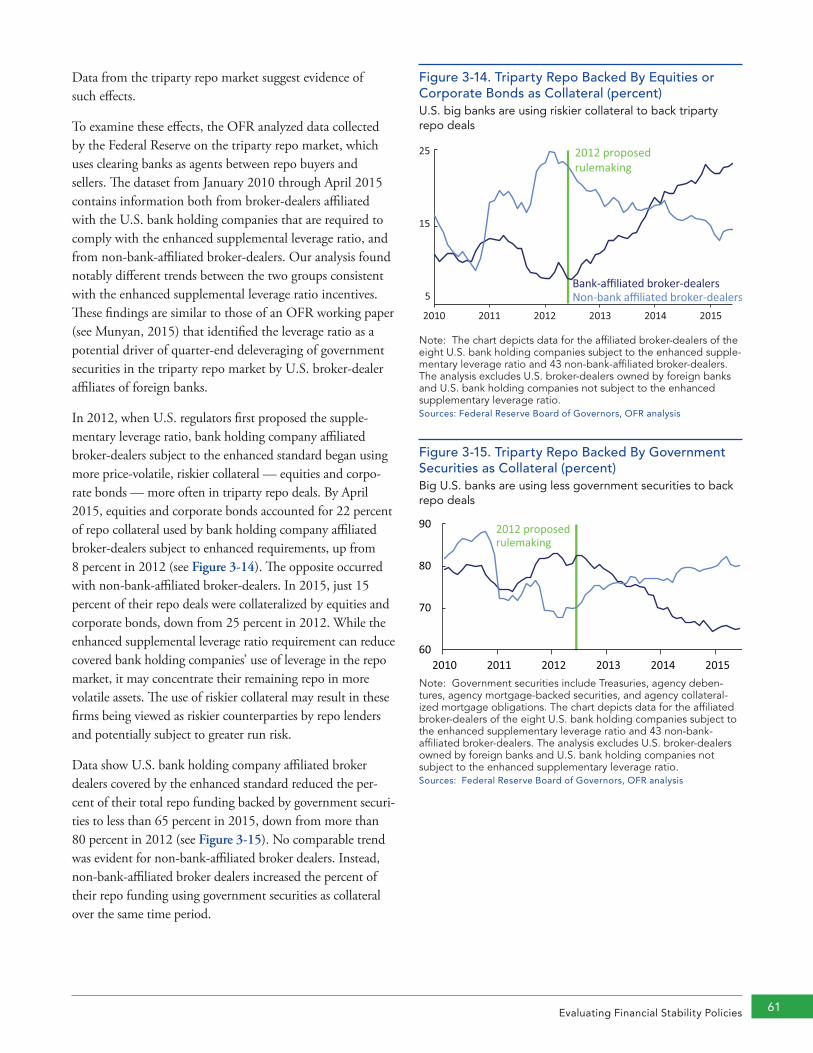
Evaluating Financial Stability Policies 61
Data from the triparty repo market suggest evidence of such effects.
To examine these effects, the OFR analyzed data collected by the Federal Reserve on the triparty repo market, which uses clearing banks as agents between repo buyers and sellers. The dataset from January 2010 through April 2015 contains information both from broker-dealers affiliated with the U.S. bank holding companies that are required to comply with the enhanced supplemental leverage ratio, and from non-bank-affiliated broker-dealers. Our analysis found notably different trends between the two groups consistent with the enhanced supplemental leverage ratio incentives. These findings are similar to those of an OFR working paper (see Munyan, 2015) that identified the leverage ratio as a potential driver of quarter-end deleveraging of government securities in the triparty repo market by U.S. broker-dealer affiliates of foreign banks.
In 2012, when U.S. regulators first proposed the supple-mentary leverage ratio, bank holding company affiliated broker-dealers subject to the enhanced standard began using more price-volatile, riskier collateral — equities and corpo-rate bonds — more often in triparty repo deals. By April 2015, equities and corporate bonds accounted for 22 percent of repo collateral used by bank holding company affiliated broker-dealers subject to enhanced requirements, up from 8 percent in 2012 (see Figure 3-14). The opposite occurred with non-bank-affiliated broker-dealers. In 2015, just 15 percent of their repo deals were collateralized by equities and corporate bonds, down from 25 percent in 2012. While the enhanced supplemental leverage ratio requirement can reduce covered bank holding companies’ use of leverage in the repo market, it may concentrate their remaining repo in more volatile assets. The use of riskier collateral may result in these firms being viewed as riskier counterparties by repo lenders and potentially subject to greater run risk.
Data show U.S. bank holding company affiliated broker dealers covered by the enhanced standard reduced the per-cent of their total repo funding backed by government securi-ties to less than 65 percent in 2015, down from more than 80 percent in 2012 (see Figure 3-15). No comparable trend was evident for non-bank-affiliated broker dealers. Instead, non-bank-affiliated broker dealers increased the percent of their repo funding using government securities as collateral over the same time period.
Figure 3-14. Triparty Repo Backed By Equities or Corporate Bonds as Collateral (percent)U.S. big banks are using riskier collateral to back triparty repo deals
5
15
25
2010 2011 2012 2013 2014 2015
2012 proposed rulemaking
Bank-affiliated broker-dealersNon-bank affiliated broker-dealers
Note: The chart depicts data for the affiliated broker-dealers of the eight U.S. bank holding companies subject to the enhanced supple-mentary leverage ratio and 43 non-bank-affiliated broker-dealers. The analysis excludes U.S. broker-dealers owned by foreign banks and U.S. bank holding companies not subject to the enhanced supplementary leverage ratio. Sources: Federal Reserve Board of Governors, OFR analysis
Figure 3-15. Triparty Repo Backed By Government Securities as Collateral (percent)Big U.S. banks are using less government securities to back repo deals
60
70
80
90
2010 2011 2012 2013 2014 2015
2012 proposed rulemaking
Note: Government securities include Treasuries, agency deben-tures, agency mortgage-backed securities, and agency collateral-ized mortgage obligations. The chart depicts data for the affiliated broker-dealers of the eight U.S. bank holding companies subject to the enhanced supplementary leverage ratio and 43 non-bank- affiliated broker-dealers. The analysis excludes U.S. broker-dealers owned by foreign banks and U.S. bank holding companies not subject to the enhanced supplementary leverage ratio. Sources: Federal Reserve Board of Governors, OFR analysis
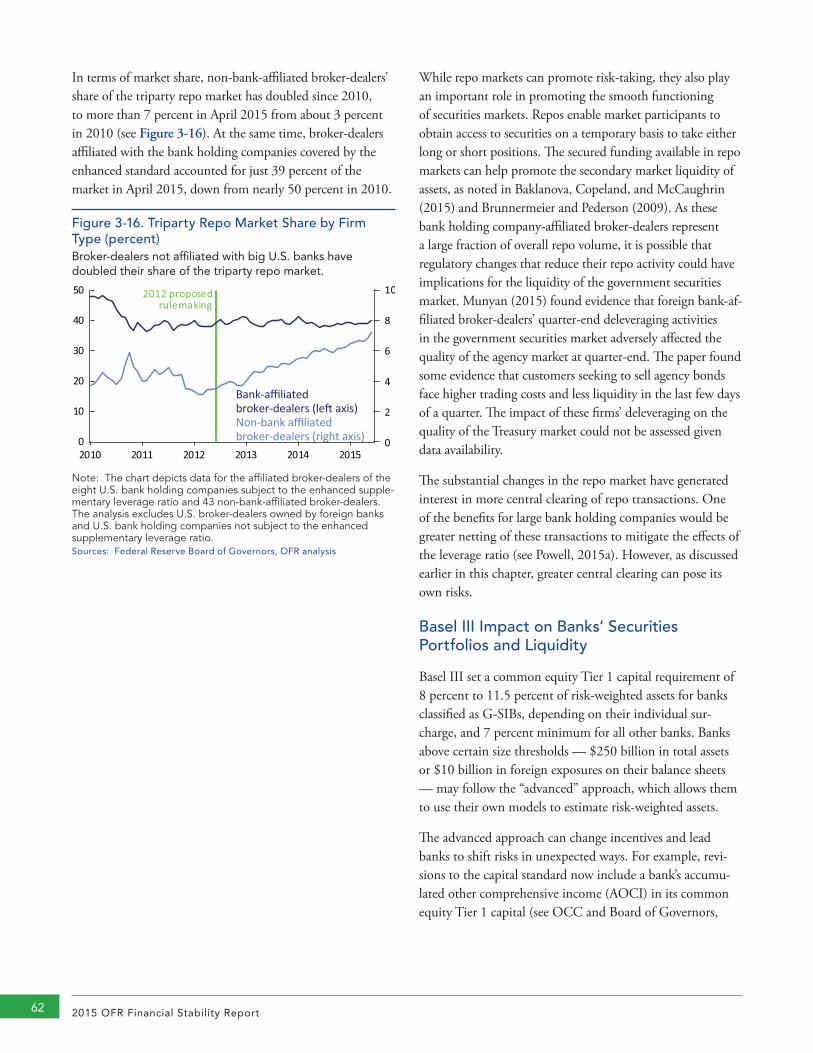
2015 OFR Financial Stability Report62
In terms of market share, non-bank-affiliated broker-dealers’ share of the triparty repo market has doubled since 2010, to more than 7 percent in April 2015 from about 3 percent in 2010 (see Figure 3-16). At the same time, broker-dealers affiliated with the bank holding companies covered by the enhanced standard accounted for just 39 percent of the market in April 2015, down from nearly 50 percent in 2010.
Figure 3-16. Triparty Repo Market Share by Firm Type (percent)Broker-dealers not affiliated with big U.S. banks have doubled their share of the triparty repo market.
Bank-affiliatedbroker-dealers (le� axis)Non-bank affiliatedbroker-dealers (right axis) 0
2
4
6
8
10
0
10
20
30
40
50
2010 2011 2012 2013 2014 2015
2012 proposedrulemaking
Note: The chart depicts data for the affiliated broker-dealers of the eight U.S. bank holding companies subject to the enhanced supple-mentary leverage ratio and 43 non-bank-affiliated broker-dealers. The analysis excludes U.S. broker-dealers owned by foreign banks and U.S. bank holding companies not subject to the enhanced supplementary leverage ratio. Sources: Federal Reserve Board of Governors, OFR analysis
While repo markets can promote risk-taking, they also play an important role in promoting the smooth functioning of securities markets. Repos enable market participants to obtain access to securities on a temporary basis to take either long or short positions. The secured funding available in repo markets can help promote the secondary market liquidity of assets, as noted in Baklanova, Copeland, and McCaughrin (2015) and Brunnermeier and Pederson (2009). As these bank holding company-affiliated broker-dealers represent a large fraction of overall repo volume, it is possible that regulatory changes that reduce their repo activity could have implications for the liquidity of the government securities market. Munyan (2015) found evidence that foreign bank-af-filiated broker-dealers’ quarter-end deleveraging activities in the government securities market adversely affected the quality of the agency market at quarter-end. The paper found some evidence that customers seeking to sell agency bonds face higher trading costs and less liquidity in the last few days of a quarter. The impact of these firms’ deleveraging on the quality of the Treasury market could not be assessed given data availability.
The substantial changes in the repo market have generated interest in more central clearing of repo transactions. One of the benefits for large bank holding companies would be greater netting of these transactions to mitigate the effects of the leverage ratio (see Powell, 2015a). However, as discussed earlier in this chapter, greater central clearing can pose its own risks.
Basel III Impact on Banks’ Securities Portfolios and Liquidity
Basel III set a common equity Tier 1 capital requirement of 8 percent to 11.5 percent of risk-weighted assets for banks classified as G-SIBs, depending on their individual sur-charge, and 7 percent minimum for all other banks. Banks above certain size thresholds — $250 billion in total assets or $10 billion in foreign exposures on their balance sheets — may follow the “advanced” approach, which allows them to use their own models to estimate risk-weighted assets.
The advanced approach can change incentives and lead banks to shift risks in unexpected ways. For example, revi-sions to the capital standard now include a bank’s accumu-lated other comprehensive income (AOCI) in its common equity Tier 1 capital (see OCC and Board of Governors,
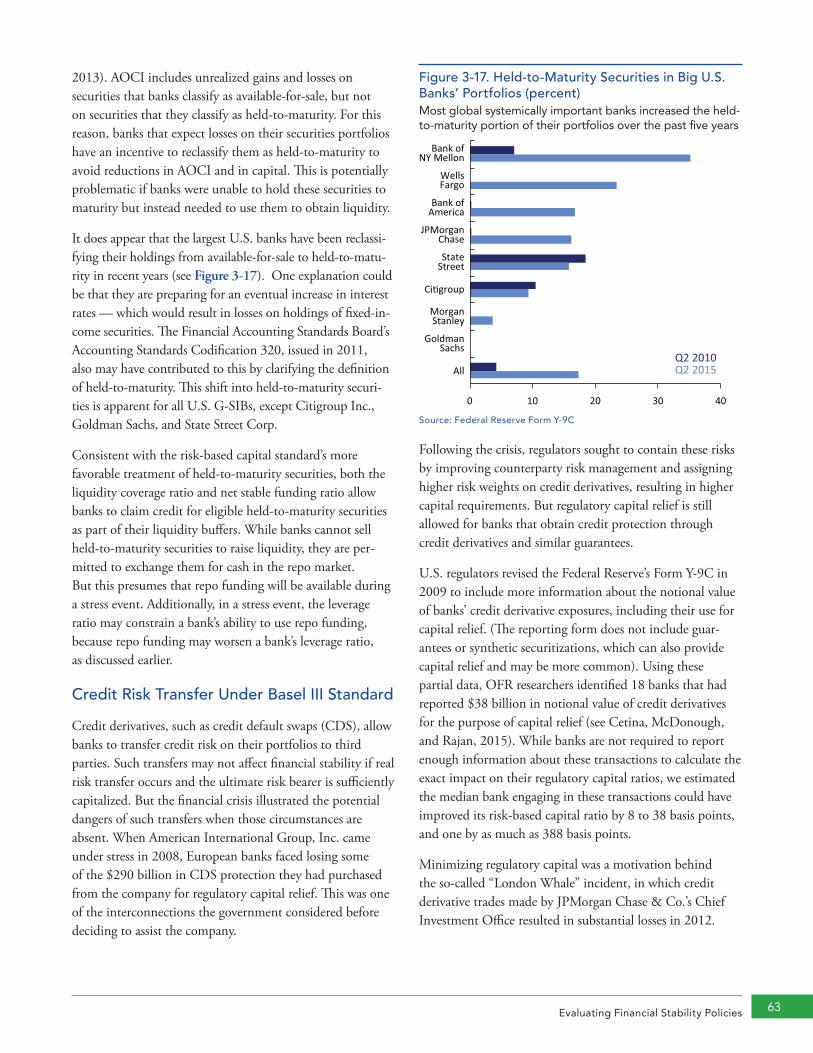
Evaluating Financial Stability Policies 63
2013). AOCI includes unrealized gains and losses on securities that banks classify as available-for-sale, but not on securities that they classify as held-to-maturity. For this reason, banks that expect losses on their securities portfolios have an incentive to reclassify them as held-to-maturity to avoid reductions in AOCI and in capital. This is potentially problematic if banks were unable to hold these securities to maturity but instead needed to use them to obtain liquidity.
It does appear that the largest U.S. banks have been reclassi-fying their holdings from available-for-sale to held-to-matu-rity in recent years (see Figure 3-17). One explanation could be that they are preparing for an eventual increase in interest rates — which would result in losses on holdings of fixed-in-come securities. The Financial Accounting Standards Board’s Accounting Standards Codification 320, issued in 2011, also may have contributed to this by clarifying the definition of held-to-maturity. This shift into held-to-maturity securi-ties is apparent for all U.S. G-SIBs, except Citigroup Inc., Goldman Sachs, and State Street Corp.
Consistent with the risk-based capital standard’s more favorable treatment of held-to-maturity securities, both the liquidity coverage ratio and net stable funding ratio allow banks to claim credit for eligible held-to-maturity securities as part of their liquidity buffers. While banks cannot sell held-to-maturity securities to raise liquidity, they are per-mitted to exchange them for cash in the repo market. But this presumes that repo funding will be available during a stress event. Additionally, in a stress event, the leverage ratio may constrain a bank’s ability to use repo funding, because repo funding may worsen a bank’s leverage ratio, as discussed earlier.
Credit Risk Transfer Under Basel III Standard
Credit derivatives, such as credit default swaps (CDS), allow banks to transfer credit risk on their portfolios to third parties. Such transfers may not affect financial stability if real risk transfer occurs and the ultimate risk bearer is sufficiently capitalized. But the financial crisis illustrated the potential dangers of such transfers when those circumstances are absent. When American International Group, Inc. came under stress in 2008, European banks faced losing some of the $290 billion in CDS protection they had purchased from the company for regulatory capital relief. This was one of the interconnections the government considered before deciding to assist the company.
Figure 3-17. Held-to-Maturity Securities in Big U.S. Banks’ Portfolios (percent)Most global systemically important banks increased the held-to-maturity portion of their portfolios over the past five years
Q2 2010Q2 2015
0 10 20 30 40
Bank ofNY Mellon
WellsFargo
Bank ofAmerica
JPMorganChase
StateStreet
Ci�group
MorganStanley
GoldmanSachs
All
Source: Federal Reserve Form Y-9C
Following the crisis, regulators sought to contain these risks by improving counterparty risk management and assigning higher risk weights on credit derivatives, resulting in higher capital requirements. But regulatory capital relief is still allowed for banks that obtain credit protection through credit derivatives and similar guarantees.
U.S. regulators revised the Federal Reserve’s Form Y-9C in 2009 to include more information about the notional value of banks’ credit derivative exposures, including their use for capital relief. (The reporting form does not include guar-antees or synthetic securitizations, which can also provide capital relief and may be more common). Using these partial data, OFR researchers identified 18 banks that had reported $38 billion in notional value of credit derivatives for the purpose of capital relief (see Cetina, McDonough, and Rajan, 2015). While banks are not required to report enough information about these transactions to calculate the exact impact on their regulatory capital ratios, we estimated the median bank engaging in these transactions could have improved its risk-based capital ratio by 8 to 38 basis points, and one by as much as 388 basis points.
Minimizing regulatory capital was a motivation behind the so-called “London Whale” incident, in which credit derivative trades made by JPMorgan Chase & Co.’s Chief Investment Office resulted in substantial losses in 2012.
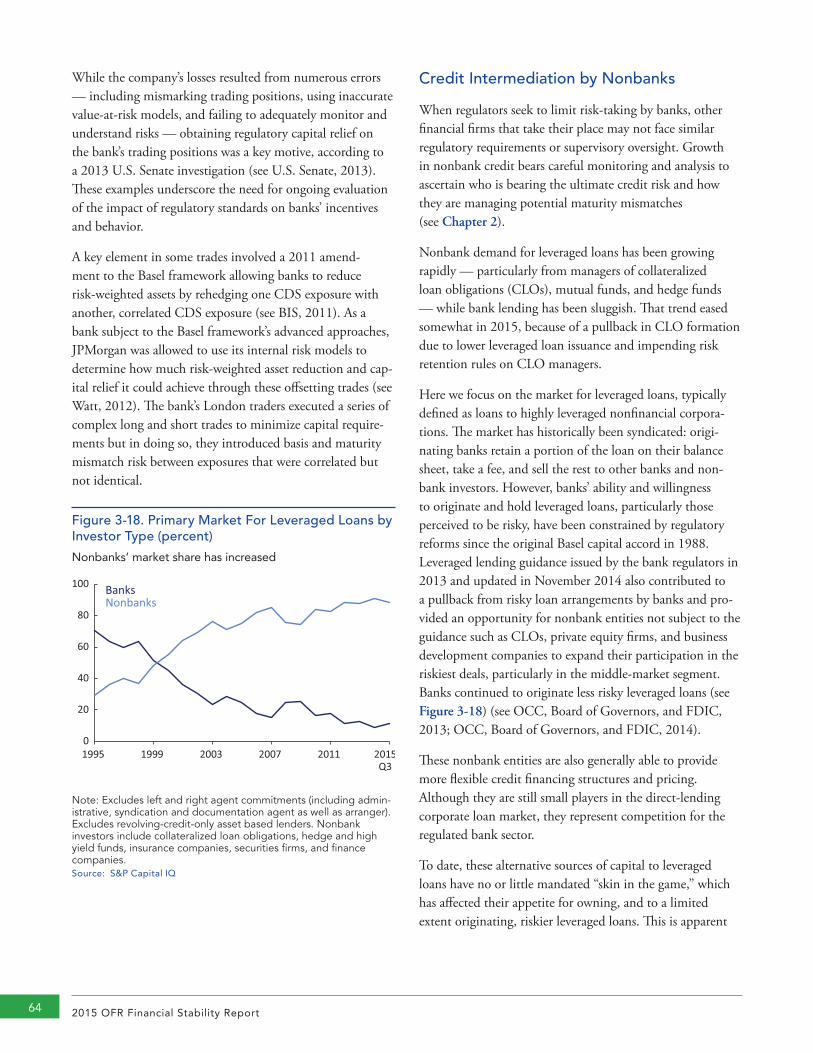
2015 OFR Financial Stability Report64
While the company’s losses resulted from numerous errors — including mismarking trading positions, using inaccurate value-at-risk models, and failing to adequately monitor and understand risks — obtaining regulatory capital relief on the bank’s trading positions was a key motive, according to a 2013 U.S. Senate investigation (see U.S. Senate, 2013). These examples underscore the need for ongoing evaluation of the impact of regulatory standards on banks’ incentives and behavior.
A key element in some trades involved a 2011 amend-ment to the Basel framework allowing banks to reduce risk-weighted assets by rehedging one CDS exposure with another, correlated CDS exposure (see BIS, 2011). As a bank subject to the Basel framework’s advanced approaches, JPMorgan was allowed to use its internal risk models to determine how much risk-weighted asset reduction and cap-ital relief it could achieve through these offsetting trades (see Watt, 2012). The bank’s London traders executed a series of complex long and short trades to minimize capital require-ments but in doing so, they introduced basis and maturity mismatch risk between exposures that were correlated but not identical.
Figure 3-18. Primary Market For Leveraged Loans by Investor Type (percent)
Nonbanks’ market share has increased
1995 1999 2003 2007 2011 2015Q3
0
20
40
60
80
100 BanksNonbanks
Note: Excludes left and right agent commitments (including admin-istrative, syndication and documentation agent as well as arranger). Excludes revolving-credit-only asset based lenders. Nonbank investors include collateralized loan obligations, hedge and high yield funds, insurance companies, securities firms, and finance companies.Source: S&P Capital IQ
Credit Intermediation by Nonbanks
When regulators seek to limit risk-taking by banks, other financial firms that take their place may not face similar regulatory requirements or supervisory oversight. Growth in nonbank credit bears careful monitoring and analysis to ascertain who is bearing the ultimate credit risk and how they are managing potential maturity mismatches (see Chapter 2).
Nonbank demand for leveraged loans has been growing rapidly — particularly from managers of collateralized loan obligations (CLOs), mutual funds, and hedge funds — while bank lending has been sluggish. That trend eased somewhat in 2015, because of a pullback in CLO formation due to lower leveraged loan issuance and impending risk retention rules on CLO managers.
Here we focus on the market for leveraged loans, typically defined as loans to highly leveraged nonfinancial corpora-tions. The market has historically been syndicated: origi-nating banks retain a portion of the loan on their balance sheet, take a fee, and sell the rest to other banks and non-bank investors. However, banks’ ability and willingness to originate and hold leveraged loans, particularly those perceived to be risky, have been constrained by regulatory reforms since the original Basel capital accord in 1988. Leveraged lending guidance issued by the bank regulators in 2013 and updated in November 2014 also contributed to a pullback from risky loan arrangements by banks and pro-vided an opportunity for nonbank entities not subject to the guidance such as CLOs, private equity firms, and business development companies to expand their participation in the riskiest deals, particularly in the middle-market segment. Banks continued to originate less risky leveraged loans (see Figure 3-18) (see OCC, Board of Governors, and FDIC, 2013; OCC, Board of Governors, and FDIC, 2014).
These nonbank entities are also generally able to provide more flexible credit financing structures and pricing. Although they are still small players in the direct-lending corporate loan market, they represent competition for the regulated bank sector.
To date, these alternative sources of capital to leveraged loans have no or little mandated “skin in the game,” which has affected their appetite for owning, and to a limited extent originating, riskier leveraged loans. This is apparent

Evaluating Financial Stability Policies 65
by the resurgence of leveraged loans with fewer restrictions or legal covenants to protect the lender. These so-called cov-enant-lite loans contain incurrence-based rather than main-tenance-based financial covenants, borrower-friendly terms often associated with high-yield bonds. Unlike in traditional bank loans, where financial tests (such as leverage ratios and interest coverage ratios) are typically measured periodically, financial tests for covenant-lite loans are generally reviewed only when a specific event occurs, such as when a borrower issues new debt. While the traditional distinctions generally still exist for term loans, a growing number of loan trans-actions contain events of default and affirmation covenants that are similar to those in bond debentures.
The 2015 Shared National Credits Review (see OCC, 2015), covering bank loan portfolios and underwriting standards, showed nonbanks owned 23 percent ($90 billion) of lending commitments but a much higher 67 percent ($153 billion) of all classified lower-quality credits and 72.8 percent ($39.7 billion) of nonaccrual assets. U.S. banks, by contrast, owned 17.8 percent of classified assets and 2.4 percent of nonaccrual loans. The survey concluded that credit underwriting stan-dards had eased for the fourth consecutive year.
CLOs are among the largest buyers and hold roughly 56 percent of primary leveraged loans. The CLO risk retention rule (see OCC and others, 2014) which goes into effect in December 2016, could be effective in reducing CLO advisors’ demand for riskier leveraged loans by requiring them to maintain some exposure to the fair value of CLO tranches issued. Although the rule could constrain issuance by thinly capitalized asset managers, many large managers are expected to continue to issue CLOs, albeit fewer given the need to retain risk.
Although the issuance of leveraged loans has slowed in 2015, the stock of outstanding levered corporate credit, which includes high-yield debt, remains material. From available data, we estimate this market to be approximately $2.5 tril-lion, but it is difficult to fully determine which parts of the financial sector will be most exposed to a credit shock when the corporate default cycle turns (see Figure 3-19). In addi-tion to credit risk, a turn in the corporate leverage lending cycle could pose liquidity risks. The broker-dealer affiliates of banks that have acted as syndicate leads and underwriters may face reputational or franchise risk in light of investor expectations that they will provide liquidity on high-yield bonds and CLOs.
Figure 3-19. Total Leveraged Debt Outstanding ($ trillion) and as a Percentage of Total Nonfinancial Corporate Obligations Outstanding (percent)
Outstandings reach new highs
0
15
30
45
0.0
0.5
1.0
1.5
2.0
2.5
3.0
1997 2000 2003 2006 2009 2012 2015
First-lien bank debt (le� axis)Second-lien bank debt (le� axis)Senior secured bonds (le� axis)Senior unsecured bonds (le� axis)Subordinated bonds (le� axis)
Leveraged debt as a percent of nonfinancial corporate obliga�ons (right axis)
Note: Does not include loans syndicated mainly to banks. The 2015 data are through September 30, 2015.Sources: S&P Capital IQ, Haver Analytics, OFR analysis

Data Needs for Financial Stability Analysis 67
F inancial data have improved substantially since the crisis, but significant deficiencies remain. This chapter highlights the progress made and
remaining work needed to improve the scope, quality, and accessibility of financial data. We discuss data needs in key markets such as those for securities financing transactions, derivatives, and mortgages, and for activities such as insurance and asset management.
4.1 Addressing Gaps in Scope, Quality, and Accessibility The OFR has a mandate to expand the scope of data available to policymakers and market participants; to develop, promote, and coordinate the use of standards to improve data quality; and to improve data access for key stakeholders. The benefits for stakeholders beyond the regulatory community are significant. Market participants can benefit and costs can be reduced when regulatory reporting requirements are closely aligned with business processes. The public can benefit when policymakers, firms, academia, and others are better able to assess risks across the financial system. All these efforts must be balanced with and accompanied by rigorous safeguards to protect data security.
Financial data must have three attributes to be useful. They must have sufficient scope (comprehensive and granular), they must be of high quality (complete, accurate, and timely), and they must be accessible (shared and secured).
By these criteria, U.S. and overseas policymakers have made significant progress since the crisis. They have introduced new regulatory reporting requirements for banks, insurance companies, hedge funds, and other asset management companies to fill critical gaps in data. They have required the use of standards to improve data quality, comparability, and integration. And they have taken steps to provide access to data for identifying, analyzing, and monitoring threats to financial stability, including engaging with global counterparts.
But there is still much work to do. Global initiatives to expand, improve, and share financial data face four significant challenges. In this chapter we identify the challenges and ways to meet them.
Accurately identifying data gaps is a first challenge. Identification begins by deciding on the most important questions related to potential vulnerabilities, the analytical framework to answer them, and the data needed to quantify that framework. Chapters 2, 3, and 5 of this report highlight key financial stability vulnerabilities, our policy concerns, and ongoing research needs. Answering these types of questions often requires new informa-tion about diverse markets, companies, and instruments. Financial markets and firms’ business models are constantly changing, and new activities often lie outside regulatory reporting requirements. Data that appear fit for the purpose at hand may already exist, but verifying that they are suitable and sufficient is an essential step.
A second challenge is to fill data gaps while minimizing the burden on private companies. The OFR is working with regulatory peers to develop best practices for data collection, including, for example, clear and precise defi-nitions of terms, the use of standards, adequate preparation, and consultation with industry.
In the United States, a third key challenge arises from the large number of financial regulators across functional, institutional, and state borders, which can hinder coordination of systemwide data collection, sharing, and stan-dards. Notwithstanding institutional and legal limitations, it is critical that regulators share data with each other. The FSOC plays an important role in bringing U.S. regulators and policymakers together, and can contribute to
Data Needs for Financial Stability Analysis 4
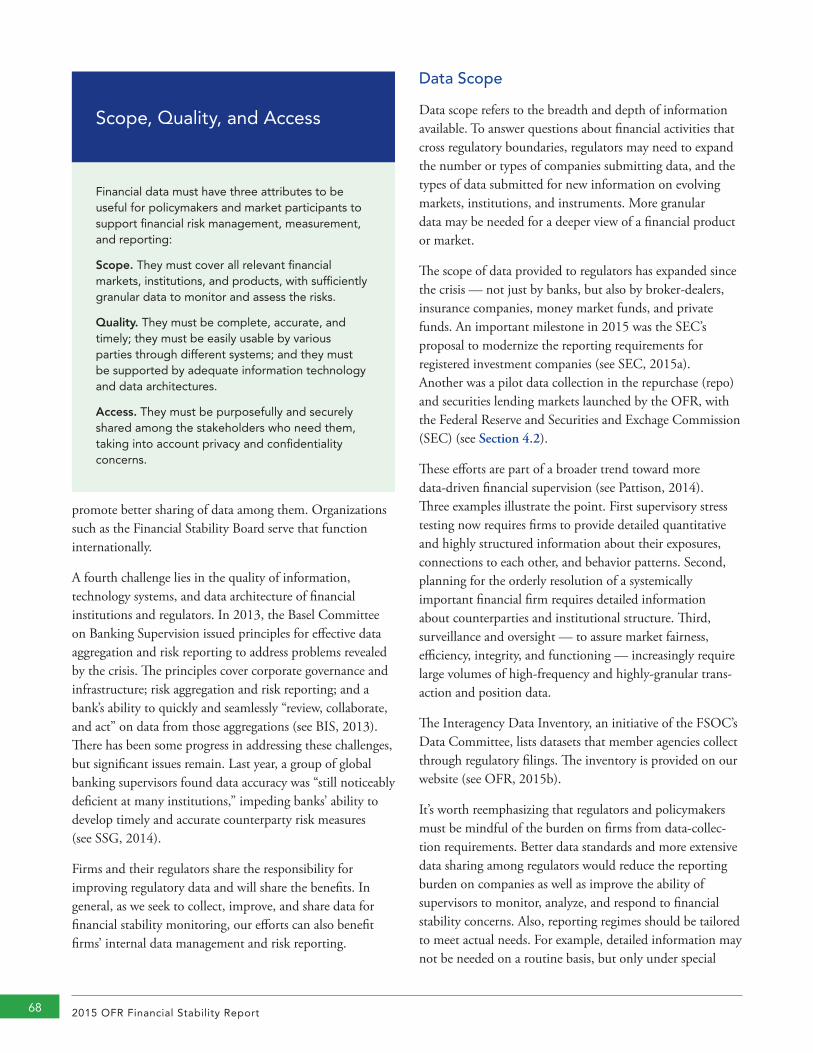
2015 OFR Financial Stability Report68
promote better sharing of data among them. Organizations such as the Financial Stability Board serve that function internationally.
A fourth challenge lies in the quality of information, technology systems, and data architecture of financial institutions and regulators. In 2013, the Basel Committee on Banking Supervision issued principles for effective data aggregation and risk reporting to address problems revealed by the crisis. The principles cover corporate governance and infrastructure; risk aggregation and risk reporting; and a bank’s ability to quickly and seamlessly “review, collaborate, and act” on data from those aggregations (see BIS, 2013). There has been some progress in addressing these challenges, but significant issues remain. Last year, a group of global banking supervisors found data accuracy was “still noticeably deficient at many institutions,” impeding banks’ ability to develop timely and accurate counterparty risk measures (see SSG, 2014).
Firms and their regulators share the responsibility for improving regulatory data and will share the benefits. In general, as we seek to collect, improve, and share data for financial stability monitoring, our efforts can also benefit firms’ internal data management and risk reporting.
Data Scope
Data scope refers to the breadth and depth of information available. To answer questions about financial activities that cross regulatory boundaries, regulators may need to expand the number or types of companies submitting data, and the types of data submitted for new information on evolving markets, institutions, and instruments. More granular data may be needed for a deeper view of a financial product or market.
The scope of data provided to regulators has expanded since the crisis — not just by banks, but also by broker-dealers, insurance companies, money market funds, and private funds. An important milestone in 2015 was the SEC’s proposal to modernize the reporting requirements for registered investment companies (see SEC, 2015a). Another was a pilot data collection in the repurchase (repo) and securities lending markets launched by the OFR, with the Federal Reserve and Securities and Exchage Commission (SEC) (see Section 4.2).
These efforts are part of a broader trend toward more data-driven financial supervision (see Pattison, 2014). Three examples illustrate the point. First supervisory stress testing now requires firms to provide detailed quantitative and highly structured information about their exposures, connections to each other, and behavior patterns. Second, planning for the orderly resolution of a systemically important financial firm requires detailed information about counterparties and institutional structure. Third, surveillance and oversight — to assure market fairness, efficiency, integrity, and functioning — increasingly require large volumes of high-frequency and highly-granular trans-action and position data.
The Interagency Data Inventory, an initiative of the FSOC’s Data Committee, lists datasets that member agencies collect through regulatory filings. The inventory is provided on our website (see OFR, 2015b).
It’s worth reemphasizing that regulators and policymakers must be mindful of the burden on firms from data-collec-tion requirements. Better data standards and more extensive data sharing among regulators would reduce the reporting burden on companies as well as improve the ability of supervisors to monitor, analyze, and respond to financial stability concerns. Also, reporting regimes should be tailored to meet actual needs. For example, detailed information may not be needed on a routine basis, but only under special
Scope, Quality, and Access
Financial data must have three attributes to be useful for policymakers and market participants to support financial risk management, measurement, and reporting:
Scope.They must cover all relevant financial markets, institutions, and products, with sufficiently granular data to monitor and assess the risks.
Quality.They must be complete, accurate, and timely; they must be easily usable by various parties through different systems; and they must be supported by adequate information technology and data architectures.
Access. They must be purposefully and securely shared among the stakeholders who need them, taking into account privacy and confidentiality concerns.
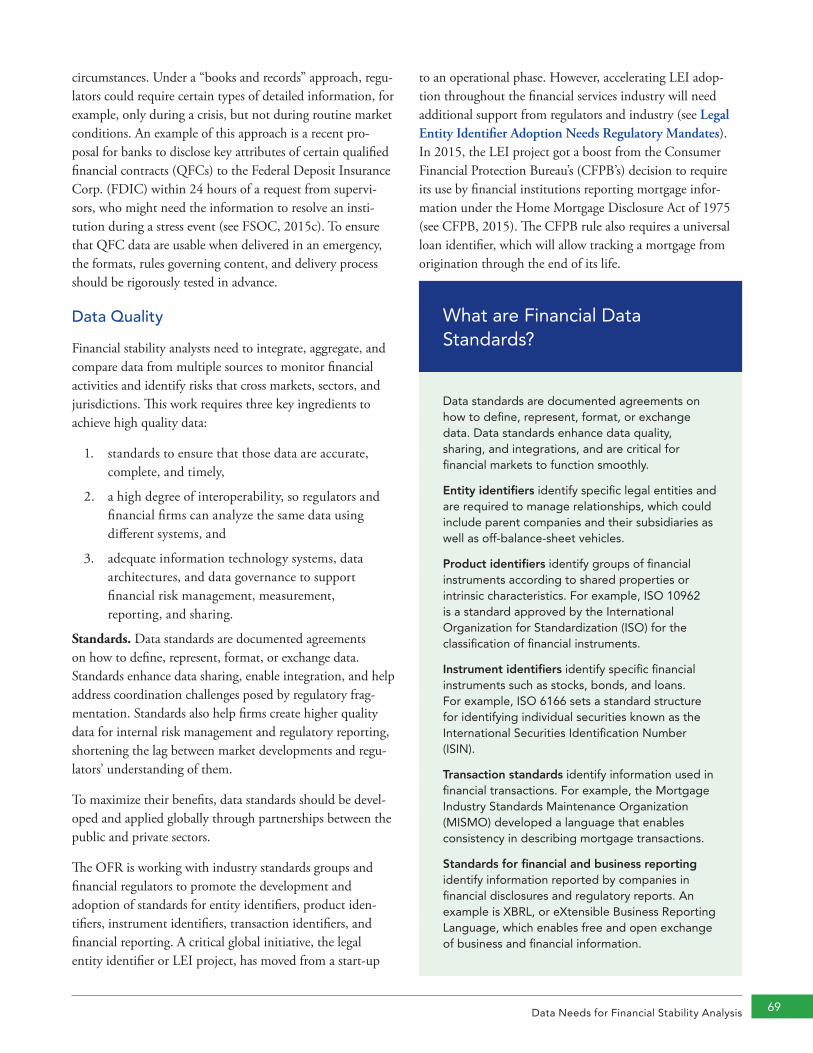
Data Needs for Financial Stability Analysis 69
circumstances. Under a “books and records” approach, regu-lators could require certain types of detailed information, for example, only during a crisis, but not during routine market conditions. An example of this approach is a recent pro-posal for banks to disclose key attributes of certain qualified financial contracts (QFCs) to the Federal Deposit Insurance Corp. (FDIC) within 24 hours of a request from supervi-sors, who might need the information to resolve an insti-tution during a stress event (see FSOC, 2015c). To ensure that QFC data are usable when delivered in an emergency, the formats, rules governing content, and delivery process should be rigorously tested in advance.
Data Quality
Financial stability analysts need to integrate, aggregate, and compare data from multiple sources to monitor financial activities and identify risks that cross markets, sectors, and jurisdictions. This work requires three key ingredients to achieve high quality data:
1. standards to ensure that those data are accurate, complete, and timely,
2. a high degree of interoperability, so regulators and financial firms can analyze the same data using different systems, and
3. adequate information technology systems, data architectures, and data governance to support financial risk management, measurement, reporting, and sharing.
Standards. Data standards are documented agreements on how to define, represent, format, or exchange data. Standards enhance data sharing, enable integration, and help address coordination challenges posed by regulatory frag-mentation. Standards also help firms create higher quality data for internal risk management and regulatory reporting, shortening the lag between market developments and regu-lators’ understanding of them.
To maximize their benefits, data standards should be devel-oped and applied globally through partnerships between the public and private sectors.
The OFR is working with industry standards groups and financial regulators to promote the development and adoption of standards for entity identifiers, product iden-tifiers, instrument identifiers, transaction identifiers, and financial reporting. A critical global initiative, the legal entity identifier or LEI project, has moved from a start-up
to an operational phase. However, accelerating LEI adop-tion throughout the financial services industry will need additional support from regulators and industry (see Legal Entity Identifier Adoption Needs Regulatory Mandates). In 2015, the LEI project got a boost from the Consumer Financial Protection Bureau’s (CFPB’s) decision to require its use by financial institutions reporting mortgage infor-mation under the Home Mortgage Disclosure Act of 1975 (see CFPB, 2015). The CFPB rule also requires a universal loan identifier, which will allow tracking a mortgage from origination through the end of its life.
What are Financial Data Standards?
Data standards are documented agreements on how to define, represent, format, or exchange data. Data standards enhance data quality, sharing, and integrations, and are critical for financial markets to function smoothly.
Entityidentifiers identify specific legal entities and are required to manage relationships, which could include parent companies and their subsidiaries as well as off-balance-sheet vehicles.
Productidentifiers identify groups of financial instruments according to shared properties or intrinsic characteristics. For example, ISO 10962 is a standard approved by the International Organization for Standardization (ISO) for the classification of financial instruments.
Instrumentidentifiers identify specific financial instruments such as stocks, bonds, and loans. For example, ISO 6166 sets a standard structure for identifying individual securities known as the International Securities Identification Number (ISIN).
Transactionstandards identify information used in financial transactions. For example, the Mortgage Industry Standards Maintenance Organization (MISMO) developed a language that enables consistency in describing mortgage transactions.
Standardsforfinancialandbusinessreporting identify information reported by companies in financial disclosures and regulatory reports. An example is XBRL, or eXtensible Business Reporting Language, which enables free and open exchange of business and financial information.
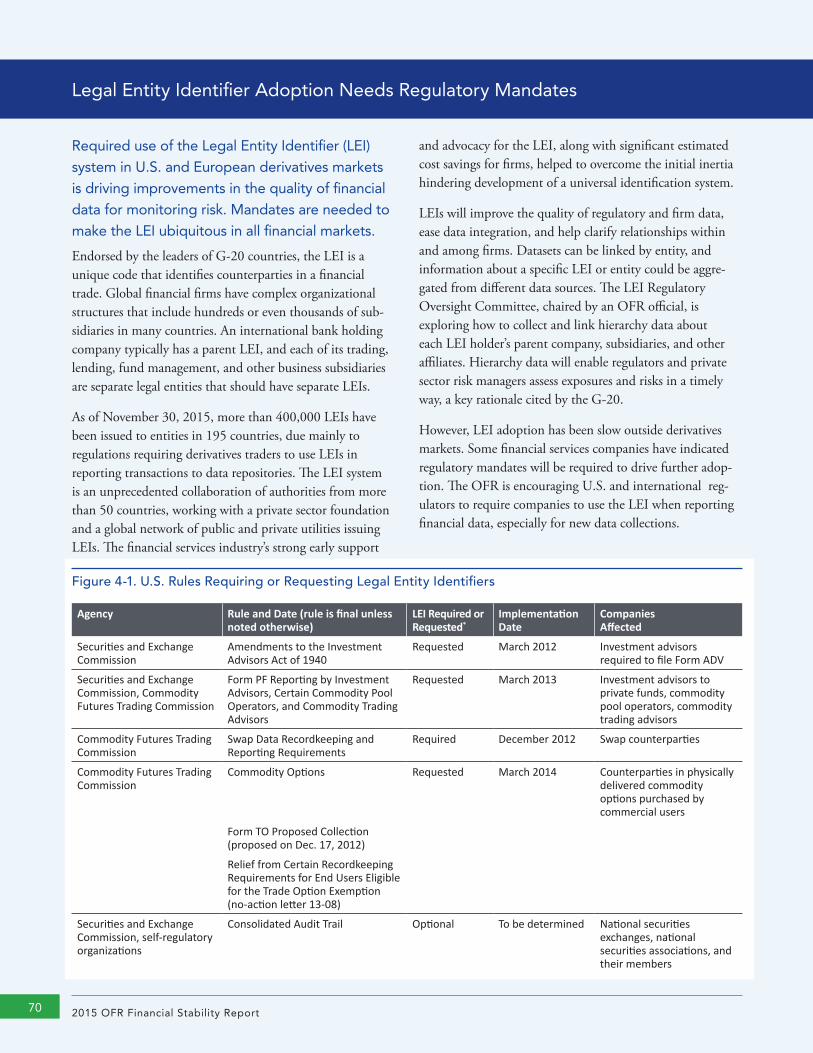
2015 OFR Financial Stability Report7070
Required use of the Legal Entity Identifier (LEI) system in U.S. and European derivatives markets is driving improvements in the quality of financial data for monitoring risk. Mandates are needed to make the LEI ubiquitous in all financial markets.
Endorsed by the leaders of G-20 countries, the LEI is a unique code that identifies counterparties in a financial trade. Global financial firms have complex organizational structures that include hundreds or even thousands of sub-sidiaries in many countries. An international bank holding company typically has a parent LEI, and each of its trading, lending, fund management, and other business subsidiaries are separate legal entities that should have separate LEIs.
As of November 30, 2015, more than 400,000 LEIs have been issued to entities in 195 countries, due mainly to regulations requiring derivatives traders to use LEIs in reporting transactions to data repositories. The LEI system is an unprecedented collaboration of authorities from more than 50 countries, working with a private sector foundation and a global network of public and private utilities issuing LEIs. The financial services industry’s strong early support
and advocacy for the LEI, along with significant estimated cost savings for firms, helped to overcome the initial inertia hindering development of a universal identification system.
LEIs will improve the quality of regulatory and firm data, ease data integration, and help clarify relationships within and among firms. Datasets can be linked by entity, and information about a specific LEI or entity could be aggre-gated from different data sources. The LEI Regulatory Oversight Committee, chaired by an OFR official, is exploring how to collect and link hierarchy data about each LEI holder’s parent company, subsidiaries, and other affiliates. Hierarchy data will enable regulators and private sector risk managers assess exposures and risks in a timely way, a key rationale cited by the G-20.
However, LEI adoption has been slow outside derivatives markets. Some financial services companies have indicated regulatory mandates will be required to drive further adop-tion. The OFR is encouraging U.S. and international reg-ulators to require companies to use the LEI when reporting financial data, especially for new data collections.
Legal Entity Identifier Adoption Needs Regulatory Mandates
Figure 4-1. U.S. Rules Requiring or Requesting Legal Entity Identifiers
Agency Rule and Date (rule is final unless noted otherwise)
LEI Required or Requested*
Implementation Date
Companies Affected
Securities and Exchange Commission
Amendments to the Investment Advisors Act of 1940
Requested March 2012 Investment advisors required to file Form ADV
Securities and Exchange Commission, Commodity Futures Trading Commission
Form PF Reporting by Investment Advisors, Certain Commodity Pool Operators, and Commodity Trading Advisors
Requested March 2013 Investment advisors to private funds, commodity pool operators, commodity trading advisors
Commodity Futures Trading Commission
Swap Data Recordkeeping and Reporting Requirements
Required December 2012 Swap counterparties
Commodity Futures Trading Commission
Commodity Options Requested March 2014 Counterparties in physically delivered commodity options purchased by commercial users
Form TO Proposed Collection (proposed on Dec. 17, 2012)
Relief from Certain Recordkeeping Requirements for End Users Eligible for the Trade Option Exemption (no-action letter 13-08)
Securities and Exchange Commission, self-regulatory organizations
Consolidated Audit Trail Optional To be determined National securities exchanges, national securities associations, and their members
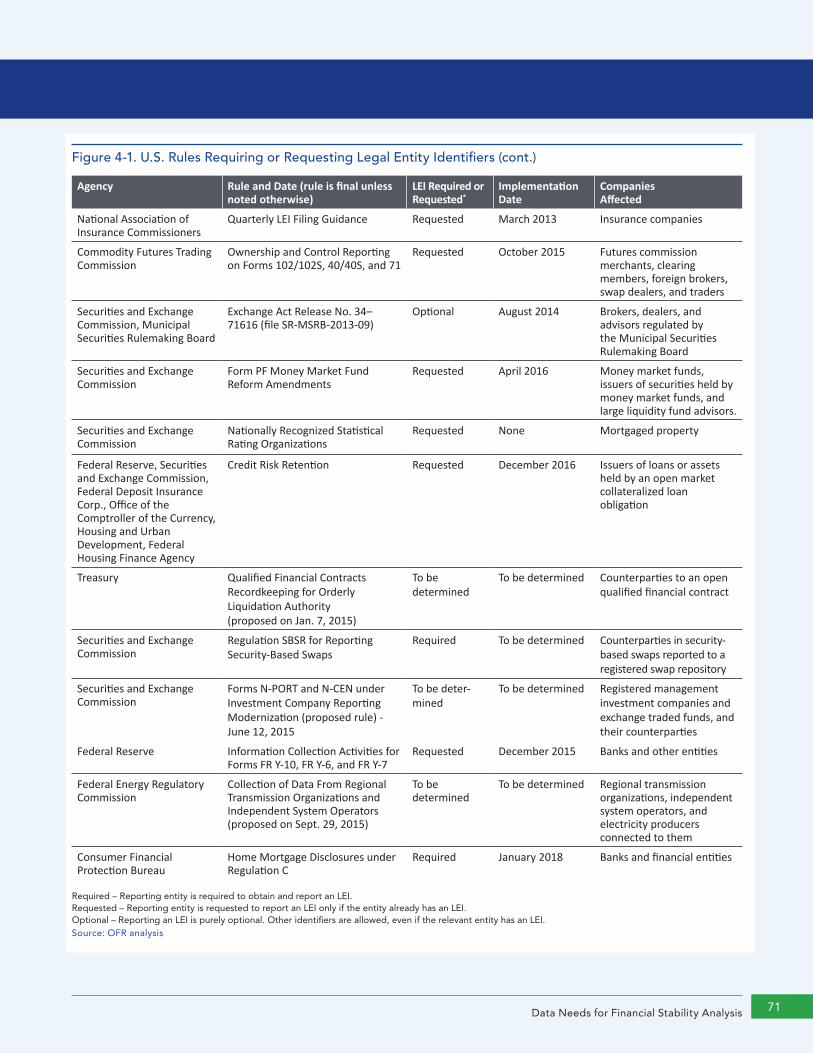
Data Needs for Financial Stability Analysis 7171
Agency Rule and Date (rule is final unless noted otherwise)
LEI Required or Requested*
Implementation Date
Companies Affected
National Association of Insurance Commissioners
Quarterly LEI Filing Guidance Requested March 2013 Insurance companies
Commodity Futures Trading Commission
Ownership and Control Reporting on Forms 102/102S, 40/40S, and 71
Requested October 2015 Futures commission merchants, clearing members, foreign brokers, swap dealers, and traders
Securities and Exchange Commission, Municipal Securities Rulemaking Board
Exchange Act Release No. 34–71616 (file SR-MSRB-2013-09)
Optional August 2014 Brokers, dealers, and advisors regulated by the Municipal Securities Rulemaking Board
Securities and Exchange Commission
Form PF Money Market Fund Reform Amendments
Requested April 2016 Money market funds, issuers of securities held by money market funds, and large liquidity fund advisors.
Securities and Exchange Commission
Nationally Recognized Statistical Rating Organizations
Requested None Mortgaged property
Federal Reserve, Securities and Exchange Commission, Federal Deposit Insurance Corp., Office of the Comptroller of the Currency, Housing and Urban Development, Federal Housing Finance Agency
Credit Risk Retention Requested December 2016 Issuers of loans or assets held by an open market collateralized loan obligation
Treasury Qualified Financial Contracts Recordkeeping for Orderly Liquidation Authority (proposed on Jan. 7, 2015)
To be determined
To be determined Counterparties to an open qualified financial contract
Securities and Exchange Commission
Regulation SBSR for Reporting Security-Based Swaps
Required To be determined Counterparties in security- based swaps reported to a registered swap repository
Securities and Exchange Commission
Forms N-PORT and N-CEN under Investment Company Reporting Modernization (proposed rule) - June 12, 2015
To be deter-mined
To be determined Registered management investment companies and exchange traded funds, and their counterparties
Federal Reserve Information Collection Activities for Forms FR Y-10, FR Y-6, and FR Y-7
Requested December 2015 Banks and other entities
Federal Energy Regulatory Commission
Collection of Data From Regional Transmission Organizations and Independent System Operators (proposed on Sept. 29, 2015)
To be determined
To be determined Regional transmission organizations, independent system operators, and electricity producers connected to them
Consumer Financial Protection Bureau
Home Mortgage Disclosures under Regulation C
Required January 2018 Banks and financial entities
Required – Reporting entity is required to obtain and report an LEI.Requested – Reporting entity is requested to report an LEI only if the entity already has an LEI.Optional – Reporting an LEI is purely optional. Other identifiers are allowed, even if the relevant entity has an LEI.Source: OFR analysis
Figure 4-1. U.S. Rules Requiring or Requesting Legal Entity Identifiers (cont.)
2015 OFR Financial Stability Report72
The OFR is developing a financial instrument reference database to fulfill a Dodd-Frank Act mandate. The database will help standardize product descriptions for market participants, providing greater comparability and more consistent reporting. In addition, the OFR plays a key role in international efforts to develop product identifiers and transaction identifiers for derivatives data reporting.
Interoperability. The financial crisis exposed the inability of regulators, policymakers, and market participants to assess financial service companies’ exposures in a timely manner. Firms were unable to link data within their own systems or to provide consolidated data to regulators. These failures illustrated the need to improve interoperability, which has been defined as “the ability of a system or a product to work with other systems or products without special effort on the part of the customer” (see IEEE, 2010).
Reporting standards can help improve interoperability by enforcing precise rules on data structures and ranges to inde-pendently validate data and share, compare, and exchange results. Unstructured data — such as a slide presentation or copy of a regulatory form — may have been sufficient for some purposes before the crisis, but they are inadequate for sophisticated analysis of companies and their intercon-nections. Interoperability initiatives should allow for local flexibility — the goal is to design for optimal, not complete, interoperability. Through widespread use of transaction standards like ISO 20022, a global standard for payment, trade, and securities message exchanges, financial markets have achieved a high degree of interoperability. However, firms’ internal systems still lack interoperability across their own business units and with regulators.
Improving data management. The financial crisis exposed shortcomings in the industry’s information technology systems and data architecture for managing risks. Regulators have studied the problems and made recommendations but progress reports have been mixed (see BIS, 2013; BIS, 2015a; SSG, 2009; SSG, 2014).
A 2014 progress report from the Senior Supervisors Group of financial regulators from 10 countries found large, com-plex financial services companies had made unsatisfactory progress in timely and accurate measurements of counter-party risk. The group said that “the area of greatest concern remains firms’ inability to consistently produce high-quality data” (see SSG, 2014). The Basel Committee on Banking Supervision noted in 2015 that “many (global systemically important) banks continue to encounter difficulties in
establishing strong data aggregation governance, architecture and processes” (see BIS, 2015a). The OFR has observed sim-ilar problems with source data during our pilot bilateral repo and securities lending data collections (see Section 4.2).
Financial firms and regulators suffer from legacy systems and processes that have not kept up with technology improvements. For example, some firms are the product of multiple mergers or acquisitions, and their information technology systems have yet to be integrated. And some regulators still encourage the design of data collections as if they were reported using paper forms. Such a format often requires reporting entities to make extensive aggregations of internal data, a process that can be burdensome and intro-duce calculation errors. Many of these aggregations cannot be validated by regulators because each reporting company has its own process.
Some data collections take an “extensible” approach, in which the number of data items reported is not constrained by a finite set of fields on the form. For example, the SEC’s Form 13-F requires mutual funds to report lists of their holdings and each list can be as long as needed, an approach typically closer in structure to funds’ own back-end systems, less burdensome to generate, requiring less aggregation, and more precise.
Data Access
To promote financial resilience and stability and to reduce the reporting burden, data must be shared by regulators with appropriate safeguards to protect confidentiality.
International regulators have called for more data sharing. Federal Reserve Board Governor Lael Brainard has noted that “no U.S. agency yet has access to complete data regarding bank and nonbank financial activities” (see Brainard, 2014). The FSOC’s latest annual report and the International Monetary Fund’s recent assessment of the U.S. financial system both urged more data sharing (see IMF, 2015b). The FSOC recommended its member agencies explore best practices for data sharing, noting that the inability to share certain data prevented market participants and regulators from fully understanding the sources and propagation of risks during the financial crisis (see FSOC, 2015a). A recent Bank for International Settlements study also highlighted the issue and outlined how macroprudential policymakers can benefit from access to supervisory data (see BIS, 2015b).
Data Needs for Financial Stability Analysis 73
Regulators often have limits on their ability to share informa-tion, including legal restrictions or requirements to protect confidential data submitted by firms. Safeguarding mar-ket-sensitive data is critical for the OFR and for regulators. Memorandums of understanding and other arrangements between authorities that spell out the nature of the information to be shared, who will use it and for what purposes, and how it will be protected provide critical governance. Compliance with such agreements, together with appropriate authentication technology, can assure data security.
It is important for financial regulators to take a broader view when designing new data collections. Regulatory datasets are typically designed from the narrow perspective of the man-date requiring the data, rather than a perspective that spans the U.S. financial system and the needs of financial stability analysis. Sharing data is easier when regulators work together in designing new financial data collections to apply standards, develop sharing mechanisms, and identify a dataset’s potential benefits to various regulators. Such coordination has the added benefit of avoiding overlapping or duplicate data requirements, reducing the burden on financial market participants.
Data sharing likely would be more efficient if regulators con-sistently shared metadata — data describing the data. Most metadata are not confidential. The FSOC’s Interagency Data Inventory is maintained by the OFR and contains a basic description of datasets, a form of metadata, collected by member agencies (see, OFR, 2015b). FSOC could build on the interagency inventory concept by cataloging, linking, and sharing more extensive metadata about member agencies’ collections. An analyst could review the additional information about a dataset before launching legal, tech-nical, and security processes for requesting and receiving data from another FSOC member.
4.2 Analyzing Data NeedsThis section describes efforts to improve the scope, quality, and accessibility of data describing repos, derivatives, and mortgages, and related to activities of asset managers, insurance companies, and banks.
Good data are essential for good policy decisions. Data gaps and lack of data access hinder policymakers, supervisors, and regulators from understanding and addressing vulner-abilities in individual institutions, markets, and across the financial system. Data gaps and obstacles to access prevent the OFR and others from assessing and monitoring threats
to financial stability, evaluating stress testing and financial stability policies, and informing decision making.
Several examples will illustrate. To start, in Chapters 3 and 5 we discuss how use of central counterparties (CCPs) have introduced concentration risks in the post-crisis hub-and-spoke system of derivatives clearing. However, the data avail-able to sufficiently assess CCP operations, vulnerabilities, and risks are not yet commensurate with their growing role. Globally, CCP disclosure and regulatory data collections are limited. Greater transparency in the operations and inter-connectedness of CCPs can instill greater market discipline by allowing clearing members to better grasp how much risk they may be facing. The OFR’s Financial Research Advisory Committee has compiled an initial list of data elements that should be collected for regulators and market participants to assess risks from CCPs (see FRAC, 2015).
Better data are also needed for forensic analyses of past market disruptions. Exceptionally volatile trading in the U.S. Treasury market on October 15, 2014, revealed signif-icant gaps in fixed-income market data due to incomplete data collecting and reporting, the over-the-counter (OTC) nature of the markets, and fragmented regulatory authority. For example, the Financial Industry Regulatory Authority (FINRA), a self-regulatory organization, collects data about transactions in most segments of the corporate fixed-income market, but not about U.S. Treasuries or traded loans. In the corporate bond market, FINRA does not capture trades if both parties are not FINRA members, and it does not disclose the identities of counterparties who are not FINRA members.
Closing data gaps would also help in developing system-wide stress tests, which would be an extension of firm-level tests to help evaluate financial system resilience. Currently, U.S. regulators primarily use microprudential stress tests to examine a bank’s resiliency to hypothetical shocks. These stress tests do not consider how a financial firm’s response to a given shock might affect its counterparties, investors, and other financial institutions, much less how those effects could feed back to the firm. Evaluating those interactions would require a broad range of transaction-level data on securities, derivatives, and short term funding markets, such as repurchase agreements (repos).
A first step in designing a systemwide stress test would be to develop tools to assess the potential for risks to be transmitted across the financial sector through channels such as funding runs, counterparty credit risk, and asset fire sales. As discussed in Chapter 5, the OFR is using network
2015 OFR Financial Stability Report74
methods to better understand risk propagation and agent-based models to analyze the dynamics of market participants and their reactions to stress events. Although the OFR has some data to begin this work, we currently lack sufficient data to evaluate a shock to U.S. financial markets. Some of the needed data are being collected by financial regulators for other purposes, such as supervision and enforcement. Broader data-sharing would allow regulators to leverage datasets from different agencies to better evaluate financial stability risks.
Better data are also needed to analyze the consequences of regulation. The OFR published a research brief in July describing capital relief transactions that shift a bank’s cred-it-risk exposure to a third party through the use of deriva-tives or guarantees. The transactions allow banks to reduce their risk-weighted assets and consequently hold less capital (see Cetina, McDonough, and Rajan, 2015). But relatively little data are available about capital relief trades and banks are not required to publicly disclose the impact of capital relief transactions on their risk-weighted assets and capital ratios. The absence of that information obscures under-standing of how capital relief affects a bank’s risk profile.
In another research brief, OFR analysts ranked global systemically important banks (G-SIBs) by their scores using criteria established by the Basel Committee on Banking Supervision (BCBS). The BCBS publishes a substantial amount of the underlying data it uses each year to rank G-SIBs. But some data are in Portable Document Format (PDF) files that are difficult to analyze (see Glasserman and Loudis, 2015). While the data are officially updated annu-ally, individual banks have resubmitted disclosure forms to their respective regulators, and some of these revisions have been substantial. These revisions may improve the accuracy of the data, but complicate the systemic importance mea-sures, which are calculated at a point in time each year. Also, although the Federal Reserve publishes G-SIB information from its Form FR Y-15, the BCBS does not make consoli-dated G-SIB information publicly available. Data in PDF files, and the lack of a publicly available consolidated digital resource for these data, hinder public research on issues of global financial stability.
Securities Financing Transactions: Bilateral Repo and Securities Lending
Banks and nonbanks that rely excessively on short-term borrowing in the securities financing market may originate,
transmit, and amplify financial stability risks (see Chapter 2). The financial crisis exposed three types of vulnerabilities: (1) risks related to the leverage and liquidity transformation taken on by market intermediaries, (2) weaknesses in the market infrastructure, and (3) the risk of asset fire sales. Regulators have taken important steps to address some of these vulnera-bilities, but more work is needed (see FSB, 2013b).
A comprehensive view of remaining and emerging risks and vulnerabilities can only be built upon timely and reliable data about these activities. Although the data available related to these markets have improved since the crisis, they remain insufficient.
To address data weaknesses in these key areas, the OFR, Federal Reserve, and SEC launched a voluntary pilot data collection of U.S. dollar-denominated transactions by a subset of market participants. The first part of the pilot data collection took place in the first half of 2015. Participants provided snapshots of their bilateral repo books during three nonconsecutive business days. The second part of the pilot, covering securities lending activity, is under way and expected to be completed in the first quarter of 2016 (see Baklanova, 2015).
We have already learned important lessons from this ongoing pilot data collection.
A recent OFR working paper detailed the institutional structure of repo and securities lending markets, the role and motivation of market participants, the vulnerabilities and potential systemic risks, efforts to limit risks, data gaps, and initiatives to close the gaps (see Baklanova, Copeland, and McCaughrin, 2015).
Problems with data scope. The pilot faces several challenges in achieving a more comprehensive view of bilateral repo activity. Because it includes only major U.S. broker-dealers, leaving out overseas and smaller domestic market partici-pants, the pilot does not provide insight about cross-border repo activities or about market interconnectedness. OFR analysts do not believe nonprimary dealers represent a substantial amount of repo activity, but this condition may change over time if regulation prompts the migration of these activities from primary dealers to nonprimary dealers or outside the dealer community. This migration cannot be tracked currently due to a lack of consolidated reporting on the repo market (see Figure 4-2).
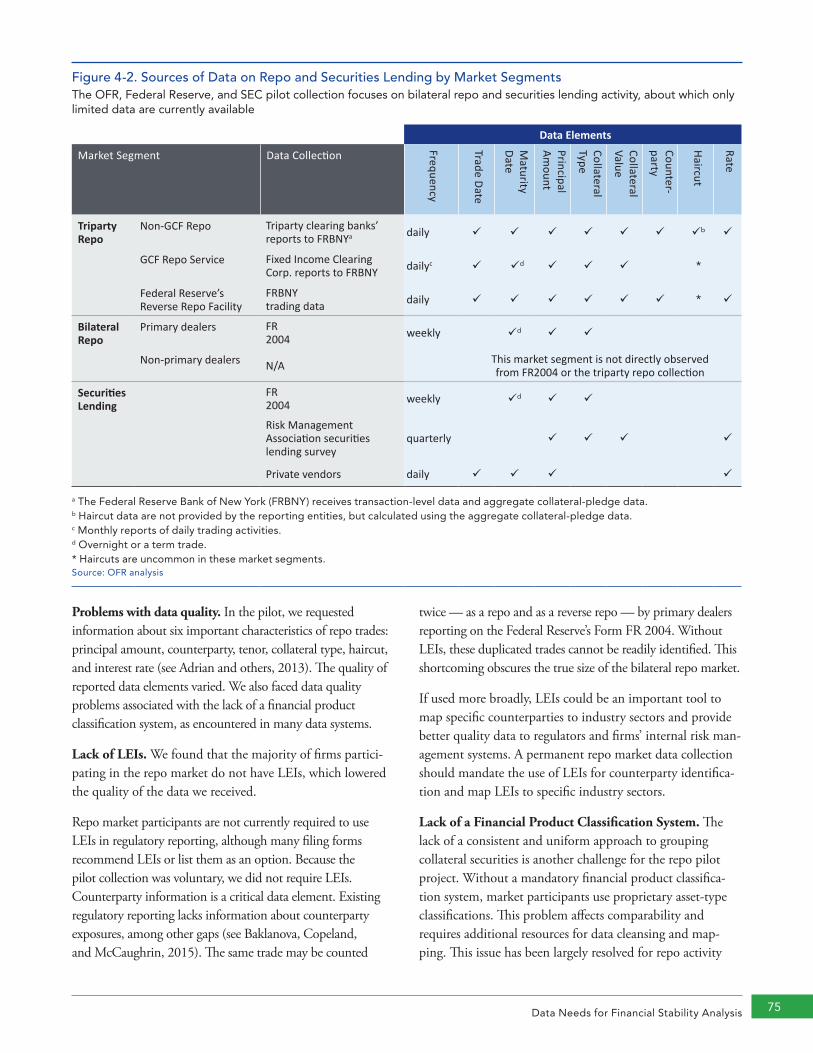
Data Needs for Financial Stability Analysis 75
Problems with data quality. In the pilot, we requested information about six important characteristics of repo trades: principal amount, counterparty, tenor, collateral type, haircut, and interest rate (see Adrian and others, 2013). The quality of reported data elements varied. We also faced data quality problems associated with the lack of a financial product classification system, as encountered in many data systems.
Lack of LEIs. We found that the majority of firms partici-pating in the repo market do not have LEIs, which lowered the quality of the data we received.
Repo market participants are not currently required to use LEIs in regulatory reporting, although many filing forms recommend LEIs or list them as an option. Because the pilot collection was voluntary, we did not require LEIs. Counterparty information is a critical data element. Existing regulatory reporting lacks information about counterparty exposures, among other gaps (see Baklanova, Copeland, and McCaughrin, 2015). The same trade may be counted
twice — as a repo and as a reverse repo — by primary dealers reporting on the Federal Reserve’s Form FR 2004. Without LEIs, these duplicated trades cannot be readily identified. This shortcoming obscures the true size of the bilateral repo market.
If used more broadly, LEIs could be an important tool to map specific counterparties to industry sectors and provide better quality data to regulators and firms’ internal risk man-agement systems. A permanent repo market data collection should mandate the use of LEIs for counterparty identifica-tion and map LEIs to specific industry sectors.
Lack of a Financial Product Classification System. The lack of a consistent and uniform approach to grouping collateral securities is another challenge for the repo pilot project. Without a mandatory financial product classifica-tion system, market participants use proprietary asset-type classifications. This problem affects comparability and requires additional resources for data cleansing and map-ping. This issue has been largely resolved for repo activity
Figure 4-2. Sources of Data on Repo and Securities Lending by Market Segments The OFR, Federal Reserve, and SEC pilot collection focuses on bilateral repo and securities lending activity, about which only limited data are currently available
Data Elements
Market Segment Data Collection
Frequency
Trade Date
Maturity
Date
Principal Am
ount
Collateral Type
Collateral Value
Counter-party
Haircut
Rate
Triparty Repo
Non-GCF Repo Triparty clearing banks’ reports to FRBNYa daily b
GCF Repo Service Fixed Income Clearing Corp. reports to FRBNY dailyc d *
Federal Reserve’s Reverse Repo Facility
FRBNY trading data daily *
Bilateral Repo
Primary dealers FR 2004 weekly d
Non-primary dealers N/A This market segment is not directly observed from FR2004 or the triparty repo collection
Securities Lending
FR 2004 weekly d
Risk Management Association securities lending survey
quarterly
Private vendors daily
a The Federal Reserve Bank of New York (FRBNY) receives transaction-level data and aggregate collateral-pledge data. b Haircut data are not provided by the reporting entities, but calculated using the aggregate collateral-pledge data. c Monthly reports of daily trading activities.d Overnight or a term trade.* Haircuts are uncommon in these market segments.Source: OFR analysis
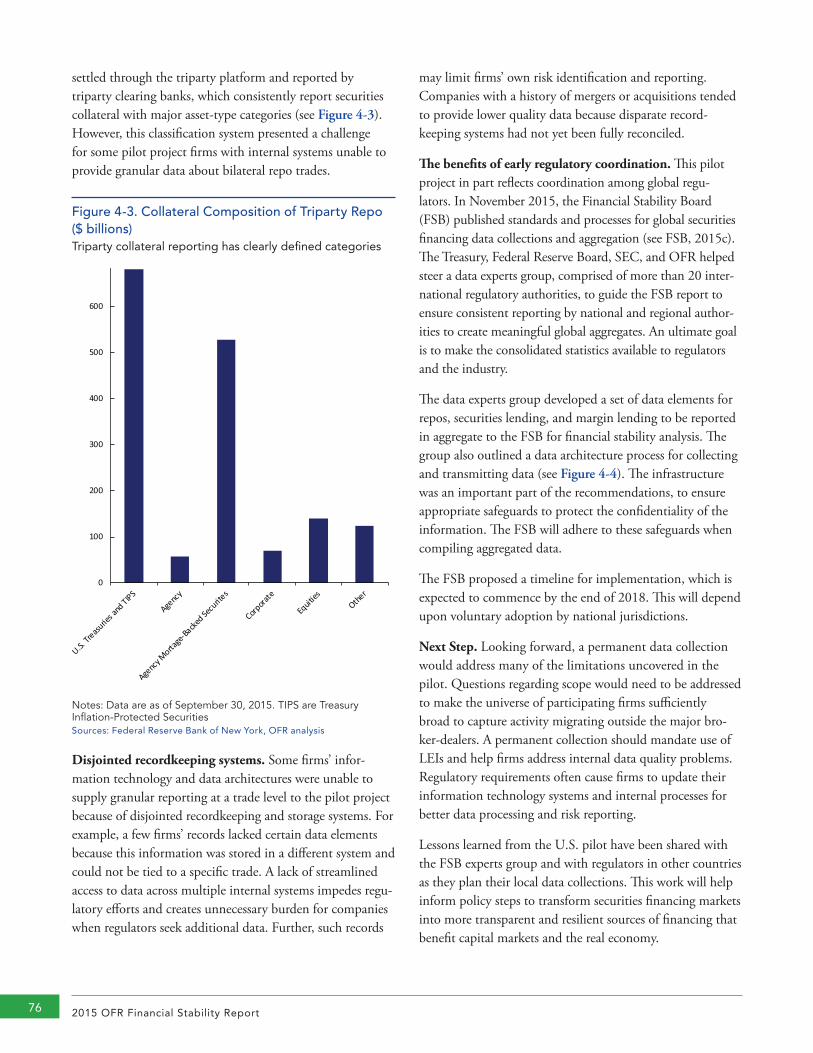
2015 OFR Financial Stability Report76
settled through the triparty platform and reported by triparty clearing banks, which consistently report securities collateral with major asset-type categories (see Figure 4-3). However, this classification system presented a challenge for some pilot project firms with internal systems unable to provide granular data about bilateral repo trades.
Figure 4-3. Collateral Composition of Triparty Repo ($ billions) Triparty collateral reporting has clearly defined categories
0
100
200
300
400
500
600
700
Notes: Data are as of September 30, 2015. TIPS are Treasury Inflation-Protected SecuritiesSources: Federal Reserve Bank of New York, OFR analysis
Disjointed recordkeeping systems. Some firms’ infor-mation technology and data architectures were unable to supply granular reporting at a trade level to the pilot project because of disjointed recordkeeping and storage systems. For example, a few firms’ records lacked certain data elements because this information was stored in a different system and could not be tied to a specific trade. A lack of streamlined access to data across multiple internal systems impedes regu-latory efforts and creates unnecessary burden for companies when regulators seek additional data. Further, such records
may limit firms’ own risk identification and reporting. Companies with a history of mergers or acquisitions tended to provide lower quality data because disparate record-keeping systems had not yet been fully reconciled.
The benefits of early regulatory coordination. This pilot project in part reflects coordination among global regu-lators. In November 2015, the Financial Stability Board (FSB) published standards and processes for global securities financing data collections and aggregation (see FSB, 2015c). The Treasury, Federal Reserve Board, SEC, and OFR helped steer a data experts group, comprised of more than 20 inter-national regulatory authorities, to guide the FSB report to ensure consistent reporting by national and regional author-ities to create meaningful global aggregates. An ultimate goal is to make the consolidated statistics available to regulators and the industry.
The data experts group developed a set of data elements for repos, securities lending, and margin lending to be reported in aggregate to the FSB for financial stability analysis. The group also outlined a data architecture process for collecting and transmitting data (see Figure 4-4). The infrastructure was an important part of the recommendations, to ensure appropriate safeguards to protect the confidentiality of the information. The FSB will adhere to these safeguards when compiling aggregated data.
The FSB proposed a timeline for implementation, which is expected to commence by the end of 2018. This will depend upon voluntary adoption by national jurisdictions.
Next Step. Looking forward, a permanent data collection would address many of the limitations uncovered in the pilot. Questions regarding scope would need to be addressed to make the universe of participating firms sufficiently broad to capture activity migrating outside the major bro-ker-dealers. A permanent collection should mandate use of LEIs and help firms address internal data quality problems. Regulatory requirements often cause firms to update their information technology systems and internal processes for better data processing and risk reporting.
Lessons learned from the U.S. pilot have been shared with the FSB experts group and with regulators in other countries as they plan their local data collections. This work will help inform policy steps to transform securities financing markets into more transparent and resilient sources of financing that benefit capital markets and the real economy.
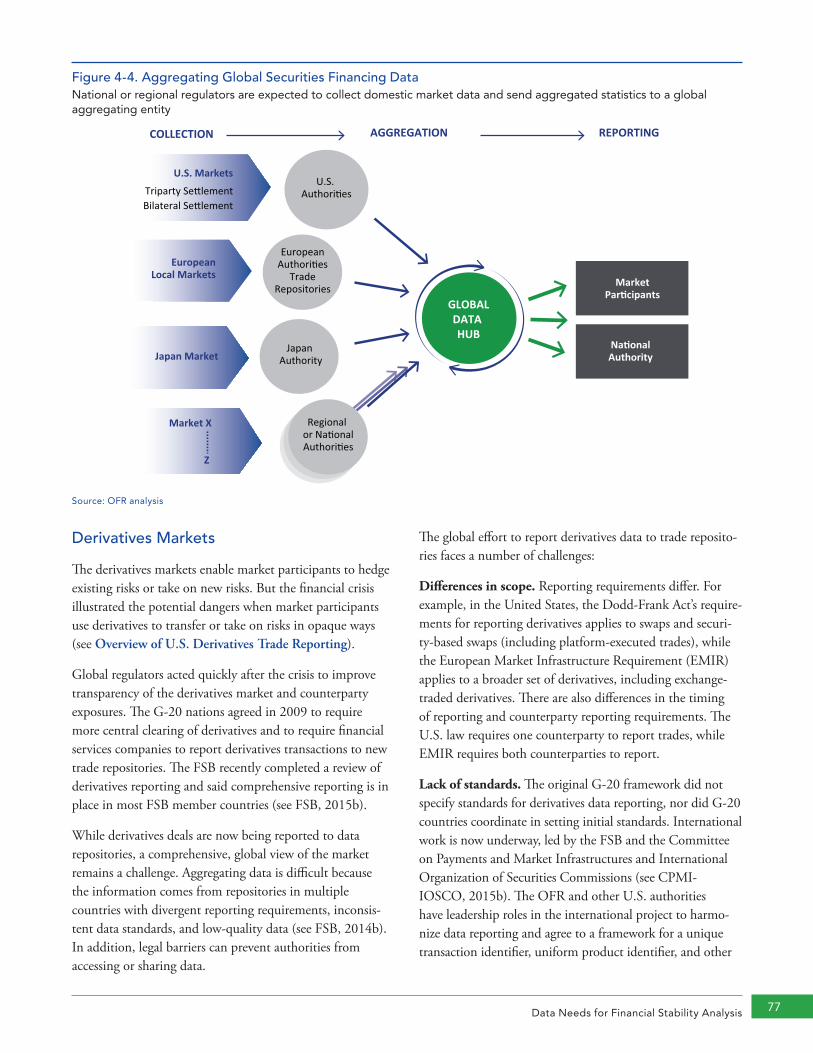
Data Needs for Financial Stability Analysis 77
Derivatives Markets
The derivatives markets enable market participants to hedge existing risks or take on new risks. But the financial crisis illustrated the potential dangers when market participants use derivatives to transfer or take on risks in opaque ways (see Overview of U.S. Derivatives Trade Reporting).
Global regulators acted quickly after the crisis to improve transparency of the derivatives market and counterparty exposures. The G-20 nations agreed in 2009 to require more central clearing of derivatives and to require financial services companies to report derivatives transactions to new trade repositories. The FSB recently completed a review of derivatives reporting and said comprehensive reporting is in place in most FSB member countries (see FSB, 2015b).
While derivatives deals are now being reported to data repositories, a comprehensive, global view of the market remains a challenge. Aggregating data is difficult because the information comes from repositories in multiple countries with divergent reporting requirements, inconsis-tent data standards, and low-quality data (see FSB, 2014b). In addition, legal barriers can prevent authorities from accessing or sharing data.
The global effort to report derivatives data to trade reposito-ries faces a number of challenges:
Differences in scope. Reporting requirements differ. For example, in the United States, the Dodd-Frank Act’s require-ments for reporting derivatives applies to swaps and securi-ty-based swaps (including platform-executed trades), while the European Market Infrastructure Requirement (EMIR) applies to a broader set of derivatives, including exchange-traded derivatives. There are also differences in the timing of reporting and counterparty reporting requirements. The U.S. law requires one counterparty to report trades, while EMIR requires both counterparties to report.
Lack of standards. The original G-20 framework did not specify standards for derivatives data reporting, nor did G-20 countries coordinate in setting initial standards. International work is now underway, led by the FSB and the Committee on Payments and Market Infrastructures and International Organization of Securities Commissions (see CPMI-IOSCO, 2015b). The OFR and other U.S. authorities have leadership roles in the international project to harmo-nize data reporting and agree to a framework for a unique transaction identifier, uniform product identifier, and other
Figure 4-4. Aggregating Global Securities Financing DataNational or regional regulators are expected to collect domestic market data and send aggregated statistics to a global aggregating entity
Triparty Se�lementBilateral Se�lement
GLOBALDATA HUB
U.S. Authories
Regional or NaonalAuthories
EuropeanAuthories
TradeRepositories
Japan Authority
MarketPar�cipants
Na�onalAuthority
EuropeanLocal Markets
Japan Market
Market X
Z
U.S. Markets
AGGREGATION REPORTINGCOLLECTION
Source: OFR analysis

2015 OFR Financial Stability Report78 2015 OFR Financial Stability Report78
Overview of U.S. Derivatives Trade Reporting
Figure 4-5. U.S. Derivatives Market Reporting StructureMultiple possible information flows for reporting derivatives data add to the complexity of tracking market activities
Third Party Service Providers(Middleware)
Market Par�cipants (Buyer/Seller)
Swap Execu�on Facili�es (SEFs)
Swap Data Repositories (SDRs)(Four registered in the U.S.)
Regulators
REPORTIN
GCLEARIN
GTRADIN
G VENU
E
Deriva�ves Clearing Organiza�ons (DCOs)Central Counterparty Clearinghouse (CCPs)
Note: Black arrows indicate predominant market flows prior to regula�on.Source: OFR analysis
Source: OFR analysis
The derivatives market structure and trade reporting are complex. U.S. implementation has been driven by the Dodd-Frank Act, which envisioned multiple types of players: market participants, swap execution facilities, derivatives clearing organizations, and swap data repositories. In practice, third-party service providers already active in the markets comprise another piece of the data supply chain (see Figure 4-5).
The structure of the U.S. derivatives market creates the potential for the same trade to be reported multiple times to one or more swap data repositories. Without certain core identifiers, including the LEI and identifiers for products and transactions, the process of netting-out duplicate trades is laborious. Our discussion here reflects the CFTC’s reporting requirements in effect at the time of publication. The SEC has not yet finalized its reporting requirements for security-based swaps.
Market participants, either the buyer or seller involved in each trade, are typically responsible for reporting the trade directly to a data repository. However, some end users are exempt from reporting these trades. Market participants may include swap dealers and major swap participants, as defined by the Dodd Frank Act (see U.S. Congress, 2010), as well as financial institutions that trade swaps.
The next layer in the derivatives market, third-party service providers, largely sit between the market participants and swap execution facilities and play an important role in processing trade data. In many cases, service providers com-municate the status and confirmation of trades to market participants. Service providers may also operate between swap execution facilities and derivatives clearing organiza-tions or repositories, depending on whether a trade is cleared or not. In these cases, service providers may submit trades to derivatives clearing organizations for clearing, or directly to repositories for reporting. The presence of third-party service providers does not impact the legal and regulatory responsi-bility of the counterparties to a trade to ensure data quality and reporting compliance.
]Insert Section Title[ 79Data Needs for Financial Stability Analysis 79
Swap execution facilities are another important player in the derivatives market. Before the CFTC issued rules, most derivatives trades were bilateral. Swap execution facilities were created to provide an electronic trading platform for swaps similar to those used for other asset classes, such as equity exchanges or commodity boards of trade. Twenty-two swap execution facilities were temporarily registered with the CFTC as of October 1, 2015, as required by law (see CFTC, 2015e).
Derivatives clearing organizations act as central counter-parties and must register with the CFTC. Fifteen deriv-atives clearing organizations were provisionally registered with the CFTC as of October 1, 2015, however, a smaller number are currently active in clearing derivatives trades in the United States (see CFTC, 2015c). CFTC rules require certain types of trades to be cleared by derivatives clearing organizations, and some trades that are not required to be cleared are also sent for clearing. Trades submitted to a derivatives clearing organization are either a bilateral trade from one of the trade’s counterparties, or a trade executed on a swap execution facility (see CFTC, 2012).
In both cases, a derivatives clearing organization terminates the original trade and creates two new trades, acting as a central counterparty to each of the original counterparties.
Complicating the reporting regime, the original trade (between two counterparties) and the resulting two trades (between the central counterparty and the original two coun-terparties) are all reported to data repositories. In some cases, the original trade and the clearing organization’s resulting trades are reported to more than one data repository. The CFTC recently proposed rulemaking to further clarify reporting obligations for cleared trades (see CFTC, 2015a).
Depending on the nature of the trade, all entities in the market structure described above could be responsible for reporting the trade to a data repository. Reporting responsi-bility depends on relevant CFTC rules, the trade venue, and agreements between the parties.
Currently, the CFTC has access to data reported to the swap data repositories that form a fifth layer in the derivatives market (see CFTC, 2015d). Four repositories were pro-visionally registered as of October 1, 2015. Because each repository has different reporting standards, aggregation of the data is challenging. The CFTC has taken steps to improve usability of the trade data through domestic and international data harmonization. The CFTC also publishes on its website a weekly swaps report that aggregates data from the four repositories by asset class, clearing status, product, tenor, and participant type (see CFTC, 2015f).
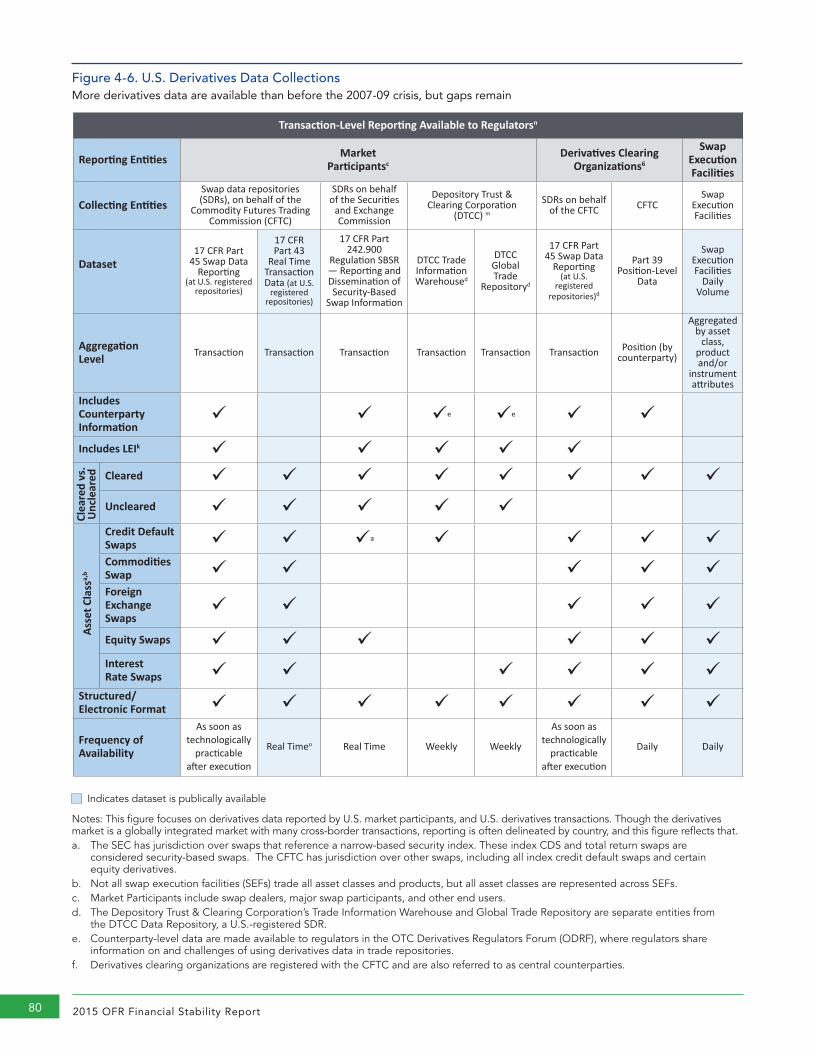
2015 OFR Financial Stability Report80
Figure 4-6. U.S. Derivatives Data CollectionsMore derivatives data are available than before the 2007-09 crisis, but gaps remain
Transaction-Level Reporting Available to Regulatorsn
Reporting Entities Market Participantsc
Derivatives Clearing Organizations6
Swap Execution Facilities
Collecting EntitiesSwap data repositories (SDRs), on behalf of the
Commodity Futures Trading Commission (CFTC)
SDRs on behalf of the Securities
and Exchange Commission
Depository Trust & Clearing Corporation
(DTCC) m
SDRs on behalf of the CFTC CFTC
Swap Execution Facilities
Dataset 17 CFR Part
45 Swap Data Reporting
(at U.S. registered repositories)
17 CFR Part 43
Real Time Transaction Data (at U.S.
registered repositories)
17 CFR Part 242.900
Regulation SBSR — Reporting and Dissemination of Security-Based
Swap Information
DTCC Trade Information Warehoused
DTCC Global Trade
Repositoryd
17 CFR Part 45 Swap Data
Reporting (at U.S.
registered repositories)d
Part 39 Position-Level
Data
Swap Execution Facilities
Daily Volume
Aggregation Level Transaction Transaction Transaction Transaction Transaction Transaction Position (by
counterparty)
Aggregated by asset
class, product and/or
instrument attributes
Includes Counterparty Information
e e
Includes LEIk Cleared Uncleared Credit Default Swaps a Commodities Swap Foreign Exchange Swaps
Equity Swaps Interest Rate Swaps
Structured/ Electronic Format
Frequency of Availability
As soon as technologically
practicable after execution
Real Timeo Real Time Weekly Weekly
As soon as technologically
practicable after execution
Daily Daily
Indicates dataset is publically available
Notes: This figure focuses on derivatives data reported by U.S. market participants, and U.S. derivatives transactions. Though the derivatives market is a globally integrated market with many cross-border transactions, reporting is often delineated by country, and this figure reflects that.a. The SEC has jurisdiction over swaps that reference a narrow-based security index. These index CDS and total return swaps are
considered security-based swaps. The CFTC has jurisdiction over other swaps, including all index credit default swaps and certain equity derivatives.
b. Not all swap execution facilities (SEFs) trade all asset classes and products, but all asset classes are represented across SEFs.c. Market Participants include swap dealers, major swap participants, and other end users.d. The Depository Trust & Clearing Corporation’s Trade Information Warehouse and Global Trade Repository are separate entities from
the DTCC Data Repository, a U.S.-registered SDR.e. Counterparty-level data are made available to regulators in the OTC Derivatives Regulators Forum (ODRF), where regulators share
information on and challenges of using derivatives data in trade repositories.f. Derivatives clearing organizations are registered with the CFTC and are also referred to as central counterparties.
Clea
red
vs.
Unc
lear
edAs
set C
lass
a,b

Data Needs for Financial Stability Analysis 81
g. Generally, data are available electronically, although structure varies by central counterparty.h. A full description of the market participants reporting to the Bank for International Settlements (BIS) is available in the survey.j. The BIS semiannual derivatives survey collects information internationally, including from the United States. Authorities from each par-
ticipating country collect data from market participants. As this table focuses on U.S. market participants, the “reporting entity” refers to U.S. participants only.
k. This column indicates whether or not the dataset includes LEI information. Some datasets require the use of LEI (with some reporting exemptions). Other databases, such as the DTCC’s Trade Information Warehouse and Global Trade Repository, collect data from multiple jurisdictions, and include LEIs when required by the jurisdiction overseeing trade reporting.
m. Data are reported to the Trade Information Warehouse (TIW) and Global Trade Repository on a voluntary basis by market participants. Data from the TIW are provided to certain authorities under guidelines developed by the OTC Derivatives Regulators Forum.
n. Certain transaction-level datasets are also available to the public (see legend).o. Certain transactions, such as large notional block trades, are not reported in real time.Sources: BIS, 2015b; CFTC, 2015; DTCC, 2015b; FRBNY, 2013; FIA, 2015; ISDA, 2015; SEC; OFR analysis
Aggregate-Level Reporting Available to the Public
Entities Providing Source Information
Central Counterpartiesf
Swap Data Repositories
Swap Execution Facilities
Swap Data Repositories,
Swap Execution Facilities, Central
Counterparties
Market Participants
including dealersc
Market Participantsh
Reporting Dealers
Entities Creating Public Datasets from Source Information
Central Counterpartiesf CFTC
International Swaps and Derivatives Association
(ISDA)
Swap execution
facilities and designated
contract makers
Commerical Data Vendors
Depository Trust & Clearing Corporation
(DTCC)
Board of Governors of the Federal Reserve System to the Bank of International
Settlements (BIS) (U.S. Only)
Dataset Clearing volume
(including compression)
CFTC Weekly Swaps Report
ISDA SwapsInfo
SEF Tracker (Futures Industry
Association)
Third-party data vendor statistics
on trade and clearing volumes
DTCC Trade Information Warehouse
DTCC Global Trade
Repositoryd
BIS Semiannual Derivatives Statisticsj
BIS Triennial Central
Bank Survey of foreign exchange
and derivatives
market activity
Aggregation Level Aggregated by asset class, product and/or instrument attributes
Cleared
Uncleared Credit Default Swaps
Commodities Swap Foreign Exchange Swaps
Equity Swaps Interest Rate Swaps
Structured/ Electronic Format g Frequency of Availability Varies Weekly Varies by
Report Monthly Varies Varies by Report
Varies by Report Semiannual Triennial
Clea
red
vs.
Unc
lear
edAs
set C
lass
a,b
U.S. Derivatives Data Collections, continued
2015 OFR Financial Stability Report82
data elements. The efforts have focused on the aggregation of these data for analysis by regulators both in their own jurisdictions and across borders.
Data quality problems. Across jurisdictions, the usefulness of swap data to monitor financial stability risks is also lim-ited by quality issues such as consistency, formatting, com-pleteness, and accuracy. In a few jurisdictions, legal barriers to reporting swap deals to repositories result in reporting partial data that masks identities of counterparties.
Accessibility concerns. Legal and practical barriers limit regulators’ ability to share data within and across borders for a comprehensive view of risks in derivatives markets. Many of these issues were highlighted in the FSB’s recent review of derivatives reporting (see FSB, 2015b). In the United States, the Dodd-Frank Act required regulators to bear certain costs arising from sharing data. For example, subject to many exceptions, domestic and foreign regulators were required to agree to indemnify swap data repositories and the CFTC and SEC for certain litigation costs that could arise as a result of the regulator’s access to the data. In some circum-stances, both domestic and foreign regulators may be unable to meet these indemnification requirements. In 2012, the CFTC issued an interpretative statement providing guidance on the scope of the confidentiality and indemnification provisions that it administers (see CFTC, 2015b). In 2015, the SEC proposed rule amendments that would, among other things, set a conditional exemption from the statu-tory indemnification requirements (see SEC, 2015c; SEC, 2015e). Recently the U.S. Congress amended sections of the Commodity Exchange Act and Securities Exchange Act, removing the indemnification requirements from the statute (see Congress, 2015).
U.S. Implementation and Harmonization
In the United States, derivatives markets historically have had little or no publicly available market data, with only a small number of participants able to discern liquidity and pricing trends. This was also the case in corporate bond markets before the 2002 launch of the Trade Reporting and Compliance Engine system by the Financial Industry Regulatory Authority, a self-regulatory organization.
The Dodd-Frank Act divided regulatory authority of swap data repositories between the CFTC, which oversees most swaps, and the SEC, which oversees a smaller market for security-based swaps. The CFTC adopted rules in 2012 for swap data recordkeeping and reporting that initiated the
creation and dissemination of limited product, price, and volume data to the public. Over the past year-and-a-half, the CFTC and market participants have started reviewing data from repositories and swap execution facilities that were intended to provide the initial means for addressing G-20 concerns about market transparency (see Figure 4-6). The SEC adopted its repository rules in early 2015 and has a phased schedule for companies to begin reporting trades.
However, understanding and aggregating the swap data sub-mitted to repositories so far has been challenging. The data are not collected by all repositories using standardized data fields, reporting formats, or common definitions for data elements and business process lifecycles. Data are difficult to aggregate across reporting entities that use different mes-sage types and varying record formats. Repositories do not have to check the quality of submissions from firms and no provision exists for rejecting incomplete or inaccurate trade information (see Data Quality Analysis of Public Swap Data Repository Data). The CFTC is focused on these issues and is working to improve the quality and accessibility of the data.
The OFR has been working with the CFTC on its data harmonization effort to enhance the quality of data collected by CFTC-registered repositories, in parallel with the global CPMI-IOSCO harmonization process (see CPMI-IOSCO, 2015b). Harmonizing trade data requires standardizing data element names, definitions, and possible values. The effort also requires a shared or standardized view of the swap trade lifecycle because each message submitted plays a role by initiating, correcting, or finalizing a trade, and must be interpreted accordingly.
Harmonizing derivatives data is complicated by several factors. First, the market trade reporting structure itself is being transformed from the pre-crisis model based on bilateral relationships to a more complex structure with a greater emphasis on central clearing. Central clearing will in some cases aid harmonization efforts, as cleared products are more standardized. A second challenge is the use of two different standards for exchanging trade information about derivatives products: Financial Information eXchange (FIX) and Financial Products Markup Language (FpML). The FIX and FpML standards evolved from different needs and in different markets, and both can represent all but the most esoteric derivative products. Initial regulatory reporting requirements have not referred to existing industry
Data Needs for Financial Stability Analysis 83
standards, but these standards will likely play a larger role as the process matures.
In November, CFTC Chairman Timothy Massad said the Commission was considering potential rule changes to improve data quality by allowing swap data repositories to validate and reject submissions from companies, and to hold companies accountable for how they report their data (see Massad, 2015).
Mortgage Markets
Individual residential real estate investments can have serious implications for financial stability, particularly when large numbers of borrowers simultaneously accumulate overwhelming debt through low-down-payment loans, withdrawing equity from their homes, and using mortgage products with slow or negative amortization rates.
Improvements in scope. Through loan-level data collec-tions, regulators now have significantly more granular infor-mation than before the financial crisis about the origination characteristics and performance of individual loans held on banks’ balance sheets. There have also been improvements in the data on mortgages securitized and owned by govern-ment-sponsored enterprises.
Since 2008, the Office of the Comptroller of the Currency (OCC) has collected monthly loan-level data from eight national banks with large mortgage servicing portfolios. In 2010, the FDIC began collecting quarterly loan-level information on the residential assets acquired from failed banks through loss-sharing agreements. In 2011, the Federal Reserve introduced a monthly loan-level data collection for 19 bank holding companies in the Comprehensive Capital Analysis and Review (CCAR). Additionally, the OCC and the CCAR data collections have attempted to match first and second liens that are owned or serviced by the same financial institutions, and the CFPB and the FHFA have made progress toward a national mortgage database.
Private vendors have also expanded data collections on mortgage performance and credit. Some vendors have loan-level performance and origination data volunteered by anon-ymous banks and nonbank servicers, capturing a segment of loans held in banks’ portfolios, loans securitized into agency mortgage-backed securities (MBS), and private-label MBS. Vendor databases contain origination characteristics and the performance of almost all loans securitized into pri-vate-label MBS. Anonymized credit data with mortgage and
non-mortgage information are also available to some regu-lators for a more comprehensive view of borrowers’ financial positions. However, mortgage borrowers’ equity positions cannot be assessed from credit data alone.
In October 2015, the Consumer Financial Protection Bureau (CFPB) revised the reporting requirements for the Home Mortgage Disclosure Act (HMDA) dataset to include a universal loan identifier (ULI) and the postal address of the property securing each mortgage loan. The revisions also require a LEI for the reporting entity and loan originator and include data fields to monitor the accumulation of risk in housing markets (see CFPB, 2015).
HMDA data are the most comprehensive data collection of U.S. mortgage originations and includes almost all new loans, except for some loans originated by small lenders. However, HMDA has two major drawbacks for monitoring financial vulnerabilities — the data have a significant time lag and they do not, by statute, include loan performance following origination. HMDA is currently collected annu-ally, and a subset of the data is made public about nine months after the end of the calendar year. Such a lengthy time interval makes it difficult to identify rapidly-changing market conditions. Beginning in 2020, however, financial institutions with large mortgage volumes will be required to report HMDA data quarterly.
HMDA’s introduction of a required ULI will allow regula-tors to follow a single loan through its lifecycle of purchases, repurchases, and other reporting events. The ability to view all transactions on a specific mortgage within a calendar year will help regulators better understand mortgage financing pathways. The ULI also lays the groundwork for a more comprehensive regulatory regime in which a single loan could potentially be tracked as it passes between lenders, is bundled into securities, or changes servicers. The prop-erty address may make it possible for regulators to match first liens and junior liens, which could help identify the accumulation of leverage in housing. Other data reported to HMDA such as the value of the home underlying the mortgage, the borrower’s credit score, the rate and loan amortization structure, and automated underwriting system results will also help regulators understand the risk profile of new originations.
Data gaps on subordinate liens. Subordinate liens such as home equity lines of credit are procyclical and were a major source of equity extraction during the housing bubble. Visibility into subordinate liens and borrowers’ equity may
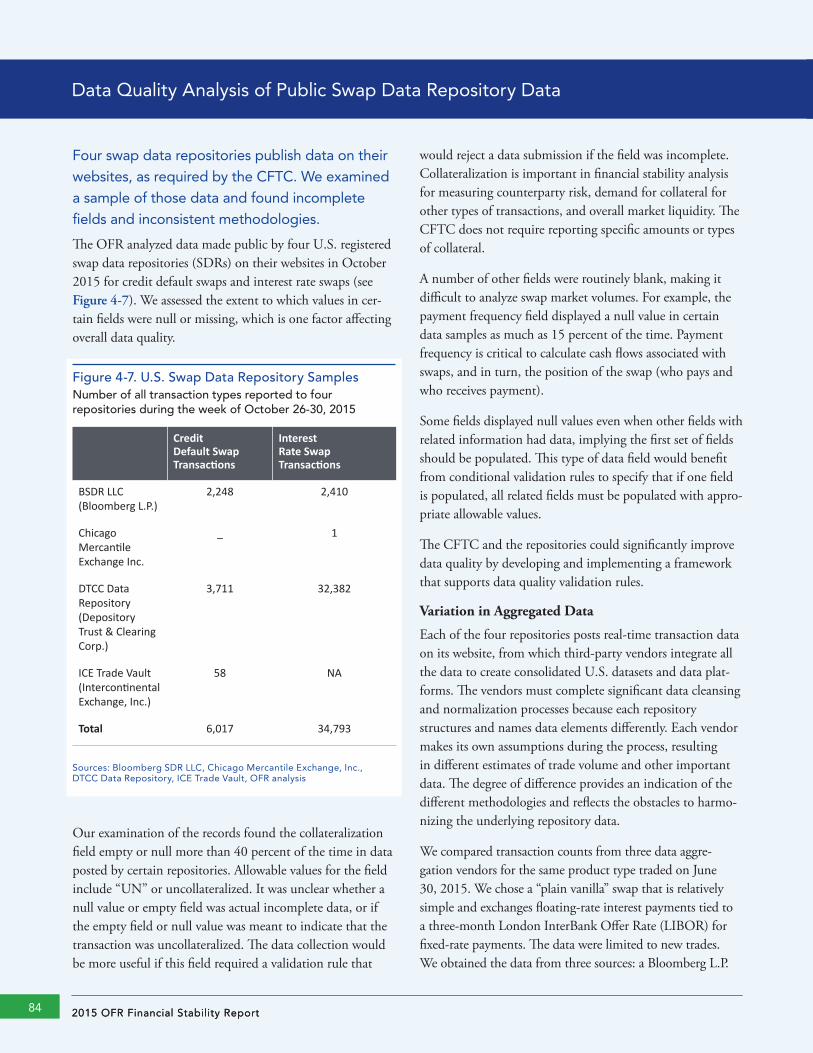
2015 OFR Financial Stability Report84 2015 OFR Financial Stability Report84
Data Quality Analysis of Public Swap Data Repository Data
Four swap data repositories publish data on their websites, as required by the CFTC. We examined a sample of those data and found incomplete fields and inconsistent methodologies.
The OFR analyzed data made public by four U.S. registered swap data repositories (SDRs) on their websites in October 2015 for credit default swaps and interest rate swaps (see Figure 4-7). We assessed the extent to which values in cer-tain fields were null or missing, which is one factor affecting overall data quality.
Figure 4-7. U.S. Swap Data Repository SamplesNumber of all transaction types reported to four repositories during the week of October 26-30, 2015
Credit Default Swap Transactions
Interest Rate Swap Transactions
BSDR LLC (Bloomberg L.P.)
2,248 2,410
Chicago Mercantile Exchange Inc.
_ 1
DTCC Data Repository (Depository Trust & Clearing Corp.)
3,711 32,382
ICE Trade Vault(Intercontinental Exchange, Inc.)
58 NA
Total 6,017 34,793
Sources: Bloomberg SDR LLC, Chicago Mercantile Exchange, Inc., DTCC Data Repository, ICE Trade Vault, OFR analysis
Our examination of the records found the collateralization field empty or null more than 40 percent of the time in data posted by certain repositories. Allowable values for the field include “UN” or uncollateralized. It was unclear whether a null value or empty field was actual incomplete data, or if the empty field or null value was meant to indicate that the transaction was uncollateralized. The data collection would be more useful if this field required a validation rule that
would reject a data submission if the field was incomplete. Collateralization is important in financial stability analysis for measuring counterparty risk, demand for collateral for other types of transactions, and overall market liquidity. The CFTC does not require reporting specific amounts or types of collateral.
A number of other fields were routinely blank, making it difficult to analyze swap market volumes. For example, the payment frequency field displayed a null value in certain data samples as much as 15 percent of the time. Payment frequency is critical to calculate cash flows associated with swaps, and in turn, the position of the swap (who pays and who receives payment).
Some fields displayed null values even when other fields with related information had data, implying the first set of fields should be populated. This type of data field would benefit from conditional validation rules to specify that if one field is populated, all related fields must be populated with appro-priate allowable values.
The CFTC and the repositories could significantly improve data quality by developing and implementing a framework that supports data quality validation rules.
Variation in Aggregated Data
Each of the four repositories posts real-time transaction data on its website, from which third-party vendors integrate all the data to create consolidated U.S. datasets and data plat-forms. The vendors must complete significant data cleansing and normalization processes because each repository structures and names data elements differently. Each vendor makes its own assumptions during the process, resulting in different estimates of trade volume and other important data. The degree of difference provides an indication of the different methodologies and reflects the obstacles to harmo-nizing the underlying repository data.
We compared transaction counts from three data aggre-gation vendors for the same product type traded on June 30, 2015. We chose a “plain vanilla” swap that is relatively simple and exchanges floating-rate interest payments tied to a three-month London InterBank Offer Rate (LIBOR) for fixed-rate payments. The data were limited to new trades. We obtained the data from three sources: a Bloomberg L.P.
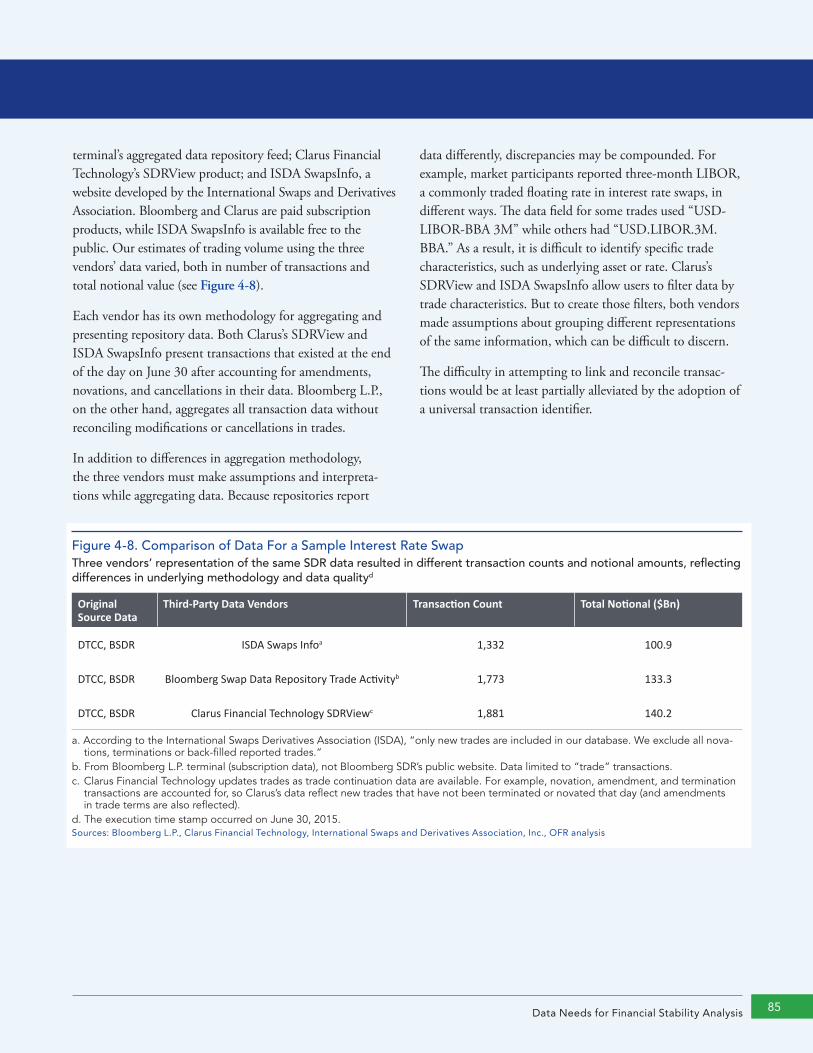
85Data Needs for Financial Stability Analysis 85
Figure 4-8. Comparison of Data For a Sample Interest Rate SwapThree vendors’ representation of the same SDR data resulted in different transaction counts and notional amounts, reflecting differences in underlying methodology and data qualityd
Original Source Data
Third-Party Data Vendors Transaction Count Total Notional ($Bn)
DTCC, BSDR ISDA Swaps Infoa 1,332 100.9
DTCC, BSDR Bloomberg Swap Data Repository Trade Activityb 1,773 133.3
DTCC, BSDR Clarus Financial Technology SDRViewc 1,881 140.2
a. According to the International Swaps Derivatives Association (ISDA), “only new trades are included in our database. We exclude all nova-tions, terminations or back-filled reported trades.”
b. From Bloomberg L.P. terminal (subscription data), not Bloomberg SDR’s public website. Data limited to “trade” transactions.c. Clarus Financial Technology updates trades as trade continuation data are available. For example, novation, amendment, and termination
transactions are accounted for, so Clarus’s data reflect new trades that have not been terminated or novated that day (and amendments in trade terms are also reflected).
d. The execution time stamp occurred on June 30, 2015.Sources: Bloomberg L.P., Clarus Financial Technology, International Swaps and Derivatives Association, Inc., OFR analysis
terminal’s aggregated data repository feed; Clarus Financial Technology’s SDRView product; and ISDA SwapsInfo, a website developed by the International Swaps and Derivatives Association. Bloomberg and Clarus are paid subscription products, while ISDA SwapsInfo is available free to the public. Our estimates of trading volume using the three vendors’ data varied, both in number of transactions and total notional value (see Figure 4-8).
Each vendor has its own methodology for aggregating and presenting repository data. Both Clarus’s SDRView and ISDA SwapsInfo present transactions that existed at the end of the day on June 30 after accounting for amendments, novations, and cancellations in their data. Bloomberg L.P., on the other hand, aggregates all transaction data without reconciling modifications or cancellations in trades.
In addition to differences in aggregation methodology, the three vendors must make assumptions and interpreta-tions while aggregating data. Because repositories report
data differently, discrepancies may be compounded. For example, market participants reported three-month LIBOR, a commonly traded floating rate in interest rate swaps, in different ways. The data field for some trades used “USD-LIBOR-BBA 3M” while others had “USD.LIBOR.3M.BBA.” As a result, it is difficult to identify specific trade characteristics, such as underlying asset or rate. Clarus’s SDRView and ISDA SwapsInfo allow users to filter data by trade characteristics. But to create those filters, both vendors made assumptions about grouping different representations of the same information, which can be difficult to discern.
The difficulty in attempting to link and reconcile transac-tions would be at least partially alleviated by the adoption of a universal transaction identifier.
2015 OFR Financial Stability Report86
remain limited in certain ways even with the revised HMDA reporting requirements. Although HMDA data will help regulators match first liens and junior liens, there may still be challenges identifying junior liens attached to properties securing specific loans held by a mortgage lender or bank.
The status of liens will remain difficult to monitor. Because HMDA tracks only originations, regulators cannot see if a subordinate lien has been paid down or extinguished. Also, HMDA data may help match subordinate liens associated with first liens that are not included in regulatory collections of loan-level performance data (such as privately- securitized loans and loans held by nonbanks and small banks). However, the HMDA dataset cannot identify the holders of the first liens.
Data gaps from regulatory arbitrage and shift to non-banks. Regulators should be forward-looking in designing data collection strategies. Although a historically large share of the mortgage market is currently visible to regula-tors following a rapid increase in the share of outstanding mortgages backed by Fannie Mae and Freddie Mac, or with Federal Housing Administration (FHA) insurance, the distribution of mortgage credit risk and servicing rights across well-regulated and less-regulated (nonbank) sectors is shifting. As markets evolve, regulators cannot be sure they will retain a comprehensive view of the risks with out-standing mortgages through existing datasets.
Regulatory efforts to contain risks may shrink the share of loans visible to regulators as mortgage activity moves from large banks, the GSEs, and FHA to less-regulated nonbank financial institutions whose mortgages may not be timely captured by data vendors. For example, if private MBS mar-kets do not recover, smaller banks, hedge funds, real estate investment trusts, and pension funds may increase their investments in whole loans. Additionally, both nonbank servicers and nonbank originators have gained market share in recent years. Such loans can be difficult to track if they do not terminate in a mortgage backed by a GSE or the FHA.
Regulators must balance between the value of keeping mortgages visible and increasing prudential regulation on mortgage lending. Regulatory arbitrage opportunities for mortgage lenders can shift mortgage risk to less-regulated sectors, creating unobservable risks to the financial system.
Regulators’ loan-level data collections and private vendor databases typically contain more than 50 data fields, and several of the fields such as loan-to-value ratios and credit
scores are especially critical to financial stability risk mod-eling (see Figure 4-9). Credit information is anonymized in vendor databases so that users cannot directly identify individual borrowers.
Problems with regulatory data sharing and efforts toward data integration. The lack of data sharing among financial regulators leads to unnecessarily narrow views of the mort-gage market and, in some cases, redundant data collections. For example, the OCC’s mortgage metrics are largely a sub-sample of the Federal Reserve’s CCAR data collection. Seven of the eight large mortgage servicers included in the OCC survey also submit CCAR data through their bank holding companies, and the CCAR data collection covers most data fields collected by the OCC.
The National Mortgage Database, a project initiated in 2011 by the CFPB and the Federal Housing Finance Agency (FHFA), seeks to expand regulators’ view. The database creates a representative, anonymous sample of first-lien mortgage borrowers using anonymized credit reports. It matches these data to the borrowers’ first-lien characteris-tics — including mortgage terms and property information — through a third-party using anonymized data from the FHFA, FHA, and Department of Veterans Affairs along with private data sources. At no point in the matching pro-cess is any individual directly identifiable to either the CFPB or FHFA. The agencies providing mortgage data to the national database currently cover about three-quarters of the sample of credit files, reflecting a sharp rise in agency market share since the financial crisis. The database is intended for use by federal regulators, government-sponsored enterprises, and the Federal Home Loan Banks. The database is not yet available and policies for access have not yet been established (see Avery and others, 2015).
The national database will bring better visibility into mort-gage markets and may help policymakers identify excess accumulation of unpriced housing risk in the economy. However, the database may be less useful during a housing bubble when standard mortgage products lose market share to alternative products, because much of the database is supplied by agencies that primarily back standard, fixed-rate conforming loans on owner-occupied properties. For this reason and others, direct, anonymized loan-level data sharing by all regulators remains important.
Unique loan identifier. A key obstacle to data sharing is that a mortgage loan does not have a unique identification number that follows it when transferred among originators,
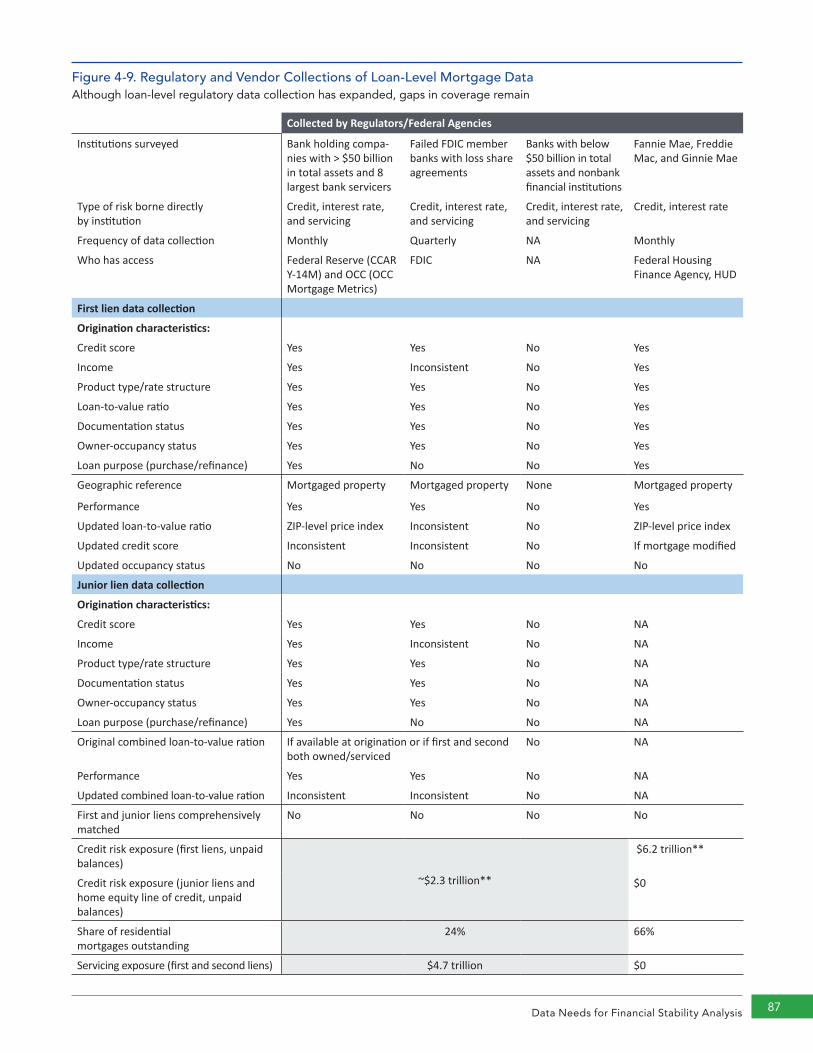
Data Needs for Financial Stability Analysis 87
Figure 4-9. Regulatory and Vendor Collections of Loan-Level Mortgage DataAlthough loan-level regulatory data collection has expanded, gaps in coverage remain
Collected by Regulators/Federal Agencies
Institutions surveyed Bank holding compa-nies with > $50 billion in total assets and 8 largest bank servicers
Failed FDIC member banks with loss share agreements
Banks with below $50 billion in total assets and nonbank financial institutions
Fannie Mae, Freddie Mac, and Ginnie Mae
Type of risk borne directly by institution
Credit, interest rate, and servicing
Credit, interest rate, and servicing
Credit, interest rate, and servicing
Credit, interest rate
Frequency of data collection Monthly Quarterly NA Monthly
Who has access Federal Reserve (CCAR Y-14M) and OCC (OCC Mortgage Metrics)
FDIC NA Federal Housing Finance Agency, HUD
First lien data collection
Origination characteristics:
Credit score Yes Yes No Yes
Income Yes Inconsistent No Yes
Product type/rate structure Yes Yes No Yes
Loan-to-value ratio Yes Yes No Yes
Documentation status Yes Yes No Yes
Owner-occupancy status Yes Yes No Yes
Loan purpose (purchase/refinance) Yes No No Yes
Geographic reference Mortgaged property Mortgaged property None Mortgaged property
Performance Yes Yes No Yes
Updated loan-to-value ratio ZIP-level price index Inconsistent No ZIP-level price index
Updated credit score Inconsistent Inconsistent No If mortgage modified
Updated occupancy status No No No No
Junior lien data collection
Origination characteristics:
Credit score Yes Yes No NA
Income Yes Inconsistent No NA
Product type/rate structure Yes Yes No NA
Documentation status Yes Yes No NA
Owner-occupancy status Yes Yes No NA
Loan purpose (purchase/refinance) Yes No No NA
Original combined loan-to-value ration If available at origination or if first and second both owned/serviced
No NA
Performance Yes Yes No NA
Updated combined loan-to-value ration Inconsistent Inconsistent No NA
First and junior liens comprehensively matched
No No No No
Credit risk exposure (first liens, unpaid balances)
~$2.3 trillion**
$6.2 trillion**
Credit risk exposure (junior liens and home equity line of credit, unpaid balances)
$0
Share of residential mortgages outstanding
24% 66%
Servicing exposure (first and second liens) $4.7 trillion $0
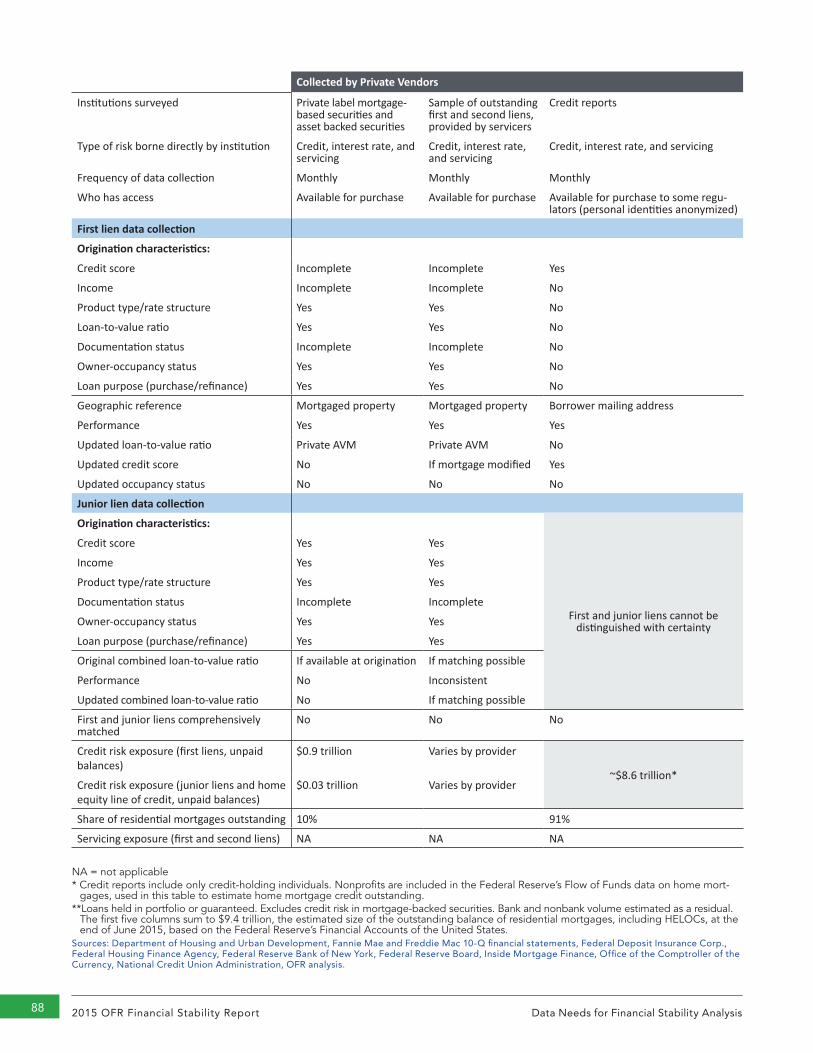
2015 OFR Financial Stability Report88 Data Needs for Financial Stability Analysis
Collected by Private Vendors
Institutions surveyed Private label mortgage- based securities and asset backed securities
Sample of outstanding first and second liens, provided by servicers
Credit reports
Type of risk borne directly by institution Credit, interest rate, and servicing
Credit, interest rate, and servicing
Credit, interest rate, and servicing
Frequency of data collection Monthly Monthly Monthly
Who has access Available for purchase Available for purchase Available for purchase to some regu-lators (personal identities anonymized)
First lien data collection
Origination characteristics:
Credit score Incomplete Incomplete Yes
Income Incomplete Incomplete No
Product type/rate structure Yes Yes No
Loan-to-value ratio Yes Yes No
Documentation status Incomplete Incomplete No
Owner-occupancy status Yes Yes No
Loan purpose (purchase/refinance) Yes Yes No
Geographic reference Mortgaged property Mortgaged property Borrower mailing address
Performance Yes Yes Yes
Updated loan-to-value ratio Private AVM Private AVM No
Updated credit score No If mortgage modified Yes
Updated occupancy status No No No
Junior lien data collection
Origination characteristics:
Credit score Yes Yes
First and junior liens cannot be distinguished with certainty
Income Yes Yes
Product type/rate structure Yes Yes
Documentation status Incomplete Incomplete
Owner-occupancy status Yes Yes
Loan purpose (purchase/refinance) Yes Yes
Original combined loan-to-value ratio If available at origination If matching possible
Performance No Inconsistent
Updated combined loan-to-value ratio No If matching possible
First and junior liens comprehensively matched
No No No
Credit risk exposure (first liens, unpaid balances)
$0.9 trillion Varies by provider
~$8.6 trillion*Credit risk exposure (junior liens and home equity line of credit, unpaid balances)
$0.03 trillion Varies by provider
Share of residential mortgages outstanding 10% 91%
Servicing exposure (first and second liens) NA NA NA
NA = not applicable* Credit reports include only credit-holding individuals. Nonprofits are included in the Federal Reserve’s Flow of Funds data on home mort-
gages, used in this table to estimate home mortgage credit outstanding.**Loans held in portfolio or guaranteed. Excludes credit risk in mortgage-backed securities. Bank and nonbank volume estimated as a residual.
The first five columns sum to $9.4 trillion, the estimated size of the outstanding balance of residential mortgages, including HELOCs, at the end of June 2015, based on the Federal Reserve’s Financial Accounts of the United States.
Sources: Department of Housing and Urban Development, Fannie Mae and Freddie Mac 10-Q financial statements, Federal Deposit Insurance Corp., Federal Housing Finance Agency, Federal Reserve Bank of New York, Federal Reserve Board, Inside Mortgage Finance, Office of the Comptroller of the Currency, National Credit Union Administration, OFR analysis.
Data Needs for Financial Stability Analysis 89
servicers, and investors. Regulators should consider using the unique HMDA identifiers recently introduced by the CFPB in regulatory databases to ease future data sharing.
Unique parcel identifier. A second major obstacle to data sharing is that the United States, unlike most industrialized nations, does not have a uniform system of identifying property records. Postal addresses are often used as property identifiers, but they can generate errors in title transfers and in data integrity. Unique parcel identifiers are needed to link underlying legal claims on a property and finan-cial instruments derived from the claims, resolving the problem of matching numerous claims on a single property. Unique identifiers would also improve the integrity of data used to generate repeat-sales house price indexes, which are important for understanding leverage. Several govern-ment entities and industry groups, including the Mortgage Industry Standards Maintenance Organization, have called for unique identifiers. Because a unique parcel identifier carries similar information to a postal address, it should be treated similarly for privacy purposes.
Standardization to increase transparency and minimize losses during crises. Undertaking data standardization during noncrisis times can minimize losses during future financial crises when entities fail and mortgage loan data must be transferred rapidly. Two specific areas where data standardization is needed are outlined below.
A theme throughout this chapter is the need for financial firms and their subsidiaries to have legal entity identifiers. The housing finance system is a complex web of actors. Different parties often bear responsibility for underwriting, securitizing, servicing, insuring, and reinsuring mortgage credit and interest rate risk. Financial institutions use repurchase agreements and both collateralized and uncol-lateralized lending to fund mortgage originations. With its new rule, the CFPB now requires that reporters to HMDA include their own LEI and that of each loan’s originator (see CFPB, 2015). Universal adoption of LEIs in contracts relating to the funding, underwriting, securitizing, servicing, insuring, and reinsuring of mortgage credit and interest rate risk would greatly simplify the legal landscape for regulators and market participants. The U.S. mortgage industry con-tinues to lag in using LEIs.
As mortgage loans are purchased and sold or servicing rights are transferred between entities, critical data must migrate from one entity’s servicing platform to another. Disarray in servicing data can magnify losses during episodes of
widespread mortgage distress. A standard set of timely, accurate documents and a common set of data elements with standardized definitions would improve transfer of loan servicing rights and could significantly reduce error and confusion in the transfer process.
Insurance
Insurers are primarily regulated by state insurance depart-ments that generally follow the statutory accounting policies and procedures promulgated by the National Association of Insurance Commissioners (NAIC). Financial statements filed with state regulators are the most reliable source of public information for U.S. insurance companies, but permitted deviations make it difficult to compare data across the industry. SEC financial statements are another major source of information, but typically are not available for insurers that are mutual companies or U.S. subsidiaries of foreign parents. Further, they are based on Generally Accepted Accounting Principles (GAAP), making compar-ison with state filings difficult.
Insurance companies’ state filings follow the reporting guide-lines and framework outlined in the NAIC’s accounting practices and procedures manual. However, a state regulator can grant a company’s request to use “permitted practices” that deviate from NAIC standards. While companies must disclose the impact of “permitted practices” on net income and capital and surplus, the reporting inconsistencies make it harder to analyze and compare industry data. It is unclear how extensively regulators have allowed “permitted practices,” and the practice probably varies by state. Some regulators have expressed concern that too much flexibility by states in the treatment of insurance risks could encourage regulatory arbitrage by companies.
Captive Reinsurance Data
The lack of transparency in the activities of captive reinsurers within the U.S. life insurance industry is an area where more comprehensive access to additional data is needed.
Some life insurance firms create wholly-owned captives to transfer and reinsure risk or to obtain less expensive sources of funding. The use of captives can be motivated by tax ben-efits and relief from reserve requirements. An insurer receives reserve credit when it transfers or cedes a portion of its risk to a captive reinsurer and can use the credit to reduce the total amount of reserves it must hold.

2015 OFR Financial Stability Report90
Relatively little information is publicly available about captives’ activities, capitalization, asset liability management, types of businesses reinsured, and the resulting reserve and capital benefits to the parent, or ceding, insurer (see Figure 4-10). The U.S. Treasury Department’s Federal Insurance Office noted in its 2014 annual report the lack of uniform and transparent solvency oversight of captives among states where captives are based (see FIO, 2014).
In 2014, NAIC enhanced reporting requirements for all term life insurance and universal life secondary guarantee (ULSG) transactions, which account for about two-thirds of life insurers’ use of captives. The new requirements were intended to provide additional information about reserves and collateral supporting insurers’ term and ULSG transac-tions. While these expanded disclosures show the absolute levels of reserves ceded for term life and ULSG, material data gaps remain because the filings give little insight into the effect of captive transactions on the primary insurer’s risk-based capital ratio and the captive’s balance sheet, cap-ital, and potential maturity mismatches.
The NAIC 2014 instructions for completing the enhanced disclosures allowed certain captives to be exempt from completing the detailed asset information (see Figure 4-11). Changes to the NAIC 2015 instructions may address some of these data gaps.
Disclosures by variable annuity captives. NAIC this year established a working group to study and address disclo-sures and regulatory issues with variable annuity captives. The life insurance industry has proposed disclosures about variable annuity transactions ceded to captives, including the type of benefits reinsured, reserve credit taken, value of the assets supporting the variable annuities, and the nature and amount of collateral supporting any reserve credit taken. These disclosures are expected to be included in year-end 2015 statutory filings with more enhancements being developed.
The disclosure proposal addresses only variable annuity transactions with captives and, unlike the supplemental filing requirements for term and ULSG transactions, does not apply to transactions ceded to third-party reinsurers. The proposal contains the same six categories of exemptions from disclosure requirements included for term and ULSG reinsurance transactions which are licensed, accredited or certified reinsurers, reinsurers domiciled in another jurisdic-tion with similar standards, reinsurers that maintain a trust fund, and reinsurance required by law.
Figure 4-10. Life Insurance Company Financial Reporting Requirements Captives are not subject to the same reporting requirements as insurers
Securities and Exchange Commission
State Insurance Filings
Insurance Company (Stock company)
Yes, if publicly- traded Yes
Insurance Company (Mutual)* No Yes
Reinsurance Company
Yes, if publicly- traded Yes
Captive Reinsurer** No No
*A limited number of mutual insurance companies, which are owned by policyholders, file financial statements with the Securities and Exchange Commission.** Financial statements are generally not available for captive reinsurers. Iowa-domiciled captive reinsurers’ financial statements are available on the Iowa Insurance Division’s website. Certain states require some captives to file financial statements with the NAIC. However, these financial state-ments are generally not publicly available.Source: OFR analysis
Figure 4-11. Captive Life Insurer Exemptions from Asset DisclosuresNearly half of captive transactions (by value) were exempt from completing Parts 2-4 of NAIC’s 2014 Reinsurance Supplement
Reserve Credit Taken ($ billions)
Percent of Reserve Credit Taken
Licensed Reinsurer 20.9 15%
Accredited Reinsurer 8.1 6%
Reinsurer Domiciled in another Jurisdiction 1.9 1%
Reinsurer Maintains Trust Fund 17.2 12%
Multiple Exemptions 14.0 10%
Total $62.1 45%
Note: As of December 31, 2014, reserve credit taken by life insurance companies totaled $213.4 billion, of which $138.6 billion was for term life and universal life secondary guarantee life insurance.Sources: SNL Financial LLC, OFR analysis
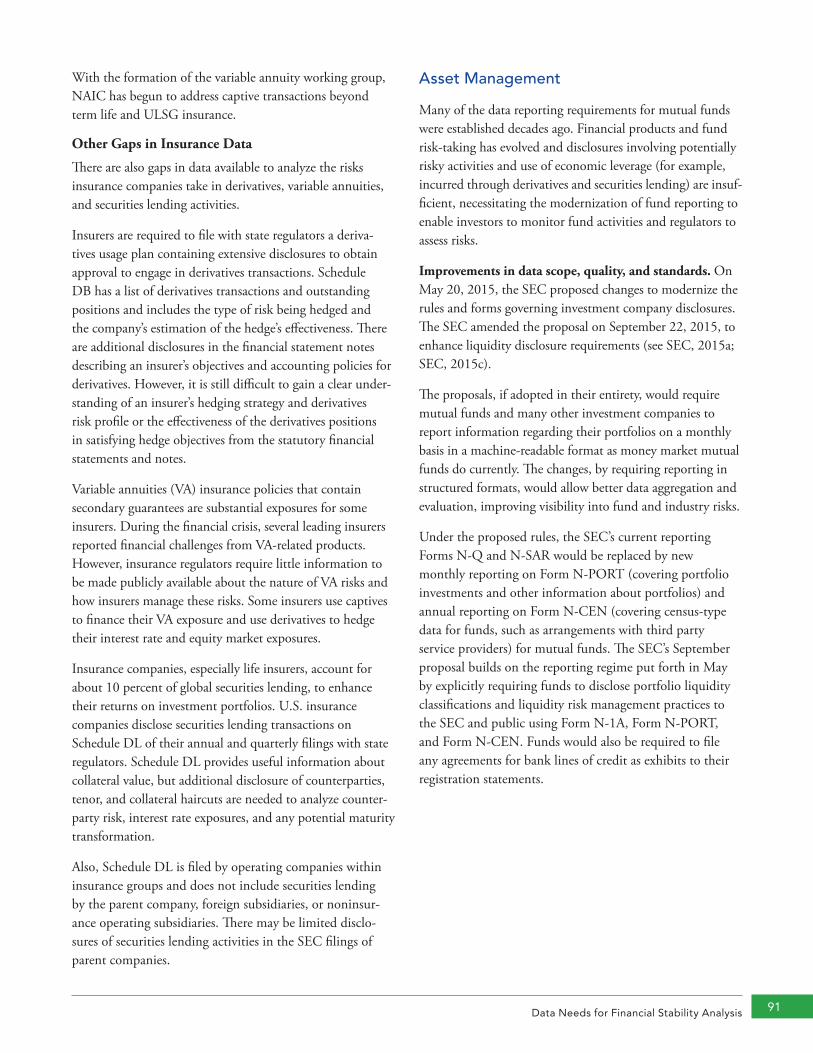
Data Needs for Financial Stability Analysis 91
With the formation of the variable annuity working group, NAIC has begun to address captive transactions beyond term life and ULSG insurance.
Other Gaps in Insurance Data
There are also gaps in data available to analyze the risks insurance companies take in derivatives, variable annuities, and securities lending activities.
Insurers are required to file with state regulators a deriva-tives usage plan containing extensive disclosures to obtain approval to engage in derivatives transactions. Schedule DB has a list of derivatives transactions and outstanding positions and includes the type of risk being hedged and the company’s estimation of the hedge’s effectiveness. There are additional disclosures in the financial statement notes describing an insurer’s objectives and accounting policies for derivatives. However, it is still difficult to gain a clear under-standing of an insurer’s hedging strategy and derivatives risk profile or the effectiveness of the derivatives positions in satisfying hedge objectives from the statutory financial statements and notes.
Variable annuities (VA) insurance policies that contain secondary guarantees are substantial exposures for some insurers. During the financial crisis, several leading insurers reported financial challenges from VA-related products. However, insurance regulators require little information to be made publicly available about the nature of VA risks and how insurers manage these risks. Some insurers use captives to finance their VA exposure and use derivatives to hedge their interest rate and equity market exposures.
Insurance companies, especially life insurers, account for about 10 percent of global securities lending, to enhance their returns on investment portfolios. U.S. insurance companies disclose securities lending transactions on Schedule DL of their annual and quarterly filings with state regulators. Schedule DL provides useful information about collateral value, but additional disclosure of counterparties, tenor, and collateral haircuts are needed to analyze counter-party risk, interest rate exposures, and any potential maturity transformation.
Also, Schedule DL is filed by operating companies within insurance groups and does not include securities lending by the parent company, foreign subsidiaries, or noninsur-ance operating subsidiaries. There may be limited disclo-sures of securities lending activities in the SEC filings of parent companies.
Asset Management
Many of the data reporting requirements for mutual funds were established decades ago. Financial products and fund risk-taking has evolved and disclosures involving potentially risky activities and use of economic leverage (for example, incurred through derivatives and securities lending) are insuf-ficient, necessitating the modernization of fund reporting to enable investors to monitor fund activities and regulators to assess risks.
Improvements in data scope, quality, and standards. On May 20, 2015, the SEC proposed changes to modernize the rules and forms governing investment company disclosures. The SEC amended the proposal on September 22, 2015, to enhance liquidity disclosure requirements (see SEC, 2015a; SEC, 2015c).
The proposals, if adopted in their entirety, would require mutual funds and many other investment companies to report information regarding their portfolios on a monthly basis in a machine-readable format as money market mutual funds do currently. The changes, by requiring reporting in structured formats, would allow better data aggregation and evaluation, improving visibility into fund and industry risks.
Under the proposed rules, the SEC’s current reporting Forms N-Q and N-SAR would be replaced by new monthly reporting on Form N-PORT (covering portfolio investments and other information about portfolios) and annual reporting on Form N-CEN (covering census-type data for funds, such as arrangements with third party service providers) for mutual funds. The SEC’s September proposal builds on the reporting regime put forth in May by explicitly requiring funds to disclose portfolio liquidity classifications and liquidity risk management practices to the SEC and public using Form N-1A, Form N-PORT, and Form N-CEN. Funds would also be required to file any agreements for bank lines of credit as exhibits to their registration statements.
2015 OFR Financial Stability Report92
Figure 4-12. Securities Lending By Lender Type (percent)Registered investment funds account for a fraction of securities lending activity
0
10
20
30
40
50
60
70
80
90
100
2008 2009 2010 2011 2012 2013 2014 2015
Mutual funds
Insurance companies
Government
Corpora�ons
Re�rement and pension funds
Endowments
Founda�ons
Source: Markit Group Ltd.
Reporting on various activities in funds’ financial statements would also be enhanced under the proposed amendments to Regulation S-X, which prescribes the content and the forms of financial statements. The forms would provide more information on funds’ derivatives positions, repo activities, securities lending practices, and asset liquidity in a machine-readable data format. Required reporting would include the name of each counterparty and collateral management practices. Many of the proposed amendments to Regulation S-X are consistent with the new monthly reporting requirements on Form N-PORT.
These additional disclosures only apply to certain registered investment companies subject to SEC jurisdiction and would exclude other participants that make up a substantial part of repo and securities lending markets. For example, due to a lack of rulemaking authority, the SEC rule would not cover the securities lending activity of entities such as pension funds, endowments, foundations, and insurance companies. These market participants would not have to provide information, and the transparency of the securities lending market as a whole would remain limited.
The OFR’s interagency data collection pilot, which aims to enhance transparency of repo and securities lending activities across markets, would provide broader and more granular data about these particular markets. The data collection
pilot relies on information provided by the largest securities lending agents and, encompasses a broad range of securi-ties lenders beyond investment companies (see Baklanova, Copeland, and McCaughrin, 2015).
Figure 4-12 illustrates the share of the market covered by the SEC data, which are focused on investment companies. The OFR collection includes all types of lenders. The SEC data collection of securities lending information from registered funds is not a substitute for the OFR interagency pilot, which is intended to support cross-market monitoring of repo and securities lending activity and inform any potential marketwide policy actions.
The OFR and the SEC are working together to minimize any unnecessary overlap in data collections. Where possible, reporting definitions and data standards should be consis-tent across the SEC and OFR collections. The OFR also welcomes efforts by financial regulators, both domestically and overseas, to improve data quality by enforcing data and industry standards such as the LEI.
Separately managed accounts data. The SEC has pro-posed amendments to Form ADV for registered invest-ment advisers to enhance reporting for separately managed accounts (SMAs), which are portfolios of assets or securities directly owned by investors and managed by professional investment firms. The proposed Form ADV amendments would provide certain baseline information regarding advisers’ separately managed account businesses, including investment composition, derivatives use, and borrowing (see SEC, 2015a).
The OFR’s 2013 report, Asset Management and Financial Stability, noted the data gap associated with separately managed accounts. Granular information about the hold-ings in these accounts, which are estimated to be worth tens of trillions of dollars, is essential to understanding the use of derivatives and borrowings by advisers in separately man-aged accounts and how these activities potentially give rise to systemic risk. The SEC’s proposal would collect basic data about accounts managed by registered investment advisers, but not accounts managed by banks with trust powers, which are outside the SEC’s jurisdiction. Standardized data for both account types are needed to fully assess potential financial stability risks. Data may need to be collected confi-dentially to provide sufficient granularity to identify risks.
Problems with data scope and consistency on fund sources of liquidity. The recent proposed amendments

Data Needs for Financial Stability Analysis 93
to the reporting requirements that the SEC outlined in May 2015 seek to enhance disclosure about liquidity and redemptions practices (see SEC, 2015b). A key element would involve the classification of each fund holding into one of six liquidity buckets according to the length of time required to convert fund positions into cash. Specific guid-ance on the factors funds should consider when assessing portfolio liquidity was provided in the proposed rule, although the proposal does not specify that certain asset classes or securities fall within particular liquidity categories. This could result in inconsistency in asset liquidity classifica-tions across funds, and warrants monitoring.
The proposal would require funds to disclose information regarding methods used to satisfy redemptions, including bank lines of credit and inter-fund borrowings. The pro-posal also acknowledges that funds use cross-trading as an additional liquidity tool, but would not establish disclo-sure requirements for cross-trading within fund families. Although the current guidance relating to Rule 17a-7 of the 1940 Investment Company Act contains provisions limiting portfolio cross-trading to liquid assets, under certain market conditions the unwinding of a very large security position (which might be considered liquid under normal market circumstances) could place sufficient downward pressure on prices such that a fund’s adviser might prefer cross trades to external sales. Additional disclosure of these activities would help investors and regulators assess cross-trading practices and better understand the circumstances under which cross-trading is used.
Cash and Liquidity Management in Money Markets
Since the financial crisis, regulators have improved data availability on the management of cash and liquidity in short-term U.S. markets.
The SEC introduced Form N-MFP in 2010 to collect data about money market mutual funds after regulators were unable to fully identify and respond to money market fund vulnerabilities during the crisis. Form N-MFP data are designed to analyze the portfolio holdings and risk character-istics of individual money market funds and industry trends.
The SEC adopted Form PF in 2011 to assess the poten-tial systemic risk presented by large private fund advisors, a group that includes private liquidity funds. The SEC recently finalized amendments to Form PF to align the frequency and granularity of portfolio data required from
private liquidity funds with those of money market funds (see SEC, 2014a). The change will be effective in April 2016 and will make it possible for the OFR to link the Form PF data with Form N-MFP data.
A third dataset, collected by the OCC for banking super-vision, requires national banks, federal savings associa-tions, and branches of foreign banks managing short-term investment funds to disclose monthly information about the funds’ total assets under management, asset pricing, and specific securities held in the portfolio. This data collection began in 2013 and the data are structured in a way generally consistent with the Form N-MFP dataset. The two data sources could be linked together.
Problems with data scope. Under the OCC’s data collection only national banks and federally-registered branches of foreign banks are required to report data about their portfolios, which collectively manage about $135 billion (see Figure 4-13). Similar funds that are managed by state-regulated banks are not subject to the same portfolio disclosure requirements and often report only assets under management. These funds manage about $150 billion in short-term assets.
Figure 4-13. Cash Management Vehicles by Type, Size, and Regulator ($ billion) Money market funds are by far the largest cash management option
State Banks short-term investment funds $150
Na�onal Banksshort-term investment funds$135
Parallel Managed Accountsassociated with liquidity funds $359Liquidity
Funds$288Money Market
Funds$3,009
Securi�es and Exchange Commission Office of the Comptroller of the CurrencyState regulators
Data collected by:
Note: SEC data are as of March 31, 2015. OCC data are as of June 30, 2014. State regulatory data are as of December 31, 2014. Sources: Federal Financial Institutions Examination Council quarterly bank call reports, Office of the Comptroller of the Currency, Securities and Exchange Commission Form PF and Form N-MFP, OFR analysis
2015 OFR Financial Stability Report94
At the international level, no European regulator collects granular portfolio holdings data needed for market mon-itoring. Data for European money market funds, which have about $1.2 trillion of assets under management, would enhance the OFR’s analysis of the global allocation of short-term capital.
Benefits of access and sharing. The SEC shares Form N-MFP and Form PF data regularly with the OFR, and the OCC shares investment funds data with us. We are using the SEC datasets to examine potential threats and vulnerabilities to interconnected segments of financial markets. Form N-MFP data provide high visibility into the repurchase agreement (repo) market even though Form N-MFP was not specifically intended for this purpose. Money market mutual funds are among the most active investors in the repo markets and are required to report granular information on their repo holdings, including names of counterparties and collateral securities. No other financial firms report the same level of detail about repo activities as money market funds do on Form N-MFP. By sharing these data, the SEC and OCC are enabling the data collections to provide an additional benefit to the public — in addition to the original purposes for these data collections.
Benefits of standards. We are exploring linking the SEC’s data on money market mutual funds and on private liquidity funds with the OCC’s data on short-term invest-ment funds in a prototype Money Market Fund Monitor to
produce a more comprehensive analysis that could be shared with other regulators. This linking is made possible by the alignment of these three data sets by the SEC and OCC — SEC’s Form N-MFP, SEC’s Form PF, and OCC’s data on short-term investment funds. Linking these data can help us track connections, funding, and liquidity risks among issuers, investors, and financial intermediaries across the United States.
Further, both Form N-MFP and Form PF data are collected in a machine readable format that allows for automated validation and eases sharing and integration of data.
The LEI is not required in any of the three collections and is not widely used in them. Maps to link their proprietary identifiers and the different spellings of entity names must be built and maintained. Processes such as entity resolution algorithms using text matching and statistical probability are utilized, followed by additional review by a data analyst to confirm or correct linkages. Data quality work is also needed because of the lack of a mandatory financial product classification system. (An ISO standard, the Classification of Financial Instruments, was recently updated for the first time in 10 years, so it now covers a wider variety of instru-ments, but it is not mandatory.) Existing classifications for financial products and asset types lack uniformity, leading to similar assets being classified as different types by the filers. A range of techniques must be used to accurately and efficiently match these data for meaningful analysis.
Research on Financial Stability 95
The OFR has a mandate to promote the understanding of factors affecting financial stability through our research. This chapter highlights key findings
and ongoing research questions from four important OFR research topics: (1) assessing risks posed by central counterparties; (2) evaluating stress tests as a macroprudential tool; (3) analyzing how crises spread through financial networks; and (4) assessing risks in asset management activities.
5.1 Research AgendaThe OFR’s fundamental research agenda supports our mandate to: (1) help develop metrics that can be used by practitioners to monitor financial stability risks; (2) assess the causes and consequences of financial crises, both through empirical analysis and model development; (3) analyze and contribute to the improvement of financial stability policy and risk management practices; and (4) improve the scope, quality, and accessibility of financial data. In pursuing these goals, OFR research seeks to complement the work of others by filling gaps and taking a systemwide approach. We prioritize areas where the risks appear to be particularly significant or poorly understood.
In the past year, the OFR has published over 30 working papers and briefs. This chapter focuses on four research projects that have already had significant results.
First, we have made it a priority to identify, assess, measure, and monitor risks potentially posed by central counterparties (CCPs). The Dodd-Frank Act mandated that certain standardized swaps and many over-the-counter derivatives be centrally cleared through CCPs. Although CCPs likely have many benefits, they also carry risks. Two OFR papers published in 2015 discuss these potential risks. Capponi, Cheng, and Rajan (2015) show that the concentration of large clearing members in a CCP can grow over time and that this concentration can increase the exposure of a CCP if a clearing member were to fail. Glasserman, Moallemi, and Yuan (2015) show that CCP margin charges collectively create incentives for swap dealers to split their positions among multiple CCPs, effectively obscuring potential liquidation costs from each CCP.
Second, we have begun to carry out our statutory mandate to evaluate stress testing practices (see Section 5.3). Stress testing was originally applied to individual firms to evaluate firm resilience, but it can also be adapted to promote financial stability monitoring and risk assessment. OFR research such as Flood and Korenko (2015), as well as Glasserman, Kang, and Kang (2015), has discussed general methods for stress scenario selection; Bookstaber, Paddrik, and Tivnan (2014) and Levy-Carciente and others (2015) explored tools for systemwide stress testing. Stress tests need to adapt as firms change business models. For example, in retrospect, we would want a pre-crisis stress test of insurance giant American International Group Inc. (AIG) to identify and analyze the risks to other companies as its business model shifted toward securities lending and the sale of credit default swaps to banks. A recent OFR Brief discussed how stress tests could also be adapted to incorporate four types of shocks — credit, funding, liquidity, and collateral values (see Cetina, 2015).
Similar to stress testing, another OFR topic uses network models to analyze potential transmission channels of financial stress, changing business models, and risk-shifting among firms (see Section 5.4). OFR researchers have taken several approaches to network analysis. One approach uses financial maps to illustrate real-world intercon-nections among financial institutions and markets. For example, a paper last year mapped sources and uses for liquidity and funding in securities financing transactions (see Aguiar, Bookstaber, and Wipf, 2014). A second approach uses analytical techniques, such as agent-based models to animate these networks (see Bookstaber,
Research on Financial Stability 5
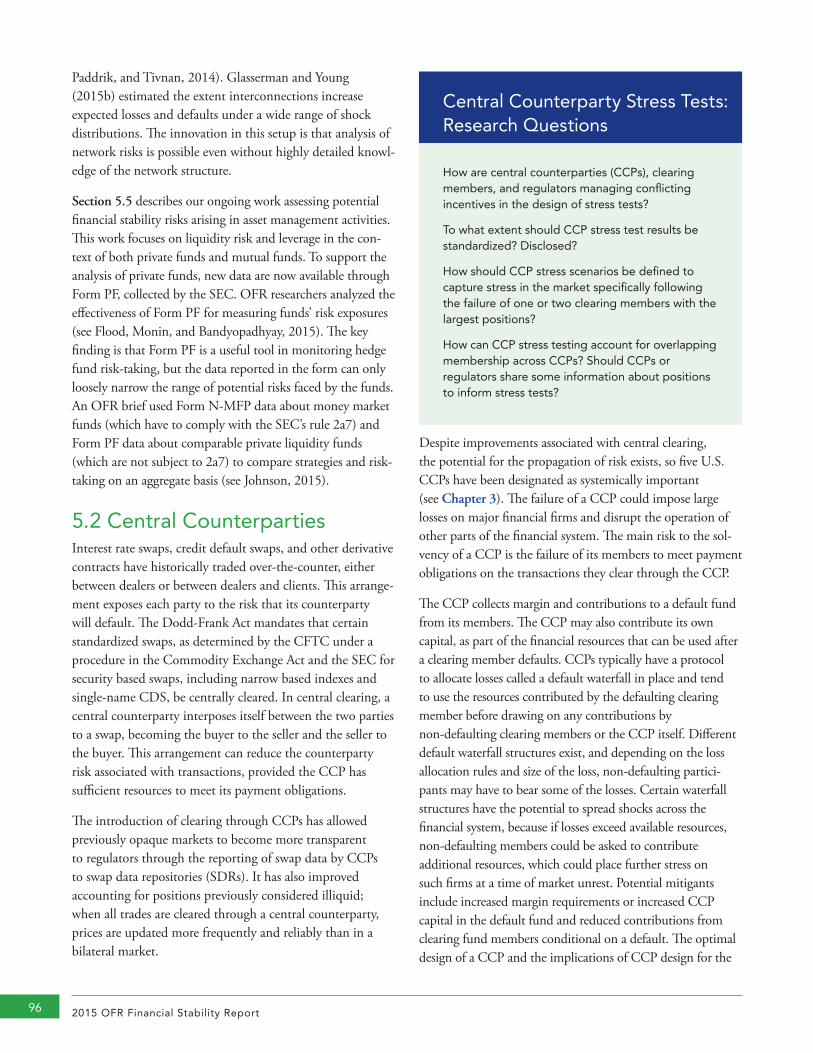
2015 OFR Financial Stability Report96
Paddrik, and Tivnan, 2014). Glasserman and Young (2015b) estimated the extent interconnections increase expected losses and defaults under a wide range of shock distributions. The innovation in this setup is that analysis of network risks is possible even without highly detailed knowl-edge of the network structure.
Section 5.5 describes our ongoing work assessing potential financial stability risks arising in asset management activities. This work focuses on liquidity risk and leverage in the con-text of both private funds and mutual funds. To support the analysis of private funds, new data are now available through Form PF, collected by the SEC. OFR researchers analyzed the effectiveness of Form PF for measuring funds’ risk exposures (see Flood, Monin, and Bandyopadhyay, 2015). The key finding is that Form PF is a useful tool in monitoring hedge fund risk-taking, but the data reported in the form can only loosely narrow the range of potential risks faced by the funds. An OFR brief used Form N-MFP data about money market funds (which have to comply with the SEC’s rule 2a7) and Form PF data about comparable private liquidity funds (which are not subject to 2a7) to compare strategies and risk-taking on an aggregate basis (see Johnson, 2015).
5.2 Central CounterpartiesInterest rate swaps, credit default swaps, and other derivative contracts have historically traded over-the-counter, either between dealers or between dealers and clients. This arrange-ment exposes each party to the risk that its counterparty will default. The Dodd-Frank Act mandates that certain standardized swaps, as determined by the CFTC under a procedure in the Commodity Exchange Act and the SEC for security based swaps, including narrow based indexes and single-name CDS, be centrally cleared. In central clearing, a central counterparty interposes itself between the two parties to a swap, becoming the buyer to the seller and the seller to the buyer. This arrangement can reduce the counterparty risk associated with transactions, provided the CCP has sufficient resources to meet its payment obligations.
The introduction of clearing through CCPs has allowed previously opaque markets to become more transparent to regulators through the reporting of swap data by CCPs to swap data repositories (SDRs). It has also improved accounting for positions previously considered illiquid; when all trades are cleared through a central counterparty, prices are updated more frequently and reliably than in a bilateral market.
Despite improvements associated with central clearing, the potential for the propagation of risk exists, so five U.S. CCPs have been designated as systemically important (see Chapter 3). The failure of a CCP could impose large losses on major financial firms and disrupt the operation of other parts of the financial system. The main risk to the sol-vency of a CCP is the failure of its members to meet payment obligations on the transactions they clear through the CCP.
The CCP collects margin and contributions to a default fund from its members. The CCP may also contribute its own capital, as part of the financial resources that can be used after a clearing member defaults. CCPs typically have a protocol to allocate losses called a default waterfall in place and tend to use the resources contributed by the defaulting clearing member before drawing on any contributions by non-defaulting clearing members or the CCP itself. Different default waterfall structures exist, and depending on the loss allocation rules and size of the loss, non-defaulting partici-pants may have to bear some of the losses. Certain waterfall structures have the potential to spread shocks across the financial system, because if losses exceed available resources, non-defaulting members could be asked to contribute additional resources, which could place further stress on such firms at a time of market unrest. Potential mitigants include increased margin requirements or increased CCP capital in the default fund and reduced contributions from clearing fund members conditional on a default. The optimal design of a CCP and the implications of CCP design for the
Central Counterparty Stress Tests: Research Questions
How are central counterparties (CCPs), clearing members, and regulators managing conflicting incentives in the design of stress tests?
To what extent should CCP stress test results be standardized? Disclosed?
How should CCP stress scenarios be defined to capture stress in the market specifically following the failure of one or two clearing members with the largest positions?
How can CCP stress testing account for overlapping membership across CCPs? Should CCPs or regulators share some information about positions to inform stress tests?
Research on Financial Stability 97
financial system remain questions under active consideration by industry, academia, and the regulatory community.
CCP stress testing is intended to ensure a CCP has suffi-cient resources available in the event of a default of one (for all CCPs) or two (for some systemically important CCPs) clearing members in “extreme but plausible” scenarios. A CCP also uses stress tests to determine how much clearing members should contribute to its default fund. To be com-petitive, a CCP needs to be able to withstand losses yet keep trading costs low, including the costs of default fund contri-butions. A clearing member might withdraw from a CCP if a CCP’s stress tests are too rigorous and result in costly additional individual obligations — or not rigorous enough, which could leave the CCP and its members vulnerable.
CFTC rules require CCPs to conduct weekly or, in some cases, daily stress tests (see CFTC, 2011). These tests are not standardized across CCPs. CCPs are given discretion in designing their stress tests, subject to review by the CFTC. Some market participants have called for standardized stress tests for CCPs. Others argue for tests tailored to the risks in products cleared. In May 2015, two international standards-setting bodies, the Committee on Payments and Market Infrastructures and the International Organization of Securities Commissions, began a review of current CCP stress testing practices.
Under normal circumstances, a CCP has no net exposure to the changes in the market prices of the instruments it clears; it runs a “matched book.” The CCP stands between trades by other parties so any payment the CCP owes to one member should be offset by an equal payment owed to the CCP by another member. By itself, a market shock or an economic downturn has no direct effect on a CCP. But if a clearing member defaults, the CCP is left with an unbalanced posi-tion and the imbalance leaves the CCP exposed to market risk. If a clearing member fails, the CCP needs to return to a matched book, and it may incur losses in the time needed to achieve this balance.
CCP stress tests should assess how large these losses might be in an extreme-but-plausible stressed market event. Historical data on past market moves may have little relevance in this case, because the CCP needs to anticipate the state of the market after a clearing member fails, especially if the failed member is a major financial institution. Extreme market moves measured from past data may not reflect the loss of market liquidity and erratic behavior that could accompany
a major default, and stress tests consider both historical and hypothetical scenarios.
In a stress scenario that describes market conditions in the days after the failure of one or two clearing members, calcu-lating the loss to the CCP is relatively straightforward, at least in theory. But the clearing members of one CCP are often members of other CCPs as well, and if a clearing member fails, it fails in all its obligations, including to other CCPs. A CCP’s stress test should take this dynamic into account (see Glasserman, Moallemi, and Yuan, 2015). Overlapping membership means a failure may have a larger market impact than anticipated. It also has an operational impact. A CCP commonly counts on staff employees from surviving member firms to help manage a default. Those same employees may be called on by more than one CCP.
5.3 Stress Testing: A Framework for EvaluationStress testing has long been part of the toolkit for risk man-agement and microprudential supervision, but it gained new prominence in the aftermath of the financial turmoil of 2007-09. Before the crisis, the trend in risk management was toward increasingly complex risk models based on probabilistic estimates of adverse events. Those models failed to predict the crisis, at least in part because they underes-timated the likelihood of seemingly extreme events. Stress testing probes the consequences of extreme-yet-plausible scenarios without attaching probabilities to these scenarios. It forces consideration of important but hard-to-quantify risks.
The current practice of U.S. stress testing is largely micropru-dential — the results of stress testing are used to assess the safety and soundness of individual financial institutions and also to set appropriate capital requirements. But stress testing could also be a potentially powerful tool for monitoring macroprudential risk and calibrating policy responses by explicitly incorporating interactions among different parts of the financial system and the broader economy.
Regulatory stress testing continues to evolve, as does stress testing in financial firms. In both cases, applications across different parts of the financial system have some features in common. But they also, by neccessity, exhibit important differences, reflecting different businesses, activities, and the nature of their risks (see Figure 5-1). We assess progress to date and identify areas for further work through four ques-tions that every stress testing exercise should consider:
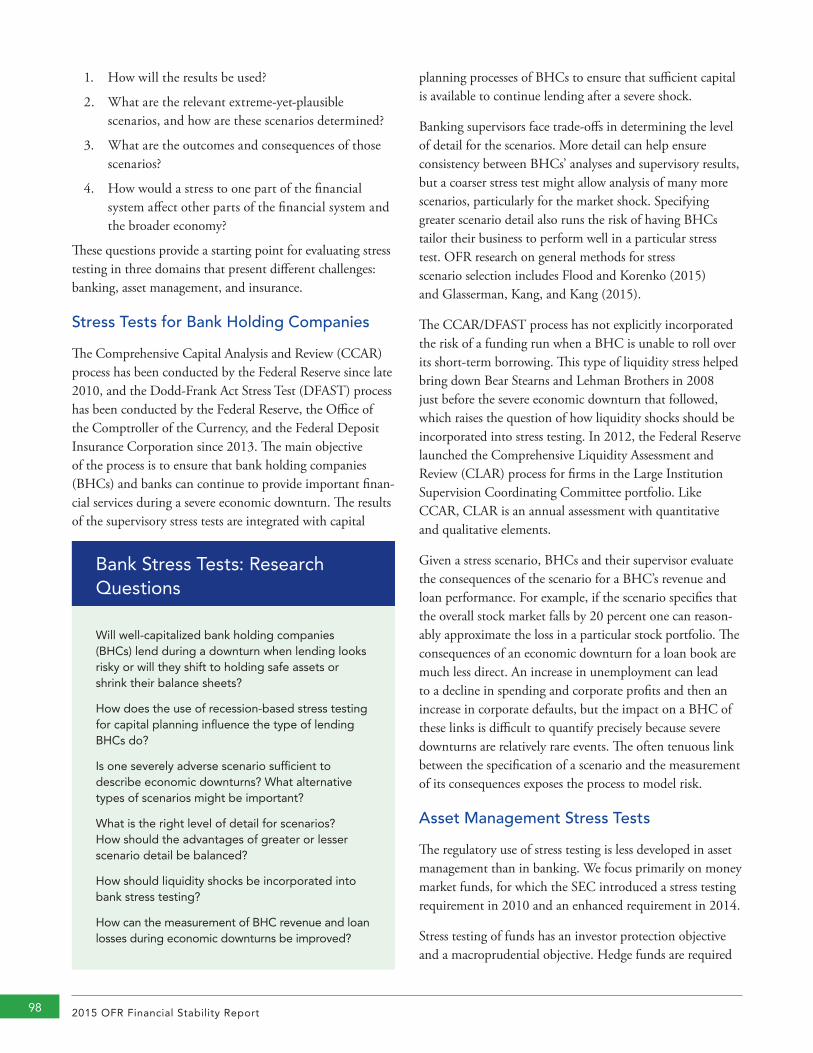
2015 OFR Financial Stability Report98
1. How will the results be used?
2. What are the relevant extreme-yet-plausible scenarios, and how are these scenarios determined?
3. What are the outcomes and consequences of those scenarios?
4. How would a stress to one part of the financial system affect other parts of the financial system and the broader economy?
These questions provide a starting point for evaluating stress testing in three domains that present different challenges: banking, asset management, and insurance.
Stress Tests for Bank Holding Companies
The Comprehensive Capital Analysis and Review (CCAR) process has been conducted by the Federal Reserve since late 2010, and the Dodd-Frank Act Stress Test (DFAST) process has been conducted by the Federal Reserve, the Office of the Comptroller of the Currency, and the Federal Deposit Insurance Corporation since 2013. The main objective of the process is to ensure that bank holding companies (BHCs) and banks can continue to provide important finan-cial services during a severe economic downturn. The results of the supervisory stress tests are integrated with capital
planning processes of BHCs to ensure that sufficient capital is available to continue lending after a severe shock.
Banking supervisors face trade-offs in determining the level of detail for the scenarios. More detail can help ensure consistency between BHCs’ analyses and supervisory results, but a coarser stress test might allow analysis of many more scenarios, particularly for the market shock. Specifying greater scenario detail also runs the risk of having BHCs tailor their business to perform well in a particular stress test. OFR research on general methods for stress scenario selection includes Flood and Korenko (2015) and Glasserman, Kang, and Kang (2015).
The CCAR/DFAST process has not explicitly incorporated the risk of a funding run when a BHC is unable to roll over its short-term borrowing. This type of liquidity stress helped bring down Bear Stearns and Lehman Brothers in 2008 just before the severe economic downturn that followed, which raises the question of how liquidity shocks should be incorporated into stress testing. In 2012, the Federal Reserve launched the Comprehensive Liquidity Assessment and Review (CLAR) process for firms in the Large Institution Supervision Coordinating Committee portfolio. Like CCAR, CLAR is an annual assessment with quantitative and qualitative elements.
Given a stress scenario, BHCs and their supervisor evaluate the consequences of the scenario for a BHC’s revenue and loan performance. For example, if the scenario specifies that the overall stock market falls by 20 percent one can reason-ably approximate the loss in a particular stock portfolio. The consequences of an economic downturn for a loan book are much less direct. An increase in unemployment can lead to a decline in spending and corporate profits and then an increase in corporate defaults, but the impact on a BHC of these links is difficult to quantify precisely because severe downturns are relatively rare events. The often tenuous link between the specification of a scenario and the measurement of its consequences exposes the process to model risk.
Asset Management Stress Tests
The regulatory use of stress testing is less developed in asset management than in banking. We focus primarily on money market funds, for which the SEC introduced a stress testing requirement in 2010 and an enhanced requirement in 2014.
Stress testing of funds has an investor protection objective and a macroprudential objective. Hedge funds are required
Bank Stress Tests: Research Questions
Will well-capitalized bank holding companies (BHCs) lend during a downturn when lending looks risky or will they shift to holding safe assets or shrink their balance sheets?
How does the use of recession-based stress testing for capital planning influence the type of lending BHCs do?
Is one severely adverse scenario sufficient to describe economic downturns? What alternative types of scenarios might be important?
What is the right level of detail for scenarios? How should the advantages of greater or lesser scenario detail be balanced?
How should liquidity shocks be incorporated into bank stress testing?
How can the measurement of BHC revenue and loan losses during economic downturns be improved?

Research on Financial Stability 99
to run a limited set of stress tests and report the results in Form PF. In the case of mutual funds, stress testing require-ments have been discussed but not adopted. But stress testing of those funds could help ensure asset managers practice prudent risk management. The primary macro-prudential objective would be to prevent disruptive fire sales that force asset managers to sell illiquid assets, driving down prices and potentially destabilizing other parts of the financial system.
For money market funds that allow investors to buy and sell shares at a fixed $1 share price, stress testing helps ensure that funds can meet the commitment to redeem shares at a fixed price. Money market funds are an important source of short-term funding for financial and nonfinancial firms. Stress testing of these funds also helps to ensure the stability of short-term markets. Before the SEC reforms of 2010 and 2014, risks in money market funds were highlighted in 2008 when the Treasury Department and Federal Reserve guaranteed money market fund assets to stabilize short-term funding markets. Since 2014, the SEC rule has required money market funds to test their ability to maintain 10 percent of their assets in securities that can be liquidated within one week. Floating net asset value (NAV) funds must also stress test against minimizing principal volatility. The objective of minimizing principal volatility replaces the 2010 rule’s objective of maintaining a fixed share price, which stable NAV funds have to test against.
The SEC’s 2010 and 2014 rules for stress testing of money market funds require that results be presented to each fund’s board of directors at regular intervals. The rules do not, however, require reporting the results to regulators or the public.
The SEC’s 2014 money market fund rules add specificity to the general stress testing requirement adopted in 2010. In contrast to the CCAR/DFAST scenarios, they are not tied to an economic scenario. The stress events that funds must consider include the main stress scenarios that could cause a fund’s net asset value to fall — increases in short-term interest rates, widening of credit spreads, downgrades or defaults of securities held by the funds, and increases in shareholder redemptions.
Funds with a fixed share price are particularly vulnerable to spikes in shareholder redemptions amid fears of falling asset values. The fixed share price creates an incentive for shareholders to redeem before other shareholders, especially when the asset value drops close to, or below, the fixed price,
causing a run on the fund. Measurements of interest rate and credit risks are relatively well established. In contrast, little data exists to facilitate measuring run risk.
Money market funds hold a limited class of short-term assets. Scenarios for stress testing other types of mutual funds or hedge funds would need to consider a much wider range of shocks to capture the range of holdings and strategies that characterize these funds to meet a consistent standard of extreme-yet-plausible stress scenarios.
For money market funds, mapping from market shocks to portfolio values is straightforward. A change in interest rates or credit quality has a fairly mechanical impact on the value of money market instruments. Some of the more difficult aspects of evaluating stress scenarios in asset management involve behavioral or strategic considerations, such as decisions by investors to withdraw, by fund managers about which assets to sell, and for leveraged funds, decisions by lenders to continue to provide credit.
Insurance Company Stress Testing
The National Association of Insurance Commissioners (NAIC) adopted a formal requirement for risk assessment in 2012, to be phased in by 2015. To date, 34 states have adopted this NAIC model act with its inclusion as an accreditation requirement beginning in 2018 (see NAIC, 2012) for companies meeting a minimum size requirement. The stress testing requirement is part of the industry’s Own Risk and Solvency Assessment (ORSA) program, modeled
Asset Management Stress Tests: Research Questions
How do fund boards use the stress testing results? Should disclosure of the results be expanded?
How should stress scenarios for increased share-holder redemptions be specified?
Given the wide diversity of mutual funds and hedge funds, how can stress scenarios for different types of funds be defined to meet a consistent standard of extreme yet plausible?
How can behavioral and strategic actions by inves-tors, fund managers, and creditors be incorporated into the analysis of stress scenarios?
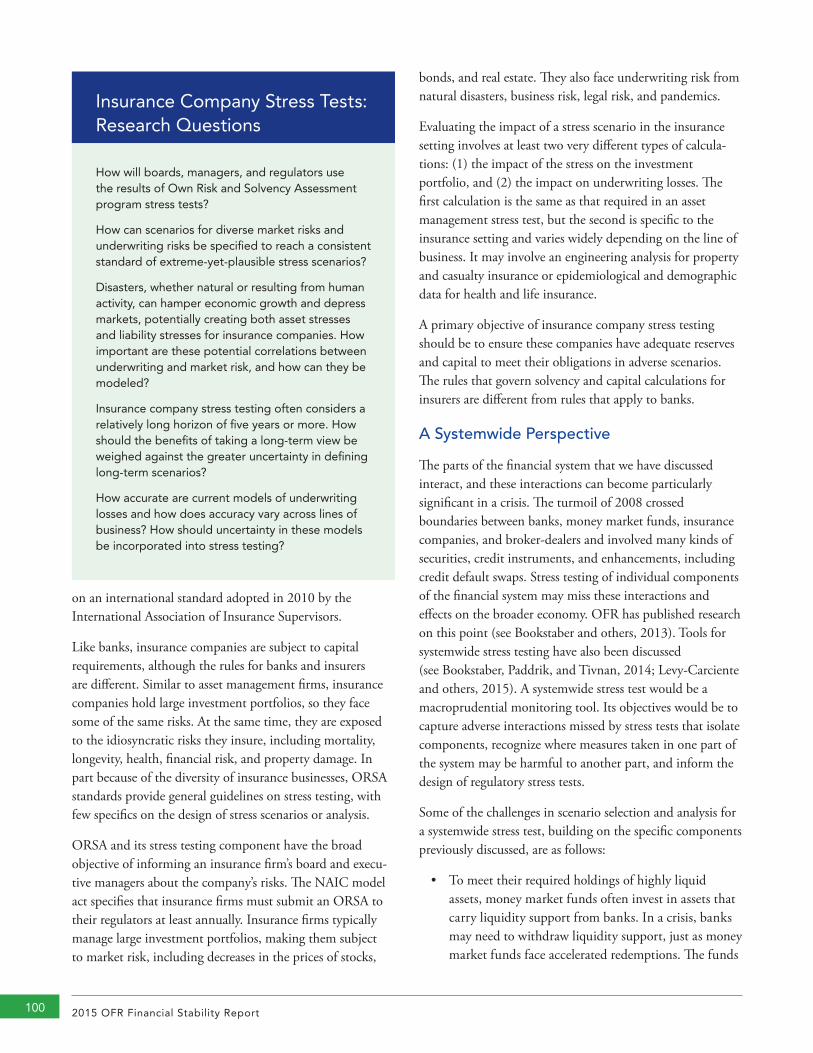
2015 OFR Financial Stability Report100
on an international standard adopted in 2010 by the International Association of Insurance Supervisors.
Like banks, insurance companies are subject to capital requirements, although the rules for banks and insurers are different. Similar to asset management firms, insurance companies hold large investment portfolios, so they face some of the same risks. At the same time, they are exposed to the idiosyncratic risks they insure, including mortality, longevity, health, financial risk, and property damage. In part because of the diversity of insurance businesses, ORSA standards provide general guidelines on stress testing, with few specifics on the design of stress scenarios or analysis.
ORSA and its stress testing component have the broad objective of informing an insurance firm’s board and execu-tive managers about the company’s risks. The NAIC model act specifies that insurance firms must submit an ORSA to their regulators at least annually. Insurance firms typically manage large investment portfolios, making them subject to market risk, including decreases in the prices of stocks,
bonds, and real estate. They also face underwriting risk from natural disasters, business risk, legal risk, and pandemics.
Evaluating the impact of a stress scenario in the insurance setting involves at least two very different types of calcula-tions: (1) the impact of the stress on the investment portfolio, and (2) the impact on underwriting losses. The first calculation is the same as that required in an asset management stress test, but the second is specific to the insurance setting and varies widely depending on the line of business. It may involve an engineering analysis for property and casualty insurance or epidemiological and demographic data for health and life insurance.
A primary objective of insurance company stress testing should be to ensure these companies have adequate reserves and capital to meet their obligations in adverse scenarios. The rules that govern solvency and capital calculations for insurers are different from rules that apply to banks.
A Systemwide Perspective
The parts of the financial system that we have discussed interact, and these interactions can become particularly significant in a crisis. The turmoil of 2008 crossed boundaries between banks, money market funds, insurance companies, and broker-dealers and involved many kinds of securities, credit instruments, and enhancements, including credit default swaps. Stress testing of individual components of the financial system may miss these interactions and effects on the broader economy. OFR has published research on this point (see Bookstaber and others, 2013). Tools for systemwide stress testing have also been discussed (see Bookstaber, Paddrik, and Tivnan, 2014; Levy-Carciente and others, 2015). A systemwide stress test would be a macroprudential monitoring tool. Its objectives would be to capture adverse interactions missed by stress tests that isolate components, recognize where measures taken in one part of the system may be harmful to another part, and inform the design of regulatory stress tests.
Some of the challenges in scenario selection and analysis for a systemwide stress test, building on the specific components previously discussed, are as follows:
• To meet their required holdings of highly liquid assets, money market funds often invest in assets that carry liquidity support from banks. In a crisis, banks may need to withdraw liquidity support, just as money market funds face accelerated redemptions. The funds
Insurance Company Stress Tests: Research Questions
How will boards, managers, and regulators use the results of Own Risk and Solvency Assessment program stress tests?
How can scenarios for diverse market risks and underwriting risks be specified to reach a consistent standard of extreme-yet-plausible stress scenarios?
Disasters, whether natural or resulting from human activity, can hamper economic growth and depress markets, potentially creating both asset stresses and liability stresses for insurance companies. How important are these potential correlations between underwriting and market risk, and how can they be modeled?
Insurance company stress testing often considers a relatively long horizon of five years or more. How should the benefits of taking a long-term view be weighed against the greater uncertainty in defining long-term scenarios?
How accurate are current models of underwriting losses and how does accuracy vary across lines of business? How should uncertainty in these models be incorporated into stress testing?
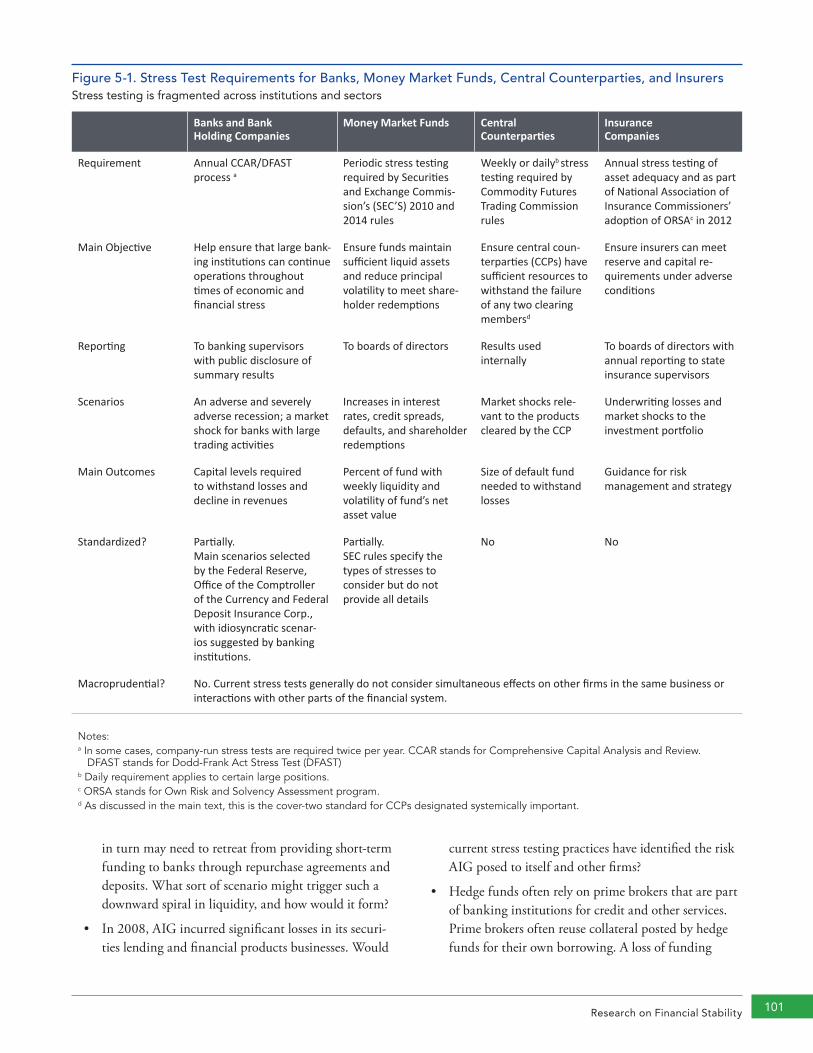
Research on Financial Stability 101
in turn may need to retreat from providing short-term funding to banks through repurchase agreements and deposits. What sort of scenario might trigger such a downward spiral in liquidity, and how would it form?
• In 2008, AIG incurred significant losses in its securi-ties lending and financial products businesses. Would
current stress testing practices have identified the risk AIG posed to itself and other firms?
• Hedge funds often rely on prime brokers that are part of banking institutions for credit and other services. Prime brokers often reuse collateral posted by hedge funds for their own borrowing. A loss of funding
Figure 5-1. Stress Test Requirements for Banks, Money Market Funds, Central Counterparties, and InsurersStress testing is fragmented across institutions and sectors
Banks and Bank Holding Companies
Money Market Funds Central Counterparties
Insurance Companies
Requirement Annual CCAR/DFAST process a
Periodic stress testing required by Securities and Exchange Commis-sion’s (SEC’S) 2010 and 2014 rules
Weekly or dailyb stress testing required by Commodity Futures Trading Commission rules
Annual stress testing of asset adequacy and as part of National Association of Insurance Commissioners’ adoption of ORSAc in 2012
Main Objective Help ensure that large bank-ing institutions can continue operations throughout times of economic and financial stress
Ensure funds maintain sufficient liquid assets and reduce principal volatility to meet share-holder redemptions
Ensure central coun-terparties (CCPs) have sufficient resources to withstand the failure of any two clearing membersd
Ensure insurers can meet reserve and capital re-quirements under adverse conditions
Reporting To banking supervisors with public disclosure of summary results
To boards of directors Results used internally
To boards of directors with annual reporting to state insurance supervisors
Scenarios An adverse and severely adverse recession; a market shock for banks with large trading activities
Increases in interest rates, credit spreads, defaults, and shareholder redemptions
Market shocks rele-vant to the products cleared by the CCP
Underwriting losses and market shocks to the investment portfolio
Main Outcomes Capital levels required to withstand losses and decline in revenues
Percent of fund with weekly liquidity and volatility of fund’s net asset value
Size of default fund needed to withstand losses
Guidance for risk management and strategy
Standardized? Partially.Main scenarios selected by the Federal Reserve, Office of the Comptroller of the Currency and Federal Deposit Insurance Corp., with idiosyncratic scenar-ios suggested by banking institutions.
Partially. SEC rules specify the types of stresses to consider but do not provide all details
No No
Macroprudential? No. Current stress tests generally do not consider simultaneous effects on other firms in the same business or interactions with other parts of the financial system.
Notes:a In some cases, company-run stress tests are required twice per year. CCAR stands for Comprehensive Capital Analysis and Review.
DFAST stands for Dodd-Frank Act Stress Test (DFAST)b Daily requirement applies to certain large positions.c ORSA stands for Own Risk and Solvency Assessment program.d As discussed in the main text, this is the cover-two standard for CCPs designated systemically important.
2015 OFR Financial Stability Report102
can force hedge funds to sell illiquid assets quickly, creating the risk of a fire sale. What types of scenarios might trigger these dynamics, given the wide range of hedge fund strategies?
• The use of recession-based stress tests in setting bank capital levels creates an incentive for banks to prefer assets that perform well in economic downturns and avoid assets that perform poorly in downturns. Capital requirements based on risk-weighted assets or overall leverage do not generally have these effects. What are the implications for the broader economy of these shifting incentives for banks?
• More generally, what unintended consequences might regulatory stress test have through the incentives they create for regulated firms?
These are examples of questions that cut across traditional stress testing boundaries. The development of systemwide stress testing, although difficult to achieve, forces consider-ation of these types of interactions.
5.4 Financial NetworksInterconnections between financial institutions play a dual role. On the one hand, they can serve as shock absorbers and a means of diversifying risk, leading to greater robustness. On the other hand, they can serve as mechanisms for propagating shocks and creating greater fragility. The OFR is studying a variety of counterparty networks to gain new insights into the robustness and fragility of the financial system.
Networks are a critical tool in the description of the financial system, its systemic structure, and the analysis and evaluation of contagion effects. Studying the network provides important system-level effects, which add to those observed when studying bilateral exposures or interactions. Observing changes in the network also allows the detection of changes in business models and increasing “shadow banking” activities.
Analytical, visual, and numerical frameworks for the study of financial networks range from the identification of the type and properties of the network to the analysis of the impact of simulated shocks. Frameworks can help quantify the risks inherent in the financial system and design and evaluate policy proposals and intervention strategies to mitigate these risks.
Counterparty Networks
The banking system is a highly interdependent system, with banks connected on the asset and liability sides of their balance sheets. Connections can be direct, indirect, or both. Banks are directly connected through mutual exposures acquired on the interbank market and indirectly connected by holding similar portfolios of assets. These connections in the interbank market can be represented as a network. From a financial stability perspective, banks should be neither “too big to fail” nor “too interconnected to fail.” A better under-standing of the interbank network and network externalities may facilitate the adoption of a macroprudential framework for financial supervision. The study of interbank networks, both theoretically and empirically, has been expanding in recent years, with an emphasis on financial stability issues and the resilience of the interbank network to shocks (see Hüser, 2015).
The interbank network exhibits two main channels of risk contagion: (1) direct interbank liability linkages between financial institutions, and (2) indirect contagion through changes in bank asset values or common shocks to funding. The first channel focuses on the dynamics of loss propagation through the network of direct counterparty exposures (claims and liabilities between institutions) after an initial default. These types of networks have been investigated in different countries, such as Austria (see Boss and others, 2004) and Germany (see Craig and Von Peter, 2014). In those studies, the authors investigate unique exposure data to characterize the structure of the interbank network and its resilience. However, data about interbank exposures are sensitive and not widely available.
The second channel involves indirect links formed between banks, either through their overlapping portfolios or common shocks to funding. Contagion in this channel can occur when a shock on the values of bank asset holdings leads to simultaneous sales and marking bank portfolios to market. To this end, models are being developed to make use of the bank balance sheet to uncover channels of risk contagion (see Caccioli and others, 2014; Huang and others, 2013). Similarly, common shocks to funding can lead to funding runs as banks liquidate assets to satisfy collateral requirements.
Beyond interbank networks, network analysis can be used to understand direct contractual links between market participants in asset markets. Monitoring the counterparty network structure of asset markets allows for the detection
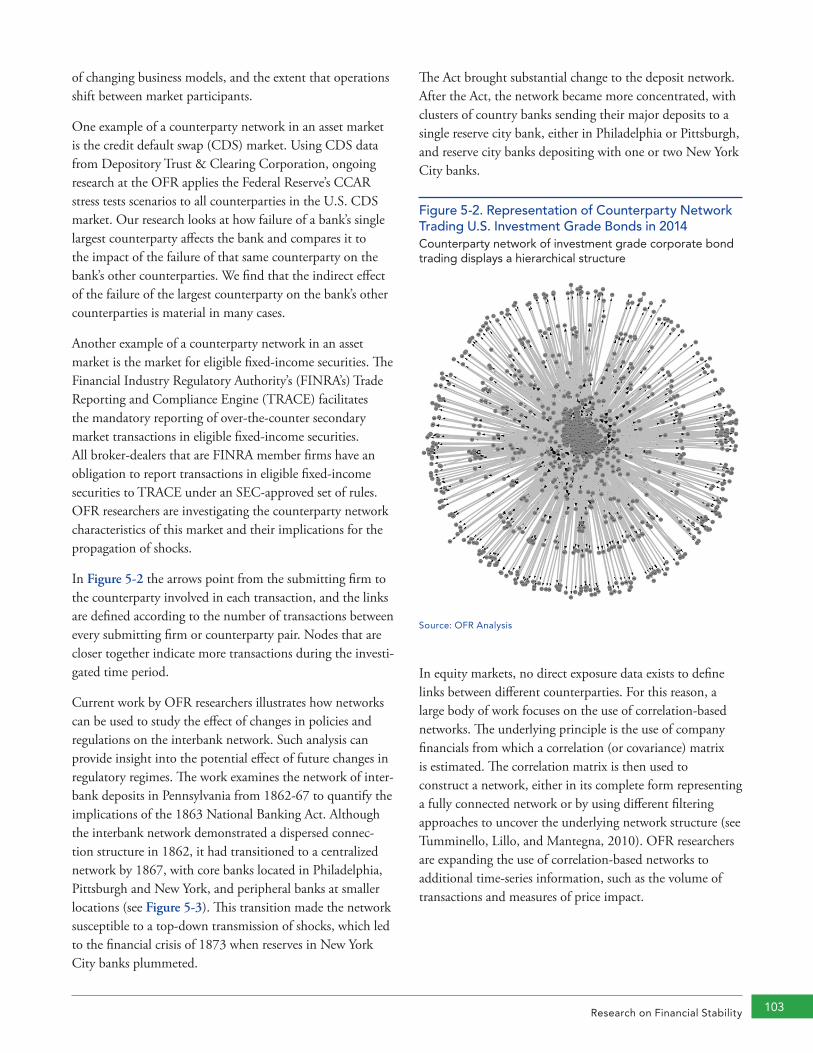
Research on Financial Stability 103
of changing business models, and the extent that operations shift between market participants.
One example of a counterparty network in an asset market is the credit default swap (CDS) market. Using CDS data from Depository Trust & Clearing Corporation, ongoing research at the OFR applies the Federal Reserve’s CCAR stress tests scenarios to all counterparties in the U.S. CDS market. Our research looks at how failure of a bank’s single largest counterparty affects the bank and compares it to the impact of the failure of that same counterparty on the bank’s other counterparties. We find that the indirect effect of the failure of the largest counterparty on the bank’s other counterparties is material in many cases.
Another example of a counterparty network in an asset market is the market for eligible fixed-income securities. The Financial Industry Regulatory Authority’s (FINRA’s) Trade Reporting and Compliance Engine (TRACE) facilitates the mandatory reporting of over-the-counter secondary market transactions in eligible fixed-income securities. All broker-dealers that are FINRA member firms have an obligation to report transactions in eligible fixed-income securities to TRACE under an SEC-approved set of rules. OFR researchers are investigating the counterparty network characteristics of this market and their implications for the propagation of shocks.
In Figure 5-2 the arrows point from the submitting firm to the counterparty involved in each transaction, and the links are defined according to the number of transactions between every submitting firm or counterparty pair. Nodes that are closer together indicate more transactions during the investi-gated time period.
Current work by OFR researchers illustrates how networks can be used to study the effect of changes in policies and regulations on the interbank network. Such analysis can provide insight into the potential effect of future changes in regulatory regimes. The work examines the network of inter-bank deposits in Pennsylvania from 1862-67 to quantify the implications of the 1863 National Banking Act. Although the interbank network demonstrated a dispersed connec-tion structure in 1862, it had transitioned to a centralized network by 1867, with core banks located in Philadelphia, Pittsburgh and New York, and peripheral banks at smaller locations (see Figure 5-3). This transition made the network susceptible to a top-down transmission of shocks, which led to the financial crisis of 1873 when reserves in New York City banks plummeted.
The Act brought substantial change to the deposit network. After the Act, the network became more concentrated, with clusters of country banks sending their major deposits to a single reserve city bank, either in Philadelphia or Pittsburgh, and reserve city banks depositing with one or two New York City banks.
Figure 5-2. Representation of Counterparty Network Trading U.S. Investment Grade Bonds in 2014Counterparty network of investment grade corporate bond trading displays a hierarchical structure
Source: OFR Analysis
In equity markets, no direct exposure data exists to define links between different counterparties. For this reason, a large body of work focuses on the use of correlation-based networks. The underlying principle is the use of company financials from which a correlation (or covariance) matrix is estimated. The correlation matrix is then used to construct a network, either in its complete form representing a fully connected network or by using different filtering approaches to uncover the underlying network structure (see Tumminello, Lillo, and Mantegna, 2010). OFR researchers are expanding the use of correlation-based networks to additional time-series information, such as the volume of transactions and measures of price impact.
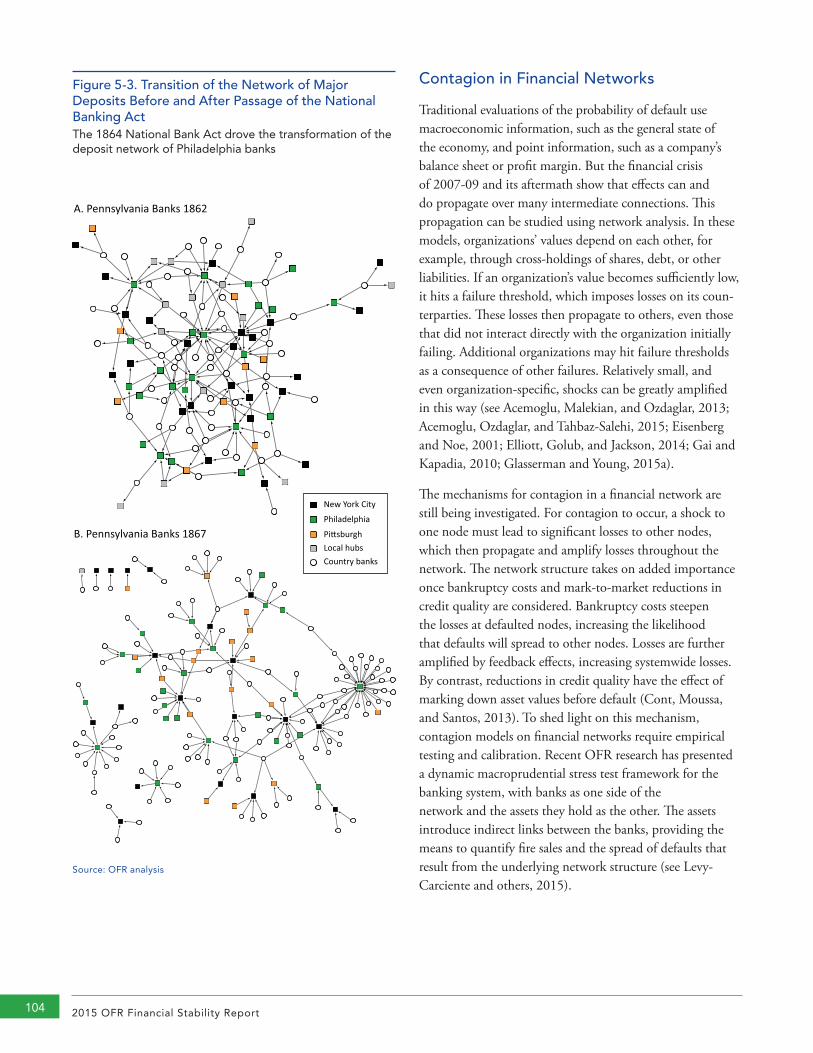
2015 OFR Financial Stability Report104
Contagion in Financial Networks
Traditional evaluations of the probability of default use macroeconomic information, such as the general state of the economy, and point information, such as a company’s balance sheet or profit margin. But the financial crisis of 2007-09 and its aftermath show that effects can and do propagate over many intermediate connections. This propagation can be studied using network analysis. In these models, organizations’ values depend on each other, for example, through cross-holdings of shares, debt, or other liabilities. If an organization’s value becomes sufficiently low, it hits a failure threshold, which imposes losses on its coun-terparties. These losses then propagate to others, even those that did not interact directly with the organization initially failing. Additional organizations may hit failure thresholds as a consequence of other failures. Relatively small, and even organization-specific, shocks can be greatly amplified in this way (see Acemoglu, Malekian, and Ozdaglar, 2013; Acemoglu, Ozdaglar, and Tahbaz-Salehi, 2015; Eisenberg and Noe, 2001; Elliott, Golub, and Jackson, 2014; Gai and Kapadia, 2010; Glasserman and Young, 2015a).
The mechanisms for contagion in a financial network are still being investigated. For contagion to occur, a shock to one node must lead to significant losses to other nodes, which then propagate and amplify losses throughout the network. The network structure takes on added importance once bankruptcy costs and mark-to-market reductions in credit quality are considered. Bankruptcy costs steepen the losses at defaulted nodes, increasing the likelihood that defaults will spread to other nodes. Losses are further amplified by feedback effects, increasing systemwide losses. By contrast, reductions in credit quality have the effect of marking down asset values before default (Cont, Moussa, and Santos, 2013). To shed light on this mechanism, contagion models on financial networks require empirical testing and calibration. Recent OFR research has presented a dynamic macroprudential stress test framework for the banking system, with banks as one side of the network and the assets they hold as the other. The assets introduce indirect links between the banks, providing the means to quantify fire sales and the spread of defaults that result from the underlying network structure (see Levy-Carciente and others, 2015).
Figure 5-3. Transition of the Network of Major Deposits Before and After Passage of the National Banking ActThe 1864 National Bank Act drove the transformation of the deposit network of Philadelphia banks
A. Pennsylvania Banks 1862
B. Pennsylvania Banks 1867
New York City
Philadelphia
Pi�sburghLocal hubsCountry banks
Source: OFR analysis

Research on Financial Stability 105
Multilayer Financial Networks
Characterizing the financial system as a multilayer interdepen-dent network can provide new insights into the underlying structure of the financial system, its vulnerabilities, and its resilience. Mathematical models (see Buldyrev and others, 2010; Gao and others, 2012) show that analyzing com-plex systems as a network of networks alters the most basic assumptions underlying single-layer networks. Ongoing work by OFR researchers focuses on mapping the layers of the financial system, investigating the interconnections and inter-dependencies between them, and the implications for finan-cial stability and regulation. Remaining challenges include:
• obtaining and tying together different data sources and using them to calibrate the interaction between nodes in different layers,
• identifying channels of risk propagation within and between the different layers, and
• developing new intervention strategies to mitigate financial crises.
The layers of the network encompass assets, funding, and collateral (see Figure 5-4). Different entities in the financial system occupy these individual layers. For example, asset managers occupy the asset layer and central counterparties occupy the collateral layer. Some entities span across layers. For example, leveraged managers such as hedge funds span the asset and funding layers. Banks are notable in spanning all three layers and are central to the spread of risks.
Data Challenges for Network Analysis
Uncovering the network structure of the financial system — static and dynamic — depends on the availability of
Figure 5-4. The Financial System as a Multilayer Network.The financial system can be represented through three layers: asset, funding, and collateral
Bank/Dealer Bank/Dealer/Dealaleral /Dealaler
Central CP
Central CP
D D
F F
COLLATERAL LAYER
FUNDING LAYER
BB
HF HF
HFHF
PB PBF F
DEALERDEALER
CashProvider
CashProvider
HF HF
HFHF
ASSET LAYER
DEALERDEALER
HF
HF
HF
HF
HF Exchange
T TD D
F Financing Desk
T Trading Desk
D Deriva�ves Desk
PBPrime Broker
DEALER
CPCounterparty
HFHedge Fund
Source: OFR Analysis
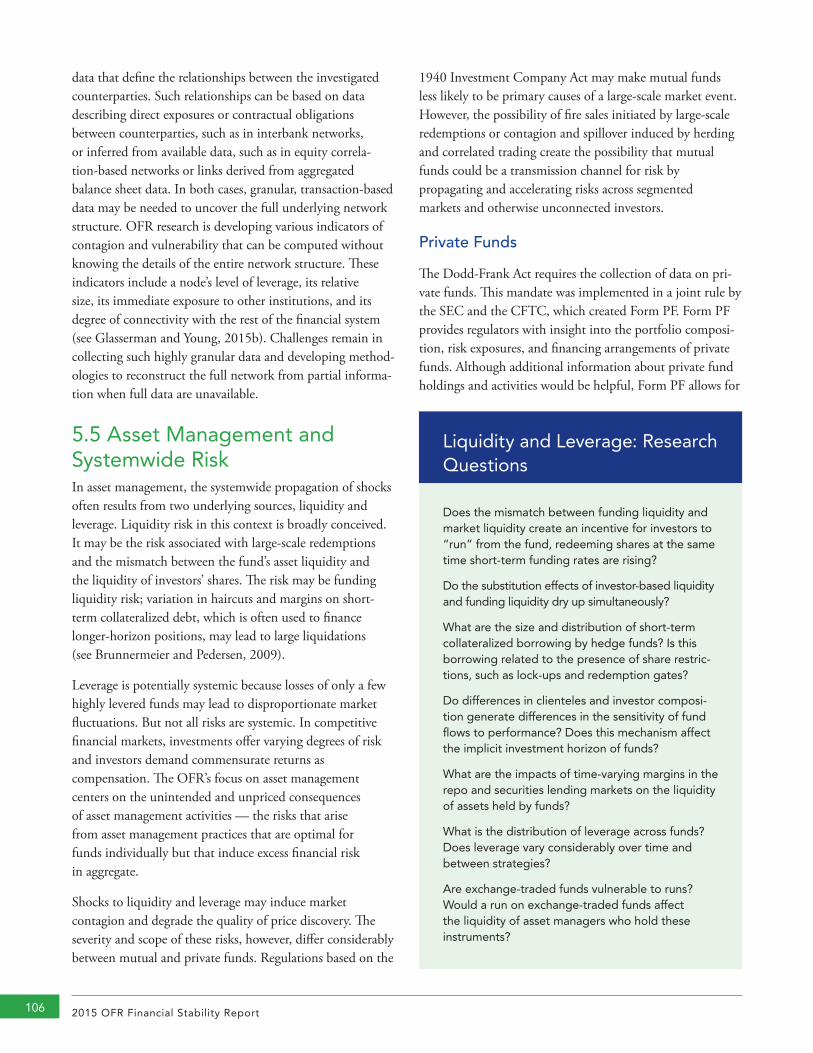
2015 OFR Financial Stability Report106
data that define the relationships between the investigated counterparties. Such relationships can be based on data describing direct exposures or contractual obligations between counterparties, such as in interbank networks, or inferred from available data, such as in equity correla-tion-based networks or links derived from aggregated balance sheet data. In both cases, granular, transaction-based data may be needed to uncover the full underlying network structure. OFR research is developing various indicators of contagion and vulnerability that can be computed without knowing the details of the entire network structure. These indicators include a node’s level of leverage, its relative size, its immediate exposure to other institutions, and its degree of connectivity with the rest of the financial system (see Glasserman and Young, 2015b). Challenges remain in collecting such highly granular data and developing method-ologies to reconstruct the full network from partial informa-tion when full data are unavailable.
5.5 Asset Management and Systemwide RiskIn asset management, the systemwide propagation of shocks often results from two underlying sources, liquidity and leverage. Liquidity risk in this context is broadly conceived. It may be the risk associated with large-scale redemptions and the mismatch between the fund’s asset liquidity and the liquidity of investors’ shares. The risk may be funding liquidity risk; variation in haircuts and margins on short-term collateralized debt, which is often used to finance longer-horizon positions, may lead to large liquidations (see Brunnermeier and Pedersen, 2009).
Leverage is potentially systemic because losses of only a few highly levered funds may lead to disproportionate market fluctuations. But not all risks are systemic. In competitive financial markets, investments offer varying degrees of risk and investors demand commensurate returns as compensation. The OFR’s focus on asset management centers on the unintended and unpriced consequences of asset management activities — the risks that arise from asset management practices that are optimal for funds individually but that induce excess financial risk in aggregate.
Shocks to liquidity and leverage may induce market contagion and degrade the quality of price discovery. The severity and scope of these risks, however, differ considerably between mutual and private funds. Regulations based on the
1940 Investment Company Act may make mutual funds less likely to be primary causes of a large-scale market event. However, the possibility of fire sales initiated by large-scale redemptions or contagion and spillover induced by herding and correlated trading create the possibility that mutual funds could be a transmission channel for risk by propagating and accelerating risks across segmented markets and otherwise unconnected investors.
Private Funds
The Dodd-Frank Act requires the collection of data on pri-vate funds. This mandate was implemented in a joint rule by the SEC and the CFTC, which created Form PF. Form PF provides regulators with insight into the portfolio composi-tion, risk exposures, and financing arrangements of private funds. Although additional information about private fund holdings and activities would be helpful, Form PF allows for
Liquidity and Leverage: Research Questions
Does the mismatch between funding liquidity and market liquidity create an incentive for investors to “run” from the fund, redeeming shares at the same time short-term funding rates are rising?
Do the substitution effects of investor-based liquidity and funding liquidity dry up simultaneously?
What are the size and distribution of short-term collateralized borrowing by hedge funds? Is this borrowing related to the presence of share restric-tions, such as lock-ups and redemption gates?
Do differences in clienteles and investor composi-tion generate differences in the sensitivity of fund flows to performance? Does this mechanism affect the implicit investment horizon of funds?
What are the impacts of time-varying margins in the repo and securities lending markets on the liquidity of assets held by funds?
What is the distribution of leverage across funds? Does leverage vary considerably over time and between strategies?
Are exchange-traded funds vulnerable to runs? Would a run on exchange-traded funds affect the liquidity of asset managers who hold these instruments?
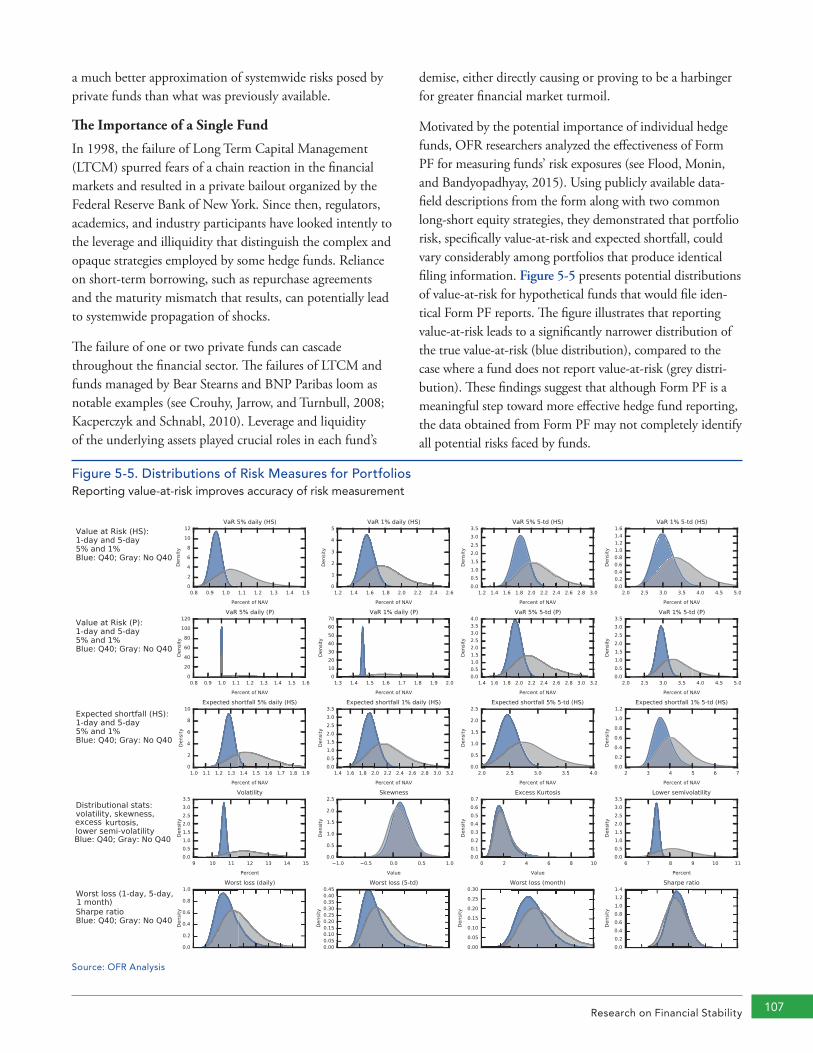
Research on Financial Stability 107
a much better approximation of systemwide risks posed by private funds than what was previously available.
The Importance of a Single Fund
In 1998, the failure of Long Term Capital Management (LTCM) spurred fears of a chain reaction in the financial markets and resulted in a private bailout organized by the Federal Reserve Bank of New York. Since then, regulators, academics, and industry participants have looked intently to the leverage and illiquidity that distinguish the complex and opaque strategies employed by some hedge funds. Reliance on short-term borrowing, such as repurchase agreements and the maturity mismatch that results, can potentially lead to systemwide propagation of shocks.
The failure of one or two private funds can cascade throughout the financial sector. The failures of LTCM and funds managed by Bear Stearns and BNP Paribas loom as notable examples (see Crouhy, Jarrow, and Turnbull, 2008; Kacperczyk and Schnabl, 2010). Leverage and liquidity of the underlying assets played crucial roles in each fund’s
demise, either directly causing or proving to be a harbinger for greater financial market turmoil.
Motivated by the potential importance of individual hedge funds, OFR researchers analyzed the effectiveness of Form PF for measuring funds’ risk exposures (see Flood, Monin, and Bandyopadhyay, 2015). Using publicly available data-field descriptions from the form along with two common long-short equity strategies, they demonstrated that portfolio risk, specifically value-at-risk and expected shortfall, could vary considerably among portfolios that produce identical filing information. Figure 5-5 presents potential distributions of value-at-risk for hypothetical funds that would file iden-tical Form PF reports. The figure illustrates that reporting value-at-risk leads to a significantly narrower distribution of the true value-at-risk (blue distribution), compared to the case where a fund does not report value-at-risk (grey distri-bution). These findings suggest that although Form PF is a meaningful step toward more effective hedge fund reporting, the data obtained from Form PF may not completely identify all potential risks faced by funds.
Figure 5-5. Distributions of Risk Measures for PortfoliosReporting value-at-risk improves accuracy of risk measurement
Source: OFR Analysis
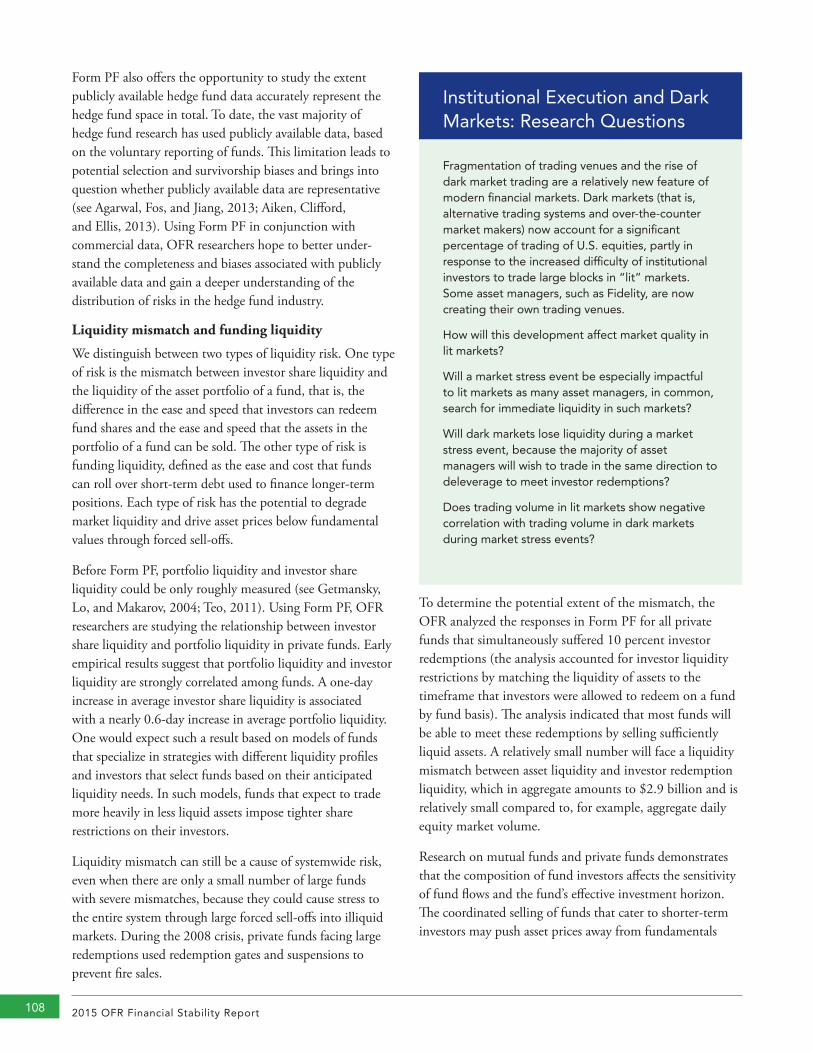
2015 OFR Financial Stability Report108
Form PF also offers the opportunity to study the extent publicly available hedge fund data accurately represent the hedge fund space in total. To date, the vast majority of hedge fund research has used publicly available data, based on the voluntary reporting of funds. This limitation leads to potential selection and survivorship biases and brings into question whether publicly available data are representative (see Agarwal, Fos, and Jiang, 2013; Aiken, Clifford, and Ellis, 2013). Using Form PF in conjunction with commercial data, OFR researchers hope to better under-stand the completeness and biases associated with publicly available data and gain a deeper understanding of the distribution of risks in the hedge fund industry.
Liquidity mismatch and funding liquidity
We distinguish between two types of liquidity risk. One type of risk is the mismatch between investor share liquidity and the liquidity of the asset portfolio of a fund, that is, the difference in the ease and speed that investors can redeem fund shares and the ease and speed that the assets in the portfolio of a fund can be sold. The other type of risk is funding liquidity, defined as the ease and cost that funds can roll over short-term debt used to finance longer-term positions. Each type of risk has the potential to degrade market liquidity and drive asset prices below fundamental values through forced sell-offs.
Before Form PF, portfolio liquidity and investor share liquidity could be only roughly measured (see Getmansky, Lo, and Makarov, 2004; Teo, 2011). Using Form PF, OFR researchers are studying the relationship between investor share liquidity and portfolio liquidity in private funds. Early empirical results suggest that portfolio liquidity and investor liquidity are strongly correlated among funds. A one-day increase in average investor share liquidity is associated with a nearly 0.6-day increase in average portfolio liquidity. One would expect such a result based on models of funds that specialize in strategies with different liquidity profiles and investors that select funds based on their anticipated liquidity needs. In such models, funds that expect to trade more heavily in less liquid assets impose tighter share restrictions on their investors.
Liquidity mismatch can still be a cause of systemwide risk, even when there are only a small number of large funds with severe mismatches, because they could cause stress to the entire system through large forced sell-offs into illiquid markets. During the 2008 crisis, private funds facing large redemptions used redemption gates and suspensions to prevent fire sales.
To determine the potential extent of the mismatch, the OFR analyzed the responses in Form PF for all private funds that simultaneously suffered 10 percent investor redemptions (the analysis accounted for investor liquidity restrictions by matching the liquidity of assets to the timeframe that investors were allowed to redeem on a fund by fund basis). The analysis indicated that most funds will be able to meet these redemptions by selling sufficiently liquid assets. A relatively small number will face a liquidity mismatch between asset liquidity and investor redemption liquidity, which in aggregate amounts to $2.9 billion and is relatively small compared to, for example, aggregate daily equity market volume.
Research on mutual funds and private funds demonstrates that the composition of fund investors affects the sensitivity of fund flows and the fund’s effective investment horizon. The coordinated selling of funds that cater to shorter-term investors may push asset prices away from fundamentals
Fragmentation of trading venues and the rise of dark market trading are a relatively new feature of modern financial markets. Dark markets (that is, alternative trading systems and over-the-counter market makers) now account for a significant percentage of trading of U.S. equities, partly in response to the increased difficulty of institutional investors to trade large blocks in “lit” markets. Some asset managers, such as Fidelity, are now creating their own trading venues.
How will this development affect market quality in lit markets?
Will a market stress event be especially impactful to lit markets as many asset managers, in common, search for immediate liquidity in such markets?
Will dark markets lose liquidity during a market stress event, because the majority of asset managers will wish to trade in the same direction to deleverage to meet investor redemptions?
Does trading volume in lit markets show negative correlation with trading volume in dark markets during market stress events?
Institutional Execution and Dark Markets: Research Questions
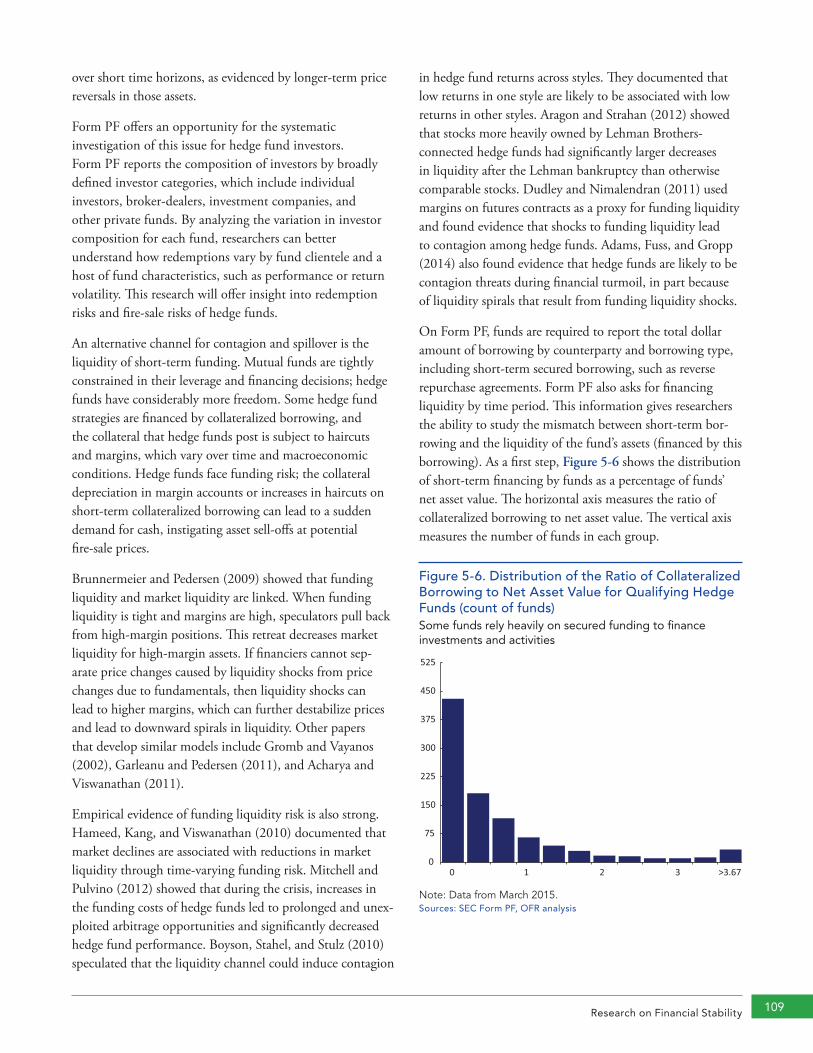
Research on Financial Stability 109
over short time horizons, as evidenced by longer-term price reversals in those assets.
Form PF offers an opportunity for the systematic investigation of this issue for hedge fund investors. Form PF reports the composition of investors by broadly defined investor categories, which include individual investors, broker-dealers, investment companies, and other private funds. By analyzing the variation in investor composition for each fund, researchers can better understand how redemptions vary by fund clientele and a host of fund characteristics, such as performance or return volatility. This research will offer insight into redemption risks and fire-sale risks of hedge funds.
An alternative channel for contagion and spillover is the liquidity of short-term funding. Mutual funds are tightly constrained in their leverage and financing decisions; hedge funds have considerably more freedom. Some hedge fund strategies are financed by collateralized borrowing, and the collateral that hedge funds post is subject to haircuts and margins, which vary over time and macroeconomic conditions. Hedge funds face funding risk; the collateral depreciation in margin accounts or increases in haircuts on short-term collateralized borrowing can lead to a sudden demand for cash, instigating asset sell-offs at potential fire-sale prices.
Brunnermeier and Pedersen (2009) showed that funding liquidity and market liquidity are linked. When funding liquidity is tight and margins are high, speculators pull back from high-margin positions. This retreat decreases market liquidity for high-margin assets. If financiers cannot sep-arate price changes caused by liquidity shocks from price changes due to fundamentals, then liquidity shocks can lead to higher margins, which can further destabilize prices and lead to downward spirals in liquidity. Other papers that develop similar models include Gromb and Vayanos (2002), Garleanu and Pedersen (2011), and Acharya and Viswanathan (2011).
Empirical evidence of funding liquidity risk is also strong. Hameed, Kang, and Viswanathan (2010) documented that market declines are associated with reductions in market liquidity through time-varying funding risk. Mitchell and Pulvino (2012) showed that during the crisis, increases in the funding costs of hedge funds led to prolonged and unex-ploited arbitrage opportunities and significantly decreased hedge fund performance. Boyson, Stahel, and Stulz (2010) speculated that the liquidity channel could induce contagion
in hedge fund returns across styles. They documented that low returns in one style are likely to be associated with low returns in other styles. Aragon and Strahan (2012) showed that stocks more heavily owned by Lehman Brothers-connected hedge funds had significantly larger decreases in liquidity after the Lehman bankruptcy than otherwise comparable stocks. Dudley and Nimalendran (2011) used margins on futures contracts as a proxy for funding liquidity and found evidence that shocks to funding liquidity lead to contagion among hedge funds. Adams, Fuss, and Gropp (2014) also found evidence that hedge funds are likely to be contagion threats during financial turmoil, in part because of liquidity spirals that result from funding liquidity shocks.
On Form PF, funds are required to report the total dollar amount of borrowing by counterparty and borrowing type, including short-term secured borrowing, such as reverse repurchase agreements. Form PF also asks for financing liquidity by time period. This information gives researchers the ability to study the mismatch between short-term bor-rowing and the liquidity of the fund’s assets (financed by this borrowing). As a first step, Figure 5-6 shows the distribution of short-term financing by funds as a percentage of funds’ net asset value. The horizontal axis measures the ratio of collateralized borrowing to net asset value. The vertical axis measures the number of funds in each group.
Figure 5-6. Distribution of the Ratio of Collateralized Borrowing to Net Asset Value for Qualifying Hedge Funds (count of funds)Some funds rely heavily on secured funding to finance investments and activities
0
75
150
225
300
375
450
525
0 1 2 3 >3.67
Note: Data from March 2015. Sources: SEC Form PF, OFR analysis
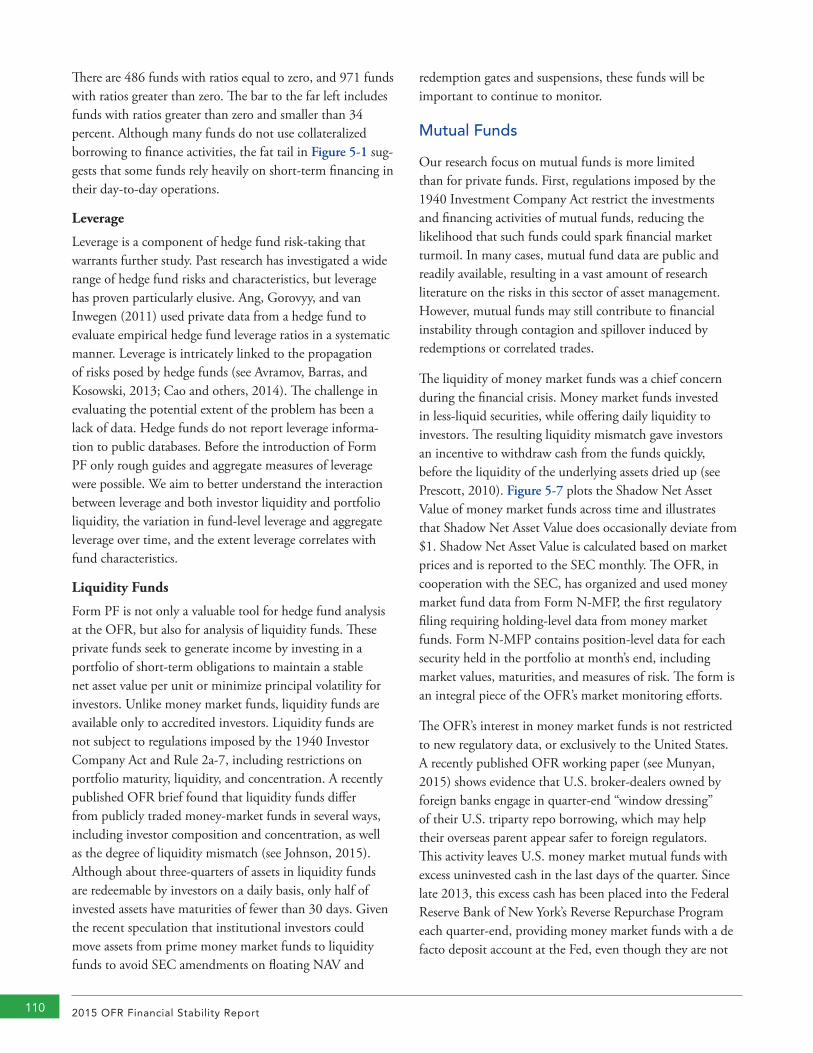
2015 OFR Financial Stability Report110
There are 486 funds with ratios equal to zero, and 971 funds with ratios greater than zero. The bar to the far left includes funds with ratios greater than zero and smaller than 34 percent. Although many funds do not use collateralized borrowing to finance activities, the fat tail in Figure 5-1 sug-gests that some funds rely heavily on short-term financing in their day-to-day operations.
Leverage
Leverage is a component of hedge fund risk-taking that warrants further study. Past research has investigated a wide range of hedge fund risks and characteristics, but leverage has proven particularly elusive. Ang, Gorovyy, and van Inwegen (2011) used private data from a hedge fund to evaluate empirical hedge fund leverage ratios in a systematic manner. Leverage is intricately linked to the propagation of risks posed by hedge funds (see Avramov, Barras, and Kosowski, 2013; Cao and others, 2014). The challenge in evaluating the potential extent of the problem has been a lack of data. Hedge funds do not report leverage informa-tion to public databases. Before the introduction of Form PF only rough guides and aggregate measures of leverage were possible. We aim to better understand the interaction between leverage and both investor liquidity and portfolio liquidity, the variation in fund-level leverage and aggregate leverage over time, and the extent leverage correlates with fund characteristics.
Liquidity Funds
Form PF is not only a valuable tool for hedge fund analysis at the OFR, but also for analysis of liquidity funds. These private funds seek to generate income by investing in a portfolio of short-term obligations to maintain a stable net asset value per unit or minimize principal volatility for investors. Unlike money market funds, liquidity funds are available only to accredited investors. Liquidity funds are not subject to regulations imposed by the 1940 Investor Company Act and Rule 2a-7, including restrictions on portfolio maturity, liquidity, and concentration. A recently published OFR brief found that liquidity funds differ from publicly traded money-market funds in several ways, including investor composition and concentration, as well as the degree of liquidity mismatch (see Johnson, 2015). Although about three-quarters of assets in liquidity funds are redeemable by investors on a daily basis, only half of invested assets have maturities of fewer than 30 days. Given the recent speculation that institutional investors could move assets from prime money market funds to liquidity funds to avoid SEC amendments on floating NAV and
redemption gates and suspensions, these funds will be important to continue to monitor.
Mutual Funds
Our research focus on mutual funds is more limited than for private funds. First, regulations imposed by the 1940 Investment Company Act restrict the investments and financing activities of mutual funds, reducing the likelihood that such funds could spark financial market turmoil. In many cases, mutual fund data are public and readily available, resulting in a vast amount of research literature on the risks in this sector of asset management. However, mutual funds may still contribute to financial instability through contagion and spillover induced by redemptions or correlated trades.
The liquidity of money market funds was a chief concern during the financial crisis. Money market funds invested in less-liquid securities, while offering daily liquidity to investors. The resulting liquidity mismatch gave investors an incentive to withdraw cash from the funds quickly, before the liquidity of the underlying assets dried up (see Prescott, 2010). Figure 5-7 plots the Shadow Net Asset Value of money market funds across time and illustrates that Shadow Net Asset Value does occasionally deviate from $1. Shadow Net Asset Value is calculated based on market prices and is reported to the SEC monthly. The OFR, in cooperation with the SEC, has organized and used money market fund data from Form N-MFP, the first regulatory filing requiring holding-level data from money market funds. Form N-MFP contains position-level data for each security held in the portfolio at month’s end, including market values, maturities, and measures of risk. The form is an integral piece of the OFR’s market monitoring efforts.
The OFR’s interest in money market funds is not restricted to new regulatory data, or exclusively to the United States. A recently published OFR working paper (see Munyan, 2015) shows evidence that U.S. broker-dealers owned by foreign banks engage in quarter-end “window dressing” of their U.S. triparty repo borrowing, which may help their overseas parent appear safer to foreign regulators. This activity leaves U.S. money market mutual funds with excess uninvested cash in the last days of the quarter. Since late 2013, this excess cash has been placed into the Federal Reserve Bank of New York’s Reverse Repurchase Program each quarter-end, providing money market funds with a de facto deposit account at the Fed, even though they are not
Research on Financial Stability 111
banks. Further, as part of their strategy, dealers in aggregate seem to be reluctant to hold market-making inventory over a quarter-end, which may imply a reduction in bond market liquidity depth in the last days of the quarter. The implication is that non-dealer traders of bonds, including both mutual and private funds, may get lower prices if they need to sell during this time. This additional and predictable illiquidity, induced by window dressing, may have systemic implications, including an increased likelihood of fire-sale sell-offs or liquidity spirals.
Another area of interest to the OFR is Stable Value Funds, which are included in many retirement plans, but are not generally registered investment funds. Such funds contain an even bigger mismatch between the liquidity of assets and liabilities compared to money market funds, because they invest in longer-term fixed-income securities while providing daily liquidity to investors. These vehicles use swaps and wrap agreements with insurance companies to insure against adverse interest rate movements — a “wrap agreement” protects the fund in times of market volatility by smoothing out the losses and gains of the underlying investments. They may be vulnerable to short-term illiquidity in bond markets.
The wave of withdrawals from the Third Avenue Focused Credit Fund, a $788 million high-yield bond mutual fund, illustrates the risks of liquidity mismatch in some mutual funds. The withdrawals led the fund’s managers to take the unusual step of suspending further redemptions in early December, rather than liquidating assets at what it consid-ered to be fire-sale prices. The combination of weak funda-mentals and reaching for yield in recent market conditions makes a recurrence of such events likely.
As mentioned in Chapter 4, the SEC proposed in May 2015 an updated reporting regime for registered investment com-panies by introducing Form N-PORT to replace Form N-Q. Form N-Port will collect detailed data on mutual funds’ use of collateralized borrowing and lending, such as repurchase agreements and securities lending practices, as well as data on options and derivatives. Form N-PORT will improve the SEC’s oversight capability and fulfillment of its mandate for investor protection. Form N-PORT also presents opportu-nities for research on the risk implications of mutual funds. For example, the 1940 Investment Company Act restricts the use of explicit leverage in mutual funds, yet the implicit leverage employed by funds through the use of derivatives may far exceed regulated explicit leverage thresholds.
The extent that funds use short-term funding to meet unanticipated redemptions is important to understand the redemption risk faced by mutual funds.
Figure 5-7. Prime Money Market Fund Shadow Net Asset Values (as of June 30, 2015).Larger prime money market funds exhibit lower shadow net asset value volatility
2011 2012 2013 2014 2015
0.9950
0.9975
1.0000
1.0025
1.0050
1.0075
Break-the-Buck
Stable $1 NAV
Capital Gain
AUM = assets under managementNAV = net asset valueNote: Shadow NAV is calculated as market priced net asset value per share excluding capital support. All prime money market fund share prices for purposes of subscrip�ons and redemp�ons are normalized to $1 for comparison. Analysis excludes 287 filings from 13 funds deemed to be in error due to missing or inconsistent data. Analysis also excludes feeder funds, funds used to fund insurance company separate accounts, and Shadow NAVs of funds liquida�ng the same month.Sources: SEC Form N-MFP, OFR analysis
Funds with AUM greater than $1 bnFunds with AUM less than $1 bn
AUM = assets under managementNAV = net asset valueNote: Shadow NAV is calculated as market priced net asset value per share excluding capital support. All prime money market fund share prices for purposes of subscriptions and redemptions are normalized to $1 for comparison. Analysis excludes 287 filings from 13 funds deemed to be in error due to missing or inconsistent data. Analysis also excludes feeder funds, funds used to fund insurance company separate accounts, and Shadow NAVs of funds liquidating the same month.Sources: SEC Form N-MFP, OFR analysis
Agenda Ahead 113
The Office of Financial Research will continue to build on initiatives to improve the scope, quality, and accessibility of financial data, to advance
financial stability monitoring and research, and to evaluate financial stability policies.
In 2015, tangible output from those initiatives included fuller development of the legal entity identifier (LEI) system, progress in harmonizing and standardizing derivatives data reported to data repositories, and pilot data collections for repo and securities lending markets in collaboration with our regulatory partners. We published more than 30 high-quality, high-profile reports based on financial stability data, research, and policy studies, and we launched an OFR website for the public to access our work.
Achieving further success in core areas of our work requires coherence and coordination across initiatives related to data, research, and analysis. The OFR is developing technology tools, gathering market intelligence, and engaging with stakeholders in a virtual research-and-data community to strengthen our work in each core area.
The potential list of activities and projects within our core program areas is long. These may include the following:
• developing data elements and financial mapping to measure and track the evolution of key activities such as collateral use and management, and payments, clearing and settlement;
• developing and implementing reference databases, and financial instrument identifiers, data dictionaries, and data hubs;
• developing and implementing standards and best practices for financial data collection;
• developing further the toolkit to assess, measure, and monitor the risks in financial markets and institutions;
• evaluating stress tests for banks, nonbanks, and the financial system as a whole, and assessing ways to improve those tests;
• assessing, measuring, and monitoring risks arising from changes in the micro-structure of financial markets;
• assessing and tracking the migration of financial activity across the system and across jurisdictions;
• assessing and promoting best practices for financial risk management in diverse parts of the financial system, including management of hard-to-quantify risks such as operational risks, cyber security threats, and environmental risks; and
• conducting fundamental research into the causes, consequences, and mitigants of financial instability.
Priorities for 2016
In 2016, we will prioritize three core program areas:
1. Further improving the scope, quality, and accessibility of data available to regulators and market participants, especially related to new and emerging sources of potential vulnerability;
2. Further developing monitoring tools to track vulnerabilities and financial risks; and
Agenda Ahead 6
2015 OFR Financial Stability Report114
3. Conducting research and collecting data to help analyze and monitor risk in central counterparties, or CCPs.
Improve Data Scope, Quality, and Accessibility
The OFR has a mission to ensure that the scope, quality, and accessibility of financial data are fit for purpose and sufficient for effective use by policymakers and market participants. As described in Chapter 4 of this report, data scope refers to the comprehensiveness and granularity of data; data quality refers to the completeness, accuracy, and timeliness of data; and data accessibility refers to the ability to find, appropriately share, and secure data. Initiating work in core areas of concentration in all three dimensions is our top priority for 2016.
Improving Data Scope
We will push forward in 2016 with several initiatives to expand the scope of data available for financial stability anal-ysis. For example, we will begin preparations for permanent bilateral repo data and securities lending data collections. Working with our Financial Stability Oversight Council (FSOC) counterparts, we expect to begin implementation of those plans over the course of the year. We plan to require the use of the LEI, and other data standards as they become available, in all OFR data collections.
Improving the efficiency of regulatory data reporting and reducing overlap and duplication in data collections across the financial system are key objectives for the OFR. To those ends, we will publish a report describing best practices for regulatory data collections. The report will draw, in part, from lessons learned with our pilot repo data collection in 2015, and from longstanding data collections among our domestic and global counterparts. We are also working with FSOC member agencies and counterparts in other jurisdictions to explore best practices for data sharing and improving reporting efficiency.
Improving Data Quality
The OFR’s data quality program has two main goals. First, we will make progress developing a financial instrument reference database and related instrument identifiers. Financial instrument reference data can represent digital definitions of financial contracts — deconstructing contract and asset types into essential elements to describe terms and
conditions, descriptive content, instrument classes, exchange and clearing information, and other attributes. By designing it in a flexible manner to address a wide range of needs and users, we target the financial instrument reference data base to serve as an authoritative source for precise, common definitions, descriptive data, and syntax, which are essential for data to be shared, compared, aggregated, and exchanged. The data dictionary will also specify which unique instru-ment identifiers are applicable to each instrument category. The proposed long-term solution will include data, a data dictionary, and analytical tools. These components must be interoperable, with the data dictio nary and its contents the essential reference on which the others depend.
Second, we will continue to identify, develop, and imple-ment data standards in areas critical to financial stability, such as data related to derivatives, repos, and mortgage markets. This work will rely heavily on collaboration with the financial services industry, our FSOC colleagues, and our global counterparts in multilateral organizations such as the Committee on Payments and Market Infrastructure (CPMI), the International Organization of Securities Commissions (IOSCO) and the Financial Stability Board (FSB). The OFR has detailed, or loaned, staff to FSOC agencies. For example, OFR staff members are working at the Commodity Futures Trading Commission on detail to support swap data repository harmonization. While devel-oping identifiers for instruments, we will continue to work to make the LEI ubiquitous by encouraging regulators to mandate its use, and by using the system ourselves. As the OFR pursues data collections, we will require a LEI for all reporting entities.
In executing our data programs, the OFR will continue to collaborate with domestic and international authorities and industry standard-setting bodies. We are establishing a data stewardship function that will be the catalyst for internal collaboration on data quality improvement among the OFR’s Data, Research and Analysis, and Technology centers.
Improving Data Accessibility
In 2016, the OFR will pursue projects aimed at improving data accessibility within the regulatory community, and between the official sector and the public.
To have data accessible and shared, parties seeking data must know that the data exist. To that end, our first project will build upon the Interagency Data Inventory that catalogs
Agenda Ahead 115
basic information — a form of metadata — about data collected by FSOC member organizations from financial market participants (see OFR, 2015b). The inventory enables policymakers to learn about the data collections that exist and to gain a basic understanding of the data for a research or analytical need. Even when data cannot be shared due to legal or privacy reasons, often the metadata can be shared. The OFR will seek to help FSOC member organizations link their metadata catalogs or create such catalogs if they do not exist. Linked metadata catalogs will provide information about the availability and nature of data that are available for supervision, oversight, and financial stability monitoring. Once completed, linked catalogs can be the bases for crafting agreements for sharing data across the agencies and for cooperatively deciding to fill data gaps. The linked catalogs can also help in applying appropriate, consistent safeguards and controls to the data to assure confidentiality and security that facilitate collaboration and sharing of insights and information.
As implied above, another project will create and promote a set of best practices for data sharing, based on work by the FSOC Data Committee. These best practices will cover the data to be shared within the policy and regulatory com-munities, and between those communities and the public. They will balance the critical need for data security with the demand for more granular information required for moni-toring and research.
Developing best practices in data sharing includes investigating alternatives to overcoming barriers for securely sharing data. The OFR will work to improve and streamline information-sharing agreements, often contained in memorandums of understanding, or MOUs. We will collaborate on techniques, technologies, and the legal and operational frameworks needed to implement improve-ments in secure data sharing. And we will invite public discussion, where appropriate, to ensure that all avenues for improvement are explored.
Further Develop Monitoring Tools
A second OFR core area of concentration is developing mon-itoring tools to assess, measure, and monitor risks across the financial system. Monitoring activities stem from our analysis of new and emerging vulnerabilities as well as existing ones in the financial system. In either case, as we gain access to new datasets, we will incorporate them into our monitoring tools for both internal and external audiences.
The OFR has publicly launched two systemwide monitors, and both can be accessed on our website. The biannual Financial Stability Monitor, for which an update is included in Chapter 2 of this report, provides a snapshot of vulner-abilities in the financial system based on five functional areas of risk: macroeconomic, market, credit, funding and liquidity, and contagion. The monitor is designed to iden-tify, at a high level, underlying financial-system vulnerabili-ties. That focus recognizes that we cannot predict the timing or severity of financial shocks or of any potential resultant financial crisis. The Financial Markets Monitor gives a periodic overview of major developments and emerging trends in global capital markets.
To examine further risks in funding and liquidity, for example, we expect to make public our Money Market Fund Monitor, which we previewed at a public meeting of our external advisory committee in February 2015. The mon-itor employs monthly data provided to the Securities and Exchange Commission on Form N-MFP by money market funds registered under the SEC’s Rule 2a7. Using this frame-work, we can examine portfolio statistics and holdings for individual funds and the industry as a whole on the basis of credit, interest rate, and liquidity risk. Over time, we expect to expand the fund monitor by incorporating aggregate data from non-2a7 funds with similar characteristics.
Other monitors are being developed, among them:
• A credit default swap monitor, providing various financial stability metrics in that market, such as market concentration and interconnectivity;
• A hedge fund monitor, providing analytics on potential risks that could arise out of the hedge fund industry; and
• A correlation monitor, exploring cross-asset correla-tions through interactive visualizations.
Some monitors will use confidential data provided by the public and private sectors. In those cases, the OFR will strive to develop informative public products that can provide information with sufficient granularity to shed light on risks, while protecting the confidentiality of the data source.
In addition to monitors, our financial stability assessment includes the analytical and data quality work described in this report on repo and securities lending markets and on asset management activities that may introduce exces-sive liquidity mismatch or leverage risks into the financial
2015 OFR Financial Stability Report116
system. We will also continue to assess and measure risks arising from changes in market structure and the potential impacts on market liquidity. We will continue to track market innovations that create new and emerging methods for delivering core financial services, potentially where regulatory oversight is more limited. And we will continue to undertake innovative exploratory research on the causes and consequences of financial instability through the use of network analysis, agent-based models, and other techniques.
Assess Risks in Central Clearing and in Central Counterparties
A third OFR core area of concentration will evaluate and measure the vulnerabilities in central clearing and in central counterparties (CCPs). We have increasingly focused on the potential risks in CCPs in our annual reports and in recent papers and speeches, as have the FSOC and our interna-tional counterparts. The OFR’s Financial Research Advisory Committee recently recommended that we conduct further analysis and engage relevant national and international authorities to improve the quality of data available to eval-uate CCP operations.
As discussed in greater detail in chapters 3 and 5, central clearing is expected to improve risk management, efficiency, and transparency in derivatives markets. Clearing through CCPs will help shed light on previously opaque over-the-counter markets where parties may have been unable or unwilling to set appropriate monitoring mechanisms. By clearing all trades centrally, all parties are able to observe prices in illiquid markets, which can allow them to set funding requirements at a level appropriate to the price variation of each financial asset.
But the increased use of CCPs can also introduce concen-tration risks by replacing a network of bilateral relationships with a hub-and-spoke system focused on a small number of large CCPs. The contagion potential of a central counter-party is amplified by the procyclical nature of the “water-falls” that dictate the order in which financial resources will be tapped in the event of the default of a clearing member. Waterfall funding also creates correlation risks at times of stress because the costs of failure of weak clearing members are transferred to relatively stronger clearing members at a time that the latter may be unable to afford them.
Key questions include:
• How should CCPs and their regulators assess and assure resilience within CCPs and across the network?
• How should CCPs and their regulators set liquidity and loss buffers?
• What is the right governance model for CCPs?
There is already substantial work ongoing globally at central banks, market regulators, and multilateral organizations to assess such vulnerabilities and develop mitigants for them. As with all of our work, the OFR does not seek to duplicate those efforts. Our job is to complement that work with initiatives to fill gaps in analysis and data using the OFR’s unique mix of skills and mandates. With those consider-ations in mind, the OFR’s program on CCPs will cover financial stability risks. Four sets of activities will aim at that goal:
• Analyze CCP design, risks, risk management practices, and potential systemic impacts;
• Identify and address data gaps, potentially through a pilot data collection following the examples of our repo and securities lending pilot data collections in 2015;
• Develop tools for monitoring CCP activity and publicly publish data or monitors to aid the market in appropriately assessing risk exposures to CCPs; and,
• Evaluate policies that have been proposed to mitigate these risks.
To launch these initiatives successfully, it will be essential to provide context. Stating comprehensively what is known and not known about central clearing will serve as a frame-work for identifying and prioritizing gaps in analysis and data, and understanding how CCPs fit in with, and affect, the financial system.
Glossary 117
Glossary
Accommodation Expansionary monetary policy in which a central bank seeks to lower borrowing costs for businesses and households to make credit more easily available.
Accumulated Other Comprehensive Income (AOCI)
A component of bank equity that includes net unrealized gains (losses) on available-for-sale securities, accumulated net gains (losses) on cash flow hedges, cumulative foreign currency translation adjustments and minimum pension liability adjustments.
Agency Mortgage- Backed Securities
A mortgage-backed security issued or guaranteed by federal agencies or government-sponsored enterprises.
Advanced Approaches Under Basel III, the standard that U.S. banks with $250 billion or more in consolidated assets, or $10 billion or more in foreign exposures, must use to calculate risk-weighted assets. The advanced approaches require models based upon a bank’s experience with its internal rating grades. Smaller banks use a standardized approach that sets risk weights for asset classes.
Bank for International Settlements (BIS)
An international financial organization that serves central banks in their pursuit of monetary and financial stability, helps to foster international cooperation, and acts as a bank for central banks.
Bank Holding Company (BHC)
Any company that has direct or indirect control of one or more banks and is regulated and supervised by the Federal Reserve under the Bank Holding Company Act of 1956. BHCs may also own nonbanking subsidiaries such as broker-dealers and asset managers.
Basel Committee on Banking Supervision (BCBS)
An international forum for bank supervisors that aims to improve banking supervision worldwide. The BCBS develops guidelines and supervisory standards such as standards on capital adequacy, the core principles for effective banking supervision, and recommendations for cross-border banking supervision.
Basel III A comprehensive set of global regulatory standards to strengthen the regulation, supervision and risk management of the banking sector.. The reform measures, include bank level regulation and system wide regulation to strengthen firms’ capital, liquidity, risk management and public disclosures to reduce the banking system’s vulnerability to shocks.
Call Report A quarterly report of a bank’s financial condition and income that all federally insured U.S. depository institutions must file.
Capital Requirement The amount of capital a bank must hold to act as a cushion to absorb unanticipated losses and declines in asset values that could otherwise cause a bank to fail. U.S. banking regulators require banks to hold more high-quality, or Tier 1, capital against total risk-weighted assets under the Basel III international accord. Banks are classified as well capitalized, adequately capitalized, undercapitalized, significantly undercapitalized, or critically undercapitalized based on regulators’ capital and leverage calculations.
Captive Reinsurance Company
A subsidiary entity that provides reinsurance for affiliates of its parent company.
Carry Trade An investment strategy involving borrowing at low interest rates to purchase assets that yield higher returns.
Central Clearing A settlement system in which securities or derivatives of a specific type are cleared by one entity, a clearinghouse or central counterparty, which guarantees the trades. It is an alternative to bilateral or over-the-counter trading (see Over-the-Counter Derivatives).
Central Counterparty (CCP)
An entity that interposes itself between counterparties to contracts traded in one or more financial markets. A CCP becomes the buyer to every seller and the seller to every buyer to help ensure the performance of open contracts.

2015 OFR Financial Stability Report118
Clearing Bank A commercial bank that facilitates payment and settlement of financial transactions, such as check clearing or matching trades between the sellers and buyers of securities and other financial instruments or contracts.
Clearing Member A member of, or a direct participant in, a central counterparty (CCP) that is entitled to enter into a transaction with the CCP.
Clearing A system that facilitates the transfer of ownership of securities after they are traded.
Clearinghouse See Central Counterparty.
Collateral Any asset pledged by a borrower to guarantee payment of a debt.
Collateralized Loan Obligation (CLO)
Securities that hold pools of corporate loans and are sold to investors in tranches with varying levels of risk.
Commercial Paper (CP) Short-term (maturity of up to 270 days), unsecured corporate debt.
Comprehensive Capital Analysis and Review (CCAR)
The Federal Reserve’s annual exercise to ensure that the largest U.S. bank holding companies have robust, forward-looking capital planning processes that account for their unique risks and sufficient capital for times of financial and economic stress. The exercise also evaluates the banks’ individual plans to make capital distributions such as dividend payments or stock repurchases.
Concentration Risk Any single exposure or group of exposures with the potential to produce losses large enough to threaten a financial institution’s ability to maintain its core operations.
Conditional Value at Risk (CoVaR)
A measure of the value at risk of the financial system conditional on distress at a single financial institution, from Adrian and Brunnermeier (2011).
Correlation Risk The risk that the value of two or more assets will move in tandem, increasing a portfolio’s volatility and potentially leading to large, simultaneous losses. Correlation risk is typically mitigated through hedging.
Countercyclical The movement of a financial or macroeconomic variable in the opposite direction of the business or credit cycle (see Procyclical).
Countercyclical Capital Buffer
A component of Basel III that requires banks to build capital buffers during favorable economic periods that can be used to absorb losses in unfavorable periods.
Counterparty Risk The risk that the party on the other side of a contract, trade, or investment will default.
Covenant-lite Loans Loans that do not include typical covenants to protect lenders, such as requiring the borrower to deliver annual reports or restricting loan-to-value ratios.
Credit Default Swap (CDS) A bilateral contract protecting against the risk of default by a borrower. The buyer of CDS protection makes periodic payments to the seller and in return receives a payoff if the borrower defaults, similar to an insurance contract. The protection buyer does not need to own the loan covered by the swap.
Credit Risk The risk that a borrower may default on its obligations.
Credit Spread The difference in yield between a security and an otherwise similar security of higher quality.
Glossary 119
Cyclical Risk Any financial or economic risk that is closely tied to the business cycle.
Dark Pools Private electronic trading venues, also referred to as alternative trading systems, that allow institutional investors to anonymously buy and sell securities, primarily stocks. Unlike stock exchanges, dark pools do not publish pretrade prices for offers to buy and sell, and report transactions to regulators after a trade is executed.
Derivative A financial contract whose value is derived from the performance of underlying assets or market factors such as interest rates, currency exchange rates, and commodity, credit, and equity prices. Derivative transactions include structured debt obligations, swaps, futures, options, caps, floors, collars and forwards.
Distressed Insurance Premium (DIP)
An indicator of a firm’s vulnerability to systemic instability. DIP uses information from credit default swap spreads and equity prices to measure the implied cost of insuring a given firm against broader financial distress.
Dodd-Frank Act Short name for the Dodd-Frank Wall Street Reform and Consumer Protection Act of 2010, the most comprehensive financial reform legislation in the United States since the Great Depression. The Dodd-Frank Act seeks to promote financial stability by improving accountability in the financial system, adding transparency about over-the-counter (OTC) derivative markets, and protecting consumers from abusive financial services practices.
Duration Risk The risk associated with the sensitivity of the prices of bonds and other fixed-income securities to changes in the level of interest rates.
Emerging Markets (EM) Developing countries where investments are often associated with both higher returns and higher risk. EM countries fall between developed markets such as the United States and frontier markets that are more speculative.
Eurozone A group of 19 European Union countries that have adopted the euro as their currency.
Exchanged-Traded Fund An investment fund whose shares are traded on an exchange. Because ETFs are exchange-traded products, their shares are continuously priced unlike mutual funds which offer only end-of-day pricing. ETFs are often designed to track an index or a portfolio of assets.
Fair Value Models Models for determining the value of an asset based on the price at which the asset could be bought or sold between two willing parties.
Federal Financial Institutions Examination Council (FFIEC)
An interagency body that prescribes uniform principles, standards, and report forms for the federal examination of financial institutions. The FFIEC makes recommendations to promote uniformity in banking supervision. Members include the Federal Reserve, the FDIC, the NCUA, the OCC, the CFPB, and a representative of state financial supervisors.
Financial Contagion A scenario in which financial or economic shocks initially affect only a few financial market participants then spread to other financial sectors and countries in a manner similar to the transmission of a medical disease. Financial contagion can happen at both the international level and the domestic level.
Financial Intermediation Any financial service in which a third party or intermediary matches lenders and investors with entrepreneurs and other borrowers in need of capital. Often investors and borrowers do not have precisely matching needs, and the intermediary’s capital is put at risk to transform the credit risk and maturity of the liabilities to meet the needs of investors.
Financial Stability The condition in which the financial system is sufficiently functioning to provide its basic tasks for the economy, even under stress.

2015 OFR Financial Stability Report120
Financial Stability Oversight Council (FSOC)
Created by the Dodd-Frank Act, a collaborative U.S. governmental body with a statutory mandate that creates for the first time collective accountability for identifying risks and responding to emerging threats to financial stability. Chaired by the Secretary of the U.S. Treasury, the Council consists of 10 voting members and 5 nonvoting members, including the Director of the Office of Financial Research.
Financial Stability Board (FSB)
An international coordinating body that monitors financial system developments on behalf of the G-20 nations. The FSB was established in 2009 and is the successor to the earlier Financial Stability Forum.
Fire Sale The disorderly liquidation of assets to meet margin requirements or other urgent cash needs. Such a sudden sell-off can drive prices below their fair value. The quantities sold are large relative to the typical volume of transactions.
Fiscal Risk Risk stemming from deviations in fiscal policy from expectations.
Form N-MFP A monthly disclosure of portfolio holdings submitted by money market funds to the SEC, which makes the information publicly available. SEC Rule 30b1-7 established the technical and legal details of N-MFP filings.
Form PF A periodic report of portfolio holdings, leverage, and risk management submitted by hedge funds, private equity funds, and related entities. The report is filed with the SEC and CFTC, which keep the information confidential. The Dodd-Frank Act mandated the reporting to help the Council monitor financial stability risks.
Funding Liquidity The availability of credit to finance the purchase of financial assets.
General Collateral Finance (GCF)
An interdealer repurchase agreement (repo) market in which the Fixed Income Clearing Corporation plays the role of intraday central counterparty. Trades are netted at the end of each day and settled at the triparty clearing banks (see Triparty Repo).
Global Systemically Important Banks (G-SIBs)
Banks annually designated by the Basel Committee on Banking Supervision for having the potential to disrupt international financial markets. The designations are based on banks’ size, interconnectedness, complexity, dominance in certain businesses, and global scope.
Global Systemically Important Insurers (G-SIIs)
Insurance companies annually designated by the FSB for having the potential to disrupt international financial markets due to their size, market position, and global interconnectedness.
Haircut The discount at which an asset is pledged as collateral. For example, a $1 million bond with a 5 percent haircut would collateralize a $950,000 loan.
Hedge Fund A pooled investment vehicle available to accredited investors such as wealthy individuals, banks, insurance companies, and trusts. Hedge funds can charge a performance fee on unrealized gains, borrow more than one half of their net asset value, short sell assets they expect to fall in value, and trade complex derivative instruments that cannot be traded by mutual funds.
Hedging An investment strategy to offset the risk of a potential change in the value of assets, liabilities, or services. An example of hedging is buying an offsetting futures position in a stock, interest rate, or foreign currency.
High-Quality Liquid Assets (HQLA)
Assets such as central bank reserves, government bonds, and corporate debt that can be quickly and easily converted to cash during a stress period. U.S. banking regulators require large banks to hold HQLA to comply with the Liquidity Coverage Ratio.
High-Yield Bonds Instruments rated below investment grade that pay a higher interest rate than investment-grade securities because of the perceived credit risk.
Glossary 121
Implied Volatility The market’s estimate of the volatility of the price of an underlying asset. The current market price of an option contract can be used in a mathematical pricing model to calculate the level of volatility that market participants expect.
Initial Margin A percentage of the total market value of securities that an investor must pay to purchase securities with borrowed funds.
Interest Rate Swap A swap in which two parties swap interest rate cash flows, typically between a fixed rate and a floating rate (see Swap).
International Association of Insurance Supervisors (IAIS)
The IAIS represents insurance regulators and supervisors of more than 200 jurisdictions in nearly 140 countries. Its objectives are to promote consistent supervision of insurance companies and contribute to global financial stability.
International Monetary Fund (IMF)
An international organization created at the end of World War II to stabilize exchange rates and support international payment systems. The IMF provides credit to developing nations and those in economic distress, typically conditional on economic and financial reforms.
International Organization for Standardization (ISO)
The world’s largest developer of voluntary international standards in products, services, and practices.
International Swaps and Derivatives Association (ISDA)
An industry association of over-the-counter derivative market participants. The ISDA Master Agreement standardized derivative terms for counterparties to simplify netting and reduce legal risks.
Investment-Grade Bonds Securities that credit rating agencies determine carry less credit risk. Non-investment grade securities have lower ratings and a greater risk of default.
Legal Entity Identifier (LEI) A unique 20-digit alphanumeric code to identify each legal entity within a company that participates in global financial markets.
Leverage Leverage is created when an entity enters into borrowings, derivatives, or other transactions resulting in investment exposures that exceed equity capital.
Leverage Ratio The Tier 1 (highest quality) capital of a bank divided by its total exposure to derivatives, securities financing transactions, and on- and off-balance-sheet exposures. The Basel III bank capital standards set a minimum leverage ratio of 3 percent, but the Federal Reserve said it will require the largest U.S. banks to maintain a leverage ratio above 5 percent beginning in 2018.
Liquidity See Funding Liquidity and Market Liquidity.
Liquidity Coverage Ratio (LCR)
A Basel III standard to ensure that a bank maintains enough high-quality liquid assets to meet its anticipated liquidity needs for a 30-day stress period. The ratio applies to banks with $250 billion or more in total consolidated assets, or $10 billion or more in on-balance-sheet foreign exposure. A less-strict ratio is required of banks with $50 billion or more in total assets (see High-Quality Liquid Assets).
Liquidity Risk The risk that a firm will not be able to meet its current and future cash flow and collateral needs, both expected and unexpected, without materially affecting its daily operations or overall financial condition.
Living Wills Annual resolution plans required of U.S. banks with $50 billion or more in total consolidated assets and nonbank financial companies designated by the Council for supervision by the Federal Reserve. Each living will must describe how the company could be dismantled in a rapid, orderly way in the event of failure.
Loan-to-Value (LTV) Ratio The ratio of the amount of a loan to the value of an asset, typically expressed as a percentage. This is a key metric in the financing of a mortgage.
2015 OFR Financial Stability Report122
Local Operating Unit (LOU)
Private- or public-sector group authorized by the Global Legal Entity Identifier Foundation to register and issue LEIs. LOUs also validate and maintain reference data, and protect information that must be stored locally. Some jurisdictions may have multiple LOUs.
Macroeconomic Risk Risk from changes in the economy or macroeconomic policy.
Macroprudential Supervision
Supervision to promote the stability of the financial system as a whole (see Microprudential Supervision).
Margin Call A requirement by a broker that a borrower increase the collateral pledged against a loan in response to changes in the collateral’s value.
Margin Requirement Rules governing the necessary collateral for a derivative, loan, or related security required to cover, in whole or in part, the credit risk one party poses to another.
Market Depth The ability of a market to absorb excess demand to buy or sell a security without affecting the price quoted for subsequent trades. In a deep market, a large number of shares or other financial instruments can be purchased with little impact on prices.
Market Liquidity The ability of market participants to sell large positions with limited price impact and low transaction costs.
Market Microstructure In economics, the study of the process and outcomes of exchanging assets under explicit trading rules. Microstructure theory focuses on how specific trading mechanisms affect the price formation process.
Market Risk The risk that an asset’s value will change due to unanticipated movements in market prices.
Market-Making The process in which an individual or firm stands ready to buy and sell a particular stock, security, or other asset on a regular and continuous basis at a publicly quoted price. Market-makers usually hold inventories of the securities in which they make markets. Market-making helps to keep financial markets efficient.
Maturity Mismatch The difference between the maturities of an investor’s assets and liabilities. A mismatch affects the investor’s ability to survive a period of stress that may limit its access to funding and to withstand shocks in the yield curve. For example, if a company relies on short-term funding to finance longer-term positions, it will be subject to significant refunding risk that may force it to sell assets at low market prices or potentially suffer through significant margin pressure.
Maturity Transformation Funding long-term assets with short-term liabilities. This creates a maturity mismatch that can pose risks when short-term funding markets are constrained.
Metadata Data that provide information about the structure, format, or organization of other data.
Microprudential Supervision
Supervision of the activities of a bank, financial firm, or other components of a financial system (see Macroprudential Supervision).
Money Market Fund (MMF)
A fund that typically invests in government securities, certificates of deposit, commercial paper, or other highly liquid and low-risk securities. Some MMFs are governed by the SEC’s Rule 2a-7.
Mortgage Call Report A quarterly report of mortgage activity and company information created by state regulators and administered electronically through the Nationwide Mortgage Licensing System & Registry (NMLS).
Mortgage Servicing Rights (MSRs)
The right to service and collect loan payments and fees on a mortgage.
Glossary 123
mREITS Real estate investment trusts that borrow short-term funds in repo markets and invest in real estate, mortgages, and mortgage-backed securities.
Mutual Fund A pooled investment vehicle, regulated by the SEC, that can invest in stocks, bonds, money market instruments, other securities, or cash.
National Association of Insurance Commissioners (NAIC)
The NAIC represents state insurance regulators in the United States and the District of Columbia and 5 U.S. territories. Through the NAIC, state insurance regulators establish accreditation standards and practices, conduct peer review, and coordinate their regulatory oversights of insurance companies.
Net Asset Value The value of an entity’s assets minus its liabilities. For example, a mutual fund calculates its NAV daily by dividing the fund’s net value by the number of outstanding shares.
Net Stable Funding Ratio (NSFR)
A Basel III standard to ensure that a bank holds sufficient available stable funding to limit its funding risk from maturity mismatches between assets and liabilities. Available stable funding is the portion of a bank’s capital and liabilities expected to be reliable for at least one year.
Network A model consisting of a set of nodes, or financial institutions, and a set of payment obligations linking them, to show how financial interconnections can amplify market movements.
Operational Risk Risks occurring during the normal operation of a business, including, for example, failed internal processes, legal risk, and environmental risk.
Option A financial contract granting the holder the right, but not the obligation, to engage in a future transaction on an underlying security or real asset. For example, an equity call option provides the right, but not the obligation, for a fixed period to buy a block of shares at a fixed price.
Order Book A list of bids and offers a trading venue uses to match buyers and sellers. A limit order book is a record of unexecuted limit orders (an order to buy a stock at or below a specified price, or to sell a stock at or above a specified price) that are treated equally with other orders in terms of priority of execution. A central limit order book is a centralized database for all limit orders received by specialists and market- makers for different types of securities.
Originate To extend credit after processing a loan application. Banks, for example, originate mortgage loans and either hold them until maturity or distribute them to other financial market participants. The distribution can include a direct sale or a securitization of a portion of the credit at the time of origination or later.
Over-the-Counter (OTC) Derivatives
Deals negotiated privately between two parties rather than traded on a formal securities exchange. Unlike standard exchange-traded products, OTC derivatives can be tailored to fit specific needs, such as the effect of a foreign exchange rate or commodity price over a given period.
Price Discovery The process of determining the prices of assets in the market place through the interactions of buyers and sellers.
Primary Dealer Banks and securities broker-dealers designated by the Federal Reserve Bank of New York to serve as trading counterparties when the FRBNY is carrying out U.S. monetary policy. Among other things, primary dealers are required to participate in all auctions of U.S. government debt and to make markets for the FRBNY when it transacts on behalf of its foreign official accountholders. A primary dealer buys government securities directly and can sell them to other market participants.
Procyclical Financial or economic indicators that tend to move in the same direction as the overall economy (see Countercyclical).
Qualified Mortgage (QM) Under the Dodd-Frank Act, a mortgage loan that meets certain underwriting criteria set by the CFPB. The originator of a QM has certain protections from borrower lawsuits alleging the originator failed to make a good faith and reasonable determination of the borrower's ability to repay the loan.
2015 OFR Financial Stability Report124
Qualified Residential Mortgage (QRM)
Under the Dodd-Frank Act, a mortgage loan exempt from the requirement that sponsors of asset-backed securities must retain at least 5 percent of the credit risk of the assets collateralizing the securities.
Quantitative Easing (QE) An unconventional monetary policy to stimulate growth when policy rates are close to zero by purchasing government or other securities from private institutions.
Refinancing Risk The risk that a borrower will face liquidity problems if unable to roll over existing debt.
Reinsurance The risk management practice of insurers to transfer some of their policy risk to other insurers. A second insurer, for example, could assume the portion of liability in return for a proportional amount of the premium income.
Repo Run A situation in which repurchase agreement (repo) investors lose confidence in the market due to concerns about counterparties, collateral, or both, and respond by pulling back their funding or demanding larger haircuts.
Repurchase Agreement (Repo)
A transaction in which one party sells a security to another party and agrees to repurchase it at a certain date in the future at an agreed price. Banks often do this on an overnight basis as a form of liquidity that is similar to a collateralized loan.
Resolution Plans See Living Wills.
Risk Management The business and regulatory practice of identifying and measuring risks and developing strategies and procedures to limit them. Categories of risk include credit, market, liquidity, operations, model, and regulatory.
Risk Retention Under the Dodd-Frank Act, a requirement that issuers of asset-backed securities must retain at least 5 percent of the credit risk of the assets collateralizing the securities. The regulation also prohibits a securitizer from directly or indirectly hedging the credit risk (see Qualified Residential Mortgage).
Run Risk The risk that investors lose confidence in a market participant due to concerns about counterparties, collateral, solvency, or related issues and respond by pulling back their funding or demanding more margin or collateral.
Search for Yield (Reach for Yield)
The practice of accepting greater risks in hopes of earning higher than average returns.
Securities Financing The transfer or lending of securities from one party to another. A borrower of securities puts up collateral in the form of shares, bonds, or cash, and is obliged to return the securities on demand. These transactions provide liquidity in the market.
Securities Lending/Borrowing
The temporary transfer of securities from one party to another for a specified fee and time period in exchange for collateral in the form of cash or securities.
Senior Supervisors Group (SSG)
The Senior Supervisors Group (SSG) is a forum for senior representatives of supervisory authorities to engage in dialogue on risk management practices, governance, and other issues concerning complex, globally-active financial institutions. The group is comprised of senior executives from the bank supervisory authorities of those institutions’ home jurisdictions.
Settlement The process by which securities are transferred and settled by book entry according to a set of exchange rules. Some settlement systems can include institutional arrangements for confirmation, clearance, and settlement of securities trades and safekeeping of securities.
Shadow Banking System Credit intermediation outside the insured depository system, involving leverage, maturity transformation, and the creation of money-like liabilities.
Glossary 125
Short-Term Wholesale Funding
Funding instruments typically issued to institutional investors to raise large amounts of funding for short periods. Examples include large time deposits, commercial paper, and repurchase agreements.
Spread The difference in yields between various private debt instruments and government securities of comparable maturity. The spread can be used as one of many indicators of financial stability.
Stress Test An exercise that shocks asset prices by a pre-specified amount, sometimes along with other financial and economic variables, to observe the effect on financial institutions or markets. Under the Dodd-Frank Act, banking regulators run annual stress tests of the biggest U.S. bank holding companies.
Supplemental Leverage Ratio
Under Basel III, the ratio of a bank’s Tier 1 (high quality) capital to its total leverage exposure, which includes all on-balance-sheet assets and many off-balance-sheet exposures. U.S. regulators require a 3 percent ratio for most banks with $250 billion or more in consolidated assets or $10 billion or more in foreign exposures. The eight large U.S. banks designated as global systemically important banks by the Financial Stability Board must maintain a ratio of 5 percent.
Swap An exchange of cash flows agreed by two parties with defined terms over a fixed period.
Swap Data Repository (SDR)
A central recordkeeping facility that collects and maintains a database of swap transaction terms, conditions, and other information. In some countries, SDRs are referred to as trade repositories.
Swap Execution Facility Under the Dodd-Frank Act, a trading platform market participants use to execute and trade swaps by accepting bids and offers made by other participants.
Systemic Expected Shortfall (SES)
A systemic risk indicator that estimates the extent to which the market value equity of a financial firm would be depleted by a decline in equity prices.
Tail Risk The low-probability risk of an extreme event moving an asset price.
Tier 1 Capital Ratio and Tier 1 Common Capital Ratio
Two measurements comparing a bank’s capital to its risk-weighted assets to show its ability to absorb unexpected losses. Tier 1 capital includes common stock, preferred stock, and retained earnings. Tier 1 common capital excludes preferred stock.
Total Loss Absorbing Capacity (TLAC)
A mix of long-term debt and equity that global systemically important bank holding companies would be required under recent proposals to hold sufficient to absorb losses and implement an orderly resolution without resorting to taxpayer-funded bailouts or extraordinary government measures.
Triparty Repo A repurchase agreement in which a third party, such as a clearing bank, acts as an intermediary for the exchange of cash and collateral between two counterparties. In addition to providing operational services to participants, agents in the U.S. triparty repo market extend intraday credit to facilitate settlement of triparty repos.
Volatility Risk The risk in the value of a portfolio from unpredictable changes in the volatility of a risk factor or underlying asset.
Volcker Rule A provision of the Dodd-Frank Act that generally prohibits a bank from certain investment activities that are not directly related to trading for customers or for market-making. The provision also limits insured depository institutions from owning or sponsoring hedge funds or private equity funds.
XBRL (eXtensible Business Reporting Language)
A common computer language for the electronic communication of business and financial data. Regulators can use XBRL as an efficient way to obtain information from companies.
XML (eXtensible Markup Language)
A common computer language that defines a set of rules for the semantic markup of documents.
Bibliography 127
Bibliography
Acemoglu, Daron, Azarakhsh Malekian, and Asuman Ozdaglar. “Network Security and Contagion.” Working Paper no. 19174, Cambridge, Mass.: National Bureau of Economic Research, June 2013. http://www.nber.org/papers/w19174 (accessed November 17, 2015).
Acemoglu, Daron, Asuman Ozdaglar, and Alireza Tahbaz-Salehi. Networks, Shocks, and Systemic Risk. In: Bramoulle, Yann, Andrea Galeotti, and Brian Rogers eds. The Oxford Handbook on the Economics of Networks. Oxford: Oxford University Press, 2015, 21.1–21.36. http://economics.mit.edu/files/10423 (accessed November 25, 2015).
Acharya, Viral V., and S. Viswanathan. “Leverage, Moral Hazard, and Liquidity.” The Journal of Finance 66, no. 1 (2011, February): 99–138. http://dx.doi.org/10.1111/j.1540-6261.2010.01627.x (accessed November 25, 2015).
Adams, Zeno, Roland Fuss, and Reint Gropp. “Spillover Effects Among Financial Institutions: A State-Dependent Sensitivity Value-at-Risk Approach.” Journal of Financial and Quantitative Analysis 49, no. 3 (2014, June): 575–598. http://journals.cambridge.org/article_S0022109014000325 (accessed November 25, 2015).
Adrian, Tobias, Brian Begalle, Adam Copeland, and Antoine Martin. “Repo and Securities Lending.” Staff Report no. 529, New York: Federal Reserve Bank of New York, February 2013. http://www.newyorkfed.org/research/staff_reports/sr529.pdf (accessed November 17, 2015).
Adrian, Tobias, Daniel Covitz, and Nellie Liang. “Financial Stability Monitoring.” Staff Report no. 2013-21, New York: Federal Reserve Bank of New York, March 2013. http://www.federalreserve.gov/pubs/feds/2013/201321/201321pap.pdf (accessed September 18, 2015).
Adrian, Tobias, Patrick de Fontnouvelle, Emily Yang, and Andrei Zlate. “Macroprudential Policy: Case Study from a Tabletop Exercise.” Staff Report no. 742, New York: Federal Reserve Bank of New York, September 2015a. https://www.newyorkfed.org/research/staff_reports/sr742.html (accessed November 25, 2015).
Adrian, Tobias, Michael Fleming, Jonathan Goldberg, Morgan Lewis, Fabio Natalucci, and Jason Wu. “Dealer Balance Sheet Capacity and Market Liquidity During the 2013 Selloff in Fixed-Income Markets.” FEDS Notes Series, Washington: Board of Governors of the Federal Reserve System, October 16, 2013. http://www.federalreserve.gov/econresdata/notes/feds-notes/2013/dealer-balance-sheet-capacity-and-market-liquidity-during-the-2013-selloff-in-fixed-income-markets-20131016.html (accessed November 17, 2015).
Adrian, Tobias, Michael Fleming, Daniel Stackman, and Erik Vogt. Has Liquidity Risk in the Treasury and Equity Markets Increased? Online Content, New York: FRBNY, October 6, 2015b. http://libertystreeteconomics.newyorkfed.org/2015/10/has-liquidity-risk-in-the-treasury-and-equity-markets-increased.html#.Vko14LerTmE (accessed December 2, 2015).
Afonso, Gara, João Santos, and James Traina. “Do ‘Too-Big-to-Fail’ Banks Take On More Risk?” Economic Policy Review 20, no. 2 (2014, December): 41–58. https://www.newyorkfed.org/research/epr/2014/1412afon.html (accessed November 24, 2015).
Agarwal, Vikas, Vyacheslav Fos, and Wei Jiang. “Inferring Reporting-Related Biases in Hedge Fund Databases from Hedge Fund Equity Holdings.” Management Science 59, no. 6 (2013): 1271–1289. http://dx.doi.org/10.1287/mnsc.1120.1647 (accessed November 25, 2015).
Aguiar, Andrea, Rick Bookstaber, and Thomas Wipf. “A Map of Funding Durability and Risk.” OFR Working Paper no. 14-03, Washington: Office of Financial Research, May 29, 2014. http://financialresearch.gov/working-papers/files/OFRwp2014-03_AguiarBookstaberWipf_MapofFundingDurabilityandRisk.pdf (accessed November 17, 2015).
Aiken, Adam L., Christopher P. Clifford, and Jesse Ellis. “Out of the Dark: Hedge Fund Reporting Biases and Commercial Databases.” Review of Financial Studies 26, no. 1 (2013): 208–243. http://rfs.oxfordjournals.org/content/26/1/208.abstract (accessed November 24, 2015).
Aikman, David, Michael T. Kiley, Seung Jung Lee, Michael G. Palumbo, Missaka N. Warusawitharana, and others. “Mapping Heat in the U.S. Financial System.” Finance and Economics Discussion Series Paper no. 2015-059, Washington: Board of Governors of the Federal Reserve System, August 2015. http://www.federalreserve.gov/econresdata/feds/2015/files/2015059pap.pdf (accessed November 23, 2015).
2015 OFR Financial Stability Report128
Allahrakha, Meraj, Paul Glasserman, and H. Peyton Young. “Systemic Importance Indicators for 33 U.S. Bank Holding Companies: An Overview of Recent Data.” OFR Brief no. 15-01, Washington: Office of Financial Research, February 12, 2015. http://financialresearch.gov/briefs/files/2015-02-12-systemic-importance-indicators-for-us-bank-holding-companies.pdf (accessed November 24, 2015).
Ang, Andrew, Sergiy Gorovyy, and Gregory B. van Inwegen. “Hedge Fund Leverage.” Journal of Financial Economics 102, no. 1 (2011): 102 – 126. http://www.sciencedirect.com/science/article/pii/S0304405X11001425 (accessed November 25, 2015).
Antoniewicz, Rochellee, and Jane Heinrichs. The Role and Activities of Authorized Participants of Exchange-Traded Funds, Washington, Investment Company Institute, March 2015. https://www.ici.org/pdf/ppr_15_aps_etfs.pdf (accessed November 25, 2015).
Aragon, George O., and Philip E. Strahan. “Hedge Funds as Liquidity Providers: Evidence from the Lehman Bankruptcy.” Journal of Financial Economics 103, no. 3 (2012): 570 – 587. http://www.sciencedirect.com/science/article/pii/S0304405X11002364 (accessed November 25, 2015).
Avery, Robert, Kenneth Brevoort, Ian Keith, Ismail Mohamed, Forrest Pafenberg, Jay Schultz, and Claudia Wood. “National Mortgage Database Technical Report.” Technical Report no. 15-01, Washington: Consumer Financial Protection Bureau, August 27, 2015. http://files.consumerfinance.gov/f/201508_cfpb_national-mortgage-database-technical-report-15-01.pdf (accessed November 16, 2015).
Avramov, Doron, Laurent Barras, and Robert Kosowski. “Hedge Fund Return Predictability Under the Magnifying Glass.” Journal of Financial and Quantitative Analysis 48, no. 4 (2013, August): 1057–1083. http://journals.cambridge.org/article_S0022109013000422 (accessed November 25, 2015).
Baklanova, Viktoria. “Repo and Securities Lending: Improving Transparency with Better Data.” OFR Brief Series no. 15-03, Washington: Office of Financial Research, April 23, 2015. http://financialresearch.gov/briefs/files/OFRbr-2015-03-repo-sec-lending.pdf (accessed November 16, 2015).
Baklanova, Viktoria, Adam Copeland, and Rebecca McCaughrin. “Reference Guide to U.S. Repo and Securities Lending Markets.” OFR Working Paper no. 15-17, Washington: Office of Financial Research, September 2015. http://financialresearch.gov/working-papers/files/OFRwp-2015-17_Reference-Guide-to-U.S.-Repo-and-Securities-Lending-Markets.pdf (accessed October 5, 2015).
Bank for International Settlements. Semiannual OTC Derivatives Statistics. Online Content: BIS, 2015a. http://www.bis.org/statistics/derstats.htm?m=6%7C32%7C71 (accessed November 19, 2015).
Bank for International Settlements: Basel Committee on Banking Supervision. Basel III: International Framework for Liquidity Risk Measurement, Standards and Monitoring, Basel: BIS, December 2010. http://www.bis.org/publ/bcbs188.htm (accessed December 2, 2015).
Bank for International Settlements: Basel Committee on Banking Supervision. Interpretive Issues with Respect to the Revisions to the Market Risk Framework, Basel: BIS, November 2011. http://www.bis.org/publ/bcbs208.pdf (accessed November 25, 2015).
Bank for International Settlements: Basel Committee on Banking Supervision. Progress in Adopting the Principles for Effective Risk Data Aggregation and Risk Reporting, Basel: BIS, December 2013. https://www.bis.org/publ/bcbs268.pdf (accessed November 25, 2015).
Bank for International Settlements: Basel Committee on Banking Supervision. The G-SIB Assessment Methodology – Score Calculation, Basel: BIS, November 2014a. http://www.bis.org/bcbs/publ/d296.pdf (accessed November 25, 2015).
Bank for International Settlements: Basel Committee on Banking Supervision. Progress in Adopting the Principles for Effective Risk Data Aggregation and Risk Reporting, Basel: BIS, January 2015b. http://www.bis.org/bcbs/publ/d308.pdf (accessed December 2, 2015).
Bank for International Settlements: Committee on Payment and Settlement Systems, and International Organization of Securities Commissions. Principles for Financial Market Infrastructures, Basel: BIS-IOSCO, April 2012. http://www.bis.org/cpmi/publ/d101a.pdf (accessed November 25, 2015).
Bank for International Settlements: Committee on the Global Financial System. Market-Making and Proprietary Trading: Industry Trends, Drivers and Policy Implications, CGFS Paper no. 52, Basel, CH: BIS, November 2014b. http://www.bis.org/publ/cgfs52.htm (accessed December 2, 2015).
Bibliography 129
Bank for International Settlements: Irving Fisher Committee on Central Bank Statistics. Data-Sharing: Issues and Good Practices, Basel: BIS, January 2015c. http://www.bis.org/ifc/events/7ifc-tf-report-datasharing.pdf (accessed November 25, 2015).
Bank of England. Financial Stability Report, London: BoE, June 2014. http://www.bankofengland.co.uk/publications/Documents/fsr/2014/fsrfull1406.pdf (accessed December 2, 2015).
Bank of England. Financial Stability Report, London: BoE, July 2015. http://www.bankofengland.co.uk/publications/Pages/fsr/2015/jul.aspx (accessed December 2, 2015).
Bank of Japan. Financial System Report, Tokyo: BoJ, October 2015. https://www.boj.or.jp/en/research/brp/fsr/data/fsr151023a.pdf (accessed November 25, 2015).
Bauer, Michael D., and Christopher J. Neely. “International Channels of the Fed’s Unconventional Monetary Policy.” FRBSF Working Paper no. 2012-12, San Francisco: Federal Reserve Bank of San Francisco, December 2013. http://www.frbsf.org/economic-research/files/wp12-12bk.pdf (accessed November 24, 2015).
Berg, Ted. “Quicksilver Markets.” OFR Brief no. 15-02, Washington: Office of Financial Research, March 17, 2015. http://financialresearch.gov/briefs/files/OFRbr-2015-02-quicksilver-markets.pdf (accessed November 17, 2015).
Bernanke, Ben, Carol Bertaut, Laurie DeMarco, and Steven Kamin. “International Capital Flows and the Returns to Safe Assets in the United States, 2003-2007.” International Finance Discussion Papers no. 1014, Washington: Board of Governors of the Federal Reserve System, February 2011. http://www.federalreserve.gov/Pubs/ifdp/2011/1014/ifdp1014.pdf (accessed December 2, 2015).
BlackRock Inc. Bond ETFs Benefits, Challenges, Opportunities. Online Content: BlackRock, July 2015. https://www.blackrock.com/corporate/en-us/literature/whitepaper/viewpoint-bond-etfs-benefits-challenges-opportunities-july-2015.pdf (accessed November 25, 2015).
Blancher, Nicolas, Srobona Mitra, Hanan Morsy, Akira Otani, Tiago Severo, and Laura Valderrama. “Systemic Risk Monitoring (’SysMo’) Toolkit-A User Guide.” IMF Working Paper no. 13/168, Washington: International Monetary Fund, July 17, 2013. https://www.imf.org/external/pubs/cat/longres.aspx?sk=40791 (accessed November 20, 2015).
Bloomberg Swap Data Repository. Swap Data Repository. Online Content: BSDR, 2015. http://www.bloombergsdr.com/ (accessed November 19, 2015).
Board of Governors of the Federal Reserve System. Federal Reserve Board Proposes Rule to Further Strengthen the Capital Positions of the Largest, Most Systemically Important U.S. Bank Holding Companies. Press Release, December 9, 2014, Washington: Board of Governors. http://www.federalreserve.gov/newsevents/press/bcreg/20141209a.htm (accessed November 25, 2015).
Board of Governors of the Federal Reserve System. Calibrating the GSIB Surcharge, Washington: Board of Governors, July 20, 2015a. http://www.federalreserve.gov/aboutthefed/boardmeetings/gsib-methodology-paper-20150720.pdf (accessed December 2, 2015).
Board of Governors of the Federal Reserve System. Minutes of the Federal Open Market Committee, Washington: Board of Governors, March 17-18, 2015b. http://www.federalreserve.gov/monetarypolicy/fomcminutes20150318.htm (accessed November 25, 2015).
Board of Governors the Federal Reserve System. Total Loss-Absorbing Capacity, Long-Term Debt, and Clean Holding Company Requirements for Systemically Important U.S. Bank Holding Companies and Intermediate Holding Companies of Systemically Important Foreign Banking Organizations; Regulatory Capital Deduction for Investments in Certain Unsecured Debt of Systemically Important U.S. Bank Holding Companies. Proposed Rule, Washington: Board of Governors, Federal Register 80, no. 229, November 30, 2015c. https://www.federalregister.gov/articles/2015/11/30/2015-29740/total-loss-absorbing-capacity-long-term-debt-and-clean-holding-company-requirements-for-systemically (accessed December 4, 2015).
Bookstaber, Rick, Jill Cetina, Greg Feldberg, Mark Flood, and Paul Glasserman. “Stress Tests to Promote Financial Stability: Assessing Progress and Looking to the Future.” OFR Working Paper no. 0010, Washington: Office of Financial Research, July 18, 2013. http://financialresearch.gov/working-papers/files/OFRwp0010_BookstaberCetinaFeldbergFloodGlasserman_StressTeststoPromoteFinancialStability.pdf (accessed November 18, 2015).
2015 OFR Financial Stability Report130
Bookstaber, Rick, Mark Paddrik, and Brian Tivnan. “An Agent-based Model for Financial Vulnerability.” OFR Working Paper no. 2014-05, Washington: Office of Financial Research, September 2014. http://financialresearch.gov/working-papers/files/OFRwp2014-05_BookstaberPaddrikTivnan_Agent-basedModelforFinancialVulnerability_revised.pdf (accessed November 24, 2015).
Boss, Michael, Helmut Elsinger, Martin Summer, and Stefan Thurner. An Empirical Analysis of the Network Structure of the Austrian Interbank Market, Financial Stability Report no. 7, Wien, Austria, Oesterreichische Nationalbank, 2004. https://www.oenb.at/dms/oenb/Publikationen/Finanzmarkt/Financial-Stability-Report/2004/Financial-Stability-Report-07/chapters/fsr7_networkinterbankmarket_tcm16-9507.pdf (accessed December 2, 2015).
Boyson, Nicole M., Christof W. Stahel, and René M. Stulz. “Hedge Fund Contagion and Liquidity Shocks.” The Journal of Finance 65, no. 5 (2010, October): 1789–1816. http://dx.doi.org/10.1111/j.1540-6261.2010.01594.x (accessed November 25, 2015).
Brainard, Lael. “The Federal Reserve’s Financial Stability Agenda.” Speech at the Hutchins Center on Fiscal and Monetary Policy, The Brookings Institution. Washington, December 3, 2014. http://www.federalreserve.gov/newsevents/speech/brainard20141203a.htm (accessed December 2, 2015).
Brunnermeier, Markus K., and Lasse Heje Pedersen. “Market Liquidity and Funding Liquidity.” Review of Financial Studies 22, no. 6 (2009): 2201–2238. http://rfs.oxfordjournals.org/content/22/6/2201.short (accessed November 25, 2015).
Buldyrev, Sergey V., Roni Parshani, Gerald Paul, H. Eugene Stanley, and Shlomo Havlin. “Catastrophic Cascade of Failures in Interdependent Networks.” Nature 464 (2010, April): 1025–1028. http://www.nature.com/nature/journal/v464/n7291/full/nature08932.html (accessed November 25, 2015).
Caccioli, Fabio, Munik Shrestha, Cristopher Moore, and J. Doyne Farmer. “Stability Analysis of Financial Contagion Due to Overlapping Porfolios.” Journal of Banking & Finance 46 (2014, September): 233–245. http://www.sciencedirect.com/science/article/pii/S0378426614001885 (accessed November 25, 2015).
Cao, Charles, Bing Liang, Andrew W. Lo, and Lubomir Petrasek. “Hedge Fund Holdings and Stock Market Efficiency.” Finance and Economics Discussion Series no. 2014-36, Washington: Federal Reserve Board, May 2014. http://www.federalreserve.gov/pubs/feds/2014/201436/201436pap.pdf (accessed December 2, 2015).
Capponi, Agostino, W. Allen Cheng, and Sriram Rajan. “Systemic Risk: The Dynamics Under Central Clearing.” OFR Working Paper no. 15-08, Washington: Office of Financial Research, May 2015. http://financialresearch.gov/working-papers/files/OFRwp-2015-08_Systemic-Risk-The-Dynamics-under-Central-Clearing.pdf (accessed October 20, 2015).
Cetina, Jill. “Incorporating Liquidity Shocks and Feedbacks in Bank Stress Tests.” OFR Brief no. 15-06, Washington: Office of Financial Research, July 2015. http://financialresearch.gov/briefs/files/OFRbr-2015-06-Incorporating-Liquidity-Shocks-and-Feedbacks-in-Bank-Stress-Tests.pdf (accessed November 23, 2015).
Cetina, Jill, John McDonough, and Sriram Rajan. “More Transparency Needed For Bank Capital Relief Trades.” OFR Brief no. 15-04, Washington: Office of Financial Research, June 11, 2015. http://financialresearch.gov/briefs/files/OFRbr-2015-04-bank-capital-reflief-trades.pdf (accessed October 2, 2015).
Christensen, Ian, Gitanjali Kumar, Césaire Meh, and Lorie Zorn. “Assessing Vulnerabilities in the Canadian Financial System.” Bank of Canada: Financial System Review 37 (2015, June): 37–46. http://www.bankofcanada.ca/wp-content/uploads/2015/06/fsr-june15-christensen.pdf (accessed December 2, 2015).
Cihák, Martin, Sharika Teh Sharifuddin, Kalin Tintchev, and Sònia Muñoz. “Financial Stability Reports: What Are They Good For?” IMF Working Paper no. 12/1, Washington: International Monetary Fund, January 2012. https://www.imf.org/external/pubs/ft/wp/2012/wp1201.pdf (accessed November 20, 2015).
CME Group. CME Swap Data Repository. Online Content, Chicago: CME, 2015. http://www.cmegroup.com/trading/global-repository-services/cme-swap-data-repository.html (accessed December 2, 2015).
Committee on Payments and Market Infrastructures, and International Organization of Securities Commissions. CPMI and IOSCO Begin Review of CCP Stress Testing. Press Release, March 11, 2015a, Basel: CPMI-IOSCO. http://www.bis.org/press/p150311.htm (accessed November 25, 2015).
Bibliography 131
Committee on Payments and Market Infrastructures and International Organization of Securities Commissions. Harmonisation of Key OTC Derivatives Data Elements (other than UTI and UPI) - First Batch, Consultative Report, Basel: CPMI-IOSCO, September 2015b. https://www.iosco.org/library/pubdocs/pdf/IOSCOPD503.pdf (accessed December 3, 2015).
Commodity Futures Trading Commission, and Securities and Exchange Commission. Findings Regarding the Market Events of May 6, 2010: Report of the Staffs of the CFTC and SEC to the Joint Advisory Committee on Emerging Regulatory Issues, Washington: CFTC, and SEC, September 30, 2010. https://www.sec.gov/news/studies/2010/marketevents-report.pdf (accessed December 2, 2015).
Commodity Futures Trading Commission. Derivatives Clearing Organization General Provisions and Core Principles. Final Rule, Washington: CFTC, Federal Register 76, no. 216, November 8, 2011. http://www.cftc.gov/ucm/groups/public/@lrfederalregister/documents/file/2011-27536a.pdf (accessed November 25, 2015).
Commodity Futures Trading Commission. Clearing Requirement Determination Under Section 2(h) of the CEA. Final Rule, Washington: CFTC, Federal Register 77, no. 240, December 13, 2012. http://www.cftc.gov/idc/groups/public/@lrfederalregister/documents/file/2012-29211a.pdf (accessed November 25, 2015).
Commodity Futures Trading Commission. Derivatives Clearing Organizations and International Standards. Final Rule, Washington: CFTC, Federal Register 78, no. 231, December 2, 2013a. http://www.cftc.gov/idc/groups/public/@lrfederalregister/documents/file/2013-27849a.pdf (accessed November 25, 2015).
Commodity Futures Trading Commission. The Euro Commission and the CFTC reach a Common Path Forward on Derivatives. Press Release, July 11, 2013b: CFTC. http://www.cftc.gov/PressRoom/PressReleases/pr6640-13 (accessed December 2, 2015).
Commodity Futures Trading Commission. Amendments to Swap Data Recordkeeping and Reporting Requirements for Cleared Swaps. Proposed Rule, Washington: CFTC, Federal Register 80, no. 168, August 31, 2015a. http://www.cftc.gov/idc/groups/public/@lrfederalregister/documents/file/2015-21030a.pdf (accessed November 25, 2015).
Commodity Futures Trading Commission. Data Recordkeeping. Online Content, Washington: CFTC, 2015b. http://www.cftc.gov/LawRegulation/DoddFrankAct/Rulemakings/DF_17_Recordkeeping/index.htm (accessed December 2, 2015).
Commodity Futures Trading Commission. Derivatives Clearing Organizations (DCO). Online Content, Washington: CFTC, 2015c. http://sirt.cftc.gov/sirt/sirt.aspx?Topic=ClearingOrganizations (accessed November 20, 2015).
Commodity Futures Trading Commission. Swap Data Repository Organizations. Online Content, Washington: CFTC, 2015d. http://sirt.cftc.gov/sirt/sirt.aspx?Topic=DataRepositories (accessed November 19, 2015).
Commodity Futures Trading Commission. Trading Organizations - Swap Execution Facilities. Online Content, Washington: CFTC, 2015e. http://sirt.cftc.gov/SIRT/SIRT.aspx?Topic=SwapExecutionFacilities (accessed November 25, 2015).
Commodity Futures Trading Commission. Weekly Swaps Report. Online Content, Washington: CFTC, 2015f. http://www.cftc.gov/MarketReports/SwapsReports/index.htm (accessed November 19, 2015).
Consumer Financial Protection Bureau. Home Mortgage Disclosure (Regulation C). Final Rule, Washington: CFPB, Federal Register 80, no. 208, October 28, 2015. https://www.federalregister.gov/articles/2015/10/28/2015-26607/home-mortgage-disclosure-regulation-c (accessed November 25, 2015).
Cont, Rama, Amal Moussa, and Edson B. Santos. Network Structure and Systemic Risk in Banking Systems. In: Fouque, Jean-Pierre, and Joseph Langsom eds. Handbook of Systemic Risks. Cambridge University Press, 2013, 327–368. http://www.stat.berkeley.edu/ aldous/206-SNET/Papers/cont.pdf (accessed November 25, 2015).
Craig, Ben, and Goetz von Peter. “Interbank Tiering and Money Center Banks.” Journal of Financial Intermediation 23, no. 3 (2014, February): 322–347. http://www.sciencedirect.com/science/article/pii/S1042957314000126 (accessed November 24, 2015).
Crouhy, Michel G., Robert A. Jarrow, and Stuart M. Turnbull. “The Subprime Credit Crisis of 2007.” Journal of Derivatives 16, no. 1 (2008, Fall): 81–110. http://www.iijournals.com/doi/abs/10.3905/jod.2008.710899 (accessed November 24, 2015).
Dattels, Peter, Rebecca McCaughrin, Ken Miyajima, and Jaume Puig. “Can You Map Global Financial Stability?” IMF Working Paper no. 10/145, Washington: International Monetary Fund, June 1, 2010. https://www.imf.org/external/pubs/cat/longres.aspx?sk=23947.0 (accessed November 20, 2015).
2015 OFR Financial Stability Report132
Department of Homeland Security. Strengthening the Security and Resilience of the Nation’s Critical Infrastructure. Online Content, Washington: DHS, September 9, 2015. http://www.dhs.gov/strengthening-security-and-resilience-nation%E2%80%99s-critical-infrastructure (accessed December 4, 2015).
Depository Trust & Clearing Corporation. DTCC. Online Content, New York: DTCC, 2015a. http://www.dtcc.com/repository-otc-data.aspx (accessed December 2, 2015).
Depository Trust & Clearing Corporation. DTCC Trade Information Warehouse. Online Content, New York: DTCC, 2015b. http://www.dtcc.com/repository-otc-data.aspx (accessed December 2, 2015).
Draghi, Mario. “Unemployment in the Euro Area.” Speech to the Annual Central Bank Symposium. Jackson Hole, Wyo., August 22, 2014. https://www.ecb.europa.eu/press/key/date/2014/html/sp140822.en.html (accessed November 24, 2015).
Dudley, Evan, and Mahendrarajah Nimalendran. “Margins and Hedge Fund Contagion.” Journal of Financial and Quantitative Analysis 46, no. 5 (2011, October): 1227–1257. http://journals.cambridge.org/article_S0022109011000342 (accessed November 24, 2015).
Dudley, William. “Regulation and Liquidity Provision.” Speech at the Securities Industry and Financial Markets Association Liquidity Forum. New York, September 30, 2015. http://www.newyorkfed.org/newsevents/speeches/2015/dud150930.html (accessed November 17, 2015).
Eisenberg, Larry, and Thomas H. Noe. “Systemic Risk in Financial Systems.” Management Science 47, no. 2 (2001, February): 236–249. http://www.jstor.org/stable/2661572 (accessed November 24, 2015).
Elliott, Matthew, Benjamin Golub, and Matthew O. Jackson. “Financial Networks and Contagion.” American Economic Review 104, no. 10 (2014): 3115–3153. https://www.aeaweb.org/articles.php?doi=10.1257/aer.104.10.3115 (accessed November 24, 2015).
Emery, Dana M., and Curtis Arledge. “Report to the Secretary of the Treasury from the Treasury Borrowing Advisory Committee of the Securities Industry and Financial Markets Association.” Letter, New York: Securities Industry and Financial Markets Association, November 6, 2013. http://www.treasury.gov/press-center/press-releases/Pages/jl2206.aspx (accessed November 25, 2015).
European Central Bank. Financial Stability Review. Online Content: ECB, 2015. https://www.ecb.europa.eu/pub/fsr/html/index.en.html (accessed November 20, 2015).
European Systemic Risk Board. Risk Dashboards. Online Content: ESRB, 2015. https://www.esrb.europa.eu/pub/rd/html/index.en.html (accessed November 20, 2015).
Federal Financial Institutions Examination Council. FR Y-15 Snapshots. Online Content, Washington: FFIEC, 2015. http://www.ffiec.gov/nicpubweb/nicweb/Y15SnapShot.aspx (accessed December 2, 2015).
Federal Insurance Office. Annual Report on the Insurance Industry, Washington: FIO, September 2014. https://www.treasury.gov/initiatives/fio/reports-and-notices/Documents/2014_Annual_Report.pdf (accessed December 3, 2015).
Federal Reserve Bank of New York. The Foreign Exchange and Interest Rate Derivatives Markets: Turnover in the United States, April 2013, New York: FRBNY, April 2013. https://www.newyorkfed.org/medialibrary/media/markets/pdf/2013triennialreport.pdf (accessed December 2, 2015).
Futures Industry Association. SEF Tracker. Online Content, Washington: FIA, 2015. https://fia.org/sef-tracker (accessed November 19, 2015).
Financial Research Advisory Committee. Central Counterparty Clearing Data Collection Recommendation, Washington: FRAC, July 23, 2015. http://financialresearch.gov/frac/files/OFR_Financial-Research-Advisory-Committee_FSRM-subcommittee_Central-Counterparty-Clearing-Data-Collection-Recommendation_REVISED_07-23-2015.pdf (accessed December 2, 2015).
Financial Services Information Sharing and Analysis Center. Financial Service - Information Sharing and Analysis Center. Online Content, San Diego, Calif.: FSISAC, 2015. https://www.fsisac.com/ (accessed December 4, 2015).
Financial Services Sector Coordinating Council. Financial Services Sector Coordinating Council for Critical Infrastructure Protection and Homeland Security. Online Content: FSSCC, 2015. https://www.fsscc.org/eweb/startpage.aspx (accessed November 20, 2015).
Bibliography 133
Financial Stability Board. Shadow Banking: Strengthening Oversight and Regulation: Recommendations of the Financial Stability Board, Basel: FSB, October 27, 2011. http://www.financialstabilityboard.org/wp-content/uploads/r_111027a.pdf?page_moved=1 (accessed November 25, 2015).
Financial Stability Board. Update of Group of Global Systemically Important Banks (G-SIBs), Basel: FSB, November 1, 2012. http://www.financialstabilityboard.org/wp-content/uploads/r_121031ac.pdf?page_moved=1 (accessed November 25, 2015).
Financial Stability Board. Global Systemically Important Insurers (G-SIIs) and the Policy Measures That Will Apply To Them, Basel: FSB, July 18, 2013a. http://www.financialstabilityboard.org/wp-content/uploads/r_130718.pdf?page_moved=1 (accessed November 25, 2015).
Financial Stability Board. Strengthening Oversight and Regulation of Shadow Board: Policy Framework for Addressing Shadow Banking Risks in Securities Lending and Repos, Basel: FSB, August 29, 2013b. http://www.financialstabilityboard.org/wp-content/uploads/r_130829b.pdf?page_moved=1 (accessed December 2, 2015).
Financial Stability Board. 2014 Update of List of Global Systemically Important Insurers, Basel: FSB, November 6, 2014a. http://www.financialstabilityboard.org/wp-content/uploads/r_141106a.pdf (accessed December 2, 2015).
Financial Stability Board. Feasibility Study on Approaches to Aggregate OTC Derivatives Data, Basel: FSB, September 19, 2014b. http://www.financialstabilityboard.org/wp-content/uploads/r_140919.pdf (accessed December 2, 2015).
Financial Stability Board. Global Shadow Banking Monitoring Report, Basel: FSB, November 4, 2014c. http://www.financialstabilityboard.org/2014/11/global-shadow-banking-monitoring-report-2014/ (accessed November 25, 2015).
Financial Stability Board. 2015 Update of List of Global Systemically Important Insurers, Basel: FSB, November 3, 2015a. http://www.financialstabilityboard.org/wp-content/uploads/FSB-communication-G-SIIs-Final-version.pdf (accessed November 25, 2015).
Financial Stability Board. Thematic Review on OTC Derivatives Trade Reporting: Peer Review Report, Basel: FSB, November 4, 2015b. http://www.financialstabilityboard.org/wp-content/uploads/Peer-review-on-trade-reporting.pdf (accessed November 25, 2015).
Financial Stability Board. Transforming Shadow Banking into Resilient Market-based Finance, Basel: FSB, November 18, 2015c. http://www.financialstabilityboard.org/wp-content/uploads/FSB-Standards-for-Global-Securities-Financing-Data-Collection.pdf (accessed November 25, 2015).
Financial Stability Oversight Council. 2014 Annual Report, Washington: FSOC, 2014. http://www.treasury.gov/initiatives/fsoc/Documents/FSOC%202014%20Annual%20Report.pdf (accessed November 25, 2015).
Financial Stability Oversight Council. 2015 Annual Report, Washington: FSOC, May 2015a. http://www.treasury.gov/initiatives/fsoc/studies-reports/Documents/2015%20FSOC%20Annual%20Report.pdf (accessed November 25, 2015).
Financial Stability Oversight Council. Financial Market Utility Designations. Online Content, Washington: FSOC, July 7, 2015b. http://www.treasury.gov/initiatives/fsoc/designations/Pages/default.aspx#FMU (accessed September 29, 2015).
Financial Stability Oversight Council. Qualified Financial Contracts Recordkeeping Related to Orderly Liquidation Authority. Proposed Rule, Washington: FSOC, Federal Register 80, no. 4, January 7, 2015c. http://www.gpo.gov/fdsys/pkg/FR-2015-01-07/pdf/2014-30734.pdf (accessed November 25, 2015).
Fitch Ratings Ltd. Global Bank Rating Criteria, New York: Fitch, March 20, 2015. https://www.fitchratings.com/creditdesk/reports/report_frame_render.cfm?rpt_id=863501 (accessed November 25, 2015).
Flood, Mark, and George Korenko. “Systematic Scenario Selection: Stress Testing and the Nature of Uncertainty.” Quantitative Finance 15, no. 1 (2015, January): 43–59. http://www.tandfonline.com/doi/abs/10.1080/14697688.2014.926018?journalCode=rquf20 (accessed December 2, 2015).
Flood, Mark, Phillip Monin, and Lina Bandyopadhyay. “Gauging Form PF: Data Tolerances in Regulatory Reporting on Hedge Fund Risk Exposures.” OFR Working Paper no. 15-13, Washington: Office of Financial Research, July 30, 2015. http://financialresearch.gov/working-papers/files/OFRwp-2015-13_Gauging-Form-PF.pdf (accessed November 25, 2015).
2015 OFR Financial Stability Report134
Fratzscher, Marcel, Marco Lo Duca, and Roland Straub. “On the International Spillovers of U.S. Quantitative Easing.” ECB Working Paper no. 1557, Frankfurt: European Central Bank, June 2013. https://www.ecb.europa.eu/pub/pdf/scpwps/ecbwp1557.pdf (accessed November 17, 2015).
Gai, Prasanna, and Sujit Kapadia. “Contagion in Financial Networks.” Proceedings of the Royal Society A 466 (2010): 2401–2423. http://rspa.royalsocietypublishing.org/content/royprsa/466/2120/2401.full.pdf (accessed November 24, 2015).
Gao, Jianxi, Sergey V. Buldyrev, H. Eugene Stanley, and Shlomo Havlin. “Networks Formed from Interdependent Networks.” Nature Physics 8 (2012): 40–48. http://www.nature.com/nphys/journal/v8/n1/full/nphys2180.html (accessed November 24, 2015).
Gârleanu, Nicolae, and Lasse Heje Pedersen. “Margin-based Asset Pricing and Deviations from the Law of One Price.” Review of Financial Studies 24, no. 6 (2011): 1980–2022. http://rfs.oxfordjournals.org/content/24/6/1980.abstract (accessed November 24, 2015).
Georgiadis, Georgios, and Johannes Gräb. “Global Financial Market Impact of the Announcement of the ECB’s Extended Asset Purchase Programme.” Globalization and Monetary Policy Institute Working Paper no. 232, Dallas, Texas: Federal Reserve Bank of Dallas, March 2015. https://www.dallasfed.org/assets/documents/institute/wpapers/2015/0232.pdf (accessed November 25, 2015).
Getmansky, Mila, Andrew W. Lo, and Igor Makarov. “An Econometric Model of Serial Correlation and Illiquidity in Hedge Fund Returns.” Journal of Financial Economics 74, no. 3 (2004, December): 529–609. http://www.sciencedirect.com/science/article/pii/S0304405X04000698 (accessed November 24, 2015).
Glasserman, Paul, Chulmin Kang, and Wanmo Kang. “Stress Scenario Selection by Empirical Likelihood.” Quantitative Finance 15, no. 1 (2015, January): 25–41. http://www.tandfonline.com/doi/abs/10.1080/14697688.2014.926019 (accessed November 25, 2015).
Glasserman, Paul, and Bert Loudis. “A Comparison of U.S. and International Global Systemically Important Banks.” OFR Brief no. 15-07, Washington: Office of Financial Research, August 2015. http://financialresearch.gov/briefs/files/OFRbr-2015-07_A-Comparison-of-US-and-International-Global-Systemically-Important-Banks.pdf (accessed September 30, 2015).
Glasserman, Paul, Ciamac Moallemi, and Kai Yuan. “Hidden Illiquidity with Multiple Central Counterparties.” OFR Working Paper no. 15-07, Washington: Office of Financial Research, May 7, 2015. http://financialresearch.gov/working-papers/files/OFRwp-2015-07_Hidden-Illiquidity-with-Multiple-Central-Counterparties.pdf (accessed December 2, 2015).
Glasserman, Paul, and H. Peyton Young. “Contagion in Financial Networks.” OFR Working Paper no. 15-21, Washington: Office of Financial Research, October 20, 2015a. http://financialresearch.gov/working-papers/files/OFRwp-2015-21_Contagion-in-Financial-Networks.pdf (accessed December 2, 2015).
Glasserman, Paul, and H. Peyton Young. “How Likely is Contagion in Financial Networks?” Journal of Banking & Finance 50 (2015b, January): 383–399. http://www.sciencedirect.com/science/article/pii/S0378426614000600 (accessed November 25, 2015).
Greenspan, Alan. Testimony of Alan Greenspan before the Financial Crisis Inquiry Commission. Testimony, Financial Crisis Inquiry Commission, April 7, 2010, Washington: Government Printing Office, 2010, 1–25. http://fcic-static.law.stanford.edu/cdn_media/fcic-docs/2010-04-07%20Alan%20Greenspan%20Written%20Testimony.pdf (accessed December 2, 2015).
Griffin, John M., and Gonzalo Maturana. “Who Facilitated Misreporting in Securitized Loans?” Review of Financial Studies (Forthcoming). http://papers.ssrn.com/sol3/papers.cfm?abstract_id=2256060 (accessed December 2, 2015).
Gromb, Denis, and Dimitri Vayanos. “Equilibrium and Welfare in Markets with Financially Constrained Arbitrageurs.” Journal of Financial Economics 66, no. 3 (2002, November-December): 361–407. http://www.sciencedirect.com/science/article/pii/S0304405X02002283 (accessed November 24, 2015).
Hameed, Allaudeen, Wenjin Kang, and S. Viswanathan. “Stock Market Declines and Liquidity.” The Journal of Finance 65, no. 1 (2010, January): 257–293. http://dx.doi.org/10.1111/j.1540-6261.2009.01529.x (accessed November 24, 2015).
Huang, Xuqing, Irena Vodenska, Shlomo Havlin, and H. Eugene Stanley. “Cascading Failures in Bi-partite Graphs: Model for Systemic Risk Propagation.” Scientific Reports 3, no. 1219 (2013, February): 1–8. http://www.ncbi.nlm.nih.gov/pmc/articles/PMC3564037/ (accessed November 24, 2015).
Bibliography 135
Hüser, Anne-Caroline. “Too Interconnected to Fail: A Survey of the Interbank Networks Literature.” SAFE Working Paper no. 91, Frankfurt: Goethe University Frankfurt, May 1, 2015. http://ssrn.com/abstract=2577241 (accessed September 21, 2015).
Information is Beautiful. World’s Biggest Data Breaches. Online Content: Information is Beautiful, August 11, 2015. http://www.informationisbeautiful.net/visualizations/worlds-biggest-data-breaches-hacks/ (accessed October 2, 2015).
Institute of Electrical and Electronics Engineers. IEEE Standards Glossary. Online Content, New York City: IEEE, March 11, 2010. https://www.ieee.org/education_careers/education/standards/standards_glossary.html#Interoperability (accessed November 24, 2015).
Intercontinental Exchange Trade Vault. ICE Trade Vault. Online Content: ICE, 2015. https://www.icetradevault.com/ (accessed November 19, 2015).
International Association of Insurance Supervisors. IAIS Develops Higher Loss Absorbency (HLA) Requirement for Global Systemically Important Insurers: Completes Second Step in Process to Develop Group-wide Global Insurance Capital Standards. Press Release, October 5, 2015, Basel: IAIS. http://iaisweb.org/index.cfm?event=getPage&persistId=1DBF672D155D89A40656517E9FE886D6# (accessed November 25, 2015).
International Monetary Fund. Global Financial Stability Report: Meeting New Challenges to Stability and Building a Safer System, Washington: IMF, April 2010. http://www.imf.org/external/pubs/ft/gfsr/2010/01/ (accessed November 25, 2015).
International Monetary Fund. The United States Spillover Report — 2011 Article IV Consultation, IMF Country Report no. 11/203, Washington: IMF, July 2011. https://www.imf.org/external/pubs/ft/scr/2011/cr11203.pdf (accessed November 25, 2015).
International Monetary Fund. Global Financial Stability Report: Navigating Monetary Policy Challenges and Managing Risks, Washington: IMF, April 2015a. http://www.imf.org/external/pubs/ft/gfsr/2015/01/ (accessed October 1, 2015).
International Monetary Fund. United States Financial Sector Assessment Program: Financial System Stability Assessment, Washington: IMF, July 2015b. http://www.imf.org/external/pubs/ft/scr/2015/cr15170.pdf (accessed December 2, 2015).
International Monetary Fund. United States Financial Sector Assessment Program: Systemic Risk Oversight and Management Technical Note, IMF Country Report no. 15/172, Washington: IMF, July 2015c. http://www.imf.org/external/pubs/ft/scr/2015/cr15172.pdf (accessed November 25, 2015).
International Swaps and Derivatives Association, Inc. ISDA Swaps Info. Online Content, New York: ISDA, 2015. http://www.swapsinfo.org/ (accessed December 2, 2015).
Johnson, David. “Private Fund Data Shed Light on Liquidity Funds.” OFR Brief no. 15-05, Washington: Office of Financial Research, July 9, 2015. http://financialresearch.gov/briefs/files/OFRbr-2015-05-Private-Fund-Data-Shed-Light-on-Liquidity-Funds.pdf (accessed November 24, 2015).
Kacperczyk, Marcin, and Philipp Schnabl. “When Safe Proved Risky: Commercial Paper During the Financial Crisis of 2007-2009.” Journal of Economic Perspectives 24, no. 1 (2010): 29–50. http://www.aeaweb.org/articles.php?doi=10.1257/jep.24.1.29 (accessed November 24, 2015).
Levy-Carciente, Sary, Dror Y. Kenett, Adam Avakian, H. Eugene Stanley, and Shlomo Havlin. “Dynamical Macro-Prudential Stress Testing Using Network Theory.” Journal of Banking & Finance 59 (2015, October): 164–181. http://www.sciencedirect.com/science/article/pii/S0378426615001454 (accessed December 2, 2015).
Massad, Timothy. “Keynote Address.” Speech at the Risk USA Conference. New York, October 22, 2012. http://www.cftc.gov/PressRoom/SpeechesTestimony/opamassad-31 (accessed November 25, 2015).
Massad, Timothy. “Keynote Address.” Speech at the Futures Industry Association Futures and Options Expo. Chicago, November 4, 2015. http://www.cftc.gov/PressRoom/SpeechesTestimony/opamassad-33 (accessed November 20, 2015).
Mitchell, Mark, and Todd Pulvino. “Arbitrage Crashes and the Speed of Capital.” Journal of Financial Economics 104, no. 3 (2012, June): 469 – 490. http://www.sciencedirect.com/science/article/pii/S0304405X11001991 (accessed November 24, 2015).
Moody’s Investors Service. Incorporation of Joint-Default Analysis into Moody’s Bank Rating Methodology, New York: Moody’s, February 2007. https://www.moodys.com/researchdocumentcontentpage.aspx?docid=PBC_102221 (accessed November 25, 2015).
2015 OFR Financial Stability Report136
Moody’s Investors Service. Rating Methodology: Banks, New York: Moody’s, March 16, 2015. https://www.moodys.com/researchdocumentcontentpage.aspx?docid=PBC_179038 (accessed December 14, 2015).
Munyan, Benjamin. “Regulatory Arbitrage in Repo Markets.” OFR Working Paper no. 15-22, Washington: Office of Financial Research, October 29, 2015. http://financialresearch.gov/working-papers/files/OFRwp-2015-22_Repo-Arbitrage.pdf (accessed November 25, 2015).
National Association of Insurance Commissioners. NAIC Statement Regarding Adoption of RMORSA Model Act and Revisions to AG38. Press Release, September 12, 2012: NAIC. http://www.naic.org/Releases/2012_docs/naic_statement_adoption_rmorsa_model_act_ag38.htm (accessed November 25, 2015).
National Association of Insurance Commissioners. NAIC ComFrame Development and Analysis (G) Working Group Discussion Draft on Approaches to a Group Capital Calculation, Washington: NAIC, July 23, 2015. http://www.naic.org/documents/committees_g_cfwg_related_us_group_capital_calc_draft.pdf (accessed November 25, 2015).
Neely, Christopher. “Unconventional Monetary Policy Had Large International Effects.” Working Paper no. 2010-018G, St. Louis, Mo.: Federal Reserve Bank of St. Louis, November 2010. http://research.stlouisfed.org/wp/2010/2010-018.pdf (accessed November 25, 2015).
NYU Stern Volatility Institute. V-Lab: System Risk Analysis. Online Content, New York: NYU, 2015. http://vlab.stern.nyu.edu/welcome/risk/ (accessed November 24, 2015).
Office of Financial Research. Asset Management and Financial Stability, Washington: OFR, September 2013. http://financialresearch.gov/reports/files/ofr_asset_management_and_financial_stability.pdf (accessed November 25, 2015).
Office of Financial Research. 2014 Annual Report, Washington: OFR, 2014. http://financialresearch.gov/annual-reports/files/office-of-financial-research-annual-report-2014.pdf (accessed November 25, 2015).
Office of Financial Research. Financial Stability Monitor. Online Content, Washington: OFR, 2015a. http://financialresearch.gov/financial-stability-monitor/ (accessed November 23, 2015).
Office of Financial Research. Interagency Data Inventory. Online Content, Washington: OFR, 2015b. http://financialresearch.gov/data/interagency-data-inventory/ (accessed November 19, 2015).
Office of the Comptroller of the Currency. Shared National Credit Reports. Online Content, Washington: OCC, 2015. http://www.occ.treas.gov/topics/credit/commercial-credit/shared-national-credits-reports.html (accessed November 25, 2015).
Office of the Comptroller of the Currency, and Board of Governors of the Federal Reserve System, Federal Deposit Insurance Corporation, Farm Credit Administration, and Federal Housing Finance Agency. Margin and Capital Requirements for Covered Swap Entities. Final Rule, Washington: OCC and others, Federal Register 80, no. 229, November 30, 2015. https://www.federalregister.gov/articles/2015/11/30/2015-28671/margin-and-capital-requirements-for-covered-swap-entities (accessed December 2, 2015).
Office of the Comptroller of the Currency, and Board of Governors of the Federal Reserve System. Regulatory Capital Rules: Regulatory Capital, Implementation of Basel III, Capital Adequacy, Transition Provisions, Prompt Corrective Action, Standardized Approach for Risk-weighted Assets, Market Discipline and Disclosure Requirements, Advanced Approaches Risk-Based Capital Rule, and Market Risk Capital Rule. Final Rule, Washington: OCC and Board of Governors, Federal Register 78, no. 198, October 11, 2013. http://www.gpo.gov/fdsys/granule/FR-2013-10-11/2013-21653 (accessed November 25, 2015).
Office of the Comptroller of the Currency, Board of Governors of the Federal Reserve System, and Federal Deposit Insurance Corporation. Interagency Guidance on Leveraged Lending. Final Guidance, Washington: OCC, Board of Governors, and FDIC, Federal Register 78, no. 56, March 22, 2013. https://federalregister.gov/a/2013-06567 (accessed December 2, 2015).
Office of the Comptroller of the Currency, Board of Governors of the Federal Reserve System, and Federal Deposit Insurance Corporation. Frequently Asked Questions for Implementing March 2013 Interagency Guidance on Leveraged Lending, Washington: OCC, Board of Governors, and FDIC, November 7, 2014. https://www.fdic.gov/news/news/press/2014/pr14096FAQ.pdf (accessed December 2, 2015).
Office of the Comptroller of the Currency, Board of Governors of the Federal Reserve System, Securities and Exchange Commission, Federal Housing Finance Agency, and Department of Housing and Urban Development and. Credit Risk Retention.
Bibliography 137
Final Rule, Washington: OCC and others, Federal Register 79, no. 247, December 24, 2014. https://www.federalregister.gov/articles/2014/12/24/2014-29256/credit-risk-retention (accessed December 2, 2015).
Oliver Wyman. The Volcker Rule Restrictions on Proprietary Trading, New York: OW, February 2012. http://www.oliverwyman.com/content/dam/oliver-wyman/global/en/files/archive/2012/Oliver_Wyman_The_Volcker_Rule_Restrictions_on_Proprietary_Trading.pdf (accessed December 2, 2015).
Pattison, John C. Data-Driven Regulation and Financial Reform: One Perspective from Industry on the Financial Crisis. In: Brose, Margarita, Mark Flood, Dilip Krishna, and Bill Nichols eds. Handbook of Financial Data and Risk Information I. Cambridge, UK: Cambridge University Press, 2014, 148–174. http://www.cambridge.org/asia/catalogue/catalogue.asp?isbn=9781107012011&ss=fro (accessed November 25, 2015).
Potter, Simon. “Money Markets and Monetary Policy Normalization.” Speech at the Money Marketeers of New York University. New York, April 15, 2015. https://www.newyorkfed.org/newsevents/speeches/2015/pot150415.html (accessed November 30, 2015).
Powell, Jerome. “Central Clearing in an Interdependent World.” Speech at the Clearing House Annual Conference. New York, November 17, 2015a. http://www.federalreserve.gov/newsevents/speech/powell20151117a.htm (accessed November 23, 2015).
Powell, Jerome. “Structure and Liquidity in Treasury Markets.” Speech at the Brookings Institution. Washington, August 3, 2015b.
Prescott, Edward Simpson. “Introduction to the Special Issue on the Diamond-Dybvig Model.” Economic Quarterly 96, no. 1 (2010, First Quarter): 1–9. Federal Reserve Bank of Richmond. https://www.richmondfed.org/-/media/richmondfedorg/publications/research/economic_quarterly/2010/q1/pdf/prescott.pdf (accessed November 25, 2015).
PricewaterhouseCoopers LLP. Global Financial Markets Liquidity Study, New York City: PWC, August 2015. http://www.pwc.com/gx/en/financial-services/publications/assets/global-financial-market-liquidity-study.pdf (accessed November 20, 2015).
Rogers, John, Chiara Scotti, and Jonathan Wright. “Evaluating Asset-Market Effects of Unconventional Monetary Policy: A Cross-Country Comparison.” International Finance Discussion Paper no. 1101, Washington: Board of Governors of the Federal Reserve System, March 2014. http://www.federalreserve.gov/pubs/ifdp/2014/1101/ifdp1101.pdf (accessed November 17, 2015).
Securities and Exchange Commission. CF Disclosure Guidance: Topic No. 2, Washington: SEC, October 13, 2011. https://www.sec.gov/divisions/corpfin/guidance/cfguidance-topic2.htm (accessed November 23, 2015).
Securities and Exchange Commission. Money Market Fund Reform: Amendments to Form PF. Final Rule, Washington: SEC, Federal Register 79, no. 157, August 14, 2014a. Section J. https://www.federalregister.gov/articles/2014/08/14/2014-17747/money-market-fund-reform-amendments-to-form-pf (accessed December 2, 2015).
Securities and Exchange Commission. Standards for Covered Clearing Agencies. Proposed Rule, Washington: SEC, Federal Register 79, no. 99, May 22, 2014b. http://www.gpo.gov/fdsys/pkg/FR-2014-05-22/pdf/R1-2014-05806.pdf (accessed November 23, 2015).
Securities and Exchange Commission. Amendments to Form ADV and Investment Advisers Act Rules. Proposed Rule, Washington: SEC, Federal Register 80, no. 113, June 12, 2015a. https://www.federalregister.gov/articles/2015/06/12/2015-12778/amendments-to-form-adv-and-investment-advisers-act-rules (accessed December 2, 2015).
Securities and Exchange Commission. Notice of Filing and Request for Comment on Chicago Mercantile Exchange Inc.’s Request to Withdraw From Registration as a Clearing Agency. Notice, Washington: SEC, Federal Register 80, no. 169, September 1, 2015b. https://www.federalregister.gov/articles/2015/09/01/2015-21551/notice-of-filing-and-request-for-comment-on-chicago-mercantile-exchange-incs-request-to-withdraw (accessed December 2, 2015).
Securities and Exchange Commission. Open-End Fund Liquidity Risk Management Programs; Swing Pricing; Re-Opening of Comment Period for Investment Company Reporting Modernization Release. Proposed Rule; Re-Opening of Comment Period, Washington: SEC, Federal Register 80, no. 199, October 15, 2015c. http://www.gpo.gov/fdsys/pkg/FR-2015-10-15/pdf/2015-24507.pdf (accessed November 23, 2015).
Securities and Exchange Commission. Private Funds Statistics: Fourth Calendar Quarter 2014, Washington: SEC, October 16, 2015d. http://www.sec.gov/divisions/investment/private-funds-statistics/private-funds-statistics-2014-q4.pdf (accessed December 7, 2015).

2015 OFR Financial Stability Report138
Securities and Exchange Commission. Regulation SBSR — Reporting and Dissemination of Security-Based Swap Information; Final Rule. Final Rule, Washington: SEC, Federal Register 80, no. 53, March 19, 2015e. http://www.gpo.gov/fdsys/pkg/FR-2015-03-19/pdf/2015-03124.pdf (accessed November 23, 2015).
Senior Supervisors Group. Risk Management Lessons from the Global Banking Crisis of 2008, Basel: SSG, October 21, 2009. https://www.sec.gov/news/press/2009/report102109.pdf (accessed November 25, 2015).
Senior Supervisors Group. Progress Report on Counterparty Data, Basel: SSG, January 15, 2014. http://www.financialstabilityboard.org/wp-content/uploads/r_140116.pdf (accessed December 2, 2015).
Standard and Poor’s. Bank Rating Methodology And Assumptions: Additional Loss-Absorbing Capacity, New York: S&P, April 27, 2015. https://www.standardandpoors.com/en_US/web/guest/article/-/view/type/HTML/id/1450319 (accessed November 25, 2015).
Tarullo, Daniel K. “Advancing Macroprudential Policy Objectives.” Speech at the Office of Financial Research and Financial Stability Oversight Council’s 4th Annual Conference on Evaluating Macroprudential Tools: Complementarities and Conflicts. Arlington, Va., January 30, 2015. http://www.federalreserve.gov/newsevents/speech/tarullo20150130a.htm (accessed November 17, 2015).
Teo, Melvyn. “The Liquidity Risk of Liquid Hedge Funds.” Journal of Financial Economics 100, no. 1 (2011, April): 24–44. http://www.sciencedirect.com/science/article/pii/S0304405X10002771 (accessed November 25, 2015).
Tepper, Alexander, Jeffrey Moore, Myeongguk Suh, and Sunwoo Nam. “Estimating the Impacts of U.S. LSAPs on Emerging Market Economies’ Local Currency Bond Markets.” Staff Report no. 595, New York: Federal Reserve Bank of New York, January 2013. https://www.newyorkfed.org/research/staff_reports/sr595.html (accessed November 17, 2015).
Tumminello, Michele, Fabrizio Lillo, and Rosario N. Mantegna. “Correlation, Hierarchies, and Networks in Financial Markets.” Journal of Economic Behavior & Organization 75, no. 1 (2010, July): 40–58. http://www.sciencedirect.com/science/article/pii/S0167268110000077 (accessed November 25, 2015).
U.S. Congress. Fixing America’s Surface Transportation Act. 114th Congress, 1st Session, Washington, Government Printing Office, 2015. https://www.gpo.gov/fdsys/pkg/BILLS-114hr22enr/html/BILLS-114hr22enr.htm (accessed January 14, 2016).
U.S. Congress. Investment Company Act of 1940. 76th Congress, 3rd Session, Washington: Government Printing Office, 1940. http://www.sec.gov/about/laws/ica40.pdf (accessed December 2, 2015).
U.S. Congress. Dodd-Frank Wall Street Reform and Consumer Protection Act. 111st Congress, 2nd Session, Washington: Government Printing Office, 2010. http://www.gpo.gov/fdsys/pkg/PLAW-111publ203/pdf/PLAW-111publ203.pdf (accessed November 25, 2015).
U.S. Department of the Treasury, Board of Governors of the Federal Reserve System, Federal Reserve Bank of New York, Securities and Exchange Commission, and Commodity Futures Trading Commission. Joint Staff Report: The U.S. Treasury Market On October 15, 2014, Washington: Treasury and others, July 13, 2015. https://www.treasury.gov/press-center/press-releases/Documents/Joint_Staff_Report_Treasury_10-15-2015.pdf (accessed November 25, 2015).
U.S. Government Accountability Office. Cybersecurity: Bank and Other Depository Regulators Need Better Data Analytics and Depository Institutions Want More Usable Threat Information, Washington: GAO, July 2, 2015. http://www.gao.gov/products/GAO-15-509 (accessed October 2, 2015).
U.S. Senate. JPMorgan Chase Whale Trades: A Case History of Derivatives Risks and Abuses. 113rd Congress, 1st Session, March 15, 2013. http://www.hsgac.senate.gov/subcommittees/investigations/hearings/chase-whale-trades-a-case-history-of-derivatives-risks-and-abuses (accessed November 25, 2015).
Watt, Michael. “JP Morgan and the CRM: How Basel 2.5 Beached the London Whale.” Risk Magazine (2012, October): 23–26. http://www.risk.net/risk-magazine/feature/2207422/jp-morgan-and-the-crm-how-basel-25-beached-the-london-whale (accessed November 24, 2015).


OFFICE OFFINANCIALRESEARCH
FINANCIALRESEARCH.gov