financial risk forecasting chapter 4 risk measures · financial risk forecasting © 2011,2017 jon...
TRANSCRIPT

Financial Risk Forecasting © 2011,2017 Jon Danielsson, page 1 of 81
What is risk? Value–at–Risk Issues Coherence Manipulation ES Scaling Regulations
Financial Risk Forecasting
Chapter 4
Risk Measures
Jon Danielsson ©2017London School of Economics
To accompanyFinancial Risk Forecasting
www.financialriskforecasting.com
Published by Wiley 2011
Version 3.0, August 2017

Financial Risk Forecasting © 2011,2017 Jon Danielsson, page 2 of 81
What is risk? Value–at–Risk Issues Coherence Manipulation ES Scaling Regulations

Financial Risk Forecasting © 2011,2017 Jon Danielsson, page 3 of 81
What is risk? Value–at–Risk Issues Coherence Manipulation ES Scaling Regulations
The focus of this chapter is on
• Defining and measuring risk
• Volatility• VaR (Value–at–Risk)• ES (Expected Shortfall)
• Holding periods
• Scaling and the square–root–of–time

Financial Risk Forecasting © 2011,2017 Jon Danielsson, page 4 of 81
What is risk? Value–at–Risk Issues Coherence Manipulation ES Scaling Regulations
Notation
p ProbabilityQ Profit and lossq Observed profit and lossw Vector of portfolio weights
X and Y Refer to two different assetsϕ(.) Risk measure
ϑ Portfolio value

Financial Risk Forecasting © 2011,2017 Jon Danielsson, page 5 of 81
What is risk? Value–at–Risk Issues Coherence Manipulation ES Scaling Regulations
Defining Risk

Financial Risk Forecasting © 2011,2017 Jon Danielsson, page 6 of 81
What is risk? Value–at–Risk Issues Coherence Manipulation ES Scaling Regulations
General Definition
• No universal definition of what constitutes risk
• On a very general level, financial risk could be defined as“the chance of losing a part or all of an investment”
• Large number of such statements could equally be made,many of which would be contradictory

Financial Risk Forecasting © 2011,2017 Jon Danielsson, page 7 of 81
What is risk? Value–at–Risk Issues Coherence Manipulation ES Scaling Regulations
Which asset do you prefer?All three assets have volatility one and mean zero
0 20 40 60 80 100
−4%
−2%
0%
2%
A

Financial Risk Forecasting © 2011,2017 Jon Danielsson, page 8 of 81
What is risk? Value–at–Risk Issues Coherence Manipulation ES Scaling Regulations
Which asset do you prefer?All three assets have volatility one and mean zero
0 20 40 60 80 100
−4%
−2%
0%
2%
A
0 20 40 60 80 100
−4%
−2%
0%
2%
B

Financial Risk Forecasting © 2011,2017 Jon Danielsson, page 9 of 81
What is risk? Value–at–Risk Issues Coherence Manipulation ES Scaling Regulations
Which asset do you prefer?All three assets have volatility one and mean zero
0 20 40 60 80 100
−4%
−2%
0%
2%
A
0 20 40 60 80 100
−4%
−2%
0%
2%
B
0 20 40 60 80 100
−4%
−2%
0%
2%
C

Financial Risk Forecasting © 2011,2017 Jon Danielsson, page 10 of 81
What is risk? Value–at–Risk Issues Coherence Manipulation ES Scaling Regulations
Which asset do you prefer?
• Standard mean variance analysis indicates that all threeassets are equally risky and preferable
• Since we have the same mean
E(A) = E(B) = E(C ) = 0
• And the same volatility
σA = σB = σC = 1

Financial Risk Forecasting © 2011,2017 Jon Danielsson, page 11 of 81
What is risk? Value–at–Risk Issues Coherence Manipulation ES Scaling Regulations
Which asset is “better”?
• There is no obvious way to discriminate between theassets
• One can try to model the underlying distribution ofmarket prices and returns of assets, but it is generallyunknown.
• can identify by maximum likelihood methods• or test the distribution against other other distributions
by using methods such as the Kolmogorov-Smirnov test
• Practically, it is impossible to accurately identify thedistribution of financial returns

Financial Risk Forecasting © 2011,2017 Jon Danielsson, page 12 of 81
What is risk? Value–at–Risk Issues Coherence Manipulation ES Scaling Regulations
Risk is a latent variable
• Financial risk is cannot be measured directly
• Risk has to be inferred from the behavior of observedmarket prices
• e.g. at the end of a trading day, the return of the day isknown while the risk is unknown

Financial Risk Forecasting © 2011,2017 Jon Danielsson, page 13 of 81
What is risk? Value–at–Risk Issues Coherence Manipulation ES Scaling Regulations
Risk measure and risk measurement
Risk measure a mathematical concept of risk
Risk measurement a number that captures risk, obtained byapplying data to a risk measure

Financial Risk Forecasting © 2011,2017 Jon Danielsson, page 14 of 81
What is risk? Value–at–Risk Issues Coherence Manipulation ES Scaling Regulations
Volatility
• Volatility is the standard deviation of returns
• Main measure of risk in most financial analysis
• It is a sufficient measure of risk when returns are normallydistributed
• For this reason, in mean-variance analysis the efficientfrontier shows the best investment decision
• If returns are not normally distributed, solutions on theefficient frontier may be inefficient

Financial Risk Forecasting © 2011,2017 Jon Danielsson, page 15 of 81
What is risk? Value–at–Risk Issues Coherence Manipulation ES Scaling Regulations
Volatility
• The assumption of normality of return is violated for mostif not all financial returns
- See Chapter 1 on the non-normality of returns
• For most applications in financial risk, volatility is likely tosystematically underestimate risk

Financial Risk Forecasting © 2011,2017 Jon Danielsson, page 16 of 81
What is risk? Value–at–Risk Issues Coherence Manipulation ES Scaling Regulations
Value–at–Risk (VaR)

Financial Risk Forecasting © 2011,2017 Jon Danielsson, page 17 of 81
What is risk? Value–at–Risk Issues Coherence Manipulation ES Scaling Regulations
VaR
Definition: Value-at-Risk. The loss on a trading portfoliosuch that there is a probability p of losses equaling orexceeding VaR in a given trading period and a (1− p)
probability of losses being lower than the VaR.
• The most common risk measure after volatility
• It is distribution independent

Financial Risk Forecasting © 2011,2017 Jon Danielsson, page 18 of 81
What is risk? Value–at–Risk Issues Coherence Manipulation ES Scaling Regulations
Quantiles and P/L
• VaR is a quantile on the distribution of P/L (profit andloss)
• We indicate the P/L on an investment portfolio by therandom variable Q, with a realization indicated by q
• In the case of holding one unit of an asset, we have
Qt = Pt − Pt−1
• More generally, if the portfolio value is ϑ:
Qt = ϑYt = ϑPt − Pt−1
Pt−1
• That is, the P/L is the portfolio value (ϑ) multiplied bythe returns

Financial Risk Forecasting © 2011,2017 Jon Danielsson, page 19 of 81
What is risk? Value–at–Risk Issues Coherence Manipulation ES Scaling Regulations
VaR and P/L density
• The density of P/L is denoted by fq(.), then VaR is givenby:
Pr[Q ≤ −VaR(p)] = p
or,
p =
∫
−VaR(p)
−∞
fq(x)dx
• We usually write it as VaR(p) or VaR100×p%
- for example, VaR(0.05) or VaR5%

Financial Risk Forecasting © 2011,2017 Jon Danielsson, page 20 of 81
What is risk? Value–at–Risk Issues Coherence Manipulation ES Scaling Regulations
Is VaR a negative or positive number?
• VaR can be stated as a negative or positive number
• Equivalently, probabilities can be stated as close to one orclose to zero – for example, VaR(0.95) or VaR(0.05)
• We take the more common approach of referring to VaRas a positive number using low-probability terminology
(e.g. 5%)

Financial Risk Forecasting © 2011,2017 Jon Danielsson, page 21 of 81
What is risk? Value–at–Risk Issues Coherence Manipulation ES Scaling Regulations
VaR graphicallyDensity of profit and loss
−3 −2 −1 0 1 2 3
0.0
0.1
0.2
0.3
0.4
Losses Profits

Financial Risk Forecasting © 2011,2017 Jon Danielsson, page 22 of 81
What is risk? Value–at–Risk Issues Coherence Manipulation ES Scaling Regulations
VaR graphicallyDensity zoomed in
−3.0 −2.8 −2.6 −2.4 −2.2 −2.0 −1.8 −1.6
0.00
0.05
0.10
0.15
p=5%
p=1%
−VaR 1%
−VaR 5%

Financial Risk Forecasting © 2011,2017 Jon Danielsson, page 23 of 81
What is risk? Value–at–Risk Issues Coherence Manipulation ES Scaling Regulations
VaR graphicallyCumulative distribution of profit and loss
−3 −2 −1 0 1 2 3
0.0
0.2
0.4
0.6
0.8
1.0

Financial Risk Forecasting © 2011,2017 Jon Danielsson, page 24 of 81
What is risk? Value–at–Risk Issues Coherence Manipulation ES Scaling Regulations
VaR graphicallyCumulative distribution zoomed in
−3.0 −2.8 −2.6 −2.4 −2.2 −2.0 −1.8 −1.6
0.00
0.01
0.02
0.03
0.04
0.05
0.06
−VaR 1%
−VaR 5%

Financial Risk Forecasting © 2011,2017 Jon Danielsson, page 25 of 81
What is risk? Value–at–Risk Issues Coherence Manipulation ES Scaling Regulations
Example
• The commodities’ trading book is worth £1 billion anddaily VaR1%=£10 million
• This means we expect to loose £10 million or more onceevery 100 days, or about once every 5 months

Financial Risk Forecasting © 2011,2017 Jon Danielsson, page 26 of 81
What is risk? Value–at–Risk Issues Coherence Manipulation ES Scaling Regulations
The three steps in VaR calculations
1. The probability of losses exceeding VaR, p
2. The holding period, the time period over which lossesmay occur
3. The probability distribution of the P/L of the portfolio

Financial Risk Forecasting © 2011,2017 Jon Danielsson, page 27 of 81
What is risk? Value–at–Risk Issues Coherence Manipulation ES Scaling Regulations
Which probability should we use?
• VaR levels of 1% – 5% are very common in practice
• Regulators (Basel II) demand 1%
• But less extreme numbers, such as 10% are often used inrisk management on the trading floor
• More extreme lower numbers, such as 0.1%, may be usedfor applications like economic capital, survival analysis orlong-run risk analysis for pension funds
Financial Risk Forecasting © 2011,2017 Jon Danielsson, page 28 of 81
What is risk? Value–at–Risk Issues Coherence Manipulation ES Scaling Regulations
Holding period
• The holding period is the time period over which lossesmay occur
• it is usually one day• can be minutes or hours• or several days, but it does not make sense to use more
than 2 weeks, and even that is on the high side
• Holding periods can vary depending on differentcircumstances
• Many proprietary trading desks focus on intraday VaR
• For institutional investors and nonfinancial corporations,it is more realistic to use longer holding periods

Financial Risk Forecasting © 2011,2017 Jon Danielsson, page 29 of 81
What is risk? Value–at–Risk Issues Coherence Manipulation ES Scaling Regulations
Probability distribution of P/L
• The identification of the probability distribution is difficult
• The standard practice is to estimate the distribution byusing past observations and a statistical model
• We will use EWMA and GARCH later

Financial Risk Forecasting © 2011,2017 Jon Danielsson, page 30 of 81
What is risk? Value–at–Risk Issues Coherence Manipulation ES Scaling Regulations
VaR and normality
• VaR does not implies normality of returns, we can use anydistribution in calculating VaR
• Even if I am often surprised by people who assume it does
• However, the most common distribution assumption forreturns in the calculation of VaR is conditional normality
• In this case, volatility provides the same information asVaR

Financial Risk Forecasting © 2011,2017 Jon Danielsson, page 31 of 81
What is risk? Value–at–Risk Issues Coherence Manipulation ES Scaling Regulations
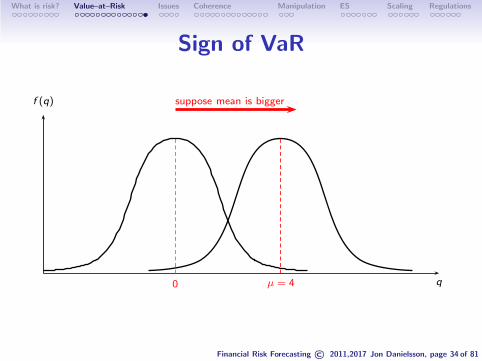
Sign of VaR
• If the mean of the density of P/L is sufficiently large, theprobability p quantile (the VaR), might easily end up onthe other side of zero
• This means that the relevant losses have become profits
• In such situations we either specify a more extreme p oruse a different measure of risk

Financial Risk Forecasting © 2011,2017 Jon Danielsson, page 32 of 81
What is risk? Value–at–Risk Issues Coherence Manipulation ES Scaling Regulations
Sign of VaR
q
f (q)
−VaR5% µ = 0

Financial Risk Forecasting © 2011,2017 Jon Danielsson, page 33 of 81
What is risk? Value–at–Risk Issues Coherence Manipulation ES Scaling Regulations
Sign of VaR
q
f (q)
−VaR5% µ = 0
suppose mean is bigger
Financial Risk Forecasting © 2011,2017 Jon Danielsson, page 34 of 81
What is risk? Value–at–Risk Issues Coherence Manipulation ES Scaling Regulations
Sign of VaR
q
f (q) suppose mean is bigger
0 µ = 4

Financial Risk Forecasting © 2011,2017 Jon Danielsson, page 35 of 81
What is risk? Value–at–Risk Issues Coherence Manipulation ES Scaling Regulations
Sign of VaRNote that -VaR is now positive
q
f (q)
0 µ = 4−VaR5%

Financial Risk Forecasting © 2011,2017 Jon Danielsson, page 36 of 81
What is risk? Value–at–Risk Issues Coherence Manipulation ES Scaling Regulations
Issues in applying VaR

Financial Risk Forecasting © 2011,2017 Jon Danielsson, page 37 of 81
What is risk? Value–at–Risk Issues Coherence Manipulation ES Scaling Regulations
Main issues in the implementation
1. VaR is only a quantile on the P/L distribution
2. VaR is not a coherent risk measure
3. VaR is easy to manipulate

Financial Risk Forecasting © 2011,2017 Jon Danielsson, page 38 of 81
What is risk? Value–at–Risk Issues Coherence Manipulation ES Scaling Regulations
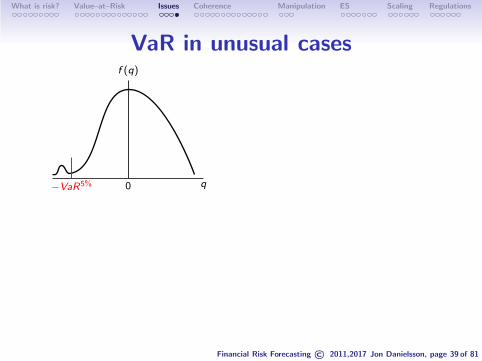
VaR is only a quantile
• VaR gives the “best of worst case scenarios” and, assuch, it inevitably underestimates the potential lossesassociated with a probability level
• I.e. VaR(p) is incapable of capturing the risk of extrememovements that have a probability of less than p
• If VaR=$1000, are potential losses $1001 or $10000000?
• The shape of the tail before and after VaR need not haveany bearing on the actual VaR number
Financial Risk Forecasting © 2011,2017 Jon Danielsson, page 39 of 81
What is risk? Value–at–Risk Issues Coherence Manipulation ES Scaling Regulations
VaR in unusual cases
q0
f (q)
−VaR5%

Financial Risk Forecasting © 2011,2017 Jon Danielsson, page 40 of 81
What is risk? Value–at–Risk Issues Coherence Manipulation ES Scaling Regulations
VaR in unusual cases
q0
f (q)
−VaR5% q0
f (q)
−VaR5%

Financial Risk Forecasting © 2011,2017 Jon Danielsson, page 41 of 81
What is risk? Value–at–Risk Issues Coherence Manipulation ES Scaling Regulations
VaR in unusual cases
q0
f (q)
−VaR5% q0
f (q)
−VaR5%
q0
f (q)
−VaR5%

Financial Risk Forecasting © 2011,2017 Jon Danielsson, page 42 of 81
What is risk? Value–at–Risk Issues Coherence Manipulation ES Scaling Regulations
VaR in unusual cases
q0
f (q)
−VaR5% q0
f (q)
−VaR5%
q0
f (q)
−VaR5% q0
f (q)
−VaR5%

Financial Risk Forecasting © 2011,2017 Jon Danielsson, page 43 of 81
What is risk? Value–at–Risk Issues Coherence Manipulation ES Scaling Regulations
Ideal properties of a risk measure
• The ideal properties of any financial risk measure wereproposed by Artzner et. al (1999)
• To them, coherence is ideal
• Other authors have added more “ideal conditions”
• While others have dismissed the importance of some ofthese

Financial Risk Forecasting © 2011,2017 Jon Danielsson, page 44 of 81
What is risk? Value–at–Risk Issues Coherence Manipulation ES Scaling Regulations
Coherence
• Suppose we have two assets, X and Y
• Denote some arbitrary risk measure by ϕ(·). It could bevolatility, VaR or something else
• ϕ(·) is then some function that maps some observationsof an asset, like X , onto a risk measurement
• Further define some arbitrary constant c
• We say that ϕ(·) is a coherent risk measure if it satisfiesthe following four axioms
1. Monotonicity2. Translation invariance3. Positive homogeneity4. Subadditivity

Financial Risk Forecasting © 2011,2017 Jon Danielsson, page 45 of 81
What is risk? Value–at–Risk Issues Coherence Manipulation ES Scaling Regulations
Monotonicity
• IfX≤Y
• andϕ(X )≥ϕ(Y )
• Then risk measure ϕ satisfies monotonicity
• What this means is that if outcomes for asset X arealways more negative than outcomes for Y
• suppose X and Y are daily returns on AMZN andGOOG, and the returns on GOOG are always higher thanfor AMZN, then GOOG risk is lower than that of AMZN
• Then the risk of Y should never exceed the risk of X
• This is perfectly reasonable and should always hold

Financial Risk Forecasting © 2011,2017 Jon Danielsson, page 46 of 81
What is risk? Value–at–Risk Issues Coherence Manipulation ES Scaling Regulations
Translation invariance
• Ifϕ(X+c) = ϕ(X )−c
• Then risk measure ϕ satisfies translation invariance
• In other words, if we add a positive constant to thereturns of AMZN then the risk will go down by thatconstant
• This is perfectly reasonable and should always hold
0−1−2−3−4−5−6−7−8 1 2 3
c

Financial Risk Forecasting © 2011,2017 Jon Danielsson, page 47 of 81
What is risk? Value–at–Risk Issues Coherence Manipulation ES Scaling Regulations
Positive homogeneity
• If c > 0 andϕ(cX ) = cϕ(X )
• Then risk measure ϕ satisfies positive homogeneity
• Positive homogeneity means risk is directly proportional
to the value of the portfolio
• For example, suppose a portfolio is worth $1,000 with risk$10, then doubling the portfolio size to $2,000 will doublethe risk to $20

Financial Risk Forecasting © 2011,2017 Jon Danielsson, page 48 of 81
What is risk? Value–at–Risk Issues Coherence Manipulation ES Scaling Regulations
• As relative shareholdings increase, the risk may increasemore rapidly than the portfolio size. In this case, positivehomogeneity is violated:
ϕ(cX ) > cϕ(X )
• This is because when we are trying to sell, the price ofthe stock falls, therefore the eventual selling price is lowerthan the initial market price
- See chapter 10, Endogenous risk
Financial Risk Forecasting © 2011,2017 Jon Danielsson, page 49 of 81
What is risk? Value–at–Risk Issues Coherence Manipulation ES Scaling Regulations
Subadditivity
• Ifϕ(X + Y ) ≤ ϕ(X ) + ϕ(Y )
• Then risk measure ϕ satisfies Subadditivity
• Subadditivity means a portfolio of assets is measured asless risky than the sum of the risks of individual assets
• That is, diversification reduces risk

Financial Risk Forecasting © 2011,2017 Jon Danielsson, page 50 of 81
What is risk? Value–at–Risk Issues Coherence Manipulation ES Scaling Regulations
Volatility is subadditive
• Recall how portfolio variance is calculated when we havetwo assets
• X and Y , with volatilities σX and σY , respectively,correlation coefficient ρ and portfolio weights wX and wY

Financial Risk Forecasting © 2011,2017 Jon Danielsson, page 51 of 81
What is risk? Value–at–Risk Issues Coherence Manipulation ES Scaling Regulations
• The portfolio variance is:
σ2portfolio = w 2
Xσ2X + w 2
Yσ2Y + 2wXwY ρσXσY
• Rewriting, we get
σ2portfolio = (wXσX + wYσY )
2 − 2wXwY (1− ρ)σXσY
where the last term is positive
• WX ,WY ≥ 0, −1 ≤ ρ ≤ 1
• Volatility is therefore subadditive because:
σportfolio ≤ wXσX + wY σY

Financial Risk Forecasting © 2011,2017 Jon Danielsson, page 52 of 81
What is risk? Value–at–Risk Issues Coherence Manipulation ES Scaling Regulations
VaR can violate subadditivity
• Asset X has probability of 4.9% of a return of -100, and95.1% of a return of 0
• Hence we have
VaR5%(X ) = 0
VaR1%(X ) = 100

Financial Risk Forecasting © 2011,2017 Jon Danielsson, page 53 of 81
What is risk? Value–at–Risk Issues Coherence Manipulation ES Scaling Regulations
• Consider another asset Y , independent of X and with thesame distribution as X
• Suppose we hold an equally weighted portfolio of assets Xand Y, the 5% VaR of the portfolio is
VaR5%portfolio = VaR5%(0.5X + 0.5Y ) = 50
Outcome X Y 12X + 1
2Y Probability Cumulative
1 -100 -100 -100 0.2% 0.2%2 -100 0 -50 4.7% 4.9%3 0 -100 -50 4.7% 9.6%4 0 0 0 90.4% 100%

Financial Risk Forecasting © 2011,2017 Jon Danielsson, page 54 of 81
What is risk? Value–at–Risk Issues Coherence Manipulation ES Scaling Regulations
• In this case, VaR5% violates subadditivity
VaR5%portfolio >0.5 VaR5%(X ) + 0.5 VaR5%(Y ) = 0
• This is because the probability of a loss (4.9%) of a singleasset is slightly smaller than the VaR probability (5%)
• While the portfolio probability is higher than 5%
Financial Risk Forecasting © 2011,2017 Jon Danielsson, page 55 of 81
What is risk? Value–at–Risk Issues Coherence Manipulation ES Scaling Regulations
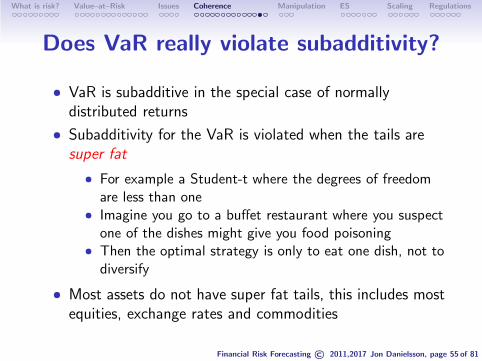
Does VaR really violate subadditivity?
• VaR is subadditive in the special case of normallydistributed returns
• Subadditivity for the VaR is violated when the tails aresuper fat
• For example a Student-t where the degrees of freedomare less than one
• Imagine you go to a buffet restaurant where you suspectone of the dishes might give you food poisoning
• Then the optimal strategy is only to eat one dish, not todiversify
• Most assets do not have super fat tails, this includes mostequities, exchange rates and commodities

Financial Risk Forecasting © 2011,2017 Jon Danielsson, page 56 of 81
What is risk? Value–at–Risk Issues Coherence Manipulation ES Scaling Regulations
• VaR of assets that are subject to occasional very largenegative returns tends to suffer subadditivity violations,e.g.
• Exchange rates in countries that peg their currency butare subject to occasional devaluations
• Electricity prices subject to very extreme price swings• Junk bonds where most of the time the bonds deliver a
steady positive return• Short deep out of the money options
• Enough for this to apply to one asset in a portfolio

Financial Risk Forecasting © 2011,2017 Jon Danielsson, page 57 of 81
What is risk? Value–at–Risk Issues Coherence Manipulation ES Scaling Regulations
Manipulating VaR
• VaR is easily it can be manipulated, perhaps to make theVaR measurement lower without risk it self falling
• There are many ways to do this, for example
1. cherry pick assets that make a VaR measure low2. particular derivative trading strategies

Financial Risk Forecasting © 2011,2017 Jon Danielsson, page 58 of 81
What is risk? Value–at–Risk Issues Coherence Manipulation ES Scaling Regulations
VaR manipulation with derivatives
• Suppose the VaR before any manipulation is VaR0 andthat a bank prefers the VaR to be VaR1
• Where, 0 < VaR1 < VaR0
−VaR0

Financial Risk Forecasting © 2011,2017 Jon Danielsson, page 59 of 81
What is risk? Value–at–Risk Issues Coherence Manipulation ES Scaling Regulations
VaR manipulation with derivatives
• Suppose the VaR before any manipulation is VaR0 andthat a bank prefers the VaR to be VaR1
• Where, 0 < VaR1 < VaR0
−VaR0 −VaR1

Financial Risk Forecasting © 2011,2017 Jon Danielsson, page 60 of 81
What is risk? Value–at–Risk Issues Coherence Manipulation ES Scaling Regulations
• This can be achieved by
1. buying put with a strike above VaR1
2. writing a put option with a strike price below VaR0
• This will result a lower expected profit
• the fee from writing the option is lower than the feefrom buying the option
• And an increase in downside risk
• because it the potential for large losses (makes the tailfatter)
• While this may be an obvious manipulation
• It can be very hard to identify in the real world

Financial Risk Forecasting © 2011,2017 Jon Danielsson, page 61 of 81
What is risk? Value–at–Risk Issues Coherence Manipulation ES Scaling Regulations
Expected Shortfall (ES)

Financial Risk Forecasting © 2011,2017 Jon Danielsson, page 62 of 81
What is risk? Value–at–Risk Issues Coherence Manipulation ES Scaling Regulations
Expected Shortfall (ES)
• A large number of other risk measures have been proposed
• The only one to get traction is ES
• It is known by several names, including
1. ES2. Expected tail loss3. Tail VaR

Financial Risk Forecasting © 2011,2017 Jon Danielsson, page 63 of 81
What is risk? Value–at–Risk Issues Coherence Manipulation ES Scaling Regulations
Definition: Expected shortfall. Expected loss conditionalon VaR being violated (i.e. expected P/L, Q, when it is lower
than negative VaR)
ES = −E[Q|Q ≤ −VaR(p)]
• ES is an alternative risk measures to VaR whichovercomes the problem of subadditivity violation
• It is aware of the shape of the tail distribution while VaRis not
Financial Risk Forecasting © 2011,2017 Jon Danielsson, page 64 of 81
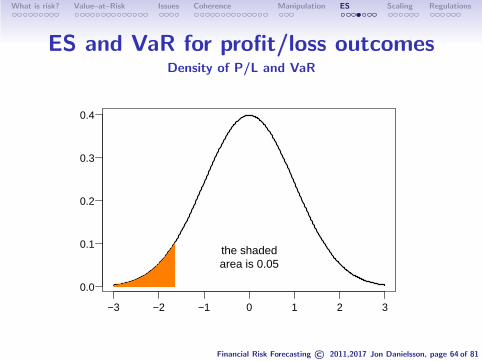
What is risk? Value–at–Risk Issues Coherence Manipulation ES Scaling Regulations
ES and VaR for profit/loss outcomesDensity of P/L and VaR
−3 −2 −1 0 1 2 3
0.0
0.1
0.2
0.3
0.4
the shadedarea is 0.05

Financial Risk Forecasting © 2011,2017 Jon Danielsson, page 65 of 81
What is risk? Value–at–Risk Issues Coherence Manipulation ES Scaling Regulations
ES and VaR for profit/loss outcomesLeft tail of the density
−3.0 −2.5 −2.0 −1.5
0.00
0.05
0.10
0.15
Take expectationover the shaded area

Financial Risk Forecasting © 2011,2017 Jon Danielsson, page 66 of 81
What is risk? Value–at–Risk Issues Coherence Manipulation ES Scaling Regulations
ES and VaR for profit/loss outcomesBlow up the tail
−3 −2 −1 0 1 2 3
0.0
0.2
0.4
0.6
0.8
Scale tail area up to 1

Financial Risk Forecasting © 2011,2017 Jon Danielsson, page 67 of 81
What is risk? Value–at–Risk Issues Coherence Manipulation ES Scaling Regulations
Expected Shortfall
• ES
ES =
∫
−VaR(p)
−∞
xfVaR(x)dx
• The tail density, fVaR(.) is given by:
1 =
∫
−VaR(p)
−∞
fVaR(x)dx =1
p
∫
−VaR(p)
−∞
fq(x)dx

Financial Risk Forecasting © 2011,2017 Jon Danielsson, page 68 of 81
What is risk? Value–at–Risk Issues Coherence Manipulation ES Scaling Regulations
Under the standard normal distribution
• If the portfolio value is 1, then:
ES = −φ(Φ−1(p))
p
where φ and Φ are the normal density and distribution,respectively
• VaR and ES for different levels of confidence for aportfolio with a face value of $1 and normally distributedP/L with mean 0 and volatility 1
p 0.5 0.1 0.05 0.025 0.01 0.001VaR 0 1.282 1.645 1.960 2.326 3.090ES 0.798 1.755 2.063 2.338 2.665 3.367

Financial Risk Forecasting © 2011,2017 Jon Danielsson, page 69 of 81
What is risk? Value–at–Risk Issues Coherence Manipulation ES Scaling Regulations
Pros and cons
Pros
• ES in coherent and VaR is not
• It is harder to manipulate ES than VaR
Cons
• ES is measured with more uncertainty than VaR
• ES is much harder to backtest than VaR because the ESprocedure requires estimates of the tail expectation tocompare with the ES forecast

Financial Risk Forecasting © 2011,2017 Jon Danielsson, page 70 of 81
What is risk? Value–at–Risk Issues Coherence Manipulation ES Scaling Regulations
Holding Periods, Scalingand the Square–Root–of–Time

Financial Risk Forecasting © 2011,2017 Jon Danielsson, page 71 of 81
What is risk? Value–at–Risk Issues Coherence Manipulation ES Scaling Regulations
Length of holding periods
• In practice, the most common holding period is daily
• Shorter holding periods are common for risk managementon the trading floor
• where risk managers use hourly, 20-minute and even 10minute holding periods
• this is technically difficult because intraday data hascomplicated diurnal patterns

Financial Risk Forecasting © 2011,2017 Jon Danielsson, page 72 of 81
What is risk? Value–at–Risk Issues Coherence Manipulation ES Scaling Regulations
Longer holding periods
• Holding periods exceeding one day are also demanding
• the effective date the sample becomes much smaller• one could use scaling laws
• Most VaR forecasts require at least a few hundredobservations to estimate risk accurately
• For a 10-day holding period will need at least 3,000trading days, or about 12 years
• In most cases data from 12 years ago are fairly useless

Financial Risk Forecasting © 2011,2017 Jon Danielsson, page 73 of 81
What is risk? Value–at–Risk Issues Coherence Manipulation ES Scaling Regulations
Scaling laws
• If data comes from a particular stochastic process it maybe possible to use VaR estimates at high frequency (e.g.daily) and scale them up to lower frequencies (e.g.biweekly)
• This would be possible because we know the stochasticprocess and how it aggregates
• That is not usually the case

Financial Risk Forecasting © 2011,2017 Jon Danielsson, page 74 of 81
What is risk? Value–at–Risk Issues Coherence Manipulation ES Scaling Regulations
Varinaces, IID and square–root–of–time
scaling
• Suppose we observe an IID random variable {Xt} withvariance σ2 over time
• The variance of the sum of two consecutive X ’s is then:
Var(Xt + Xt+1) = Var(Xt) + Var(Xt+1) = 2σ2
• The scaling law for variances is time• It is the same for the mean• While the scaling law for standard deviations (volatility)
is square root of time• This holds regardless of the underlying distribution
(provided the variance is defined)

Financial Risk Forecasting © 2011,2017 Jon Danielsson, page 75 of 81
What is risk? Value–at–Risk Issues Coherence Manipulation ES Scaling Regulations
Square-root-of-time scaling
• The square-root-of-time rule applies to volatility whendata is IID
• It does not apply when data is not IID, like GARCH
• This rule applies to volatility regardless of the underlyingdistribution provided that the returns are IID
• For VaR, the square-root-of-time rule only applies returnsare IID normally distributed
• note we need an additional assumption
• It is possible to derive the scaling law for IID fat taileddata

Financial Risk Forecasting © 2011,2017 Jon Danielsson, page 76 of 81
What is risk? Value–at–Risk Issues Coherence Manipulation ES Scaling Regulations
Regulations

Financial Risk Forecasting © 2011,2017 Jon Danielsson, page 77 of 81
What is risk? Value–at–Risk Issues Coherence Manipulation ES Scaling Regulations
Regulations
• All financial institutions are regulated
• Banks are regulated under the Basel Accords
• Determined by the Basel Committee (Under G20)
• Countries commit themselves to implementing the BaselAccords

Financial Risk Forecasting © 2011,2017 Jon Danielsson, page 78 of 81
What is risk? Value–at–Risk Issues Coherence Manipulation ES Scaling Regulations
Basel Accords
• Three main risk factors
1. trading book2. banking book3. operational risk
• Our focus here is on trading book

Financial Risk Forecasting © 2011,2017 Jon Danielsson, page 79 of 81
What is risk? Value–at–Risk Issues Coherence Manipulation ES Scaling Regulations
Trading book
• Basel II (in effect from about 2008 until 2019)
• banks are required to measure market risk with VaR99%
with ten-day holding periods
• Basel III (in effect from about 2019 (some partsimplemented earlier))
• banks are required to measure market risk with ES97.5%
with various holding periods

Financial Risk Forecasting © 2011,2017 Jon Danielsson, page 80 of 81
What is risk? Value–at–Risk Issues Coherence Manipulation ES Scaling Regulations
Use of regulatory risk measures
• Ensure banks have effective risk management systems
• Identify if they are taking too much risk
• Financial institutions regulated under the Basel II Accordsare required to set aside a certain amount of capital dueto market risk, credit risk and operational risk
• It is based on multiplying the maximum of previous day1%VaR and 60 days average VaR by a constant, Ξ, whichis determined by the number of violations that happenedpreviously:
Market risk capitalt = Ξt max(
VaR1%t ,VaR
1%
t
)
+constant

Financial Risk Forecasting © 2011,2017 Jon Danielsson, page 81 of 81
What is risk? Value–at–Risk Issues Coherence Manipulation ES Scaling Regulations
• VaR1%t is average reported 1% VaR over the previous 60
trading days
• The multiplication factor Ξt varies with the number ofviolations, υ1, that occurred in the previous 250 tradingdays - the required testing window length for backtestingin the Basel Accords.
• This is based on three ranges for the number ofviolations, named after the three colors of traffic lights:
Ξt =
3, if υ1 ≤ 4 (Green)
3 + 0.2(υ1 − 4), if 5 ≤ υ1 ≤ 9 (Amber)
4, if 10 ≤ υ1 (Red)