financial report june 30, 2005 and 2004
TRANSCRIPT
MICHIGAN STATE UNIVERSITY
Financial Report
June 30, 2005 and 2004
TABLE OF CONTENTS Michigan State University
Page
Letter from Vice President for Finance and Operations and Treasurer .....................................................................3 Sesquicentennial Statement.......................................................................................................................................4 Management's Discussion and Analysis ....................................................................................................................8 Independent Auditors’ Report...................................................................................................................................17 Basic Financial Statements: Statements of Net Assets - Michigan State University ........................................................................................19 Statements of Financial Position - Michigan State University Foundation ..........................................................20 Statements of Revenues, Expenses, and Changes in Net Assets - Michigan State University .........................21 Statements of Activities and Changes in Net Assets - Michigan State University Foundation ...........................22 Statements of Cash Flows - Michigan State University.......................................................................................23 Notes to the Financial Statements.......................................................................................................................25 Independent Auditors’ Report on Internal Control Over Financial Reporting and on Compliance and Other Matters Based on an Audit of Financial Statements Performed in Accordance with Government Auditing Standards........42

MICHIGAN STATE UNIVERSITYBOARD OF TRUSTEES
David L. Porteous Dolores M. Cook Dorothy V. Gonzales Donald W. NugentChairperson Greenville East Lansing FrankfortReed City
Joel I. Ferguson Melanie Foster Colleen M. McNamara G. Scott RomneyVice Chairperson East Lansing Okemos BirminghamLansing
EXECUTIVE OFFICERS
Lou Anna K. Simon Alison E. Barber J. Ian Gray Charles H. WebbPresident Secretary of the Board of Vice President for Research Vice President for
Trustees and Executive and Graduate Studies University DevelopmentKim Wilcox Assistant to the PresidentProvost and Vice President Lee June Steven M. Websterfor Academic Affairs Terry Denbow Vice President for Student Vice President for
Vice President for Affairs and Services Governmental AffairsFred L. Poston University RelationsVice President for Finance Robert A. Noto Keith Williamsand Operations and Treasurer Paulette Granberry Russell General Counsel and Executive Director of the
Senior Advisor to the Vice President for MSU Alumni AssociationPresident for Diversity and Legal AffairsDirector of Affirmative Action, Complianceand Monitoring
VICE PRESIDENT FOR FINANCE AND OPERATIONS AND TREASURER ADMINISTRATIVE STAFF
Fred L. Poston David S. Byelich Charles M. Gagliano Thomas N. LuccockVice President for Finance Assistant Vice President and Assistant Vice President for Director of Internaland Operations and Treasurer Director of Planning and Housing and Food Services Audit
BudgetsPamela S. Beemer Jeffrey R. Kacos Ronald H. MasonAssistant Vice President for James H. Dunlap Director of Campus Director of Human Resources Police Chief and Director of Planning and Administration Intercollegiate Athletics
Police and Public SafetyDavid B. Brower Kathryn E. Lindahl Charles J. ReidAssistant Vice President, Ronald T. Flinn Assistant Vice President for Director of LandChief Financial Officer and Assistant Vice President for Finance and Operations ManagementController Physical Plant
BUSINESS OPERATIONS ADMINISTRATIVE STAFF
David B. Brower Patricia J. Fowler Glen J. Klein Susan J. WaltersdorfAssistant Vice President, Director of Risk Director of Investments Associate ControllerChief Financial Officer and Management and and FinancialController Insurance Management
Daniel T. Evon Pamela D. George Vincent SchimizziDirector of Contract and Director of University Chief AccountantGrant Administration Services and Purchasing
3
T his report presents the financial position and results of operations of Michigan State University (“MSU” or “the University”) for the fiscal years ended June 30, 2005, and June 30, 2004. The financial report has been adopted by the Board of Trustees and is provided as part of the commitment by Michigan State University to report annually on its fiscal affairs. These financial statements have been audited by KPMG LLP, Certified Public Accountants. Their audit report appears on page 17. Since 1855, MSU has been advancing knowledge and transforming lives through teaching, research, and outreach. Some 45,000 students from every county in the state, every state in the nation, and more than 125 countries worldwide enroll at Michigan State each year in 200 programs of undergraduate and graduate study. The fall 2004 freshman class reflected another strong recruiting effort with an average high school GPA of 3.56 and an average composite ACT score of 24.5. Despite continued difficult financial times, MSU made the necessary fiscal adjustments through a series of strategies with the objective of maintaining quality and balancing the budget. This was achieved by focusing on cost controls, pursuing a long-term investment strategy to maximize risk-adjusted total returns, and appropriate utilization of debt and other resources to meet programmatic needs, including the maintenance and replacement of the University’s infrastructure. In an effort to broaden its revenue base, the University continues The Campaign for MSU, a comprehensive fundraising initiative with a goal to generate $1.2 billion by 2007. As of June 30, 2005, the amount raised to date exceeded $1 billion. The University’s ongoing review of its infrastructure indicates a need to expend approximately $550 million over the next ten years to modernize and renovate aging teaching, research, housing and other support facilities, utility systems, and roads, utilizing a just-in-time maintenance strategy. Examples during 2005-06 include upgrades to the T.B. Simon Power Plant and new heating, ventilating, and air conditioning systems in the Biochemistry, Chemistry, and Food Science Buildings. These modernizations, efforts to improve the reliability of the University’s source of power and to upgrade laboratory facilities, respectively, will serve to greatly enhance the University’s research and teaching missions. Michigan State University observes its Sesquicentennial this year, celebrating 150 years as the nation’s pioneer land-grant university. Since its founding, Michigan State University has been a leader and an innovator, a forward-thinking instrument for educational and social improvement, a catalyst for economic development, and a national - and now, international - model for higher education. It is our responsibility to build on that legacy and to continue offering our students, scholars, and stakeholders the kinds of opportunities and possibilities that will make a lasting difference.
Fred L. Poston Vice President for Finance and Operations and Treasurer
In 2005, Michigan State University observes its Sesquicentennial, celebrating the birth of a revolution conceived 150 years ago in Michigan. As the pioneer land-grant institution, this university spearheaded a movement that led to the development of a totally new educational tradition.
That “land-grant tradition” was not simply about the establishment of agricul-tural colleges, as some believe. Rather, it was a visionary idea of higher educa-tion that called for embracing practical knowledge, as well as traditional scien-tific and classical studies, and offering all—not just those preparing themselves for a handful of traditional professions—an equal opportunity to become citizen leaders and to shape a new, wider range of knowledge that, in turn, would help shape our rapidly growing nation.
In 1855, that idea was considered a “great experiment.” In 2005, we reaffirm it and the land-grant values of quality, inclusion, and connectivity at its core—values that made this university the model for the land-grant revolution that transformed higher education across our nation and around the world. Today, we stand on the threshold of the next bold experiment: the land-grant university for the 21st century and the world.
This anniversary is not only an occasion to reflect on our unique history, but also a time to consider key questions that will shape our collective future: How can we contribute to creating a more civil society—on campus, locally, nation-ally, and globally? What is the best way to transform education to achieve real progress in transforming society to advance the public good? How can we nurture and challenge the inventive mind, sharpening and freeing it to meet the rigors of problem solving demanded in the 21st century?
As a great public research university, one of the top 100 in the world, endowed with a difference—the great land-grant spirit, the great land-grant heart—Michi-gan State University will answer those questions by accepting the responsibil-ity, as the nation’s pioneer land-grant university, to honor the values of our past and to draw from them the energy to innovate our future around the world, across the nation, and at home. We will build something enduring for our students, scholars, and stakeholders and continue to offer them the kinds of opportunities and possibilities that will make a lasting difference.
Michigan State University has been the very embodiment of the land-grant philosophy, which couples instruction, research, and extension in the interests of the people of Michigan. The problem is not one of testing the validity of this proposition, but rather of being concerned with how this philosophy can best be implemented in a period far dif-ferent from the one to which that philosophy was originally indigenous.
— John Hannah, MSU President 1941–1969
BUILDING ON A LEGACY OF EXCELLENCE AND INNOVATION
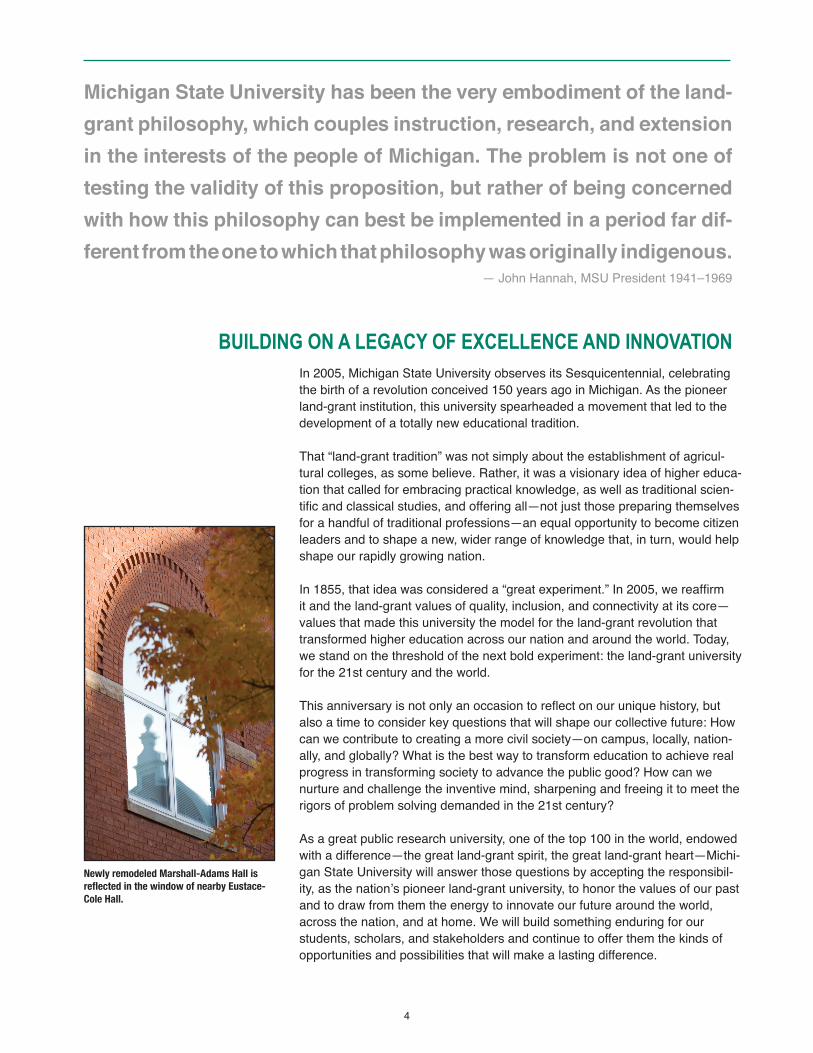
Newly remodeled Marshall-Adams Hall is reflected in the window of nearby Eustace-Cole Hall.
4

BOLDNESS BY DESIGNBy 2012, Michigan State University will be recognized worldwide as the leading land-grant research university, the model for “world-grant.”
When people think of land-grant universities, we want them to think first of Michigan State. The example of our work in the classroom and in laboratories, both on campus and around the world, and our engagement in serving society will redefine the power and relevance of the land-grant mission for the 21st century world. And we will get there by working together, by staying focused amid the fascination of possibilities—the kaleidoscope of problems to solve and opportunities to seize—and by staying true to our strengths and values.
We have identified five imperatives—inspired by our historical strengths—that we will use to align existing initiatives, to guide decisions about investing in new priorities, and to focus our energies:
• Enhance the student experience—by continually improving the quality of academic programs and the value of an MSU degree for undergraduate and graduate students.
• Enrich community, economic, and family life—through research, outreach, engagement, entrepreneurship, innovation, and diversity.
• Expand international reach—through academic, research, and economic development initiatives and global, national, and local strategic alliances.
• Increase research opportunities—by significantly expanding research funding and involvement of graduate and undergraduate students in research and scholarship.
• Strengthen stewardship—by appreciating and nurturing the university’s academic and financial assets, campus infrastructure, and people for optimal effectiveness today and tomorrow.
Through these imperatives, we will chart a course, using them to provide focus, guidelines for decision making, and milestones and measurements of progress and success toward fulfilling our strategic commitment.
BUILDING FOR THE FUTUREMichigan State University has come a long way since the first students arrived at a hastily cleared acre of land on which stood the three brick buildings that were the original college: College Hall, the first building in the world dedicated to the teaching of scientific agriculture; “Saints’ Rest,” the first dormitory in what would grow into the largest single-campus housing system in the country; and a horse barn. It was a modest beginning, but to many it was a place of opportu-nities and possibilities—“a place built of bricks and dreams.”
While those original buildings are gone now, the promise that infused them remains. And one—Saints’ Rest—continues to offer learning opportunities to the students who participated this summer in an archaeological excavation of its remaining foundations alongside the MSU Museum, where artifacts from the dig are now on display.
An anthropology student digs into MSU’s past during the summer 2005 excavation of Saints’ Rest, the first dormitory on campus.
5
As we look around the MSU campus today—with some 2,000 acres developed or in planning and more than 660 buildings—we can see the outlines of the campus of tomorrow taking shape: the Matilda R. Wilson Pegasus Critical Care Center, a 13,000-square-foot addition to the Veterinary Clinical Center that will provide critical care for horses; the new nuclear magnetic resonance spectrom-eter facility at the Michigan Center for Structural Biology, brought to MSU with support from the Michigan Technology Tri-Corridor and Dow Chemical Compa-ny; the renovation and expansion of Spartan Stadium; and the relocation of the original, ceramic “Sparty” statue to the remodeled stadium and the unveiling of a new bronze “Sparty”—cast from a mold of the original—at the reconfigured and much safer intersection of Kalamazoo Street, Chestnut Road, and Red Cedar Road.
And speaking of safety, in August, Congress passed the federal highway bill with more than $16 million earmarked for the construction of underpasses at the railroad tracks that cross Farm Lane, which will allow emergency vehicles to move quickly and easily through the campus.
STEWARDSHIPMichigan State University has always been a good place to invest in the future.
In 1855, the Michigan Legislature invested a total of $56,320 from the state treasury for all of the expenses—the land, buildings, furniture, equipment, and salaries—necessary to establish and operate the original college on a tract of farmland outside of Lansing. Today, MSU has grown to more than a billion-dol-lar enterprise, with connections and linkages that span the globe. And like any high-performing, globally competitive organization in this 21st century, it has obligations and expectations that must be met.
In June 2005, we surpassed the $1 billion mark in our $1.2 billion capital cam-paign scheduled to end in 2007. That places MSU in the elite company of only two other public universities without a teaching hospital to pass the $1 billion mark—University of California at Berkeley and Purdue. We continue to rank among the top 10 percent in our return on investment of our endowment funds. We continue to put every dollar of revenue possible into advancing opportu-nities for students and developing critical programs and initiatives. And, we continue to control costs because we know that every dollar we save translates into additional capacity to invest in people, programs, and new possibilities.
RETURN ON INVESTMENTMichigan State University knows that those who invest in us expect a return on their investment. Our investors are many—the state, our students and their families, our alumni and donors, our faculty and staff, our for-profit and not-for-profit organization partners, our research-funding agencies—and all believe in MSU’s ability to transform today’s possibilities into opportunities for all of our tomorrows.
We make a commitment to our students and their families that a degree earned from Michigan State today will continue to increase in value in the future. We make a commitment to society that we will generate and apply knowledge to make a difference and advance the quality of life. According to a 2002 study, every dollar invested in Michigan’s public universities returned an “education premium” of $26 to the state’s economy. Few other investments offer stake-holders such an impressive rate of return.
Michigan StateUniversity hasalways beena good placeto invest inthe future.
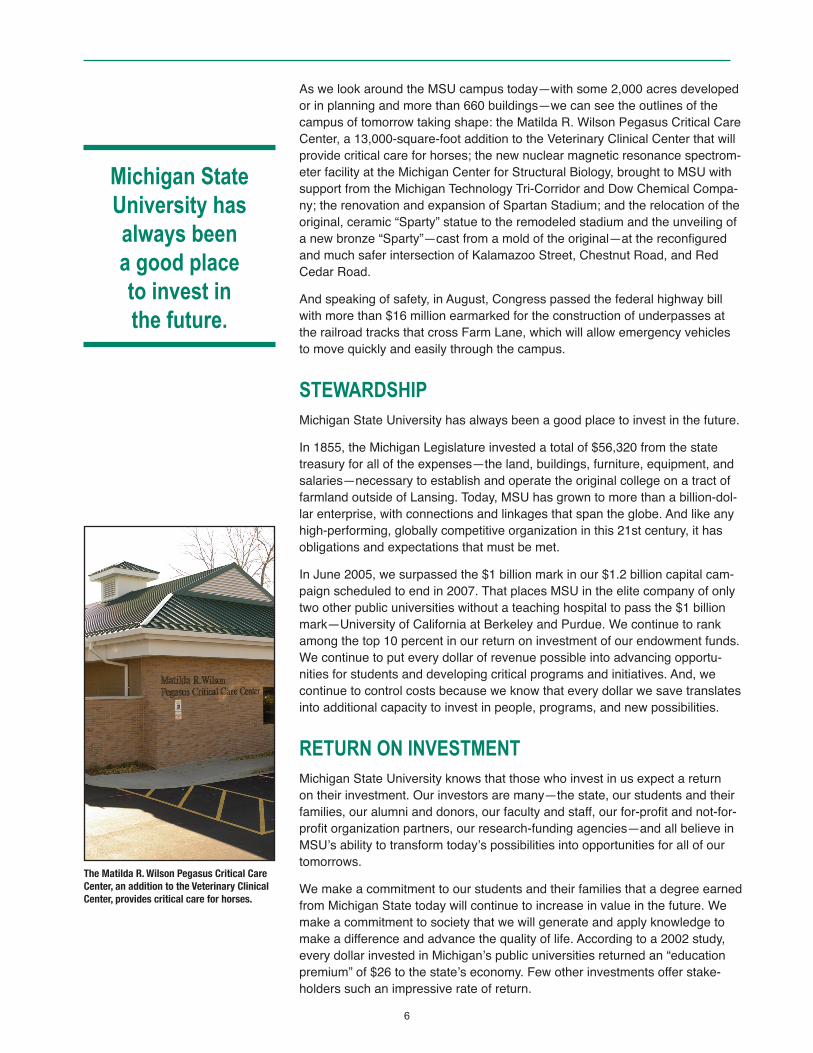
The Matilda R. Wilson Pegasus Critical Care Center, an addition to the Veterinary Clinical Center, provides critical care for horses.
6
MSU AND ECONOMIC DEVELOPMENTSociety’s expectations for its public universities continue to increase. As the pioneer land-grant institution in the world, it is in the lifeblood of Michigan State to apply the benefits of higher education to advance society and the public good. And every year we are asked to do more with less, to play an ever-great-er role in building the national and local economies.
The state of Michigan explicitly recognized the vital role of higher education in the economic future and competitiveness of Michigan in the bipartisan report of The Lt. Governor’s Commission on Higher Education and Economic Growth—known as the Cherry Commission—in December 2004. Research universities like Michigan State are identified as the vehicles to meet the rising demand for intellectual capital that will drive the emerging new economy in Michigan.
Michigan State already has joined forces with the cities of Lansing and East Lansing in a regional SmartZone initiative to identify commercial opportuni-ties that will grow businesses in or attract businesses to the mid-Michigan area. The university is partnering with the Michigan Department of Labor and Economic Growth on a regional economic development process to create a permanent engine for community and economic development in the Greater Lansing area and the mid-Michigan region that will subsume the event-driven initiatives of the past into a comprehensive, proactive, sustainable force. We are just beginning to take that conversation to the larger community.
MSU will continue to be in the vanguard of Michigan’s economic development efforts with our public- and private-sector partners, developing the research and development inputs and the technology and science workforce—the hu-man “intellectual” capital—that will fuel the state’s economic growth.
TOWARD THE FUTUREHistorically, Michigan State University has been an engine of innovation for economic competitiveness and social change. We have a proven record of delivering strong results for Michigan’s people and Michigan’s economy. The work done at Michigan State and the knowledge we have generated have touched lives far beyond our campus. From hybrid corn to a Rwandan coffee, from international education to residential learning, from Cisplatin to Tamiflu intermediate synthesis, Michigan State has a strong reputation for addressing society’s needs and providing innovations that improve lives, strengthen the economy, and contribute to the public good.
Michigan State is a diligent and effective steward of the trust and resources in-vested in it. At the same time, we boldly forge ahead, reinventing the land-grant university for the 21st century and the world. Although much has changed in the past 150 years, Michigan State University continues to lead and to be a place of opportunities and possibilities, still “a place built of bricks and dreams.”
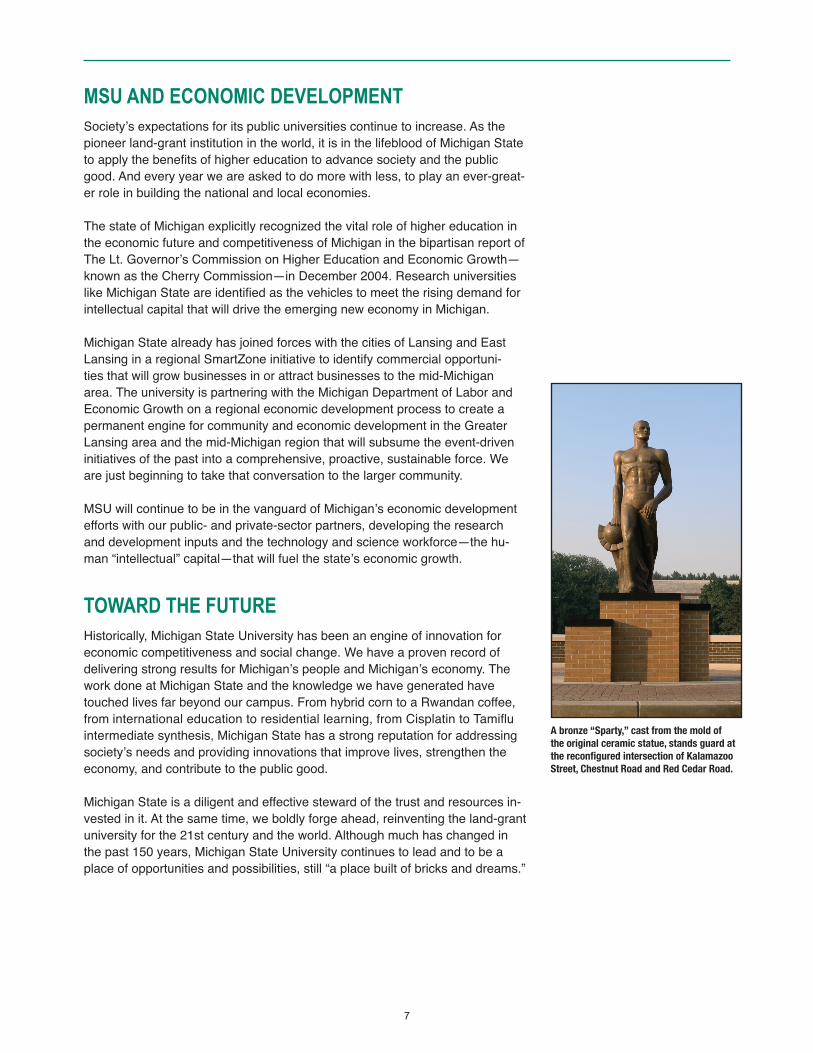
A bronze “Sparty,” cast from the mold of the original ceramic statue, stands guard at the reconfigured intersection of Kalamazoo Street, Chestnut Road and Red Cedar Road.
7
MANAGEMENT’S DISCUSSION AND ANALYSIS Michigan State University
8
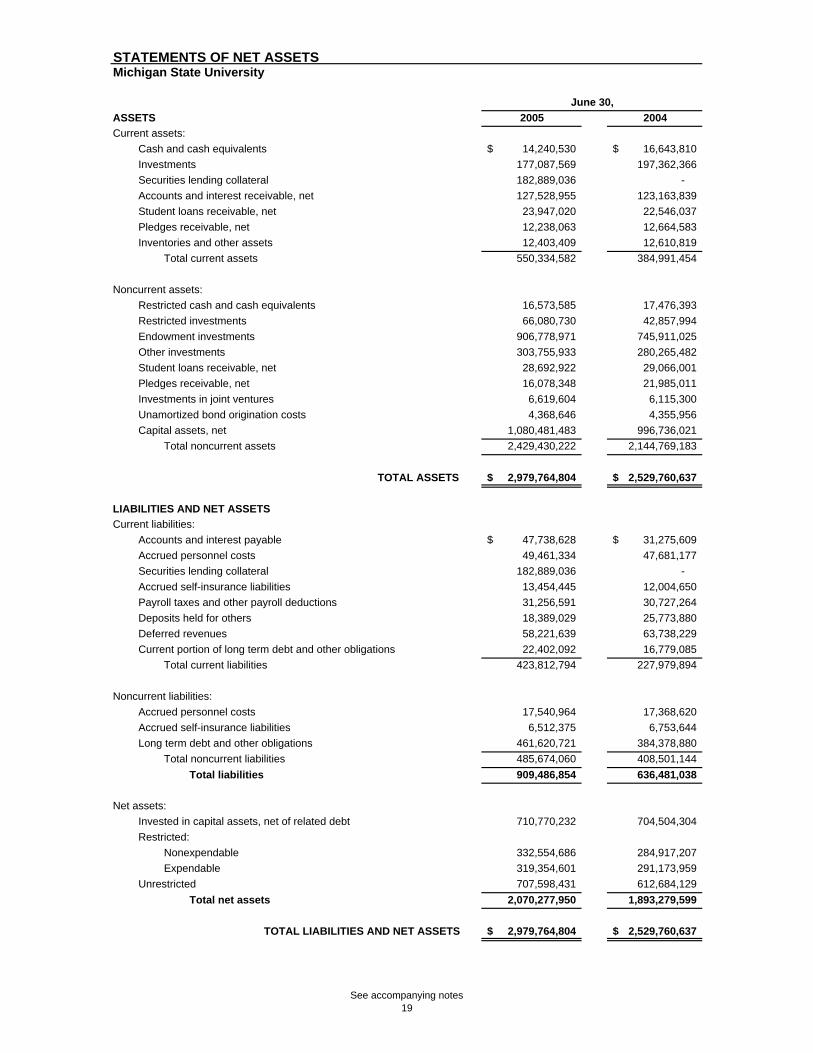
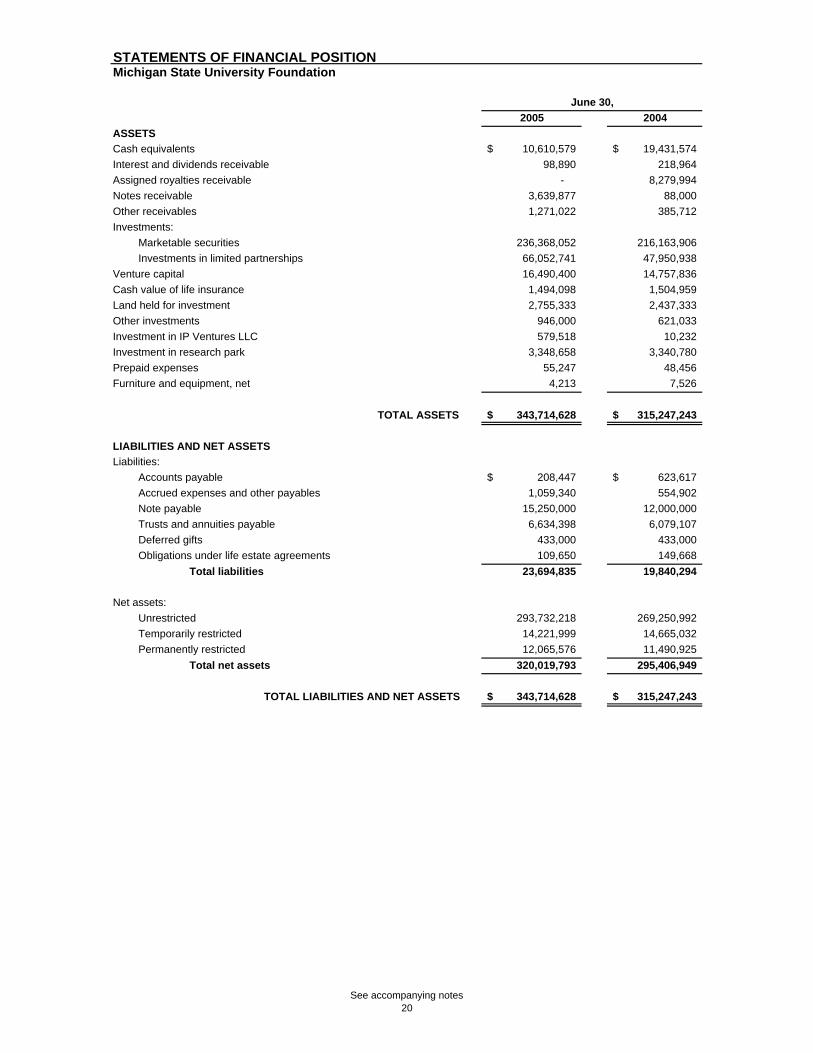
Introduction The following discussion provides an overview of the financial position of Michigan State University (the “University”) for the years ended June 30, 2005 and 2004 and includes an analysis of the University’s Statement of Net Assets, which presents the assets, liabilities, and net assets of the institution as of the end of the fiscal year, and Statement of Revenues, Expenses, and Changes in Net Assets, which reflects revenues and expenses recognized during the fiscal year. These financial statements are prepared in accordance with Governmental Accounting Standards Board (GASB) pronouncements. The Michigan State University Foundation (the “Foundation”) is a legally separate entity which meets the criteria set forth for component units under GASB regulations. The Foundation provides financial support for the objectives, purposes, and programs of the University. Although the University does not control the timing, purpose, or amount of receipts from the Foundation, the resources (and income thereon) which the Foundation holds and invests are dedicated to benefit the University. Because these resources held by the Foundation can only be used by, or for the benefit of, the University, the Foundation is considered a component unit of the University and is discretely presented in the University's financial statements. The Foundation is a private organization that reports under Financial Accounting Standards Board (FASB) standards. As such, certain revenue recognition criteria and presentation features are different from GASB revenue recognition criteria and presentation features. No modifications have been made to the Foundation’s financial information in the University’s financial reporting entity for these differences. This discussion (which excludes the Foundation) has been prepared by management along with the financial statements and related footnote disclosures and should be read in conjunction with the financial statements and footnotes. Statement of Net Assets The Statement of Net Assets includes all assets and liabilities. It is prepared under the accrual basis of accounting, whereby revenues and assets are recognized when services are provided and expenses and liabilities are recognized when others provide the services, regardless of when cash is exchanged. Assets and liabilities are generally measured using current values. One exception is capital assets, which are stated at historical cost less an allowance for depreciation. A summarized comparison of the University’s assets, liabilities and net assets at June 30, 2005, 2004, and 2003 follows:

MANAGEMENT’S DISCUSSION AND ANALYSIS (Continued) Michigan State University
9
2005 2004 2003
Current assets 550$ 385$ 340$ Noncurrent assets:
Restricted cash and cash equivalents and restricted investments 83 60 24 Endowment and other investments 1,211 1,026 874 Capital assets, net 1,080 997 952 Other 56 62 57
Total assets 2,980 2,530 2,247
Current liabilities 424 228 208 Noncurrent liabilities 486 409 321 Total liabilities 910 637 529 Total net assets 2,070$ 1,893$ 1,718$
(in millions)
Over time, increases or decreases in net assets are one indicator of the improvement or erosion of the University’s financial health when considered with non-financial facts such as enrollment levels, strength of faculty, and condition of facilities. The University’s Statement of Net Assets at June 30, 2005 and June 30, 2004 indicates that the University increased total net assets approximately 10% in each of the last two years. This has been achieved by focusing on cost controls, pursuing a long-term investment strategy to maximize risk-adjusted total returns, and appropriate utilization of debt and other resources to meet programmatic needs, including the maintenance and replacement of the University’s infrastructure. Current assets: Current assets consist of cash and cash equivalents, securities lending collateral, investments, net accounts and interest receivable, and other assets. Effective in 2005, to enhance the return on investments, the University Board of Trustees authorized participation in a securities lending program whereby University securities are contractually loaned to approved borrowers against a pledge of collateral which is invested. As of June 30, 2005, securities lending collateral totaled $183 million and is recorded as a current asset and offsetting current liability. The net increase in current assets in 2005 is due primarily to this $183 million. The net increase in 2004 includes $12 million in student loans receivable related to the then-newly offered Federal Family Education Loan Program (the 2005 receivable balance for this program totaled $13 million). Noncurrent assets: Restricted cash and cash equivalents and restricted investments These assets represent unspent bond proceeds which are externally restricted for the construction or purchase of capital assets. The 2005 balance is due to the University’s issuance of Series 2005 bonds in June 2005. The 2004 balance is due to the University’s issuance of Series 2003A and 2003C bonds in December 2003. Endowment and other investments At June 30, 2005 and June 30, 2004, the University’s endowment investments totaled $907 million (an increase of $161 million from the prior year) and $746 million (an increase of $144 million from the prior year), respectively. During both 2005 and 2004, $60 million of investments was reallocated to designated endowment investments,

MANAGEMENT’S DISCUSSION AND ANALYSIS (Continued) Michigan State University
10
consistent with the University’s Board approved cash management and investment plan. Market value (realized and unrealized) increases within the investment portfolio accounted for $77 million and $67 million of the increases in 2005 and 2004, respectively, while gifts to permanent endowments totaled $19 million and $12 million in 2005 and 2004, respectively. Other investments consist primarily of the intermediate term fixed income securities component of the University’s Operating Cash Pool which totaled $196 million and $185 million at June 30, 2005 and 2004, respectively. Funded retirement and post-employment benefit reserves ($81 million in 2005 and $73 million in 2004) substantially account for the remainder of other investments. For the years ended June 30, 2005, 2004, and 2003, the total returns on investments were as follows:
2005 2004 2003 Operating Cash Pool: Liquidity Pool 2.3% 0.3% 5.0% Intermediate Term Fixed Income Pool 7.4% 0.8% 11.4% Common Investment Fund 15.3% 18.7% 5.0% Other Separately Invested Investments 5.1% 7.8% 1.0%
Capital assets The University continues to implement its long-range plan to modernize and renew its teaching, research and residential life facilities in support of its missions. At June 30, 2005, 2004, and 2003, the University’s investment in capital assets was as follows:
2005 2004 2003
Land 20$ 20$ 19$ Buildings and site improvements 1,432 1,350 1,333 Construction in progress 138 86 26 Equipment and other 435 430 421 Capital assets not depreciated 5 5 5 Less: accumulated depreciation (950) (894) (852)
1,080$ 997$ 952$
(in millions)
Major additions to buildings and site improvements during 2005 included $40 million for heating, ventilating, and air conditioning improvements to the Biochemistry, Chemistry, and Food Science Buildings, $8 million for Psychology Building alterations, and $5 million for an expansion of the T.B. Simon Power Plant. Major additions to buildings and site improvements during 2004 included $3 million for a series of upgrades to the T.B. Simon Power Plant, and $1 million each for a series of improvements to the campus steam tunnel vaults, renovations of Jenison Field House, Engineering Building classroom alterations, and residence hall roof restorations. Construction in progress reflects multi-year projects which, once completed and placed into service, are categorized as buildings and site improvements. The 2005 balance includes $50 million for Spartan Stadium suites and club seating, $24 million for an expansion of the T.B. Simon Power Plant, $7 million for the Veterinary

MANAGEMENT’S DISCUSSION AND ANALYSIS (Continued) Michigan State University
11
Medical Center Oncology expansion, $6 million for Marshall-Adams Hall renovations, and $4 million for renovations to Kellogg Center guest rooms. The 2004 balance includes $34 million for heating, ventilating, and air conditioning improvements to the Biochemistry, Chemistry, and Food Science Buildings, $13 million for Spartan Stadium suites and club seating, and $8 million for Psychology Building alterations. As of June 30, 2005, the University had initiated plans and incurred certain contractual commitments related to the construction and renovation of various facilities. The costs to complete the projects are estimated to be $79 million and are to be funded from State of Michigan and State Building Authority (SBA) appropriations, private gifts, debt proceeds, or other University funds. Current liabilities: Current liabilities consist primarily of trade accounts payable, accrued compensation and other personnel costs, securities lending collateral, deferred revenues, and other liabilities payable within one year or less. The net increase in current liabilities in 2005, as compared to 2004, is due primarily to $183 million in securities lending collateral – new in 2005. Also contributing to the net increase in current liabilities is a $16 million increase in accounts and interest payable, due primarily to completed work at Spartan Stadium ($8 million) and an expansion of the T.B. Simon Power Plant ($5 million). The net increase in current liabilities in 2004 is due primarily to a $13 million increase in the current portion of long term debt and other obligations related to line of credit borrowings under the then-new Federal Family Education Loan Program (the 2005 line of credit balance for this program totaled $14 million). Noncurrent liabilities, primarily debt: At June 30, 2005, the University had noncurrent debt and other obligations outstanding of $462 million compared with $384 million at June 30, 2004. This balance is comprised primarily of outstanding General Revenue Bonds of $423 million and $348 million in 2005 and 2004, respectively, a net increase largely due to the issuance of General Revenue Bonds Series 2005 ($85 million) in June, 2005. The University periodically reviews its debt capacity and related capital assets needs to optimize the use of long-term resources. The University’s outstanding bonds carry an investment grade bond rating from Moody’s of Aa2.

MANAGEMENT’S DISCUSSION AND ANALYSIS (Continued) Michigan State University
12
Net assets: Net assets represent residual University assets after liabilities are deducted. The University’s net assets at June 30, 2005, 2004, and 2003 are summarized as follows:
2005 2004 2003
Invested in capital assets, net of related debt 711$ 704$ 700$
Restricted:Nonexpendable 333 285 241 Expendable 319 291 263
Total restricted 652 576 504 Unrestricted 707 613 514
Total net assets 2,070$ 1,893$ 1,718$
(in millions)
The following is a breakdown of net assets at June 30, 2005 (amounts are presented in millions of dollars):
Net assets invested in capital assets, net of related debt, represent the University’s land, buildings and equipment net of accumulated depreciation and outstanding principal balances of debt attributable to the acquisition, construction or improvement of those assets. Restricted nonexpendable net assets are made up of the University’s permanent endowment funds. Restricted expendable net assets, which are subject to externally imposed restrictions governing their use, include restricted quasi-endowments, restricted gifts, and federal and state sponsored programs. Although unrestricted net assets are not subject to externally imposed restrictions, virtually all of the University’s unrestricted net assets are designated for purposes to fulfill its various fiduciary responsibilities, including maintaining reserves for capital projects, future post-employment benefits, working capital for self-supporting departmental activities, and unrestricted quasi and term endowments.

MANAGEMENT’S DISCUSSION AND ANALYSIS (Continued) Michigan State University
13
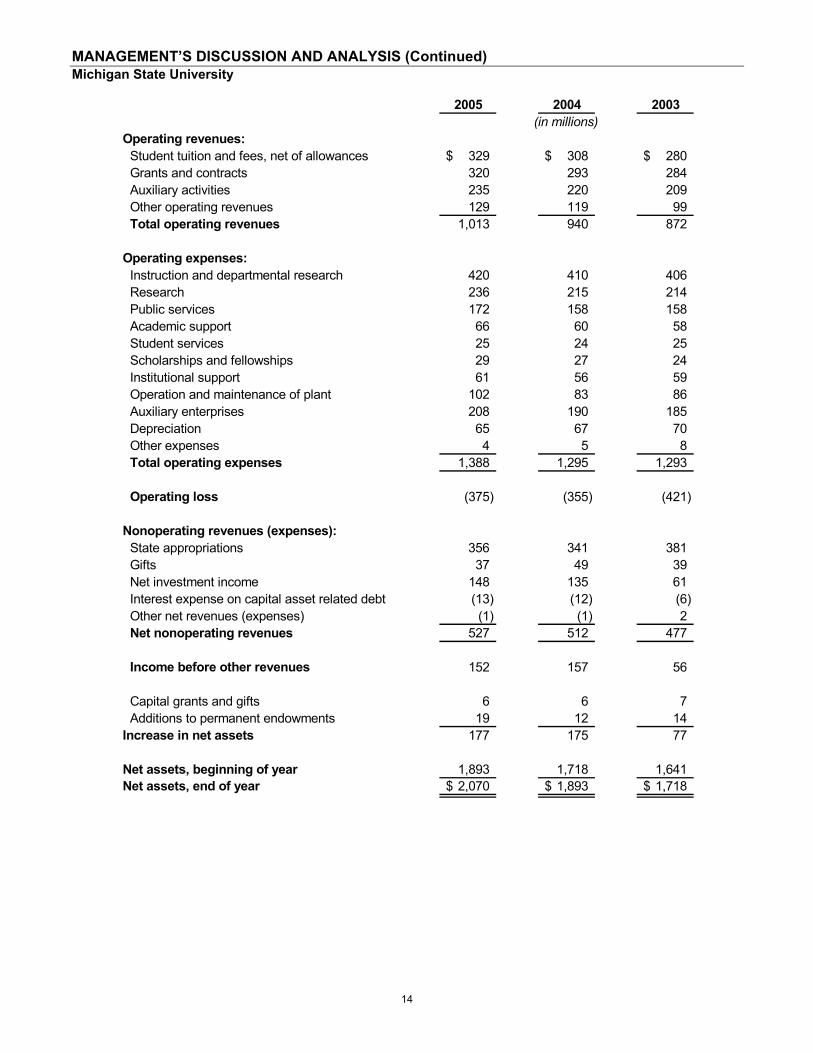
The University’s ongoing review of its infrastructure indicates a need to expend approximately $550 million over the next 10 years to modernize and renovate aging teaching, research, housing and other support facilities, utility systems, and roads, consistent with its just-in-time maintenance strategy. The University intends to address these maintenance and technology needs through the use of capital and infrastructure reserves, appropriate use of additional borrowing, and efforts to obtain additional gifts, grants, and capital appropriations. In addition, the University faces the challenge of funding its increasing health care and dental benefits costs. This includes the cost of providing postemployment health and dental benefits to eligible employees. The University will be required to implement the provisions of GASB Statement No. 45, Accounting and Financial Reporting by Employers for Postemployment Benefits Other Than Pensions, effective with the fiscal year ending June 30, 2008. In accordance with this statement, the University will address the accounting and reporting for expected benefit obligations related to postemployment healthcare and other non-pension benefits which were estimated at $800 million as of July 2003 (the latest actuarial calculation). Statement of Revenues, Expenses, and Changes in Net Assets The Statement of Revenues, Expenses, and Changes in Net Assets presents the operating results of the University, as well as the nonoperating revenues and expenses. Operating revenues primarily include net student tuition and fees, grants and contracts, and auxiliary activities. Given a public university’s dependency on revenues such as state appropriations, gifts, and investment income, which are prescribed by GASB as nonoperating revenues, operating expenses will exceed operating revenues resulting in an operating loss. Net nonoperating revenues or expenses are an integral component in determining the increase or decrease in net assets. A summarized comparison of the University’s revenues, expenses, and changes in net assets for the years ended June 30, 2005, 2004, and 2003 follows:
MANAGEMENT’S DISCUSSION AND ANALYSIS (Continued) Michigan State University
14
2005 2004 2003
Operating revenues:Student tuition and fees, net of allowances 329$ 308$ 280$ Grants and contracts 320 293 284 Auxiliary activities 235 220 209 Other operating revenues 129 119 99 Total operating revenues 1,013 940 872
Operating expenses:Instruction and departmental research 420 410 406 Research 236 215 214 Public services 172 158 158 Academic support 66 60 58 Student services 25 24 25 Scholarships and fellowships 29 27 24 Institutional support 61 56 59 Operation and maintenance of plant 102 83 86 Auxiliary enterprises 208 190 185 Depreciation 65 67 70 Other expenses 4 5 8 Total operating expenses 1,388 1,295 1,293
Operating loss (375) (355) (421)
Nonoperating revenues (expenses):State appropriations 356 341 381 Gifts 37 49 39 Net investment income 148 135 61 Interest expense on capital asset related debt (13) (12) (6) Other net revenues (expenses) (1) (1) 2 Net nonoperating revenues 527 512 477
Income before other revenues 152 157 56
Capital grants and gifts 6 6 7 Additions to permanent endowments 19 12 14
Increase in net assets 177 175 77
Net assets, beginning of year 1,893 1,718 1,641 Net assets, end of year 2,070$ 1,893$ 1,718$
(in millions)

MANAGEMENT’S DISCUSSION AND ANALYSIS (Continued) Michigan State University
15
The following is a graphic illustration of total revenue by source for the year ended June 30, 2005 (amounts are presented in millions of dollars):
The University is supported by a diverse stream of revenue which supplements its student tuition and fees, including state appropriations, federal and state sponsored programs, private gifts and grants, and investment income. The University continues to seek funding from all possible sources consistent with its mission and to manage the financial resources realized from these efforts to fund its operations. Operating revenues: The most significant source of operating revenue for the University was tuition and fees (net of scholarship allowances), totaling $329 million and $308 million at June 30, 2005 and June 30, 2004, respectively. Gross tuition and fees revenue increased 6.3% in 2005 and includes a 4.3% effective rate increase in tuition and fees and a 1.9% revenue increase from additional student credit hours taken. The 10.5% increase in 2004 reflects a 10.1% effective rate increase in tuition and fees. Other major revenue sources in 2005 include auxiliary services of $235 million ($220 million in 2004) and federal grants and contracts of $231 million ($212 million in 2004). Net nonoperating and other revenues: The primary source of this net revenue is state appropriations, which totaled $356 million in 2005, an increase of $15 million (4.4%). For 2005, $287 million in funding for general operations was initially appropriated, but subsequently reduced a net $2 million, resulting in support for the year of $285 million. Additionally in 2005, the State allocated one-time funding of $9 million to refund a portion of prior year Executive Order budget cuts. Michigan State University Extension and the Michigan Agricultural Experiment Station appropriations remained at $62 million annually over the two year period. In 2004, appropriations decreased $40 million (10.5%) via a 6.7% beginning of the year cut for general operations, Michigan State University Extension, and the Michigan Agricultural Experiment Station, and an unscheduled 5.0% mid-year budget rescission for the general operations by the State. In 2005, other significant components of net nonoperating revenues, gift revenue and net investment income, decreased $12 million and increased $13 million, respectively. In 2004, gift revenue and net investment income increased $10 million and $74 million, respectively.

MANAGEMENT’S DISCUSSION AND ANALYSIS (Continued) Michigan State University
16
The following is a graphic illustration of operating expenses by source for the year ended June 30, 2005 (amounts are presented in millions of dollars):
During 2005, $828 million (59.6%) was expended for the core missions of the University, instruction and departmental research, research, and public services, compared with $783 million (60.8%) in 2004. Auxiliary enterprises (activities which provide services to students, faculty, staff, and the public) totaled $208 million (15.0%) and $190 million (14.7%) in 2005 and 2004, respectively. Expenses for the operation and maintenance of plant totaled $102 million (7.4%) and $83 million (6.4%) in 2005 and 2004, respectively. The increase in 2005 is due primarily to increased fuel costs and an increase in campus-wide non-capitalized repair and maintenance projects. Economic Outlook As a result of economic pressures affecting the State of Michigan, 2005-06 fiscal year State appropriations are slightly less than 2004-05 levels. The Board of Trustees approved increases of 9.4% and 13.5% for fall 2005 tuition and required fees for returning in-state and new in-state undergraduate students, respectively. The University’s revenue mix is closely associated with the level of State support. There is a direct relationship between the growth of State appropriations and the increase in tuition and fee levels. Static or declining State appropriations generally result in increased tuition and fee levels. Continued adverse economic pressures affecting the State will, at best, result in minimal or declining adjustments in State appropriations for higher education. In an effort to broaden its revenue base, the University continues The Campaign for MSU, a comprehensive fund-raising initiative with a goal to generate $1.2 billion by 2007. As of June 30, 2005, $1.0 billion had been raised including cash, in-kind gifts, pledges, irrevocable life income agreements, and bequests.


STATEMENTS OF NET ASSETS Michigan State University
ASSETS 2005 2004Current assets:
Cash and cash equivalents 14,240,530$ 16,643,810$ Investments 177,087,569 197,362,366 Securities lending collateral 182,889,036 - Accounts and interest receivable, net 127,528,955 123,163,839 Student loans receivable, net 23,947,020 22,546,037 Pledges receivable, net 12,238,063 12,664,583 Inventories and other assets 12,403,409 12,610,819
Total current assets 550,334,582 384,991,454
Noncurrent assets:Restricted cash and cash equivalents 16,573,585 17,476,393 Restricted investments 66,080,730 42,857,994 Endowment investments 906,778,971 745,911,025 Other investments 303,755,933 280,265,482 Student loans receivable, net 28,692,922 29,066,001 Pledges receivable, net 16,078,348 21,985,011 Investments in joint ventures 6,619,604 6,115,300 Unamortized bond origination costs 4,368,646 4,355,956 Capital assets, net 1,080,481,483 996,736,021
Total noncurrent assets 2,429,430,222 2,144,769,183
TOTAL ASSETS 2,979,764,804$ 2,529,760,637$
LIABILITIES AND NET ASSETSCurrent liabilities:
Accounts and interest payable 47,738,628$ 31,275,609$ Accrued personnel costs 49,461,334 47,681,177 Securities lending collateral 182,889,036 - Accrued self-insurance liabilities 13,454,445 12,004,650 Payroll taxes and other payroll deductions 31,256,591 30,727,264 Deposits held for others 18,389,029 25,773,880 Deferred revenues 58,221,639 63,738,229 Current portion of long term debt and other obligations 22,402,092 16,779,085
Total current liabilities 423,812,794 227,979,894
Noncurrent liabilities:Accrued personnel costs 17,540,964 17,368,620 Accrued self-insurance liabilities 6,512,375 6,753,644 Long term debt and other obligations 461,620,721 384,378,880
Total noncurrent liabilities 485,674,060 408,501,144 Total liabilities 909,486,854 636,481,038
Net assets:Invested in capital assets, net of related debt 710,770,232 704,504,304 Restricted:
Nonexpendable 332,554,686 284,917,207 Expendable 319,354,601 291,173,959
Unrestricted 707,598,431 612,684,129 Total net assets 2,070,277,950 1,893,279,599
TOTAL LIABILITIES AND NET ASSETS 2,979,764,804$ 2,529,760,637$
June 30,
See accompanying notes19
STATEMENTS OF FINANCIAL POSITION Michigan State University Foundation
2005 2004ASSETSCash equivalents 10,610,579$ 19,431,574$ Interest and dividends receivable 98,890 218,964 Assigned royalties receivable - 8,279,994 Notes receivable 3,639,877 88,000 Other receivables 1,271,022 385,712 Investments:
Marketable securities 236,368,052 216,163,906 Investments in limited partnerships 66,052,741 47,950,938
Venture capital 16,490,400 14,757,836 Cash value of life insurance 1,494,098 1,504,959 Land held for investment 2,755,333 2,437,333 Other investments 946,000 621,033 Investment in IP Ventures LLC 579,518 10,232 Investment in research park 3,348,658 3,340,780 Prepaid expenses 55,247 48,456 Furniture and equipment, net 4,213 7,526
TOTAL ASSETS 343,714,628$ 315,247,243$
LIABILITIES AND NET ASSETSLiabilities:
Accounts payable 208,447$ 623,617$ Accrued expenses and other payables 1,059,340 554,902 Note payable 15,250,000 12,000,000 Trusts and annuities payable 6,634,398 6,079,107 Deferred gifts 433,000 433,000 Obligations under life estate agreements 109,650 149,668
Total liabilities 23,694,835 19,840,294
Net assets:Unrestricted 293,732,218 269,250,992 Temporarily restricted 14,221,999 14,665,032 Permanently restricted 12,065,576 11,490,925
Total net assets 320,019,793 295,406,949
TOTAL LIABILITIES AND NET ASSETS 343,714,628$ 315,247,243$
June 30,
See accompanying notes20

STATEMENTS OF REVENUES, EXPENSES, AND CHANGES IN NET ASSETS Michigan State University
OPERATING REVENUES 2005 2004Student tuition and fees 373,307,566$ 351,365,838$ Less: scholarship allowances 44,007,144 43,072,601
Net student tuition and fees 329,300,422 308,293,237
State of Michigan grants and contracts 39,460,126 30,937,782 Federal grants and contracts 231,108,854 211,727,368 Local and private sponsored programs 49,011,971 50,566,439 Interest and fees on student loans 1,691,083 1,372,112 Departmental activities (net of scholarship allowances of
$2,677,000 in 2005 and $2,737,000 in 2004) 127,118,487 117,094,955 Auxiliary activities (net of room and board allowances of
$7,724,000 in 2005 and $8,211,000 in 2004) 235,324,557 219,335,129 TOTAL OPERATING REVENUES 1,013,015,500 939,327,022
OPERATING EXPENSESInstruction and departmental research 420,424,908 409,984,992 Research 235,980,709 214,528,107 Public services 171,812,259 158,220,805 Academic support 66,404,059 59,490,542 Student services 24,597,372 24,212,212 Scholarships and fellowships 28,814,667 26,631,200 Institutional support 60,919,671 55,941,277 Operation and maintenance of plant 102,358,145 83,188,784 Auxiliary enterprises 207,766,572 190,165,876 Depreciation 64,635,686 67,375,536 Other expenses 3,862,627 4,840,436
TOTAL OPERATING EXPENSES 1,387,576,675 1,294,579,767
Operating loss (374,561,175) (355,252,745)
NONOPERATING REVENUES (EXPENSES)State of Michigan appropriations 355,813,500 341,379,588 Gifts 36,657,827 48,562,320 Net investment income 148,071,543 135,031,446 Interest expense on capital asset related debt (12,903,993) (11,901,234) Other expenses (1,159,718) (1,268,788)
Net nonoperating revenues 526,479,159 511,803,332
INCOME BEFORE OTHER REVENUES 151,917,984 156,550,587
Capital grants and gifts 5,778,879 6,779,982 Additions to permanent endowments 19,301,488 12,076,973
Increase in net assets 176,998,351 175,407,542
Net assets, beginning of year 1,893,279,599 1,717,872,057 NET ASSETS, END OF YEAR 2,070,277,950$ 1,893,279,599$
Year ended June 30,
See accompanying notes21

STATEMENTS OF ACTIVITIES AND CHANGES IN NET ASSETS Michigan State University Foundation
Year ended June 30,2005
Unrestricted Funds
Temporarily Restricted
Permanently Restricted Total
REVENUE, GAINS AND OTHER SUPPORT:Contributions 20,575$ 7,987,688$ 23,829$ 8,032,092$ Equity earnings - subsidiaries 743,676 743,676 Income from investments 10,488,466 61,802 411,540 10,961,808 Royalty income 6,414,963 6,414,963 Realized gain on sale of securities 3,212,249 891,257 135,384 4,238,890 Unrealized gain on securities 21,821,407 473,485 424,474 22,719,366 Net assets released from restrictions:
Satisfaction of program restrictions 74,765 (59,776) (14,989) Current year transfers 10,203,076 (9,797,489) (405,587)
TOTAL REVENUE, GAINS AND OTHER SUPPORT 52,979,177 (443,033) 574,651 53,110,795
EXPENSES:Contributions to the University 24,313,967 24,313,967 Patent expense 943,285 943,285 Investment management fees 1,225,606 1,225,606 Management and general 1,493,587 1,493,587 Postemployment retirement benefits 462,000 462,000 Promotional expenses - Management Company 59,506 59,506
TOTAL EXPENSES 28,497,951 28,497,951 Increase (decrease) in net assets 24,481,226 (443,033) 574,651 24,612,844 Net assets, beginning of year 269,250,992 14,665,032 11,490,925 295,406,949
NET ASSETS, END OF YEAR 293,732,218$ 14,221,999$ 12,065,576$ 320,019,793$
Year ended June 30,2004
Unrestricted Funds
Temporarily Restricted
Permanently Restricted Total
REVENUE, GAINS AND OTHER SUPPORT:Contributions 48,315$ 4,289,851$ 8,628$ 4,346,794$ Equity loss - subsidiaries (446,189) (446,189) Income from investments 5,019,287 (105,610) 284,333 5,198,010 Royalty income 20,763,437 20,763,437 Realized gain (loss) on sale of securities (302,775) 13,878 112,167 (176,730) Unrealized gain on securities 21,887,327 1,265,635 560,223 23,713,185 Net assets released from restrictions:
Satisfaction of program restrictions 42,533 (26,280) (16,253) Current year transfers 3,965,703 (3,528,977) (436,726)
TOTAL REVENUE, GAINS AND OTHER SUPPORT 50,977,638 1,908,497 512,372 53,398,507
EXPENSES:Contributions to the University 18,026,563 18,026,563 Patent expense 943,206 943,206 Investment management fees 979,250 979,250 Unrelated business taxManagement and general 1,039,916 1,039,916 Postemployment retirement benefits 59,000 59,000 Promotional expenses - Management Company 62,677 62,677
TOTAL EXPENSES 21,110,612 21,110,612 Increase in net assets 29,867,026 1,908,497 512,372 32,287,895 Net assets, beginning of year 239,383,966 12,756,535 10,978,553 263,119,054
NET ASSETS, END OF YEAR 269,250,992$ 14,665,032$ 11,490,925$ 295,406,949$
See accompanying notes22

STATEMENTS OF CASH FLOWS Michigan State University
2005 2004Cash flows from operating activities
Tuition and fees 329,643,589$ 309,326,720$ Research grants and contracts 312,448,939 283,609,754 Auxiliary activities 238,054,500 210,704,095 Departmental activities 127,230,506 112,944,556 Interest and fees on student loans 1,691,083 1,372,112 Loans issued to students (87,067,458) (82,134,368) Collection of loans from students 86,039,554 69,504,868 Scholarships and fellowships (32,842,448) (29,870,216) Payments to suppliers (338,765,159) (276,097,470) Payments to employees (920,816,254) (902,724,504) Other payments (34,168,517) (12,508,921)
Net cash used by operating activities (318,551,665) (315,873,374)
Cash flows from noncapital financing activitiesState appropriations 355,485,171 348,275,898 Gifts 40,296,513 39,723,420 Endowment gifts 18,969,545 12,275,737 Federal loan program receipts - 1,043,348 Federal loan program disbursements - (1,043,348) Federal Family Education Loan Program receipts 211,538,994 173,434,916 Federal Family Education Loan Program disbursements (210,256,097) (159,928,880)
Net cash provided by noncapital financing activities 416,034,126 413,781,091
Cash flows from capital and related financing activitiesCapital appropriations 1,127,694 465,272 Capital gifts and grants 8,805,319 11,476,565 Proceeds from issuance of debt and other long term obligations 85,855,000 115,115,000 Purchase of capital assets (141,923,358) (110,897,692) Proceeds from sale of capital assets 627,077 164,953 Principal paid on capital debt (4,273,049) (27,503,935) Interest paid (12,952,337) (9,458,831) Other receipts (payments) 1,934,699 (1,433,741)
Net cash used by capital and related financing activities (60,798,955) (22,072,409)
Cash flows from investing activitiesInvestment income, net 102,531,931 68,446,424 Proceeds from sales and maturities of investments 23,365,639,305 1,737,853,847 Purchase of investments (23,508,160,830) (1,886,053,463)
Net cash used by investing activities (39,989,594) (79,753,192)
Net increase in cash (3,306,088) (3,917,884)
Cash, beginning of year 34,120,203 38,038,087 Cash, end of year 30,814,115$ 34,120,203$
Year ended June 30,
See accompanying notes23
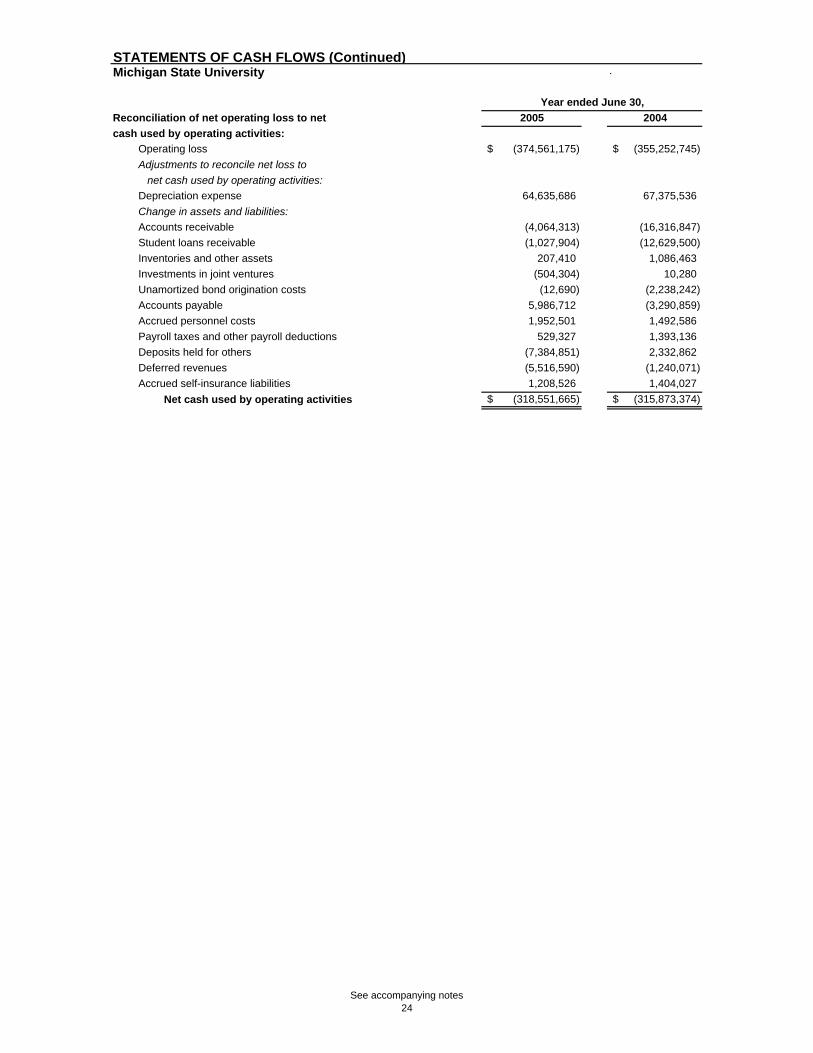
STATEMENTS OF CASH FLOWS (Continued)Michigan State University .
Reconciliation of net operating loss to net 2005 2004cash used by operating activities:
Operating loss (374,561,175)$ (355,252,745)$ Adjustments to reconcile net loss to net cash used by operating activities:Depreciation expense 64,635,686 67,375,536 Change in assets and liabilities:Accounts receivable (4,064,313) (16,316,847) Student loans receivable (1,027,904) (12,629,500) Inventories and other assets 207,410 1,086,463 Investments in joint ventures (504,304) 10,280 Unamortized bond origination costs (12,690) (2,238,242) Accounts payable 5,986,712 (3,290,859) Accrued personnel costs 1,952,501 1,492,586 Payroll taxes and other payroll deductions 529,327 1,393,136 Deposits held for others (7,384,851) 2,332,862 Deferred revenues (5,516,590) (1,240,071) Accrued self-insurance liabilities 1,208,526 1,404,027
Net cash used by operating activities (318,551,665)$ (315,873,374)$
Year ended June 30,
See accompanying notes24

NOTES TO THE FINANCIAL STATEMENTS Michigan State University
25
1. Organization, basis of presentation, reporting entity, and summary of significant accounting policies Organization: Michigan State University (the “University”) was founded in 1855 as the Agricultural College of the State of Michigan. It was the first institution of higher learning in the nation to teach scientific agriculture and in 1863 became a pioneer land grant college under the Morrill Act. The University has grown into a comprehensive research university providing undergraduate, graduate, and professional degree programs. The University is not a component unit of the State of Michigan as defined by the Governmental Accounting Standards Board (GASB). Basis of presentation:
The University follows all applicable GASB pronouncements. In addition, the University applies all applicable Financial Accounting Standards Board (FASB) Statements and Interpretations, Accounting Principles Board (APB) Opinions and Accounting Research Bulletins of the Committee on Accounting Procedures issued on or before November 30, 1989 unless those pronouncements conflict with or contradict GASB pronouncements. The University has elected not to apply FASB pronouncements issued after November 30, 1989. The accompanying financial statements have been prepared using the economic resource measurement focus and the accrual basis of accounting in accordance with accounting principles generally accepted in the United States of America for publicly owned colleges and universities and is presented in accordance with the reporting model as prescribed in Governmental Accounting Standards Board (GASB) Statement No. 34, Basic Financial Statements-and Management’s Discussion and Analysis-for State and Local Governments, and GASB Statement No. 35, Basic Financial Statements-and Management’s Discussion and Analysis-for Public Colleges and Universities, as amended by GASB Statements No. 37 and No. 38. The University follows the “business-type” activities requirements of GASB Statement No. 34. This approach requires the following components of the University’s financial statements:
• Management’s Discussion and Analysis. • Basic Financial Statements: Statement of Net Assets; Statement of Revenues, Expenses, and Changes in Net Assets;
Statement of Cash Flows; and Notes to the Financial Statements. GASB Statement No. 34 establishes standards for external financial reporting for public colleges and universities and requires that resources be classified for accounting and reporting purposes into the following four net asset categories:
• Invested in capital assets, net of related debt: Capital assets, net of accumulated depreciation and outstanding principal balances of debt attributable to the acquisition, construction, or improvement of those assets.
• Restricted:
Nonexpendable – Net assets subject to externally imposed constraints that they be maintained permanently by the University. Such assets include the University’s permanent endowment funds.
Expendable – Net assets whose use by the University is subject to externally imposed constraints that can be
fulfilled by actions of the University pursuant to those constraints or that expire by the passage of time.
• Unrestricted: Net assets that are not subject to externally imposed constraints. Unrestricted net assets may be designated for specific purposes by action of management or the Board of Trustees (the “Board”) or may otherwise be limited by contractual agreements with outside parties. Substantially all unrestricted net assets are designated for academic, research, and outreach programs and initiatives, postemployment benefits, and capital asset renewals and replacements.
Reporting entity: The Michigan State University Foundation (the “Foundation”) is a legally separate, tax-exempt entity which meets the criteria set forth for component units under GASB Statement No. 39, Determining Whether Certain Organizations are Component Units. The Foundation provides financial support for the objectives, purposes, and programs of the University. Although the University does not control the timing, purpose, or amount of receipts from the Foundation, the resources (and income thereon) which the Foundation holds and invests are dedicated to benefit the University. Because the resources held by the Foundation can only be used by, or for the benefit of, the University, the Foundation is considered a component unit of the University and its Statements of Financial Position and Statements of Activities and Changes in Net Assets are discretely presented in the University’s financial statements. In addition, the Foundation’s significant notes are summarized in Footnote 4. The Foundation is a private organization that reports under FASB standards, including FASB Statement No. 117, Financial Reporting for Not-for-Profit Organizations. As such, certain revenue recognition criteria and presentation features are different from those under GASB. No modifications have been made to the Foundation’s financial information in the University’s financial reporting entity for these differences.
NOTES TO THE FINANCIAL STATEMENTS (Continued) Michigan State University
26
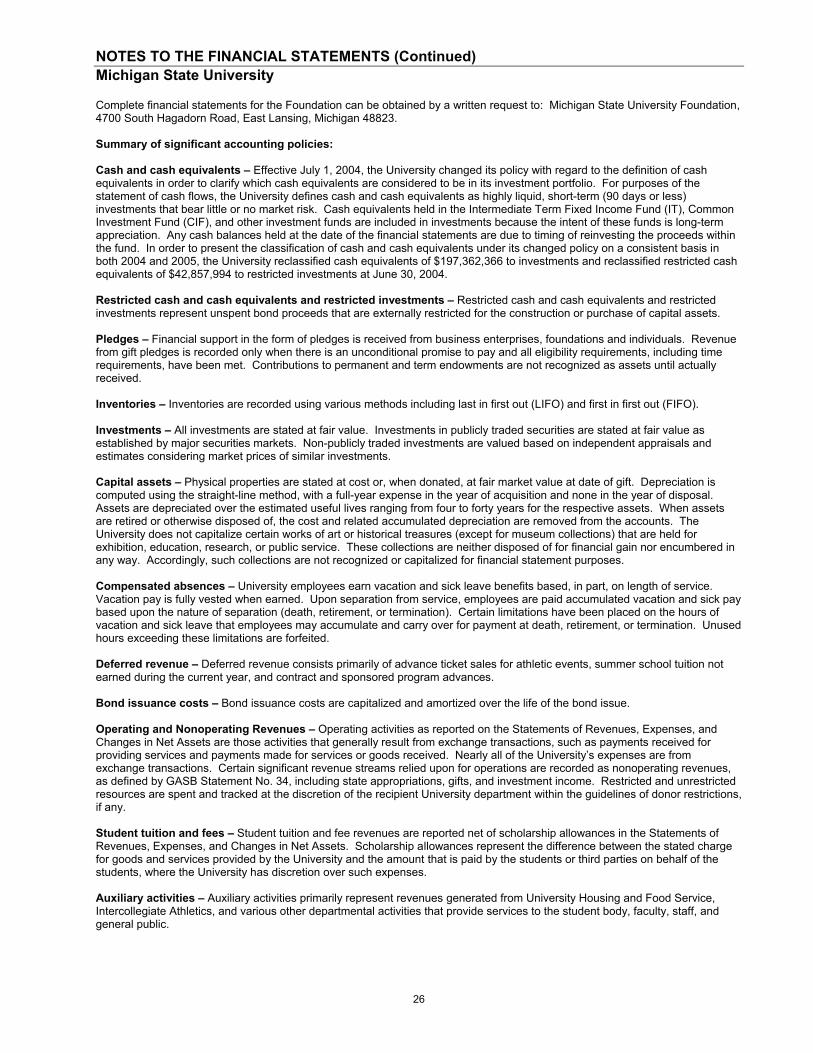
Complete financial statements for the Foundation can be obtained by a written request to: Michigan State University Foundation, 4700 South Hagadorn Road, East Lansing, Michigan 48823. Summary of significant accounting policies: Cash and cash equivalents – Effective July 1, 2004, the University changed its policy with regard to the definition of cash equivalents in order to clarify which cash equivalents are considered to be in its investment portfolio. For purposes of the statement of cash flows, the University defines cash and cash equivalents as highly liquid, short-term (90 days or less) investments that bear little or no market risk. Cash equivalents held in the Intermediate Term Fixed Income Fund (IT), Common Investment Fund (CIF), and other investment funds are included in investments because the intent of these funds is long-term appreciation. Any cash balances held at the date of the financial statements are due to timing of reinvesting the proceeds within the fund. In order to present the classification of cash and cash equivalents under its changed policy on a consistent basis in both 2004 and 2005, the University reclassified cash equivalents of $197,362,366 to investments and reclassified restricted cash equivalents of $42,857,994 to restricted investments at June 30, 2004. Restricted cash and cash equivalents and restricted investments – Restricted cash and cash equivalents and restricted investments represent unspent bond proceeds that are externally restricted for the construction or purchase of capital assets. Pledges – Financial support in the form of pledges is received from business enterprises, foundations and individuals. Revenue from gift pledges is recorded only when there is an unconditional promise to pay and all eligibility requirements, including time requirements, have been met. Contributions to permanent and term endowments are not recognized as assets until actually received. Inventories – Inventories are recorded using various methods including last in first out (LIFO) and first in first out (FIFO). Investments – All investments are stated at fair value. Investments in publicly traded securities are stated at fair value as established by major securities markets. Non-publicly traded investments are valued based on independent appraisals and estimates considering market prices of similar investments. Capital assets – Physical properties are stated at cost or, when donated, at fair market value at date of gift. Depreciation is computed using the straight-line method, with a full-year expense in the year of acquisition and none in the year of disposal. Assets are depreciated over the estimated useful lives ranging from four to forty years for the respective assets. When assets are retired or otherwise disposed of, the cost and related accumulated depreciation are removed from the accounts. The University does not capitalize certain works of art or historical treasures (except for museum collections) that are held for exhibition, education, research, or public service. These collections are neither disposed of for financial gain nor encumbered in any way. Accordingly, such collections are not recognized or capitalized for financial statement purposes. Compensated absences – University employees earn vacation and sick leave benefits based, in part, on length of service. Vacation pay is fully vested when earned. Upon separation from service, employees are paid accumulated vacation and sick pay based upon the nature of separation (death, retirement, or termination). Certain limitations have been placed on the hours of vacation and sick leave that employees may accumulate and carry over for payment at death, retirement, or termination. Unused hours exceeding these limitations are forfeited. Deferred revenue – Deferred revenue consists primarily of advance ticket sales for athletic events, summer school tuition not earned during the current year, and contract and sponsored program advances. Bond issuance costs – Bond issuance costs are capitalized and amortized over the life of the bond issue. Operating and Nonoperating Revenues – Operating activities as reported on the Statements of Revenues, Expenses, and Changes in Net Assets are those activities that generally result from exchange transactions, such as payments received for providing services and payments made for services or goods received. Nearly all of the University’s expenses are from exchange transactions. Certain significant revenue streams relied upon for operations are recorded as nonoperating revenues, as defined by GASB Statement No. 34, including state appropriations, gifts, and investment income. Restricted and unrestricted resources are spent and tracked at the discretion of the recipient University department within the guidelines of donor restrictions, if any. Student tuition and fees – Student tuition and fee revenues are reported net of scholarship allowances in the Statements of Revenues, Expenses, and Changes in Net Assets. Scholarship allowances represent the difference between the stated charge for goods and services provided by the University and the amount that is paid by the students or third parties on behalf of the students, where the University has discretion over such expenses. Auxiliary activities – Auxiliary activities primarily represent revenues generated from University Housing and Food Service, Intercollegiate Athletics, and various other departmental activities that provide services to the student body, faculty, staff, and general public.

NOTES TO THE FINANCIAL STATEMENTS (Continued) Michigan State University
27
Donor restricted endowments – For donor restricted endowments, the Uniform Management of Institutional Funds Act, as adopted in Michigan, permits the Board to appropriate an amount of realized and unrealized endowment appreciation as the Board determines to be prudent. Endowment realized and unrealized appreciation is reported consistent with the net asset categorization of the related endowment net of spending policy distributions. The Board chooses to spend only a portion of the investment income (including changes in the value of investments) each year. Under the spending policy established by the Board, 5.75 percent of the average market value of endowment investments for the twenty quarters of the five calendar years prior to the beginning of the fiscal year has been authorized for expenditure. Eliminations – In preparing the financial statements, the University eliminates inter-fund assets and liabilities that would otherwise be reflected twice in the Statements of Net Assets. Similarly, revenues and expenses related to internal service activities are also eliminated from the Statement of Revenues, Expenses, and Changes in Net Assets. Student tuition and residence fees are presented net of scholarships and fellowships applied to student accounts where the University has discretion over such expenses, while stipends and other payments made directly to students are presented as scholarship and fellowship expenses. Use of estimates – The preparation of the financial statements in conformity with accounting principles generally accepted in the United States of America requires management to make estimates and assumptions that affect amounts reported in the financial statements and the accompanying notes. Actual results could differ from those estimates. Income taxes – The University is a part of the State of Michigan for purposes of Internal Revenue Code Section 115 and is an organization as described in Internal Revenue Code Section 501(c)(3). The University’s income generally is exempt from federal income taxes, although income from certain activities may be subject to taxation as unrelated business income. Reclassifications – Certain amounts from the prior year have been reclassified to conform to the current year’s presentation. 2. Cash and cash equivalents The University’s cash and cash equivalents as of June 30, 2005 and 2004 were as follows:
2005 2004Cash and cash equivalents, current 14,240,530$ 16,643,810$ Restricted cash and cash equivalents, noncurrent 16,573,585 17,476,393 Total cash and cash equivalents 30,814,115$ 34,120,203$
Of the bank balances for cash, $100,000 of the total $4,889,000 in 2005 and $100,000 of the total $808,000 in 2004 were covered by federal depository insurance. The remaining amounts were uninsured and uncollateralized, as banks holding deposits of the University are legally prohibited from collateralizing these deposits.

NOTES TO THE FINANCIAL STATEMENTS (Continued) Michigan State University
28
3. Investments The University manages investments in accordance with policy approved by the Board of Trustees. The investment policy distinguishes guidelines for the Liquidity Pool (LP), Intermediate Term Fixed Income Fund (IT), and Common Investment Fund (CIF). In addition, the University has other investments that are restricted by external agreements or by special donor limitations (Other). Securities Lending Transactions: The Board of Trustees authorized participation in a securities lending program whereby University securities are contractually loaned to approved borrowers against a pledge of collateral which is invested. The University had loaned securities with a market value of approximately $178,400,000 at June 30, 2005. One of the University’s custodians is an agent in lending the University’s domestic securities for cash collateral of 102 percent and international securities for cash collateral of 105 percent. At June 30, 2005, the University has no credit risk exposure to borrowers because the amounts the University owes the borrowers exceed the amounts the borrowers owe the University. The contract with the lending agent requires it to indemnify the University if the borrowers fail to return the securities (and if the collateral is inadequate to replace the securities lent). All securities loans can be terminated on demand by either the University or the borrower. As a means of managing the University’s interest rate risk, the securities lending agreement limits the difference between the average weighted maturity of securities loans and the average weighted maturity of the cash collateral investment portfolio to a maximum of 90 days. At June 30, 2005, the difference was less than 90 days. As of June 30, 2005, the University had the following investments:
Investment type LP IT CIFSecurities Lending Other Total
Repurchase agreements -$ -$ -$ 105,289$ -$ 105,289$ External investment pools 3,192 196,058 606,382 - 22,337 827,969 U.S. Treasury bonds 53,811 - 29,826 - 67 83,704 U.S. Government agencies 43,952 - 39,520 10,000 - 93,472 Corporate bonds 44,942 - 29,598 67,600 279 142,419 Asset-backed securities 97,271 - 67,063 - 85 164,419 Domestic common stock - - 198,110 - 4,460 202,570 Domestic convertible preferred stock - - 650 - - 650 International equities - - 16,100 - - 16,100 Total 243,168$ 196,058$ 987,249$ 182,889$ 27,228$ 1,636,592$
June 30, 2005 (in thousands)
Interest Rate Risk: As a means of managing its exposure to fair value losses arising from increasing interest rates, University investment policy limits the average duration of the LP portfolio to three years and the IT and CIF portfolios to six years. At June 30, 2005, the University is in compliance with its investment policy with regard to average duration. University policy does not address average duration of investments by investment type.

NOTES TO THE FINANCIAL STATEMENTS (Continued) Michigan State University
29
The maturities of fixed income investments as of June 30, 2005 are as follows:
Investment typeLess than 1
year 1-5 years 6-10 yearsMore than 10
years TotalRepurchase agreements 105,289$ -$ -$ -$ 105,289$ External investment pools 3,653 58 197,227 1,674 202,612 U.S. Treasury bonds - 65,929 7,696 10,079 83,704 U.S. Government agencies 16,783 19,343 11,058 46,288 93,472 Corporate bonds 51,142 68,397 14,236 8,644 142,419 Asset-backed securities - 74,665 9,042 80,712 164,419 Total 176,867$ 228,392$ 239,259$ 147,397$ 791,915$
June 30, 2005Fixed Income Investment Maturities (in thousands)
The University invests in asset-backed securities such as mortgage pass-through securities issued by U.S. Government agencies. These securities are based on cash flows from interest payments on underlying mortgages. Therefore, they are sensitive to prepayments by mortgagees, which may result from a decline in interest rates. Credit Risk: As a means of managing credit risk, University investment policy limits fixed income investments at time of purchase to the following ratings issued by nationally recognized statistical rating organizations: LP portfolio – short-term A1/P1, long-term BBB; IT portfolio – short-term A2/P2, long-term B; CIF portfolio – short-term A2/P2, long-term BB. Thereafter, the minimum quality for all three portfolios is limited to AA. At June 30, 2005, the University is in compliance with its credit risk policy for each portfolio. University policy does not address credit risk by investment type. The Standard & Poor’s credit ratings for fixed income investments at June 30, 2005 are as follows:
RatingRepurchase Agreements
External investment
poolsU.S. Treasury
bonds
U.S. Government
agenciesCorporate
bondsAsset-backed
securities TotalAAA -$ -$ -$ 25,613$ 30,579$ 73,822$ 130,014$ AAA 34,067 - - - 29,693 - 63,760 AAA 71,222 - - - 55,188 - 126,410 BBB - - - - 23,145 1,633 24,778 BB - - - - 2,289 766 3,055 Below BB - - - - - - - Not rated - 202,612 83,704 67,859 1,525 88,198 443,898 Total 105,289$ 202,612$ 83,704$ 93,472$ 142,419$ 164,419$ 791,915$
As of June 30,2005 (in thousands)
Concentration of Credit Risk: As a means of managing the concentration of credit risk, University investment policy limits the concentration of investments as follows: LP portfolio – No more than 15 percent of the portfolio’s market value may be invested in dollar denominated foreign securities of developed countries (i.e., no emerging markets). No more than 10 percent of the portfolio's market value will be invested in (1) Rule 144A securities or (2) securities of any single issuer, except those which are obligations of, or fully guaranteed as to both principal and interest by, the U.S. Government or its agencies. IT portfolio – No more than 10 percent of the portfolio’s market value may be invested in securities below BBB. No more than 30 percent of the portfolio’s market value may be invested in securities denominated in foreign currencies. No more than 10 percent of the portfolio's market value will be invested in securities of any single issuer, except those which are obligations of, or fully guaranteed as to both principal and interest by, the U.S. Government or its agencies. CIF portfolio – Investments are managed in accordance with asset allocation guidelines and manager guidelines at time of manager appointment. As of June 30, 2005, not more than 5 percent of the University’s total investments were invested in any one security.
NOTES TO THE FINANCIAL STATEMENTS (Continued) Michigan State University
30
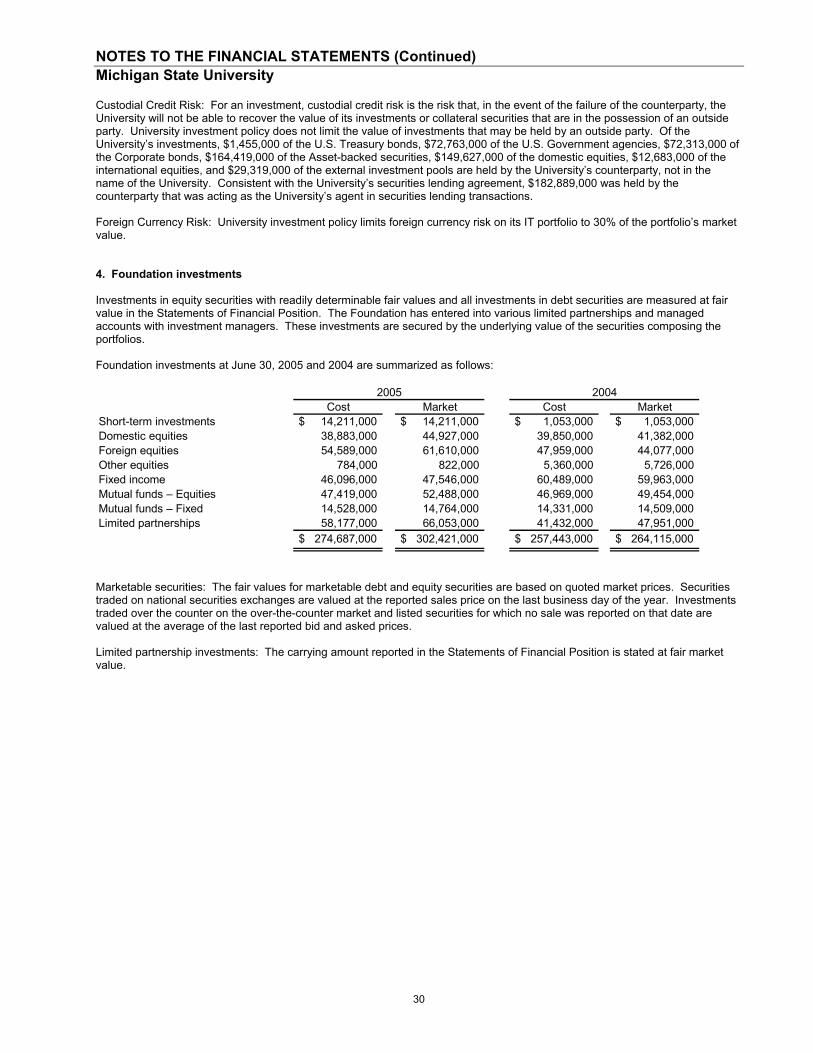
Custodial Credit Risk: For an investment, custodial credit risk is the risk that, in the event of the failure of the counterparty, the University will not be able to recover the value of its investments or collateral securities that are in the possession of an outside party. University investment policy does not limit the value of investments that may be held by an outside party. Of the University’s investments, $1,455,000 of the U.S. Treasury bonds, $72,763,000 of the U.S. Government agencies, $72,313,000 of the Corporate bonds, $164,419,000 of the Asset-backed securities, $149,627,000 of the domestic equities, $12,683,000 of the international equities, and $29,319,000 of the external investment pools are held by the University’s counterparty, not in the name of the University. Consistent with the University’s securities lending agreement, $182,889,000 was held by the counterparty that was acting as the University’s agent in securities lending transactions. Foreign Currency Risk: University investment policy limits foreign currency risk on its IT portfolio to 30% of the portfolio’s market value. 4. Foundation investments Investments in equity securities with readily determinable fair values and all investments in debt securities are measured at fair value in the Statements of Financial Position. The Foundation has entered into various limited partnerships and managed accounts with investment managers. These investments are secured by the underlying value of the securities composing the portfolios. Foundation investments at June 30, 2005 and 2004 are summarized as follows:
Cost Market Cost MarketShort-term investments $ 14,211,000 $ 14,211,000 $ 1,053,000 $ 1,053,000 Domestic equities 38,883,000 44,927,000 39,850,000 41,382,000 Foreign equities 54,589,000 61,610,000 47,959,000 44,077,000 Other equities 784,000 822,000 5,360,000 5,726,000 Fixed income 46,096,000 47,546,000 60,489,000 59,963,000 Mutual funds – Equities 47,419,000 52,488,000 46,969,000 49,454,000 Mutual funds – Fixed 14,528,000 14,764,000 14,331,000 14,509,000 Limited partnerships 58,177,000 66,053,000 41,432,000 47,951,000
$ 274,687,000 $ 302,421,000 $ 257,443,000 $ 264,115,000
2005 2004
Marketable securities: The fair values for marketable debt and equity securities are based on quoted market prices. Securities traded on national securities exchanges are valued at the reported sales price on the last business day of the year. Investments traded over the counter on the over-the-counter market and listed securities for which no sale was reported on that date are valued at the average of the last reported bid and asked prices. Limited partnership investments: The carrying amount reported in the Statements of Financial Position is stated at fair market value.
NOTES TO THE FINANCIAL STATEMENTS (Continued) Michigan State University
31
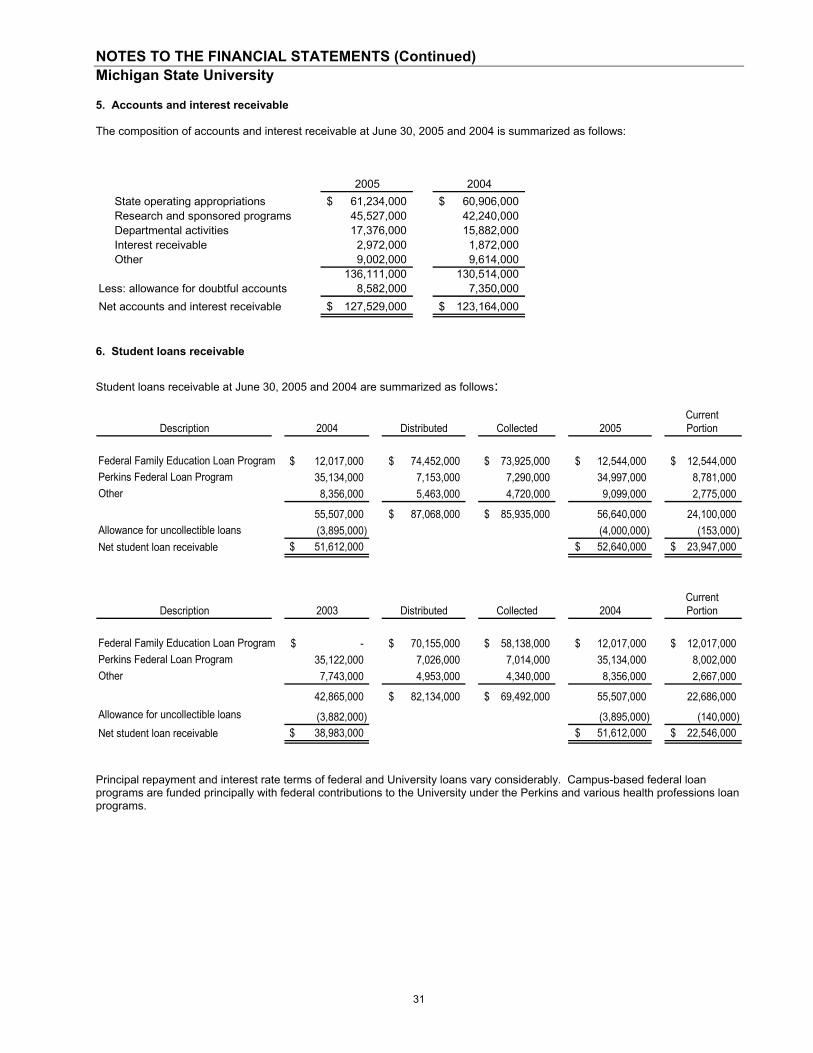
5. Accounts and interest receivable The composition of accounts and interest receivable at June 30, 2005 and 2004 is summarized as follows:
2005 2004 State operating appropriations 61,234,000$ 60,906,000$ Research and sponsored programs 45,527,000 42,240,000 Departmental activities 17,376,000 15,882,000 Interest receivable 2,972,000 1,872,000 Other 9,002,000 9,614,000
136,111,000 130,514,000 Less: allowance for doubtful accounts 8,582,000 7,350,000 Net accounts and interest receivable 127,529,000$ 123,164,000$
6. Student loans receivable Student loans receivable at June 30, 2005 and 2004 are summarized as follows:
Current Description 2004 Distributed Collected 2005 Portion
Federal Family Education Loan Program 12,017,000$ 74,452,000$ 73,925,000$ 12,544,000$ 12,544,000$ Perkins Federal Loan Program 35,134,000 7,153,000 7,290,000 34,997,000 8,781,000 Other 8,356,000 5,463,000 4,720,000 9,099,000 2,775,000
55,507,000 87,068,000$ 85,935,000$ 56,640,000 24,100,000 Allowance for uncollectible loans (3,895,000) (4,000,000) (153,000) Net student loan receivable 51,612,000$ 52,640,000$ 23,947,000$
Current Description 2003 Distributed Collected 2004 Portion
Federal Family Education Loan Program -$ 70,155,000$ 58,138,000$ 12,017,000$ 12,017,000$ Perkins Federal Loan Program 35,122,000 7,026,000 7,014,000 35,134,000 8,002,000 Other 7,743,000 4,953,000 4,340,000 8,356,000 2,667,000
42,865,000 82,134,000$ 69,492,000$ 55,507,000 22,686,000 Allowance for uncollectible loans (3,882,000) (3,895,000) (140,000) Net student loan receivable 38,983,000$ 51,612,000$ 22,546,000$
Principal repayment and interest rate terms of federal and University loans vary considerably. Campus-based federal loan programs are funded principally with federal contributions to the University under the Perkins and various health professions loan programs.
NOTES TO THE FINANCIAL STATEMENTS (Continued) Michigan State University
32
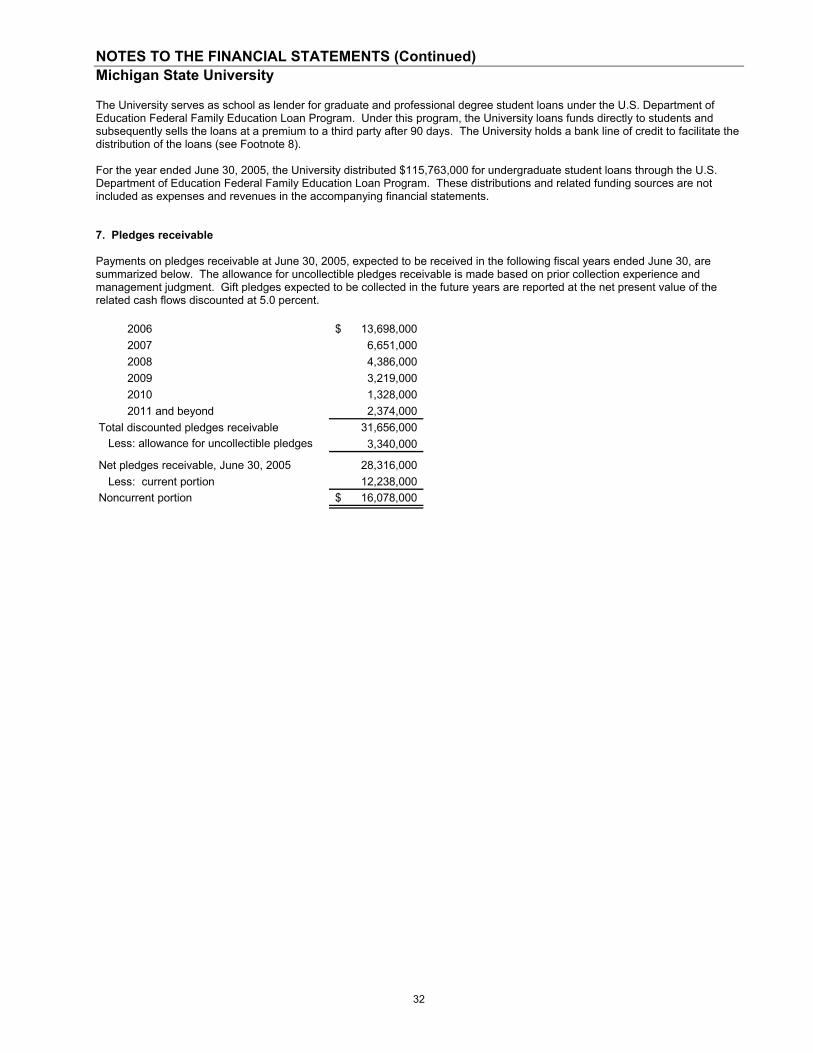
The University serves as school as lender for graduate and professional degree student loans under the U.S. Department of Education Federal Family Education Loan Program. Under this program, the University loans funds directly to students and subsequently sells the loans at a premium to a third party after 90 days. The University holds a bank line of credit to facilitate the distribution of the loans (see Footnote 8). For the year ended June 30, 2005, the University distributed $115,763,000 for undergraduate student loans through the U.S. Department of Education Federal Family Education Loan Program. These distributions and related funding sources are not included as expenses and revenues in the accompanying financial statements. 7. Pledges receivable Payments on pledges receivable at June 30, 2005, expected to be received in the following fiscal years ended June 30, are summarized below. The allowance for uncollectible pledges receivable is made based on prior collection experience and management judgment. Gift pledges expected to be collected in the future years are reported at the net present value of the related cash flows discounted at 5.0 percent. 2006 13,698,000$ 2007 6,651,000 2008 4,386,000 2009 3,219,000 2010 1,328,000 2011 and beyond 2,374,000 Total discounted pledges receivable 31,656,000 Less: allowance for uncollectible pledges 3,340,000
Net pledges receivable, June 30, 2005 28,316,000 Less: current portion 12,238,000 Noncurrent portion 16,078,000$

NOTES TO THE FINANCIAL STATEMENTS (Continued) Michigan State University
33
8. Long term debt and other obligations Long term debt and other obligations for the years ended June 30, 2005 and 2004 are summarized as follows:
Current 2004 Borrowed Retired 2005 Portion
General Revenue Bonds: Series 2005 -$ 84,580,000$ -$ 84,580,000$ -$ Series 2003A 80,570,000 80,570,000 1,735,000 Series 2003B 23,695,000 - 155,000 23,540,000 160,000 Series 2003C 10,850,000 - - 10,850,000 180,000 Series 2002A 53,780,000 - - 53,780,000 2,135,000 Series 2002B 11,480,000 - - 11,480,000 1,075,000 Series 2000A-2 48,835,000 - - 48,835,000 - Series 2000A-1 57,115,000 - 1,000,000 56,115,000 260,000 Series 1998A-2 51,935,000 - - 51,935,000 - Series 1998A-1 11,655,000 - 2,130,000 9,525,000 2,220,000 Series 1996A 1,220,000 - 595,000 625,000 625,000
351,135,000 84,580,000 3,880,000 431,835,000 8,390,000 Federal student loan deposits 33,608,000 1,107,000 232,000 34,483,000 - Short term line of credit 13,506,000 94,669,000 94,261,000 13,914,000 13,914,000 Lease Obligations 2,909,000 1,275,000 393,000 3,791,000 98,000
401,158,000$ 181,631,000$ 98,766,000$ 484,023,000$ 22,402,000$
Current 2003 Borrowed Retired 2004 Portion
General Revenue Bonds: Series 2003A -$ 80,570,000$ -$ 80,570,000 -$ Series 2003B - 23,695,000 - 23,695,000 155,000 Series 2003C - 10,850,000 - 10,850,000 - Series 2002A 53,780,000 - - 53,780,000 - Series 2002B 11,480,000 - - 11,480,000 - Series 2000A-2 48,835,000 - - 48,835,000 - Series 2000A-1 59,515,000 - 2,400,000 57,115,000 - Series 1998A-2 51,935,000 - - 51,935,000 - Series 1998A-1 13,685,000 - 2,030,000 11,655,000 2,130,000 Series 1996A 23,930,000 - 22,710,000 1,220,000 595,000
263,160,000 115,115,000 27,140,000 351,135,000 2,880,000 Federal student loan deposits 33,445,000 523,000 360,000 33,608,000 - Short term line of credit - 64,793,000 51,287,000 13,506,000 13,506,000 Lease Obligations 3,436,000 - 527,000 2,909,000 393,000
300,041,000$ 180,431,000$ 79,314,000$ 401,158,000$ 16,779,000$
All bonds are secured by General Revenues and certain issues bear interest based on a weekly rate determined by the remarketing agent and are amortized through mandatory redemptions as follows:
• Series 2005: from fiscal 2008 through 2034 • Series 2003A, Series 2003C, Series 2002A: from fiscal 2006 through 2033 • Series 2003B: from fiscal 2005 through 2026 • Series 2002B: from fiscal 2006 through 2023 • Series 2000A-2: from fiscal 2007 through 2031 • Series 2000A-1: from fiscal 2006 through 2031 • Series 1998A-2: from fiscal 2010 through 2023

NOTES TO THE FINANCIAL STATEMENTS (Continued) Michigan State University
34
The foregoing bonds may be converted to a permanent fixed rate provided certain conditions are met. The Series 1998A-1 bonds bear interest at rates varying from 4.25 percent to 5.00 percent and mature serially through fiscal 2009. The Series 1996A bonds bear interest at rates varying from 4.55 percent to 4.65 percent and mature serially through fiscal 2006. Interest expense was $12,904,000 and $11,901,000 (net of capitalized interest of $911,000) for 2005 and 2004, respectively. Swap payments and associated debt: Using rates as of June 30, 2005, scheduled fiscal year maturities of bonds payable and related interest expense are as follows. As rates vary, variable-rate interest payments and net swap payments will vary (see Footnote 17):
Fiscal Year Interest RateEnding June 30, Principal Interest Principal Interest Swaps, Net Total
2006 2,845,000$ 428,000$ 5,545,000$ 8,517,000$ 8,730,000$ 26,065,000$ 2007 2,320,000 300,000 7,535,000 9,504,000 9,898,000 29,557,000 2008 2,430,000 188,000 9,725,000 9,295,000 9,742,000 31,380,000 2009 2,555,000 64,000 10,050,000 9,058,000 9,525,000 31,252,000 2010 - - 13,085,000 8,782,000 9,265,000 31,132,000 2011-2015 - - 61,560,000 39,673,000 42,105,000 143,338,000 2016-2020 - - 74,735,000 31,796,000 34,163,000 140,694,000 2021-2025 - - 88,450,000 22,262,000 24,401,000 135,113,000 2026-2030 - - 95,255,000 11,659,000 13,234,000 120,148,000 2030-2034 - - 55,745,000 2,077,000 2,802,000 60,624,000
Total 10,150,000$ 980,000$ 421,685,000$ 152,623,000$ 163,865,000$ 749,303,000$
Fixed-Rate Bonds Variable-Rate Bonds
Federal student loan deposits represent funds from the federal government related to various federal student loan programs. At June 30, 2005, the University owed $13,914,000 on a short term $75,000,000 line of credit related to the University’s distribution of graduate and professional degree student loans under the Federal Family Education Loan Program (see Footnote 6). Principal amounts outstanding under this line of credit bear interest equal to sixty basis points over a thirty day trailing average of the one-month London Interbank Offering Rate (LIBOR), and accrued interest is payable monthly. Payment terms of the principal balance outstanding at June 30, 2005 vary, but do not exceed six months. Accrued personnel costs include vacation and sick leave days earned but unused, including the University’s share of payroll taxes, valued at the current rate of pay. Changes in the balances of accrued personnel costs during 2005 and 2004 were as follows:
2005 2004Balance, beginning of year $ 65,050,000 $ 63,557,000 Additions 4,149,000 3,157,000 Reductions (2,197,000) (1,664,000)Balance, end of year 67,002,000 65,050,000 Less: current portion 49,461,000 47,681,000 Noncurrent portion $ 17,541,000 $ 17,369,000
NOTES TO THE FINANCIAL STATEMENTS (Continued) Michigan State University
35
9. Retirement benefits The University has a defined contribution base retirement plan administered through the TIAA-CREF, Fidelity Investments, and The Vanguard Group for all qualified employees. All regular employees are eligible to participate based on the service requirements specific to their employee group. Participants maintain individual contracts with the base retirement vendors and are fully vested. Participating employees contribute 5.0 percent of their base salary or wages and the University contributes 10.0 percent of the employee’s base salary or wages subject to applicable Internal Revenue Service limits. Participants may elect to contribute additional amounts to a supplemental plan and/or a deferred compensation plan, within specified limits, which are not matched by University contributions. Plan provisions and contribution requirements of plan members and the University are established and may be amended by the Board in accordance with University policies, union contracts, or plan provisions. Contributions under the base plan, excluding the participants’ supplemental contributions, for the years ended June 30, 2005 and 2004 were as follows:
2005 2004
University contributions 51,841,000$ 50,892,000$
Employee contributions 25,921,000 25,446,000 In addition, the University has a single-employer, defined benefit plan covering approximately 1,000 employees hired prior to January 1, 1973. The plan is closed to new entrants and monies have been internally reserved by the University to fully fund program costs. The benefits are based on the employee’s compensation during the last three years of employment and/or years of service. There were no required annual contributions and no pension costs for each of the three preceding years ended June 30, 2005. 10. Other post employment benefits In addition to providing retirement benefits, the University contributes monthly health care and dental premiums for retired employees. Substantially all of the University’s employees may become eligible for those benefits if they meet normal retirement requirements while still working for the University. The number of eligible retirees was approximately 3,800 in 2005 and 2004. The University recognizes the cost of providing those benefits on a pay-as-you-go basis. Those costs totaled $23,243,000 for 2005 and $20,004,000 for 2004 and are included in operating expenses in the Statements of Revenues, Expenses, and Changes in Net Assets (see Footnote 18). 11. Grants and contracts The University receives grants and contracts from certain federal, state, and local agencies to fund research and other activities. Revenues from government grants and contracts are recognized when all eligibility requirements have been met. The University records indirect costs related to such grants and contracts at predetermined rates that are negotiated with the University’s federal cognizant agency. Both direct and indirect costs charged to the grants or contracts are subject to audit and approval by the granting agencies. University management believes adjustments of costs, if any, resulting from such examination by the granting agency would be insignificant. 12. Commitments At June 30, 2005, the University had initiated plans and incurred certain contractual commitments related to the construction or capital improvement of various facilities. The costs to complete the projects are estimated to be $79,261,000 and are to be funded from state and State Building Authority (SBA) appropriations, private gifts, debt proceeds, or other University funds. Certain University facilities have been, or are scheduled to be, financed in whole or in part by SBA bond issues secured by a pledge of rentals to be received from the State of Michigan pursuant to lease agreements between the SBA, the State of Michigan, and the University. During the lease terms, the SBA will hold title to the respective buildings, the State of Michigan will make all lease payments to the SBA, and the University will pay all operating and maintenance costs. The SBA will be obligated to sell each building to the University for one dollar, after full payment of all rentals due under the related lease. At June 30, 2005, the University had entered into various limited partnerships with investment managers of oil and gas, real estate, venture capital, private equity, and restructuring funds. As of June 30, 2005, $72,316,000 of the initial $138,050,000 investment commitment remains outstanding.
NOTES TO THE FINANCIAL STATEMENTS (Continued) Michigan State University
36
13. Contingencies and risk management The University is exposed to various risks of loss related to torts; theft of, damage to, and destruction of assets; errors and omissions; and natural disasters. To manage these risks, the University uses commercial insurance with various self-insured retentions. Self-insured amounts are computed based on historical claim experience. The University’s liability for various medical professional liability claims is funded based on actuarial valuations. The University carries excess commercial medical professional liability insurance to manage the liability. The liability is reported at its present value of $5,411,000 as of June 30, 2005. The discount rate used was 5.0 percent. The University is also self-insured for various employee benefits which include health care and dental insurance, workers compensation, and unemployment compensation. Claims expenditures and liabilities are reported when it is probable that a loss has occurred and the amount of the loss can be reasonably estimated. Those losses include an estimate of claims that have been incurred but not reported. The workers compensation liability, which will be settled by fixed payments over an extended period of time, is reported at its present value of $3,281,000 as of June 30, 2005. The discount rate used was 6.0 percent. Changes in the total reported general, professional, and self-insured employee benefit liabilities during 2005, 2004, and 2003 were as follows:
2005 2004 2003
Balance, beginning of year 18,758,000$ 17,354,000$ 15,779,000$ Claims incurred and changes in estimates 76,859,000
Claim payments (89,224,000) (81,315,000) (75,284,000)
Balance, end of year 19,967,000 18,758,000 17,354,000
Less: current portion 13,455,000 12,005,000 11,353,000
Noncurrent portion 6,512,000$ 6,753,000$ 6,001,000$
90,433,000 82,719,000
For those risks that the University has purchased commercial insurance, settled claims have not exceeded the commercial coverage in any of the past three years. In the normal course of its activities, the University has been a party in various legal actions. Historically, the University has not experienced significant losses from such actions. After taking into consideration legal counsel’s evaluation of pending actions, the University is of the opinion that the outcome thereof will not have a material effect on the financial statements. 14. Investments in joint ventures The University is a member of several incorporated not for profit joint ventures, most of which are accounted for under the equity method. The University and Sparrow Health System are members of Mid-Michigan MRI, Inc., which provides high technology cross-sectional diagnostic imaging services. University Rehabilitation Alliance, Inc. has the University and Peckham Vocational Industries of Lansing as members and is an enterprise for the treatment of persons with brain injury. The Great Lakes Cancer Institute is a corporation formed with McLaren Health Care Corporation to bring cancer care and research opportunities to community-based cancer centers and physicians. The University is a 50 percent member in each of the foregoing not for profit corporations. Additionally, the University is a 33 percent member in Radiation Oncology Alliance, a not for profit corporation formed with Michigan Affiliated Healthcare System, Inc. and the University of Michigan to provide radiation oncology services. Copies of financial statements for these entities can be obtained by a written request to: Office of the Controller, Michigan State University, Room 305 John A. Hannah Administration Building, East Lansing, Michigan 48824-1046.

NOTES TO THE FINANCIAL STATEMENTS (Continued) Michigan State University
37
15. Capital assets and collections Capital asset and collection activity for the years ended June 30, 2005 and 2004 follows:
Additions 2004 (Deductions) Disposals 2005
Non-depreciated capital assets: Land 19,517,000$ -$ -$ 19,517,000$ Construction in progress 85,939,000 52,425,000 - 138,364,000 Collections 5,138,000 266,000 - 5,404,000
110,594,000 52,691,000 - 163,285,000
Depreciated capital assets: Buildings and site improvements 1,349,994,000 82,051,000 (5,000) 1,432,040,000 Equipment and other 430,164,000 17,361,000 (12,787,000) 434,738,000 Less: accumulated depreciation Buildings and site improvements (573,888,000) (38,274,000) 5,000 (612,157,000) Equipment and other (320,128,000) (26,362,000) 9,065,000 (337,425,000)
886,142,000 34,776,000 (3,722,000) 917,196,000 Total capital assets 996,736,000$ 87,467,000$ (3,722,000)$ 1,080,481,000$
Additions 2003 (Deductions) Disposals 2004
Non-depreciated capital assets: Land 19,217,000$ 300,000$ -$ 19,517,000$ Construction in progress 26,014,000 59,925,000 - 85,939,000 Collections 4,677,000 461,000 - 5,138,000
49,908,000 60,686,000 - 110,594,000
Depreciated capital assets: Building and site improvements 1,333,445,000 16,549,000 - 1,349,994,000 Equipment and other 420,636,000 38,025,000 (28,497,000) 430,164,000 Less: accumulated depreciation Buildings and site improvements (539,994,000) (33,894,000) - (573,888,000) Equipment and other (312,481,000) (33,481,000) 25,834,000 (320,128,000) 901,606,000 (12,801,000) (2,663,000) 886,142,000 Total capital assets 951,514,000$ 47,885,000$ (2,663,000)$ 996,736,000$
NOTES TO THE FINANCIAL STATEMENTS (Continued) Michigan State University
38
16. Net assets Restricted and unrestricted net assets for the years ended June 30, 2005 and 2004 follows:
2005 2004Restricted - nonexpendable: Permanent endowments 332,555,000$ 284,917,000$
Restricted - expendable: Gifts, endowment income and sponsored programs 170,319,000$ 148,927,000$ Quasi and term endowments 125,446,000 112,088,000 Capital projects 16,124,000 22,946,000 Student loans 7,466,000 7,213,000 Total 319,355,000$ 291,174,000$
Unrestricted: Designated 706,911,000$ 616,547,000$ Uncommitted 687,000 (3,863,000) Total 707,598,000$ 612,684,000$
Restricted – Net assets are restricted when they are subject to externally imposed constraints. Unrestricted – Unrestricted net assets are not subject to externally imposed constraints. However, these net assets are subject to internal designations. Unrestricted net assets include amounts designated for specific purposes by action of the Board or management or may otherwise be subject to pending contractual commitments with external parties. Substantially all unrestricted net assets are internally designated for programmatic initiatives or capital asset renewals.

NOTES TO THE FINANCIAL STATEMENTS (Continued) Michigan State University
39
17. Derivatives not reported at fair value The University is party to derivative financial instruments (interest rate swaps that are intended to effectively convert variable-rate debt to fixed-rate debt) that are not reported at fair value on the Statement of Net Assets at June 30, 2005. Objective of the swaps: In order to protect against the potential of rising interest rates, the University has entered into ten separate pay-fixed, receive-variable interest rate swaps at a cost less than what the University would have paid to issue fixed-rate debt. Terms, fair values, and credit risk: The terms, fair values, and credit rating of the outstanding swaps as of June 30, 2005 are listed below. The notional amounts of the swaps match the principal amounts of the associated debt. The University’s swap agreements contain scheduled reductions to outstanding notional amounts that are expected to follow scheduled or anticipated reductions in the associated “bonds payable” category:
Associated Bond Issue
Outstanding Notional Amount
Effective Date
Fixed Rate Paid
Variable Rate
Received Fair Value
Swap Termination
Date
Counterparty/ Counterparty Credit Rating
1998A-2 51,935,000$ 7/1/1998 4.604%BMA
Municipal Swap Index
(6,682,000)$ 8/15/2022 Ambac Financial Services/Aaa
2000A-1 & 2000A-2 98,545,000 5/2/2002 4.074% 67% USD-
LIBOR-BBA (13,277,000) 8/15/2029Lehman Brothers Special Financing
Inc./A2
2002A 51,660,000 10/17/2002 3.390% 67% USD-LIBOR-BBA (2,383,000) 8/15/2032 UBS Warburg/Aa2
2002A 2,120,000 10/17/2002 3.530% 67% USD-LIBOR-BBA (146,000) 8/15/2022 UBS Warburg/Aa2
2002B 9,440,000 10/17/2002 4.330% USD-LIBOR-BBA (167,000) 8/15/2018 UBS Warburg/Aa2
2002B 2,040,000 10/17/2002 5.280% USD-LIBOR-BBA (212,000) 8/15/2022 UBS Warburg/Aa2
2003A 80,570,000 12/11/2003 3.618% 67% USD-LIBOR-BBA (6,174,000) 2/15/2033
Lehman Brothers Special Financing
Inc./A2
2003B 23,540,000 12/11/2003 3.479% 67% USD-LIBOR-BBA (1,321,000) 2/15/2026 UBS Warburg/Aa2
2003C 10,850,000 12/11/2003 5.330% USD-LIBOR-BBA (1,173,000) 2/15/2033
Lehman Brothers Special Financing
Inc./A2
2005 84,580,000 7/2/2007 3.647% 67% USD-LIBOR-BBA (4,483,000) 2/15/2034
Lehman Brothers Special Financing
Inc./A2
Total 415,280,000$ (36,018,000)$
Fair Value: Primarily because interest rates have declined since their execution, the swaps in total have a negative fair value as of June 30, 2005. The swaps’ negative fair value may be countered by a reduction in total interest payments required under the variable-rate bonds, creating a lower synthetic rate. Because the coupons on the University’s variable-rate bonds adjust to changing interest rates, the bonds do not have a corresponding fair value increase. The fair value was estimated using the zero-coupon method. This method calculates the future net settlement payments required by the swaps, assuming that the current forward rates implied by the yield curve correctly anticipate future spot interest rates. The payments are then discounted using
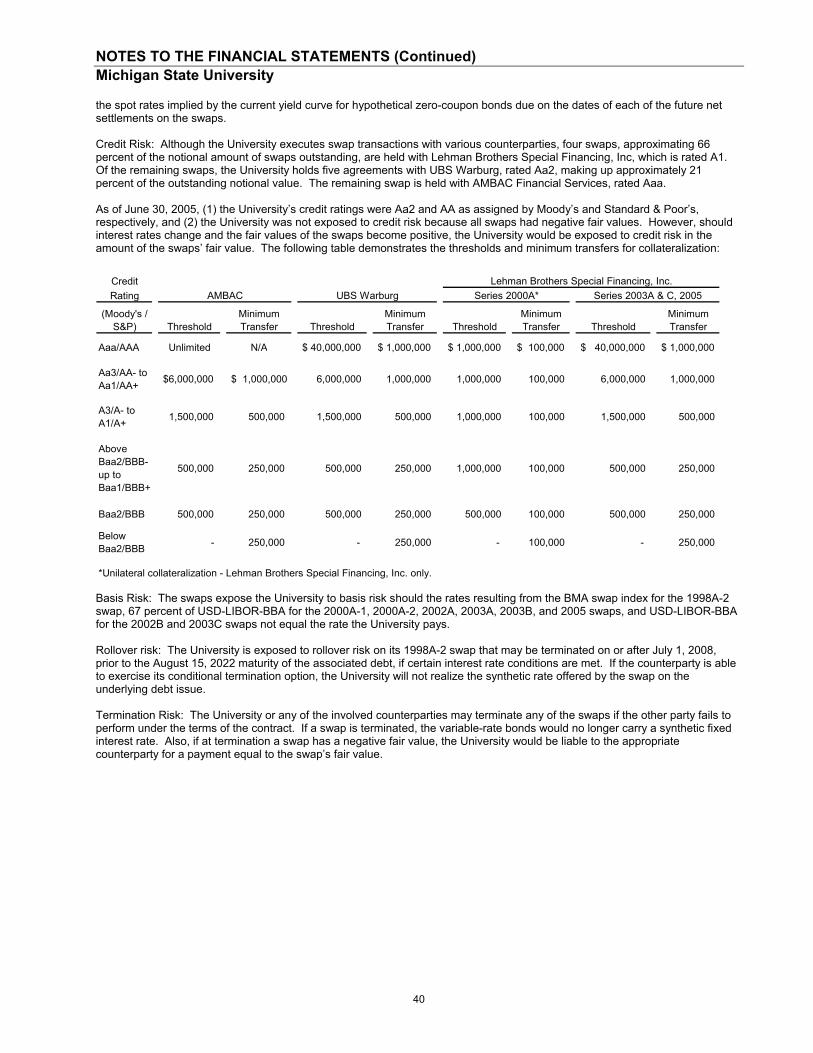
NOTES TO THE FINANCIAL STATEMENTS (Continued) Michigan State University
40
the spot rates implied by the current yield curve for hypothetical zero-coupon bonds due on the dates of each of the future net settlements on the swaps. Credit Risk: Although the University executes swap transactions with various counterparties, four swaps, approximating 66 percent of the notional amount of swaps outstanding, are held with Lehman Brothers Special Financing, Inc, which is rated A1. Of the remaining swaps, the University holds five agreements with UBS Warburg, rated Aa2, making up approximately 21 percent of the outstanding notional value. The remaining swap is held with AMBAC Financial Services, rated Aaa. As of June 30, 2005, (1) the University’s credit ratings were Aa2 and AA as assigned by Moody’s and Standard & Poor’s, respectively, and (2) the University was not exposed to credit risk because all swaps had negative fair values. However, should interest rates change and the fair values of the swaps become positive, the University would be exposed to credit risk in the amount of the swaps’ fair value. The following table demonstrates the thresholds and minimum transfers for collateralization:
CreditRating
(Moody's / S&P) Threshold
Minimum Transfer Threshold
Minimum Transfer Threshold
Minimum Transfer Threshold
Minimum Transfer
Aaa/AAA Unlimited N/A $ 40,000,000 $ 1,000,000 $ 1,000,000 $ 100,000 $ 40,000,000 $ 1,000,000
Aa3/AA- to Aa1/AA+ $6,000,000 $ 1,000,000 6,000,000 1,000,000 1,000,000 100,000 6,000,000 1,000,000
A3/A- to A1/A+ 1,500,000 500,000 1,500,000 500,000 1,000,000 100,000 1,500,000 500,000
Above Baa2/BBB- up to Baa1/BBB+
500,000 250,000 500,000 250,000 1,000,000 100,000 500,000 250,000
Baa2/BBB 500,000 250,000 500,000 250,000 500,000 100,000 500,000 250,000
Below Baa2/BBB - 250,000 - 250,000 - 100,000 - 250,000
*Unilateral collateralization - Lehman Brothers Special Financing, Inc. only.
Lehman Brothers Special Financing, Inc.AMBAC UBS Warburg Series 2000A* Series 2003A & C, 2005
Basis Risk: The swaps expose the University to basis risk should the rates resulting from the BMA swap index for the 1998A-2 swap, 67 percent of USD-LIBOR-BBA for the 2000A-1, 2000A-2, 2002A, 2003A, 2003B, and 2005 swaps, and USD-LIBOR-BBA for the 2002B and 2003C swaps not equal the rate the University pays. Rollover risk: The University is exposed to rollover risk on its 1998A-2 swap that may be terminated on or after July 1, 2008, prior to the August 15, 2022 maturity of the associated debt, if certain interest rate conditions are met. If the counterparty is able to exercise its conditional termination option, the University will not realize the synthetic rate offered by the swap on the underlying debt issue. Termination Risk: The University or any of the involved counterparties may terminate any of the swaps if the other party fails to perform under the terms of the contract. If a swap is terminated, the variable-rate bonds would no longer carry a synthetic fixed interest rate. Also, if at termination a swap has a negative fair value, the University would be liable to the appropriate counterparty for a payment equal to the swap’s fair value.
NOTES TO THE FINANCIAL STATEMENTS (Continued) Michigan State University
41
18. New accounting pronouncements The University will be required to implement the provisions of GASB Statement No. 42, Accounting and Financial Reporting for Impairment of Capital Assets and for Insurance Recoveries, effective with the fiscal year ending June 30, 2006. The University will be required to address the accounting and reporting for impaired capital assets, if any, and insurance recoveries. The University has not yet determined the full impact of GASB Statement No. 42 on its financial statements. The University will be required to implement the provisions of GASB Statement No. 45, Accounting and Financial Reporting by Employers for Postemployment Benefits Other Than Pensions, effective with the fiscal year ending June 30, 2008. The University will be required to address the accounting and reporting for costs and obligations related to postemployment healthcare and other non-pension benefits. The University has not yet determined the full impact of GASB Statement No. 45 on its financial statements. The University will be required to implement the provisions of GASB Statement No. 47, Accounting for Termination Benefits, effective with the fiscal year ending June 30, 2006. The University will be required to disclose certain information regarding termination benefit arrangements, if any. The University has not yet determined the full impact of GASB Statement No. 47 on its financial statements.
Financial report prepared under the direction of Fred L. Poston, Vice President for Finance and Operations and Treasurer; David B. Brower, Assistant Vice President, Chief Financial Officer and Controller; Glen J. Klein,
Director of Investments and Financial Management; Vincent Schimizzi, Chief Accountant; Gregory J. Deppong, Manager of Financial Analysis; and Robert J. Patterson, Manager of Cost Analysis.
Michigan State University is an affirmative-action, equal-opportunity institution.
The Michigan State University IDEA is Institutional Diversity: Excellence in Action