financial report - jan de nul
TRANSCRIPT

FINANCIAL REPORT

Dit rapport is ook beschikbaar in het Nederlands. Ce rapport est également disponible en français. Este informe también está disponible en español.
RESPONSIBLE EDITOR Jan De Nul Group [Sofidra sa] Luxembourg [email protected] www.jandenul.com
REGISTERED OFFICE 34-36, Parc d’Activités Capellen L-8308 Capellen I Grand Duchy of Luxembourg
LAY OUT Communication department Jan De Nul Group
PHOTOGRAPHY© Jan De Nul Group
BOARD OF DIRECTORSJ.P.J. De Nul, Dirk De Nul, Julie De Nul, Géry Vandewalle, Jeannot Krecké, Paul Lievens, Johan Van Boxstael, David Lutty, Niels Van Ghendt, Etienne Schneider
We find it important to do our part in an ecological world, which is why this annual report is published on recycled paper (Nautilus – Super White).
For more information on this annual report, please contact: Paul Lievens, CFO Jan De Nul Group [email protected]

1. FINANCIAL KEY FIGURES 4
2. PROFIT & LOSS ACCOUNT 5
3. BALANCE SHEET 7
4. ORDER BOOK 8
5. INVESTMENTS 10
6. REPORT ON THE AUDIT OF
THE CONSOLIDATED FINANCIAL STATEMENTS 12
CONTENT

4 2020 FINANCIAL REPORT.4 2020 FINANCIAL REPORT.
FINANCIAL KEY FIGURES
EXTREMELY STRONG SOLVENCY-RATIO THANKS TO COMPLETE PROFIT RESERVATION
4,102 BALANCE SHEET TOTAL
(MILLION EURO)
2,950 EQUITY
(MILLION EURO)
2,336FIXED ASSETS
(MILLION EURO)
72%SOLVENCY RATIO
2020
279 NET CASH POSITION
(MILLION EURO)
25NET PROFIT (MILLION EURO)
344EBITDA (MILLION EURO)
18% EBITDA MARGIN 2020
TURNOVER: 5 YEAR COMPARISON IN MILLION EURO
1,908
2020
1,708
2018
2,030
20192016
2,044
2017
1,758

5PROFIT & LOSS ACCOUNT.
PROFIT & LOSS ACCOUNT
Jan De Nul Group is a leading world player in dredging and marine works, specialised services for the offshore oil, gas and renewable energy market, civil engineering works, environmental activities and project development.
Despite the ongoing challenging market circumstances in 2020, along with the impact on day-to-day business from the exceptional measures implemented to cope with the COVID-19 pandemic health emergency, Jan De Nul Group shows solid 2020 results.
After deducting depreciations, financial costs and taxes, the Group presents a net profit of 25 million euro.
MARITIME DREDGING AND OFFSHORE ACTIVITIES
The maritime dredging and offshore sector remains in 2020 the cornerstone of Jan De Nul Group’s activities with 77% of the total turnover of the Group.
In 2020, Jan De Nul Group was responsible for the deepening and widening of the Elbe River in Hamburg (Lower and Outer Elbe), Germany. In Africa, Jan De Nul Group was active in Benin for the coastal protection works near the coastal villages Avlékété and Djégbadji, part of the town called Ouidah. Jan De Nul Group is building a submerged dike at about 150 meters off the coast and performing beach reclamation works. The works started in February 2018 and will be completed in 2021. In the Middle-East, Jan De Nul Group worked for the completion of the ‘Dibba bulk handling terminal – Package 3 project’, consisting of dredging works in the channel and harbour basin as well as the fishery harbour and port infrastructure works in the United Arab Emirates. In Asia, Jan De Nul
Group undertook maintenance dredging works in the port of Mailiao, Taiwan. In Latin America, Jan De Nul Group is operating and maintaining the access channel to the port terminals of Guayaquil, Ecuador, under a 25-year concession contract.
The offshore division was once again involved in the construction of several offshore wind farm projects, in and outside Europe. In Belgium, Jan De Nul Group installed Northwester 2 and in Germany, the Trianel Offshore Wind Farm. Outside Europe, more specifically in Taiwan, Jan De Nul Group is responsible for the supply, transport and installation of foundations, cables and wind turbine generators for 21 5.2 MW Hitachi turbines for the Changhua Offshore Wind Farm. Also in Taiwan, Jan De Nul Group executes the EPCI-contract for the design, supply and installation of 47 WTG foundations, 4 export cables and 47 inter array cables for the Formosa 2 Offshore Wind Farm. In the United States, Jan De Nul Group completed the transport and installation of two offshore wind turbines for the Coastal Virginia Offshore Wind Farm Pilot Project.
Furthermore, the offshore division executed general offshore services, amongst other things, the preparation of the shore approach in Italy and Albania for an undersea trans-Adriatic pipeline, as well as rock installation works for the construction of the Tortue LNG hub in Senegal-Mauretania. In Greece, Jan De Nul Group installed a 135-kilometer long submarine cable for the inter–connection between Crete and the Greek mainland.
CIVIL ACTIVITIES
With 21% of the Group’s total turnover, the civil activities remain a more than significant part of Jan De Nul Group. The civil division has a wide variety of projects in its portfolio, with a focus on complex design and engineering projects, both in Belgium and abroad. The type of projects ranges from buildings, over transport related infrastruc-tures to water related infrastructures like quay walls and locks. The civil department offers its services to private clients, public parties and participates in Public Private Partnerships (PPP). In Belgium, Jan De Nul Group continues to contribute to the renovation of the Leopold II-tunnel in Brussels and, in Charleroi, the construction works of the Grand Hôpital de Charleroi (GHdC) has continued.
In 2020, Jan De Nul Group was able to achieve a solid turnover of 1.9 billion euro. The EBITDA amounted to 344 million euro or 18% of turnover, a great performance and in the leading group of the sector.

6 2020 FINANCIAL REPORT.
ENVIRONMENTAL ACTIVITIES
Envisan, the environmental division of Jan De Nul Group, focuses on environmental technology solutions. The envi-ronmental activities keep a stable 2% of the Group’s total turnover. To support these activities, Jan De Nul Group owns and operates six soil and sediment valorisation centres in Belgium and France. In Antwerp, Belgium, Envisan has started soil remediation works at the Fort Philip site. As in previous years, the environmental segment works closely together with the maritime and civil activities and, in particular, with the project development partner of the Group, PSR Brownfield Developers, which is active in the remediation, repurposing and sustainable development of polluted industrial sites and under-utilised sites.
GEOGRAPHICAL PRESENCE
Although the world is its market, Jan De Nul Group continues to have a strong presence in Europe: 38% of its turnover was realised across European countries. Jan De Nul Group’s activities, however, grew fastest in Asia and the Middle East. The share of this region in the Group’s turnover continued to increase from 18% in 2018 to 27% in 2019 to 37% in 2020. This increase is driven by Jan De Nul Group’s activities for the construction of three major offshore wind farms in Taiwan. Furthermore, in 2020 Jan De Nul Group was active in America (13%) and Africa (12%).
TURNOVER ACCORDING TO ACTIVITY
77% DREDGING AND OFFSHORE
21% CIVIL
2%ENVIRONMENTAL
REGIONAL BREAKDOWN OF TURNOVER
37%ASIA & MIDDLE EAST
12% AFRICA
13% AMERICA
38%EUROPE

7BALANCE SHEET.
BALANCE SHEETSOLVENCY
In the financial year 2020, Jan De Nul Group maintained its high solvency position with a ratio of 72%. Equity increased from 2,941 million euro in 2019 to 2,950 million euro in 2020, thanks to the sustained policy of complete profit reinvestment (no-payments-of-dividends policy).
LIQUIDITY & NET FINANCIAL DEBT
Since 2014, Jan De Nul Group is completely net debt-free. This is quite unique, especially considering the Group’s strong investment-DNA. Jan De Nul Group is currently making significant and strategic investments in its offshore fleet, through the construction of Jack-Up Installation Vessel Voltaire and large Crane Vessel Les Alizés.
The net cash position at the end of 2020 amounted to 279 million euro, compared to 465 million euro in 2019. At the
end of 2020, the available cash in the bank and in hand of the Group amounted to 555 million euro (compared to 712 million euro at the end of 2019). This solid balance sheet is a major asset of Jan De Nul Group in the context of economic volatility, future investments and competitive strength.
FIXED ASSETS
As a global player, Jan De Nul Group has a focus on the long-term perspective. The continuous renewal and modernization of its fleet and equipment is one element that reveals this long-term vision. The amount of fixed assets on the balance sheet remains stable and amounted to 2,336 million euro (2,205 million euro in 2019). About 70% of the Group’s fixed assets consists of vessels.
BALANCE SHEET TOTAL (MILLION EURO)
EQUITY (MILLION EURO)
20202018 20192016 2017
4,1023,9184,3354,558
3,739
2,9502,859 2,9412,752 2,823

8 2020 FINANCIAL REPORT.
ORDER BOOKSTABLE ORDER BOOK OF 3.2 BILLION EURO
With continuous investment in people and equipment, Jan De Nul Group remains a reliable leading expert in its business. The in-house technical knowhow, competent and well-trained employees, and the development of an extensive high performance modern fleet, allow Jan De Nul Group to offer creative and innovative solutions, tailor-made for the client.
These core characteristics of the group, combined with the group’s financial strength, convinces clients to entrust Jan De Nul with their projects. Moreover, Jan De Nul Group has ample experience in facilitating export credit structures and other financing proposals for its clients. This results at the end of 2020 in an order book of 3.2 billion euro.
A DIVERSIFIED PROJECT PORTFOLIO
Jan De Nul Group is a global and multidisciplinary group, active in maritime, dredging and offshore works, civil works and environmental works. The projects in its order book are therefore very diverse in nature and geographically well spread.
Jan De Nul Group’s order book includes several major projects, a selection of which is presented below:
• In December 2020, Jan De Nul Group signed a contract with Payra Port Authority in order to maintain the depths of the existing port access channel. In January 2021, the vessels Diogo Cão and Henry Darcy were mobilized to Bangladesh in order to start the works.
• In 2021, Jan De Nul Group will complete the works for the expansion of the port facilities for Ibistek in Takoradi, Ghana. Also, in Benin, the construction of the underwater breakwater and the coastline protection works will be completed.
• In the UAE, Jan De Nul Group and its partner will complete the expansion of the Port of Fujairah in Dibba. The design-and-build contract consists of dredging the navigation channel and port basin, reclamation and shore protection, as well as constructing breakwaters, a 765-meter long quay wall, foundations for ship loader rails, port infrastructure and creating utilities and aids to navigation.
• In Ecuador, Jan De Nul Group holds a concession for the deepening and maintenance of the 95-kilometer long access channel to the port of Guayaquil. Having completed the deepening in 2019, Jan De Nul Group continues with the maintenance and the operation of the channel for the next 23 years.
• In Buenos Aires, Argentina, Jan De Nul Group commenced a deepening and widening campaign for AGP Port of Buenos Aires in October 2020. After completing the deepening and widening works, Jan De Nul Group will continue to maintain the depth and width for 24 months until 2023.
• In Taiwan, Jan De Nul Group will continue with maintenance dredging works at the port of Mailiao. After the maintenance contract of 2018-20, a new contract has been awarded for another three years until 2023.
• Jan De Nul Group has previously successfully completed and delivered the first wind farm in Taiwan, Formosa 1 Phase 2, and is now continuing to build the second Taiwanese wind farm: Changhua Offshore Wind Farm with a capacity of 109 MW. The jacket foundations and the export cables were installed for this purpose in 2020 and in 2021 the inter-array cables will be further laid and connected. The 21 5.2 MW turbines from Hitachi will also be installed and put into operation in 2021.
• In 2020, Jan De Nul also started installing the pin piles for the jacket foundations of its third offshore wind farm project in Taiwan, Formosa 2 Offshore Wind Farm with a capacity of 376 MW. The fabrication of the jacket foundations in Indonesia and Malaysia is currently in full swing, as is the laying of the export cables. The jacket foundations will be installed next year, as well as the inter-array cables. These cables will be laid by the Connector, the Cable-Lay Vessel recently purchased by Jan De Nul Group, which is a perfect addition to Jan De Nul Group’s offshore fleet. Completion of this work is scheduled for 2022.
• For the Kriegers Flak Offshore Wind Farm, Jan De Nul Group is installing a total of 72 wind turbines of 8.4 MW each on behalf of Vattenfall Denmark. All together, they will produce enough green electricity for the annual consumption of approximately 600,000 Danish households. The last turbine is scheduled to be installed

9INVESTMENTS.
during the summer of 2021, approximately 4.5 months after the start of this installation campaign. This offshore wind farm will immediately become the largest in Denmark and will increase Denmark’s offshore wind production by no less than 16 percent.
• The transport and installation of the wind turbines at the Saint-Nazaire Offshore Wind Farm in France will also be done by Jan De Nul Group. Preparation works for the seabed will continue in 2021 and the actual installation of the 80 wind turbines is planned for 2022. As for the Kriegers Flak Offshore Wind Farm, the Jack-Up Installation Vessel Vole au vent will be used for this project as well.
• In the United Kingdom, Jan De Nul Group is responsible for the transport and installation of the GE Haliade-X offshore wind turbines at the Dogger Bank Offshore Wind Farms, 130 km off the Yorkshire coast. The transport and installation of the turbines in a period of three consecutive years will be done by Voltaire, the world’s largest Offshore Jack-Up Installation Vessel from Jan De Nul Group. The 3.6 GW Dogger Bank Wind Farms, which will be delivered in three 1.2 GW North Sea phases, will be the world’s largest offshore wind farm upon completion and is a joint venture between SSE Renewables and Equinor. Dogger Bank will generate enough energy when completed to power more than 4.5 million households each year, which is about 5% of the UK’s electricity needs.
• In April 2020, Jan De Nul Group and its partner signed the contracts for the supply and installation of high-voltage cables that will connect the Dutch offshore wind farms ‘Hollandse Kust Noord’ and ‘Hollandse Kust West Alpha’ to the onshore electricity grid. In 2020, the main focus points of the project were the cable design and the detailed design of the tracked vertical injector, Moonfish, that will bury the cables in the nearshore section. In 2021, the cables will be tested and manufactured. Thereafter, the actual installation works will start. The Cable-Lay Vessel Isaac Newton will sail to South Korea to load the submarine cables and install them upon return in the Netherlands. The cables will be buried by means of the jet trenchers UTV 1200 (offshore section) and the Moonfish (nearshore section). Pre-sweeping works will be undertaken by the elevated excavator Starfish and a Trailing Suction Hopper Dredger. Subsea Rock Installation Vessel
Adhémar de Saint-Venant will install the pre-lay & post-lay rock berms at the crossing locations.
• In Belgium, Jan De Nul Group is part of the Scheldt tunnel construction of the Oosterweel project. The Scheldt tunnel is the most important connecting element in the Oosterweel link and closes the Antwerp Ring Road on the north side. The tunnel has a total length of 1,800 m and will be built according to the ‘immersed tube’ method. Eight tunnel elements of approximately 60,000 tonnes each will be built in the inner port of Zeebrugge and then towed to Antwerp via the North Sea and the Western Scheldt, where they will be immersed in a pre-dredged trench in the River Scheldt.
• Furthermore, in Belgium, Jan De Nul Group and its joint venture partner continue the construction of the Hospital of Charleroi. With an opening scheduled in 2024, the 154,000 m² complex is built on a 42-acre site and will have 1,000 beds. In the light of the Constitution contract, Jan De Nul Group and its partners have also started the construction of subway stations Toots Thielemans and Lemonnier and 575 metres of underground tunnels in Brussels.
• In 2021, the environmental division of the Jan De Nul Group, together with its consortium partner, will continue with the largest soil remediation project ever executed in the port of Antwerp at the Fort Filips site. The encapsulation of the polluted soil will avoid the further spreading of any pollution. The construction of flood defence dikes will protect the port against flooding.

10 2020 FINANCIAL REPORT.
INVESTMENTSFLEET
VERSATILE HOPPER AND CUTTER FLEET
At the end of 2020, the Keppel shipyard in Singapore delivered the 6,000 m³ Trailing Suction Hopper Dredger Ortelius. Ortelius is the sister vessel of Sanderus, which was delivered earlier in 2019. Both vessels comply with the strictest emission standards and, together with three other vessels from our fleet, they were the first vessels in the world to obtain Bureau Veritas’ ULEv notation.
The COSCO Dalian shipyard in China delivered the Trailing Suction Hopper Dredger Galileo Galilei in January 2021. This dredger has a hopper capacity of 18,000 m³ and joins our medium-sized hopper dredgers. A special feature of this vessel and unique in Jan De Nul’s hopper fleet is that it has two separate hoppers on board. This allows the dredged material to be spread evenly over both hoppers, thus optimally controlling the load and the draught.
After Jan De Nul Group acquired the Cutter Suction Dredger Willem van Rubroeck in October 2019 through the highest bid in a public auction in Croatia, it was handed over to Jan De Nul Group in February 2020 and transferred to the Remontowa shipyard in Poland in April 2020. At Remontowa, she was further finished and delivered at the end of 2020. The vessel is currently on its way to its first job.
OFFSHORE INSTALLATION FLEET
With a clear focus on the offshore energy projects of tomorrow, Jan De Nul Group is strategically investing in its specialised fleet for the offshore energy market.
Jan De Nul Group ordered in the spring of 2019 the offshore jack-up installation vessel Voltaire from the shipyard COSCO Shipping Heavy Industry. In May 2020, the first steel plate was cut. Delivery is expected in early 2022.
In autumn 2019, Jan De Nul Group ordered the large crane vessel Les Alizés from the shipyard China Merchants Industry Holding Co. This vessel is also in the steel construction phase with her first steel plate in December 2020. Les Alizés will enter the Jan De Nul fleet in mid-2022.
At the end of 2020, Jan De Nul Group purchased the offshore construction and cable-lay vessel Connector from Ocean Yield ASA. The Connector is a DP3 Ultra Deepwater Multipurpose Subsea Cable- and Flex-Lay Construction Vessel. The vessel has a proven track record of installing power cables and umbilicals using its dual turntables with a combined total pay-load capacity of 9,000 tonnes, as well as risers using its two heave-compensated 400 mt and 100 mt offshore cranes. The Connector is also fitted with two built-in WROV’s which can work in water depths of up to 4,000 meters.
New ULEv certificationBureau Veritas, the world leader
in testing, inspection and certification, has developed
a new certification for the performance of Ultra-Low Emission vessels (ULEvs).
Jan De Nul’s latest Trailing Suction Hopper Dredgers, the Sanderus, Ortelius, Tristão da
Cunha, Afonso de Albuquerque and Diogo Cão, are the first
vessels to have been awarded this certification.

LAND-BASED EQUIPMENT
Jan De Nul Group continuously invests in extending and renewing its land-based equipment for supporting its worldwide operations. In doing so, Jan De Nul Group always goes for the most up-to-date technologies, meeting the most stringent environmental requirements. The right machine for the right application.
In 2020, Jan De Nul Group expanded its fleet of land-based equipment with 4 wheel loaders, 5 excavators and several aerial lifts to support its domestic and international operations.
The purchase of a 250 Heavy Duty cable crane strengthens Jan De Nul’s position in the market for soil improvement works, including dynamic compaction and vibroflotation. At its logistics hub in Zelzate, the Group installed a new gantry crane. To further support its foundation expertise, Jan De Nul Group purchased a new foundation rig with telescopic leader type Liebherr LRB355.1.
At the same time, the Group continues to invest in developing project-specific solutions. To remedy historical pollution with microplastics in the Port of Antwerp, a team of Jan De Nul Group invented the Nul-0-Plastic: a compact, manoeuvrable hoover on caterpillar tracks. This machine was designed and built entirely in-house.
12PILE DRILLING
MACHINES
20VIBRO AND
HYDRAULIC HAMMERS
36CRAWLER CRANES
FROM 50 TO 600 TONNES
45 HYDRAULIC
TELESCOPIC CRANES
31TELESCOPICHANDLERS
LAND EQUIPMENT OF JAN DE NUL GROUP AS AT 31.12.2020
70DUMPERS WITH CARRYING
CAPACITY FROM 25 TO 100 TONNES
152HYDRAULIC EXCAVATORS
BETWEEN 8 AND 250 TONNES
31TOWER CRANES
51BULLDOZERS
48WHEEL LOADERS
11INVESTMENTS.

12 2020 FINANCIAL REPORT.
OPINION
We have audited the consolidated Financial Statements of JAN DE NUL GROUP*, which comprise the consolidated balance sheet as at 31 December 2020, and the consolidated profit and loss account for the year then ended, and notes to the consolidated financial statements, including a summary of significant accounting policies.
In our opinion, the accompanying consolidated financial statements present fairly, in all material respects, the consolidated financial position of the Company as at 31 December 2020, and of the consolidated results of its operations for the year then ended in accordance with Luxembourg legal and regulatory requirements relating to the preparation and presentation of the consolidated Financial Statements.
BASIS FOR OPINION
We conducted our audit in accordance with the Law of July 23, 2016 on the audit profession (Law of July 23, 2016) and with International Standards on Auditing (ISAs) as adopted for Luxembourg by the “Commission de Surveillance du Secteur Financier” (CSSF). Our respon-sibilities under those Law and standards are further described in the « Responsibilities of “Réviseur d’Entre-prises Agréé” for the Audit of the consolidated Financial Statements » section of our report. We are also independent of the Company in accordance with the International Ethics Standards Board for Accountants’ Code of Ethics for Professional Accountants (IESBA Code) as adopted for Luxembourg by the CSSF together with the ethical requirements that are relevant to our audit of the consolidated Financial Statements, and have fulfilled our other ethical responsibilities under those ethical requirements. We believe that the audit evidence we have obtained is sufficient and appropriate to provide a basis for our opinion.
OTHER INFORMATION
The Board of Directors is responsible for the other information. The other information comprises the information included in the consolidated management report but does not include the consolidated Financial Statements and our report of “Réviseur d’Entreprises Agréé” thereon.
Our opinion on the consolidated Financial Statements does not cover the other information and we do not express any form of assurance conclusion thereon.
In connection with our audit of the consolidated Financial Statements, our responsibility is to read the other information and, in doing so, consider whether the other information is materially inconsistent with the consolidated Financial Statements or our knowledge obtained in the audit or otherwise appears to be materially misstated. If, based on the work we have performed, we conclude that there is a material misstatement of this other information, we are required to report this fact. We have nothing to report in this regard.
RESPONSIBILITIES OF THE BOARD OF DIRECTORS FOR THE CONSOLIDATED FINANCIAL STATEMENTS
The Board of Directors is responsible for the preparation and fair presentation of these consolidated Financial Statements in accordance with Luxembourg legal and regulatory requirements relating to the preparation and presentation of the consolidated Financial Statements, and for such internal control as the Board of Directors determines is necessary to enable the preparation of the consolidated Financial Statements that are free from material misstatement, whether due to fraud or error.
In preparing the consolidated Financial Statements, the Board of Directors is responsible for assessing the Company’s ability to continue as a going concern, disclosing, as applicable, matters related to going concern and using the going concern basis of accounting unless the Board of Directors either intends to liquidate the Company or to cease operations, or has no realistic alternative but to do so.
REPORT ON THE AUDIT OF THE CONSOLIDATED FINANCIAL STATEMENTS
Grant Thornton Audit & Assurance S.A. | 13, rue de Bitbourg | L-1273 Luxembourg | Tel.: +352 40 12 991 | Fax: +352 40 05 98 | www.grantthornton.lu
*JAN DE NUL GROUP is the trade name for Sofidra sa

13
RESPONSIBILITY OF THE RÉVISEUR D’ENTREPRISES AGRÉÉ FOR THE AUDIT OF THE CONSOLIDATED FINANCIAL STATEMENTS
Our objectives are to obtain reasonable assurance about whether the consolidated Financial Statements as a whole are free from material misstatement, whether due to fraud or error, and to issue a report of “Réviseur d’Entreprises Agréé” that includes our opinion. Reasonable assurance is a high level of assurance, but is not a guarantee that an audit conducted in accordance with the Law dated 23 July 2016 and with ISAs as adopted for Luxembourg by the CSSF will always detect a material misstatement when it exists. Misstatements can arise from fraud or error and are considered material if, individually or in the aggregate, they could reasonably be expected to influence the economic decisions of users taken on the basis of these consolidated Financial Statements.
As part of an audit in accordance with the Law dated 23 July 2016 and with ISAs as adopted for Luxembourg by the CSSF, we exercise professional judgment and maintain professional skepticism throughout the audit. We also:
• Identify and assess the risks of material misstatement of the consolidated Financial Statements, whether due to fraud or error, design and perform audit procedures responsive to those risks, and obtain audit evidence that is sufficient and appropriate to provide a basis for our opinion. The risk of not detecting a material misstatement resulting from fraud is higher than for one resulting from error, as fraud may involve collusion, forgery, intentional omissions, misrepresentations, or the override of internal control.
• Obtain an understanding of internal control relevant to the audit in order to design audit procedures that are appropriate in the circumstances, but not for the purpose of expressing an opinion on the effectiveness of the Company’s internal control.
• Evaluate the appropriateness of accounting policies used and the reasonableness of accounting estimates and related disclosures made by the Board of Directors.
• Conclude on the appropriateness of the Board of Directors use of the going concern basis of accounting and, based on the audit evidence obtained, whether a material uncertainty exists related to events or conditions that may cast significant doubt on the Company’s ability to continue as a going concern. If we conclude that a material uncertainty exists, we are required to draw attention in our report of “Réviseur
d’Entreprises Agréé” to the related disclosures in the consolidated Financial Statements or, if such disclosures are inadequate, to modify our opinion. Our conclusions are based on the audit evidence obtained up to the date of our report of “Réviseur d’Entreprises Agréé”. However, future events or conditions may cause the Company to cease to continue as a going concern.
• Evaluate the overall presentation, structure and content of the consolidated Financial Statements, including the disclosures, and whether the consolidated Financial Statements represent the underlying transactions and events in a manner that achieves fair presentation.
• Obtain sufficient appropriate audit evidence regarding the financial information of the entities and business activities within the Group to express an opinion on the consolidated financial statements. We are responsible for the direction, supervision and performance of the Group audit. We remain solely responsible for our audit opinion.
We communicate with those charged with governance regarding, among other matters, the planned scope and timing of the audit and significant audit findings, including any significant deficiencies in internal control that we identify during our audit.
REPORT ON OTHER LEGAL AND REGULATORY REQUIREMENTS
The consolidated management report is consistent with the consolidated Financial Statements and has been prepared in accordance with applicable legal requirements.
Luxembourg, 4 May 2021
Thierry REMACLERéviseur d’Entreprises AgrééGrant Thornton Audit & Assurance
Grant Thornton Audit & Assurance S.A. | 13, rue de Bitbourg | L-1273 Luxembourg | Tel.: +352 40 12 991 | Fax: +352 40 05 98 | www.grantthornton.lu
REPORT ON THE AUDIT OF THE CONSOLIDATED FINANCIAL STATEMENTS.

14 2020 FINANCIAL REPORT.
CONSOLIDATED BALANCE SHEET AS AT DECEMBER 31, 2020
Jan De Nul GROUP* Registered office: Capellen – R.C.S. Luxembourg: B 73.723
ASSETS 2020 2019
FIXED ASSETS 2,336,267,427.35 2,204,817,684.41
Intangible assets 67,282,790.70 81,541,536.11
Concessions, patents, licences, trademarks & similar rights and assets, if they were acquired for valuable consideration and need not be shown under goodwill (Note 4) 67,282,790.70 81,541,536.11
Goodwill, to the extent that it was acquired for valuable consideration (Note 5) 0.00 0.00
Tangible assets (Note 6) 2,210,010,441.15 2,066,265,890.64
Land and buildings 86,330,805.13 90,050,328.36
Plant and machinery 1,730,398,592.23 1,619,596,170.64
Other fixtures and fittings, tools and equipment 21,451,223.57 22,213,514.51
Payments on account and tangible assets in the course of construction 371,829,820.22 334,405,877.13
Financial assets (Note 7) 46,978,515.51 47,184,755.66
Loans to undertakings with which the undertaking is linked by virtue of participating interests 0.00 0.00
Investments held as fixed assets 470,772.41 470,772.41
Other loans 46,507,743.10 46,713,983.25
Companies consolidated by net equity method (Note 8) 11,995,679.99 9,825,502.00
CURRENT ASSETS 1,733,384,693.59 2,086,559,751.15
Stocks (Note 9) 413,510,288.92 400 ,042,158.86
Raw materials and consumables 222,018,000.83 238,497,377.22
Work in progress 182,929,224.97 152,956,102.41
Finished goods and goods for resale 8,563,063.12 8,588,679.23
Payments on account 0.00 0.00
Debtors 704,621,192.29 914,733,323.05
Trade debtors (Note 10) 550,527,449.78 825,086,739.08
becoming due and payable within one year 548,749,449.78 823,308,739.08
becoming due and payable after more than one year 1,778,000.00 1,778,000.00
Amounts owed by undertakings with which the undertaking is linked by virtue of participating interests (Note 11) 8,563,802.43 4,924,608.23
becoming due and payable within one year 8,563,802.43 4,924,608.23
Other debtors (Note 12) 145,529,940.08 84,721,975.74
becoming due and payable within one year 145,529,940.08 84,721,975.74
becoming due and payable after more than one year 0.00 0.00
Investments 60,000,000.00 60,000,000.00
Own shares (Note 13) 60,000,000.00 60,000,000.00
Other investments 0.00 0.00
Cash at bank and in hand 555,253,212.4 711,784,269.24
PREPAYMENTS 32,670,814.25 43,787,316.40
TOTAL (ASSETS) 4,102,322,935.19 4,335,164,751.96
The accompanying notes form an integral part of these consolidated accounts. (Expressed in euro)
15
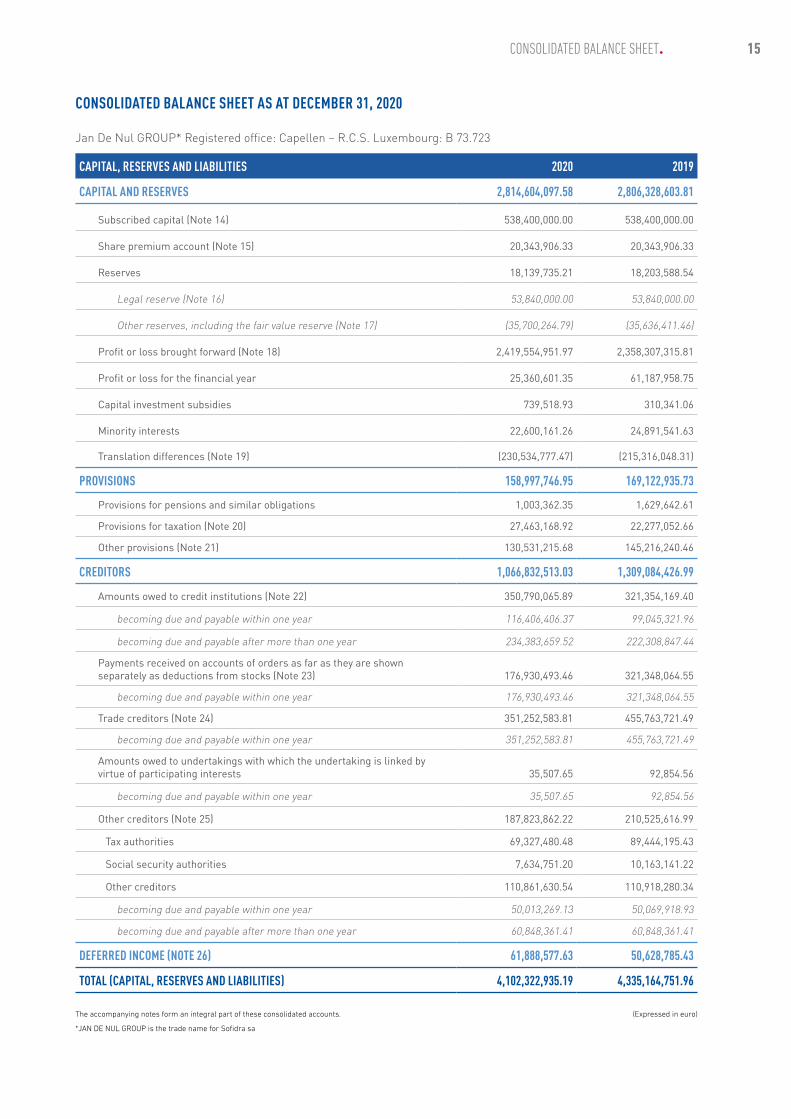
CONSOLIDATED BALANCE SHEET AS AT DECEMBER 31, 2020
Jan De Nul GROUP* Registered office: Capellen – R.C.S. Luxembourg: B 73.723
CAPITAL, RESERVES AND LIABILITIES 2020 2019
CAPITAL AND RESERVES 2,814,604,097.58 2,806,328,603.81
Subscribed capital (Note 14) 538,400,000.00 538,400,000.00
Share premium account (Note 15) 20,343,906.33 20,343,906.33
Reserves 18,139,735.21 18,203,588.54
Legal reserve (Note 16) 53,840,000.00 53,840,000.00
Other reserves, including the fair value reserve (Note 17) (35,700,264.79) (35,636,411.46)
Profit or loss brought forward (Note 18) 2,419,554,951.97 2,358,307,315.81
Profit or loss for the financial year 25,360,601.35 61,187,958.75
Capital investment subsidies 739,518.93 310,341.06
Minority interests 22,600,161.26 24,891,541.63
Translation differences (Note 19) (230,534,777.47) (215,316,048.31)
PROVISIONS 158,997,746.95 169,122,935.73
Provisions for pensions and similar obligations 1,003,362.35 1,629,642.61
Provisions for taxation (Note 20) 27,463,168.92 22,277,052.66
Other provisions (Note 21) 130,531,215.68 145,216,240.46
CREDITORS 1,066,832,513.03 1,309,084,426.99
Amounts owed to credit institutions (Note 22) 350,790,065.89 321,354,169.40
becoming due and payable within one year 116,406,406.37 99,045,321.96
becoming due and payable after more than one year 234,383,659.52 222,308,847.44
Payments received on accounts of orders as far as they are shown separately as deductions from stocks (Note 23) 176,930,493.46 321,348,064.55
becoming due and payable within one year 176,930,493.46 321,348,064.55
Trade creditors (Note 24) 351,252,583.81 455,763,721.49
becoming due and payable within one year 351,252,583.81 455,763,721.49
Amounts owed to undertakings with which the undertaking is linked by virtue of participating interests 35,507.65 92,854.56
becoming due and payable within one year 35,507.65 92,854.56
Other creditors (Note 25) 187,823,862.22 210,525,616.99
Tax authorities 69,327,480.48 89,444,195.43
Social security authorities 7,634,751.20 10,163,141.22
Other creditors 110,861,630.54 110,918,280.34
becoming due and payable within one year 50,013,269.13 50,069,918.93
becoming due and payable after more than one year 60,848,361.41 60,848,361.41
DEFERRED INCOME (NOTE 26) 61,888,577.63 50,628,785.43
TOTAL (CAPITAL, RESERVES AND LIABILITIES) 4,102,322,935.19 4,335,164,751.96
The accompanying notes form an integral part of these consolidated accounts. (Expressed in euro)
*JAN DE NUL GROUP is the trade name for Sofidra sa
CONSOLIDATED BALANCE SHEET.

16 2020 FINANCIAL REPORT.
CONSOLIDATED PROFIT AND LOSS ACCOUNT FROM JANUARY 1, 2020 TO DECEMBER 31, 2020
Jan De Nul GROUP * Registered office: Capellen – R.C.S. Luxembourg: B 73.723
2020 2019
NET OPERATING RESULT 128,774,246.50 137,051,356.46 Net turnover (Note 27) 1,907,905,727.78 2,029,694,746.54
Variation in stocks of finished goods and in work in progress (Note 9) 32,863,843.15 53,357,882.92
Work performed by the undertaking for its own purposes and capitalised 1,944,930.16 82,475,141.15
Other operating income (Note 28) 98,985,871.84 76,283,772.39
Raw materials and consumables and other external expenses (1,285,421,756.51) (1,402,347,243.97)
Raw materials and consumables (762,469,969.71) (832,432,545.63)
Other external expenses (522,951,786.80) (569,914,698.34)
Staff costs (Note 29) (372,725,374.65) (406,747,055.64)
Wages and salaries (280,092,386.17) (298,023,890.18)
Social security costs (76,937,465.51) (83,472,720.40)
Other staff costs (15,695,522.97) (25,250,445.06)
Value adjustments (214,742,891.35) (204,717,550.94)
in respect of formation expenses and of tangible and intangible fixed assets (Notes 4, 5 and 6) (202,927,555.94) (193,510,172.19)
in respect of current assets (Note 30) (11,815,335.41) (11,207,378.75)
Other operating expenses (Note 31) (40,036,103.92) (90,948,335.99)
NET FINANCIAL RESULT (60,830,432.64) (28,321,891.24)Income from participating interests 0.00 1,065.23
derived from affiliated undertakings 0.00 0.00
other income from participating interests 0.00 1,065.23
Income from other investments and loans forming part of the fixed assets 0.00 0.00
derived from affiliated undertakings 0.00 0.00
other income not included under derived from affiliated undertakings 0.00 0.00
Other interest receivable and similar income (Note 32) 29,127,552.40 26,989,937.30
derived from affiliated undertakings 0.00 0.00
other interest and similar income 29,127,552.40 26,989,937.30
Share of profit or loss of undertakings accounted for under the equity method (Note 8) (37,212,862.72) (33,899,737.44)
Value adjustments in respect of financial assets and of investments held as current assets (Note 7) (1,408,976.54) 29,436,812.67
Interest payable and similar expenses (Note 33) (51,336,145.78) (50,849,969.00)
concerning affiliated undertakings 0.00 0.00
other interest and similar expenses (51,336,145.78) (50,849,969.00)
TAXES AND RESULT OF THE PERIOD
Tax on profit or loss (Note 34) (27,102,668.82) (32,271,406.48)
Profit or loss after taxation 40,841,145.04 76,458,058.74
Other taxes not shown above (Note 35) (17,053,506.47) (13,929,691.76)
Profit or loss for the period before minority interests 23,787,638.57 62,528,366.98
Minority interests 1,572,962.78 (1,340,408.23)
PROFIT OR LOSS FOR THE PERIOD AFTER MINORITY INTERESTS 25,360,601.35 61,187,958.75
The accompanying notes form an integral part of these consolidated accounts. (Expressed in euro)

17
CONSOLIDATED CASH FLOW ANALYSIS
Jan De Nul GROUP * Registered office: Capellen – R.C.S. Luxembourg: B 73.723
2020 2019
CASH AT BANK AND IN HAND & INVESTMENTS AT BEGINNING OF PERIOD 711,784,269.24 614,073,835.61
+ Operational Cash Flow 220,021,145.74 224,340,295.27
+ Change in Working Capital 30,468,099.20 (537,682.02)
+ Cash Flow Investments (342,037,701.45) (250,381,016.99)
+ Cash Flow Financial Operations (64,982,600.35) 124,288,837.37
CASH AT BANK AND IN HAND & INVESTMENTS AT END OF PERIOD 555,253,212.38 711,784,269.24
+ Result of the year 25,360,601.35 61,187,958.75
- Minority Interests (1,572,962.78) 1,340,408.23
- Share in result of companies consolidated using the equity method 27,512,831.86 (44,216,291.76)
+ Depreciation and amounts written off on intangible and tangible fixed assets 197,918,841.25 194,731,205.37
+ Depreciation and amounts written off on current assets 9,201,057.15 12,007,161.66
+ Depreciation and amounts written off on financial assets 1,408,975.54 (29,463,288.31)
+ Changes in Provisions (39,808,198.63) 42,145,258.24
+ Control acquisitions 0.00 (13,392,116.91)
OPERATIONAL CASH FLOW 220,021,145.74 224,340,295.27
+ Change in Short-term Debt (179,351,138.70) 236,684,183.43
+ Change in Deferred income 11,259,792.20 (720,047.31)
- Change in Short-term Receivables 203,204,471.16 (139,738,355.94)
- Change in Deferred Charges 11,116,502.15 (29,733,954.03)
- Change in Stock (15,761,527.61) (67,029,508.17)
CHANGE IN WORKING CAPITAL 30,468,099.20 (537,682.02)
- Investments in Intangible Fixed Assets (243,200.27) (82,238,769.82)
- Investments in Tangible Fixed Assets (344,152,150.53) (256,255,540.16)
- Investments in Financial Assets 0.00 0.00
+ Disuse of Tangible Fixed Assets & Exchange Rate Differences 3,560,384.74 66,469,156.72
- Change in Financial Assets (1,202,735.39) 22,284,136.27
- Increase in Participations of Companies consolidated by net Equity method 0.00 0.00
- Acquisition of subsidiaries net of cash acquired 0.00 (640,000.00)
- Regularisations and other Transactions 0.00 0.00
CASH FLOW INVESTMENTS (342,037,701.45) (250,381,016.99)
+ Change in Consolidation and Conversion differences (2,081,825.09) 23,945,503.02
+ Change in Long-term Debt (62,900,775.26) 100,343,334.35
- Change in Long-term Receivables 0.00 0.00
CASH FLOW FINANCIAL OPERATIONS (64,982,600.35) 124,288,837.37
The cashflow analysis is not part of the audited financial statements. (Expressed in euro) The accompanying notes form an integral part of these consolidated accounts.
*JAN DE NUL GROUP is the trade name for Sofidra sa
CONSOLIDATED BALANCE SHEET.

18 2020 FINANCIAL REPORT.
2. Group structure & Consolidation area
Jan De Nul GROUP * Registered office: 34-36, Parc d’Activités L-8308 Capellen – R.C.S. Luxembourg: B 73.723
THE HOLD INTERESTS OF THE GROUP IN CONSOLIDATED SUBSIDIARIES ARE (SITUATION AT THE END OF THE RESPECTIVE YEARS): 2020 2019
COMPANIES CONSOLIDATED FOLLOWING THE GLOBAL INTEGRATION METHOD
Jan De Nul Mauritius Ltd, Mauritius 100.00 % 100.00 %
Port Louis Dredging Company Ltd, Mauritius 100.00 % 100.00 %
Jan De Nul Dredging Ltd, Mauritius 100.00 % 100.00 %
Jan De Nul Pacific Ltd, Mauritius 100.00 % 100.00 %
Jan De Nul (Mozambique) Ltda, Mozambique 100.00 % 100.00 %
Jan De Nul Dredging M.E. Ltd, Cyprus 100.00 % 100.00 %
Jan De Nul Indian Ocean Ltd, Seychelles 100.00 % 100.00 %
Barbarons Maritime Ltd, Seychelles 100.00 % 100.00 %
Jan De Nul Central America Ltd., Bahamas 100.00 % 100.00 %
Kina Ltd, Seychelles 100.00 % 100.00 %
Malaysian Marine Services Ltd, Malaysia 100.00 % 100.00 %
Universal Dredging & Reclamation Corporation Ltd, Mauritius 100.00 % 100.00 %
Jan De Nul Interamerica S.A., Uruguay 100.00 % 100.00 %
Jan De Nul (Mascareignes) Ltd, (formerly Envisan Ltd) Mauritius 100.00 % 100.00 %
Port Louis Maritime Co. Ltd, Mauritius 100.00 % 100.00 %
Jan De Nul nv, Belgium 99.07 % 99.07 %
Jan De Nul (U.K.) Ltd, United Kingdom 99.07 % 99.07 %
Jan De Nul (Australia) Pty Ltd, Australia 99.07 % 99.07 %
Jan De Nul (Phils.) Inc, Philippines 99.07 % 99.07 %
Mest- en Afvalverwerking N.V., Belgium 99.08 % 99.08 %
Sodraco International S.A.S., France 99.07 % 99.07 %
Terminal Eight Marine Works Ltd, China 99.53 % 99.53 %
Jan De Nul (Italia) S.p.A., Italy 99.08 % 99.08 %
Jan De Nul Saudi Arabia Co. Ltd, Saudi Arabia 99.07 % 99.07 %
Jan De Nul Maritime & Constructions Services Co Ltd, Lybia 99.07 % 99.07 %
Jan De Nul Nassbaggerei und Wasserbau GmbH, Germany 99.07 % 99.07 %
Jan De Nul Ghana Ltd, Ghana 99.07 % 99.07 %
Vidar Crewing Luxembourg S.A., Luxembourg 99.07 % 99.07 %
Vidar Shipowning Luxembourg S.A., Luxembourg 100.00 % 100.00 %
NOTES TO THE CONSOLIDATED ACCOUNTS AS OF DECEMBER 31, 2020
1. Principal activities
JAN DE NUL GROUP* (the Group) is a group of companies active in dredging, civil, environmental and offshore works.
The parent company Sofidra sa (the Company) is incorporated as a Société Anonyme on December 29, 1999 for an unlimited period. The Company is registered in Capellen under reference B 73.723.
The Group’s financial year starts on January 1 and ends on December 31 of each year.
*JAN DE NUL GROUP is the trade name of Sofidra sa registered at the Répertoire Général des Personnes Morales in Luxembourg on March 31, 2002.

19
Algemene Ondernemingen Soetaert N.V., Belgium 99.07 % 99.07 %
Soetaert France S.A.S., France 99.07 % 99.07 %
Jan De Nul Constructlux S.A., Luxembourg 99.44 % 99.44 %
Travaux Maritimes Nador S.A.R.L., Morocco 99.07 % 99.07 %
Arenas Argentinas Del Parana S.A., Argentina 99.54 % 99.54 %
Jan De Nul Altyapi Hizmetleri A.S., Turkey 99.07 % 99.07 %
Jan De Nul Kazakhstan LLP, Kazakhstan 99.07 % 99.07 %
Jan De Nul Bénin S.A., Benin 99.07 % 99.07 %
Canal de Guayaquil CGU S.A., Ecuador 99.16 % 99.16 %
Payra Dredging Company Ltd, Bangladesh 99.07 % 99.07 %
Vasco S.A., Luxembourg 100.00 % 100.00 %
Dragalux S.A., Luxembourg 100.00 % 100.00 %
Dracomar S.A., Luxembourg 100.00 % 100.00 %
Vole au Vent S.A.S., Luxembourg 100.00 % 100.00 %
Adhémar & Bernoulli S.A., Luxembourg 100.00 % 100.00 %
Cunha S.A., Luxembourg 100.00 % 100.00 %
Sanderus S.A., Luxembourg 100.00 % 100.00 %
Vlaamse Bagger Maatschappij N.V., Belgium 100.00 % 100.00 %
PSR Brownfield Developers N.V., Belgium 100.00 % 100.00 %
Lummerzheim & Co. N.V., Belgium 100.00 % 100.00 %
Cortoria N.V., Belgium 100.00 % 100.00 %
PSR 8870 N.V., Belgium 100.00 % 100.00 %
Zennepoort N.V., Belgium 100.00 % 100.00 %
PSR 1830.01 N.V., Belgium 100.00 % 100.00 %
PSR 2850 N.V., Belgium 100.00 % 100.00 %
De Lediaan B.V., Belgium 100.00 % 0.00 %
Codralux S.A., Luxembourg 100.00 % 100.00 %
Dredging and Contracting Rotterdam B.V., Netherlands 100.00 % 100.00 %
Jan De Nul Ukraine LLC, Ukraine 100.00 % 100.00 %
Jan De Nul Guatemala S.A., Guatemala 100.00 % 100.00 %
Dredging and Maritime Management S.A., Luxembourg 100.00 % 100.00 %
Jan De Nul Dredging N.V., Belgium 100.00 % 100.00 %
Mexicana de Dragados S.A. de C.V., Mexico 99.54 % 99.54 %
Servicios de Dragados S.A. de C.V., Mexico 100.00 % 100.00 %
Dredging and Reclamation Jan De Nul Ltd, Nigeria 100.00 % 100.00 %
Envisan N.V., Belgium 100.00 % 100.00 %
Envisan France S.A.S., France 100.00 % 100.00 %
Jan De Nul (Singapore) Pte Ltd, Singapore 100.00 % 100.00 %
Jan De Nul Dredging India Pvt Ltd, India 100.00 % 100.00 %
Compania Chilena de Dragados S.A., Chile 100.00 % 100.00 %
Compania Sud. Americana de Dragados S.A., Argentina 99.91 % 99.91 %
Jan De Nul (Malaysia) Sdn. Bhd, Malaysia 100.00 % 100.00 %
PT Idros Services, Indonesia 100.00 % 100.00 %
Jan De Nul Monaco SAM, Monaco 100.00 % 100.00 %
Jan De Nul Portugal LDA, Portugal 100.00 % 100.00 %
CONSOLIDATED BALANCE SHEET.

20 2020 FINANCIAL REPORT.
European Dredging Company S.A., Luxembourg 100.00 % 100.00 %
Willem S.A., Luxembourg 100.00 % 100.00 %
Isaac Newton S.A., Luxembourg 100.00 %(*) 100.00 %(*)
Komarine Engineering & Construction Co. Ltd, Korea 100.00 % 100.00 %
Jan De Nul Do Brasil Dragagem Ltda, Brasil 100.00 % 100.00 %
Taillevent S.A., Luxembourg 100.00 % 100.00 %
Albuquerque S.A., Luxembourg 100.00 % 100.00 %
Jan De Nul Dredging Middle East FZE, UAE 100.00 % 100.00 %
Siam Dredging and Reclamation Ltd, Thaïland 100.00 % 100.00 %
Jan De Nul Luxembourg S.A., Luxembourg 100.00 % 100.00 %
Mediudra S.R.L., Romania 100.00 % 100.00 %
Sofidra Shipping S.C.A., Luxembourg 100.00 % 100.00 %
Jan De Nul Panama S.A., Panama 100.00 % 100.00 %
Maritime and Construction Management C.V., Belgium 100.00 % 100.00 %
Toa (Lux) S.A., Luxembourg 81.00 % 81.00 %
Ortelius S.A., Luxembourg 100.00 % 0.00 %
Van Rubroeck S.A., Luxembourg 100.00 % 0.00 %
(*) Per application of the substance over form principle – see note 3.2
COMPANIES CONSOLIDATED FOLLOWING THE PROPORTIONAL INTEGRATION METHOD
Hidrovia S.A., Argentina 49.53 % 49.53 %
Scaldis Salvage & Marine Contractors N.V., Belgium 20.43 % 20.43 %
Terranova N.V., Belgium 33.18 % 49.77 %
Terranova Solar N.V., Belgium 22.40 % 22.40 %
Boskalis Jan De Nul – Dragagens E Afins, Lda, Angola 49.53 % 49.53 %
Travaux Maritimes Tanger Med S.A.R.L., Morocco 49.53 % 49.53 %
Denderoever N.V., Belgium 50.00 % 50.00 %
Circul 2020 N.V., Belgium 24.77 % 24.77 %
Meurop 2020 N.V., Belgium 50.00 % 50.00 %
Denderoever Properties I N.V., Belgium 50.00 % 0.00 %
Denderoever Properties II N.V. , Belgium 50.00 % 0.00 %
Marine Construction and Dredging LLP, Kazakhstan 49.53 % 0.00 %
Socaré B.V., Belgium 50.00 % 0.00 %
Socaré Offices B.V., Belgium 50.00 % 0.00 %
Cuesmes Triage B.V., Belgium 49.53 % 0.00 %
Various Joint ventures variable variable
COMPANIES CONSOLIDATED FOLLOWING THE NET EQUITY METHOD
R-1 Consortium Inc, Philippines 39.23 % 39.23 %
Southern Peninsula Dredging Sdn Bhd, Malaysia 30.00 % 30.00 %
Grupo Unidos Por El Canal S.A., Panama 14.86 % 14.86 %
Normalux Maritime S.A., Luxembourg 37.50 % 37.50 %
Neo Legia S.A., Belgium 25.00 % 25.00 %
SAS Van Vreeswijk Maintenance B.V., Belgium 19.81 % 19.81 %

21
MODIFICATION IN THE CONSOLIDATION AREA – CURRENT YEAR
During the year 2020, the following modifications have been performed in the consolidation area:
• Ortelius S.A., Luxembourg, Van Rubroeck S.A., Luxembourg, Cuesmes Triage B.V., Belgium, De Lediaan B.V., Belgium, Marine Construction and Dredging LLP, , Kazakhstan, Socaré B.V., Belgium and Socaré Offices B.V., Belgium have been incorporated during the year by group‘s subsidiaries.
• The percentage of ownership in Terranova N.V. has changed during the year.
MODIFICATION IN THE CONSOLIDATION AREA – PRIOR YEAR
During the year 2019, the following modifications have been performed in the consolidation area:
• The Group has acquired shares in Toa (Lux) S.A. from a third party so that the Group gains control over this subsidiary.
• Cunha S.A., Luxembourg and Sanderus S.A., Luxembourg, Denderoever Properties I N.V., Belgium and Denderoever Properties II N.V., Belgium, have been incorporated during the year by group‘s subsidiaries.
• The companies Jan De Nul nv FZE, Nigeria, Al Idrisi S.A., Luxembourg, Dias S.A., Luxembourg, Vitus Bering S.A., Luxembourg and Magalhaes S.A., Luxembourg have been liquidated.
CONSOLIDATED BALANCE SHEET.

22 2020 FINANCIAL REPORT.
3. Summary of significant accounting policies
3.1 Principles of consolidation
The consolidated accounts are prepared in accordance with the Section XVI of the amended Luxembourg law on commercial companies dated August 10, 1915 (the Law). The consolidated accounts are prepared using the going concern principle.
Date of first consolidation
The Company acquired in 2000 Jan De Nul Mauritius Ltd and subsidiaries and in 2001 Jan De Nul nv, Belgium and subsidiaries. In both operations, ships included under fixed assets were revaluated. The revaluation was based on a valuation report issued by an independent expert. No deferred taxes were accounted for on this reevaluation of assets. These operations restructured the initial Group Jan De Nul nv and subsidiairies, Belgium. Date of the first consolidation is fixed at the fiscal year starting January 1st, 2001. The revaluations have been fully depreciated as of December 31, 2019 and 2020.
Companies consolidated following the global integration method
Subsidiaries are in principle all entities (including special purpose entities) over which the Group has the power to govern the financial and operating policies generally accompanying a shareholding of more than one half of voting rights. The existence and effect of potential voting rights currently exercisable or convertible are considered when assessing whether the Group controls another entity.
Subsidiaries are consolidated using the global integration method. Subsidiaries are consolidated from the date on which control is transferred to the Group. They are decon-solidated from the date control ceases.
Intercompany transactions, balances and unrealized gains on transactions between group companies are eliminated. Accounting policies of subsidiaries have been exchanged where necessary to ensure consistency with the policies adopted by the Group.
Minority interests are that portion of the profit or loss and net assets of a subsidiary attributable to equity interests that are not owned, directly or indirectly through subsidiaries, by the parent. Equity attributable to the interest of minority shareholder interests in subsidiaries is shown separately in the consolidated annual accounts.
Companies consolidated following the proportional integration method
Joint ventures are those entities over whose activities the Group has joint control, established by contractual agreement. Joint Ventures and Jointly controlled entities are accounted for using the proportional consolidation method.
Unrealized gains on transactions between the Group and its Joint Ventures and jointly controlled entities are eliminated to the extent of the Group’s interest in these entities. Unrealized losses are also eliminated unless the transaction provides evidence of an impairment of the asset transferred. Accounting policies of Joint Ventures and jointly controlled entities have been changed where necessary to ensure consistency with the policies adopted by the Group.
Companies consolidated following the net equity method
Associates are all entities over which the Group has significant influence but not control, generally accompanying a shareholding of between 20% and 50% of the voting rights. Investments in associates are accounted for using the equity method of accounting and are initially recognized at cost.
The Group’s share of its associates’ post acquisition profits is recognized in the profit and loss account under the caption Share of profit or loss of undertakings accounted for under the equity method. The cumulative post-acquisition movements are adjusted against the carrying amount of the investment. When the Group’s share of losses in an associate equals or exceeds its interest in the associate, the Group recognizes further losses under the caption Other provisions.
Unrealized gains on transactions (disposal of fixed assets or inventory) between the Group and its associates are eliminated to the extent of the Group’s interest in the associates. Unrealized losses are also eliminated unless the transaction provides evidence of an impairment of the asset transferred. Accounting policies of associates have been changed where necessary to ensure consistency with the policies adopted by the Group.
3.2 Accounting methods
Foreign currencies
a) The Company’s accounts are kept in Euros (EUR) and the consolidated accounts are expressed in this currency. Transactions in any currency other than the EUR are translated at exchange rates fixed monthly by the Group. At balance sheet date, the translation is done based on the following methods:
- Banks are translated at exchange rates prevailing at the balance sheet date;

23
- For Debtors and Creditors, realized exchange gains and losses are recorded in the profit and loss account as well as the unrealized exchange losses; unrealized exchange gains are booked in a balance sheet account presented under Other creditors;
- Other accounts are translated at the historical exchange rate.
b) The annual accounts of the subsidiaries kept in another currency than EUR are translated – in order to include those in the consolidated annual accounts – as follows:
- Assets and liabilities other than Capital and reserves are translated at the exchange rates prevailing at the balance sheet date;
- Capital and reserves are translated at rates prevailing at the first consolidation or at historical rates;
- Income and charges are translated at the average exchange rate of the year.
Gains and losses resulting from the translation of capital, reserves, income and charges into EUR are accumulated in a separate account under shareholders’ equity called Translation differences.
Exchange losses and exchange gains resulting from the elimination of intercompany debtors and creditors accounts are recorded in the Other interest and similar expenses or Other interest and similar income captions respectively.
c) Transactions in subsidiaries holding their accounts in a currency in hyperinflation are converted using a specific method. A currency is considered in hyperinflation if the cumulative inflation over a 3 year period approaches or is in excess of 100%. The amounts in the balance sheet that are not already expressed in EUR are restated following a specific method as follows:
- The intangible, tangible and financial fixed assets, the long term loan receivables and payables as well as the deferred tax positions are restated by applying a general price index; the counterpart of the impact of this retreatment is reflected under Other interest and similar income;
- All items in the Profit and Loss are restated by applying a general price index from the dates when the items of income and expenses were initially recorded; the counterpart of the impact of this retreatment is reflected under Other interest and similar income;
- The Equity are restated by applying a general price index and its impact is included under Translation differences.
Acquisition differences
Up to 2012, positive and negative acquisition differences related to the acquisition of subsidiaries are recorded under Other reserves in the Capital and reserves. Starting from 2013, positive acquisition differences related to the acquisition of subsidiaries are allocated to certain assets and/or liabilities, and for the unallocated portion to Goodwill (within the Intangible assets caption); negative acquisition differences are recorded under Other reserves in the Capital and reserves caption. The Goodwill is depreciated over a 5 years period.
Where the Group considers that Goodwill has suffered a durable depreciation in value, an additional write-down is recorded in order to reflect this loss.
Formation expenses
Formation expenses are entirely depreciated during the year of their acquisition.
Intangible and tangible assets
Vessels that were brought in during the first year of con-solidation (2001) are recognized at the revaluated acquisition cost, while ships acquired since then are recognized at acquisition cost.
Intangible and tangible assets are recognized at acquisition cost, including the expenses incidental thereto or at production cost. Replacement spare parts for vessels, which are constantly being replaced and whose overall value is of secondary importance to the Group are shown under Plant and machinery at a fixed quantity and value, as the quantity, value and composition thereof do not vary materially; further acquisition of spare parts for vessels are booked as charges.
Vessels are depreciated on a linear or degressive method over their expected lifetime or a period of 12 years to 20 years, whichever is the shortest. Intangible and other tangible fixed assets are depreciated using a linear or degressive method over their expected lifetime. Land and assets under construction are not depreciated.
Where the Group considers that an intangible or tangible asset has suffered a durable depreciation in value, an additional write-down is recorded in order to reflect this loss. These value adjustments are not continued if the reasons for which the value adjustments were made have ceased to apply.
CONSOLIDATED BALANCE SHEET.

24 2020 FINANCIAL REPORT.
Financial assets
Financial assets represent participations in non-consoli-dated companies, deposits and long-term loans. Shares in participating interests are recognized at purchase price including the expenses incidental thereto. Deposits and long-term loans are recognized at nominal value including the expenses incidental thereto.
In case of a durable depreciation in value according to the opinion of the Board of Directors, value adjustments are made in respect of financial assets, so that they are valued at the lower figure to be attributed to them at the balance sheet date. These value adjustments are not continued if the reasons for which the value adjustments were made have ceased to apply.
Stocks
Stocks represent raw materials, heavy material held for resale, work in progress, finished goods and merchandise.
Stocks of Raw materials and consumables are valued at the lower of purchase price or market value. A value adjustment is recorded where the economic value is below the purchase price. These value adjustments are not continued if the reasons for which the value adjustments were made have ceased to apply.
Heavy material held for resale represent steel pipes that are not allocated to a particular site at year end and are available for sale, out of the Group. Heavy material held for resale is included under the Raw materials and consumables caption. Heavy material held for resale is recognized at the net book value valid at the date of transfer from tangible assets (or stock) to stock. A value adjustment is recorded where the economic value is below the purchase price. These value adjustments are not continued if the reasons for which the value adjustments were made have ceased to apply.
Finished goods and goods for resale represent mainly brownfields pieces of land acquired and the related cost for their rehabilitation. The gross book value includes the initial acquisition price paid and the costs directly attributable to the rehabilitation of the land. A value adjustment is recorded where the economic value is below the net book value. These value adjustments are not continued if the reasons for which the value adjustments were made have ceased to apply.
Work and contracts in progress are valued at cost (purchase or production cost) or at net realisable value when this is lower. The production cost comprises all direct and indirect costs incurred in bringing the inventories to their completion at balance sheet date and this corresponds with the estimated sales prices in normal circumstances, minus the handling, marketing and distribution costs (net realizable value). Construction and dredging contracts are valued according to the Percentage of Completion method based
on cost to cost – whereby the result is recognized in accordance with progress of the works. Expected losses are immediately recognized as an expense.
Debtors
Debtors are recognized at their nominal value. They are subject to value adjustments where their recovery is compromised. These value adjustments are not continued if the reasons for which the value adjustments were made have ceased to apply.
Transferable securities
Transferable securities are valued at the lower of purchase cost, including expenses incidental thereto and calculated on the basis of weighted average prices method, expressed in the currency in which the annual accounts are prepared and market value. A value adjustment is recorded where the market value is lower than the purchase cost. These value adjustments are not continued if the reasons for which the value adjustments were made have ceased to apply.
The market value corresponds to:
- the last available quote on the valuation day for transferable securities listed on a stock exchange or dealt in on another regulated market;
- the probable realisation value estimated with care and in good faith by the Board of Directors
- for transferable securities not listed on a stock exchange or not dealt in on another regulated market and for transferable securities listed on a stock exchange or dealt in on another regulated market where the latest quote is not representative.
Prepayments
This asset item includes expenditure incurred during the financial year but relating to a subsequent financial year.
Provisions
Provisions are intended to cover losses or debts the nature of which is clearly defined and which, at the date of the balance sheet are either likely to be incurred or certain to be incurred but uncertain as to their amount or as to the date on which they will arise.
Deferred taxes
Deferred taxes are recognized for temporary differences due to consolidation retreatments that will result in deductible or taxable amounts or from tax losses carried forward. Deferred tax assets are fully impaired except if

25
they can be offset against statutory tax accruals and/or deferred tax liabilities.
Creditors
Creditors are valued at their nominal value.
Deferred income
This liability item includes income received during the financial year or previous years but relating to a subsequent financial year. Among these, Group’s technical contribution to some vessels invoiced by the Group to the shipyard in charge of the ship’s construction are retreated from the revenues to the deferred income and amortized at a rate based on the related tangible asset’s residual lifetime.
Deferred income also includes profit on intercompany disposals of inventory and of Heavy material held for resale which cannot be individually identified. These positions are recognized in revenues over a 2.5 years period. This method is intended to deal appropriately with profits on intercompany disposals of fixed assets or inventory items that are whether fungible whether difficult to retreat individually over their remaining useful lifetime (among others the stock of pipes).
Net turnover
The Net turnover comprises the amounts derived from the sale of products and the provision of services falling within the Group’s ordinary activities, after deductions of sales rebates and of value added tax and other taxes directly linked to the turnover. The method of revenue recognition is the percentage of completion method based on cost to cost.
Derivatives
Unrealized losses and gains on derivatives subscribed for hedging of assets or liabilities that are present in the balance
sheet at year end (example: Forex deals hedging trade debtors in foreign currency that are booked at year end and will be collected on next year) are recognized in the profit and loss account concommitently with the revenue/loss recognition of the hedged asset or liability. Unrealized losses and gains on derivatives subscribed for hedging of transactions occurring in the future and – as such – not present in the balance sheet at year end except where they would correct concommitent revenue/loss recognition of the hedged asset or liability (example: Energy swaps in relation with next year’s fuel purchases – Forex deals hedging trade debtors not yet booked at year end but expected to be recognized on next year) – these are not accrued but are mentioned in off balance sheet commitments.
Unrealized losses on derivatives not subscribed for hedging purpose are accrued for and recognized in profit and loss at year end.
Unrealized gains on derivatives not subscribed for hedging purpose are not recognized.
Realized losses and gains on derivatives are recognized in profit and loss account during the year of their realization.
Substance over form
The presentation of the amounts recorded on the consolidated balance sheet and consolidated profit and loss account should refer to the substance of the operation rather than its legal form.
This principle has been applied to the consolidation method applied to certain subsidiaries which are – based on the voting rights – controlled by a third party but whose effective control is exercised by the Group.
CONSOLIDATED BALANCE SHEET.

26 2020 FINANCIAL REPORT.
4. Concessions, patents, licences, trademarks & similar rights and assets
THE EVOLUTION OF CONCESSIONS, PATENTS, LICENCES, TRADEMARKS & SIMILAR RIGHTS AND ASSETS IS AS FOLLOWS: 2020 2019
ACQUISITION COST
Beginning of the year 95,744,798.73 14,308,263.66
Impact of foreign exchange (7,824,584.15) (159,753.24)
Change of consolidation perimeter 0.00 0.00
Increase of the year 243,200.27 82,238,769.82
Decrease of the year (14,866.23) (642,481.51)
ACQUISITION COST – END OF THE YEAR 88,148,548.62 95,744,798.73
VALUE CORRECTION
Beginning of the year (14,203,262.62) (12,349,283.02)
Impact of foreign exchange 1,451,029.50 (160,059.04)
Change of consolidation perimeter 0.00 0.00
Increase of the year (8,118,237.31) (1,988,516.04)
Decrease of the year 4,712.51 294,595.48
VALUE CORRECTION – END OF THE YEAR (20,865,757.92) (14,203,262.62)
NET BOOK VALUE – END OF THE YEAR 67,282,790.70 81,541,536.11
In 2019, the Group activated an asset consisting in a concession right over the exploitation of the Canal de Guayaquil in Ecuador, over a 25 years period starting in 2019. The activated amount of 92,006,309.15 USD consists in the production cost (including a reasonable portion of indirect costs) of the deepening works of the canal, performed by the Group. The counterpart of this activation lies in the Profit and loss for the year 2019 under the caption Work performed by the undertaking for its own purposes and capitalized for an amount of 81,899,865.72 EUR. Applying a prudent approach, the Management depreciates this asset over a 10 years period, starting in November 2019. The asset has been subject to an impairment testing concluding that no impairment has to be deducted from the net book value as of December 31, 2019 and 2020.
5. Goodwill
THE EVOLUTION OF GOODWILL IS AS FOLLOWS: 2020 2019
ACQUISITION COST
Beginning of the year 12,746,053.50 12,746,053.50
Impact of foreign exchange 0.00 0.00
Increase of the year 0.00 0.00
Decrease of the year 0.00 0.00
ACQUISITION COST – END OF THE YEAR 12,746,053.50 12,746,053.50
VALUE CORRECTION
Beginning of the year (12,746,053.50) (12,746,053.50)
Impact of foreign exchange 0.00 0.00
Increase of the year 0.00 0.00
Decrease of the year 0.00 0.00
VALUE CORRECTION – END OF THE YEAR (12,746,053.50) (12,746,053.50)
NET BOOK VALUE – END OF THE YEAR 0.00 0.00
27CONSOLIDATED BALANCE SHEET.
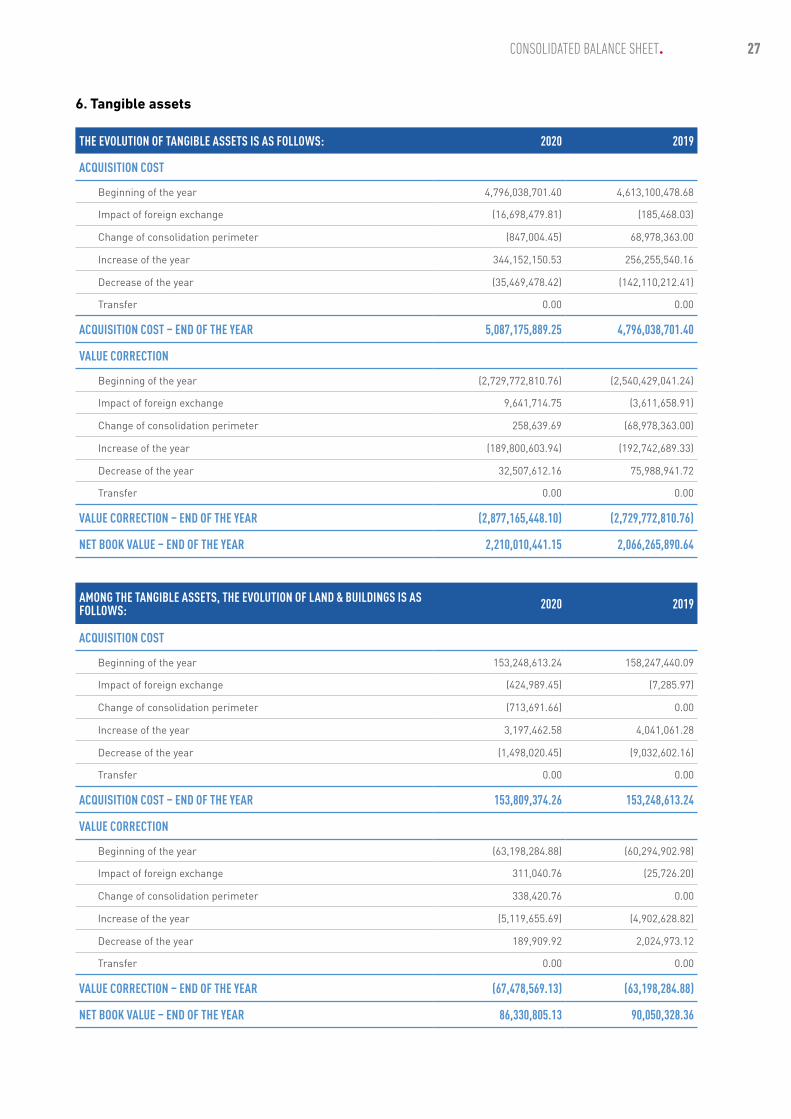
6. Tangible assets
THE EVOLUTION OF TANGIBLE ASSETS IS AS FOLLOWS: 2020 2019
ACQUISITION COST
Beginning of the year 4,796,038,701.40 4,613,100,478.68
Impact of foreign exchange (16,698,479.81) (185,468.03)
Change of consolidation perimeter (847,004.45) 68,978,363.00
Increase of the year 344,152,150.53 256,255,540.16
Decrease of the year (35,469,478.42) (142,110,212.41)
Transfer 0.00 0.00
ACQUISITION COST – END OF THE YEAR 5,087,175,889.25 4,796,038,701.40
VALUE CORRECTION
Beginning of the year (2,729,772,810.76) (2,540,429,041.24)
Impact of foreign exchange 9,641,714.75 (3,611,658.91)
Change of consolidation perimeter 258,639.69 (68,978,363.00)
Increase of the year (189,800,603.94) (192,742,689.33)
Decrease of the year 32,507,612.16 75,988,941.72
Transfer 0.00 0.00
VALUE CORRECTION – END OF THE YEAR (2,877,165,448.10) (2,729,772,810.76)
NET BOOK VALUE – END OF THE YEAR 2,210,010,441.15 2,066,265,890.64
AMONG THE TANGIBLE ASSETS, THE EVOLUTION OF LAND & BUILDINGS IS AS FOLLOWS: 2020 2019
ACQUISITION COST
Beginning of the year 153,248,613.24 158,247,440.09
Impact of foreign exchange (424,989.45) (7,285.97)
Change of consolidation perimeter (713,691.66) 0.00
Increase of the year 3,197,462.58 4,041,061.28
Decrease of the year (1,498,020.45) (9,032,602.16)
Transfer 0.00 0.00
ACQUISITION COST – END OF THE YEAR 153,809,374.26 153,248,613.24
VALUE CORRECTION
Beginning of the year (63,198,284.88) (60,294,902.98)
Impact of foreign exchange 311,040.76 (25,726.20)
Change of consolidation perimeter 338,420.76 0.00
Increase of the year (5,119,655.69) (4,902,628.82)
Decrease of the year 189,909.92 2,024,973.12
Transfer 0.00 0.00
VALUE CORRECTION – END OF THE YEAR (67,478,569.13) (63,198,284.88)
NET BOOK VALUE – END OF THE YEAR 86,330,805.13 90,050,328.36

28 2020 FINANCIAL REPORT.
AMONG THE TANGIBLE ASSETS, THE EVOLUTION OF PLANT & MACHINERY IS AS FOLLOWS: 2020 2019
ACQUISITION COST
Beginning of the year 4,244,129,320.21 4,063,475,009.36
Impact of foreign exchange (15,380,976.29) 3,215,872.44
Change of consolidation perimeter (133,312.79) 68,978,363.00
Increase of the year 100,889,813.47 28,361,598.71
Decrease of the year (28,518,171.71) (79,044,560.88)
Transfer 195,335,068.69 159,143,037.58
ACQUISITION COST – END OF THE YEAR 4,496,321,741.58 4,244,129,320.21
VALUE CORRECTION
Beginning of the year (2,624,533,149.57) (2,440,056,675.27)
Impact of foreign exchange 8,683,091.81 (3,323,632.65)
Change of consolidation perimeter (79,781.07) (68,978,363.00)
Increase of the year (177,964,894.71) (184,374,800.51)
Decrease of the year 27,971,584.19 72,200,321.86
Transfer 0.00 0.00
VALUE CORRECTION – END OF THE YEAR (2,765,923,149.35) (2,624,533,149.57)
NET BOOK VALUE – END OF THE YEAR 1,730,398,592.23 1,619,596,170.64
AMONG THE TANGIBLE ASSETS, THE EVOLUTION OF OTHER FIXTURES AND FITTINGS, TOOLS AND EQUIPMENT IS AS FOLLOWS: 2020 2019
ACQUISITION COST
Beginning of the year 64,254,890.74 61,456,199.06
Impact of foreign exchange (892,514.06) 188,556.76
Change of consolidation perimeter 0.00 0.00
Increase of the year 7,079,139.57 7,951,841.18
Decrease of the year (5,226,563.14) (5,341,706.26)
Transfer 0.00 0.00
ACQUISITION COST – END OF THE YEAR 65,214,953.11 64,254,890.74
VALUE CORRECTION
Beginning of the year (42,041,376.23) (40,077,462.89)
Impact of foreign exchange 647,582.18 (262,300.09)
Change of consolidation perimeter 0.00 0.00
Increase of the year (6,715,910.41) (3,465,260.00)
Decrease of the year 4,345,974.92 1,763,646.75
Transfer 0.00 0.00
VALUE CORRECTION – END OF THE YEAR (43,793,729.54) (42,041,376.23)
NET BOOK VALUE – END OF THE YEAR 21,451,223.57 22,213,514.51

29CONSOLIDATED BALANCE SHEET.
AMONG THE TANGIBLE ASSETS, THE EVOLUTION OF PAYMENTS ON ACCOUNT AND TANGIBLE ASSETS IN THE COURSE OF CONSTRUCTION IS AS FOLLOWS: 2020 2019
ACQUISITION COST
Beginning of the year 334,405,877.13 329,921,830.07
Impact of foreign exchange 0.00 (3,582,611.22)
Change of consolidation perimeter 0.00 0.00
Increase of the year 232,985,734.90 215,901,038.98
Decrease of the year (226,723.12) (48,691,343.12)
Transfer (195,335,068.69) (159,143,037.58)
ACQUISITION COST – END OF THE YEAR 371,829,820.22 334,405,877.13
VALUE CORRECTION
Beginning of the year 0.00 0.00
Impact of foreign exchange 0.00 0.00
Change of consolidation perimeter 0.00 0.00
Increase of the year 0.00 0.00
Decrease of the year 0.00 0.00
Transfer 0.00 0.00
VALUE CORRECTION – END OF THE YEAR 0.00 0.00
NET BOOK VALUE – END OF THE YEAR 371,829,820.22 334,405,877.13
The Payments on account and tangible assets in the course of construction include the acquisition value of the vessel under construction Willem van Rubroeck. The main part of the decrease of the year 2019 is related to this vessel and is explained as follows.
Over 2018 and 2019, the shipyard Uljanik d.d. was confronted with serious liquidity problems. The Group and Uljanik d.d. previously entered into a shipbuilding contract for the construction of the vessel Willem van Rubroeck. A rescue plan was launched by the Croatian government (supported by the EU) with around 100 million EUR of liquidity input. The Group and Uljanik d.d. extended the shipbuilding contract until January 2019. However progress stalled and Uljanik d.d. did not have sufficient resources anymore to complete the construction of the vessel. As a result, the Group terminated the shipbuilding contract on January 23, 2019. From that point on, negotiations started with Uljanik d.d. and the different stakeholders (the guaranteeing banks and the counter-guaranteeing Croatian government) to take over the vessel subject to specific conditions.
In April 2019, the Group called on the refund guarantees to safeguard its contractual rights and securities. This resulted in a full and unconditional repayment of the disbursed construction milestone payments of the Group by the guaranteeing banks end of May 2019. On July 22, 2019, the bankruptcy court has published its decision on a public sale of the vessel via an electronic public auction organized by the Croatian Financial Agency (FINA). On October 23, 2019, the Group submitted the highest bid in the public auction. The main part of the book value of the vessel is constituted by this bid, constituting the new acquisition value of the vessel. Except for interests received under the refund guarantees, there is no impact on the profit and loss accounts.

30 2020 FINANCIAL REPORT.
AMONG THE PLANT & MACHINERY, THE EVOLUTION OF SHIPS IN SERVICE IS AS FOLLOWS: 2020 2019
ACQUISITION COST
Beginning of the year 3,778,577,732.10 3,572,266,833.81
Impact of foreign exchange (3,954.08) 0.00
Change of consolidation perimeter (133,764.98) 68,978,363.00
Increase of the year 70,940,197.37 324,140.88
Decrease of the year (11,735,430.33) (2,830,934.77)
Transfer/Other 193,454,318.74 139,839,329.18
ACQUISITION COST – END OF THE YEAR 4,031,099,098.82 3,778,577,732.10
VALUE CORRECTION
Beginning of the year (2,302,213,949.75) (2,089,151,576.57)
Impact of foreign exchange 49,275.73 0.00
Change of consolidation perimeter 0.00 (68,978,363.00)
Increase of the year (142,712,024.61) (146,914,944.95)
Decrease of the year 10,626,216.31 2,830,934.77
Transfer/Other 0.00 0.00
VALUE CORRECTION – END OF THE YEAR (2,434,250,482.32) (2,302,213,949.75)
NET BOOK VALUE – END OF THE YEAR 1,596,848,616.50 1,476,363,782.35
In 2020, the vessel Connector has been acquired by the group from a third party. The vessels Ortelius and Willem Van Rubroek have been commissioned during the year. The vessel Manzanillo has been sold to a third party.
In 2019, the vessels Tristao Sa Cunha, Giovanni Venturi, Henry Darcy, Henri Pitot, Sanderus, Diogo Cao and Afonso Albuquerque have been commissioned. The vessels Dirk Martens, Weseltje, Geelvinck, Nijptangh have been sold to third parties. The vessel Kaishuu, fully depreciated, has been acquired through a change of consolidation perimeter (see Note 2).

31CONSOLIDATED BALANCE SHEET.
7. Financial assets
Investments held as fixed assets
THE EVOLUTION OF INVESTMENTS HELD AS FIXED ASSETS IS AS FOLLOWS: 2020 2019
ACQUISITION COSTBeginning of the year 1,695,772.41 2,726,077.16
Impact of foreign exchange 0.00 0.00
Variation of consolidation scope 0.00 0.00
Increase of the year 0.00 2,531.25
Decrease of the year 0.00 (1,032,836.00)
Transfer 0.00 0.00
ACQUISITION COST – END OF THE YEAR 1,695,772.41 1,695,772.41
VALUE CORRECTIONBeginning of the year (1,225,000.00) (1,225,000.00)
Impact of foreign exchange 0.00 0.00
Variation of consolidation scope 0.00 0.00
Increase of the year 0.00 0.00
Decrease of the year 0.00 0.00
Transfer 0.00 0.00
VALUE CORRECTION – END OF THE YEAR (1,225,000.00) (1,225,000.00)
NET BOOK VALUE – END OF THE YEAR 470,772.41 470,772.41
These amounts represent participations held in non-consolidated companies.
Loans to undertakings with which the undertaking is linked by virtue of participating interests and Other loans
THE COMBINED EVOLUTION OF LOANS TO UNDERTAKINGS WITH WHICH THE UNDERTAKING IS LINKED BY VIRTUE OF PARTICIPATING INTERESTS AND OTHER LOANS IS AS FOLLOWS : 2020 2019
ACQUISITION COSTBeginning of the year 226,753,410.94 247,367,242.46
Net increase of the year 1,202,735.39 0.00
Net decrease of the year 0.00 (20,613,831.52)
ACQUISITION COST – END OF THE YEAR 227,956,146.33 226,753,410.94
VALUE CORRECTIONBeginning of the year (180,039,426.69) (209,502,715.00)
Net increase of the year (1,408,976.54) 0.00
Net decrease of the year 0.00 29,463,288.31
VALUE CORRECTION – END OF THE YEAR (181,448,403.23) (180,039,426.69)
NET BOOK VALUE – END OF THE YEAR 46,507,743.10 46,713,983.25
In 2020 and 2019, these amounts represent deposits, long term loans to non-consolidated entities and a long term shareholder (subordinated) loan to an entity consolidated by net equity method named Grupo Unidos Por El Canal S.A., Panama or GUPC where a participation below 20% is held. This shareholder (subordinated) loan is fully depreciated.
In 2020, among the deposits, an amount of 10,789,774.58 EUR (2019: 10,672,031.52 EUR) was blocked as guarantee upon Court’s decision due to an arbitration with a supplier. In 2021 this blockage was lifted (see Note 40 on Subsequent events).
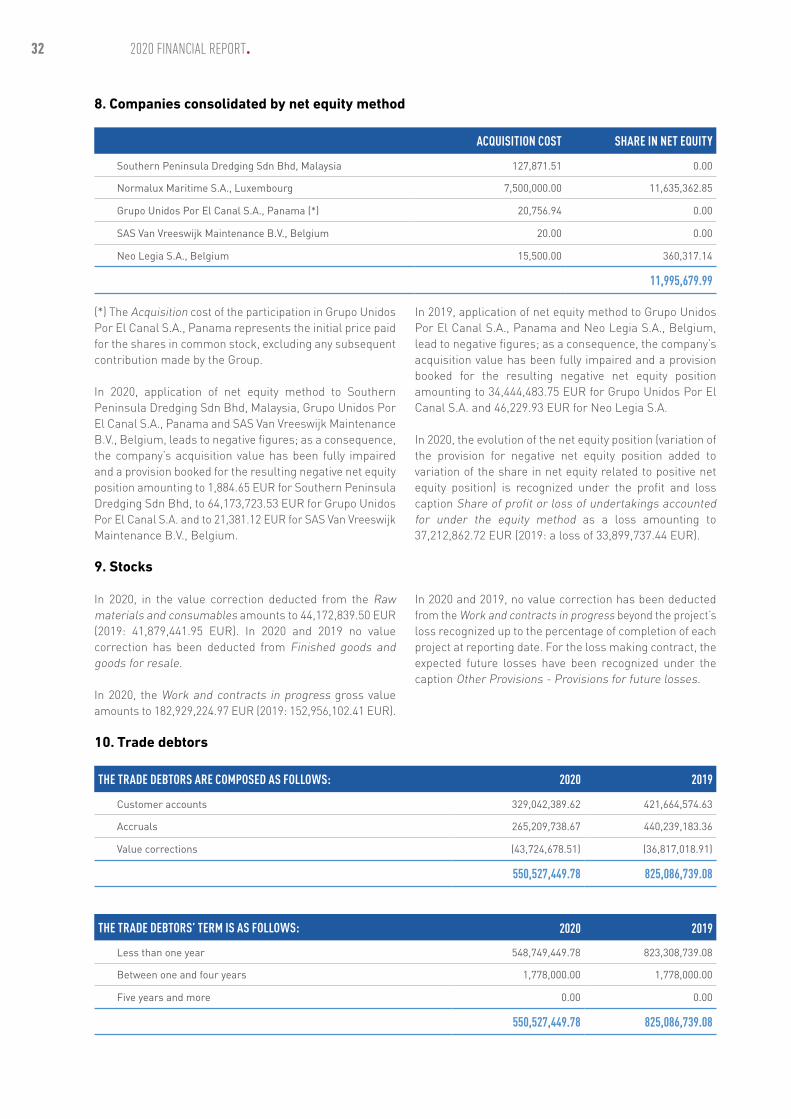
32 2020 FINANCIAL REPORT.
8. Companies consolidated by net equity method
ACQUISITION COST SHARE IN NET EQUITY
Southern Peninsula Dredging Sdn Bhd, Malaysia 127,871.51 0.00
Normalux Maritime S.A., Luxembourg 7,500,000.00 11,635,362.85
Grupo Unidos Por El Canal S.A., Panama (*) 20,756.94 0.00
SAS Van Vreeswijk Maintenance B.V., Belgium 20.00 0.00
Neo Legia S.A., Belgium 15,500.00 360,317.14
11,995,679.99
(*) The Acquisition cost of the participation in Grupo Unidos Por El Canal S.A., Panama represents the initial price paid for the shares in common stock, excluding any subsequent contribution made by the Group.
In 2020, application of net equity method to Southern Peninsula Dredging Sdn Bhd, Malaysia, Grupo Unidos Por El Canal S.A., Panama and SAS Van Vreeswijk Maintenance B.V., Belgium, leads to negative figures; as a consequence, the company’s acquisition value has been fully impaired and a provision booked for the resulting negative net equity position amounting to 1,884.65 EUR for Southern Peninsula Dredging Sdn Bhd, to 64,173,723.53 EUR for Grupo Unidos Por El Canal S.A. and to 21,381.12 EUR for SAS Van Vreeswijk Maintenance B.V., Belgium.
In 2019, application of net equity method to Grupo Unidos Por El Canal S.A., Panama and Neo Legia S.A., Belgium, lead to negative figures; as a consequence, the company’s acquisition value has been fully impaired and a provision booked for the resulting negative net equity position amounting to 34,444,483.75 EUR for Grupo Unidos Por El Canal S.A. and 46,229.93 EUR for Neo Legia S.A.
In 2020, the evolution of the net equity position (variation of the provision for negative net equity position added to variation of the share in net equity related to positive net equity position) is recognized under the profit and loss caption Share of profit or loss of undertakings accounted for under the equity method as a loss amounting to 37,212,862.72 EUR (2019: a loss of 33,899,737.44 EUR).
9. Stocks
In 2020, in the value correction deducted from the Raw materials and consumables amounts to 44,172,839.50 EUR (2019: 41,879,441.95 EUR). In 2020 and 2019 no value correction has been deducted from Finished goods and goods for resale.
In 2020, the Work and contracts in progress gross value amounts to 182,929,224.97 EUR (2019: 152,956,102.41 EUR).
In 2020 and 2019, no value correction has been deducted from the Work and contracts in progress beyond the project’s loss recognized up to the percentage of completion of each project at reporting date. For the loss making contract, the expected future losses have been recognized under the caption Other Provisions - Provisions for future losses.
10. Trade debtors
THE TRADE DEBTORS ARE COMPOSED AS FOLLOWS: 2020 2019
Customer accounts 329,042,389.62 421,664,574.63
Accruals 265,209,738.67 440,239,183.36
Value corrections (43,724,678.51) (36,817,018.91)
550,527,449.78 825,086,739.08
THE TRADE DEBTORS’ TERM IS AS FOLLOWS: 2020 2019
Less than one year 548,749,449.78 823,308,739.08
Between one and four years 1,778,000.00 1,778,000.00
Five years and more 0.00 0.00
550,527,449.78 825,086,739.08

33CONSOLIDATED BALANCE SHEET.
11. Amounts owed by undertakings with which the undertaking is linked by virtue of participating interests
The Amounts owed by undertakings with which the undertaking is linked by virtue of participating interests are mainly composed with current accounts owed from various
companies and Joint Ventures which are consolidated following the proportional integration method.
12. Other debtors
THE OTHER DEBTORS ARE COMPOSED AS FOLLOWS: 2020 2019
Prepayments to creditors 43,542,139.14 10,161,384.01
Accrued income (incl. interests to receive) 1,266,217.82 2,819,368.55
Advance payments to staff 253,208.41 1,188,807.02
Joint ventures & Partners current accounts 27,382,497.55 11,697,672.71
VAT receivables 39,258,948.97 22,452,287.77
Tax receivables 28,811,840.39 29,747,244.89
Others 5,015,087.80 6,655,210.79
145,529,940.08 84,721,975.74
A provision for non-recoverability risks on VAT, income tax and withholding tax debtors amounting to 3,530,628.08 EUR (2019: 4,006,331.37 EUR) has been provided for and is shown under Other provisions.
13. Own shares
A Group’s subsidiary - consolidated by global integration method - owns 132 shares, with a nominal value of 400,000.00 EUR each, in the Group’s mother company Sofidra sa, Luxembourg, representing an acquisition value of 60,000,000.00 EUR and creating a circular relationship. Per application of article 1712-4 (2) of the Law on consolidated annual accounts, these shares are considered as Own shares at Group level. There is no unavailable reserve for own shares accounted for.
In 2020 and 2019, there has been no transaction on Own shares.
14. Subscribed capital
Subscribed capital
THE EVOLUTION OF SUBSCRIBED CAPITAL IS AS FOLLOWS: 2020 2019
Beginning of the year 538,400,000.00 538,400,000.00
Increase of the year 0.00 0.00
Decrease of the year 0.00 0.00
538,400,000.00 538,400,000.00
As at December 31, 2020 and 2019, the Subscribed capital amounts to 538,400,000.00 EUR and is divided into 1,346 shares fully paid with a nominal value of 400,000.00 EUR each.
Authorized capital
Per an Extraodinary General Meeting of Shareholders held on May 5, 2020, an authorized capital amounting to 5,000,000,000.00 EUR, divided into 12,500 shares with a nominal value of 400,000.00 EUR each, has been reinstated.
This authorization is valid for a period of 5 years starting from the General Meeting date. The unused authorized capital amounted to 5,000,000,000.00 EUR as at December 31, 2020.

34 2020 FINANCIAL REPORT.
15. Share premium account
THE EVOLUTION OF SHARE PREMIUM ACCOUNT IS AS FOLLOWS: 2020 2019
Beginning of the year 20,343,906.33 20,343,906.33
Increase of the year 0.00 0.00
Decrease of the year 0.00 0.00
20,343,906.33 20,343,906.33
16. Legal reserve
THE EVOLUTION OF THE LEGAL RESERVE IS AS FOLLOWS: 2020 2019
Beginning of the year 53,840,000.00 51,650,025.53
Allocation from previous year result 0.00 2,189,974.47
53,840,000.00 53,840,000.00
Luxembourg companies are required to allocate to a Legal reserve a minimum of 5% of the profit of the financial year, until this reserve equals 10% of the Subscribed capital. This reserve may not be distributed. This amount represents the Legal reserve of the Company only.
17. Other reserves
THE EVOLUTION OF OTHER RESERVES IS AS FOLLOWS: 2020 2019
Beginning of the year (35,636,411.46) (45,194,045.27)
Variation of first consolidation differences (63,853.33) 9,557,633.81
(35,700,264.79) (35,636,411.46)
In 2019 the variation of Other reserves during the year is mainly due to the acquisition difference on the acquisition of a subsidiary from a third party.
18. Profit or loss brought forward
THE EVOLUTION OF THE PROFIT OR LOSS BROUGHT FORWARD IS AS FOLLOWS: 2020 2019
Beginning of the year 2,358,307,315.81 2,328,774,445.57
Result for the previous financial year 61,187,958.75 31,288,083.55
Allocation to the legal reserve 0.00 (2,189,974.47)
Other 59,677.41 434,761.16
2,419,554,951.97 2,358,307,315.81

35CONSOLIDATED BALANCE SHEET.
19. Translation differences
THE EVOLUTION OF TRANSLATION DIFFERENCES IS AS FOLLOWS: 2020 2019
Beginning of the year (215,316,048.31) (221,357,247.84)
Translation variation of the year (15,218,729.16) 6,041,199.53
(230,534,777.47) (215,316,048.31)
The Translation differences represents gains and losses resulting from the translation into EUR of capital, reserves, income and charges positions of consolidated entities whose accounts are kept in foreign currencies. Starting from
January 1, 2018 there is an hyperinflation adjustment booked due to the devaluation of ARS and its impacts on the subsidiaries located in Argentina.
20. Provisions for taxation
THE PROVISIONS FOR TAXATION ARE COMPOSED AS FOLLOWS: 2020 2019
Provisions for taxes 26,660,358.08 18,487,484.34
Provisions for deferred taxes 802,810.84 3,789,568.32
27,463,168.92 22,277,052.66
Provision for taxes include provisions for corporate income taxes and tax risks for the various entities consolidated through global and proportional integration method.
In 2020 and 2019, the net position of deferred taxes is negative and the resulting net position of deferred tax liabilities had been recognized under Provisions for deferred taxes.

36 2020 FINANCIAL REPORT.
21. Other provisions
THE OTHER PROVISIONS ARE COMPOSED AS FOLLOWS: 2020 2019
Provisions for future losses 6,316,530.05 22,663,722.91
Provisions for non recoverable VAT & tax debtors 3,530,628.08 4,006,331.37
Provisions for maintenance and repairs 33,388,047.58 36,130,551.09
Provisions for negative net equity method 64,196,989.30 34,490,713.68
Others 23,099,020.67 47,924,921.41
130,531,215.68 145,216,240.46
Provisions for future losses
The Provisions for future losses are intended to cover the expected future losses on non-performing projects. Due to its generally operating nature, the allocations and reversals of this provision are booked in operating result.
Provisions for non recoverable VAT & tax debtors
The Management performs annually an impairment test on the amounts due by tax authorities. Where the Management considers that a position whether cannot be collected nor be offset against current or expected future tax payables, Provisions for non recoverable VAT & tax debtors are booked to cover such a recoverability risk. Due to its generally operating nature, the allocations and reversals of this provision are booked in operating result.
Provisions for maintenance and repairs
The Provisions for maintenance and repairs are booked to cover future docking costs of the main vessels of the fleet. These docking costs are estimated using a standard maintenance cost determined on a vessel-per-vessel basis. A docking is expected to occur twice over a five years period. Due to its operating nature, the allocations and reversals of this provision are booked in operating result.
Others
These provisions includes amounts related to brownfield projects and cover the expected future land rehabilitation costs and to cover the risk of repayment of some guarantees. Due to its operating nature, the allocations and reversals of this provision are booked in operating result.
In addition, it included in 2019 a provision for the repatriation cost of positions (bank accounts and trade receivables) located in Argentina amounting to 8,087,153.85 EUR. Due to its financial nature, the allocations and reversals of this provision are booked in financial result.
Provisions for negative net equity projects
The Provisions for negative net equity projects represents the net equity method valuation of these entities where the application of net equity method leads to negative figures (see also Note 8).
THE PROVISIONS FOR NEGATIVE NET EQUITY PROJECTS ARE COMPOSED AS FOLLOWS: 2020 2019
Southern Peninsula Dredging Sdn Bhd, Malaysia 1,884.65 0.00
Grupo Unidos Por El Canal S.A., Panama 64,173,723.53 34,444,483.75
SAS Van Vreeswijk Maintenance B.V., Belgium 21,381.12 0.00
Neo Legia S.A., Belgium 0.00 46,229.93
64,196,989.30 34,490,713.68
Grupo Unidos Por El Canal S.A., Panama (hereafter GUPC) is a company incorporated under the laws of the Republic of Panama (deed no 25931 dated November 23, 2009). Jan De Nul nv has an economic interest of 15% in the shareholding of GUPC.
On February 19, 2021, a final award was issued in ICC case 20910/ASM/JPA. According to this award, ACP is entitled to amounts previously awarded to GUPC by a Dispute Adjudication Board (DAB). Given the earlier award by the DAB in favour of GUPC, the outcome of this ICC award was totally unexpected. The Group has per 31 December 2020

37CONSOLIDATED BALANCE SHEET.
made the necessary provisions to cover for its share in the repayment to ACP of the amount awarded. The Profit and Loss impact of the decision is recognized through the caption Share of profit or loss of undertakings accounted for under the equity method. On 23 February 2021, the total amount awarded to ACP was paid by GUPC to ACP, each partner contributing for its share towards GUPC (see Note 40 on Subsequent events). This means now that, except for totally
unforeseen incidents, any winning award under the running arbitrations would have – taking into account Group’s share in the project and legal costs – a positive impact on Group’s future financial results and on Group’s cash position.
The financial exposure of the Group in relation to the above is covered by the Provisions for negative net equity projects.
22. Amounts owed to credit institutions
THE AMOUNTS OWED TO CREDIT INSTITUTIONS ARE COMPOSED AS FOLLOWS: 2020 2019
Long term loans and financing 248,498,165.80 166,645,137.42
Bank overdraft and short term loans 955,524.63 199,272.05
Commercial paper 101,000,000.00 154,000,000.00
Leasing debts 336,375.46 509,759.93
350,790,065.89 321,354,169.40
THE AMOUNTS OWED TO CREDIT INSTITUTIONS TERM IS AS FOLLOWS: 2020 2019
Less than one year 116,406,406.37 99,045,321.96
Between one and four years 152,386,159.62 195,311,347.54
Five years or more 81,997,499,90 26,997,499.90
350,790,065.89 321,354,169.40
In 2020, the Long term loans and financing include a subordinated loan for an amount of 75,000,000.00 EUR (2019: 75,000,000.00 EUR), due between one and four years. This loan is granted under a 75,000,000.00 EUR facility agreement.
23. Payments received on accounts of orders as far as they are shown separately as deductions from stocks
In 2020, the Payments received on accounts of orders as far as they are shown separately as deductions from stocks include prepayments from customers amounting to 160,609,721.42 EUR (2019: 311,239,641.24 EUR).
24. Trade creditors
THE TRADE CREDITORS ARE COMPOSED AS FOLLOWS: 2020 2019
Supplier accounts 164,634,013.52 175,224,587.00
Accruals 186,618,570.29 280,539,134.49
351,252,583.81 455,763,721.49
THE TRADE CREDITORS’ TERM IS AS FOLLOWS: 2020 2019
Less than one year 351,252,583.81 455,763,721.49
Between one and four years 0.00 0.00
Five years and more 0.00 0.00
351,252,583.81 455,763,721.49
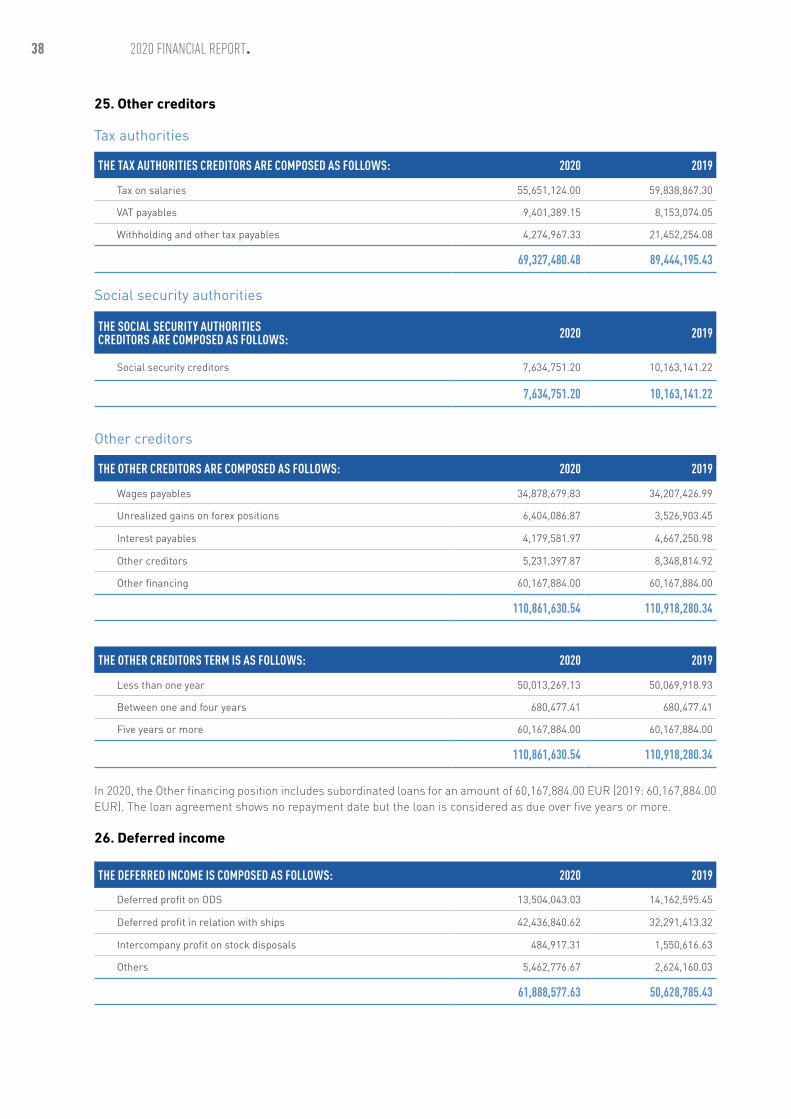
38 2020 FINANCIAL REPORT.
25. Other creditors
Tax authorities
THE TAX AUTHORITIES CREDITORS ARE COMPOSED AS FOLLOWS: 2020 2019
Tax on salaries 55,651,124.00 59,838,867.30
VAT payables 9,401,389.15 8,153,074.05
Withholding and other tax payables 4,274,967.33 21,452,254.08
69,327,480.48 89,444,195.43
Social security authorities
THE SOCIAL SECURITY AUTHORITIES CREDITORS ARE COMPOSED AS FOLLOWS: 2020 2019
Social security creditors 7,634,751.20 10,163,141.22
7,634,751.20 10,163,141.22
Other creditors
THE OTHER CREDITORS ARE COMPOSED AS FOLLOWS: 2020 2019
Wages payables 34,878,679.83 34,207,426.99
Unrealized gains on forex positions 6,404,086.87 3,526,903.45
Interest payables 4,179,581.97 4,667,250.98
Other creditors 5,231,397.87 8,348,814.92
Other financing 60,167,884.00 60,167,884.00
110,861,630.54 110,918,280.34
THE OTHER CREDITORS TERM IS AS FOLLOWS: 2020 2019
Less than one year 50,013,269.13 50,069,918.93
Between one and four years 680,477.41 680,477.41
Five years or more 60,167,884.00 60,167,884.00
110,861,630.54 110,918,280.34
In 2020, the Other financing position includes subordinated loans for an amount of 60,167,884.00 EUR (2019: 60,167,884.00 EUR). The loan agreement shows no repayment date but the loan is considered as due over five years or more.
26. Deferred income
THE DEFERRED INCOME IS COMPOSED AS FOLLOWS: 2020 2019
Deferred profit on ODS 13,504,043.03 14,162,595.45
Deferred profit in relation with ships 42,436,840.62 32,291,413.32
Intercompany profit on stock disposals 484,917.31 1,550,616.63
Others 5,462,776.67 2,624,160.03
61,888,577.63 50,628,785.43

39
The Deferred profit on ODS is generated by the neutralization of the profit realized on the delivery by the Group of parts that are included in the construction of new vessels. This income is recognized as operating on a timely basis (based on the depreciation rate of the related vessel) and recognized under the profit and loss caption Other operating income.
The Deferred profit in relation with ships is generated by the financing structure put in place by the Group and by indemnities perceived from ship constructors due to delivery delays or non-conformity issues. This income is recognized as operating or financial result on a timely basis (financial structure) or at the amortization rate of the related vessel (indemnities). In 2020, a profit amounting to 16,216,418.83 EUR (2019: 13,300,557.39 EUR) has been
recognized under the profit and loss caption Other operating income or Other interest receivable and similar income, depending on the nature of the income.
The Intercompany profit on stock disposals represents eliminated intercompany margin on disposal of assets or inventories when these margins cannot be allocated to a single item (example: pipes). This margin is recognized as operating result over a 2.5 years period. In 2020, a profit amounting to 1,065,699.32 EUR (2019: 5,685,087.80 EUR) has been recognized under the profit and loss caption Other operating income.
27. Net turnover
NET TURNOVER IS BROKEN DOWN AS FOLLOWS: 2020 2019
Maritime, dredging and offshore works 76.66% 77.08 %
Civil works 20.85 % 20.33 %
Environmental 2.49 % 2.59 %
100.00 % 100.00%
NET TURNOVER IS BROKEN DOWN AS FOLLOWS: 2020 2019
Africa 12.43 % 7.17 %
America 12.77 % 17.50 %
Australia 0.06 % 3.59 %
Asia & Middle East 37.23 % 27.08 %
Europa 37.51 % 44.66 %
100.00 % 100.00%
28. Other operating income
OTHER OPERATING INCOME IS BROKEN DOWN AS FOLLOWS: 2020 2019
Insurance indemnification 5,420,043.37 1,011,131.72
Income from Joint Venture 74,630.65 68,959.84
Reversal of operating provisions 51,089,692.40 18,293,579.21
Deferred income recognition – ships 4,240,346.87 5,004,447.78
Deferred income recognition – interco. disposals 1,065,028.71 5,772,385.92
Gain on disposal of tangible assets 9,962,690.59 16,419,977.07
Other 27,133,439.25 29,713,290.85
98,985,871.84 76,283,772.39
Gain on disposal of tangible assets are to be as well considered as extraordinary income.
CONSOLIDATED BALANCE SHEET.

40 2020 FINANCIAL REPORT.
29. Staff costs
During the year 2020, average staff employed by Group entities consolidated through the global integration method is 5,785 (2019: 6,468) among these 1,496 (2019: 1,809) are employed through third party crewing agencies.
During the year 2020, average staff employed by Group entities consolidated through the proportional integration method is 482 (2019: 407).
30. Value adjustments in respect of current assets
VALUE ADJUSTMENTS IN RESPECT OF CURRENT ASSETS ARE BROKEN DOWN AS FOLLOWS: 2020 2019
Value adjustments on stock (2,293,397.55) (126,049.14)
Value adjustments on receivables (9,521,937.86) (11,081,329.61)
(11,815,335.41) (11,207,378.75)
The Value adjustments on stocks represent in 2020 an allocation to the value correction on Raw materials and consumables for an amount of 2,293,397.55 EUR (2019: 1,898,810.10 EUR) and a reversal of value correction on Raw materials and consumables amounting to 0.00 EUR (2019: 1,772,760.96 EUR).
31. Other operating expenses
OTHER OPERATING EXPENSES ARE BROKEN DOWN AS FOLLOWS: 2020 2019
Net allocation to operating provisions 18,041,221.28 46,318,267.75
Losses on disposal of tangible assets 4,483,569.16 7,564,453.89
Others 17,511,313.48 37,065,614.35
40,036,103.92 90,948,335.99
The Net allocation to operating provisions includes the allocation to the other provisions (including provisions for land depollution, for ships maintenance and repairs and for losses on projects) for an amount of 18,041,221.28 EUR (2019: 46,318,267.75 EUR). Losses on disposal of tangible assets are to be considered as extraordinary charges. The Others include extraordinary charges amounting to 82,845.04 EUR (2019: 686,873.55 EUR).
32. Other interest receivable and similar income
OTHER INTEREST RECEIVABLE AND SIMILAR INCOME IS BROKEN DOWN AS FOLLOWS: 2020 2019
Interest income 3,023,152.41 14,526,002.79
Exchange differences – net 0.00 0.00
Deferred income recognition 14,961,497.79 12,463,934.51
Reversal of financial provisions 10,656,677.14 0.00
Other financial income 486,225.06 0.00
29,127,552.40 26,989,937.30
The Deferred income recognition is related to the Deferred profit in relation with ships (see Note 26).

41
33. Interest payable and similar expenses
INTEREST PAYABLE AND SIMILAR EXPENSES ARE BROKEN DOWN AS FOLLOWS: 2020 2019
Interest charges 5,961,806.34 5,052,181.37
Exchange differences – net 33,570,340.31 23,294,436.25
Allocation to financial provisions 11,783,770.12 11,930,943.85
Other financial charges 20,229.01 10,572,407.53
51,336,145.78 50,849,969.00
34. Tax on profit or loss
TAX ON PROFIT OR LOSS IS BROKEN DOWN AS FOLLOWS: 2020 2019
Income tax 25,108,838.03 29,488,314.88
Deferred taxes 1,993,830.79 2,783,091.60
27,102,668.82 32,271,406.48
35. Other taxes
Other taxes are mainly composed of withholding tax charges.
36. Emoluments granted to the members of the administrative, managerial and supervisory bodies and commitments in respect of retirement pensions
The emoluments granted to the members of the administrative, managerial and supervisory bodies in that capacity and the obligations arising or entered into in respect of retirement pensions for former members of those bodies for the financial year, are broken down as follows:
2020 2019
Administrative and managerial bodies 3,343,745.47 2,942,271.89
Supervisory bodies 0.00 0.00
37. Audit fees
Audit fees incurred during the year 2020 amount to 1,473,473.78 EUR (2019: 1,483,662.83 EUR). Audit fees of the statutory auditor for the year 2020 amounts to 299,580.00 EUR (2019: 292,270.00 EUR).
38. Advances and loans granted to the members of the administrative, managerial and supervisory bodies
The advances and loans granted during the financial year to the members of those bodies may be summarised as follows:
2020 2019
Administrative and managerial bodies 0.00 0.00
Supervisory bodies 0.00 0.00
The Group did not enter in any commitments during the financial year on the behalf of the members of those bodies.
CONSOLIDATED BALANCE SHEET.

42 2020 FINANCIAL REPORT.
39. Off balance sheet commitments
Guarantees issued for operations
As at December 31, 2020, the Group has issued guarantees for operations for an amount of 886,723,134.82 EUR (2019: 1,044,142,545.74 EUR). As at December 31, 2020, the Group had received guarantees for operations for an amount of 520,477,207.03 EUR (2019: 474,797,761.17 EUR).
Hedging derivatives
Mark to Market potential gain on total derivative portfolio as at December 31, 2020 is 14,948,879.77 EUR (2019: a loss amounting to 8,687,152.91 EUR). Based on these, an accrual has been included through Other provisions for 0.00 EUR (2019: 145,832.89 EUR).
The Group’s commitment in derivatives consists of:
1. Forward exchange contracts on different currencies for a total amount of over 178 million USD (2019: 156 million USD), 0 million AUD (2019: 10 million AUD), 35 million BRL (2019: 14 million BRL), 0 million COP (2019: 2,900 million COP), 0 million RUB (2019: 208 million RUB), 0 million INR (2019: 0 million INR), 72 million SEK (2019: 36 million SEK), 8,247 million TWD (2019: 10,547 million TWD), 0 million IDR (2019: 63,000 million IDR), 10 million MXN (2019: 250 million MXN), 0.3 million NOK (2019: 0 million NOK), 0 million CNY (2019: 8 million CNY), 0.7 million TRY (2019: 0 million TRY) and 0 million PLN (2019: 1,5 million PLN). The term of the forex deals is up to May 2021 (2019: up to November 2020). Mark to Market potential gain on Forex contracts amounts to 16,279,805.11 EUR (2019: a loss of 7,602,257.16 EUR).
In 2020, from this amount, no provision for forex loss (2019: a provision amounting to 145,832.89 EUR) has been recognized; other forex contracts at loss have been considered as hedging contracts so that no provision has been recorded. No deduction from Trade debtors has been made to take into account the hedging effect of open positions at year end as the impact is immaterial.
2. Interest Rate Swaps and Collars contracts in order to cover its long term funding interest risk. Global notional amounts to 150 million EUR (2019: 100 million EUR). Due dates are up to December 2021 (2019: to December 2021). Mark to Market loss on IRC contracts amounts to 1,023,668.46 EUR (2019: a loss of 1,117,432.90 EUR). No provision has been provided for in connection with these contracts as they are considered as hedging contracts.
3. Energy Swaps contracts in order to cover the variation of fuel prices. Global notional amounts to 26,219 MT (2019: 5,103 MT). Their expiration date is up to June 2023. The valuation of these contracts as at December 31, 2020 leads to a potential loss amounting to 307,256.88 EUR (in 2019: gain of 32,537.15 EUR). As these contracts are hedging purpose, no accrual has been provided for.
Commitments to purchase tangible assets
As at December 31, 2020, commitments related to forward purchases of vessels within Tangible assets amount approx-imately to 257.4 million EUR (2019: 440.6 million EUR).
40. Subsequent events
1. In light of the final award issued to GUPC in 2021 as described in Note 21, the Group made a cash disbursement of USD 42,920,583.54 in February 2021.
2. Furthermore, the blocked deposit of EUR 10,789,774.58 referred to in Note 7, was released on 14 April 2021, and therefore the amount is free for use again.
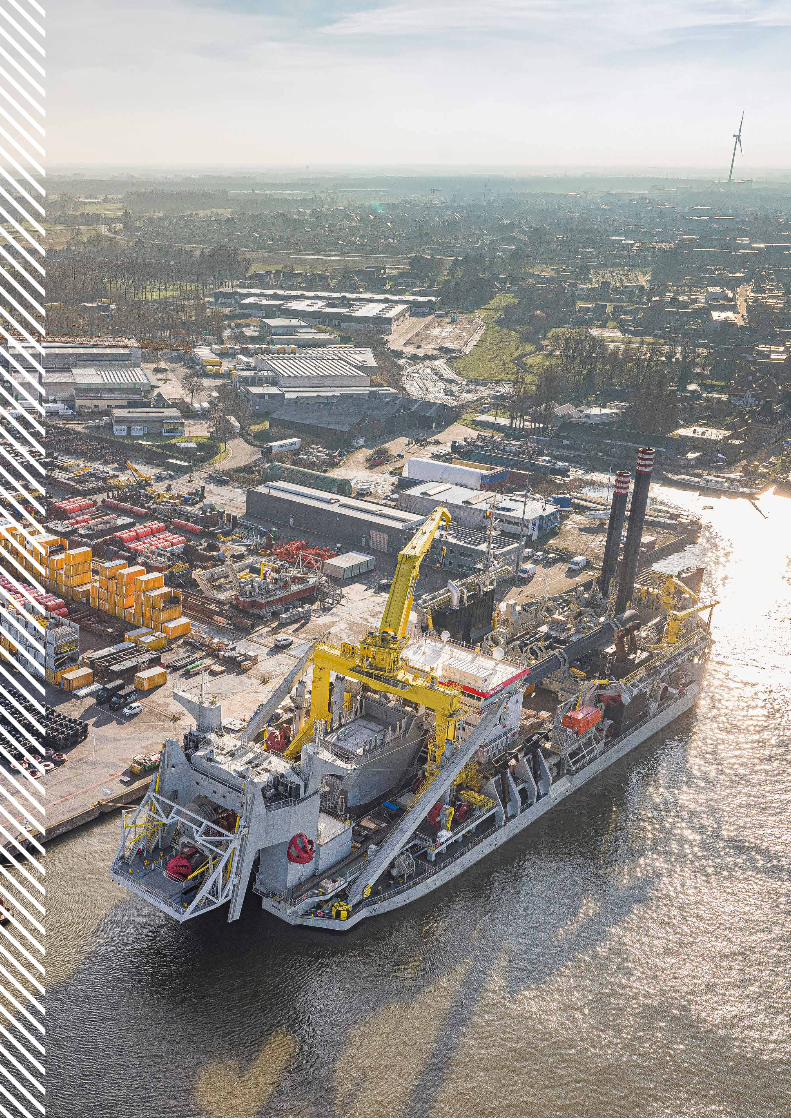
43CONSOLIDATED BALANCE SHEET.

J A N D E N U L . C O MJ A N D E N U L . C O M
18/05
/21