financial report - home - ivy tech community college · pdf filefive year trend in student...
TRANSCRIPT


2016 | IVY TECH COMMUNITY COLLEGE FINANCIAL REPORT1
IVY TECH COMMUNITY COLLEGE OF INDIANA2015-16 FINANCIAL REPORT
TABLE OF CONTENTS
President’s Letter . . . . . . . . . . . . . . . . . . . . . . . . . . . . . . . . . . . . . . . . . . . . . . . . . . . . . . . . . . . . . . . . . . . . . . . . . . . . . . . . . . . . . 2State Board of Trustees . . . . . . . . . . . . . . . . . . . . . . . . . . . . . . . . . . . . . . . . . . . . . . . . . . . . . . . . . . . . . . . . . . . . . . . . . . . . . . . . 3Management Letter . . . . . . . . . . . . . . . . . . . . . . . . . . . . . . . . . . . . . . . . . . . . . . . . . . . . . . . . . . . . . . . . . . . . . . . . . . . . . . . . . . . 4Auditor's Opinion . . . . . . . . . . . . . . . . . . . . . . . . . . . . . . . . . . . . . . . . . . . . . . . . . . . . . . . . . . . . . . . . . . . . . . . . . . . . . . . . . . . 5–7Management’s Discussion and Analysis . . . . . . . . . . . . . . . . . . . . . . . . . . . . . . . . . . . . . . . . . . . . . . . . . . . . . . . . . . . . . . .8–20Ivy Tech Community College of Indiana Statement of Net Position . . . . . . . . . . . . . . . . . . . . . . . . . . . . . . . . . . . . . . . . . . . 21Ivy Tech Foundation Consolidated Statement of Financial Position . . . . . . . . . . . . . . . . . . . . . . . . . . . . . . . . . . . . . . . . . . 22Ivy Tech Community College of Indiana Statement of Revenues, Expenses and Changes in Net Position . . . . . . . . . . 23Ivy Tech Foundation Consolidated Statement of Activities . . . . . . . . . . . . . . . . . . . . . . . . . . . . . . . . . . . . . . . . . . . . . 24–25Ivy Tech Community College of Indiana Statement of Cash Flows . . . . . . . . . . . . . . . . . . . . . . . . . . . . . . . . . . . . . . . 26–27Ivy Tech Foundation Consolidated Statement of Cash Flows . . . . . . . . . . . . . . . . . . . . . . . . . . . . . . . . . . . . . . . . . . . . 28–29Ivy Tech Community College of Indiana Notes to Financial Statements . . . . . . . . . . . . . . . . . . . . . . . . . . . . . . . . . . . 30–45Required Supplementary Information
Schedule of OPEB Funding Progress . . . . . . . . . . . . . . . . . . . . . . . . . . . . . . . . . . . . . . . . . . . . . . . . . . . . . . . . . . . . . . . . . . . . 47
Schedule of Proportionate Share of the Net Pension Liability . . . . . . . . . . . . . . . . . . . . . . . . . . . . . . . . . . . . . . . . . . . . . . . 47Schedule of the College’s Contributions . . . . . . . . . . . . . . . . . . . . . . . . . . . . . . . . . . . . . . . . . . . . . . . . . . . . . . . . . . . . . . . . . 47Supplementary Schedules
Schedules of Annual Bond Requirements for Outstanding Debts . . . . . . . . . . . . . . . . . . . . . . . . . . . . . . . . . . . . . . . . 49–55Schedule of Student Financial Aid Expenditures . . . . . . . . . . . . . . . . . . . . . . . . . . . . . . . . . . . . . . . . . . . . . . . . . . . . . . . . . . 56Five Year Trend in Student Enrollment . . . . . . . . . . . . . . . . . . . . . . . . . . . . . . . . . . . . . . . . . . . . . . . . . . . . . . . . . . . . . . . . . . . 56

IVY TECH COMMUNITY COLLEGE FINANCIAL REPORT | 20162
DEAR FRIENDS OF IVY TECH,On behalf of the Trustees of Ivy Tech Community College of Indiana, I am pleased to present the College’s 2015-16 Financial Report.
As evidenced by this report, Ivy Tech continues to remain fiscally strong thanks to the work of College leadership, faculty, and staff in increasing efficiencies and reducing expenditures. The College is grateful for support received from State appropriations, donor contributions, grants, contracts, and student fees and is committed to maximizing those resources.
Most importantly, this report reflects the College’s commitment to prepare students for gainful employment and upward mobility in high demand fields. As outlined in Focus on Student Success 2025, Ivy Tech’s goal is to increase the number of graduates to 50,000 students by 2025. With nearly 20,000 students graduating from the College this year, Ivy Tech is making great progress towards this goal, and ensuring programs are designed to meet the needs of employers.
We look forward to your continued input and support in positioning students for success in Indiana’s and the global economy.
Respectfully,
Dr. Susan Ellspermann

2016 | IVY TECH COMMUNITY COLLEGE FINANCIAL REPORT3
PRESIDENTDr. Susan Ellspermann
STATE BOARD OF TRUSTEESPaula Hughes, Chair
Fort Wayne, Indiana
Michael Dora, Vice Chair Rushville, Indiana
Bob Jones, Secretary Evansville, Indiana
Board listing as of June 30, 2016 President as of July 1, 2016
Jesse Brand Columbus, Indiana
Michael Evans Indianapolis, Indiana
Larry Garatoni Mishawaka, Indiana
Richard Halderman Wabash, Indiana
Lillian Sue Livers Madison, Indiana
Lee Marchant Bloomington, Indiana
Stewart McMillan Valparaiso, Indiana
Kimra Schleicher Sellersburg, Indiana
Steve Schreckengast Lafayette, Indiana
Kaye Whitehead Muncie, Indiana
Darrel Zeck Terre Haute, Indiana
October 13, 2016
TO THE PRESIDENT AND STATE BOARD OF TRUSTEES OF IVY TECH COMMUNITY COLLEGE OF INDIANA:
On behalf of all those individuals responsible for the financial stewardship of College resources, I am pleased to present the Ivy Tech Community College of Indiana Annual Financial Report for the year ended June 30, 2016 .
The report has been prepared in conformance with authoritative reporting standards and guidelines for colleges and universities . This report utilizes Governmental Accounting Standards Board Statement No . 35, Basic Financial Statement and Management’s Discussion and Analysis for Public Colleges and Universities . An analysis is included which compares the College’s financial position for the fiscal years ended June 30, 2016 and 2015 with comparative information for fiscal year 2014 .
The report contains data which is consolidated for all College locations as well as statements and schedules listed in the table of contents .
The Indiana State Board of Accounts has audited the financial statements . Their audit opinion on the financial statements is a part of this report .
Respectfully submitted,
Christopher A . Ruhl Senior Vice President, Chief Financial Officer and General Counsel

2016 | IVY TECH COMMUNITY COLLEGE FINANCIAL REPORT5
STATE OF INDIANAAN EQUAL OPPORTUNITY EMPLOYER STATE BOARD OF ACCOUNTS
302 WEST WASHINGTON STREET ROOM E418 INDIANAPOLIS, INDIANA 46204-2769
Telephone: (317) 232-2513 Fax: (317) 232-4711
Web Site: www.in.gov/sboa
INDEPENDENT AUDITOR'S REPORT
TO: THE OFFICIALS OF IVY TECH COMMUNITY COLLEGE OF INDIANA, INDIANAPOLIS, INDIANA
Report on the Financial Statements
We have audited the financial statements of the business-type activities and the discretely presented component unit of Ivy Tech Community College of Indiana (College), a component unit of the State of Indiana, as of and for the year ended June 30, 2016 and 2015, and the related notes to the financial statements, which collectively comprise the College's basic financial statements, as listed in the Table of Contents.
Management's Responsibility for the Financial Statements
Management is responsible for the preparation and fair presentation of these financial statements in accordance with accounting principles generally accepted in the United States of America; this includes the design, implementation, and maintenance of internal control relevant to the preparation and fair presentation of financial statements that are free from material misstatement, whether due to fraud or error.
Auditor's Responsibility
Our responsibility is to express opinions on these financial statements based on our audit. We did not audit the financial statements of the Ivy Tech Foundation (Foundation), a component unit of the College as discussed in Note 1, which represents 100 percent of the assets, net assets, and revenues of the discretely presented component unit. Those statements were audited by other auditors whose report has been furn-ished to us, and our opinion, insofar as it relates to the amounts included for the Foundation, is based solely on the report of the other auditors. We conducted our audit in accordance with auditing standards generally accepted in the United States of America and the standards applicable to financial audits contained in Government Auditing Standards, issued by the Comptroller General of the United States. Those standards require that we plan and perform the audit to obtain reasonable assurance about whether the financial state-ments are free from material misstatement.
An audit involves performing procedures to obtain audit evidence about the amounts and disclosures in the financial statements. The procedures selected depend on the auditor's judgment, including the assess-ment of the risks of material misstatement of the financial statements, whether due to fraud or error. In making those risk assessments, the auditor considers internal control relevant to the College's preparation and fair presentation of the financial statements in order to design audit procedures that are appropriate in the circumstances, but not for the purpose of expressing an opinion on the effectiveness of the College's internal control. Accordingly, we express no such opinion. An audit also includes evaluating the appropriateness of accounting policies used and the reasonableness of significant accounting estimates made by management, as well as evaluating the overall presentation of the financial statements.
We believe that the audit evidence we have obtained is sufficient and appropriate to provide a basis for our audit opinions.
IVY TECH COMMUNITY COLLEGE FINANCIAL REPORT | 20166
INDEPENDENT AUDITOR'S REPORT (Continued)
Opinions
In our opinion, based on our audit and the report of the other auditors, the financial statements referred to above present fairly, in all material respects, the respective financial position of the business-type activities and the discretely presented component unit of the College, as of June 30, 2016 and 2015, and the respective changes in financial position and, where applicable, cash flows thereof and for the year then ended, in accordance with accounting principles generally accepted in the United States of America.
Other Matters
Required Supplementary Information
Accounting principles generally accepted in the United States of America require that the Management's Discussion and Analysis, Schedule of OPEB Funding Progress, Schedule of Proportionate Share of the Net Pension Liability, and Schedule of the College's Contributions, be presented to supplement the basic financial statements. Such information, although not a part of the basic financial statements, is re-quired by the Governmental Accounting Standards Board who considers it to be an essential part of financial reporting for placing the basic financial statements in an appropriate operational, economic, or historical context. We have applied certain limited procedures to the required supplementary information in accordance with auditing standards generally accepted in the United States of America, which consisted of inquiries of management about the methods of preparing the information and comparing the information for consistency with management's responses to our inquiries, the basic financial statements, and other knowledge we ob-tained during our audit of the basic financial statements. We do not express an opinion or provide any assur-ance on the information because the limited procedures do not provide us with sufficient evidence to express an opinion or provide any assurance.
Other Information
Our audit was conducted for the purpose of forming opinions on the financial statements that col-lectively comprise the College's basic financial statements. The President's Letter, State Board of Trustees, Management Letter, Schedules of Annual Bond Requirements for Outstanding Debts, Schedule of Student Financial Aid Expenditures, and Five Year Trend in Student Enrollment are presented for purposes of addi-tional analysis and are not a required part of the basic financial statements.
The President's Letter, State Board of Trustees, Management Letter, Schedules of Annual Bond Requirements for Outstanding Debts, Schedule of Student Financial Aid Expenditures, and Five Year Trend in Student Enrollment have not been subjected to the auditing procedures applied in the audit of the basic financial statements and, accordingly, we do not express an opinion or provide any assurance on this infor-mation.
Other Reporting Required by Government Auditing Standards
In accordance with Government Auditing Standards, we have also issued our report dated October 26, 2016, on our consideration of the College's internal control over financial reporting and on our tests of its compliance with certain provisions of laws, regulations, contracts, and grant agreements and other matters.
2016 | IVY TECH COMMUNITY COLLEGE FINANCIAL REPORT7
INDEPENDENT AUDITOR'S REPORT (Continued)
The purpose of that report is to describe the scope of our testing of internal control over financial reporting and compliance and the results of that testing, and not to provide an opinion on internal control over financial reporting or on compliance. That report is an integral part of an audit performed in accordance with Government Auditing Standards in considering College's internal control over financial reporting and compli-ance.
Paul D. Joyce, CPA State Examiner
October 26, 2016
IVY TECH COMMUNITY COLLEGE FINANCIAL REPORT | 20168
MANAGEMENT’S DISCUSSION AND ANALYSISIntroductionThis section of Ivy Tech Community College of Indiana’s (Ivy Tech) annual financial report presents a discussion and analysis of the financial performance of the College for the fiscal year ending June 30, 2016 and 2015 along with comparative data for the year ending June 30, 2014 . The management’s discussion and analysis provides summary level financial information; therefore, it should be read in conjunction with the accompanying financial statements and note disclosures . The management’s discussion and analysis is designed to focus on current activities, significant changes, and currently known facts . The financial statements, notes, and this discussion are the responsibility of management .
Using this Annual ReportThis annual report consists of a series of financial statements, prepared in accordance with the Governmental Accounting Standards Board (GASB) Statement No . 35, Basic Financial Statements and Management’s Discussion and Analysis for Public Colleges and Universities, an Amendment of GASB Statement No . 34 Basic Financial Statements and Management’s Discussion and Analysis – for State and Local Governments . The financial statements focus on the financial condition of the College, the results of operations, and cash flows of the College as a whole .
One of the most important questions asked about the College’s finances is whether the College is better or worse as a result of this year’s activity . The keys to understanding that question are the Statement of Net Position, Statement of Revenues, Expenses, and Changes in Net Position, and the Statement of Cash Flows . These statements present financial information in a form similar to that used by corporations . The College’s net position is one indicator of the College’s financial strength . Over time, increases or decreases in net position is one indicator of the improvement or erosion of the College’s financial health when considered with non-financial facts such as enrollment levels and the condition of facilities .
The Statement of Net Position includes all assets and liabilities . It is prepared under the accrual basis of accounting, whereby revenues and assets are recognized when the service is provided and expenses and liabilities are recognized when others provide the service to the College, regardless of when cash is exchanged .
The Statement of Revenues, Expenses, and Changes in Net Position presents the revenues earned and expenses incurred during the year . Activities are reported as either operating or nonoperating . The authoritative financial reporting model classifies State appropriations and gifts as nonoperating revenues; therefore, such a classification results in an operating deficit being shown in this statement . The utilization of long-lived assets, referred to as capital assets, is reflected in the financial statements as depreciation, which amortizes the cost of an asset over its expected useful life .
Another important factor to consider when evaluating financial viability is the College’s ability to meet financial obligations as they mature . The Statement of Cash Flows presents the information related to cash inflows and outflows summarized by operating, capital, and noncapital financing and investing activities .

2016 | IVY TECH COMMUNITY COLLEGE FINANCIAL REPORT9
Financial HighlightsIn return for providing the resources necessary for the operations of the College, Ivy Tech’s students and the taxpayers of Indiana demand careful stewardship of State appropriations, student fees, grants and contracts, donor contributions, and other funds . This Annual Financial Report for the 2015-16 fiscal year reflects that commitment .
Overall, the College’s financial position continues to be strong . During fiscal year 2015-16 the College’s net position increased by a total of $39 .0 million (6 .5%) compared to the previous year . During the last five years, the College’s net position has grown from $474 .7 million to $637 .0 million, an increase of 34 .2% . Unrestricted net position also grew in 2015-16 by $23 .9 million (7 .8%) . Unrestricted net position has grown from $250 .4 million to $331 .3 million, a 32 .3% increase in five years . This performance has allowed the College to continue to fully fund internally designated funds to offset liabilities for accrued vacation, sick leave, defined benefit pension, and other post-employment benefits (OPEB) while also establishing reserves for operations, self-insurance, repair and rehabilitation and technology related infrastructure .
Overall, long-term debt decreased by $25 .4 million due to principal payments on bonds payable, off-setting increases of $5 .0 million in the net pension liability and a $1 .4 million increase in other post-employment benefits .
Operating revenue increased in 2015-16 . FTE enrollment modestly declined compared to 2014-15 resulting in gross tuition and fee revenue declining by 4 .8% compared to 2014-15 . Scholarship allowance declined by 14 .0% . The net effect was a 2 .2% increase in net tuition revenue . Auxiliary revenue increased by 34 .4% reflecting the recognition of $3 .6 million of unamortized payments received from Follett . Nonoperating revenues declined 6 .1% primarily due to a decrease in the number of Federal Pell grant recipients . State operating appropriations were 3 .9% higher than the previous year .
Operating expenses totaled $550 .0 million, a decrease of 1 .4% compared to 2014-15 . This decline was primarily attributable to a decrease in scholarship expense of $25 .4 million; this decrease was offset by increases in salary, benefits, and depreciation expense .
IVY TECH COMMUNITY COLLEGE FINANCIAL REPORT | 201610
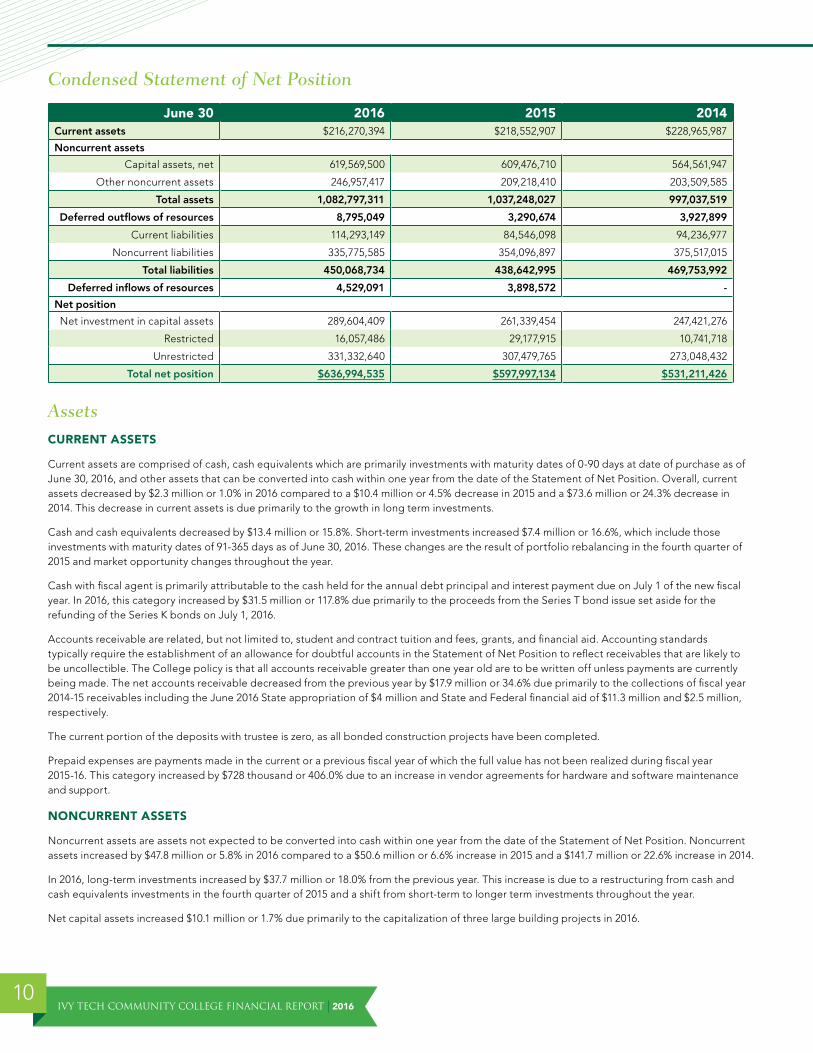
Condensed Statement of Net Position
June 30 2016 2015 2014Current assets $216,270,394 $218,552,907 $228,965,987
Noncurrent assets
Capital assets, net 619,569,500 609,476,710 564,561,947
Other noncurrent assets 246,957,417 209,218,410 203,509,585
Total assets 1,082,797,311 1,037,248,027 997,037,519
Deferred outflows of resources 8,795,049 3,290,674 3,927,899
Current liabilities 114,293,149 84,546,098 94,236,977
Noncurrent liabilities 335,775,585 354,096,897 375,517,015
Total liabilities 450,068,734 438,642,995 469,753,992
Deferred inflows of resources 4,529,091 3,898,572 -
Net position
Net investment in capital assets 289,604,409 261,339,454 247,421,276
Restricted 16,057,486 29,177,915 10,741,718
Unrestricted 331,332,640 307,479,765 273,048,432
Total net position $636,994,535 $597,997,134 $531,211,426
AssetsCURRENT ASSETS
Current assets are comprised of cash, cash equivalents which are primarily investments with maturity dates of 0-90 days at date of purchase as of June 30, 2016, and other assets that can be converted into cash within one year from the date of the Statement of Net Position . Overall, current assets decreased by $2 .3 million or 1 .0% in 2016 compared to a $10 .4 million or 4 .5% decrease in 2015 and a $73 .6 million or 24 .3% decrease in 2014 . This decrease in current assets is due primarily to the growth in long term investments .
Cash and cash equivalents decreased by $13 .4 million or 15 .8% . Short-term investments increased $7 .4 million or 16 .6%, which include those investments with maturity dates of 91-365 days as of June 30, 2016 . These changes are the result of portfolio rebalancing in the fourth quarter of 2015 and market opportunity changes throughout the year .
Cash with fiscal agent is primarily attributable to the cash held for the annual debt principal and interest payment due on July 1 of the new fiscal year . In 2016, this category increased by $31 .5 million or 117 .8% due primarily to the proceeds from the Series T bond issue set aside for the refunding of the Series K bonds on July 1, 2016 .
Accounts receivable are related, but not limited to, student and contract tuition and fees, grants, and financial aid . Accounting standards typically require the establishment of an allowance for doubtful accounts in the Statement of Net Position to reflect receivables that are likely to be uncollectible . The College policy is that all accounts receivable greater than one year old are to be written off unless payments are currently being made . The net accounts receivable decreased from the previous year by $17 .9 million or 34 .6% due primarily to the collections of fiscal year 2014-15 receivables including the June 2016 State appropriation of $4 million and State and Federal financial aid of $11 .3 million and $2 .5 million, respectively .
The current portion of the deposits with trustee is zero, as all bonded construction projects have been completed .
Prepaid expenses are payments made in the current or a previous fiscal year of which the full value has not been realized during fiscal year 2015-16 . This category increased by $728 thousand or 406 .0% due to an increase in vendor agreements for hardware and software maintenance and support .
NONCURRENT ASSETS
Noncurrent assets are assets not expected to be converted into cash within one year from the date of the Statement of Net Position . Noncurrent assets increased by $47 .8 million or 5 .8% in 2016 compared to a $50 .6 million or 6 .6% increase in 2015 and a $141 .7 million or 22 .6% increase in 2014 .
In 2016, long-term investments increased by $37 .7 million or 18 .0% from the previous year . This increase is due to a restructuring from cash and cash equivalents investments in the fourth quarter of 2015 and a shift from short-term to longer term investments throughout the year .
Net capital assets increased $10 .1 million or 1 .7% due primarily to the capitalization of three large building projects in 2016 .
2016 | IVY TECH COMMUNITY COLLEGE FINANCIAL REPORT11
Deferred Outflows of ResourcesDeferred outflows of resources represent consumption of resources applicable to a future reporting period . Deferred outflows increased $5 .5 million or 167 .3% due to the change in deferred outflows related to pensions as required by GASB Statement No . 68 and GASB Statement No . 71 . Additional information about this item can be found in Note IX, section B .
Liabilities
CURRENT LIABILITIES
Current liabilities are obligations that are due within one year from the date of the Statement of Net Position and will require the use of a current asset or will create another current liability . This category increased by $29 .7 million or 35 .2% in 2016 compared to a $9 .7 million or 10 .3% decrease in 2015 and a $28 .1 million or 23 .0% decrease in 2014 . The net change in current liabilities are largely due to the fluctuations in the current portion of debt due to bond principal payable in the following fiscal year .
Accounts payable and accrued liabilities increased by $996 thousand or 3 .5% in fiscal year 2016 . An increase of $1 .0 million in self-insurance unpaid claims estimates and claim accruals drove the change .
Compensated absences increased $565 thousand or 6 .1% while deposits held in custody for others remained stable as compared to the prior year .
Unearned revenue represents monies received in the current year for services, tuition and fees, future revenue related to the lease of the College bookstores, or goods to be provided by the College in a future period and not applicable with GASB Statement No . 63 Financial Reporting of Deferred Outflows of Resources, Deferred Inflows of Resources, and Net Position . Unearned revenue decreased $5 .0 million or 30 .1% as compared to the prior year primarily due to the recognition of $3 .6 million of unamortized revenue earned upon the completion of the 2008 contract with Follett on the lease of the Ivy Tech Bookstores . Additionally, a $1 .5 million decrease is attributed to the reduction in deferred summer revenue due to a decline in summer term enrollment .
The current portion of debt obligation is the portion of the College’s long-term debt which is payable within the next fiscal year . This category increased by $32 .9 million or 135 .3% due to the expected $33 .1 million refunding of the Series K bonds in fiscal year 2016-17 .
NONCURRENT LIABILITIES
Noncurrent liabilities will be paid one year or later from the date of the Statement of Net Position . The College’s noncurrent liabilities include compensated absences, long-term debt and other obligations, other post-employment benefits, and beginning in fiscal year 2014-15, net pension liability . Implementation of GASB Statement No . 68, Accounting and Financial Reporting for Pensions – An Amendment of GASB Statement No. 27 required the recognition of net pension liability for defined benefit pension plans .
Overall, noncurrent liabilities decreased by $18 .3 million or 5 .2% in 2016, compared to a $21 .4 million or 5 .7% decrease in 2015 and a $78 .4 million or 26 .4% increase in 2014 . Since 2014, long term debt and other obligations decreased by $43 .8 million or 13 .3% due to a reduction in long-term debt .
The 2016 change in noncurrent liabilities was due primarily to a $25 .4 million decrease in long-term debt from the principal payments on bonds payable and off-setting increases of $5 .0 million in the actuarially determined net pension liability, a $1 .4 million increase in other post-employment benefits and a $643 thousand increase in compensated absences .
In accordance with the appropriate accounting guidance, the entire amount of post-employment benefits is considered a long-term liability .
IVY TECH COMMUNITY COLLEGE FINANCIAL REPORT | 201612
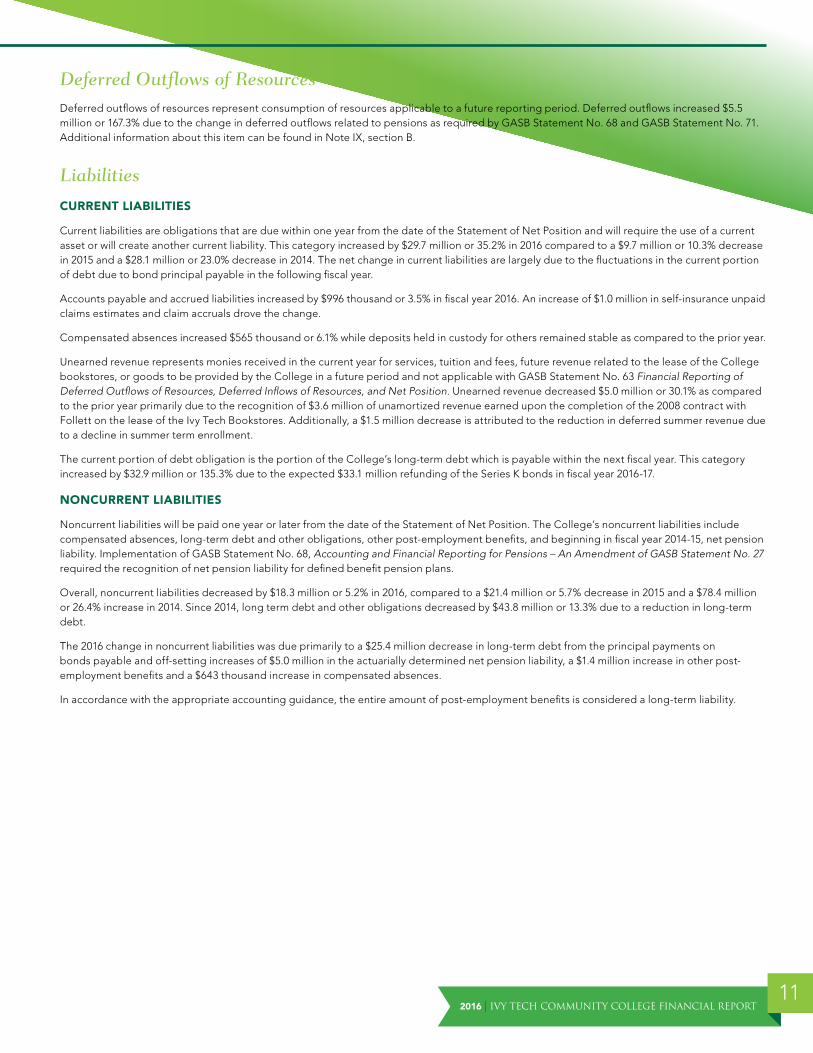
OUTSTANDING DEBT AT YEAR END
Leases, Notes, and Bonds Payable 6/30/2016 6/30/2015 6/30/2014Revenue Bonds Payable:
Series H student fee bonds $11,200,000 $11,200,000 $11,200,000
Series I student fee bonds - - 8,830,000
Series J student fee bonds 9,245,000 9,245,000 9,245,000
Series K student fee bonds 33,085,000 33,085,000 35,675,000
Series L student fee bonds 32,575,000 35,390,000 38,105,000
Series M student fee bonds - - 3,735,000
Series N student fee bonds 66,450,000 70,290,000 70,290,000
Series O student fee bonds 9,200,000 9,200,000 9,200,000
Series P student fee bonds 26,135,000 29,645,000 30,590,000
Series Q student fee bonds 5,640,000 8,450,000 11,490,000
Series R student fee bonds 60,670,000 65,320,000 71,355,000
Series S student fee bonds 4,570,000 6,840,000 -
Series T student fee bonds 27,730,000 - -
Total bonds payable 286,500,000 278,665,000 299,715,000
Premium on bonds—H, I, J, K, L ,M, P & T 14,428,238 12,005,094 13,220,258
Lease obligations 35,371,320 41,312,420 38,096,647
Notes payable 5,714,517 2,446,899 2,784,491
Total leases, notes, and bonds payable $342,014,075 $334,429,413 $353,816,396
Deferred Inflows of ResourcesDeferred inflows of resources represent acquisition of resources applicable to a future reporting period as required by GASB Statement No .68 and GASB Statement No . 71 . Deferred inflows related to pensions totaled $4 .5 million, an increase of $631 thousand or 16 .2% from fiscal year 2014-15 . Additional information about this item can be found in Note IX, section B .
Net PositionNet position represents the difference between the College’s assets and liabilities . Net position increased $39 .0 million or 6 .5% in 2016 compared to an increase of $66 .8 million or 12 .6% in 2015 and an increase of $21 .8 million or 4 .3% in 2014 .
The classification “net investment in capital assets,” which includes building and equipment less depreciation, land owned by the College, and construction work in progress, increased by $28 .3 million or 10 .8% compared to the prior year . This increase was mainly due to the capitalization of three large construction projects in Anderson, Bloomington, and Indianapolis as well as other repair and rehabilitation projects . In addition, the College added network equipment through a finance agreement and multifunction printing equipment through capital lease financing .
The restricted “capital projects” classification decreased by $13 .1 million or 45 .1% from the prior year . This decrease was primarily due to the decrease in recorded construction in progress after capitalizing the Anderson, Bloomington, and Indianapolis construction projects .
Unrestricted net position increased by $23 .9 million or 7 .8% . This was mainly due to increases in State appropriations, operating revenues, investment income and from a reduction in unrestricted funded construction expenses .
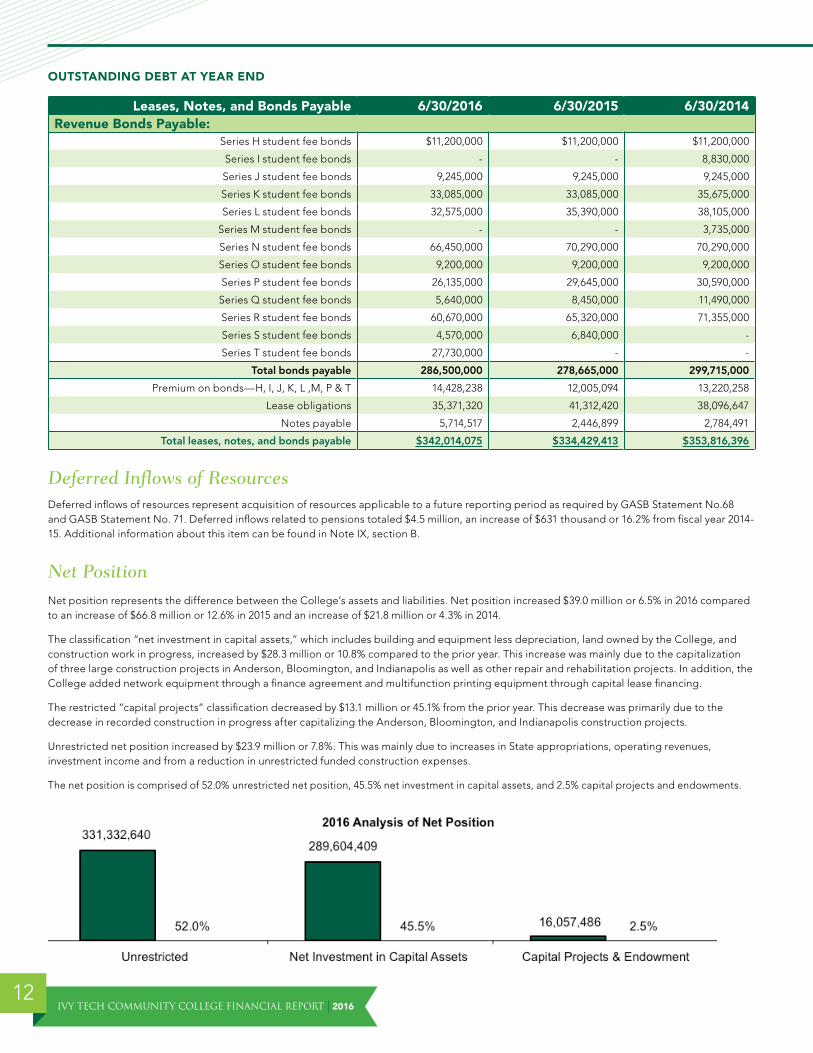
The net position is comprised of 52 .0% unrestricted net position, 45 .5% net investment in capital assets, and 2 .5% capital projects and endowments .
2016 | IVY TECH COMMUNITY COLLEGE FINANCIAL REPORT13
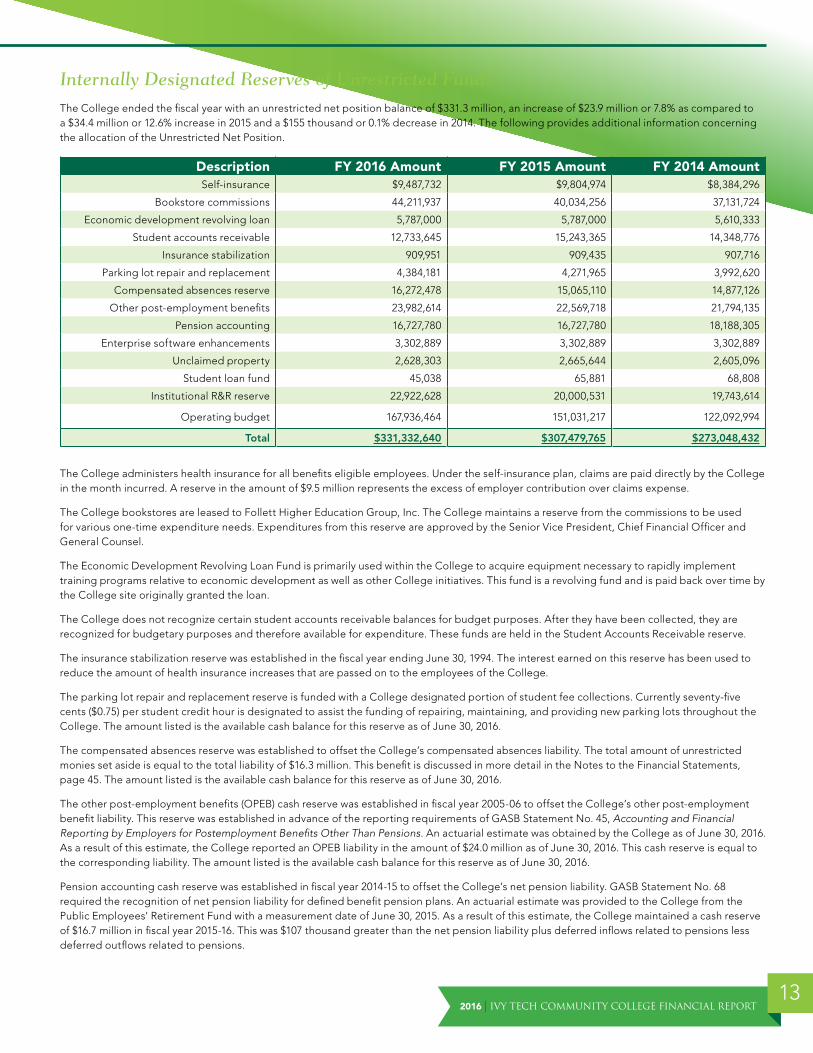
Internally Designated Reserves of Unrestricted FundsThe College ended the fiscal year with an unrestricted net position balance of $331 .3 million, an increase of $23 .9 million or 7 .8% as compared to a $34 .4 million or 12 .6% increase in 2015 and a $155 thousand or 0 .1% decrease in 2014 . The following provides additional information concerning the allocation of the Unrestricted Net Position .
Description FY 2016 Amount FY 2015 Amount FY 2014 AmountSelf-insurance $9,487,732 $9,804,974 $8,384,296
Bookstore commissions 44,211,937 40,034,256 37,131,724
Economic development revolving loan 5,787,000 5,787,000 5,610,333
Student accounts receivable 12,733,645 15,243,365 14,348,776
Insurance stabilization 909,951 909,435 907,716
Parking lot repair and replacement 4,384,181 4,271,965 3,992,620
Compensated absences reserve 16,272,478 15,065,110 14,877,126
Other post-employment benefits 23,982,614 22,569,718 21,794,135
Pension accounting 16,727,780 16,727,780 18,188,305
Enterprise software enhancements 3,302,889 3,302,889 3,302,889
Unclaimed property 2,628,303 2,665,644 2,605,096
Student loan fund 45,038 65,881 68,808
Institutional R&R reserve 22,922,628 20,000,531 19,743,614
Operating budget 167,936,464 151,031,217 122,092,994
Total $331,332,640 $307,479,765 $273,048,432
The College administers health insurance for all benefits eligible employees . Under the self-insurance plan, claims are paid directly by the College in the month incurred . A reserve in the amount of $9 .5 million represents the excess of employer contribution over claims expense .
The College bookstores are leased to Follett Higher Education Group, Inc . The College maintains a reserve from the commissions to be used for various one-time expenditure needs . Expenditures from this reserve are approved by the Senior Vice President, Chief Financial Officer and General Counsel .
The Economic Development Revolving Loan Fund is primarily used within the College to acquire equipment necessary to rapidly implement training programs relative to economic development as well as other College initiatives . This fund is a revolving fund and is paid back over time by the College site originally granted the loan .
The College does not recognize certain student accounts receivable balances for budget purposes . After they have been collected, they are recognized for budgetary purposes and therefore available for expenditure . These funds are held in the Student Accounts Receivable reserve .
The insurance stabilization reserve was established in the fiscal year ending June 30, 1994 . The interest earned on this reserve has been used to reduce the amount of health insurance increases that are passed on to the employees of the College .
The parking lot repair and replacement reserve is funded with a College designated portion of student fee collections . Currently seventy-five cents ($0 .75) per student credit hour is designated to assist the funding of repairing, maintaining, and providing new parking lots throughout the College . The amount listed is the available cash balance for this reserve as of June 30, 2016 .
The compensated absences reserve was established to offset the College’s compensated absences liability . The total amount of unrestricted monies set aside is equal to the total liability of $16 .3 million . This benefit is discussed in more detail in the Notes to the Financial Statements, page 45 . The amount listed is the available cash balance for this reserve as of June 30, 2016 .
The other post-employment benefits (OPEB) cash reserve was established in fiscal year 2005-06 to offset the College’s other post-employment benefit liability . This reserve was established in advance of the reporting requirements of GASB Statement No . 45, Accounting and Financial Reporting by Employers for Postemployment Benefits Other Than Pensions . An actuarial estimate was obtained by the College as of June 30, 2016 . As a result of this estimate, the College reported an OPEB liability in the amount of $24 .0 million as of June 30, 2016 . This cash reserve is equal to the corresponding liability . The amount listed is the available cash balance for this reserve as of June 30, 2016 .
Pension accounting cash reserve was established in fiscal year 2014-15 to offset the College’s net pension liability . GASB Statement No . 68 required the recognition of net pension liability for defined benefit pension plans . An actuarial estimate was provided to the College from the Public Employees’ Retirement Fund with a measurement date of June 30, 2015 . As a result of this estimate, the College maintained a cash reserve of $16 .7 million in fiscal year 2015-16 . This was $107 thousand greater than the net pension liability plus deferred inflows related to pensions less deferred outflows related to pensions .
IVY TECH COMMUNITY COLLEGE FINANCIAL REPORT | 201614
The enterprise software enhancement reserve has been established to assist the College in maintaining and enhancing the enterprise-wide software programs .
Prior to the repeal of Indiana Code Title 4, Article 10, Chapter 10 in July 2014, the College maintained unclaimed property which consisted of checks that have not been cashed and are greater than two years old . The payees may claim these checks upon the filing of a claim and proof of identity . As of June 30, 2016, checks that have not been cashed are now reported and remitted to the State’s Unclaimed Property division in accordance with the dormancy periods outlined in the State’s unclaimed property laws .
The College maintains a loan fund for the purpose of making short-term loans to students . The funds are derived from a number of different sources .
The College has unrestricted reserves for potential R&R projects within the College .
The operating budget is the remaining amount of the unrestricted net position available for expenditure .
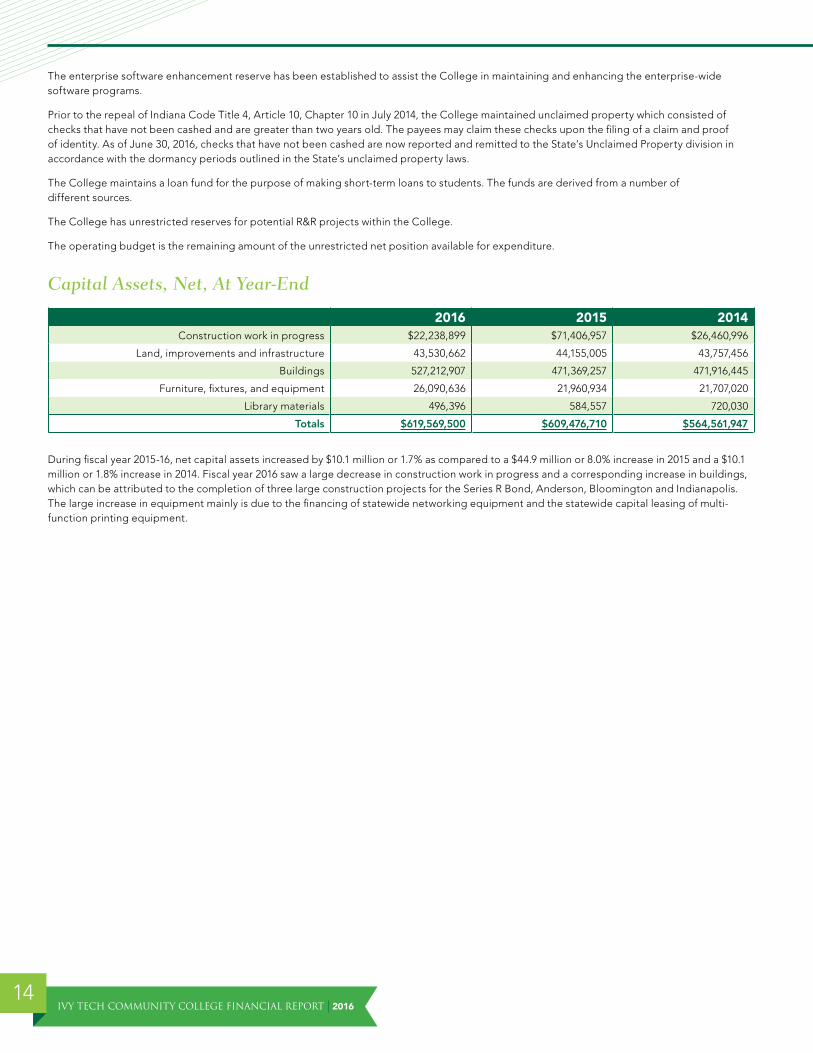
Capital Assets, Net, At Year-End
2016 2015 2014Construction work in progress $22,238,899 $71,406,957 $26,460,996
Land, improvements and infrastructure 43,530,662 44,155,005 43,757,456
Buildings 527,212,907 471,369,257 471,916,445
Furniture, fixtures, and equipment 26,090,636 21,960,934 21,707,020
Library materials 496,396 584,557 720,030
Totals $619,569,500 $609,476,710 $564,561,947
During fiscal year 2015-16, net capital assets increased by $10 .1 million or 1 .7% as compared to a $44 .9 million or 8 .0% increase in 2015 and a $10 .1 million or 1 .8% increase in 2014 . Fiscal year 2016 saw a large decrease in construction work in progress and a corresponding increase in buildings, which can be attributed to the completion of three large construction projects for the Series R Bond, Anderson, Bloomington and Indianapolis . The large increase in equipment mainly is due to the financing of statewide networking equipment and the statewide capital leasing of multi-function printing equipment .

2016 | IVY TECH COMMUNITY COLLEGE FINANCIAL REPORT15
Condensed Statement of Revenues, Expenses and Changes in Net Position
Year Ended June 30 2016 2015 2014Operating revenues
Tuition and fees, net $132,748,891 $129,865,547 $137,417,388
Grants and contracts 24,454,294 22,596,616 28,913,220
Auxiliary services 10,065,782 7,491,642 8,718,709
Other 7,719,121 6,616,928 6,830,035
Total Operating Revenues 174,988,088 166,570,733 181,879,352
Operating expensesInstruction 195,406,949 190,847,029 206,323,425
Public service 1,060,215 1,429,636 1,592,452
Academic support 51,996,283 50,639,711 53,349,166
Student services 44,116,845 43,351,399 45,562,994
Auxiliary services 4,695,315 1,996,634 1,841,792
Institutional support 94,761,023 91,769,823 95,023,481
Operation and maintenance of plant 41,488,388 39,369,693 40,428,290
Scholarships and fellowships 85,110,188 110,524,275 129,741,445
Depreciation and amortization 31,298,349 27,555,378 29,833,048
Total operating expenses 549,933,555 557,483,578 603,696,093
Operating income (loss) (374,945,467) (390,912,845) (421,816,741)
Nonoperating revenues (expenses)State/federal appropriations 248,316,530 239,090,909 235,492,735
Governmental grants and contracts 167,625,262 206,618,064 231,903,361
Other nonoperating revenue (expense) (7,084,952) (6,902,053) (8,734,245)
Net Nonoperating Revenues 408,856,840 438,806,920 458,661,851
Income/(loss) before other revenues, expenses, gains, or losses
33,911,373 47,894,075 36,845,110
Other revenues and gains (losses) 5,086,028 18,891,633 3,098,452
Total increase in net position 38,997,401 66,785,708 39,943,562
Net positionNet position—beginning of year 597,997,134 531,211,426 509,456,169
Net position—end of year before change in standard
- 549,399,731
Prior period adjustment— change in accounting standard
- (18,188,305)
Net position–end of year $636,994,535 $597,997,134 $531,211,426
IVY TECH COMMUNITY COLLEGE FINANCIAL REPORT | 201616
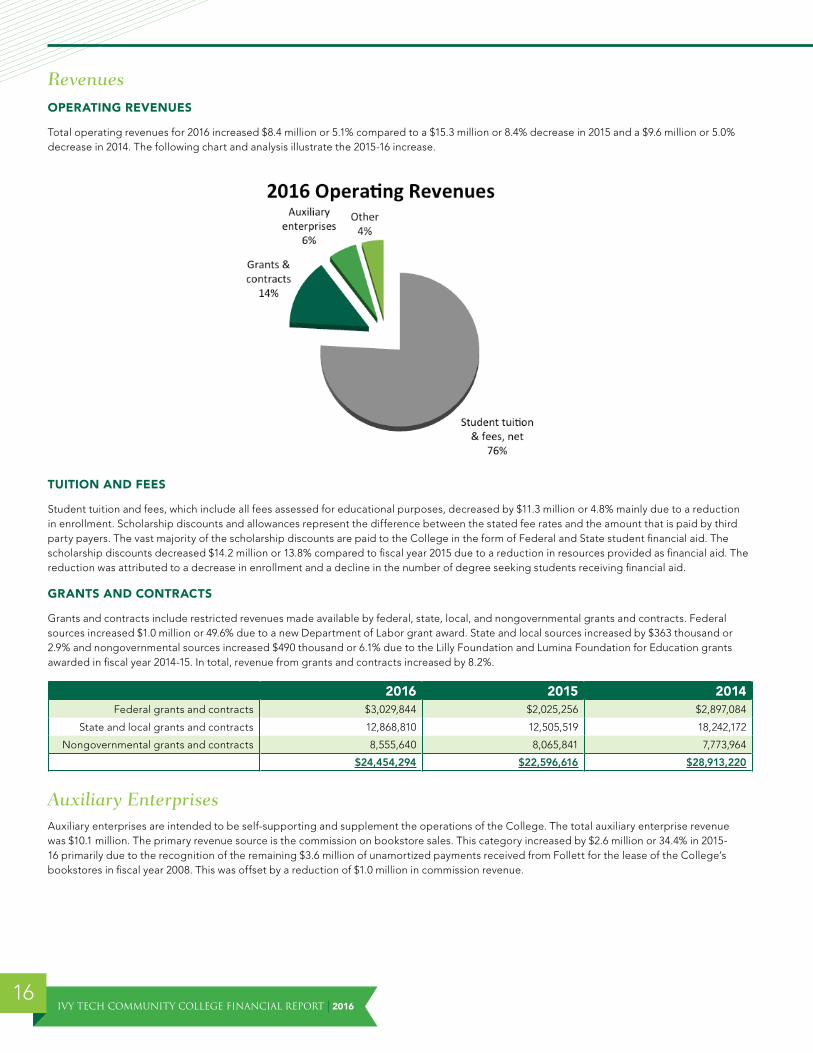
RevenuesOPERATING REVENUES
Total operating revenues for 2016 increased $8 .4 million or 5 .1% compared to a $15 .3 million or 8 .4% decrease in 2015 and a $9 .6 million or 5 .0% decrease in 2014 . The following chart and analysis illustrate the 2015-16 increase .
TUITION AND FEES
Student tuition and fees, which include all fees assessed for educational purposes, decreased by $11 .3 million or 4 .8% mainly due to a reduction in enrollment . Scholarship discounts and allowances represent the difference between the stated fee rates and the amount that is paid by third party payers . The vast majority of the scholarship discounts are paid to the College in the form of Federal and State student financial aid . The scholarship discounts decreased $14 .2 million or 13 .8% compared to fiscal year 2015 due to a reduction in resources provided as financial aid . The reduction was attributed to a decrease in enrollment and a decline in the number of degree seeking students receiving financial aid .
GRANTS AND CONTRACTS
Grants and contracts include restricted revenues made available by federal, state, local, and nongovernmental grants and contracts . Federal sources increased $1 .0 million or 49 .6% due to a new Department of Labor grant award . State and local sources increased by $363 thousand or 2 .9% and nongovernmental sources increased $490 thousand or 6 .1% due to the Lilly Foundation and Lumina Foundation for Education grants awarded in fiscal year 2014-15 . In total, revenue from grants and contracts increased by 8 .2% .
2016 2015 2014Federal grants and contracts $3,029,844 $2,025,256 $2,897,084
State and local grants and contracts 12,868,810 12,505,519 18,242,172
Nongovernmental grants and contracts 8,555,640 8,065,841 7,773,964
$24,454,294 $22,596,616 $28,913,220
Auxiliary EnterprisesAuxiliary enterprises are intended to be self-supporting and supplement the operations of the College . The total auxiliary enterprise revenue was $10 .1 million . The primary revenue source is the commission on bookstore sales . This category increased by $2 .6 million or 34 .4% in 2015-16 primarily due to the recognition of the remaining $3 .6 million of unamortized payments received from Follett for the lease of the College’s bookstores in fiscal year 2008 . This was offset by a reduction of $1 .0 million in commission revenue .

2016 | IVY TECH COMMUNITY COLLEGE FINANCIAL REPORT17
Operating ExpensesTotal operating expenses decreased by $7 .6 million or 1 .4% in 2016 compared to a $46 .2 million or 7 .7% decrease in 2015 and a $24 .1 million or 3 .8% decrease in 2014 . The decrease in operating expenses in 2015 was primarily due to the $27 .4 million reduction in personnel costs as a result of the Early Retirement Incentive Plan (ERIP) in 2014 and from the reduction of $18 .9 million in scholarships and fellowships expenses . In 2016, the $25 .4 million decrease in scholarships and fellowships expenses was offset by increases in salary, benefits, and depreciation expenses . Changes to operating expenses during 2016 are noted below .
COMPENSATION
Salary and wages expense increased by $5 .5 million or 2 .4% and benefits expense increased $8 .9 million or 12 .8% in 2015-16 . The increase in contributions to the medical health plans by the College accounted for 75% of the change in total benefits expense in 2016 .
SCHOLARSHIPS AND FELLOWSHIPS
Scholarships and fellowships decreased $25 .4 million or 23 .2% in 2015-16, due to a reduction in enrollment and the number of degree seeking students receiving Federal financial aid .
UTILITIES
Utilities remained stable compared to 2015 with a small increase of $68 thousand or 0 .6% .
SUPPLIES AND OTHER SERVICES
Supplies and other services decreased $366 thousand or 0 .3% .
DEPRECIATION
Depreciation expense increased by $3 .8 million or 13 .8% in 2016 primarily due to the additions of three major building projects .
AMORTIZATION OF DEFERRED LOSS ON REFUNDING
Amortization of deferred loss on refunding decreased by $18 thousand or 7 .9% .
Nonoperating Revenue and ExpenseThis category consists of State and Federal appropriations, investment income, interest on capital asset-related debt, governmental grants and contracts and student government support .
Nonoperating revenues decreased $27 .3 million or 6 .1% in 2016, compared to a $21 .3 million or 4 .5% decrease in 2015, and a decrease of $11 .6 million or 2 .4% in 2014 . The major factor for the declines in nonoperating revenues is attributed to Federal and State financial aid revenues which have declined by $64 .3 million or 27 .7 % since 2014 .
In fiscal year 2015-16, Federal grants and contracts totaled $138 .0 million, a reduction of $32 .9 million or 19 .3% from the previous year . State aid awards decreased by $6 .1 million or 17 .0% from the previous year . The reduction in both Federal and State awards are due to the decline in enrollment and a reduction of degree-seeking students receiving financial aid . State appropriations increased by $9 .3 million or 3 .9% . Investment income increased by $2 .4 million or 84 .3% . This increase can be attributed to higher returns on the investment portfolio and from $50 million invested in higher tiers during fiscal year 2015-16 .
Nonoperating expenses increased $2 .6 million or 26 .7% during fiscal year 2016 due to interest on capital asset related debt .
OTHER REVENUES, EXPENSES, GAINS, OR LOSSES
Total other revenues, expenses, gains, or losses consist of capital gifts, grants, gains (losses) from the sale of capital assets, and capital appropriations . In total, this category decreased by $13 .8 million in 2016, compared to a $15 .8 million increase in 2015 and $1 .3 million increase in 2014 .
In fiscal year 2016, capital appropriations decreased by $11 .5 million due to the one-time 2015 capital appropriation of $12 .0 million received from the State for the Hamilton County campus project . State capital appropriations for college-wide repair and rehabilitation projects increased by $1 .0 million . Capital gifts, grants and gains/ (losses) from sale of capital assets decreased $2 .3 million as gift revenue of $3 .8 million recognized from the early payoff of six capital lease agreements with the Ivy Tech Foundation was offset by a $2 .4 million decrease in donations to the College, a $3 .4 million loss from the sale Kokomo Events Center property, and a decrease of $405 thousand in other gift revenue .

IVY TECH COMMUNITY COLLEGE FINANCIAL REPORT | 201618
Statement of Cash FlowsAnother way to assess the financial condition of an institution is to look at the Statement of Cash Flows . Its primary purpose is to provide relevant information about the cash receipts and cash payments of an entity during a period . The Statement of Cash Flows also helps users evaluate:
• an entity’s ability to generate future net cash flows
• its ability to meet its obligations as they come due
• its need for external financing
Condensed Statement of Cash Flows
Year Ended June 30 2016 2015 2014Cash provided (used) by:
Operating activities ($335,879,702) ($384,675,136) ($378,145,302)
Noncapital financing activities 418,254,709 441,110,845 468,696,392
Capital and related financing activities (56,780,645) (39,019,298) (66,965,771)
Investing activities (38,963,517) 14,375,163 (180,169,601)
Net increase (decrease) in cash (13,369,155) 31,791,574 (156,584,282)
Cash and cash equivalents, beginning of the year 84,728,221 52,936,647 209,520,929
Cash and cash equivalents, end of the year $71,359,066 $84,728,221 $52,936,647
For the College’s financial statement purposes, cash and cash equivalents are comprised of cash (in banks and on hand) and investments with maturity dates of 0-90 days at date of purchase as of June 30, 2016 . Cash and cash equivalents decreased by 15 .8% this fiscal year . This change is primarily due to portfolio rebalancing based on market opportunities .
Cash used for operating activities decreased $48 .8 million in 2016 compared to a $6 .5 million increase from 2014 to 2015 . The reduction in payments to students and the reduction in payments to suppliers accounted for the largest decrease in operating outflows in both 2016 and 2015 .
Cash provided from noncapital financing activities decreased by $22 .9 million in 2016 compared to a $27 .6 million decrease in 2015 . The largest decline in cash was from Federal and State scholarships and grants and from Direct Federal loan proceeds .
Cash used for capital and related financing activities increased $17 .8 million in 2016 compared to a $27 .9 million decrease from 2014 to 2015 . The largest use of cash in 2016 was for principal payments on capital debt .
Cash used for investing activities increased $53 .3 million in 2016 compared to a $194 .5 million decrease in cash used from 2014 to 2015 . Purchase of investments exceeded proceeds from sales and maturities of investments in 2016 .
According to the authoritative guidance from the Governmental Accounting Standards Board, State appropriations and Federal and State financial aid proceeds are to be shown as a non-capital financing activity and not as cash provided by operating activities . This resulted in showing more cash being used for operating activities than cash being provided .
Factors Impacting Future PeriodsIvy Tech is well positioned to continue to serve the educational and training needs of Hoosiers . The College is in sound financial shape . Net position continues to grow and the College consistently operates with a positive operating margin . Key financial ratios are strong as evidenced by the Higher Learning Commission’s financial ratios . Both Standard and Poor’s And Fitch Ratings maintain an ‘AA’ bond rating for the College’s long-term debt .
State of Indiana general fund revenues decreased 0 .5% compared to the prior year . The state’s largest source of revenue – sales and use taxes – grew 0 .4% vs . fiscal year 2016 . Individual income tax revenue declined 0 .3% due to a planned reduction in the individual income tax rate . The State ended fiscal year 2015-16 with a combined balance of $2 .2 billion and a $51 million operating surplus, generated by tight expense control of a 0 .6% increase compared to prior year . The most recent economic and revenue forecast (December 2015) projects revenue growth of 2 .8% in fiscal year 2017 . The most recent projection from the Indiana State Budget Agency projects a $120 million operating surplus for the State of Indiana in 2016-17 and combined balances of $1 .9 million after accounting for a one-time transfer of surplus funds to state and local infrastructure needs as directed by the 2015 budget bill . For fiscal year 2015-16, the College has targeted a significant portion of increased tuition revenues and state operating funds toward retention and completion efforts—hiring more full time faculty, adding academic advisors, augmenting coaching, mentoring and tutoring services and upgrading and modernizing laboratory and industrial technology equipment . The College continues to post strong results under Indiana’s performance funding formula which is used to allocate operating funds to the state’s public universities and colleges . Based on this formula, the College’s state operating appropriation is set to increase 3 .4% in 2016-17 .

2016 | IVY TECH COMMUNITY COLLEGE FINANCIAL REPORT19
Enrollment at Ivy Tech declined in 2015-16, reflecting a continuation of the modest declines for the College in prior years, and consistent with national trends for community colleges. As reflected in the College’s Statement of Revenues, Expenses and Changes in Net Position, this contributed to a modest decline in gross tuition revenue. Historical annual unduplicated headcount and FTE are reflected in the charts on pages 19–20.
In June 2015, with the stated goal of improving retention and completion, the College’s Board of Trustees approved a tuition freeze for continuously enrolled students. This freeze took effect for students first enrolling for the Fall semester of 2015 who stay continuously enrolled. For those students who meet the eligibility requirements, their tuition rate, which would otherwise increase in Fall semester of 2016, will be frozen at the Fall 2015 level for as long as they stay continuously enrolled. Based on fall enrollment data approximately 6,300 students qualified for the freeze which is expected to impact gross tuition and fee revenue by less than $1 million in FY 2016-17.
• Note: the annualized FTE number for the fiscal year 2015-16 is an estimate as of the publishing of these financial statements.
• Note: the annualized Headcount number for the fiscal year 2015-16 is an estimate as of the publishing of these financial statements.

IVY TECH COMMUNITY COLLEGE FINANCIAL REPORT | 201620
Authorized FacilitiesDuring the 2015 General Assembly, Ivy Tech did not receive approval for any capital projects or bonding authority . All previously authorized projects including: Indianapolis Phase III $23 .1 million, Anderson $20 .0 million and Bloomington $20 .0 million were completed in 2015 and early 2016 .
Ivy Tech received legislative approval in 2014 for the Hamilton County project with a $12 .0 million cash appropriation and approval for a $6 .0 million addition project funded by city and community funds to the Lawrenceburg Lakefront Campus . Both projects were nearly complete at June 30, 2016 .
2016 | IVY TECH COMMUNITY COLLEGE FINANCIAL REPORT21
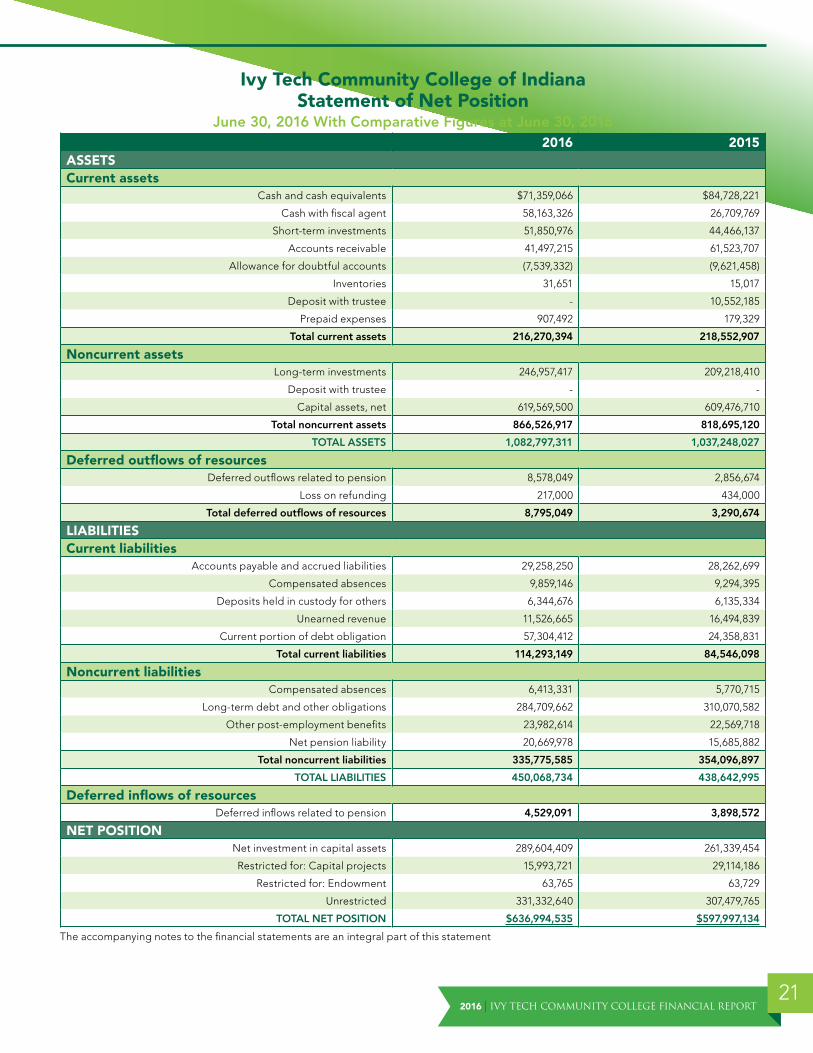
Ivy Tech Community College of Indiana Statement of Net Position
June 30, 2016 With Comparative Figures at June 30, 20152016 2015
ASSETSCurrent assets
Cash and cash equivalents $71,359,066 $84,728,221
Cash with fiscal agent 58,163,326 26,709,769
Short-term investments 51,850,976 44,466,137
Accounts receivable 41,497,215 61,523,707
Allowance for doubtful accounts (7,539,332) (9,621,458)
Inventories 31,651 15,017
Deposit with trustee - 10,552,185
Prepaid expenses 907,492 179,329
Total current assets 216,270,394 218,552,907
Noncurrent assetsLong-term investments 246,957,417 209,218,410
Deposit with trustee - -
Capital assets, net 619,569,500 609,476,710
Total noncurrent assets 866,526,917 818,695,120
TOTAL ASSETS 1,082,797,311 1,037,248,027
Deferred outflows of resourcesDeferred outflows related to pension 8,578,049 2,856,674
Loss on refunding 217,000 434,000
Total deferred outflows of resources 8,795,049 3,290,674
LIABILITIESCurrent liabilities
Accounts payable and accrued liabilities 29,258,250 28,262,699
Compensated absences 9,859,146 9,294,395
Deposits held in custody for others 6,344,676 6,135,334
Unearned revenue 11,526,665 16,494,839
Current portion of debt obligation 57,304,412 24,358,831
Total current liabilities 114,293,149 84,546,098
Noncurrent liabilitiesCompensated absences 6,413,331 5,770,715
Long-term debt and other obligations 284,709,662 310,070,582
Other post-employment benefits 23,982,614 22,569,718
Net pension liability 20,669,978 15,685,882
Total noncurrent liabilities 335,775,585 354,096,897
TOTAL LIABILITIES 450,068,734 438,642,995
Deferred inflows of resourcesDeferred inflows related to pension 4,529,091 3,898,572
NET POSITIONNet investment in capital assets 289,604,409 261,339,454
Restricted for: Capital projects 15,993,721 29,114,186
Restricted for: Endowment 63,765 63,729
Unrestricted 331,332,640 307,479,765
TOTAL NET POSITION $636,994,535 $597,997,134
The accompanying notes to the financial statements are an integral part of this statement
IVY TECH COMMUNITY COLLEGE FINANCIAL REPORT | 201622
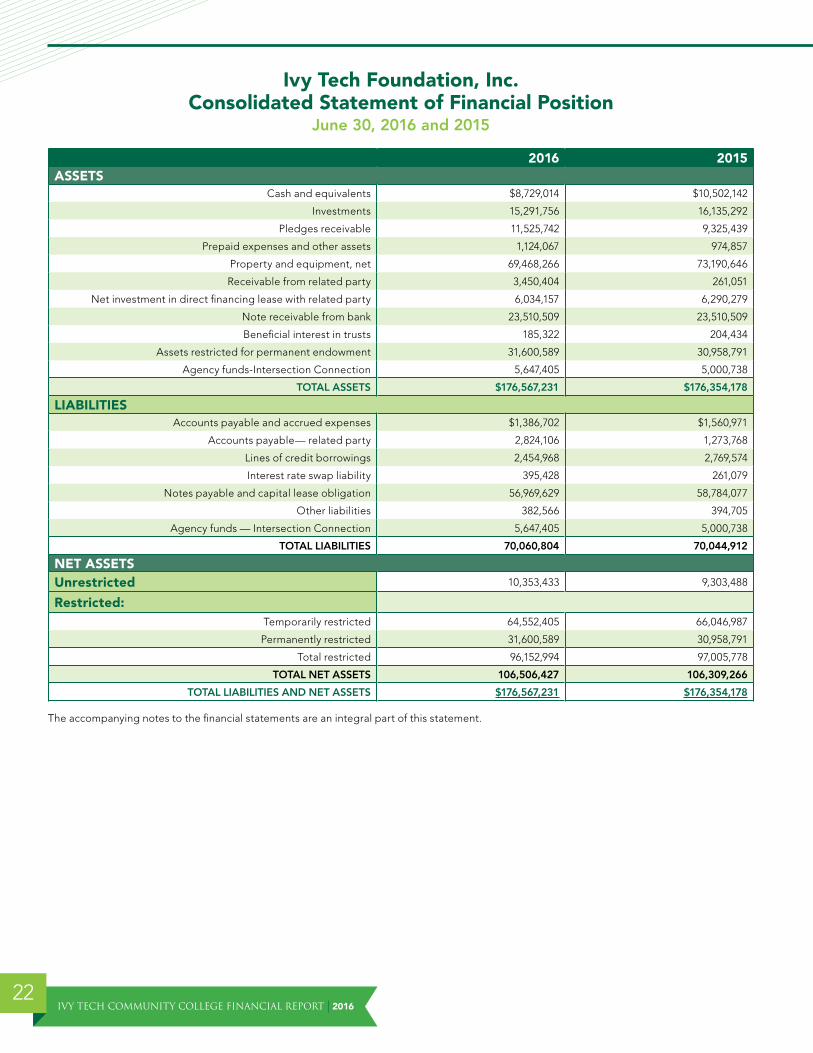
Ivy Tech Foundation, Inc. Consolidated Statement of Financial Position
June 30, 2016 and 2015
2016 2015ASSETS
Cash and equivalents $8,729,014 $10,502,142
Investments 15,291,756 16,135,292
Pledges receivable 11,525,742 9,325,439
Prepaid expenses and other assets 1,124,067 974,857
Property and equipment, net 69,468,266 73,190,646
Receivable from related party 3,450,404 261,051
Net investment in direct financing lease with related party 6,034,157 6,290,279
Note receivable from bank 23,510,509 23,510,509
Beneficial interest in trusts 185,322 204,434
Assets restricted for permanent endowment 31,600,589 30,958,791
Agency funds-Intersection Connection 5,647,405 5,000,738
TOTAL ASSETS $176,567,231 $176,354,178
LIABILITIESAccounts payable and accrued expenses $1,386,702 $1,560,971
Accounts payable— related party 2,824,106 1,273,768
Lines of credit borrowings 2,454,968 2,769,574
Interest rate swap liability 395,428 261,079
Notes payable and capital lease obligation 56,969,629 58,784,077
Other liabilities 382,566 394,705
Agency funds — Intersection Connection 5,647,405 5,000,738
TOTAL LIABILITIES 70,060,804 70,044,912
NET ASSETSUnrestricted 10,353,433 9,303,488
Restricted:Temporarily restricted 64,552,405 66,046,987
Permanently restricted 31,600,589 30,958,791
Total restricted 96,152,994 97,005,778
TOTAL NET ASSETS 106,506,427 106,309,266
TOTAL LIABILITIES AND NET ASSETS $176,567,231 $176,354,178
The accompanying notes to the financial statements are an integral part of this statement .

2016 | IVY TECH COMMUNITY COLLEGE FINANCIAL REPORT23
Ivy Tech Community College of Indiana Statement of Revenues, Expenses, and Changes in Net PositionFor the Year Ended June 30, 2016 With Comparative Figures at June 30, 2015
2016 2015REVENUESOperating Revenues
Student tuition and fees $221,184,594 $232,454,653
Scholarship allowances (88,435,703) (102,589,106)
Net student tuition and fees 132,748,891 129,865,547
Federal grants and contracts 3,029,844 2,025,256
State and local grants and contracts 12,868,810 12,505,519
Nongovernmental grants and contracts 8,555,640 8,065,841
Sales and services of educational departments 1,698,851 1,334,800
Auxiliary enterprises 10,065,782 7,491,642
Other operating revenues 6,020,270 5,282,128
TOTAL OPERATING REVENUES 174,988,088 166,570,733
EXPENSESOperating Expenses
Salaries and wages 239,020,725 233,529,677
Benefits 78,491,196 69,576,917
Scholarships and fellowships 83,943,030 109,343,751
Utilities 11,030,357 10,961,795
Supplies and other services 106,149,898 106,516,060
Depreciation 31,081,349 27,319,649
Amortization of deferred loss on refunding 217,000 235,729
TOTAL OPERATING EXPENSES 549,933,555 557,483,578
Operating income (loss) (374,945,467) (390,912,845)
NONOPERATING REVENUES (EXPENSES)State appropriations 247,064,144 237,787,954
Federal appropriations 1,252,386 1,302,955
Investment income 5,301,016 2,876,423
Interest on capital asset-related debt (11,679,910) (8,989,312)
Governmental grants and contracts-federal 137,958,208 170,870,584
Governmental grants and contracts-state 29,667,054 35,747,480
Student government support (706,058) (789,164)
NET NONOPERATING REVENUES 408,856,840 438,806,920
Income (loss) before other revenues, expenses, gains, or losses 33,911,373 47,894,075
Capital gifts, grants and gain from sale of capital assets 1,038,830 3,361,289
Capital appropriations 4,047,198 15,530,344
Total other revenues, expenses, gains or losses 5,086,028 18,891,633
INCREASE IN NET POSITION 38,997,401 66,785,708
Net position—beginning of year 597,997,134 531,211,426
Net position—end of year $636,994,535 $597,997,134
The accompanying notes to the financial statements are an integral part of this statement
IVY TECH COMMUNITY COLLEGE FINANCIAL REPORT | 201624
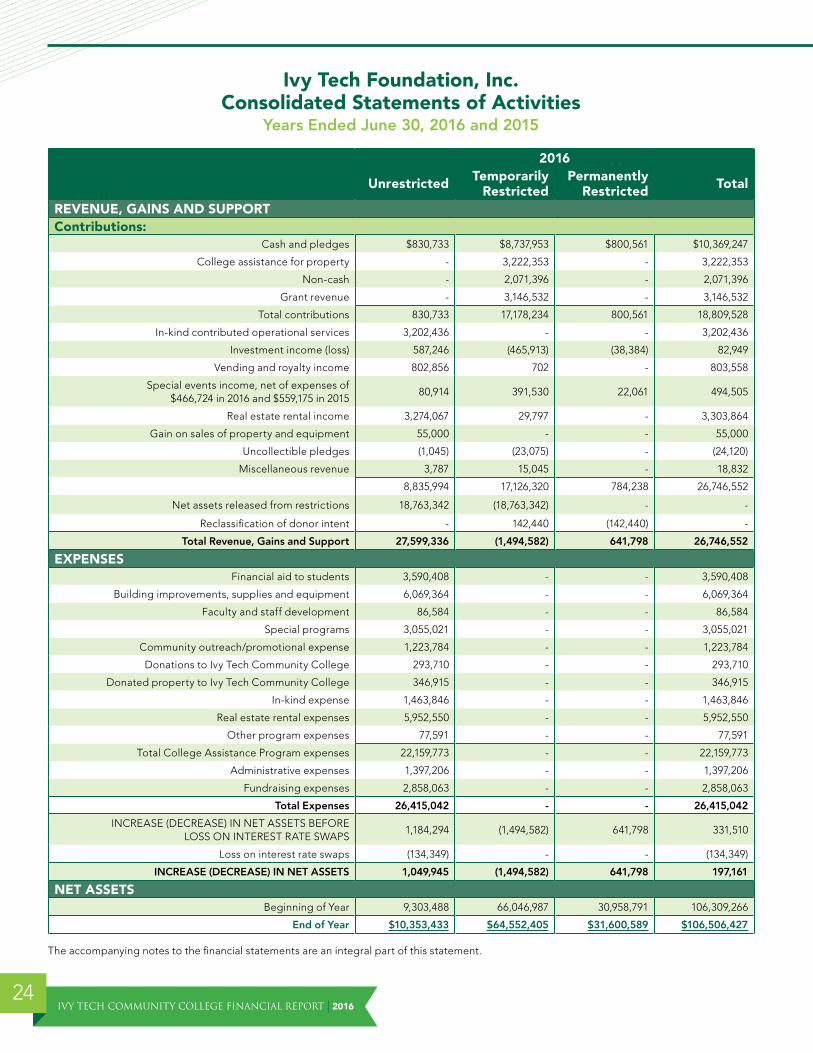
Ivy Tech Foundation, Inc. Consolidated Statements of Activities
Years Ended June 30, 2016 and 2015
2016
Unrestricted Temporarily Restricted
Permanently Restricted Total
REVENUE, GAINS AND SUPPORTContributions:
Cash and pledges $830,733 $8,737,953 $800,561 $10,369,247
College assistance for property - 3,222,353 - 3,222,353
Non-cash - 2,071,396 - 2,071,396
Grant revenue - 3,146,532 - 3,146,532
Total contributions 830,733 17,178,234 800,561 18,809,528
In-kind contributed operational services 3,202,436 - - 3,202,436
Investment income (loss) 587,246 (465,913) (38,384) 82,949
Vending and royalty income 802,856 702 - 803,558
Special events income, net of expenses of $466,724 in 2016 and $559,175 in 2015
80,914 391,530 22,061 494,505
Real estate rental income 3,274,067 29,797 - 3,303,864
Gain on sales of property and equipment 55,000 - - 55,000
Uncollectible pledges (1,045) (23,075) - (24,120)
Miscellaneous revenue 3,787 15,045 - 18,832
8,835,994 17,126,320 784,238 26,746,552
Net assets released from restrictions 18,763,342 (18,763,342) - -
Reclassification of donor intent - 142,440 (142,440) -
Total Revenue, Gains and Support 27,599,336 (1,494,582) 641,798 26,746,552
EXPENSESFinancial aid to students 3,590,408 - - 3,590,408
Building improvements, supplies and equipment 6,069,364 - - 6,069,364
Faculty and staff development 86,584 - - 86,584
Special programs 3,055,021 - - 3,055,021
Community outreach/promotional expense 1,223,784 - - 1,223,784
Donations to Ivy Tech Community College 293,710 - - 293,710
Donated property to Ivy Tech Community College 346,915 - - 346,915
In-kind expense 1,463,846 - - 1,463,846
Real estate rental expenses 5,952,550 - - 5,952,550
Other program expenses 77,591 - - 77,591
Total College Assistance Program expenses 22,159,773 - - 22,159,773
Administrative expenses 1,397,206 - - 1,397,206
Fundraising expenses 2,858,063 - - 2,858,063
Total Expenses 26,415,042 - - 26,415,042
INCREASE (DECREASE) IN NET ASSETS BEFORE LOSS ON INTEREST RATE SWAPS
1,184,294 (1,494,582) 641,798 331,510
Loss on interest rate swaps (134,349) - - (134,349)
INCREASE (DECREASE) IN NET ASSETS 1,049,945 (1,494,582) 641,798 197,161
NET ASSETSBeginning of Year 9,303,488 66,046,987 30,958,791 106,309,266
End of Year $10,353,433 $64,552,405 $31,600,589 $106,506,427
The accompanying notes to the financial statements are an integral part of this statement .
2016 | IVY TECH COMMUNITY COLLEGE FINANCIAL REPORT25
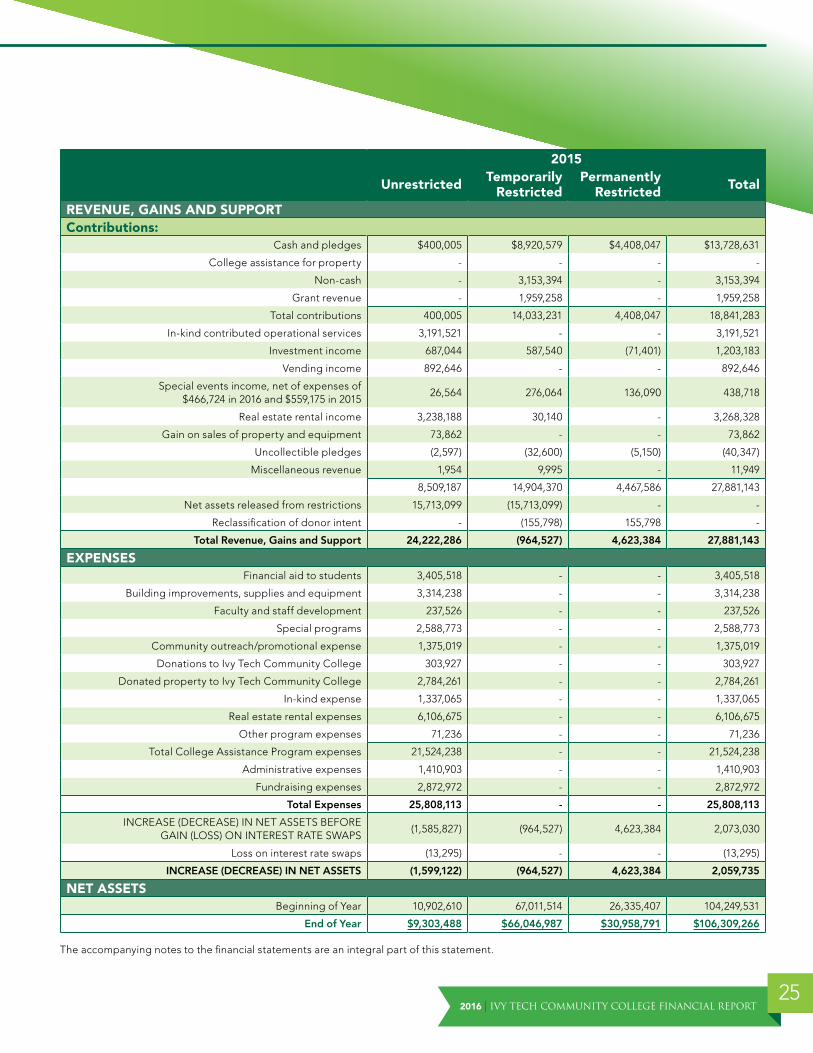
2015
Unrestricted Temporarily Restricted
Permanently Restricted Total
REVENUE, GAINS AND SUPPORTContributions:
Cash and pledges $400,005 $8,920,579 $4,408,047 $13,728,631
College assistance for property - - - -
Non-cash - 3,153,394 - 3,153,394
Grant revenue - 1,959,258 - 1,959,258
Total contributions 400,005 14,033,231 4,408,047 18,841,283
In-kind contributed operational services 3,191,521 - - 3,191,521
Investment income 687,044 587,540 (71,401) 1,203,183
Vending income 892,646 - - 892,646
Special events income, net of expenses of $466,724 in 2016 and $559,175 in 2015
26,564 276,064 136,090 438,718
Real estate rental income 3,238,188 30,140 - 3,268,328
Gain on sales of property and equipment 73,862 - - 73,862
Uncollectible pledges (2,597) (32,600) (5,150) (40,347)
Miscellaneous revenue 1,954 9,995 - 11,949
8,509,187 14,904,370 4,467,586 27,881,143
Net assets released from restrictions 15,713,099 (15,713,099) - -
Reclassification of donor intent - (155,798) 155,798 -
Total Revenue, Gains and Support 24,222,286 (964,527) 4,623,384 27,881,143
EXPENSESFinancial aid to students 3,405,518 - - 3,405,518
Building improvements, supplies and equipment 3,314,238 - - 3,314,238
Faculty and staff development 237,526 - - 237,526
Special programs 2,588,773 - - 2,588,773
Community outreach/promotional expense 1,375,019 - - 1,375,019
Donations to Ivy Tech Community College 303,927 - - 303,927
Donated property to Ivy Tech Community College 2,784,261 - - 2,784,261
In-kind expense 1,337,065 - - 1,337,065
Real estate rental expenses 6,106,675 - - 6,106,675
Other program expenses 71,236 - - 71,236
Total College Assistance Program expenses 21,524,238 - - 21,524,238
Administrative expenses 1,410,903 - - 1,410,903
Fundraising expenses 2,872,972 - - 2,872,972
Total Expenses 25,808,113 - - 25,808,113
INCREASE (DECREASE) IN NET ASSETS BEFORE GAIN (LOSS) ON INTEREST RATE SWAPS
(1,585,827) (964,527) 4,623,384 2,073,030
Loss on interest rate swaps (13,295) - - (13,295)
INCREASE (DECREASE) IN NET ASSETS (1,599,122) (964,527) 4,623,384 2,059,735
NET ASSETSBeginning of Year 10,902,610 67,011,514 26,335,407 104,249,531
End of Year $9,303,488 $66,046,987 $30,958,791 $106,309,266
The accompanying notes to the financial statements are an integral part of this statement .

IVY TECH COMMUNITY COLLEGE FINANCIAL REPORT | 201626
Ivy Tech Community College of Indiana Statement of Cash Flows
For the Year Ended June 30, 2016 With Comparative Figures at June 30, 2015
2016 2015CASH FLOWS FROM OPERATING ACTIVITIES
Tuition and fees $128,491,599 $130,613,056
Gifts, grants and contracts 33,824,517 8,143,356
Auxiliary enterprises 10,238,919 7,392,739
Sales and services of educational departments 1,698,851 1,334,800
Payments to suppliers (118,234,950) (126,269,372)
Payments to or on behalf of employees (313,975,878) (301,828,092)
Payments to students (83,943,030) (109,343,751)
Other receipts (payments) 6,020,270 5,282,128
NET CASH PROVIDED (USED) BY OPERATING ACTIVITIES (335,879,702) (384,675,136)
CASH FLOWS FROM NONCAPITAL FINANCING ACTIVITIESFederal and state scholarships & grants 167,625,262 206,618,064
State appropriations 251,152,938 233,699,160
Receipts from direct federal loan proceeds 94,299,087 126,306,937
Payments from direct federal loan proceeds to students/financial institutions (94,116,520) (126,143,690)
Other nonoperating receipts (payments) (706,058) 630,374
NET CASH PROVIDED (USED) BY NONCAPITAL FINANCING ACTIVITIES 418,254,709 441,110,845
CASH FLOW FROM CAPITAL AND RELATED FINANCING ACTIVITIESCapital/federal appropriations 5,299,584 16,833,299
Deposit with trustee 13,454,081 41,603,149
Proceeds from issuance of capital debt 31,950,472 6,840,000
Purchase of capital assets (31,636,082) (60,890,622)
Proceeds from sale of capital assets 448,201 -
Principal paid on capital-related debt (63,260,912) (30,141,819)
Interest paid on capital-related debt (13,035,989) (13,263,305)
NET CASH PROVIDED (USED) BY CAPITAL AND RELATED FINANCING ACTIVITIES (56,780,645) (39,019,298)
CASH FLOW FROM INVESTING ACTIVITIESPurchase of investments (50,000,000) (30,000,000)
Proceeds from sales and maturities of investments 4,876,154 39,999,228
Income on investments 6,160,329 4,375,935
NET CASH PROVIDED (USED) BY INVESTING ACTIVITIES (38,963,517) 14,375,163
Net increase (decrease) in cash (13,369,155) 31,791,574
Cash and cash equivalents–beginning of year 84,728,221 52,936,647
Cash and cash equivalents–end of year $71,359,066 $84,728,221
2016 | IVY TECH COMMUNITY COLLEGE FINANCIAL REPORT27
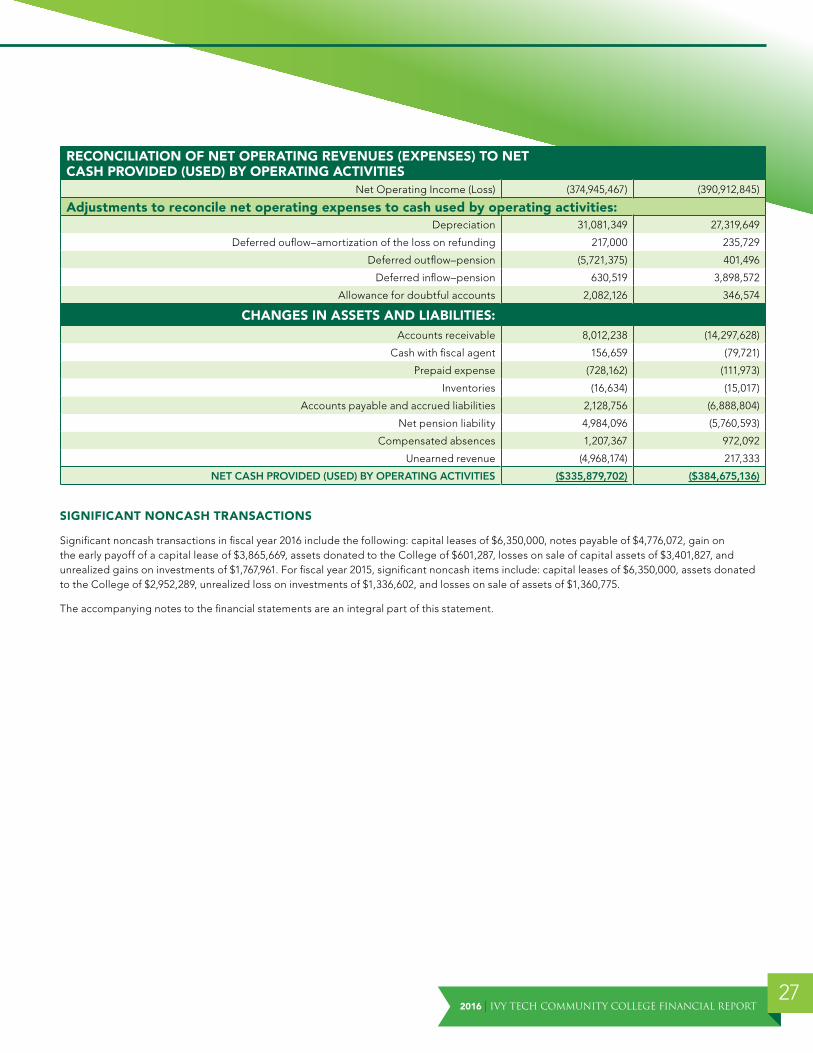
RECONCILIATION OF NET OPERATING REVENUES (EXPENSES) TO NET CASH PROVIDED (USED) BY OPERATING ACTIVITIES
Net Operating Income (Loss) (374,945,467) (390,912,845)
Adjustments to reconcile net operating expenses to cash used by operating activities:Depreciation 31,081,349 27,319,649
Deferred ouflow–amortization of the loss on refunding 217,000 235,729
Deferred outflow–pension (5,721,375) 401,496
Deferred inflow–pension 630,519 3,898,572
Allowance for doubtful accounts 2,082,126 346,574
CHANGES IN ASSETS AND LIABILITIES:Accounts receivable 8,012,238 (14,297,628)
Cash with fiscal agent 156,659 (79,721)
Prepaid expense (728,162) (111,973)
Inventories (16,634) (15,017)
Accounts payable and accrued liabilities 2,128,756 (6,888,804)
Net pension liability 4,984,096 (5,760,593)
Compensated absences 1,207,367 972,092
Unearned revenue (4,968,174) 217,333
NET CASH PROVIDED (USED) BY OPERATING ACTIVITIES ($335,879,702) ($384,675,136)
SIGNIFICANT NONCASH TRANSACTIONS
Significant noncash transactions in fiscal year 2016 include the following: capital leases of $6,350,000, notes payable of $4,776,072, gain on the early payoff of a capital lease of $3,865,669, assets donated to the College of $601,287, losses on sale of capital assets of $3,401,827, and unrealized gains on investments of $1,767,961 . For fiscal year 2015, significant noncash items include: capital leases of $6,350,000, assets donated to the College of $2,952,289, unrealized loss on investments of $1,336,602, and losses on sale of assets of $1,360,775 .
The accompanying notes to the financial statements are an integral part of this statement .
IVY TECH COMMUNITY COLLEGE FINANCIAL REPORT | 201628
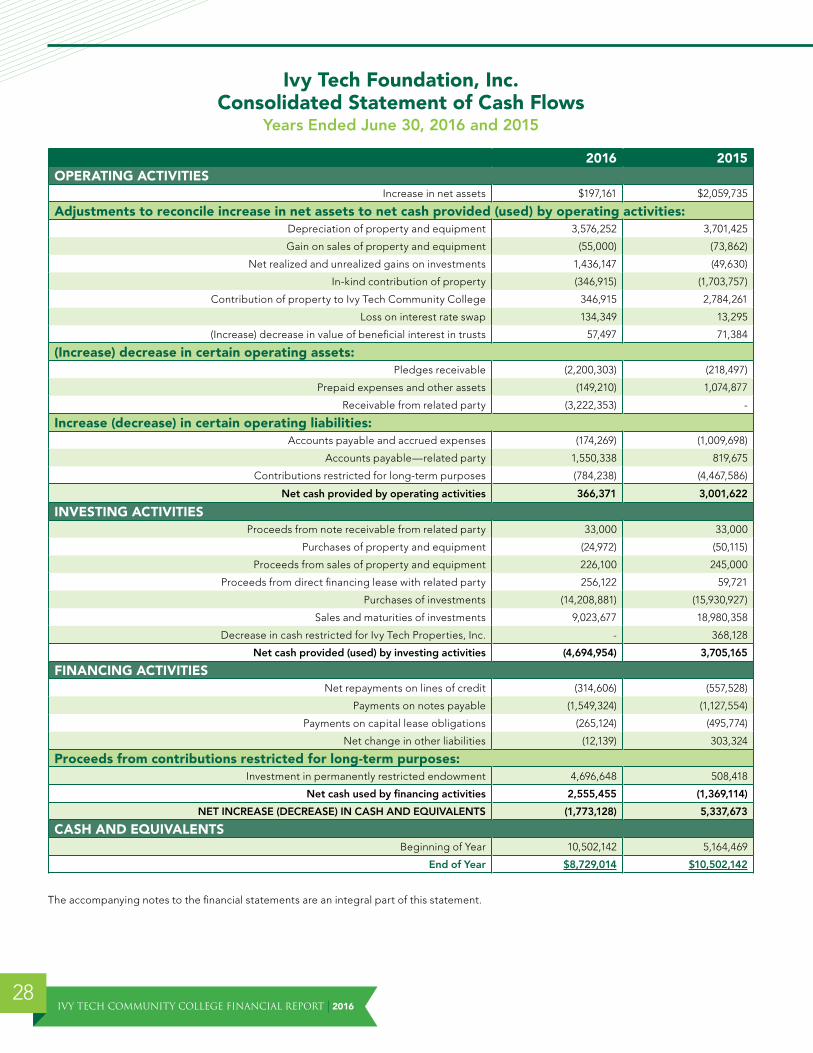
Ivy Tech Foundation, Inc. Consolidated Statement of Cash Flows
Years Ended June 30, 2016 and 2015
2016 2015OPERATING ACTIVITIES
Increase in net assets $197,161 $2,059,735
Adjustments to reconcile increase in net assets to net cash provided (used) by operating activities:Depreciation of property and equipment 3,576,252 3,701,425
Gain on sales of property and equipment (55,000) (73,862)
Net realized and unrealized gains on investments 1,436,147 (49,630)
In-kind contribution of property (346,915) (1,703,757)
Contribution of property to Ivy Tech Community College 346,915 2,784,261
Loss on interest rate swap 134,349 13,295
(Increase) decrease in value of beneficial interest in trusts 57,497 71,384
(Increase) decrease in certain operating assets:Pledges receivable (2,200,303) (218,497)
Prepaid expenses and other assets (149,210) 1,074,877
Receivable from related party (3,222,353) -
Increase (decrease) in certain operating liabilities:Accounts payable and accrued expenses (174,269) (1,009,698)
Accounts payable—related party 1,550,338 819,675
Contributions restricted for long-term purposes (784,238) (4,467,586)
Net cash provided by operating activities 366,371 3,001,622
INVESTING ACTIVITIESProceeds from note receivable from related party 33,000 33,000
Purchases of property and equipment (24,972) (50,115)
Proceeds from sales of property and equipment 226,100 245,000
Proceeds from direct financing lease with related party 256,122 59,721
Purchases of investments (14,208,881) (15,930,927)
Sales and maturities of investments 9,023,677 18,980,358
Decrease in cash restricted for Ivy Tech Properties, Inc . - 368,128
Net cash provided (used) by investing activities (4,694,954) 3,705,165
FINANCING ACTIVITIESNet repayments on lines of credit (314,606) (557,528)
Payments on notes payable (1,549,324) (1,127,554)
Payments on capital lease obligations (265,124) (495,774)
Net change in other liabilities (12,139) 303,324
Proceeds from contributions restricted for long-term purposes:Investment in permanently restricted endowment 4,696,648 508,418
Net cash used by financing activities 2,555,455 (1,369,114)
NET INCREASE (DECREASE) IN CASH AND EQUIVALENTS (1,773,128) 5,337,673
CASH AND EQUIVALENTSBeginning of Year 10,502,142 5,164,469
End of Year $8,729,014 $10,502,142
The accompanying notes to the financial statements are an integral part of this statement .

2016 | IVY TECH COMMUNITY COLLEGE FINANCIAL REPORT29
IVY TECH FOUNDATION, INC. CONSOLIDATED STATEMENTS OF CASH FLOWS (CONTINUED) YEARS ENDED JUNE 30, 2016 AND 2015
SUPPLEMENTAL DISCLOSURES 2016 2015Interest paid $1,376,220 $1,088,350
Noncash investing and financing activities:In-kind contribution of property 346,915 1,703,757
Contribution of property to Ivy Tech Community College 346,915 2,784,261
Assets acquired through capital lease obligation - 6,350,000
Net investment in direct financing lease with related party - 6,350,000
Note payable refinanced - 6,000,000
Payments on line of credit made by related party - 360,174
The accompanying notes to the financial statements are an integral part of this statement .

IVY TECH COMMUNITY COLLEGE FINANCIAL REPORT | 201630
IVY TECH COMMUNITY COLLEGE OF INDIANA NOTES TO FINANCIAL STATEMENTS JUNE 30, 2016I. Summary of Significant Accounting Policies
A. GENERAL INFORMATION
Ivy Tech Community College of Indiana (Ivy Tech) prepares Indiana residents to learn, live, and work in a diverse and globally competitive environment by delivering professional, technical, transfer, and lifelong education . Through its affordable, open-access educational and training programs, the College enhances the development of Indiana’s citizens and communities and strengthens its economy . The Indiana General Assembly through IC 20-12-61-2 established Ivy Tech in 1963 . In 2005 the General Assembly adopted Senate Bill 296 which broadened the institution’s mission to include serving as the state’s community college system . Ivy Tech’s official name changed to “Ivy Tech Community College of Indiana .” Ivy Tech is governed by a board of trustees, composed of 14 members, appointed by the governor . Each member of the state board must have knowledge or experience in one or more of the following areas; manufacturing; commerce; labor; agriculture; state and regional economic development needs; or Indiana’s educational delivery system . At least one trustee must reside in each College region . Appointments are made for three year terms on a staggered basis . Ivy Tech has 14 main regional sites located across the State of Indiana . The President’s office and other statewide administrative offices are located in Indianapolis, Indiana .
Ivy Tech Foundation (the Foundation) was incorporated on June 9, 1969, under The Indiana Foundations and Holding Companies Act of 1921 as a corporation organized exclusively for charitable, educational and scientific purposes . The Foundation, whose principal activity is to promote educational, scientific and charitable purposes in connection with or at the request of Ivy Tech Community College (the College), commenced its financial activities with the receipt of various unrestricted contributions in October 1970 and provided $21 .5 million to assist the College during fiscal year 2015-16 . The Foundation currently operates under the Indiana Nonprofit Corporations Law of 1971 as amended, which is codified as IC 23-17 . As required by the Governmental Accounting Standards Board (GASB) Statement No . 39 Determining Whether Certain Organizations Are Component Units and GASB Statement No . 61 The Financial Reporting Entity: Omnibus an amendment of GASB Statements No. 14 and No. 34, the audited financial statements of the Foundation are discretely presented with the College’s financial statements . The Foundation’s fiscal year reporting period is from July 1 through June 30 . Further information regarding the Foundation may be obtained at Ivy Tech Foundation; 50 West Fall Creek Parkway Drive North, Indianapolis, IN 46208-5752 or http://ivytech .edu/giving .
With the implementation of GASB Statement No . 35 Basic Financial Statements and Management’s Discussion and Analysis for Public Colleges and Universities, Ivy Tech is considered a special purpose government . The College has elected to report as a business type activity using proprietary fund accounting and financial reporting model . The College is considered to be a component unit of the State of Indiana .
As such, there is a close relationship between the College and the State of Indiana . The College receives appropriations, program approvals and grants from the State .
The financial statements have been prepared to incorporate all fund groups utilized internally by Ivy Tech . These statements have been prepared in accordance with accounting principles generally accepted in the United States of America as prescribed by GASB Statements No . 34 and 35 . These Statements require the College to report revenues net of discounts and allowances . The following components of the College’s financial statements are also required by GASB Statements No . 34 and 35:
• Management’s Discussion and Analysis
• Basic financial statements including a Statement of Net Position, Statement of Revenues, Expenses and Changes in Net Position, and Statement of Cash Flows for the College as a whole
• Notes to the financial statements
There were new GASB statements that were effective for the fiscal year 2015-16 . The new standards were reviewed and any required changes were incorporated . Specifically GASB Statement No . 72 Fair Value Measurement and Application, GASB Statement No . 73 Accounting and Financial Reporting for Pensions and Related Assets That Are Not within the Scope of GASB Statement 68, and Amendments to Certain Provisions of GASB Statements 67 and 68, and GASB Statement No . 76, The Hierarchy of Generally Accepted Accounting Principles for State and Local Governments . The implementation of GASB Statement No . 72 required the College to include the hierarchy of inputs to valuation techniques which were used to measure the fair value of investments . The implementation of GASB Statement No . 73, required additional disclosures within the Retirement Plans Note IX .
B. MEASUREMENT FOCUS, BASIS OF ACCOUNTING, AND FINANCIAL STATEMENT PRESENTATION
The College’s financial statements are reported using the economic resources measurement focus and the accrual basis of accounting . Revenues are recorded when earned and expenses are recorded when a liability is incurred, regardless of the timing of related cash flows . Grants and similar
2016 | IVY TECH COMMUNITY COLLEGE FINANCIAL REPORT31
items are recognized as revenue as soon as all eligibility requirements imposed by the provider have been met . Eliminations have been made to prevent the double counting of internal activities .
The preparation of financial statements in conformity with accounting principles generally accepted in the United States of America requires management to make estimates and assumptions that affect the reported amounts of assets and liabilities at the date of the financial statements and the reported amounts of revenue and expenses during the reporting period . Actual results could differ from those estimates .
The College utilizes the accounting standard of the establishment of an allowance for doubtful accounts in the Statement of Net Position to reflect receivables that are likely to be uncollectible .
Operating revenues of the College consist of tuition and fees, non-financial aid grants and contracts, sales and services of educational activities and bookstore commission revenues . Transactions related to financial aid grants, capital and related financing activities, non-capital financing activities, investing activities, and State appropriations are components of nonoperating income .
C. CASH AND CASH EQUIVALENTS
Cash and cash equivalents are comprised of cash (in banks and on hand) and investments with maturity dates of 0-90 days at date of purchase as of June 30, 2016 .
D. PREPAID EXPENSES
Prepaid expenses are payments made in the current or a previous fiscal year, which the College has not realized the full value of through fiscal year 2015-16 .
E. CASH WITH FISCAL AGENT
The balance is primarily attributable to the debt principal and interest payment made in fiscal year 2015-16 and not due until July 1, 2016 .
F. CAPITAL ASSETS ACCOUNTING POLICY DISCLOSURE
The College’s capitalization threshold is defined as any non-expendable item, or group of items making up one unit, with a useful life of more than one year, and a unit acquisition cost of $3,000 or more . Library books costing $35 or more are generally capitalized as a group, with the detail maintained and updated periodically as new acquisitions are made or other items are removed .
College capital equipment and facilities are depreciated on a straight line basis dividing the cost of the asset by the appropriate useful life . Building improvements are depreciated over the remaining life of the facilities to which they pertain . Leasehold improvements are depreciated over the remaining life of the asset for capital leases and over the remaining life of the lease for operating leases .
Land improvements 10 years
Buildings 40 years
Building improvements Remaining life of the building
Furniture, fixtures, and equipment 3-8 years
Library books and materials 5 years
Ivy Tech has a minimal amount of infrastructure assets that are components of buildings or land improvements and are depreciated accordingly .
The College capitalizes interest related to construction of major facilities . Capitalized interest is recorded as part of the related asset, and is amortized over the asset’s estimated useful life . The College recognized capitalized interest in the amount of $673 thousand for the year ended June 30, 2016 .
If both restricted and unrestricted resources are to be expended for the same purpose or project, the determination of the portion of the expenses paid from the restricted sources are made on a case-by-case basis .
II. Accrual of Loss ContingencyThe College has been named a party in unasserted claims, assessments, and litigation . College management has reviewed these actions to determine if one (1) it is probable that as of the date of the financial statements, an asset has been impaired or a liability incurred, based on subsequent available information prior to the issuance of the financial statements, and two (2) the amount of the loss can be reasonably estimated .
No accrual of loss contingency has been established, as in the opinion of management, the above conditions do not exist in a material amount .
The College has seven (7) active matters in litigation; two (2) in County Superior Court, four (4) in United States District Court, one (1) in Seventh Circuit Court of Appeals, and six (6) matters with the Equal Employment Opportunity Commission .
In the opinion of management, an unfavorable outcome in these matters will not have a materially adverse effect on the balance sheet of the institution . Management is currently unable to assess the probability of an unfavorable outcome .
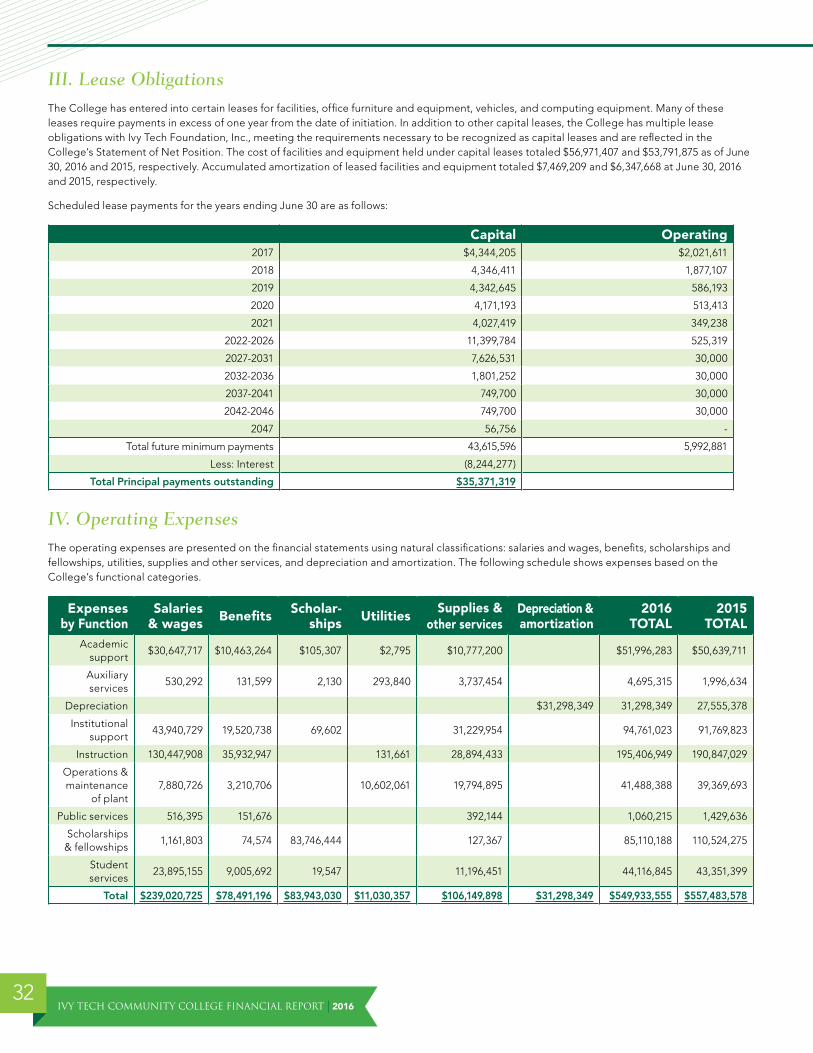
IVY TECH COMMUNITY COLLEGE FINANCIAL REPORT | 201632
III. Lease ObligationsThe College has entered into certain leases for facilities, office furniture and equipment, vehicles, and computing equipment . Many of these leases require payments in excess of one year from the date of initiation . In addition to other capital leases, the College has multiple lease obligations with Ivy Tech Foundation, Inc ., meeting the requirements necessary to be recognized as capital leases and are reflected in the College’s Statement of Net Position . The cost of facilities and equipment held under capital leases totaled $56,971,407 and $53,791,875 as of June 30, 2016 and 2015, respectively . Accumulated amortization of leased facilities and equipment totaled $7,469,209 and $6,347,668 at June 30, 2016 and 2015, respectively .
Scheduled lease payments for the years ending June 30 are as follows:
Capital Operating2017 $4,344,205 $2,021,611
2018 4,346,411 1,877,107
2019 4,342,645 586,193
2020 4,171,193 513,413
2021 4,027,419 349,238
2022-2026 11,399,784 525,319
2027-2031 7,626,531 30,000
2032-2036 1,801,252 30,000
2037-2041 749,700 30,000
2042-2046 749,700 30,000
2047 56,756 -
Total future minimum payments 43,615,596 5,992,881
Less: Interest (8,244,277)
Total Principal payments outstanding $35,371,319
IV. Operating ExpensesThe operating expenses are presented on the financial statements using natural classifications: salaries and wages, benefits, scholarships and fellowships, utilities, supplies and other services, and depreciation and amortization . The following schedule shows expenses based on the College’s functional categories .
Expenses by Function
Salaries & wages Benefits Scholar-
ships UtilitiesSupplies &
other servicesDepreciation & amortization
2016 TOTAL
2015 TOTAL
Academic support
$30,647,717 $10,463,264 $105,307 $2,795 $10,777,200 $51,996,283 $50,639,711
Auxiliary services
530,292 131,599 2,130 293,840 3,737,454 4,695,315 1,996,634
Depreciation $31,298,349 31,298,349 27,555,378
Institutional support
43,940,729 19,520,738 69,602 31,229,954 94,761,023 91,769,823
Instruction 130,447,908 35,932,947 131,661 28,894,433 195,406,949 190,847,029
Operations & maintenance
of plant7,880,726 3,210,706 10,602,061 19,794,895 41,488,388 39,369,693
Public services 516,395 151,676 392,144 1,060,215 1,429,636
Scholarships & fellowships
1,161,803 74,574 83,746,444 127,367 85,110,188 110,524,275
Student services
23,895,155 9,005,692 19,547 11,196,451 44,116,845 43,351,399
Total $239,020,725 $78,491,196 $83,943,030 $11,030,357 $106,149,898 $31,298,349 $549,933,555 $557,483,578

2016 | IVY TECH COMMUNITY COLLEGE FINANCIAL REPORT33
As a percentage of total expenses, scholarships & fellowships decreased 5%, instruction increased 2%, academic support and student services did not change, and the other functional expense categories had increases of 1%. In fiscal year 2015, all of the functional expense categories remained stable compared to fiscal year 2014.
V. Natural Gas ProcurementIvy Tech has entered into contracts to centralize the purchasing of natural gas through fixed and variable rate contracts. The contract period is October 1, 2015 through September 30, 2016. This allows the College to generate cost savings by protecting against increases in the market price of natural gas. In the event the College uses a higher volume than stated in the contract, market price is paid for the amount of the increase. If the quantity used is less than the amount stated in the contract, the remaining volume is sold.
VI. InvestmentsIndiana Code Title 21, Article 21, Chapter 3, Section .3 provides authorization for investment activity. IC 30-4-3.5 (Indiana Prudent Investor Act) requires the State Board of Trustees to act “as a prudent investor would, by considering the purposes, terms, distribution requirements, and other circumstances of the trust. In satisfying this standard, the trustee shall exercise reasonable care, skill, and caution.” The trustees have the responsibility to assure the assets are prudently invested in a manner consistent with the College’s investment policy. The Board has delegated the day-to-day responsibilities for overseeing the investment program to the Sr. Vice President, Chief Financial Officer and General Counsel.
The College’s current investment policy was approved by the Board of Trustees in August 2013 and revised in December 2015. The overall investment allocation is designed in accordance with the College’s Investment Philosophy and Objectives, and the portfolio shall maintain a prudently diversified investment portfolio. The investment structure is divided into liquidity tiers to provide for income maximization while meeting the daily liquidity requirements of the College.
Authorized investments include certificates of deposit, interest-bearing deposit accounts, U.S. Government Treasury securities, U.S. Government agency securities, repurchase agreements, commercial paper, money market accounts, investment grade corporate bonds and notes, municipal bonds, and asset and mortgage backed securities.
A. FAIR VALUE MEASUREMENT
As mentioned previously, the mission of Ivy Tech is to prepare Indiana residents to learn, live, and work in a diverse and globally competitive environment by delivering professional, technical, transfer, and lifelong education. Ivy Tech’s investment portfolio is a source of funds for current and future operations of the College. GASB Statement No. 72, Fair Value Measurement & Application, states that investments must be measured at fair value. There are 3 levels of measuring fair value. Level 1 consists of quoted prices for identical assets or liabilities in an active market at the measurement date. Level 2 are prices other than those included within Level 1 that are observable, directly or indirectly, and consist of quoted prices for similar assets or liabilities in active or non-active markets. Level 3 are significant, unobservable inputs.
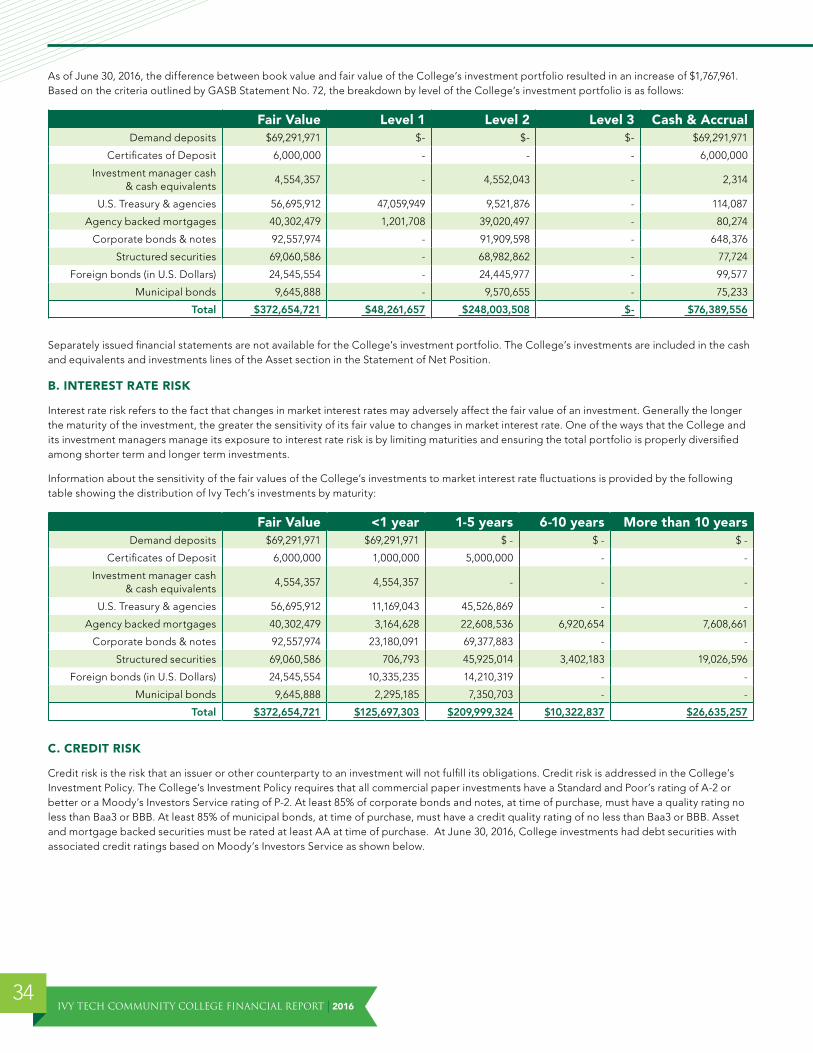
IVY TECH COMMUNITY COLLEGE FINANCIAL REPORT | 201634
As of June 30, 2016, the difference between book value and fair value of the College’s investment portfolio resulted in an increase of $1,767,961 . Based on the criteria outlined by GASB Statement No . 72, the breakdown by level of the College’s investment portfolio is as follows:
Fair Value Level 1 Level 2 Level 3 Cash & AccrualDemand deposits $69,291,971 $- $- $- $69,291,971
Certificates of Deposit 6,000,000 - - - 6,000,000
Investment manager cash & cash equivalents
4,554,357 - 4,552,043 - 2,314
U .S . Treasury & agencies 56,695,912 47,059,949 9,521,876 - 114,087
Agency backed mortgages 40,302,479 1,201,708 39,020,497 - 80,274
Corporate bonds & notes 92,557,974 - 91,909,598 - 648,376
Structured securities 69,060,586 - 68,982,862 - 77,724
Foreign bonds (in U .S . Dollars) 24,545,554 - 24,445,977 - 99,577
Municipal bonds 9,645,888 - 9,570,655 - 75,233
Total $372,654,721 $48,261,657 $248,003,508 $- $76,389,556
Separately issued financial statements are not available for the College’s investment portfolio . The College’s investments are included in the cash and equivalents and investments lines of the Asset section in the Statement of Net Position .
B. INTEREST RATE RISK
Interest rate risk refers to the fact that changes in market interest rates may adversely affect the fair value of an investment . Generally the longer the maturity of the investment, the greater the sensitivity of its fair value to changes in market interest rate . One of the ways that the College and its investment managers manage its exposure to interest rate risk is by limiting maturities and ensuring the total portfolio is properly diversified among shorter term and longer term investments .
Information about the sensitivity of the fair values of the College’s investments to market interest rate fluctuations is provided by the following table showing the distribution of Ivy Tech’s investments by maturity:
Fair Value <1 year 1-5 years 6-10 years More than 10 yearsDemand deposits $69,291,971 $69,291,971 $ - $ - $ -
Certificates of Deposit 6,000,000 1,000,000 5,000,000 - -
Investment manager cash & cash equivalents
4,554,357 4,554,357 - - -
U .S . Treasury & agencies 56,695,912 11,169,043 45,526,869 - -
Agency backed mortgages 40,302,479 3,164,628 22,608,536 6,920,654 7,608,661
Corporate bonds & notes 92,557,974 23,180,091 69,377,883 - -
Structured securities 69,060,586 706,793 45,925,014 3,402,183 19,026,596
Foreign bonds (in U .S . Dollars) 24,545,554 10,335,235 14,210,319 - -
Municipal bonds 9,645,888 2,295,185 7,350,703 - -
Total $372,654,721 $125,697,303 $209,999,324 $10,322,837 $26,635,257
C. CREDIT RISK
Credit risk is the risk that an issuer or other counterparty to an investment will not fulfill its obligations . Credit risk is addressed in the College’s Investment Policy . The College’s Investment Policy requires that all commercial paper investments have a Standard and Poor’s rating of A-2 or better or a Moody’s Investors Service rating of P-2 . At least 85% of corporate bonds and notes, at time of purchase, must have a quality rating no less than Baa3 or BBB . At least 85% of municipal bonds, at time of purchase, must have a credit quality rating of no less than Baa3 or BBB . Asset and mortgage backed securities must be rated at least AA at time of purchase . At June 30, 2016, College investments had debt securities with associated credit ratings based on Moody’s Investors Service as shown below .

2016 | IVY TECH COMMUNITY COLLEGE FINANCIAL REPORT35
Fair Value AAA Aa and A* Baa Ba and B** Cash and Short Term Liquid Investments Not Rated
Demand deposits $69,291,971 $- $- $ - $ - $69,291,971 $-
Certificates of Deposit
6,000,000 - - - - - 6,000,000
Investment manager cash & cash equivalents
4,554,357 100,001 92,296 - - 4,362,060 -
U .S . Treasury & agencies
56,695,912 56,695,912 - - - - -
Agency backed mortgages
40,302,479 2,951,854 - - - - 37,350,625
Corporate bonds & notes
92,557,974 1,692,940 52,500,841 30,518,402 4,901,446 - 2,944,345
Structured securities 69,060,586 49,046,595 640,455 - - - 19,373,536
Foreign bonds (in U .S . Dollars)
24,545,554 2,789,743 18,174,383 2,864,663 716,765 - -
Municipal bonds 9,645,888 842,037 6,087,595 - 25,570 - 2,690,686
Total $372,654,721 $114,119,082 $77,495,570 $33,383,065 $5,643,781 $73,654,031 $68,359,192
As a percentage of total portfolio
- 30 .6% 20 .8% 9 .0% 1 .5% 19 .8% 18 .3%
*Aa and A is comprised of $22,229,960 in Aa **Ba and B is comprised of $3,752,715 in Ba
D. CONCENTRATION OF CREDIT RISK
In the allocation of assets, diversification of investments among asset classes that are not similarly affected by economic, political, or social developments is a highly desirable objective of credit risk . Thus to avoid undue risk concentrations in any single asset class or investment category, the College’s policy requires that certificates of deposit at any one bank do not exceed twenty percent (20%) of the College’s total investment portfolio at the time of investment . Commercial paper may not exceed sixty-five percent (65%) of total investments, and no more than one million ($1,000,000) or ten percent (10%) of the College’s total investment, whichever is less, may be invested in any one company at one time . No more than twenty-five percent (25%) of the total commercial paper portfolio may be invested in a single industry . Corporate bonds and commercial paper shall not exceed sixty-five percent (65%) of the College’s total investment portfolio, and no security of an individual corporate bond or note issuer shall exceed five percent (5%) of the College’s total investment portfolio . Municipal bonds shall not exceed twenty-five percent (25%) of the College’s investment portfolio, and no security of a municipal bond issuer shall exceed five percent (5%) of the College’s total investment portfolio . Combined exposure to non-Government sectors, including commercial paper, corporates, municipal bonds, mortgage-backed, commercial mortgage-backed and asset-backed securities, shall not exceed eighty-five percent (85%) of the College’s total investment portfolio .
The financial institutions that hold five percent (5%) or more of the College’s investments at June 30, 2016:
Name of Institution Amount PercentageLake City Bank $69,291,971 18 .6%
E. CUSTODIAL CREDIT RISK
The custodial credit risk for investments is the risk that, in the event of the failure of the counterparty to a transaction, a government will not be able to recover the value of investment or collateral securities that are in the possession of an outside party . The College manages custodial credit risk through the types of investments that are allowed by the Investment Policy . As of June 30, 2016, Ivy Tech deposits with financial institutions held in uncollateralized accounts are insured up to $250,000 by the FDIC and in excess of $250,000 by the Indiana Public Deposits Insurance Fund . Certificates of Deposits, totaling $6,000,000 are also covered under the Indiana Public Deposits Insurance Fund, as they were invested in financial institutions on the approved list of depositories for the Public Deposits Insurance Fund .
F. FOREIGN CURRENCY RISK
As of June 30, 2016, all of the College’s accounts are in U .S . dollars and not exposed to foreign currency risk .
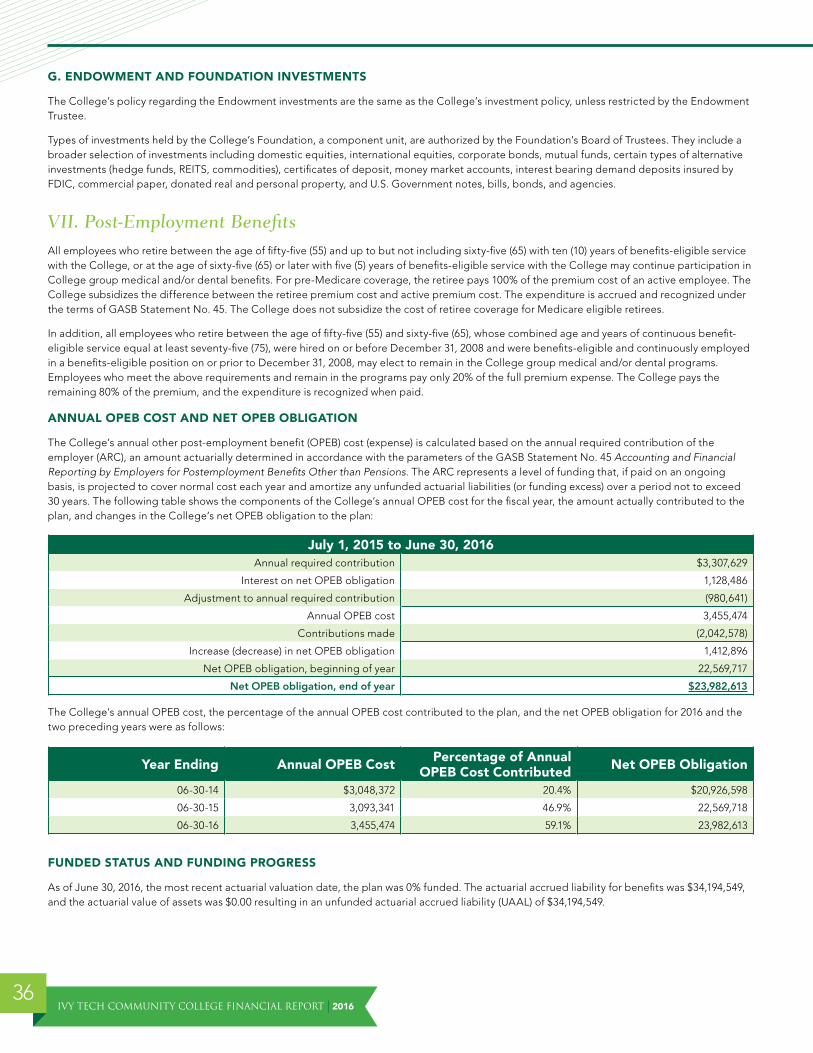
IVY TECH COMMUNITY COLLEGE FINANCIAL REPORT | 201636
G. ENDOWMENT AND FOUNDATION INVESTMENTS
The College’s policy regarding the Endowment investments are the same as the College’s investment policy, unless restricted by the Endowment Trustee .
Types of investments held by the College’s Foundation, a component unit, are authorized by the Foundation’s Board of Trustees . They include a broader selection of investments including domestic equities, international equities, corporate bonds, mutual funds, certain types of alternative investments (hedge funds, REITS, commodities), certificates of deposit, money market accounts, interest bearing demand deposits insured by FDIC, commercial paper, donated real and personal property, and U .S . Government notes, bills, bonds, and agencies .
VII. Post-Employment BenefitsAll employees who retire between the age of fifty-five (55) and up to but not including sixty-five (65) with ten (10) years of benefits-eligible service with the College, or at the age of sixty-five (65) or later with five (5) years of benefits-eligible service with the College may continue participation in College group medical and/or dental benefits . For pre-Medicare coverage, the retiree pays 100% of the premium cost of an active employee . The College subsidizes the difference between the retiree premium cost and active premium cost . The expenditure is accrued and recognized under the terms of GASB Statement No . 45 . The College does not subsidize the cost of retiree coverage for Medicare eligible retirees .
In addition, all employees who retire between the age of fifty-five (55) and sixty-five (65), whose combined age and years of continuous benefit-eligible service equal at least seventy-five (75), were hired on or before December 31, 2008 and were benefits-eligible and continuously employed in a benefits-eligible position on or prior to December 31, 2008, may elect to remain in the College group medical and/or dental programs . Employees who meet the above requirements and remain in the programs pay only 20% of the full premium expense . The College pays the remaining 80% of the premium, and the expenditure is recognized when paid .
ANNUAL OPEB COST AND NET OPEB OBLIGATION
The College’s annual other post-employment benefit (OPEB) cost (expense) is calculated based on the annual required contribution of the employer (ARC), an amount actuarially determined in accordance with the parameters of the GASB Statement No . 45 Accounting and Financial Reporting by Employers for Postemployment Benefits Other than Pensions . The ARC represents a level of funding that, if paid on an ongoing basis, is projected to cover normal cost each year and amortize any unfunded actuarial liabilities (or funding excess) over a period not to exceed 30 years . The following table shows the components of the College’s annual OPEB cost for the fiscal year, the amount actually contributed to the plan, and changes in the College’s net OPEB obligation to the plan:
July 1, 2015 to June 30, 2016Annual required contribution $3,307,629
Interest on net OPEB obligation 1,128,486
Adjustment to annual required contribution (980,641)
Annual OPEB cost 3,455,474
Contributions made (2,042,578)
Increase (decrease) in net OPEB obligation 1,412,896
Net OPEB obligation, beginning of year 22,569,717
Net OPEB obligation, end of year $23,982,613
The College’s annual OPEB cost, the percentage of the annual OPEB cost contributed to the plan, and the net OPEB obligation for 2016 and the two preceding years were as follows:
Year Ending Annual OPEB Cost Percentage of Annual OPEB Cost Contributed Net OPEB Obligation
06-30-14 $3,048,372 20 .4% $20,926,598
06-30-15 3,093,341 46 .9% 22,569,718
06-30-16 3,455,474 59 .1% 23,982,613
FUNDED STATUS AND FUNDING PROGRESS
As of June 30, 2016, the most recent actuarial valuation date, the plan was 0% funded . The actuarial accrued liability for benefits was $34,194,549, and the actuarial value of assets was $0 .00 resulting in an unfunded actuarial accrued liability (UAAL) of $34,194,549 .
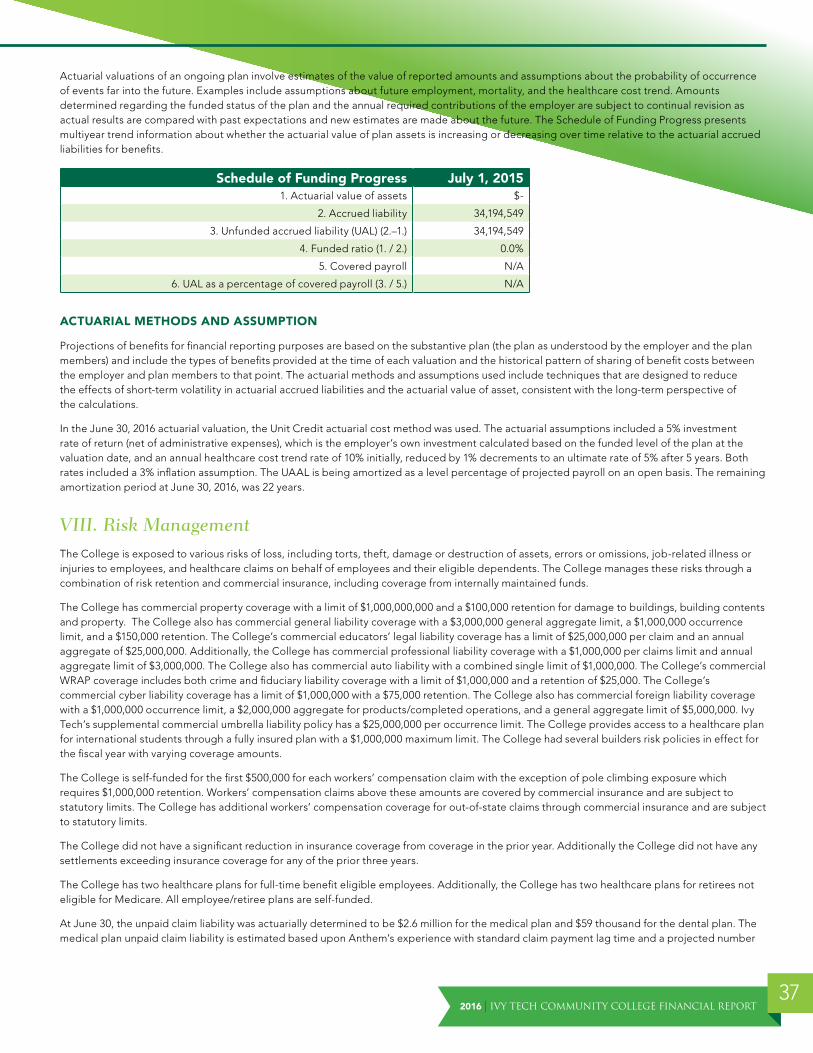
2016 | IVY TECH COMMUNITY COLLEGE FINANCIAL REPORT37
Actuarial valuations of an ongoing plan involve estimates of the value of reported amounts and assumptions about the probability of occurrence of events far into the future . Examples include assumptions about future employment, mortality, and the healthcare cost trend . Amounts determined regarding the funded status of the plan and the annual required contributions of the employer are subject to continual revision as actual results are compared with past expectations and new estimates are made about the future . The Schedule of Funding Progress presents multiyear trend information about whether the actuarial value of plan assets is increasing or decreasing over time relative to the actuarial accrued liabilities for benefits .
Schedule of Funding Progress July 1, 20151 . Actuarial value of assets $-
2 . Accrued liability 34,194,549
3 . Unfunded accrued liability (UAL) (2 .–1 .) 34,194,549
4 . Funded ratio (1 . / 2 .) 0 .0%
5 . Covered payroll N/A
6 . UAL as a percentage of covered payroll (3 . / 5 .) N/A
ACTUARIAL METHODS AND ASSUMPTION
Projections of benefits for financial reporting purposes are based on the substantive plan (the plan as understood by the employer and the plan members) and include the types of benefits provided at the time of each valuation and the historical pattern of sharing of benefit costs between the employer and plan members to that point . The actuarial methods and assumptions used include techniques that are designed to reduce the effects of short-term volatility in actuarial accrued liabilities and the actuarial value of asset, consistent with the long-term perspective of the calculations .
In the June 30, 2016 actuarial valuation, the Unit Credit actuarial cost method was used . The actuarial assumptions included a 5% investment rate of return (net of administrative expenses), which is the employer’s own investment calculated based on the funded level of the plan at the valuation date, and an annual healthcare cost trend rate of 10% initially, reduced by 1% decrements to an ultimate rate of 5% after 5 years . Both rates included a 3% inflation assumption . The UAAL is being amortized as a level percentage of projected payroll on an open basis . The remaining amortization period at June 30, 2016, was 22 years .
VIII. Risk ManagementThe College is exposed to various risks of loss, including torts, theft, damage or destruction of assets, errors or omissions, job-related illness or injuries to employees, and healthcare claims on behalf of employees and their eligible dependents . The College manages these risks through a combination of risk retention and commercial insurance, including coverage from internally maintained funds .
The College has commercial property coverage with a limit of $1,000,000,000 and a $100,000 retention for damage to buildings, building contents and property . The College also has commercial general liability coverage with a $3,000,000 general aggregate limit, a $1,000,000 occurrence limit, and a $150,000 retention . The College’s commercial educators’ legal liability coverage has a limit of $25,000,000 per claim and an annual aggregate of $25,000,000 . Additionally, the College has commercial professional liability coverage with a $1,000,000 per claims limit and annual aggregate limit of $3,000,000 . The College also has commercial auto liability with a combined single limit of $1,000,000 . The College’s commercial WRAP coverage includes both crime and fiduciary liability coverage with a limit of $1,000,000 and a retention of $25,000 . The College’s commercial cyber liability coverage has a limit of $1,000,000 with a $75,000 retention . The College also has commercial foreign liability coverage with a $1,000,000 occurrence limit, a $2,000,000 aggregate for products/completed operations, and a general aggregate limit of $5,000,000 . Ivy Tech’s supplemental commercial umbrella liability policy has a $25,000,000 per occurrence limit . The College provides access to a healthcare plan for international students through a fully insured plan with a $1,000,000 maximum limit . The College had several builders risk policies in effect for the fiscal year with varying coverage amounts .
The College is self-funded for the first $500,000 for each workers’ compensation claim with the exception of pole climbing exposure which requires $1,000,000 retention . Workers’ compensation claims above these amounts are covered by commercial insurance and are subject to statutory limits . The College has additional workers’ compensation coverage for out-of-state claims through commercial insurance and are subject to statutory limits .
The College did not have a significant reduction in insurance coverage from coverage in the prior year . Additionally the College did not have any settlements exceeding insurance coverage for any of the prior three years .
The College has two healthcare plans for full-time benefit eligible employees . Additionally, the College has two healthcare plans for retirees not eligible for Medicare . All employee/retiree plans are self-funded .
At June 30, the unpaid claim liability was actuarially determined to be $2 .6 million for the medical plan and $59 thousand for the dental plan . The medical plan unpaid claim liability is estimated based upon Anthem’s experience with standard claim payment lag time and a projected number

IVY TECH COMMUNITY COLLEGE FINANCIAL REPORT | 201638
of claims in lag . Additionally, the unpaid liability includes $1 .2 million of medical and $76 thousand of dental expense incurred in June and not paid until July .
Changes in the balance of claims liabilities are as follows:
FY 2015-16 FY 2014-15Unpaid claims, 7/01 $2,177,455 $5,122,899
Claims incurred 36,762,515 26,251,916
Claims paid (36,249,539) (29,197,360)
Unpaid claims, 6/30 $2,690,431 $2,177,455
A reserve (the excess of employer share over claims paid) was recognized in the amount of $9 .5 million .
IX. Retirement PlansIvy Tech’s State Board of Trustees has the authority to determine employee benefits and personnel policies . The following describes the retirement plans authorized by the College’s State Board of Trustees .
The College sponsors a defined contribution plan under section 403(b) of the Internal Revenue Code for full-time faculty, administrative staff, and, for full-time support employees and eligible part-time support employees hired on or after July 1, 2014 . The College also participates in the State of Indiana’s defined-benefit pension plan for full-time support employees hired prior to July 1, 2014 . The College also sponsors a defined contribution plan under section 457(b) of the Internal Revenue Code in which all employees are eligible to participate . Additionally, the College sponsors a defined contribution plan under section 401(a) for certain eligible employees of the College . This plan is a governmental plan as defined under section 414(d) and section 3(32) of the Employee Retirement Income Security Act of 1974 . As part of this plan, the College adopted the Qualified Excess Benefit Arrangement (QEBA) under section 415(m) (3) . The sole purpose of the Arrangement is to provide for contributions that would have been made to the 401(a) plan absent the limitations of section 415(c) .
The College provided retirement plan coverage to 2,962 and 3,058 active employees as of June 30, 2016, and June 30, 2015, respectively .
A. IVY TECH COMMUNITY COLLEGE OF INDIANA DEFINED CONTRIBUTION RETIREMENT PLAN
Full-time faculty, administrative staff, full-time support employees hired after July 1, 2014 and eligible part-time support employees are eligible to receive a nonelective contribution to the defined contribution retirement plan sponsored by the College . The College contributes a fixed percentage of compensation on behalf of each eligible employee to the plan . The participation date for eligible employees is determined by their personnel position classification . The employee immediately vests, upon eligibility and participation in the plan .
Prior to June 1, 2016, the record-keeper vendors for the College’s retirement plans were Teachers Insurance and Annuity Association (TIAA) and American United Life Insurance Company (AUL) . On June 1, 2016, the College changed record-keepers to Transamerica Retirement Solutions . Employees may elect to allocate contributions to their retirement plan account between several funding options offered by Transamerica Retirement Solutions . The allocation may be designated in whole or prescribed ratios to a fixed-dollar fund or to a diversified common stock fund(s) .
During the fiscal year ending June 30, 2016, the College remitted $16 .4 million to TIAA/CREF, $2 .6 million to AUL, and $1 .5 million to Transamerica, representing $139 .3 million in total salaries . The total defined contribution pension expense recognized for fiscal year 2015-16 was $20 .5 million . There were no forfeitures recognized by the College during the reporting period, and there are no assets held in a trust as defined in GASB Statement No . 73 . Additionally, the College had a defined contribution retirement plan liability of $4,041 as of June 30, 2016 . On June 30, 2016, there were 2,353 employees participating in the defined contribution retirement plan .
All employees of the College are also eligible to voluntarily defer a portion of their salary to this retirement plan .
B. PUBLIC EMPLOYEES’ RETIREMENT FUND
Plan Description
The Indiana Public Retirement System (INPRS) administers nine pension trust funds including eight defined benefit retirement plans and one defined contribution retirement plan, two other post-employment benefit funds and one agency fund . The College participates in the Public Employees’ Retirement Fund (PERF) for full-time, non-exempt employees hired prior to July 1, 2014, which is one of the eight defined benefit retirement plans .
The PERF is a cost sharing multiple-employer defined benefit plan based on 35 IAC 21-1-1, 35 IAC 21-1-2 and amended IC 5-10 .2-2-11(b) . PERF was established to provide retirement, disability, and survivor benefits to full-time employees of the State of Indiana not covered by another plan, those political subdivisions that elect to participate in the retirement plan, and certain INPRS employees . There are two tiers to the PERF Plan . The first is the Public Employees’ Defined Benefit Plan (PERF Hybrid Plan) and the second is the Public Employees’ Annuity Savings Account Only Plan (PERF ASA Only Plan) . The College participates in the PERF Hybrid Plan .
2016 | IVY TECH COMMUNITY COLLEGE FINANCIAL REPORT39
The PERF Hybrid Plan was established by the Indiana Legislature in 1945 and is governed by the INPRS Board of Trustees in accordance with Indiana Code (IC) 5-10 .2, IC 5-10 .3, and IC 5-10 .5 . There are two aspects to the PERF Hybrid Plan defined benefit structure . The first portion is the monthly defined benefit pension that is funded by the employer . The second portion of the PERF Hybrid Plan benefit structure is the annuity savings account (ASA) that supplements the defined benefit at retirement .
Complete financial statements for INPRS are available online at www .in .gov/inprs/annualreports .htm
Membership
PERF members are officers and employees of units of State and local governments in Indiana (referred to as political subdivisions), including counties, cities, towns, townships, libraries, and school corporations . The political subdivisions become participants by ordinance or resolution of the governing body, which specifies the classifications of employees who will become members of the plan . The ordinance or resolution is filed with and approved by INPRS . In order to be a member, employees hired after June 30, 1982, except employees of a participating school corporation, must occupy positions normally requiring performance of service of more than 1,000 hours during a year .
Contributions
The College is obligated by statute to make contributions to PERF, which are determined by the INPRS Board of Trustees based on actuarial investigation and valuation in accordance with IC 5-10 .2-2-11 . The funding policy provides for periodic employer contributions at actuarially determined rates that, expressed as percentages of annual covered payroll, are sufficient to fund the pension benefits when they become due . As PERF is a cost-sharing plan, all risks and costs, including benefit costs, are shared proportionately by the participating employers . During fiscal year 2016, the College was required to contribute 11 .2% of covered payroll, which totaled $2,365,110 . In fiscal year 2015, the College contributed $2,729,685 . The PERF Hybrid Plan members contribute 3% of covered payroll to their annuity savings account, which is not used to fund the defined benefit pension for the PERF Hybrid Plan . The employer may elect to make the contributions to the annuity savings account on behalf of the member, which is the case with the College .
Retirement Benefits – Defined Benefit Pension
The PERF Hybrid Plan retirement benefit consists of the sum of a defined pension benefit provided by employer contributions plus the amount credited to the member’s annuity savings account . Pension benefits (non ASA) vest after 10 years of creditable service . Members are immediately vested in their annuity savings account .
A member who has reached age 65 and has at least 10 years of creditable service is eligible for normal retirement and, as such, is entitled to 100% of the pension benefit component . This annual pension benefit is equal to 1 .1% times the average annual compensation times the number of years of creditable service . The average annual compensation in this calculation uses the highest 20 calendar quarters of salary in a covered position . All 20 calendar quarters do not need to be continuous, but they must be in groups of four consecutive calendar quarters . Members may be eligible for reduced pension benefit based on age and years of service .
The monthly pension benefits for members in pay status may be increased periodically as cost of living adjustments (COLA) . Such increases are not guaranteed by statute and have historically been provided on an “ad hoc” basis and can only be granted by the Indiana General Assembly . There was no COLA for the year ended June 30, 2015; however, eligible members received a one-time check in September 2014 . The amount of the one-time check ranged from $150 to $450, depending upon a member’s years of service, and was for a member who retired or was disabled on or before December 1, 2013, and who was entitled to receive a monthly benefit on July 1, 2014 .
Disability and Survivor Benefits
The PERF Hybrid Plan also provides disability and survivor benefits . A member who has at least five years of creditable service and becomes disabled while in active service, on FMLA leave, receiving workers’ compensation benefits, or receiving employer-provided disability insurance benefits may retire for the duration of the disability, if the member has qualified for social security disability benefits and has furnished proof of the qualification . The disability benefit is calculated the same as that for a normal retirement without reduction for early retirement .
Upon the death in service of a member with 15 or more years of creditable service as of January 1, 2007, a survivor benefit may be paid to the surviving spouse to whom the member had been married for two or more years, or surviving dependent children under the age of 18 .
Retirement Benefits – Annuity Savings Account
Members are required to participate in an Annuity Savings Account (ASA) . The ASA consists of the member’s contributions, set by statute at 3% of compensation as defined by IC 5-10 .2-3-2 for PERF, plus the interest/earnings or losses credited to the member’s account . A member’s contributions and interest credits belong to the member and do not belong to the State or the College .
Investments in the members’ annuity savings accounts are individually directed and controlled by plan participants who direct the investment of their account balances among eight investment options, with varying degrees of risk and return potential .

IVY TECH COMMUNITY COLLEGE FINANCIAL REPORT | 201640
SIGNIFICANT ACTUARIAL ASSUMPTIONS
Key methods and assumptions used in calculating the total pension liability in the latest actuarial valuations for the College’s participation in PERF are below .
Valuation Date:Assets June 30, 2015
LiabilitiesJune 30, 2015–Member census data as of June 30, 2014 was used in the valuation and adjusted, where
appropriate, to reflect changes between June 30, 2014 and June 30, 2015 . Standard actuarial roll forward techniques were then used to project the total pension liability computed as of June 30, 2014 to June 30, 2015 .
Actuarial Assumptions:Experience study date Period of 4 years ended June 30, 2014
Investment rate of return 6 .75%, net of investment expense, including inflation
Cost of living increase 1 .0%
Future salary increases 2 .50%-4 .25%
Inflation 2 .25%
MortalityRP-2014 Total Data Set Mortality Table, with Social Security Administration
generational improvement scale from 2016
The long-term return expectation for the INPRS defined benefit plans has been determined using a building block approach and assumes a time horizon as defined in the INPRS Investment Policy Statement . A forecasted rate of inflation serves as the baseline for the return expectation . Various real return premiums over the baseline inflation rate have been established for each asset class . The long-term expected nominal rate of return has been determined by calculating a weighted average of the expected real return premiums for each asset class, adding the projected inflation rate, and adding the expected return from rebalancing uncorrelated asset classes . The asset allocation is as follows:
Target Asset Allocation Geometric Basis Long-Term Expected Real Rate of Return
Public equity 22 .5% 5 .3%
Private equity 10 .0% 5 .6%
Fixed income-ex inflation-linked 22 .0% 2 .1%
Fixed income-inflation-linked 10 .0% 0 .7%
Commodities 8 .0% 2 .0%
Real estate 7 .5% 3 .0%
Absolute return 10 .0% 3 .9%
Risk parity 10 .0% 5 .0%
DISCOUNT RATE
Total pension liability for each defined benefit plan was calculated using a discount rate of 6 .75% . The projection of cash flows used to determine the discount rate assumed the contributions from employers would be at the actuarially determined required rates computed in accordance with the current funding policy adopted by the Board, and contributions required by the State of Indiana would be made as stipulated by State statute . Projected inflows from investment earnings were calculated using the long-term assumed rate of return of 6 .75% . Based on those assumptions, each defined benefit pension plan’s fiduciary net position were projected to be available to make all projected future benefit payments of current plan members . The long-term expected rate of return on pension plan investments was applied to all periods of projected benefits to determine the total pension liability for each plan .
Net pension liability is sensitive to changes in the discount rate . The following table illustrates the potential impact if the discount rate decreases by one percentage point or increases by one percentage point .
1% Decrease (5.75%) Current (6.75%) 1% Increase (7.75%)$30,489,988 $20,669,978 $12,517,575
PENSION PLAN’S FIDUCIARY NET POSITION
INPRS is a pension trust fund of the State of Indiana for financial statement reporting purposes . The financial statements of INPRS are prepared using the accrual basis of accounting in conformity with generally accepted accounting principles as applied to governments . Under the accrual
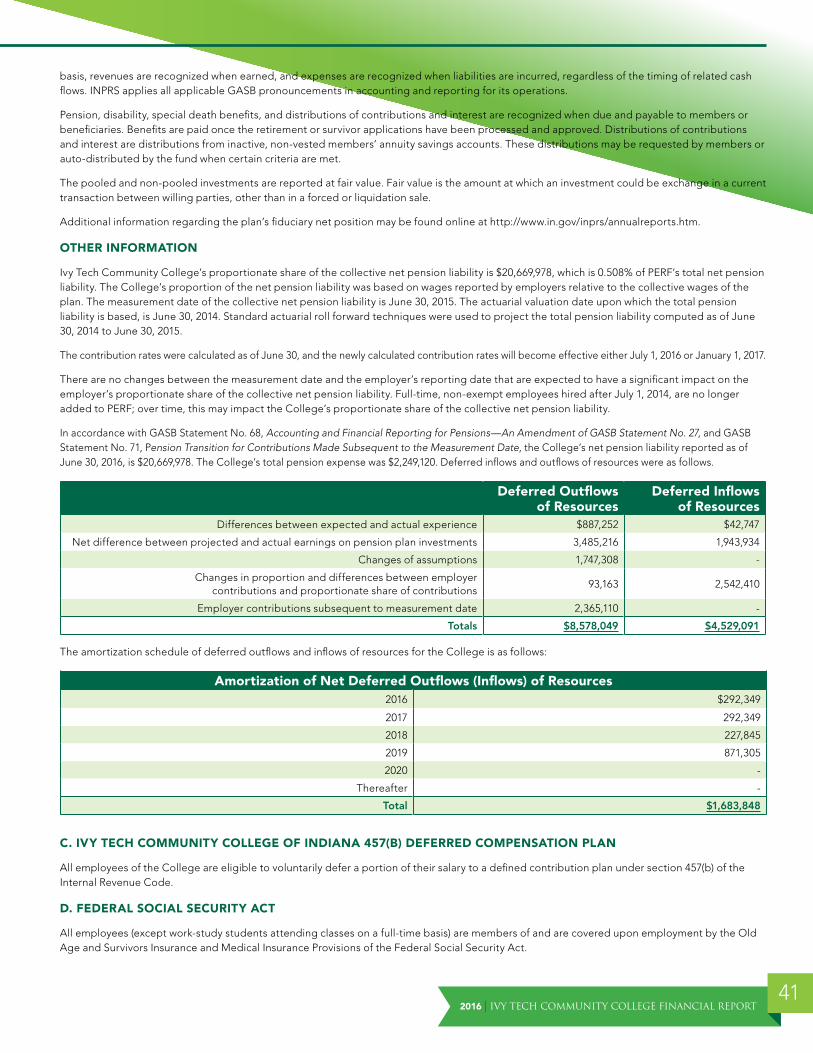
2016 | IVY TECH COMMUNITY COLLEGE FINANCIAL REPORT41
basis, revenues are recognized when earned, and expenses are recognized when liabilities are incurred, regardless of the timing of related cash flows . INPRS applies all applicable GASB pronouncements in accounting and reporting for its operations .
Pension, disability, special death benefits, and distributions of contributions and interest are recognized when due and payable to members or beneficiaries . Benefits are paid once the retirement or survivor applications have been processed and approved . Distributions of contributions and interest are distributions from inactive, non-vested members’ annuity savings accounts . These distributions may be requested by members or auto-distributed by the fund when certain criteria are met .
The pooled and non-pooled investments are reported at fair value . Fair value is the amount at which an investment could be exchange in a current transaction between willing parties, other than in a forced or liquidation sale .
Additional information regarding the plan’s fiduciary net position may be found online at http://www .in .gov/inprs/annualreports .htm .
OTHER INFORMATION
Ivy Tech Community College’s proportionate share of the collective net pension liability is $20,669,978, which is 0 .508% of PERF’s total net pension liability . The College’s proportion of the net pension liability was based on wages reported by employers relative to the collective wages of the plan . The measurement date of the collective net pension liability is June 30, 2015 . The actuarial valuation date upon which the total pension liability is based, is June 30, 2014 . Standard actuarial roll forward techniques were used to project the total pension liability computed as of June 30, 2014 to June 30, 2015 .
The contribution rates were calculated as of June 30, and the newly calculated contribution rates will become effective either July 1, 2016 or January 1, 2017 .
There are no changes between the measurement date and the employer’s reporting date that are expected to have a significant impact on the employer’s proportionate share of the collective net pension liability . Full-time, non-exempt employees hired after July 1, 2014, are no longer added to PERF; over time, this may impact the College’s proportionate share of the collective net pension liability .
In accordance with GASB Statement No . 68, Accounting and Financial Reporting for Pensions—An Amendment of GASB Statement No. 27, and GASB Statement No . 71, Pension Transition for Contributions Made Subsequent to the Measurement Date, the College’s net pension liability reported as of June 30, 2016, is $20,669,978 . The College’s total pension expense was $2,249,120 . Deferred inflows and outflows of resources were as follows .
Deferred Outflows of Resources
Deferred Inflows of Resources
Differences between expected and actual experience $887,252 $42,747
Net difference between projected and actual earnings on pension plan investments 3,485,216 1,943,934
Changes of assumptions 1,747,308 -
Changes in proportion and differences between employer contributions and proportionate share of contributions
93,163 2,542,410
Employer contributions subsequent to measurement date 2,365,110 -
Totals $8,578,049 $4,529,091
The amortization schedule of deferred outflows and inflows of resources for the College is as follows:
Amortization of Net Deferred Outflows (Inflows) of Resources2016 $292,349
2017 292,349
2018 227,845
2019 871,305
2020 -
Thereafter -
Total $1,683,848
C. IVY TECH COMMUNITY COLLEGE OF INDIANA 457(B) DEFERRED COMPENSATION PLAN
All employees of the College are eligible to voluntarily defer a portion of their salary to a defined contribution plan under section 457(b) of the Internal Revenue Code .
D. FEDERAL SOCIAL SECURITY ACT
All employees (except work-study students attending classes on a full-time basis) are members of and are covered upon employment by the Old Age and Survivors Insurance and Medical Insurance Provisions of the Federal Social Security Act .

IVY TECH COMMUNITY COLLEGE FINANCIAL REPORT | 201642
X. Capital AssetsProperty, buildings, and equipment are stated at cost on the date of acquisition or at fair market value at the time of donation . Assets used by the College which are subject to capital lease obligations are recorded at the net present value of the minimum lease payments of the asset at inception of the lease .
Capital asset activity for the year ended June 30, 2016 was as follows:
Beginning Balance FY-Additions FY-Retirements Balance
Land $31,013,803 $593,701 $- $31,607,504
Construction work in progress 71,406,957 28,124,454 77,292,512 22,238,899
Land improvements & infrastructure 27,814,144 328,038 74,305 28,067,877
Buildings 676,179,786 81,211,776 5,773,941 751,617,621
Furniture, fixtures & equipment 92,080,336 12,181,232 9,466,705 94,794,863
Library materials 3,827,327 179,026 120,618 3,885,735
Total 902,322,353 122,618,227 92,728,081 932,212,499
Less accumulated depreciation:Land - - - -
Land improvements & infrastructure 14,672,942 1,478,987 7,210 16,144,719
Buildings 204,810,529 21,544,689 1,950,504 224,404,714
Furniture, fixtures & equipment 70,119,402 7,790,486 9,205,661 68,704,227
Library materials 3,242,770 267,187 120,618 3,389,339
Total accumulated depreciation 292,845,643 31,081,349 11,283,993 312,642,999
Capital assets, net $609,476,710 $91,536,878 $81,444,088 $619,569,500
CONSTRUCTION WORK IN PROGRESS
The following table presents the construction projects in process as of June 30, 2016:
Hamilton county campus – Noblesville $14,449,234
Insurance refund – Richmond 56,304
Lawrenceburg mfg . training center 4,081,693
4th street project – Bloomington 81,990
Culinary 2015 second bakery 143,750
Cowen road improvements 16,208
Library conference room project Lawrence 24,054
Batesville manufacturing room 42,976
Advising pilot project 412,798
Various repair & rehabilitation & parking lot projects 2,929,892
Total construction work in progress $22,238,899

2016 | IVY TECH COMMUNITY COLLEGE FINANCIAL REPORT43
XI. Long Term Liabilities
Beginning Balance Additions Reductions Ending
BalanceCurrent Portion
Leases, Notes, and Bonds Payable:Lease obligations $41,312,420 $4,171,356 $10,112,457 $35,371,319 $3,329,917
Notes payable–interim financing/mortgage
2,446,899 4,776,072 1,508,454 5,714,517 1,257,167
Total lease & notes payable 43,759,319 8,947,428 11,620,911 41,085,836 4,587,084
Series H student fee bonds bond yield 1.32%–3.96%
11,200,000 - - 11,200,000 -
Series J student fee bonds bond yield 4.25%–4.47%
9,245,000 - - 9,245,000 -
Series K student fee bonds bond yield 3.76%–4.74%
33,085,000 - - 33,085,000 33,085,000
Series L student fee bonds bond yield 3.76%–4.74%
35,390,000 - 2,815,000 32,575,000 2,935,000
Series N student fee bonds bond yield 3.51%–6.155%
70,290,000 - 3,840,000 66,450,000 3,935,000
Series O student fee bonds bond yield 3.25%–3.55%
9,200,000 - - 9,200,000 -
Series P student fee bonds bond yield .28%–4.11%
29,645,000 - 3,510,000 26,135,000 1,015,000
Series Q student fee bonds bond yield .90%
8,450,000 - 2,810,000 5,640,000 2,855,000
Series R student fee bonds bond yield .21%–4.20%
65,320,000 - 4,650,000 60,670,000 4,855,000
Series S student fee bonds bond yield .794%
6,840,000 - 2,270,000 4,570,000 2,280,000
Series T student fee bonds bond yield .20%–2.71%
28,090,000 360,000 27,730,000 320,000
Total bonds payable 278,665,000 28,090,000 20,255,000 286,500,000 51,280,000
Premium on Bonds– Series H, I, J, K, L, M, P, R, T
12,005,094 3,860,472 1,437,328 14,428,238 1,437,328
Total leases, notes, & bonds payable
334,429,413 40,897,900 33,313,239 342,014,074 57,304,412
Other liabilities:Compensated absences 15,065,110 10,564,973 9,357,606 16,272,477 9,859,146
Other post-employment benefits 22,569,718 1,412,896 - 23,982,614 -
Net pension liability 15,685,882 12,360,631 7,376,535 20,669,978 -
Total other liabilities 53,320,710 24,338,500 16,734,141 60,925,069 9,859,146
Total long-term liabilities $387,750,123 $65,236,400 $50,047,380 $402,939,143 $67,163,558
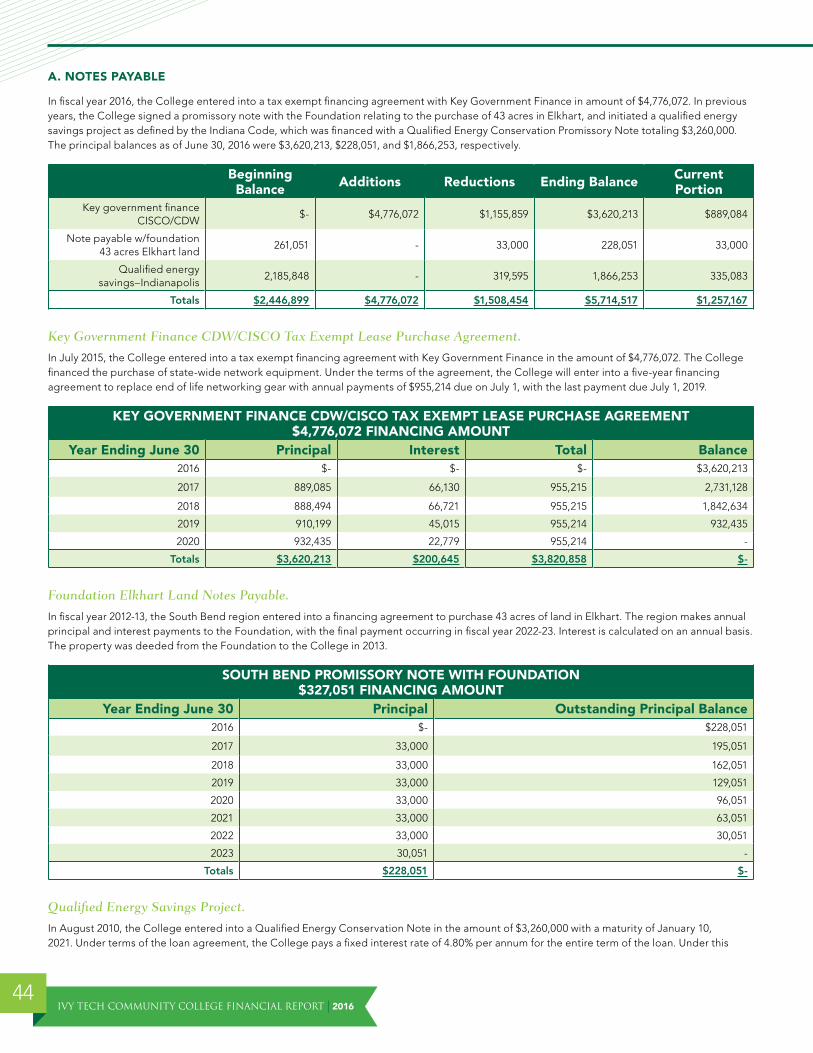
IVY TECH COMMUNITY COLLEGE FINANCIAL REPORT | 201644
A. NOTES PAYABLE
In fiscal year 2016, the College entered into a tax exempt financing agreement with Key Government Finance in amount of $4,776,072 . In previous years, the College signed a promissory note with the Foundation relating to the purchase of 43 acres in Elkhart, and initiated a qualified energy savings project as defined by the Indiana Code, which was financed with a Qualified Energy Conservation Promissory Note totaling $3,260,000 . The principal balances as of June 30, 2016 were $3,620,213, $228,051, and $1,866,253, respectively .
Beginning Balance Additions Reductions Ending Balance Current
PortionKey government finance
CISCO/CDW$- $4,776,072 $1,155,859 $3,620,213 $889,084
Note payable w/foundation 43 acres Elkhart land
261,051 - 33,000 228,051 33,000
Qualified energy savings–Indianapolis
2,185,848 - 319,595 1,866,253 335,083
Totals $2,446,899 $4,776,072 $1,508,454 $5,714,517 $1,257,167
Key Government Finance CDW/CISCO Tax Exempt Lease Purchase Agreement.
In July 2015, the College entered into a tax exempt financing agreement with Key Government Finance in the amount of $4,776,072 . The College financed the purchase of state-wide network equipment . Under the terms of the agreement, the College will enter into a five-year financing agreement to replace end of life networking gear with annual payments of $955,214 due on July 1, with the last payment due July 1, 2019 .
KEY GOVERNMENT FINANCE CDW/CISCO TAX EXEMPT LEASE PURCHASE AGREEMENT $4,776,072 FINANCING AMOUNT
Year Ending June 30 Principal Interest Total Balance2016 $- $- $- $3,620,213
2017 889,085 66,130 955,215 2,731,128
2018 888,494 66,721 955,215 1,842,634
2019 910,199 45,015 955,214 932,435
2020 932,435 22,779 955,214 -
Totals $3,620,213 $200,645 $3,820,858 $-
Foundation Elkhart Land Notes Payable.
In fiscal year 2012-13, the South Bend region entered into a financing agreement to purchase 43 acres of land in Elkhart . The region makes annual principal and interest payments to the Foundation, with the final payment occurring in fiscal year 2022-23 . Interest is calculated on an annual basis . The property was deeded from the Foundation to the College in 2013 .
SOUTH BEND PROMISSORY NOTE WITH FOUNDATION $327,051 FINANCING AMOUNT
Year Ending June 30 Principal Outstanding Principal Balance2016 $- $228,051
2017 33,000 195,051
2018 33,000 162,051
2019 33,000 129,051
2020 33,000 96,051
2021 33,000 63,051
2022 33,000 30,051
2023 30,051 -
Totals $228,051 $-
Qualified Energy Savings Project.
In August 2010, the College entered into a Qualified Energy Conservation Note in the amount of $3,260,000 with a maturity of January 10, 2021 . Under terms of the loan agreement, the College pays a fixed interest rate of 4 .80% per annum for the entire term of the loan . Under this
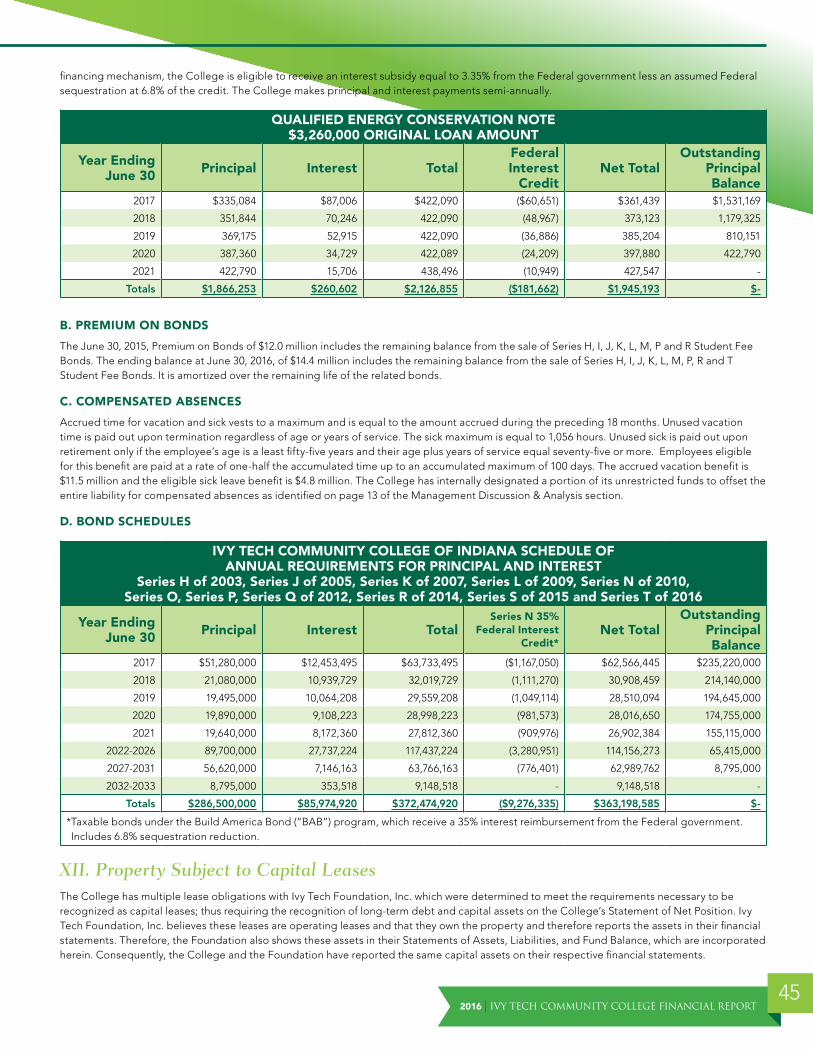
2016 | IVY TECH COMMUNITY COLLEGE FINANCIAL REPORT45
financing mechanism, the College is eligible to receive an interest subsidy equal to 3.35% from the Federal government less an assumed Federal sequestration at 6.8% of the credit. The College makes principal and interest payments semi-annually.
QUALIFIED ENERGY CONSERVATION NOTE $3,260,000 ORIGINAL LOAN AMOUNT
Year Ending June 30 Principal Interest Total
Federal Interest
CreditNet Total
Outstanding Principal Balance
2017 $335,084 $87,006 $422,090 ($60,651) $361,439 $1,531,169
2018 351,844 70,246 422,090 (48,967) 373,123 1,179,325
2019 369,175 52,915 422,090 (36,886) 385,204 810,151
2020 387,360 34,729 422,089 (24,209) 397,880 422,790
2021 422,790 15,706 438,496 (10,949) 427,547 -
Totals $1,866,253 $260,602 $2,126,855 ($181,662) $1,945,193 $-
B. PREMIUM ON BONDS
The June 30, 2015, Premium on Bonds of $12.0 million includes the remaining balance from the sale of Series H, I, J, K, L, M, P and R Student Fee Bonds. The ending balance at June 30, 2016, of $14.4 million includes the remaining balance from the sale of Series H, I, J, K, L, M, P, R and T Student Fee Bonds. It is amortized over the remaining life of the related bonds.
C. COMPENSATED ABSENCES
Accrued time for vacation and sick vests to a maximum and is equal to the amount accrued during the preceding 18 months. Unused vacation time is paid out upon termination regardless of age or years of service. The sick maximum is equal to 1,056 hours. Unused sick is paid out upon retirement only if the employee’s age is a least fifty-five years and their age plus years of service equal seventy-five or more. Employees eligible for this benefit are paid at a rate of one-half the accumulated time up to an accumulated maximum of 100 days. The accrued vacation benefit is $11.5 million and the eligible sick leave benefit is $4.8 million. The College has internally designated a portion of its unrestricted funds to offset the entire liability for compensated absences as identified on page 13 of the Management Discussion & Analysis section.
D. BOND SCHEDULES
IVY TECH COMMUNITY COLLEGE OF INDIANA SCHEDULE OF ANNUAL REQUIREMENTS FOR PRINCIPAL AND INTEREST
Series H of 2003, Series J of 2005, Series K of 2007, Series L of 2009, Series N of 2010, Series O, Series P, Series Q of 2012, Series R of 2014, Series S of 2015 and Series T of 2016
Year Ending June 30 Principal Interest Total
Series N 35% Federal Interest
Credit*Net Total
Outstanding Principal Balance
2017 $51,280,000 $12,453,495 $63,733,495 ($1,167,050) $62,566,445 $235,220,000
2018 21,080,000 10,939,729 32,019,729 (1,111,270) 30,908,459 214,140,000
2019 19,495,000 10,064,208 29,559,208 (1,049,114) 28,510,094 194,645,000
2020 19,890,000 9,108,223 28,998,223 (981,573) 28,016,650 174,755,000
2021 19,640,000 8,172,360 27,812,360 (909,976) 26,902,384 155,115,000
2022-2026 89,700,000 27,737,224 117,437,224 (3,280,951) 114,156,273 65,415,000
2027-2031 56,620,000 7,146,163 63,766,163 (776,401) 62,989,762 8,795,000
2032-2033 8,795,000 353,518 9,148,518 - 9,148,518 -
Totals $286,500,000 $85,974,920 $372,474,920 ($9,276,335) $363,198,585 $-
* Taxable bonds under the Build America Bond (“BAB”) program, which receive a 35% interest reimbursement from the Federal government. Includes 6.8% sequestration reduction.
XII. Property Subject to Capital LeasesThe College has multiple lease obligations with Ivy Tech Foundation, Inc. which were determined to meet the requirements necessary to be recognized as capital leases; thus requiring the recognition of long-term debt and capital assets on the College’s Statement of Net Position. Ivy Tech Foundation, Inc. believes these leases are operating leases and that they own the property and therefore reports the assets in their financial statements. Therefore, the Foundation also shows these assets in their Statements of Assets, Liabilities, and Fund Balance, which are incorporated herein. Consequently, the College and the Foundation have reported the same capital assets on their respective financial statements.

IVY TECH COMMUNITY COLLEGE FINANCIAL REPORT | 201646
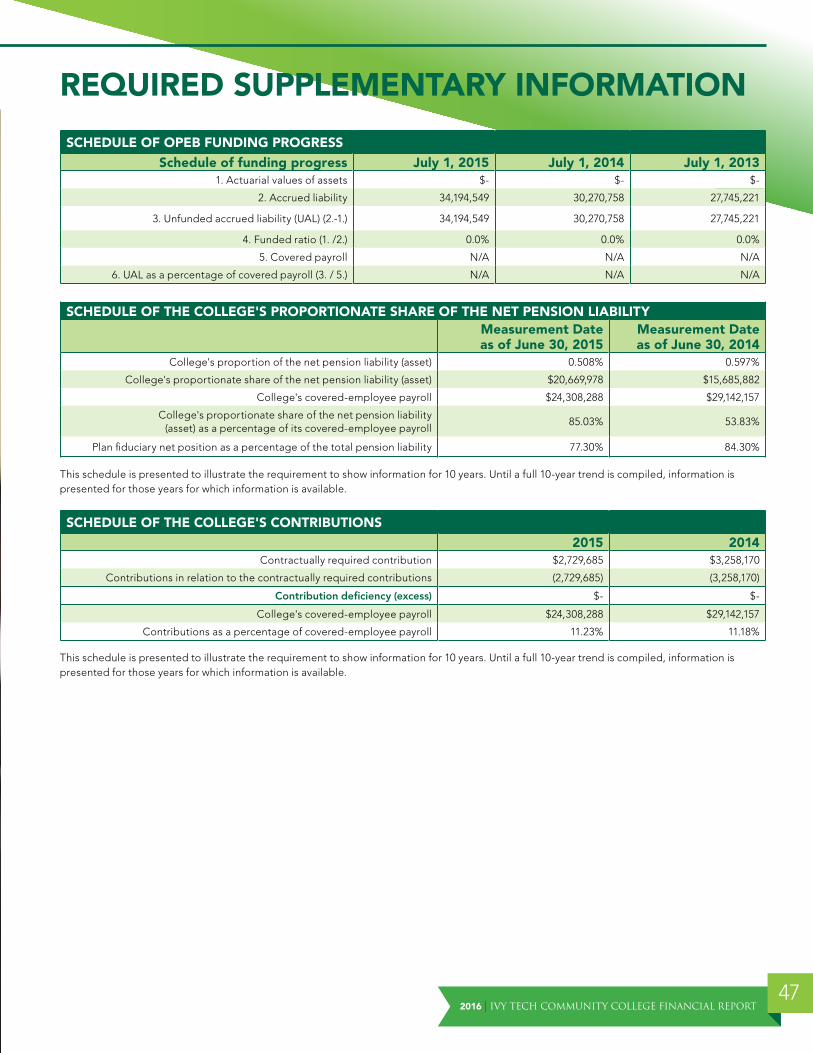
2016 | IVY TECH COMMUNITY COLLEGE FINANCIAL REPORT47
REQUIRED SUPPLEMENTARY INFORMATION
SCHEDULE OF OPEB FUNDING PROGRESS
Schedule of funding progress July 1, 2015 July 1, 2014 July 1, 20131 . Actuarial values of assets $- $- $-
2 . Accrued liability 34,194,549 30,270,758 27,745,221
3 . Unfunded accrued liability (UAL) (2 .-1 .) 34,194,549 30,270,758 27,745,221
4 . Funded ratio (1 . /2 .) 0 .0% 0 .0% 0 .0%
5 . Covered payroll N/A N/A N/A
6 . UAL as a percentage of covered payroll (3 . / 5 .) N/A N/A N/A
SCHEDULE OF THE COLLEGE'S PROPORTIONATE SHARE OF THE NET PENSION LIABILITYMeasurement Date as of June 30, 2015
Measurement Date as of June 30, 2014
College's proportion of the net pension liability (asset) 0 .508% 0 .597%
College's proportionate share of the net pension liability (asset) $20,669,978 $15,685,882
College's covered-employee payroll $24,308,288 $29,142,157
College's proportionate share of the net pension liability (asset) as a percentage of its covered-employee payroll
85 .03% 53 .83%
Plan fiduciary net position as a percentage of the total pension liability 77 .30% 84 .30%
This schedule is presented to illustrate the requirement to show information for 10 years . Until a full 10-year trend is compiled, information is presented for those years for which information is available .
SCHEDULE OF THE COLLEGE'S CONTRIBUTIONS
2015 2014Contractually required contribution $2,729,685 $3,258,170
Contributions in relation to the contractually required contributions (2,729,685) (3,258,170)
Contribution deficiency (excess) $- $-
College's covered-employee payroll $24,308,288 $29,142,157
Contributions as a percentage of covered-employee payroll 11 .23% 11 .18%
This schedule is presented to illustrate the requirement to show information for 10 years . Until a full 10-year trend is compiled, information is presented for those years for which information is available .

The following information is presented as additional data
and is not subject to the audit opinion expressed by the Indiana
State Board of Accounts.These reports were prepared by the management
of Ivy Tech Community College of Indiana.

2016 | IVY TECH COMMUNITY COLLEGE FINANCIAL REPORT49
SCHEDULES OF ANNUAL BOND REQUIREMENTS FOR OUTSTANDING DEBTS
IVY TECH COMMUNITY COLLEGE OF INDIANA SCHEDULE OF ANNUAL REQUIREMENTS FOR PRINCIPAL AND INTEREST
Series H – Richmond Phase I, Evansville, Valparaiso, Terre Haute Original Issue–$47,065,000
Year Ending June 30 Principal Interest Total Outstanding
Principal Balance2016 $- $588,000 $588,000 $11,200,000
2017 - 588,000 588,000 11,200,000
2018 - 588,000 588,000 11,200,000
2019 3,780,000 488,775 4,268,775 7,420,000
2020 3,985,000 284,944 4,269,944 3,435,000
2021 3,435,000 90,169 3,525,169 -
Totals $11,200,000 $2,627,888 $13,827,888 $-
IVY TECH COMMUNITY COLLEGE OF INDIANA SCHEDULE OF ANNUAL REQUIREMENTS FOR PRINCIPAL AND INTEREST
Series J – Richmond and Marion Original Issue–$9,245,000
Year Ending June 30 Principal Interest Total Outstanding
Principal Balance2016 $- $462,250 $462,250 $9,245,000
2017 - 462,250 462,250 9,245,000
2018 - 462,250 462,250 9,245,000
2019 - 462,250 462,250 9,245,000
2020 - 462,250 462,250 9,245,000
2021 - 462,250 462,250 9,245,000
2022 2,780,000 392,750 3,172,750 6,465,000
2023 2,925,000 250,125 3,175,125 3,540,000
2024 3,075,000 100,125 3,175,125 465,000
2025 465,000 11,625 476,625 -
Totals $9,245,000 $3,528,125 $12,773,125 $-

IVY TECH COMMUNITY COLLEGE FINANCIAL REPORT | 201650
IVY TECH COMMUNITY COLLEGE OF INDIANA SCHEDULE OF ANNUAL REQUIREMENTS FOR PRINCIPAL AND INTEREST
Series K – Valparaiso Phase II, Marion Construction and Madison ConstructionOriginal Issue–$60,670,000
Year Ending June 30 Principal Interest Total Outstanding
Principal Balance2016 $- $1,643,938 $1,643,938 $33,085,000
2017 33,085,000 821,969 33,906,969 -
Totals $33,085,000 $2,465,907 $35,550,907 $-
IVY TECH COMMUNITY COLLEGE OF INDIANA SCHEDULE OF ANNUAL REQUIREMENTS FOR PRINCIPAL AND INTEREST
Series L – Fort Wayne, Logansport and Greencastle Projects; Fairbanks Refinancing and Series E RefundingOriginal Issue–$65,095,000
Year Ending June 30 Principal Interest Total Outstanding
Principal Balance2016 $2,815,000 $1,642,419 $4,457,419 $32,575,000
2017 2,935,000 1,527,419 4,462,419 29,640,000
2018 3,070,000 1,391,969 4,461,969 26,570,000
2019 3,225,000 1,234,594 4,459,594 23,345,000
2020 - 1,153,969 1,153,968 23,345,000
2021 3,530,000 1,065,719 4,595,718 19,815,000
2022 3,210,000 897,219 4,107,219 16,605,000
2023 2,915,000 744,094 3,659,094 13,690,000
2024 3,065,000 594,594 3,659,594 10,625,000
2025 - 517,969 517,969 10,625,000
2026 3,370,000 435,825 3,805,825 7,255,000
2027 3,540,000 267,394 3,807,394 3,715,000
2028 3,715,000 90,553 3,805,553 -
Totals $35,390,000 $11,563,735 $46,953,735 $-

2016 | IVY TECH COMMUNITY COLLEGE FINANCIAL REPORT51
IVY TECH COMMUNITY COLLEGE OF INDIANA SCHEDULE OF ANNUAL REQUIREMENTS FOR PRINCIPAL AND INTEREST
Series N (Taxable Build America–Direct Pay Option) – Elkhart, Sellersburg, Warsaw and Indianapolis ProjectsOriginal Issue–$70,290,000
Year Ending June 30 Principal Interest Total
35% Federal Interest Credit*
Net TotalOutstanding
Principal Balance
2016 $3,840,000 $3,724,789 $7,564,789 ($1,212,372) $6,352,417 $66,450,000
2017 3,935,000 3,577,713 7,512,713 (1,167,050) 6,345,663 62,515,000
2018 4,045,000 3,406,714 7,451,714 (1,111,270) 6,340,444 58,470,000
2019 4,165,000 3,216,167 7,381,167 (1,049,114) 6,332,053 54,305,000
2020 4,300,000 3,009,113 7,309,113 (981,573) 6,327,540 50,005,000
2021 4,440,000 2,789,625 7,229,625 (909,976) 6,319,649 45,565,000
2022 4,600,000 2,555,714 7,155,714 (833,674) 6,322,040 40,965,000
2023 4,760,000 2,299,832 7,059,832 (750,205) 6,309,627 36,205,000
2024 4,940,000 2,027,504 6,967,504 (661,372) 6,306,132 31,265,000
2025 5,135,000 1,739,514 6,874,514 (567,429) 6,307,085 26,130,000
2026 5,320,000 1,435,535 6,755,535 (468,271) 6,287,264 20,810,000
2027 5,545,000 1,110,208 6,655,208 (362,150) 6,293,058 15,265,000
2028 5,765,000 762,143 6,527,143 (248,611) 6,278,532 9,500,000
2029 6,000,000 400,075 6,400,075 (130,504) 6,269,571 3,500,000
2030 3,500,000 107,712 3,607,712 (35,136) 3,572,576 -
Totals $70,290,000 $32,162,358 $102,452,358 ($10,488,707) $91,963,651 $-
* Taxable bonds issued under the Build America Bond ("BAB") program, which receive a 35% interest reimbursement from the Federal government . Includes 6 .8% sequestration reduction .

IVY TECH COMMUNITY COLLEGE FINANCIAL REPORT | 201652
IVY TECH COMMUNITY COLLEGE OF INDIANA SCHEDULE OF ANNUAL REQUIREMENTS FOR PRINCIPAL AND INTEREST
Series O (Tax-Exempt) – Series I RefundingOriginal Issue–$9,200,000
Year Ending June 30 Principal Interest Total Outstanding
Principal Balance2016 $- $314,728 $314,728 $9,200,000
2017 - 314,728 314,728 9,200,000
2018 - 314,728 314,728 9,200,000
2019 - 314,728 314,728 9,200,000
2020 - 314,728 314,728 9,200,000
2021 - 314,728 314,728 9,200,000
2022 - 314,728 314,728 9,200,000
2023 - 314,728 314,728 9,200,000
2024 - 314,728 314,728 9,200,000
2025 2,250,000 278,160 2,528,160 6,950,000
2026 3,415,000 183,548 3,598,548 3,535,000
2027 3,535,000 62,746 3,597,746 -
Totals $9,200,000 $3,357,006 $12,557,006 $-
IVY TECH COMMUNITY COLLEGE OF INDIANA SCHEDULE OF ANNUAL REQUIREMENTS FOR PRINCIPAL AND INTEREST
Series P (Tax-Exempt) – Indianapolis & Muncie Projects, Lafayette Refinancing and Series I & K RefundingsOriginal Issue–$32,415,000
Year Ending June 30 Principal Interest Total Outstanding
Principal Balance2016 $3,510,000 $1,106,350 $4,616,350 $26,135,000
2017 1,015,000 1,013,450 2,028,450 25,120,000
2018 1,050,000 978,550 2,028,550 24,070,000
2019 3,390,000 877,525 4,267,525 20,680,000
2020 3,530,000 738,300 4,268,300 17,150,000
2021 5,235,000 581,825 5,816,825 11,915,000
2022 540,000 477,500 1,017,500 11,375,000
2023 555,000 458,375 1,013,375 10,820,000
2024 570,000 441,500 1,011,500 10,250,000
2025 965,000 417,269 1,382,269 9,285,000
2026 615,000 389,287 1,004,287 8,670,000
2027 5,035,000 263,700 5,298,700 3,635,000
2028 665,000 135,450 800,450 2,970,000
2029 700,000 104,737 804,737 2,270,000
2030 725,000 75,394 800,394 1,545,000
2031 760,000 46,600 806,600 785,000
2032 785,000 15,700 800,700 -
Totals $29,645,000 $8,121,512 $37,766,512 $-

2016 | IVY TECH COMMUNITY COLLEGE FINANCIAL REPORT53
IVY TECH COMMUNITY COLLEGE OF INDIANA SCHEDULE OF ANNUAL REQUIREMENTS FOR PRINCIPAL AND INTEREST
Series Q (Tax-Exempt) – Series G RefundingOriginal Issue–$15,190,000
Year Ending June 30 Principal Interest Total Outstanding
Principal Balance2016 $2,810,000 $63,405 $2,873,405 $5,640,000
2017 2,855,000 37,913 2,892,913 2,785,000
2018 2,785,000 12,532 2,797,532 -
Totals $8,450,000 $113,580 $8,563,850 $-
IVY TECH COMMUNITY COLLEGE OF INDIANA SCHEDULE OF ANNUAL REQUIREMENTS FOR PRINCIPAL AND INTERESTSeries R (Tax-Exempt) – Anderson, Bloomington & Indianapolis Projects,
Note Refinancing (Series H & L Partial Refundings) Original Issue–$76,705,000
Year Ending June 30 Principal Interest Total Outstanding
Principal Balance2016 $4,650,000 $3,020,795 $7,670,795 $60,670,000
2017 4,855,000 2,806,420 7,661,420 55,815,000
2018 5,110,000 2,557,295 7,667,295 50,705,000
2019 2,080,000 2,377,545 4,457,545 48,625,000
2020 5,075,000 2,198,670 7,273,670 43,550,000
2021 2,290,000 2,014,545 4,304,545 41,260,000
2022 2,415,000 1,896,920 4,311,920 38,845,000
2023 2,540,000 1,773,045 4,313,045 36,305,000
2024 2,665,000 1,642,920 4,307,920 33,640,000
2025 5,545,000 1,437,670 6,982,670 28,095,000
2026 2,950,000 1,225,295 4,175,295 25,145,000
2027 3,095,000 1,074,170 4,169,170 22,050,000
2028 3,250,000 915,545 4,165,545 18,800,000
2029 3,425,000 748,670 4,173,670 15,375,000
2030 3,595,000 573,170 4,168,170 11,780,000
2031 3,770,000 407,895 4,177,895 8,010,000
2032 3,925,000 252,033 4,177,033 4,085,000
2033 4,085,000 85,785 4,170,785 -
Totals $65,320,000 $27,008,388 $92,328,388 $-
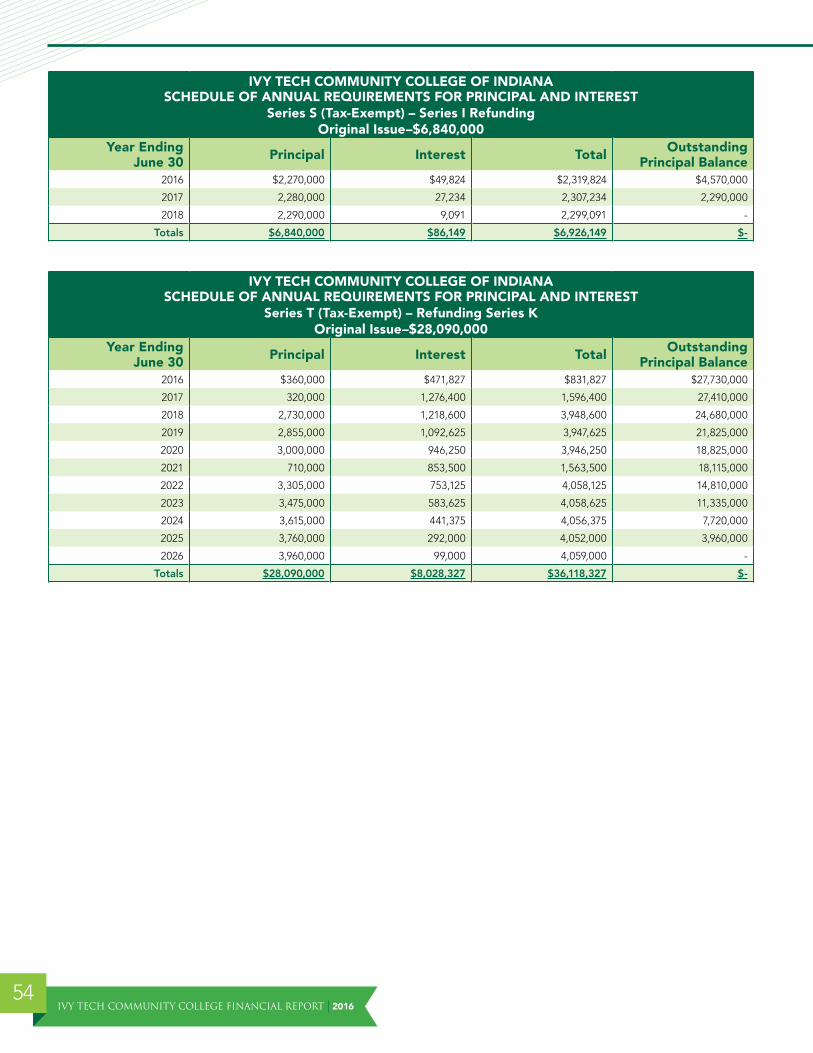
IVY TECH COMMUNITY COLLEGE FINANCIAL REPORT | 201654
IVY TECH COMMUNITY COLLEGE OF INDIANA SCHEDULE OF ANNUAL REQUIREMENTS FOR PRINCIPAL AND INTEREST
Series S (Tax-Exempt) – Series I RefundingOriginal Issue–$6,840,000
Year Ending June 30 Principal Interest Total Outstanding
Principal Balance2016 $2,270,000 $49,824 $2,319,824 $4,570,000
2017 2,280,000 27,234 2,307,234 2,290,000
2018 2,290,000 9,091 2,299,091 -
Totals $6,840,000 $86,149 $6,926,149 $-
IVY TECH COMMUNITY COLLEGE OF INDIANA SCHEDULE OF ANNUAL REQUIREMENTS FOR PRINCIPAL AND INTEREST
Series T (Tax-Exempt) – Refunding Series K Original Issue–$28,090,000
Year Ending June 30 Principal Interest Total Outstanding
Principal Balance2016 $360,000 $471,827 $831,827 $27,730,000
2017 320,000 1,276,400 1,596,400 27,410,000
2018 2,730,000 1,218,600 3,948,600 24,680,000
2019 2,855,000 1,092,625 3,947,625 21,825,000
2020 3,000,000 946,250 3,946,250 18,825,000
2021 710,000 853,500 1,563,500 18,115,000
2022 3,305,000 753,125 4,058,125 14,810,000
2023 3,475,000 583,625 4,058,625 11,335,000
2024 3,615,000 441,375 4,056,375 7,720,000
2025 3,760,000 292,000 4,052,000 3,960,000
2026 3,960,000 99,000 4,059,000 -
Totals $28,090,000 $8,028,327 $36,118,327 $-
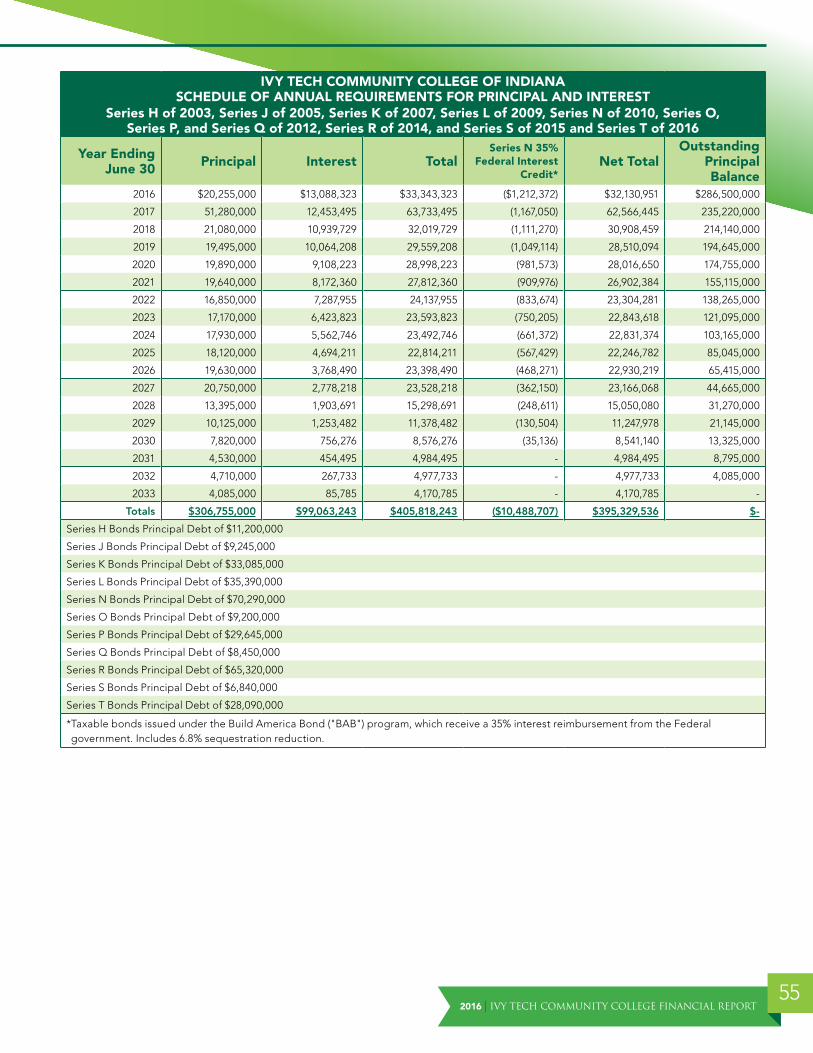
2016 | IVY TECH COMMUNITY COLLEGE FINANCIAL REPORT55
IVY TECH COMMUNITY COLLEGE OF INDIANA SCHEDULE OF ANNUAL REQUIREMENTS FOR PRINCIPAL AND INTEREST
Series H of 2003, Series J of 2005, Series K of 2007, Series L of 2009, Series N of 2010, Series O, Series P, and Series Q of 2012, Series R of 2014, and Series S of 2015 and Series T of 2016
Year Ending June 30 Principal Interest Total
Series N 35% Federal Interest
Credit*Net Total
Outstanding Principal Balance
2016 $20,255,000 $13,088,323 $33,343,323 ($1,212,372) $32,130,951 $286,500,000
2017 51,280,000 12,453,495 63,733,495 (1,167,050) 62,566,445 235,220,000
2018 21,080,000 10,939,729 32,019,729 (1,111,270) 30,908,459 214,140,000
2019 19,495,000 10,064,208 29,559,208 (1,049,114) 28,510,094 194,645,000
2020 19,890,000 9,108,223 28,998,223 (981,573) 28,016,650 174,755,000
2021 19,640,000 8,172,360 27,812,360 (909,976) 26,902,384 155,115,000
2022 16,850,000 7,287,955 24,137,955 (833,674) 23,304,281 138,265,000
2023 17,170,000 6,423,823 23,593,823 (750,205) 22,843,618 121,095,000
2024 17,930,000 5,562,746 23,492,746 (661,372) 22,831,374 103,165,000
2025 18,120,000 4,694,211 22,814,211 (567,429) 22,246,782 85,045,000
2026 19,630,000 3,768,490 23,398,490 (468,271) 22,930,219 65,415,000
2027 20,750,000 2,778,218 23,528,218 (362,150) 23,166,068 44,665,000
2028 13,395,000 1,903,691 15,298,691 (248,611) 15,050,080 31,270,000
2029 10,125,000 1,253,482 11,378,482 (130,504) 11,247,978 21,145,000
2030 7,820,000 756,276 8,576,276 (35,136) 8,541,140 13,325,000
2031 4,530,000 454,495 4,984,495 - 4,984,495 8,795,000
2032 4,710,000 267,733 4,977,733 - 4,977,733 4,085,000
2033 4,085,000 85,785 4,170,785 - 4,170,785 -
Totals $306,755,000 $99,063,243 $405,818,243 ($10,488,707) $395,329,536 $-
Series H Bonds Principal Debt of $11,200,000
Series J Bonds Principal Debt of $9,245,000
Series K Bonds Principal Debt of $33,085,000
Series L Bonds Principal Debt of $35,390,000
Series N Bonds Principal Debt of $70,290,000
Series O Bonds Principal Debt of $9,200,000
Series P Bonds Principal Debt of $29,645,000
Series Q Bonds Principal Debt of $8,450,000
Series R Bonds Principal Debt of $65,320,000
Series S Bonds Principal Debt of $6,840,000
Series T Bonds Principal Debt of $28,090,000
* Taxable bonds issued under the Build America Bond ("BAB") program, which receive a 35% interest reimbursement from the Federal government . Includes 6 .8% sequestration reduction .
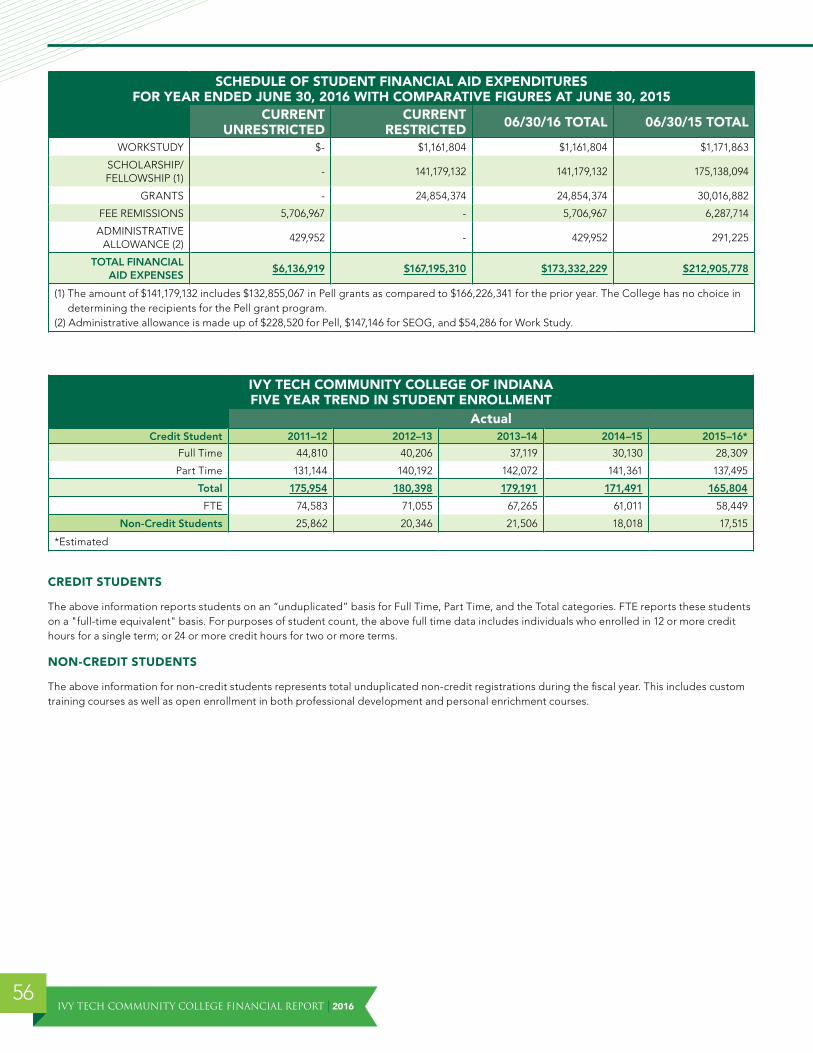
IVY TECH COMMUNITY COLLEGE FINANCIAL REPORT | 201656
SCHEDULE OF STUDENT FINANCIAL AID EXPENDITURES FOR YEAR ENDED JUNE 30, 2016 WITH COMPARATIVE FIGURES AT JUNE 30, 2015
CURRENT UNRESTRICTED
CURRENT RESTRICTED 06/30/16 TOTAL 06/30/15 TOTAL
WORKSTUDY $- $1,161,804 $1,161,804 $1,171,863
SCHOLARSHIP/FELLOWSHIP (1)
- 141,179,132 141,179,132 175,138,094
GRANTS - 24,854,374 24,854,374 30,016,882
FEE REMISSIONS 5,706,967 - 5,706,967 6,287,714
ADMINISTRATIVE ALLOWANCE (2)
429,952 - 429,952 291,225
TOTAL FINANCIAL AID EXPENSES
$6,136,919 $167,195,310 $173,332,229 $212,905,778
(1) The amount of $141,179,132 includes $132,855,067 in Pell grants as compared to $166,226,341 for the prior year . The College has no choice in determining the recipients for the Pell grant program .
(2) Administrative allowance is made up of $228,520 for Pell, $147,146 for SEOG, and $54,286 for Work Study .
IVY TECH COMMUNITY COLLEGE OF INDIANA FIVE YEAR TREND IN STUDENT ENROLLMENT
ActualCredit Student 2011–12 2012–13 2013–14 2014–15 2015–16*
Full Time 44,810 40,206 37,119 30,130 28,309
Part Time 131,144 140,192 142,072 141,361 137,495
Total 175,954 180,398 179,191 171,491 165,804
FTE 74,583 71,055 67,265 61,011 58,449
Non-Credit Students 25,862 20,346 21,506 18,018 17,515
*Estimated
CREDIT STUDENTS
The above information reports students on an “unduplicated” basis for Full Time, Part Time, and the Total categories . FTE reports these students on a "full-time equivalent" basis . For purposes of student count, the above full time data includes individuals who enrolled in 12 or more credit hours for a single term; or 24 or more credit hours for two or more terms .
NON-CREDIT STUDENTS
The above information for non-credit students represents total unduplicated non-credit registrations during the fiscal year . This includes custom training courses as well as open enrollment in both professional development and personal enrichment courses .

