financial problems and perceived well-being among the european self-employed, the role of social...
TRANSCRIPT
Financial problems and perceived well-being among the European self-employed, the role of social
trust and collectivism
Authors: Marjan Gorgievski, Psychology
Anne Annink, Public AdministrationFabian Dekker, Sociology
Erasmus University Rotterdam, Rotterdam, The NetherlandsICAP, July 9 – 13, 2014, Paris

Background
Economic crisis in Europe, 23% of Europeans report they are living comfortably and 45% say they are getting by (Gallup, 2014).
The self-employed are important for society
What are the effects of financial hardship on the well-being of self-employed people?

Theoretical background is Conservation of Resources Theory (Hobfoll, 2002). Basic premises:
People strive to protect and increase their resources
(Potential) loss of resources is stressful, leading to impaired well-being
People need to invest resources to gain resources and prevent (further) resource loss, which may lead to resource loss spirals
Resource caravans: More resourceful people, people from more resourceful environments are better able to prevent and stop loss cycles.
Ecological Stress Theory

Research model
Financial hardship Well-being
Country level
Individual level Social trust
Collectivism
-
-
-+

H1. Financial problems relate to financial hardshipH1a. Differences in level of financial hardship between
countries explain country differences in level of wellbeing
H2a. Social resources on individual level (social trust) buffer the negative hardship – well-being relationship
H2b. Social resources (collectivism) on societal level buffer the negative hardship– well-being relationship
H2c. There is a three way interaction of individual and societal social resources -> stronger buffer.
Hypotheses

Sample: European Social Survey rounds 2004 and 2010 N = 9755 participants, 64% male, age on average 52.05, sd 15.97. From 31 European countries, 18 countries participated twice
2x: Belgium (N=347), Switzerland (N=431), Czech Republic (N=430), Germany (N=503), Denmark (N=286), Estonia (N=211), Spain (N=487), Finland (N=461), United Kingdom (N=447), Greece (N=1248), Ireland (N=550), The Netherlands (N=381), Norway (N=303), Poland (N=480), Portugal (595), Sweden (N=364), Slovakia (N=262) and Ukraine (N=137).
1x: Austria (208), Bulgaria (119), Cyprus (179), France (161), Croatia (87), Hungary (105), Israel (232), Iceland (74), Lietuva (16), Luxembourg (156), Romania (117), Turkey (216)
Sample descriptives

Social trust, 3 items, e.g. Most people can be trusted; answers 1 (poor) – 10 (good), Alpha reliability 0.78
Collectivism, 11 items Schwartz’ PVQ ; Alpha reliability = .77. Scales corrected according to Schwartz’ recommendations.
Financial hardship, 2 items (household income and borrowing money), 1 (good) -5 (poor), Alpha reliability =0.92
Perceived subjective well-being ,3 items, satisfaction, happiness, general health; answers range 1 (poor) – 5 (good); Alpha reliability = .07)
More information: http://www.europeansocialsurvey.org/
Measures

Descriptivesupper individual level (n = 9755), lower diagonal country * year level (
age gender edusup trust col
Col_mfin
wel
Age - .002 -.12** .01 .03* -.37** -.09** .08** -.15**
Gender (1 = male) .04 - -.03* -.15** -.01 .14** .02 -.09** .04*
Higher education (edu) -.14 -.01 - -.08** .12** .17** .11** -.16** .13**
Supervising 3) (1 = yes) .04 -.18 -.39** - -.06** -.11** -.10** .19** -.10**
Social trust .42** .28 .20 -.31 - .04** .16** -.30** .34**
Collectivism -.05 -.01 .11 -.29 .50** - .28** -.17** .14**
Collectivism_m -.36* -.05 .28 -.36 .15 .58** - -.16** .08**
Financial hardship -.36* -.41* -.17 .38 -.83** -.41** -.08 - -.44**
Well-being .46** .42* .17 -.35 .79** .11 -.04 -.86 -
M 52.05 .64 .17 .61 4.96 -.27 -.27 2.17 3.81
SD 15.97 .48 .38 .49 2.07 .44 .12 .86 .76
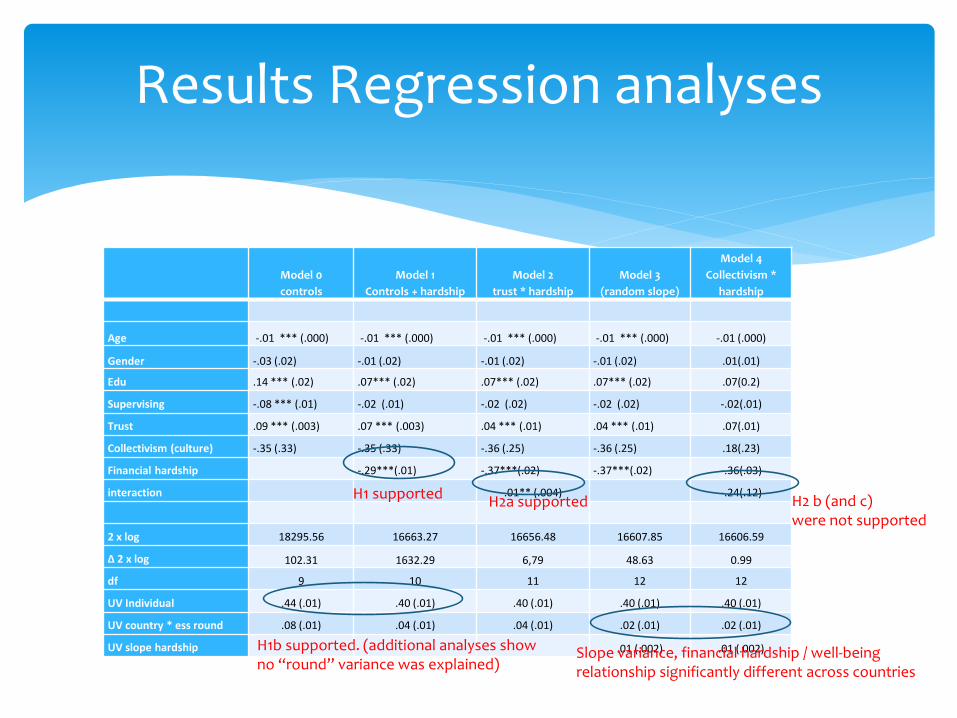
Results Regression analyses
Model 0
controls
Model 1
Controls + hardship
Model 2
trust * hardship
Model 3
(random slope)
Model 4
Collectivism *
hardship
Age -.01 *** (.000) -.01 *** (.000) -.01 *** (.000) -.01 *** (.000) -.01 (.000)
Gender -.03 (.02) -.01 (.02) -.01 (.02) -.01 (.02) .01(.01)
Edu .14 *** (.02) .07*** (.02) .07*** (.02) .07*** (.02) .07(0.2)
Supervising -.08 *** (.01) -.02 (.01) -.02 (.02) -.02 (.02) -.02(.01)
Trust .09 *** (.003) .07 *** (.003) .04 *** (.01) .04 *** (.01) .07(.01)
Collectivism (culture) -.35 (.33) -.35 (.33) -.36 (.25) -.36 (.25) .18(.23)
Financial hardship -.29***(.01) -.37***(.02) -.37***(.02) -.36(.03)
interaction .01** (.004) -.24(.12)
2 x log 18295.56 16663.27 16656.48 16607.85 16606.59
Δ 2 x log 102.31 1632.29 6,79 48.63 0.99
df 9 10 11 12 12
UV Individual .44 (.01) .40 (.01) .40 (.01) .40 (.01) .40 (.01)
UV country * ess round .08 (.01) .04 (.01) .04 (.01) .02 (.01) .02 (.01)
UV slope hardship .01 (.002) .01 (.002)
H1 supported
H1b supported. (additional analyses show no “round” variance was explained)
H2a supported H2 b (and c) were not supported
Slope variance, financial hardship / well-beingrelationship significantly different across countries

Interaction plot social trust * financial hardship

Strengths and weaknesses
Strength of the study:
large sample size
many European countries are represented
two data points (before and after the crisis)
Weaknesses:
Short and diverse nature of the measures,
panel data, but not longitudinal (within person)

Financial hardship relates negatively to well-being, and differences in levels of financial hardship explain differences in well-being acrosscountries
ESS data show support for a buffer effect of social trust. The averagelevel is very low, so may be worth while investing in trying to increasethis social buffer.
Current analyses show the strength of the hardhip-wellbeingrelationship differs across countries.
We have not been able to find an explanatory mechanism for these differences, yet.
To conclude

Future studies: Investigate the effect of other possible cross-country
buffers of the hardship – well-being relation (e.g., unemployment benefit), which would aid European policy making.
Not just include culture at the country level, but alsolook at personal values differences within countries(would actually be possible with ESS data).
More generally, look at person-environment interactionsto develop more tailor made solutions.
Future studies: