financial performance report 2008 - dfat.gov.au · nfe pendidikan non -formal non -formal education...
TRANSCRIPT
Preface
FINANCIAL PERFORMANCE REPORT 2008 Annual Review of Indonesian Education Sector Financing February 2009
Australia – Indonesia Basic Education Program
A joint initiative of the Australian and Indonesian Governments

Preface
Page ii
PREFACE
The Australia–Indonesia Partnership is a whole of government aid program encompassing
expenditure of around $2 billion over five years. This includes the $1 billion Australia Indonesia
Partnership for Reconstruction and Development (AIPRD), the single largest aid package in
Australia’s history, of which the Basic Education Program (BEP) is a key element.
The objective of BEP is improved equitable access to higher quality and better governed basic
education services, especially in targeted disadvantaged areas. Support is delivered through a
programmatic approach based on the three pillars of the government’s RENSTRA: improved access
through construction of junior secondary schools, improved quality and internal efficiency and
improved governance. For BEP, a fourth pillar is enhanced resource mobilisation, including policy
advice, research and sector monitoring.
Recognising the scale of the policy reform agenda being adopted by Government of Indonesia (GoI),
the Strategic Advisory Services (SAS) component of BEP has been designed primarily to advise on the
overall strategic direction of the BEP and to implement activities under pillar four. The contractor for
Strategic Advisory Services (CSAS) is also tasked with providing selected capacity building and
mentoring to key counterparts in MoNE and MoRA.
This is the second Annual Financial Performance Report. It has been prepared by a CSAS core team
member - Finance Performance Specialist, Mr. Adam Rorris with close collaboration and support
from the Ministry of Finance. The consultant acknowledges the support and advice of the many
people that contributed to the study. The document was reviewed by team leader Ms. Hetty
Cislowski. Data analysis support was provided the consultant Mr. Geoff Howse. Mr. Ahmad Evandri
undertook the task of collecting the relevant electronic and paper records from districts.
The second part of this report is a summary of the CSAS report District Financial Reporting in
Education by the consultant Dr. Winifred Wirkus. The report provides a background and overview of
planning and budgeting at the district level in Indonesia. It reviews the usefulness and effectiveness
of the key financial reports required by district level education offices. It also provides
recommendations for strengthening the district financial reporting system.
The views and opinions expressed in this report are those of the CSAS Finance Performance
Specialist and do not necessarily reflect those of MoNE, MoRA, Bappenas or AusAID.

Abbreviations and Acronyms
Page iii
ABBREVIATIONS AND ACRONYMS
Acronym Bahasa Indonesia English
ACER Australian Council for Educational Research
ADB Bank Pembangunan Asia Asian Development Bank
APK Angka Partisipasi Kasar Gross Enrolment Rate
APM Angka Partisipasi Murni Net Enrolment Rate
AusAID Badan Australia untuk Pembangunan
Internasional
Australian Agency for International Development
AWP Rencana Kerja Tahunan Annual Work Plan
Balitbang Badan Penelitian dan Pengembangan Centre for Research and Development
Bappenas Badan Perencanaan Pembangunan Nasional National Development Planning Agency
BEP Program Pendidikan Dasar Australia-Indonesia Australia-Indonesia Basic Education Program
BOS Biaya Operasional Sekolah School Operational Fund
BOS Buku Biaya Operasional Sekolah Buku School Operation Funds for Textbooks
BSNP Badan Standar Nasional Pendidikan National Education Standards Board
CCR Rasio Kelas-Ruang Kelas Class-Classroom Ratio
CSAS Kontraktor untuk Layanan Kepenasehatan
Strategis
Contractor for Strategic Advisory Services
DG Direktorat Jendral Directorate General
EC Komisi Eropa European Commission
EFA Pendidikan untuk Semua Education for All
ESP Rencana Strategis Pendidikan Education Strategic Plan
ESWG Kelompok Kerja Sektor Pendidikan Education Sector Working Group
GDP Pendapatan Domestik Bruto Gross Domestic Product
GER Angka Pendaftaran Kasar Gross Enrolment Rate
GOI Pemerintah Indonesia Government of Indonesia
JSS Sekolah Menengah Pertama Junior Secondary School
KPI Indikator Kunci dari Kunci Key Performance Indicator
LAKIP Laporan Akuntabilitas Kinerja Publik Public Performance Accountability Report
MCPM Kontraktor Pelaksana untuk Pengelolaan Program Managing Contractor Program Management
MDA Kajian Tengah Dekade Mid-Decade Assessment
MoF Departemen Keuangan Ministry of Finance
MONE Departemen Pendidikan Nasional Ministry of National Education
MORA Departemen Agama Ministry of Religious Affairs
NER Angka Pendaftaran Murni Net Enrolment Rate
NFE Pendidikan Non-formal Non-Formal Education
PAM Matriks Aksi Kebijakan Policy Action Matrix
PCMU Unit Pengelola dan Koordinasi Program Program Coordination and Management Unit
PMPTK Peningkatan Mutu Pendidik dan Tenaga
Kependidikan
Quality Improvement of Teachers and Education
Personels
Abbreviations and Acronyms
Page iv
Acronym Bahasa Indonesia English
PSC Komite Pengarah Program Program Steering Committee
PTP Matrix Matriks Sasaran dan Kinerja Program Program Targets and Performance Matrix
PUSLIT Pusat Penelitian Center for Research
PUSPENDIK Pusat Statistik Pendidikan Center for Education Statistics
Renstra Rencana Strategis Strategic Plan
Rp. Rupiah Rupiah
SCR Rasio Siswa Ruang Kelas Student Classroom Ratio
SD Sekolah Dasar Primary School
SIKD Sistem Informasi Keuangan Daerah Regional Finance Information system
SMP Sekolah Menengah Pertama Junior Secondary School
SMA Sekolah Menengah Atas Senior Secondary School
SWAP Pendekatan Sektor secara Luas Sector Wide Approach
SPI Indikator Kinerja Tambahan Supplementary Performance Indicator
STR Rasio Siswa Guru Student Teacher Ratio
SUSENAS Survei Sosial Ekonomi Nasional National Socio-Economic Survey
TA Bantuan Teknis Technical Assistance
ToR Kerangka Acuan Kerja Term of Reference
UN Perserikatan Bangsa-Bangsa United Nations
USAID Badan Amerika Serikat untuk Pembangunan
Internasional
United States Agency for International
Development

Executive Summary
Page v
EXECUTIVE SUMMARY
Background
The Financial Performance Report 2008 monitors and reports on trends in education financing in
Indonesia. This is the second Finance Performance Report produced by the Contractor for the
AusAID supported Strategic Advisory Services team. The report is intended for the use of high level
government officials and education sector technical experts and is updated annually. It provides
succinct analysis and is intended to be an accessible tool for operational planning. The objectives of
the report are:
1. To identify trends in the quantum and distribution of education funding in relation to national
policy and school needs.
2. To monitor education sector and school resourcing from the standpoint of the key RENSTRA
themes of access, quality improvement and improved accountability.
3. To inform GoI and donors of the effectiveness and efficiency of current school funding
mechanisms.
4. To support the capacity of GoI institutions to monitor and report on school financing.
Expanded Set of Indicators
The report analysis is framed by a set of Key Performance Indicators (KPI). These KPI focus attention
on the main RENSTRA themes and government financial commitment to education. Most of these
KPI are reported on at a national level by the GoI as part of its international Education for All (EFA)
reporting obligations. An additional two (2) KPI have been nominated to guide analysis of district
level expenditures.
Supplementary Performance Indicators (SPI) are also presented in this report. They offer a more
nuanced perspective on financial performance of the education sector. The KPI and SPI are updated
in each annual Financial Performance Report with the latest available national and district data.
This report is based on expanded database for 2007. The MoF received data from districts that had
not supplied data at the time of the previous publication. This means there are some variations from
the results presented in the 2007 report but these are generally not significant variations. The report
highlights any significant changes.
Each of the indicators proposed is described as being either a lead or lag indicator. Lag indicators are
summative in nature. They describe the current state of progress toward an expected outcome. Lead
indicators are those which capture the rate of movement towards an outcome or have a clear causal
relationship to a desired outcome.
Executive Summary
Page vi
District and National Level Analysis
This report continues to provide a detailed analysis not only of national level expenditures but also
of expenditures at the district level. This analysis has been made possible through the collection of
disaggregated district expenditure data collected from the original budget papers prepared and
submitted by each district to the MoF. These records are the most authoritative district level
account available of actual budget allocations for a year and actual expenditures for the previous
year. The initial cooperative arrangement established by CSAS with the MoF in 2007 has continued
into 2008.
The report is structured to enable comparisons with the results for 2007. While time series
comparisons have been possible at a national level, this will be the first time multiple time series
comparisons are being established at the district level.
In this report district level analysis for 2006 is based on the final available set of data. The 2007
report was based on the returns for only 60% of districts that had submitted their 2006 budget
papers to the MoF. The data analysis and interpretation has now been updated in the Financial
Performance Report 2008. It is not expected that there will be any further data received by MoF for
the outstanding districts. This analysis for 2006 data can therefore be considered final.
A summary of the results and findings for each of the KPI and SPI is presented in table format as part
of this Executive Summary. This includes a summary assessment of the indicator result being
positive, negative or uneven. A `Positive’ result indicates it is supportive of RENSTRA objectives and
BEP activities; a ‘Negative’ result suggests it is contradictory to RENSTRA objectives and BEP
activities; and an ‘Uneven’ result indicates large variation between districts.
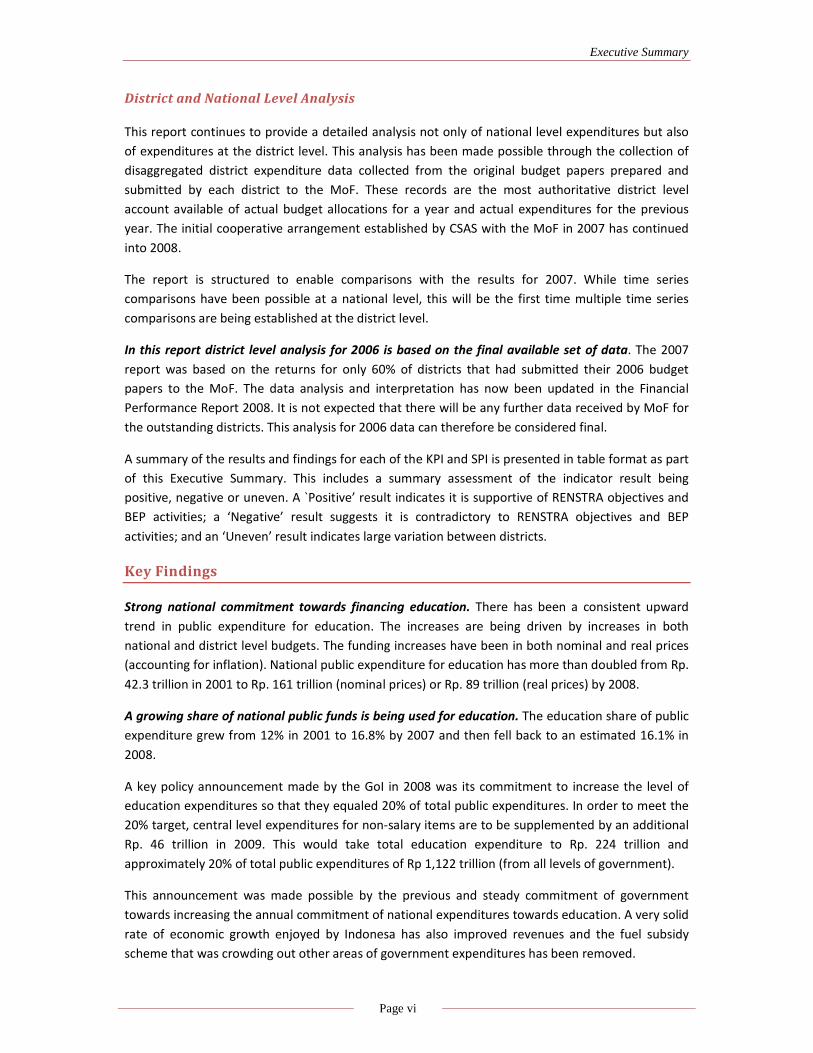
Key Findings
Strong national commitment towards financing education. There has been a consistent upward
trend in public expenditure for education. The increases are being driven by increases in both
national and district level budgets. The funding increases have been in both nominal and real prices
(accounting for inflation). National public expenditure for education has more than doubled from Rp.
42.3 trillion in 2001 to Rp. 161 trillion (nominal prices) or Rp. 89 trillion (real prices) by 2008.
A growing share of national public funds is being used for education. The education share of public
expenditure grew from 12% in 2001 to 16.8% by 2007 and then fell back to an estimated 16.1% in
2008.
A key policy announcement made by the GoI in 2008 was its commitment to increase the level of
education expenditures so that they equaled 20% of total public expenditures. In order to meet the
20% target, central level expenditures for non-salary items are to be supplemented by an additional
Rp. 46 trillion in 2009. This would take total education expenditure to Rp. 224 trillion and
approximately 20% of total public expenditures of Rp 1,122 trillion (from all levels of government).
This announcement was made possible by the previous and steady commitment of government
towards increasing the annual commitment of national expenditures towards education. A very solid
rate of economic growth enjoyed by Indonesa has also improved revenues and the fuel subsidy
scheme that was crowding out other areas of government expenditures has been removed.

Executive Summary
Page vii
Education share of Gross Domestic Product (GDP) has grown and will continue to grow if 20%
target for education expenditure is achieved. Education expenditure as a percentage of GDP rose
from 2.1% in 2001 to 3.9% by 2007, but has steadied at 3.6% in 2008. Expressed as a percentage of
GDP, future growth in education share of GDP will be attained if the GoI delivers on its 20%
commitment for education portion of national public expenditure.
Districts increased commitment towards education between 2006 and 2007. Average district level
education expenditures across Indonesia increased from 26.8% of the total district budget (APBD) in
2006 to a 27.8% share in 2008. During the same period, BEP districts increased the education share
of their budgets by 1% from 26.4% to 27.5%.
Annual growth in district education spending is uneven. There was a 23% average annual growth in
district education budgets between 2006 and 2007 and 19% growth between the years 2007 and
2008. Districts by poverty quintile showed education budget growth ranging from 6% (second
poorest) to more than 25% growth for middle ranking provinces.
BEP districts matched the national growth rate in education spending in 2006-07, but slipped to a
16% growth rate in 2007-08. This may indicate an investment substitution effect occurring in BEP
districts if their average growth in education expenditure is slipping well below national average
growth.
Uneven district education commitments will lead to a widening education gap. Districts that have
high poverty rates and are persistently allocating a significantly smaller share of resources for
education than the national average are at great disadvantage to the rest of the country. This
disadvantage is likely to be compounded each year as other, more wealthy districts spend greater
amounts on education.
Growth in district education spending continues to grow faster than aggregate district public
expenditures. Nationally, the picture is positive for district education spending relative to aggregate
district expenditure. But there has been a slowdown within districts included in the BEP (BEP
districts). Education expenditure at the district level grew 1.1 times faster than aggregate district
expenditures across Indonesia. BEP districts grew their education expenditures at 1.23 times the rate
of aggregate district expenditures between 2006 and 2007, but this slowed down to 1.05 times by
2007-08.
School Operational Funds (BOS) grants remain a vital input for school resourcing. The BOS grants
have great potential to fund innovative and securely financed interventions at schools. BOS funds
provided 10%-12% of total funds available to district run schools. As district expenditures increase,
the BOS funds remain significant as discretionary school level funds, but their share of total district
level expenditure declined from 12% in 2006 down to 10% by 2008.
Expenditure per student is highest in the poorest districts and in the eastern region of the country.
The highest average per student allocations are found in the poorest districts (quintile 5) where in
2008 they average more than Rp. 2 million per student. Districts in the Eastern region of the country
allocate (on average) an additional Rp. 1 million more per student than Western region districts.
The per-student allocation is greatly affected by the sparsity of population. Therefore districts that
are more sparsely populated (such as those in the eastern region and many of those in the poorest
Executive Summary
Page viii
quintile districts) have higher average salary costs. This is because of lower student/teacher ratios
and higher salary related costs associated with remote area allowances.
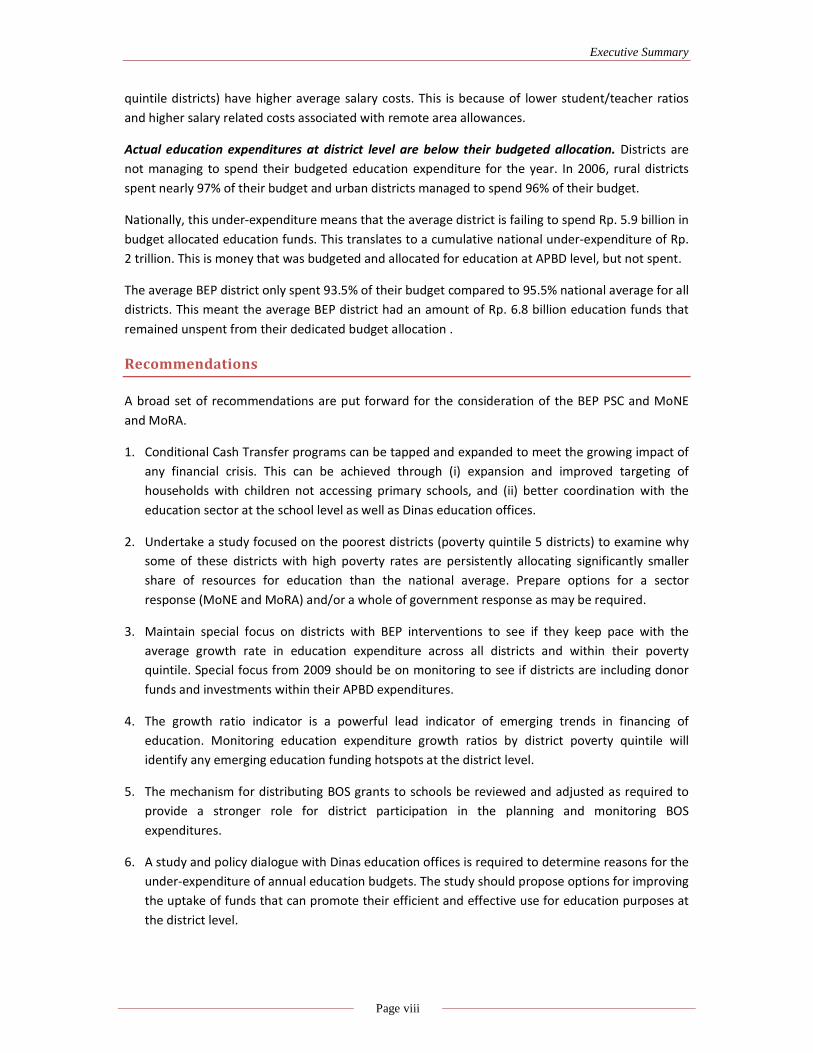
Actual education expenditures at district level are below their budgeted allocation. Districts are
not managing to spend their budgeted education expenditure for the year. In 2006, rural districts
spent nearly 97% of their budget and urban districts managed to spend 96% of their budget.
Nationally, this under-expenditure means that the average district is failing to spend Rp. 5.9 billion in
budget allocated education funds. This translates to a cumulative national under-expenditure of Rp.
2 trillion. This is money that was budgeted and allocated for education at APBD level, but not spent.
The average BEP district only spent 93.5% of their budget compared to 95.5% national average for all
districts. This meant the average BEP district had an amount of Rp. 6.8 billion education funds that
remained unspent from their dedicated budget allocation .
Recommendations
A broad set of recommendations are put forward for the consideration of the BEP PSC and MoNE
and MoRA.
1. Conditional Cash Transfer programs can be tapped and expanded to meet the growing impact of
any financial crisis. This can be achieved through (i) expansion and improved targeting of
households with children not accessing primary schools, and (ii) better coordination with the
education sector at the school level as well as Dinas education offices.
2. Undertake a study focused on the poorest districts (poverty quintile 5 districts) to examine why
some of these districts with high poverty rates are persistently allocating significantly smaller
share of resources for education than the national average. Prepare options for a sector
response (MoNE and MoRA) and/or a whole of government response as may be required.
3. Maintain special focus on districts with BEP interventions to see if they keep pace with the
average growth rate in education expenditure across all districts and within their poverty
quintile. Special focus from 2009 should be on monitoring to see if districts are including donor
funds and investments within their APBD expenditures.
4. The growth ratio indicator is a powerful lead indicator of emerging trends in financing of
education. Monitoring education expenditure growth ratios by district poverty quintile will
identify any emerging education funding hotspots at the district level.
5. The mechanism for distributing BOS grants to schools be reviewed and adjusted as required to
provide a stronger role for district participation in the planning and monitoring BOS
expenditures.
6. A study and policy dialogue with Dinas education offices is required to determine reasons for the
under-expenditure of annual education budgets. The study should propose options for improving
the uptake of funds that can promote their efficient and effective use for education purposes at
the district level.

Executive Summary
Page ix
Table 1: Summary Findings – Financial Performance at National/District Levels
Indicator Description Gov’t Level/
Related Goal
Comment
KPI 1 Share of public
expenditure
Public expenditure on
education as
percentage of total public
expenditure
National
Gov’t commitment
Result = Neutral
Significant growth in allocations as proportion of national expenditure since
2001 (12%) to 16% by 2008. There was a small decline in the education share
of public expenditure in 2008 from a high of 16.8% in 2007.
KPI 2 Share of GNP Public expenditure on
education as percentage of
GDP
National
Gov’t commitment
Result = Positive
Education expenditure as a percentage of GDP has risen from 2.1% in 2001 to
3.6% by 2008.
Small decline from 3.9% in 2007 to 3.6% in 2008. Future growth in public
allocations for education may become harder in the future.
KPI 3 Share of non-
salary resources
% share of education budget
spending on non-salary
costs.
National
Quality
Result = Negative
Salary related items as part of Routine expenditures consume 84% of
resources.
KPI 4 National
commitment for non-
formal learning
Public expenditure on
literacy and NFE as
percentage of public
expenditure on education
National
Equity/access
Result= Negative
NFE expenditure is approximately 1% of total expenditure for education.
Key advantage of NFE is its cost-effectiveness; increased levels of investment
are needed to maximise possible economic and social returns.
KPI 5 Commitment to
Basic education
relative to national
wealth
Public recurrent expenditure
on basic education per pupil
as percentage of GNP per
capita
National
Equity/access
Result = Positive
In 2004 basic education accounts for approximately 70% of education
expenditure.
KPI 6 District
commitment to
education
Education as % of total
public expenditures
District
Gov’t commitment
Equity/access
Result = Positive
Average district level education expenditures in Indonesia increased from 27%
of total district budget in 2006 to 28% share in 2008.
KPI 7 Annual growth in
spending for the
poorest districts
Annual % change in public
expenditures for education in
lowest quintile districts
compared to national %
change in public expenditure
for education
District
Equity/access
Result = Uneven
Annual growth in 2008 education budgets was greatest in richest and poorest
districts. Only one poverty quintile of districts (quintile 4) had a year of growth
in education expenditure that was less than 10%.
BEP districts showed markedly slower growth in education expenditures than
non-BEP districts in 2008 (15% compared to 21%).
KPI 8 Average District
Expenditure per
student **
Public expenditure from
APBD divided by total
number of school students
District
Gov’t commitment
Quality
Result = Positive
Strong growth in average expenditures per student across country. Poorest
quintile districts have highest per student expenditure.
KPI 9 Actual education
expenditure as % of
planned expenditure**
Realised APBD for
education as % of planned
APBD for education
District
Gov’t commitment
Result = Negative
Actual expenditures at district level average only 95% of planned allocations.
Poorest quintile districts only spend 90% of budget.
SPI 1 Relative growth
ratio of education
spending
Annual % growth in public
education expenditure as
ratio to % annual growth of
total public expenditure
District
Gov't commitment
Result = Positive
Education expenditure at the district level is growing 1.1 times faster than
aggregate public expenditures across Indonesia.
BEP districts grew education expenditures at 1.1 times the rate of aggregate
public expenditures between 2007 and 2008.
SPI 2 Discretionary
school funds as % of
total school
expenditure
Estimated BOS expenditure
as % of total school
expenditure
District
Quality
Result = Positive
The BOS grants to district schools offer a vital source of discretionary funds to
schools. They provide an additional 11% of average of district level
expenditure directly to district run schools.
BOS grants as a % of total district budget are diminishing as district budgets
grow at a faster rate.
* KPI – Key Performance Indicator, SPI – Supplementary Performance Indicator. ** New indicators

Executive Summary
Page 1
Table of Contents
PREFACE .......................................................................................................................................................... II
ABBREVIATIONS AND ACRONYMS ..................................................................................................................III
EXECUTIVE SUMMARY .................................................................................................................................... V
BACKGROUND ........................................................................................................................................................ V
KEY FINDINGS ........................................................................................................................................................ VI
RECOMMENDATIONS ............................................................................................................................................. VIII
I. INTRODUCTION ....................................................................................................................................... 2
A. OBJECTIVES OF THE FINANCIAL PERFORMANCE REPORT ......................................................................................... 2
B. SCOPE OF ANALYSIS ........................................................................................................................................ 2
C. APPROACH AND METHODOLOGY ....................................................................................................................... 3
D. REPORT STRUCTURE ........................................................................................................................................ 5
II. FINANCIAL PERFORMANCE – NATIONAL LEVEL ....................................................................................... 6
A. OVERVIEW .................................................................................................................................................... 6
B. TRENDS IN EDUCATION FUNDING....................................................................................................................... 6
III. FINANCIAL PERFORMANCE – DISTRICT LEVEL ........................................................................................ 13
A. OVERVIEW .................................................................................................................................................. 13
B. TRENDS IN EDUCATION FUNDING..................................................................................................................... 14
IV. DISTRICT FINANCIAL REPORTING IN EDUCATION: ANALYSIS OF REPORTING EFFECTIVENESS ................ 32
KEY FINDINGS: CENTRAL LEVEL RELATIONSHIP WITH DISTRICT REPORTING ....................................................................... 32
KEY FINDINGS: DISTRICT REPORTING ......................................................................................................................... 33
RECOMMENDATIONS ............................................................................................................................................. 34
V. APPENDIX .............................................................................................................................................. 37

Introduction
Page 2
I. INTRODUCTION
This is the second Finance Performance Report produced by the CSAS team. The report assesses the
trends in education funding at national and district level in Indonesia between 2006 and 2008.
It is for the attention of the Project Steering Committee, the senior level officials within relevant GoI
agencies and for AusAID as the donor agency.
A. Objectives of the Financial Performance Report
The objectives of the report are:
1. To identify trends in the quantum and distribution of education funding in relation to national
policy and school needs
2. To monitor education sector and school resourcing addressing the key RENSTRA themes of
access, quality improvement and improved accountability
3. To inform GoI and donors of the effectiveness and efficiency of current school funding
mechanisms
4. To support the capacity of GoI institutions to monitor and report on school financing
B. Scope of Analysis
District Level Disaggregation
The district level of government has an increasing importance in education provision under the GoI
decentralisation policy. Financial analysis of education allocations therefore needs to have a district
level disaggregation to assess the variability in fiscal capacity and actual allocations for education
resourcing.
A district finance database has been assembled from the paper financial records of district level
budgets that disaggregate education related expenditure. For 2006, the MoF has now collected
detailed official budget papers from 345 districts (78%) compared to the 263 districts (approximately
60%) that were available for analysis as part of the 2007 report.
The district financial analysis of this report provides comparisons across the years 2006, 2007 and
2008. The data set for 2006 remains incomplete and it is not clear whether additional data will be
received by MoF. The 2006 dataset is therefore unlikely to be revised for future analyses. The 2006
data covers 345 districts (78% of total)
Data for 2007 cover 400 districts (90% of total).
The data for 2008 is still incomplete with returns received and processed from 162 districts (37% of
total) by the time this report was prepared. District data analysis for 2008 is still provisional and
should not be used for monitoring and evaluation purposes because of the incomplete database.
However, certain trends can be shown. CSAS is liaising with the MoF regarding the 2008 district

Introduction
Page 3
financial data and the next Financial Performance Report (2009) will include the revised 2008 district
level data.
Key Performance Indicators
The Key Performance Indicators (KPI) focus on the three main RENSTRA themes and government
financial commitment to education.
Two Supplementary Performance Indicators (SPI) sit below the KPI. The SPI offer a more nuanced
perspective across the three RENSTRA themes assessing education expenditure at a district level. SPI
have been chosen based on available data against the three RENSTRA themes.
Lead and Lag Indicators
Each of the indicators proposed are described as being either a lead or lag indicator1.
Lag indicators are summative in nature. They describe the current state of progress toward an
expected outcome. For example, a lag indicator measuring government financial commitment
towards education is the percentage of total public expenditure allocated towards education.
Lead indicators are those which capture the rate of movement towards an outcome or have a clear
causal relationship to a desired outcome. For example, a lead indicator of government commitment
towards financial commitment towards education might be annual percentage real increase in the
education share of total public expenditure.
Selection of Indicators
The indicators used have been drawn from a number of sources. One group of Key Performance
Indicators is used by GoI as part of its EFA reporting obligations.
Another set of indicators focuses mainly on the district level of analysis. These have been selected to
be of use for the Basic Education Program (BEP) in promoting development of the basic education
sector across Indonesia. These indicators can be of use at the district level for planning and
budgeting purposes.
A larger list of potential indicators of financial performance has been prepared but it has not been
possible to use them due to data limitations. In the future it will be possible to report on additional
indicators as more data becomes available.
C. Approach and Methodology
Phased Approach – Over 3 Years
The financial performance monitoring of the education sector by CSAS began in 2007. The annual
Financial Performance Report will be built on each successive year as additional data becomes
1 Conceptually, “lead and lag indicators” have originated in the development of performance scorecards for use by business analysts. They
are adapted here for use within the education sector.
Introduction
Page 4
available and as the indicators become better known. Financial performance monitoring begins with
what is available now and works towards future improvement.
The district level data and findings presented in this report are provisional. Financial data for 2006 is
available for only 345 districts – approximately 78%. Data for 2008 is limited to a collection from 162
districts and will be expanded for further analysis in the 2009 report.
Build On Existing Research
The monitoring of financial performance utilises all possible existing data sources and avoids
wherever possible the request for new data collections from schools and districts. GoI and donors
already fund extensive research and data collections across the country.
Data Sources and Collections: Financial Data
National level financial data (combining districts, provinces and central levels) up to 2007 has been
largely sourced from the EFA Mid-Decade Assessment Report prepared by the GoI and presented in
May 2007. This report also uses data appearing in the World Bank report Spending for Development
– Indonesia Public Expenditure Review 2007. National level data for 2008 has been sourced from the
MoF publication DATA POKOK APBN 2008 – 2009. Estimates of district and provincial level
expenditures for 2008 have been based on World Bank estimates and CSAS estimates based on
previous year allocations and trends.
District level financial data has been collected from the Ministry of Finance (MoF) Regional Financial
Information System (SIKD). The SIKD collects in hard copy format the budget and actual expenditures
of all districts and provinces. CSAS arranged with the Officers of the SIKD section to be given access
to the available SIKD records. A painstaking process of manually sorting through the paper financial
records of all districts and provinces was undertaken. Near complete financial records for all districts
and provinces were obtained for 2007 and for approximately 78% of all districts in 2006.
The data collection process in 2008 was delayed due to the extensive renovation of the SIKD section
undertaken during the second half of the year. This meant access to paper records was limited
resulting in extensive delays.
The year 2006 reflects financial commitment undertaken by the GoI prior to the commencement of
the BEP and is therefore the best option for the baseline financial data.
Data Sources and Collections: Non-Financial Data
Education: The student, teacher and school facilities data is derived from the statistical collection of
the Education Census conducted by MORA and MONE. This education data has been collected and
stored in the BEP Education Sector Database. This database has been built from available
government statistical collections and represents authoritative government sanctioned data. The
database includes population data collected from the Bureau of Central Statistics (BPS).
Poverty: Poverty is an important analytical filter for the Financial Performance Report. Financial data
analysis includes an examination of poverty by segregating districts into poverty quintiles. This
analysis is consistent with the analysis applied in the CSAS Annual Sector Monitoring Report. The
Introduction
Page 5
Poverty quintiles are based on the “P0” poverty scale developed by Survei Sosial Ekonomi Nasional
(SUSENAS). This scale captures the incidence of poverty (the proportion of people living below the
poverty line).
Incorporate Into Existing Reporting Systems
The Financial Performance Report indicators and analysis will be available to be used and
incorporated within existing mandatory reports of MONE and MORA.
The data underpinning most of the indicators at the district level is sourced from GoI statistical
collections. This should mean the indicators will be able to be reported within other regular reports.
At the district level, these indicators will be useful and could be incorporated within their reporting
systems.
D. Report Structure
Financial Performance - National Level
The Financial Performance Statement presents an analysis of the nationally available financial
performance indicators for education. These are presented according to the key RENSTRA themes of
Access, Quality and Governance/Accountability.
Financial Performance – District Level
Two additional Financial Performance KPIs and two SPIs have been identified for the district level to
assess district level allocations to basic education.
Special Discussion Themes
Each Financial Performance Report presents in more detail some particular themes or issues that
have been explored through specific research that has been commissioned by CSAS during the year.
This report includes an examination of district financial reporting in education. The financing streams
in education in Indonesia are complex, and the review provides a historical context and rationale for
the organisation of education financing at district level. It highlights the strengths of the financial
reporting system and the areas where improvement is needed to improve the efficiency and
effectiveness of reporting.

Financial Performance – National Level
Page 6
II. FINANCIAL PERFORMANCE – NATIONAL LEVEL
A. Overview
Education funding in Indonesia is derived from a variety of public and private sources. Public funding
is provided mostly by the central and provincial levels of government with the provincial level
providing a smaller share. National level analysis of aggregate public expenditure is complicated
because of these different sources of funding and the subsidisation of salaries and services provided
by the central level of government.
For the 2008 Financial Performance Report, the national level analysis is built from (i) the data
collected by the World Bank and presented in its recent publication Investing in Indonesia’s
Education, World Bank, 2007, (ii) the national budget data presented in the MoF publication DATA
POKOK APBN 2008 – 2009, and (iii) CSAS estimates of sub-national expenditures for the year 2008
based on historical trends and the evidence of data collected from districts and provinces that have
supplied data for 2008.
The national trends in the public financing of education are analysed in this section. Key
Performance Indicators (KPI) have been identified for the national level financing assessment. Each
KPI has been assigned a ranking that indicates (neutral, positive, negative).
B. Trends in Education Funding
Upward trend in national public expenditure for education in Indonesia. There has been a
consistent upward trend in public expenditure for education. The funding increases have been
attained in both nominal and real prices (accounting for inflation). This analysis covers government
expenditures from all levels of government.
Figure 1: National Public Expenditure on Education, Rp. Trillion 2001-2008
Financial Performance – National Level
Page 7
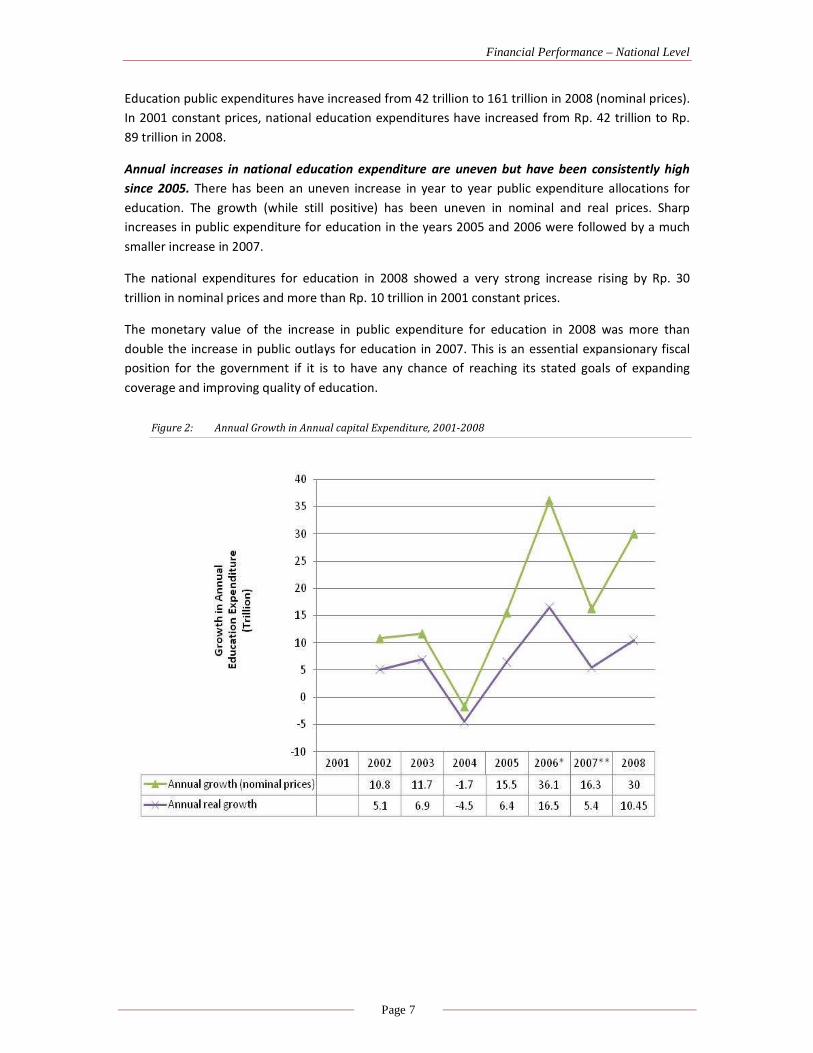
Education public expenditures have increased from 42 trillion to 161 trillion in 2008 (nominal prices).
In 2001 constant prices, national education expenditures have increased from Rp. 42 trillion to Rp.
89 trillion in 2008.
Annual increases in national education expenditure are uneven but have been consistently high
since 2005. There has been an uneven increase in year to year public expenditure allocations for
education. The growth (while still positive) has been uneven in nominal and real prices. Sharp
increases in public expenditure for education in the years 2005 and 2006 were followed by a much
smaller increase in 2007.
The national expenditures for education in 2008 showed a very strong increase rising by Rp. 30
trillion in nominal prices and more than Rp. 10 trillion in 2001 constant prices.
The monetary value of the increase in public expenditure for education in 2008 was more than
double the increase in public outlays for education in 2007. This is an essential expansionary fiscal
position for the government if it is to have any chance of reaching its stated goals of expanding
coverage and improving quality of education.
Figure 2: Annual Growth in Annual capital Expenditure, 2001-2008

Financial Performance – National Level
Page 8
KPI 1: Education Expenditure as Proportion of Total Public Expenditure
Figure 3: Education Expenditure as Percent of Total National Public Expenditure, 2001-2008
Result: Neutral
Data Availability: Full
Comment: There has been very significant growth in education expenditure allocations
as a proportion of national expenditure since 2001. Education’s share has
grown from 12% in 2001 to more than nearly 16% by 2008.
A one year decline in the share of education expenditures occurred in 2004.
This fall was related to the fuel subsidy crisis and the fiscal squeeze
encountered by the central government. There was also a smaller decline in
the education share of public expenditure in 2008 from a high of 16.8% in
2007.
This small decline in 2008 is not significant enough to categorise as a negative
result. There was a substantial nominal and real growth in expenditure for
education (see previous section). Particularly strong government revenues in
2008 facilitated a large growth in public expenditures.
In contrast, the relative decline in education expenditure during 2004 was
affected through a decline in mostly development expenditures.
Future Analysis: Annual. Will require establishment of national level education finance
database
Policy Implications: The removal of the fuel subsidy has created the fiscal space to expand financial
commitment to the education sector. The GoI is now better placed to meet the growing funding
needs of the education sector.

Financial Performance – National Level
Page 9
A key policy announcement made by the GoI in 2008 concerned its funding targets for education.
The President of the Republic announced in 2008 that the government was commiting itself to
increasing its share of expenditure so that the national level of education expenditure from all levels
of government would reach 20% of total public expenditures.
Subsequent to this announcement the MoF released supplementary documentation in August 2008
to its initial planned budget papers. The supplement papers (Dokument Tambahan 2009) showed
how this 20% expenditure target was to be met. The initial target of the planned national budget
(RAPBN) was for central level education expenditures of about Rp. 77 trillion out of a total Rp. 188
trillion. In order to meet the 20% target, central level expenditures for non-salary items are to be
supplemented by an additional Rp. 46 trillion in 2009. This would take total education expenditure
to Rp. 224 trillion and approximately 20% of total public expenditures of Rp 1,122 trillion (from all
levels of government).
This announcement was made possible by the previous and steady commitment of government
towards increasing the annual commitment of national expenditures towards education. It was also
made possible by the very solid rates of economic growth that have been enjoyed the country that
have improved revenues as well as the removal of the fuel subsidy scheme that was crowding out
other areas of government expenditures.
It remains to be seen whether the government can deliver on this 20% commitment for education in
2009. The government will be greatly challenged by the severe global financial crisis that is evolving
into an economic crisis in 2009. This will (amongst other things) affect government revenues and will
also generate stronger demand for other alternative expenditures (largely through household
transfer payments) that can provide a social safety net for households and communities.
A key challenge for education sector policy makers and stakeholders will be to try to insert the
interests of children and education within the evolving policy responses of government to the
economic crisis. One example of how this can be achieved is with the Conditional Cash Transfer
schemes used by government to provide a social safety net. These cash transfer programs can be
especially important and effective during period of financial crisis. Indonesia has a long experience
with CCT schemes and is well positioned to expand existing initiatives to deal with the financial crisis.
Recommendation: Conditional Cash Transfer programs can be tapped and expanded to meet the
growing impact of any financial crisis. This can be achieved through (i) expansion and improved
targeting of households with children not accessing primary schools, and (ii) better coordination
with the education sector at the school level as well as Dinas education offices.
Financial Performance – National Level
Page 10
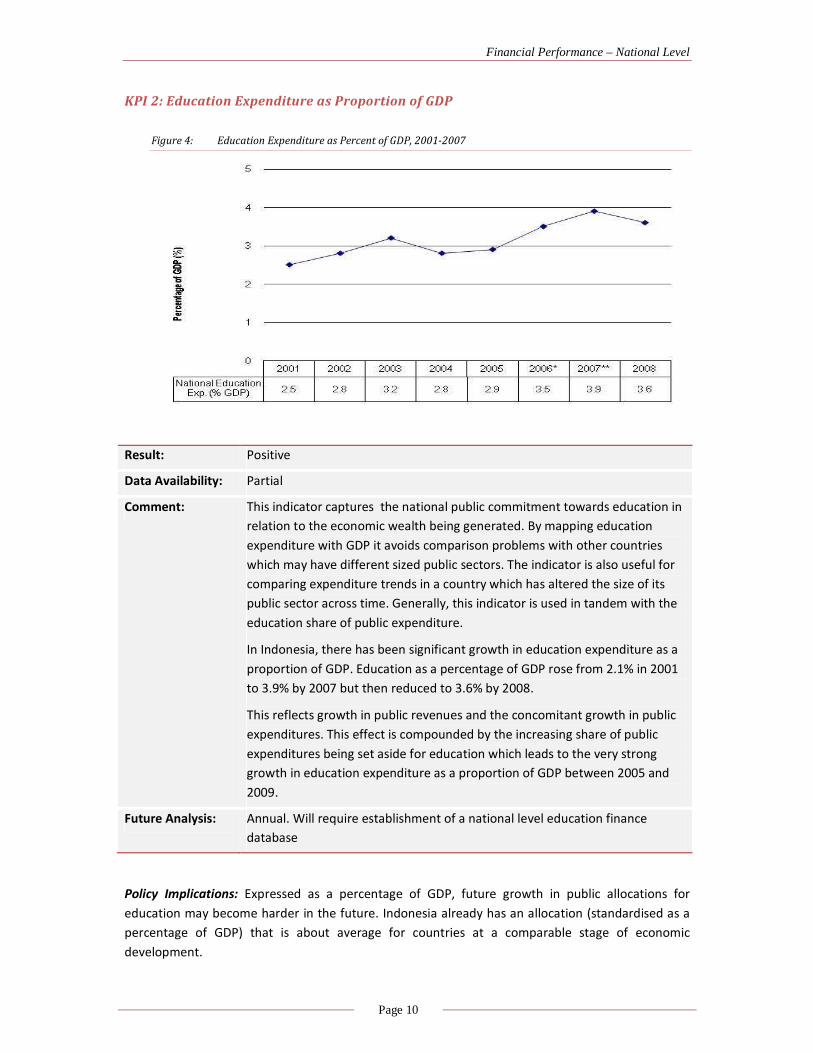
KPI 2: Education Expenditure as Proportion of GDP
Figure 4: Education Expenditure as Percent of GDP, 2001-2007
Policy Implications: Expressed as a percentage of GDP, future growth in public allocations for
education may become harder in the future. Indonesia already has an allocation (standardised as a
percentage of GDP) that is about average for countries at a comparable stage of economic
development.
Result: Positive
Data Availability: Partial
Comment: This indicator captures the national public commitment towards education in
relation to the economic wealth being generated. By mapping education
expenditure with GDP it avoids comparison problems with other countries
which may have different sized public sectors. The indicator is also useful for
comparing expenditure trends in a country which has altered the size of its
public sector across time. Generally, this indicator is used in tandem with the
education share of public expenditure.
In Indonesia, there has been significant growth in education expenditure as a
proportion of GDP. Education as a percentage of GDP rose from 2.1% in 2001
to 3.9% by 2007 but then reduced to 3.6% by 2008.
This reflects growth in public revenues and the concomitant growth in public
expenditures. This effect is compounded by the increasing share of public
expenditures being set aside for education which leads to the very strong
growth in education expenditure as a proportion of GDP between 2005 and
2009.
Future Analysis: Annual. Will require establishment of a national level education finance
database

Financial Performance – National Level
Page 11
Source: World Bank, Investing in Indonesia’s Education, 2007
84%
4%12%
Routine Expenditure: Salaries
Routine Expenditure: Non-salaries
Development Expenditure
KPI 3: Education Non-salary Expenditure as Share of Total Expenditure
Figure 5: Aggregate District Expenditure, 2004
Result: Negative
Data Availability: Limited to 2004 and district level only. Breakdown of data is difficult because
of its composition from three tiers of government. Difficult to separate the
salary component of development expenditures and to separate salary items
from central level expenditures. Based on WB calculation of the salary
composition of routine expenditures, a 96% share of district routine funds has
been allocated for salary items.
Comment: Salary related items as part of routine expenditures consume 84% of
resources. The balance is distributed between non-salary items from routine
expenditures and development expenditures (these include capital and other
investments of a largely non-recurrent nature).
In fact, the salary share will be higher than 84% because a portion of
development expenditures includes salaries. While districts spend the bulk of
the money for education, most of this is tied to salary payments and therefore
not discretionary.
Future Analysis: To be decided. Current data collected at SIKD does not summarise salary and
non-salary dissections of expenditure. Liaison with MONE, MORA, Bappenas
and World Bank staff to see if periodic update is possible.
Policy Implications: The flow of BOS funds directly from the central government to schools increases
the independence of schools from districts as they become even less reliant on the district for
additional discretionary funds. Strengthening the hand of districts is important so that government
can retain a strategic capacity and managerial oversight of school performance.

Financial Performance – National Level
Page 12
Source: World Bank, Investing in Indonesia’s Education, 2007
KPI 4: Expenditure on Basic Education as % of All Education Expenditure &
KPI 5: Expenditure on Non Formal Education as % of All Education Expenditure
Figure 6: Education Expenditure by Sub-Sector, 2004
Result: Positive for Basic Education, Negative for Non Formal Education
Data Availability: Limited to 2004. Breakdown of data is difficult because of its composition
from 3 tiers of government.
Comment: Basic education accounts for approximately 70% of total funding, with nearly
50% for pre-school and primary. Senior secondary will begin to make a
stronger resource claim in future as universalisation policy expands access.
Districts are carrying the bulk of expenditure for basic education and
therefore remain a key site for interventions. The central share is likely to
have increased since 2004 with the introduction of BOS grants that are paid
directly to schools.
Future Analysis: Uncertain. Current data collected at SIKD does not disaggregate between
levels of education expenditure at the district level. Liaison with MONE,
MORA, Bappenas and World Bank staff to see if periodic update is possible.
Policy Implications: Maintaining the share of basic education will be important even as access to
secondary education is expanded. Investment in basic education builds a strong base in literacy and
numeracy and economic development suffers when basic education expenditure is neglected in
favor of investment at higher levels.
NFE expenditure is approximately 1% of total expenditure for education. While a key advantage of
NFE is its cost-effectiveness, increased levels of investment are needed to maximise the possible
economic and social returns.

Financial Performance – District Level
Page 13
III. FINANCIAL PERFORMANCE – DISTRICT LEVEL
A. Overview
This section provides multi-year comparisons of district level expenditures for education spanning
the period 2006-2008. This enables some trend analysis of district level commitment towards
education spending beyond just a one or two year snapshot. The year 2006 is a useful benchmark as
it can serve to identify the nature and extent of education spending at the district level before the
commencement of the BEP expenditures.
The district level analysis has been structured to enable comparisons in district expenditures
between (i) rural and urban districts, (ii) BEP and non-BEP districts, (ii) districts sorted into poverty
quintile rankings, and (iv) eastern and western regions of the country.
The district level financial data presented here has been collected by CSAS directly from the SIKD
section of MoF. The SIKD collects in hard copy format the budget and actual expenditures of all
districts and provinces. CSAS arranged with the Officers of the SIKD section to be given access to the
available SIKD records. In 2008 this process was complicated by the extensive renovations
undertaken of the SIKD offices and the difficulty that posed to accessing the individual paper records
of each district that underpin the database.
District level expenditure patterns are increasingly important as districts have increased
responsibility for education management under decentralisation. Monitoring patterns of
expenditure by districts will become an increasingly important role for MONE and MORA to ensure
that national funding norms and procedures are being implemented appropriately.
The wide range of districts’ poverty status and the importance of education in lifting district
populations out of poverty also mean that vulnerable groups stand to benefit most from well
targeted education investment. Monitoring and evaluation of district level education financing
provides the tools to do so.
The Financial Performance Report 2007 presented district level analysis based on district level data
that was available for 2006 and 2007. This report updates that analysis by refreshing the 2006 data
base with the addition of 82 districts for a total of 345 districts out of 440. It is unlikely that the 2006
dataset will be updated any further because of difficulties the SIKD may have in collecting records
from the outstanding districts.
The financial data for 2008 that underpins this report is limited to 162 districts. This is a major
limitation and reflects the difficulties the SIKD section of MoF has in receiving the budget papers of
all districts on time and in the right format.
The district level data and findings presented in this report for 2008 are provisional because there
are still more than 50% of districts to be included in the analysis. The 2009 Financial Performance
Statement will reflect any data changes and revise the analysis as required.
Financial Performance – District Level
Page 14
B. Trends in District Education Funding
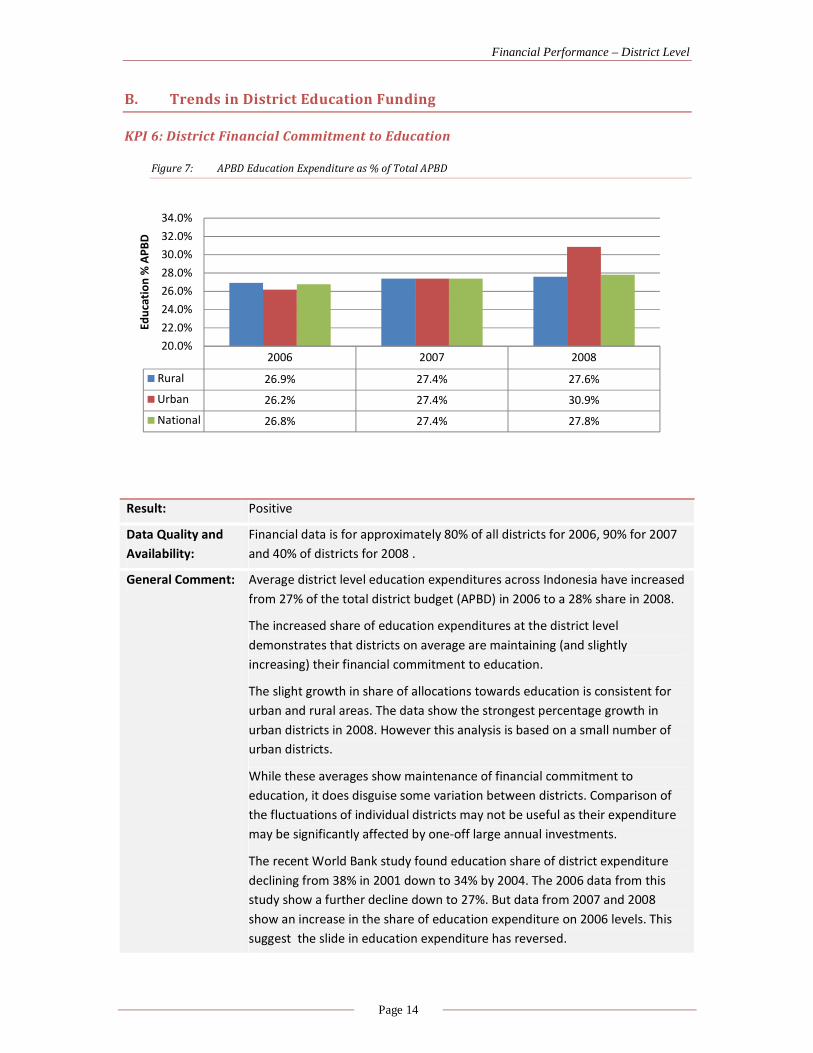
KPI 6: District Financial Commitment to Education
Figure 7: APBD Education Expenditure as % of Total APBD
Result: Positive
Data Quality and
Availability:
Financial data is for approximately 80% of all districts for 2006, 90% for 2007
and 40% of districts for 2008 .
General Comment: Average district level education expenditures across Indonesia have increased
from 27% of the total district budget (APBD) in 2006 to a 28% share in 2008.
The increased share of education expenditures at the district level
demonstrates that districts on average are maintaining (and slightly
increasing) their financial commitment to education.
The slight growth in share of allocations towards education is consistent for
urban and rural areas. The data show the strongest percentage growth in
urban districts in 2008. However this analysis is based on a small number of
urban districts.
While these averages show maintenance of financial commitment to
education, it does disguise some variation between districts. Comparison of
the fluctuations of individual districts may not be useful as their expenditure
may be significantly affected by one-off large annual investments.
The recent World Bank study found education share of district expenditure
declining from 38% in 2001 down to 34% by 2004. The 2006 data from this
study show a further decline down to 27%. But data from 2007 and 2008
show an increase in the share of education expenditure on 2006 levels. This
suggest the slide in education expenditure has reversed.
2006 2007 2008
Rural 26.9% 27.4% 27.6%
Urban 26.2% 27.4% 30.9%
National 26.8% 27.4% 27.8%
20.0%
22.0%
24.0%
26.0%
28.0%
30.0%
32.0%
34.0%
Ed
uca
tio
n %
AP
BD

Financial Performance – District Level
Page 15
BEP Districts: In 2006, BEP districts on average allocated 26% of their APBD for education in
2006 compared to 24% share of other districts. By 2007 BEP districts had
increased their education expenditure to 28% which was below the average of
non-BEP districts (29%) but close to the average expenditure of districts
nationally.
The updated data for 2006 shows that BEP districts’ education share of district
budgets grew by 1% from 2006 to 2007. This is less than the rate of growth in
education share for the non-BEP districts. The education share of APBD
expenditure in non-BEP districts grew by 5% and reached 29% by 2008.
Future Analysis: Update 2008 data once more districts’ data is collected with series to
continue 2009-2010.
Figure 8: APBD Education Expenditure as % of Total APBD in BEP and Non-BEP Supported Districts
Real variation (see chart below) appears in the shares of expenditure for education when comparing
districts by poverty quintile. Data for the three years from 2006-2008 show that middle ranking
districts in terms of poverty (quintiles 3 & 4) on average have the highest share allocation of their
budgets for education.
Schools in the poorest quintile of districts (Quintile 5) are consistently over the three years (2006-
2008) allocating the smallest share of funds to education (between 22% and 24%). For some
districts, this smaller per capita expenditure could be due to a greater proportion of students being
enrolled in private schools in the eastern region of the country. Because private schools do not have
salaries paid by the district level of government (via a transfer of payments from the central budget)
this distorts the district per capita expenditure.
2006 2007 2008
BEP District 26.4% 27.3% 27.5%
Non-BEP Districts 23.9% 26.1% 28.7%
20.0%
22.0%
24.0%
26.0%
28.0%
30.0%
32.0%
34.0%
Ed
uca
tio
n %
AP
BD

Financial Performance – District Level
Page 16
Figure 9: Expenditure as % of Total APBD by Districts according to Poverty Quintile, 2006-2008
Policy Implications:
Districts that have high poverty rates and are persistently allocating a significantly smaller share of
resources for education than the national average are at great disadvantage to the rest of the
country. This disadvantage is likely to be compounded each year as other, more wealthy districts
spend higher amounts on education.
Recommendation:
Undertake a study focused on the poorest districts (poverty quintile 5 districts) to examine why
some of these districts with high poverty rates are allocating significantly smaller share of resources
for education than the national average. Prepare options for a sector response (MoNE and MoRA)
and/or a whole of government response as may be required.
Poverty
Quintile 1
Poverty
Quintile 2
Poverty
Quintile 3
Poverty
Quintile 4
Poverty
Quintile 5
(poorest)
National
2006 23.9% 25.6% 30.0% 29.9% 24.2% 26.8%
2007 26.1% 26.4% 30.1% 31.2% 22.2% 27.4%
2008 28.7% 25.9% 31.3% 28.9% 23.6% 27.8%
20.0%
22.0%
24.0%
26.0%
28.0%
30.0%
32.0%
34.0%
Ed
uca
tio
n %
AP
BD

Financial Performance – District Level
Page 17
KPI 7: Annual Growth in Education Spending for the Poorest Districts
Figure 10: Annual Growth in APBD Education Expenditure, 2006 -2007, Urban and Rural Districts
Result: Uneven
Data Quality and
Availability:
As per KPI 6
General Comment: National average annual growth in education budgets between 2006 and
2007 was approximately 19%.
Rural districts have shown consistent and strong growth measured on a year
to year basis since 2006.
The data for urban districts is very limited for the year 2008, and this maybe
distorting the results for 2007-08 where its shows only 8% growth on the
previous year.
Results show that nationally, financial commitment of district governments
for education grew at a faster rate than their financial commitments to all
other sectors as a whole.
Poverty quintile 4 districts (second most poor) are exceptional in recording
much lower growth in education budgets (14% and 6% for the years 2006-7
and 2007-08 respectively). The slower growth in education expenditure in
these districts may be related to the fact that Quintile 4 districts already have
on average some of the highest shares of education expenditure of all district
quintiles. (see KPI 6).
Other district quintiles may also slow their rate of growth in education
expenditure when they reach this threshold.
BEP Districts: BEP districts showed strong positive commitment to education with 21%
annual growth in education funds in 2006-07 and 16% in 2007-08.
Non-BEP districts displayed even stronger growth in their education
2006-07 2007-08
Rural 23.6% 18.6%
Urban 22.3% 8.2%
0.0%
5.0%
10.0%
15.0%
20.0%
25.0%
30.0%
An
nu
al
Gro
wth
in
Ed
du
cati
on
Exp
en
dit
ure
(%
)

Financial Performance – District Level
Page 18
expenditures and they increased by 23% and 25% respectively for the years
2006-07 and 2007-08. This may indicate some substitution effect occurring in
BEP districts if their average growth in education expenditure is below
national average growth.
Future Analysis: Update 2008 data once collected.
Trend series to continue 2009-10.
Figure 11: BEP and Non-BEP Supported Districts, Annual Growth in APBD Education Expenditure, 2006 -2008
Districts in poverty quintile 4 are lagging behind other quintiles in the growth rate of their education
budget. The poorest districts (quintile 5) have shown stronger growth rate for the period 2007-8.
The strongest consistent growth is found in the middle quintiles (2 and 3) which have recorded
growth rates of 33% and 25% respectively.
Figure 12: Annual Growth in APBD Education Expenditure, 2006 -2008, Districts by Poverty Quintile
2006-07 2007-08
BEP District 21.9% 16.0%
Non-BEP District 22.9% 25.1%
0.0%
5.0%
10.0%
15.0%
20.0%
25.0%
30.0%
An
nu
al
Gro
wth
in E
dd
uca
tio
n
Ex
pe
nd
itu
re (
% )
Poverty
Quintile 1
Poverty
Quintile 2
Poverty
Quintile 3
Poverty
Quintile 4
Poverty
Quintile 5
(poorest)
National
2006-07 29.1% 32.4% 28.3% 14.2% 14.9% 23.4%
2007-08 18.7% 33.8% 24.6% 6.1% 21.7% 19.1%
0.0%
5.0%
10.0%
15.0%
20.0%
25.0%
30.0%
35.0%
40.0%
An
nu
al G
row
th i
n E
dd
uca
tio
n E
xp
en
dit
ure
(% )

Financial Performance – District Level
Page 19
Policy Implications: Growth in year to year education expenditure is strong across the country.
However aggregation can miss much of the important detail at the district level.
At a district level, the analysis will be most useful when it is run over a few years to smooth out the
impact of investment programs.
Recommendation: Maintain special focus on districts with BEP interventions to see if they keep pace
with the average growth rate in education expenditure across all districts and within their poverty
quintile. Special focus from 2009 should be on monitoring to see if districts are including donor funds
and investments within their APBD expenditures.

Financial Performance – District Level
Page 20
KPI 8: Average District Expenditure per Student
Figure 13: Average APBD Education Expenditure per Student, (Rp.)
Result: Positive
Data Quality and
Availability:
Data for 2008 is limited and analysis to be refreshed in 2009 report.
General Comment: There has been strong national growth in the average expenditure per
student across the country over the three years.
Strongest growth is observed in the urban districts, but this urban data is
based on a small number of returns and will need to be refreshed in the 2009
report.
The highest average per student allocations are found in the poorest districts
(quintile 5) where in 2008 they average more than Rp. 2 million per student.
This compares with an average district allocation of Rp. 1.9 million in the
richest districts.
Districts in the Eastern region of the country allocate (on average) an
additional Rp. 1 million more per student than Western region districts.
The per student allocation is greatly affected by the sparsity of population.
Therefore more sparsely populated districts (such as those in the eastern
region and many of those in the poorest quintile districts) have higher average
salary costs. This is because of lower student/teacher ratios and higher salary
related costs associated with remote area allowances.
BEP Districts: BEP districts have a higher than national average per student allocation across
all three years. The higher expenditure of BEP districts is related to the fact
that 90% of BEP districts are located in the Eastern region of the country. Unit
costs are higher in the eastern region due to sparsity factors.
Future Analysis: Update 2008 data once collected.
Trend series to continue 2009-10
2006 2007 2008
Rural 1,256,070 1,614,764 1,827,768
Urban 1,413,733 1,662,298 2,530,042
National 1,282,804 1,623,235 1,867,561
-
500,000
1,000,000
1,500,000
2,000,000
2,500,000
3,000,000
Ru
pia
h p
er
stu
de
nt

Financial Performance – District Level
Page 21
Figure 14: Average APBD Education Expenditure per Student (Rp), BEP and Non-BEP Districts
Poverty quintile analysis shows a significant gap between the average expenditures of districts in
poverty quintile 3 and the other districts. Particularly strong growth in district budget per student
allocations is observed in the richest districts and the poorest districts (quintiles 1 and 3
respectively). Districts in the poorest quintile have the highest average expenditures per student in
two out of three years.
Figure 15: Average APBD Education Expenditure per Student (Rp), by Poverty Quintile Districts
Districts in the eastern region of the country have significantly higher costs per student than districts
in the western region. To a certain extent these differences may be explained by the lower density of
populations in these districts. This has an impact on the unit cost of salaries (through the cost of
allowances related to isolation) and the lower student/teacher ratio that drives up the per student
unit cost of teacher salaries.
2006 2007 2008
BEP districts 1,355,024 1,681,106 1,963,746
Non-BEP Districts 1,256,773 1,603,836 1,826,882
-
500,000
1,000,000
1,500,000
2,000,000
2,500,000
Ru
pia
h p
er
stu
de
nt
Poverty
Quintile 1
Poverty
Quintile 2
Poverty
Quintile 3
Poverty
Quintile 4
Poverty
Quintile 5
(poorest)
2006 1,301,655 1,370,368 1,123,036 1,321,228 1,417,981
2007 1,562,977 1,847,734 1,490,952 1,601,748 1,761,787
2008 1,918,861 2,081,934 1,627,543 1,854,500 2,106,530
-
500,000
1,000,000
1,500,000
2,000,000
2,500,000
Ru
pia
h p
er
stu
de
nt

Financial Performance – District Level
Page 22
Figure 16: Average APBD Education Expenditure per Student (Rp), by region
Policy Implications: Unit cost calculations are greatly affected by the sparsity of populations and
care needs to be taken when comparing districts. Care should be taken to compare like with like
districts in order to get a true feel for the district government commitment and possible impact on
quality.
The data show that the poorest districts need to spend (and actually do spend) more than the other
districts to provide their educational services. Much of this expenditure is through the payment of
salaries that is channeled through the DAU by the central government. Additional expenditure does
not indicate additional discretionary funds at the school level.
2006 2007 2008
Eastern Region 1,673,509 2,157,386 2,588,472
Western Region 1,157,733 1,463,035 1,545,721
-
500,000
1,000,000
1,500,000
2,000,000
2,500,000
3,000,000
Ru
pia
h p
er
stu
de
nt

Financial Performance – District Level
Page 23
KPI 9: Actual district education expenditure as % of planned education expenditure
Figure 17: Realised Education Expenditure as % of Planned Expenditure 2006
Result: Negative
Data Quality and
Availability:
Data covers approximately 80% of districts
General Comment: Districts are not managing to spend their budgeted education expenditure for
the year. In 2006, rural districts performed better and spent nearly 97% of
their budget but urban districts managed to spend 96% of their budget.
Nationally, this under-expenditure means that the average district is failing to
spend Rp. 5.9 billion in budget allocated education funds. This translates to a
cumulative national under-expenditure of Rp. 2 trillion. This is money that was
budgeted for education at APBD level, but not spent.
BEP Districts: BEP districts under-spent their budget at an average of Rp 88,000 per student
compared to a national average under-spend of Rp. 58,000.
The average BEP district only spent 93.5% of their budget compared to 95.5%
nationally.
The average BEP district had an amount of Rp. 6.8 billion that remained
unspent from their dedicated education allocation of their APBD. compared to
a national average of Rp. 5.9 billion.
A cumulative under-expenditure of Rp 822 billion in 2006 on the education
related APBD.
Rural districts Urban districtsAll Districts
Average
Realised Education Expenditure
as % of Planned Expenditure
2006
96.6% 90.8% 95.5%
87.0%
88.0%
89.0%
90.0%
91.0%
92.0%
93.0%
94.0%
95.0%
96.0%
97.0%
98.0%

Financial Performance – District Level
Page 24
Future Analysis: Update 2008 data once collected.
Trend series to continue with realized budget data for 2007 to be collected
Figure 18: Realised Education Expenditure as % of Planned Expenditure 2006, BEP and Non-BEP districts
As a consequence of not spending 6.5% of their budgeted education allocation in 2006, BEP districts
under-spent on average Rp. 88,000 per student. This was more than the Rp. 47,000 per student
under-spent by the non-BEP districts.
Figure 19: Average Per Student Gap between Plan and Actual District Education Expenditure 2006 (Rp.)
BEP districts in 2006 had Rp. 822 billion in budgeted education funds that remained unspent, while
other districts accumulated Rp, 1,217 billion of unspent education money.
BEP Districts Non-BEP DistrictsAll Districts
Average
Realised Education Expenditure
as % of Planned Expenditure
2006
93.5% 96.3% 95.5%
92.0%
92.5%
93.0%
93.5%
94.0%
94.5%
95.0%
95.5%
96.0%
96.5%
BEP
Districts
Non-BEP
Districts
All
Districts
Average
Per Student Gap between District
Plan and Actual Edu. Expenditure
2006"
87,760 46,805 57,656
-10,000 20,000 30,000 40,000 50,000 60,000 70,000 80,000 90,000
100,000

Financial Performance – District Level
Page 25
Figure 20: CumulativeGap -Planned Budget and Actual District Education Expenditure 2006 (Rp. Billion)
Poverty quintile analysis shows that the poorest and richest districts spent the lowest portion of
their allocated education expenditures in 2006. Only districts in poverty quintile 3 managed to reach
their expenditure allocation.
Figure 21: Realised Education Expenditure as % of Planned Expenditure 2006, by Poverty Quintile
The poorest and richest districts managed to not spend more than Rp. 100,000 of budgeted
education funds per enrolled student in 2006. This is from a total district education budget of Rp. 1.4
million and 1.3 million for the poorest and richest districts respectively.
BEP
Districts
Non-
BEP
Districts
All
Districts
Average
Cumulative Gap between District
Plan and Actual Edu. Expenditure
2006"
822 1,217 2,039
-
500
1,000
1,500
2,000
2,500
Poverty
Quintile 1
Poverty
Quintile 2
Poverty
Quintile 3
Poverty
Quintile 4
Poverty
Quintile 5
(poorest)
National
Realised Education Expenditure
as % of Planned Expenditure
2006
91.5% 95.2% 100.4% 96.9% 91.6% 95.5%
86.0%
88.0%
90.0%
92.0%
94.0%
96.0%
98.0%
100.0%
102.0%

Financial Performance – District Level
Page 26
Figure 22: Average Per Student Gap between Plan and Actual District Education Expenditure 2006 (Rp.)
Policy Implications: Too many districts may be failing to expend their allocated annual education
budgets. The difficulty of the poorest districts in expending their budgets is of a particular concern
given the access and quality problems in these districts. The quantum of funds may not be the
greatest problem facing some districts, and/or there maybe other problems related to disbursement
restrictions and reporting or planning requirements.
Recommendation: A study and policy dialogue with Dinas education offices is required to determine
reasons for the under-expenditure of annual education budgets. The study should propose options
for improving the uptake of funds that can promote their efficient and effective use for education
purposes at the district level.
Poverty
Quintile
1
Poverty
Quintile
2
Poverty
Quintile
3
Poverty
Quintile
4
Poverty
Quintile
5
(poorest)
National
Per Student Gap between
District Plan and Actual Edu.
Expenditure 2006"
110,072 65,898 -4,820 41,179 119,358 57,656
-20,000
-
20,000
40,000
60,000
80,000
100,000
120,000
140,000

Financial Performance – District Level
Page 27
SPI 1: Growth Ratio of Education Spending
Figure 23: Annual Education Expenditure Growth Ratio, Urban and Rural districts( 2006-2007, 2007-08)
2006-07 2007-08
Rural 1.10 1.05
National 1.13 1.10
Urban 1.32 2.09
0.00
0.50
1.00
1.50
2.00
Meaning of
the Indicator:
This indicator expresses the annual growth in education expenditure as a ratio to the
annual growth of the district budget. The higher the ratio, the greater financial
commitment shown by the district in distributing funds to education.
A score greater than 1 means the education budget is growing at a faster rate than the
district budget as whole. A score less than one means it is growing at a slower rate than
the total district budget.
Result: Positive
Data Quality: As per KPI 6
General
Comment:
On average, education expenditure at the district level grew faster than aggregate
spending in both rural and urban districts across Indonesia.
Updated data for 2006 has altered the findings found in the previous report. Urban areas
on average had a faster rate of growth in 2006-07 (1.3) compared to 1.1 growth ratio in
rural districts.
The growth ratio for 2007-08 is slowing in rural districts. Initial data for urban districts
shows a very strong growth ratio (2.1) but this is likely to be an overstatement due to the
small number of districts processed for analysis at report publication.
A very positive result demonstrating that districts are prioritising education expenditure.
BEP Districts: Education expenditure for the period 2006-07 at the district level in BEP districts grew
1.2 times faster than aggregate district public expenditures. For the period 2007-08 this
had slowed to 1.05 times compared with non-BEP districts which remained stable at
around 1.1 times growth rate.
This is still a positive result and demonstrates that BEP districts continue to grow
education expenditure at a faster rate than general public expenditure.
Future
Analysis:
Update 2008 data once collected and trend series to continue 2009-10
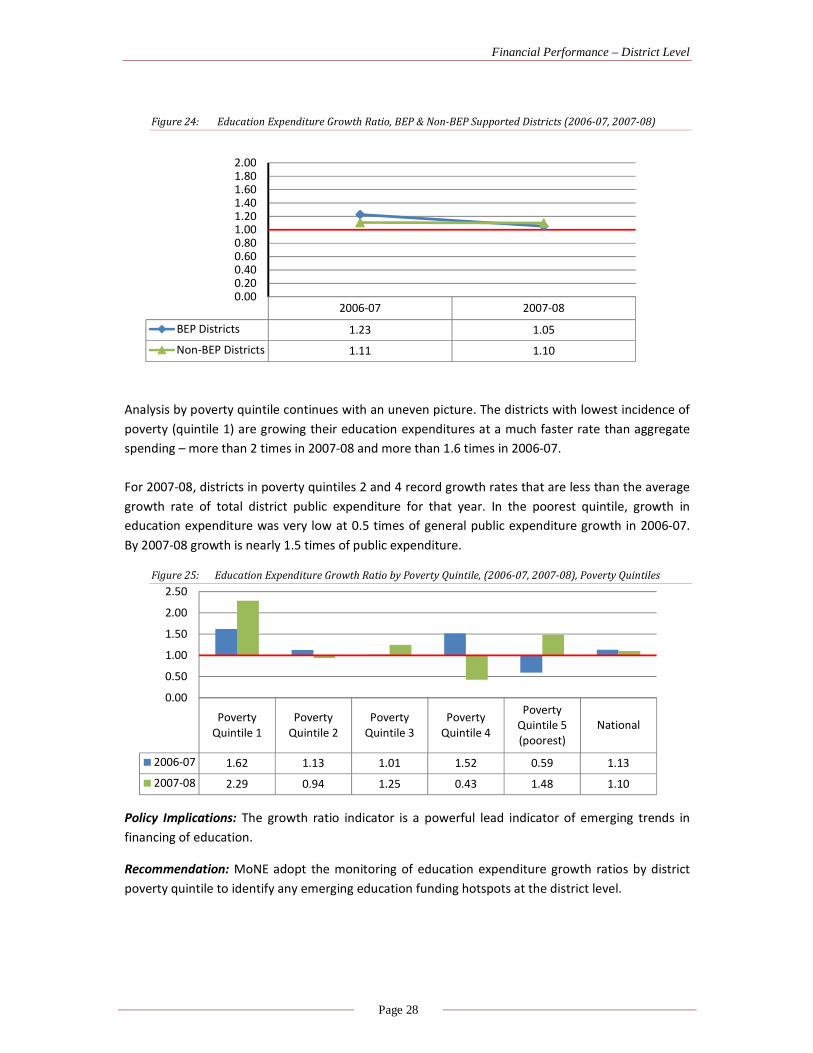
Financial Performance – District Level
Page 28
Figure 24: Education Expenditure Growth Ratio, BEP & Non-BEP Supported Districts (2006-07, 2007-08)
Analysis by poverty quintile continues with an uneven picture. The districts with lowest incidence of
poverty (quintile 1) are growing their education expenditures at a much faster rate than aggregate
spending – more than 2 times in 2007-08 and more than 1.6 times in 2006-07.
For 2007-08, districts in poverty quintiles 2 and 4 record growth rates that are less than the average
growth rate of total district public expenditure for that year. In the poorest quintile, growth in
education expenditure was very low at 0.5 times of general public expenditure growth in 2006-07.
By 2007-08 growth is nearly 1.5 times of public expenditure.
Figure 25: Education Expenditure Growth Ratio by Poverty Quintile, (2006-07, 2007-08), Poverty Quintiles
Policy Implications: The growth ratio indicator is a powerful lead indicator of emerging trends in
financing of education.
Recommendation: MoNE adopt the monitoring of education expenditure growth ratios by district
poverty quintile to identify any emerging education funding hotspots at the district level.
2006-07 2007-08
BEP Districts 1.23 1.05
Non-BEP Districts 1.11 1.10
0.000.200.400.600.801.001.201.401.601.802.00
Poverty
Quintile 1
Poverty
Quintile 2
Poverty
Quintile 3
Poverty
Quintile 4
Poverty
Quintile 5
(poorest)
National
2006-07 1.62 1.13 1.01 1.52 0.59 1.13
2007-08 2.29 0.94 1.25 0.43 1.48 1.10
0.00
0.50
1.00
1.50
2.00
2.50

Financial Performance – District Level
Page 29
SPI 2: Discretionary School Expenditure as Percentage of Total Education Expenditure
Figure 26: BOS Grants as % of Education & Culture Budget 2006-2008
Meaning of the
Indicator:
Discretionary expenditure is a key variable at the school level to enable
schools to provide materials for classrooms and other activities.
Result: Neutral
Data Quality: BOS grants are used as a proxy variable for discretionary expenditure. The
BOS funds are distributed directly to schools from the central government via
MoNE. Schools will also collect other funds from parents and/or the district
level of government. These other amounts are not reported on at a national
level. The BOS grants indicate the average minimum discretionary funds
available to schools.
Analysis for this report has calculated BOS grants distributed by the districts to
public schools. It does not include BOS grants distributed by MoRA to
madrasah in the district. The previous report calculated the value of BOS
grants distributed by the central government through MoRA and the district
to all schools/madrasah.
2006 2007 2008
Rural 13.3% 12.4% 10.6%
Urban 9.3% 10.6% 6.9%
National 12.5% 12.0% 10.3%
0.0%
2.0%
4.0%
6.0%
8.0%
10.0%
12.0%
14.0%
16.0%
18.0%
20.0%

Financial Performance – District Level
Page 30
General Comment: The BOS grants distributed by districts provide a key source of discretionary
funds available to schools under their own management. They have injected a
dramatic new dimension to school resourcing. Direct payment to schools
minimises the opportunities for leakage before the funds reach the school.
BOS grants offer great potential for funding innovative and securely resourced
interventions at schools that have an ongoing recurrent funding base. This
allows school principals to plan around these allocations instead of pursuing
submission based models of grants.
The national analysis shows BOS has annually contributed funds directly to
public schools which approximate 10% - 12% of total district level education
expenditure for public schools.
The significance of BOS expenditures as a proportion of total district level
expenditure has declined from 12% in 2006 down to 10% in 2008. This reflects
the increasing expenditures of the district level of government for the
education sector.
BEP Districts: BOS grants in BEP districts have reduced from a 15% share of total funds for
education in 2006 down to 11% in 2008. This compares with a reduction in
other districts from 11% to 10%. The higher significance in BEP districts is due
to the lower average per capita expenditure in BEP districts.
Future Analysis: Update 2008 data once collected and trend series to continue 2009-10.
Figure 1: BOS Grants as % of Education & Culture Budget 2006-2008, BEP and Non-BEP Districts
BOS grants as a percentage of total education expenditure are affected by the share of students
progressing to secondary education. The per capita BOS grants for junior secondary students are
35% higher in value than grants for primary students. Districts with higher proportionate enrolment
at secondary level have an increased proportionate weight in their BOS grants. As a consequence,
2006 2007 2008
BEP Districts 14.5% 12.5% 11.2%
Non-BEP Districts 11.4% 11.8% 9.6%
National 12.5% 12.0% 10.3%
0.0%
2.0%
4.0%
6.0%
8.0%
10.0%
12.0%
14.0%
16.0%
18.0%
20.0%

Financial Performance – District Level
Page 31
inter-poverty quintile comparisons are not accurate as they are distorted by secondary level
transition rates.
The poverty quintile analysis shows BOS grants stand at 9% or more of total public expenditures for
education across all district poverty quintiles. However, the significance of the BOS expenditures in
comparison with total district expenditures is declining for districts across all poverty quintiles. This
reflects the expanding outlays for education being made by the district levels of government during
this period.
Figure 2: BOS Grants as % of Education & Culture Budget 2006, by Poverty Quintile
Policy Implications: BOS grants provide a critical injection of funds at the school level. It is important
that these funds are utilised as effectively as possible. Their importance is even greater in BEP
districts where they stand as a greater than average proportion of total funds available to education.
Planning and management of BOS funds should be a key planning priority for schools in BEP districts.
Capacity building activities for principals and socialisation amongst parents are two obvious
intervention points.
Recommendation: The mechanism for distributing BOS grants to schools be reviewed and adjusted
as required to provide a stronger role for district participation in the planning and monitoring BOS
expenditures.
Poverty Quintile
1
Poverty Quintile
2
Poverty Quintile
3
Poverty Quintile
4
Poverty Quintile
5
(poorest)
2006 11.2% 10.9% 17.6% 11.7% 10.9%
2007 11.7% 10.9% 14.1% 13.1% 10.4%
2008 8.6% 9.1% 11.8% 12.1% 9.3%
0.0%2.0%4.0%6.0%8.0%
10.0%12.0%14.0%16.0%18.0%20.0%
Special Discussion Theme - District Financial Reporting in Education: Analysis of Reporting Effectiveness
Page 32
IV. SPECIAL DISCUSSION THEME - DISTRICT FINANCIAL REPORTING IN
EDUCATION: ANALYSIS OF REPORTING EFFECTIVENESS2
It is widely recognized that the district level financial reporting system is governed by a large number
of overlapping and, sometimes conflicting rules and regulations. This reflects a systemic problem in
which Education, as one of the “obligatory functions”3 decentralized to the district level, is subject
not only to the regional autonomy and regional finance laws but also to the national financial system
and the national planning system laws. While this characteristic is shared with the other
decentralized sectors, education has the unusual feature that it is also governed by its own national
education system law.
This report analyses district level governance in education, how it came to be in its current form and
the financial reporting system for education that is the result. The report provides a background and
overview of planning and budgeting at the district level in Indonesia, and reviews the usefulness and
effectiveness of the key financial reports required from district level education offices.
Key Findings: Central Level Relationship with District Reporting
1. Under the national financial system law and the national planning system law, plans and budgets
are integrated into one system. The financial reporting system is based on budgets, which in turn
are based on targets in plans. Annual budgets are notionally “performance based” as they
contain annual targets, however the link to longer term (5 year) plans and goals is weak.
Financial reports contain information on achievement of activity “targets” and “indicators” while
performance reports contain comparisons of budget allocation and actual expenditure for the
activities.
2. District education offices are required to report on all sources of funding, including:
• funding from the district’s own budget (APBD);
• funding from the central budget (APBN) to the district budget (APBD), earmarked for national
priority activities implemented in the district (DAK);
• funding from central MONE direct to the district education service (block grants);
• funding from central MONE channelled through the provincial governor (deconcentration
funding)
• special per capita subsidies to schools for operational assistance (BOS) and purchase of
textbooks to be loaned to students (BOS for Books);
• international donor funding assistance (projects).
2 This section reproduces the executive summary of the report district financial reporting in education released by csas in
2009 and authored by dr. Winifred wirkus. A full copy of the report can be obtained from CSAS.
3 For ease of reading, quotation marks “ … ” are used to mark Indonesian technical terms.
Special Discussion Theme - District Financial Reporting in Education: Analysis of Reporting Effectiveness
Page 33
It should be noted that each individual activity funded through block grants or deconcentration
requires it own separate reports.
3. District education offices are also required to prepare the data and analysis of education
activities, including financial data and analysis, for inclusion in the reports which district
government (office of the head of district) is required to submit to the district legislative
assembly (DPRP) and the central ministries which have responsibility for the various aspects of
regional autonomy, e.g. Ministry of Home Affairs (MOHA), National Planning Agency (Bappenas)
and Ministry of Finance (MOF).
4. MONE central office has very detailed guidelines and handbooks for activities funded from the
MONE budget, including instructions for reporting. MONE also tracks compliance by districts
with reporting requirements. The MONE central office analyses the reports and the results are
used to plan activities and funding for the subsequent fiscal year.
5. In contrast the other central ministries interviewed provided only tables of contents (or lists of
data required) for reports. They did not appear to have adequate mechanisms for tracking
reporting compliance. There was little indication that the reports were even read – not to
mention analysed or used for information inputs for the ministry.
6. Although most reports are copied to multiple central (and provincial) agencies, when a central
agency needs data, it sends an additional, separate data collection instrument to the districts.
7. There do not appear to be systems for verifying accuracy of data reported or for checking
consistency of data across reports.
Key Findings: District Reporting
Actual system of financial reporting. Under the national financial system law and the national
planning system law, plans and budgets are integrated into one system. The financial reporting
system is based on budgets, which in turn are based on targets in plans. Annual budgets are
notionally “performance based” as they contain annual targets, however the link to longer term (5
year) plans and goals is weak. In part, this weakness is caused by an increasing tendency on the part
of MOHA to regulate not only the format but also the content and priorities of the districts’ annual
work plans – and thus district activities, targets and budgets. Financial reports contain information
on achievement of activity “targets” and “indicators” while performance reports contain
comparisons of budget allocation and actual expenditure for the activities.
District education offices are required to report on all sources of funding for their own activities,
including district budget funds, funds originating from the central MONE budget (DAK, block grants
and deconcentration) as well as international donor assistance projects. Districts appear to be
fulfilling these requirements, albeit with substantial delays and inadequate quality control for
accuracy of source data and report content.
Activities implemented by other stakeholders within the district, such as schools, principals,
teachers, students and school linked organizations (school committees) are not the responsibility of
the district education office even though these activities have significant impacts on the education
sector in the district. All recipients of funding are required to send copies of the financial reports
Special Discussion Theme - District Financial Reporting in Education: Analysis of Reporting Effectiveness
Page 34
which they submit to their funding sources to the district education office as well. The district
education office is then supposed to summarize the reports. As in the case of the financial reports
for district education offices’ own activities, these summaries are being produced but subject to
delay and serious questions about their accuracy. Fragmentation of responsibility for supervision of
stakeholder activities within the district education office structure contributes to these problems.
District education offices are also required to prepare the data and analysis of education activities,
including financial data and analysis, for inclusion in the reports which district government (office of
the head of district) is required to submit to the district legislative assembly and the central
ministries which have responsibility for the various aspects of regional autonomy, e.g. MOHA,
Bappenas and MOF. Again, the information is being furnished but there is little or no quality control
on the accuracy of the data or analysis.
The usefulness of financial reports. The financial reports for accounting purposes are somewhat
useful for district budget management and control but not very useful for evaluation and district
planning purposes. In part this is related to the lack of quality control for data and the resulting
inaccuracy as well as inconsistency among different data sources and reports.
Similarly district financial reports are very useful to central MONE for management and control of its
own budget and somewhat useful for evaluation, policy making and management of the education
sector nationally.
The efficiency of financial reports. Although the district survey reported low levels of resources
required to produce reports, there are indications that these are serious underestimates of the
actual resources used. Qualitative information suggests that there are serious inefficiencies in the
production of district financial reports.
Organizational inefficiencies are basically issues of systems and procedures for obtaining the
required data on time, assuring the accuracy of the data and generating the reports. Leadership and
management attitudes contribute to these problems.
Technical inefficiencies arise because the already available computers and on line resources are not
being used effectively. In part, this is an issue of appropriate software but effective organization
(systems and procedures) is also lacking. Capacity building and system reorganization to reduce
these inefficiencies would be expensive and, until there is a strong managerial demand for useful
reports, perhaps not cost effective.
Recommendations
Improving the effectiveness and efficiency of reporting
District financial planning and reporting requirements are mandated by central laws and regulations
and it is therefore unrealistic to recommend changes in these requirements. However the
operational systems to fulfil these legal requirements are designed and operated by the districts
themselves.
Recommendation 1 - District education offices should therefore design their systems to suit the
information requirements for district planning and operations needs as well as MoNE planning,

Special Discussion Theme - District Financial Reporting in Education: Analysis of Reporting Effectiveness
Page 35
coordinating and monitoring functions. The following steps could be undertaken in the re-design of
systems.
Step 1 - A management audit to identify the reporting requirements, required data sources,
schedule of reports, etc. over the entire district education office. This audit would focus also on
overlaps in reporting and data requirements. It would also differentiate between data which is
necessary for reporting and which is “interesting” to know and collect.
Step 2 - Systems and procedures to be designed for quality – and deadline – control management of
the data supply chain. Internal cross checking mechanisms would be built into the data supply chain
management system to ensure internal and external consistency of reports. Without timely,
accurate, consistent data guaranteed, sophisticated report production mechanisms are useless.
Reporting and data collection formats which are pre printed with previous data and require the
submitter only to note changes would increase accuracy, reduce cost and contribute to achieving
deadlines.
Recommendation 2 - Enforce compliance with the legal requirement that all education budget users
in the district send copies of their financial reports to the district education office. This would go a
long way towards making the district’s own reporting more useful. Districts could start by recording
all proposals for block grants and deconcentration and using this list to track compliance with
reporting.
Recommendation 3 - Off the shelf software be used to create data storage systems. These systems
would be designed to communicate with one another, in order to reduce overlap in data collection
and improve consistency. The systems would also be designed to track compliance with data
collection deadlines and to verify validity of data submitted. Dummy tables for routine reports would
be included so that the reports could be produced “at the touch of a button”. The system would also
be flexible enough to produce non routine, ad hoc reports, perhaps with the assistance of an on call
consultant.
Improving the effectiveness and efficiency of reports.
The issues of accuracy and verification are, at heart, economic issues. In theory, it may be possible to
guarantee accurate data, but the cost would be prohibitive. An optimizing approach to this issue
would suggest that the current “equilibrium” condition represents the best obtainable balance
between data which is accurate “enough” without transferring excessive resources from educational
activities to “verification” as has been the tendency of many monitoring and evaluation activities.
The key to successful interventions is not to transfer more resources to reporting but to remove the
sources of inefficiency in the reporting system itself.
Some of the problems with lack of usefulness and inefficiency of the current district reporting
system must be laid at the door of previous donor assisted projects. Almost all projects at the district
level emphasize the production of medium term (5 year, strategic) district education development
plans. Monitoring implementation and achievement of the plans is nominally part of the task, but
the real focus of consultant efforts is on producing the plans themselves. Given the relatively high

Special Discussion Theme - District Financial Reporting in Education: Analysis of Reporting Effectiveness
Page 36
staff turnover rates and the fact that these plans are drawn up only once in five years, there is little
institutional memory created by this type of activity and, thus, the capacity built is not sustainable.
Recommendation 4 – Focus district education management capacity building on the link between
the strategic plan and the annual work plans.
This technical assistance would be much more difficult and complicated because the annual budget
cycle is well established in district offices and runs on a very tight schedule, reducing the availability
of entry points for external assistance. However it is precisely the annual budget cycle which would
present opportunities for reorganizing the reporting implementation framework and the
management of the data supply chain.
Even just the first step of the previous recommendation, a management audit focused on reporting
and covering the entire district education office, might identify small but significant changes which
could improve effectiveness and efficiency of reports.
With better reports, the vicious cycle of bad reports reducing the demand for reports, could be
incrementally breached, creating the environment in which the next steps could be demanded.
Eventually, better information and more useful reports could contribute to improved processes for
ensuring sustained increases in central and district education budget allocations as well as
information to assist greater complementarity and reduced substitution of GoI, parental and donor
education financing, including the balance between central and district financing.
Recommendation on the LAKIP
Although the LAKIP was an important innovation at the time it was instituted (1999) its role in
promoting accountability has been overtaken by the new national financial system (2003). Reporting
on performance by government agencies is now incorporated into both the national planning system
(2004) and the revised regional autonomy (2004). This redundancy has been noted by the Agency for
State Administration (Lembaga Administrasi Negara/LAN) and is reflected in its proposal to integrate
finance, planning and regional autonomy into one overall “accountability and performance system”
(Sistem Akuntabilitas Kinerja Instansi Pemerintah/SAKIP).
Recommendation 5 - Recognising the overlap between reporting requirements and the
Government’s desire to streamline the performance system it appears timely now to consider
eliminating the annual accountability and performance reports (LAKIP).
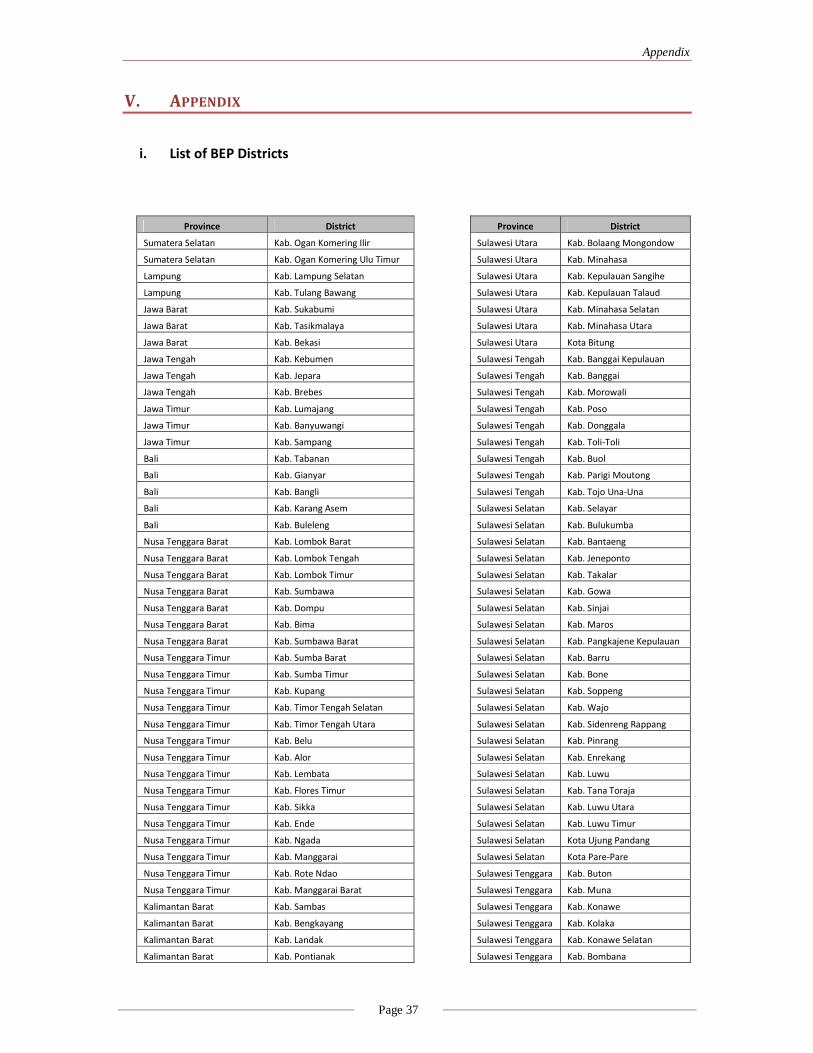
Appendix
Page 37
V. APPENDIX
i. List of BEP Districts
Province District Province District
Sumatera Selatan Kab. Ogan Komering Ilir Sulawesi Utara Kab. Bolaang Mongondow
Sumatera Selatan Kab. Ogan Komering Ulu Timur Sulawesi Utara Kab. Minahasa
Lampung Kab. Lampung Selatan Sulawesi Utara Kab. Kepulauan Sangihe
Lampung Kab. Tulang Bawang Sulawesi Utara Kab. Kepulauan Talaud
Jawa Barat Kab. Sukabumi Sulawesi Utara Kab. Minahasa Selatan
Jawa Barat Kab. Tasikmalaya Sulawesi Utara Kab. Minahasa Utara
Jawa Barat Kab. Bekasi Sulawesi Utara Kota Bitung
Jawa Tengah Kab. Kebumen Sulawesi Tengah Kab. Banggai Kepulauan
Jawa Tengah Kab. Jepara Sulawesi Tengah Kab. Banggai
Jawa Tengah Kab. Brebes Sulawesi Tengah Kab. Morowali
Jawa Timur Kab. Lumajang Sulawesi Tengah Kab. Poso
Jawa Timur Kab. Banyuwangi Sulawesi Tengah Kab. Donggala
Jawa Timur Kab. Sampang Sulawesi Tengah Kab. Toli-Toli
Bali Kab. Tabanan Sulawesi Tengah Kab. Buol
Bali Kab. Gianyar Sulawesi Tengah Kab. Parigi Moutong
Bali Kab. Bangli Sulawesi Tengah Kab. Tojo Una-Una
Bali Kab. Karang Asem Sulawesi Selatan Kab. Selayar
Bali Kab. Buleleng Sulawesi Selatan Kab. Bulukumba
Nusa Tenggara Barat Kab. Lombok Barat Sulawesi Selatan Kab. Bantaeng
Nusa Tenggara Barat Kab. Lombok Tengah Sulawesi Selatan Kab. Jeneponto
Nusa Tenggara Barat Kab. Lombok Timur Sulawesi Selatan Kab. Takalar
Nusa Tenggara Barat Kab. Sumbawa Sulawesi Selatan Kab. Gowa
Nusa Tenggara Barat Kab. Dompu Sulawesi Selatan Kab. Sinjai
Nusa Tenggara Barat Kab. Bima Sulawesi Selatan Kab. Maros
Nusa Tenggara Barat Kab. Sumbawa Barat Sulawesi Selatan Kab. Pangkajene Kepulauan
Nusa Tenggara Timur Kab. Sumba Barat Sulawesi Selatan Kab. Barru
Nusa Tenggara Timur Kab. Sumba Timur Sulawesi Selatan Kab. Bone
Nusa Tenggara Timur Kab. Kupang Sulawesi Selatan Kab. Soppeng
Nusa Tenggara Timur Kab. Timor Tengah Selatan Sulawesi Selatan Kab. Wajo
Nusa Tenggara Timur Kab. Timor Tengah Utara Sulawesi Selatan Kab. Sidenreng Rappang
Nusa Tenggara Timur Kab. Belu Sulawesi Selatan Kab. Pinrang
Nusa Tenggara Timur Kab. Alor Sulawesi Selatan Kab. Enrekang
Nusa Tenggara Timur Kab. Lembata Sulawesi Selatan Kab. Luwu
Nusa Tenggara Timur Kab. Flores Timur Sulawesi Selatan Kab. Tana Toraja
Nusa Tenggara Timur Kab. Sikka Sulawesi Selatan Kab. Luwu Utara
Nusa Tenggara Timur Kab. Ende Sulawesi Selatan Kab. Luwu Timur
Nusa Tenggara Timur Kab. Ngada Sulawesi Selatan Kota Ujung Pandang
Nusa Tenggara Timur Kab. Manggarai Sulawesi Selatan Kota Pare-Pare
Nusa Tenggara Timur Kab. Rote Ndao Sulawesi Tenggara Kab. Buton
Nusa Tenggara Timur Kab. Manggarai Barat Sulawesi Tenggara Kab. Muna
Kalimantan Barat Kab. Sambas Sulawesi Tenggara Kab. Konawe
Kalimantan Barat Kab. Bengkayang Sulawesi Tenggara Kab. Kolaka
Kalimantan Barat Kab. Landak Sulawesi Tenggara Kab. Konawe Selatan
Kalimantan Barat Kab. Pontianak Sulawesi Tenggara Kab. Bombana

Appendix
Page 38
Kalimantan Barat Kab. Sanggau Sulawesi Tenggara Kab. Wakatobi
Kalimantan Barat Kab. Ketapang Sulawesi Tenggara Kab. Kolaka Utara
Kalimantan Barat Kab. Sintang Sulawesi Tenggara Kota Kendari
Province District Province District
Kalimantan Barat Kab. Kapuas Hulu Gorontalo Kab. Boalemo
Kalimantan Barat Kab. Sekadau Gorontalo Kab. Gorontalo
Kalimantan Barat Kab. Melawi Gorontalo Kab. Pohuwato
Kalimantan Tengah Kab. Kotawaringin Timur Gorontalo Kab. Bone Bolango
Kalimantan Tengah Kab. Barito Selatan Gorontalo Kab. Gorontalo Utara
Kalimantan Tengah Kab. Barito Utara Sulawesi Barat Kab. Majene
Kalimantan Tengah Kab. Sukamara Sulawesi Barat Kab. Polewali Mandar
Kalimantan Tengah Kab. Lamandau Sulawesi Barat Kab. Mamasa
Kalimantan Tengah Kab. Seruyan Sulawesi Barat Kab. Mamuju
Kalimantan Tengah Kab. Katingan Maluku Kab. Maluku Tenggara Barat
Kalimantan Tengah Kab. Pulang Pisau Maluku Kab. Maluku Tenggara
Kalimantan Tengah Kab. Gunung Mas Maluku Kab. Maluku Tengah
Kalimantan Tengah Kab. Barito Timur Maluku Kab. Buru
Kalimantan Tengah Kab. Murung Raya Maluku Kab. Kepulauan Aru
Kalimantan Tengah Kota Palangka Raya Maluku Kab. Seram Bagian Barat
Kalimantan Selatan Kab. Kota Baru Maluku Kab. Seram Bagian Timur
Kalimantan Selatan Kab. Banjar Maluku Utara Kab. Halmahera Barat
Kalimantan Selatan Kab. Barito Kuala Maluku Utara Kab. Halmahera Tengah
Kalimantan Selatan Kab. Hulu Sungai Tengah Maluku Utara Kab. Kepulauan Sula
Kalimantan Selatan Kab. Hulu Sungai Utara Maluku Utara Kab. Halmahera Selatan
Kalimantan Selatan Kab. Tabalong Maluku Utara Kab. Halmahera Utara
Kalimantan Selatan Kab. Tanah Bumbu Maluku Utara Kab. Halmahera Timur
Kalimantan Selatan Kab. Balangan Maluku Utara Kota Ternate
Kalimantan Selatan Kota Banjar Baru Maluku Utara Kota. Tidore Kepulauan