financial performance of top ten export handloom …irphouse.com/ijbmer/ijbmerv1n1_06.pdfaditya...
TRANSCRIPT

International Journal of Business Management and Economics Research. ISSN 2349-2333 Volume 1, Number 1 (2014), pp. 47-56 © International Research Publication House http://www.irphouse.com
Financial Performance of Top Ten Export Handloom Units in India
Dr. Monica Bansal1 and Prof. (Dr.) Kuldeep Singh2
1Assistant Professor, Department of Commerce, Panjab University Rural Centre, Kauni, Shri Muktsar Sahib
2Principal, JCD Institute of Business Management, Sirsa-125055
Abstract The handloom sector occupies a distinct and unique place in the Indian economy, besides being the largest generator of non-farm rural employment. While available statistics indicate an economic sector of considerable size, there is still immense scope for expansion. The handloom sector indeed is capable of exponential growth, with proper identification of its needs, a reasonable level of resource input and structural attention. Any initiative in this direction, however, is hampered by a paucity of detailed ground level data. The generation of such information is an urgent necessity today. The objective of this paper has been to generate such field data, which can become the basis for future interventions. It identifies areas of potential growth in the handloom sector and indicates models for intervention based on ground realities. It focuses on different handloom sectors with a view to bringing out the trends and growth and identifies particular problems. Keywords: Handloom Export Units, Economic Sector, Sick Industries, Profit After Tax, Rural Employment.
1. Financial Performance of Top Ten Export Handloom Units in India
The handloom sector occupies a distinct and unique place in the Indian economy, besides being the largest generator of non-farm rural employment. While available statistics indicate an economic sector of considerable size, there is still immense scope

Dr. Monica Bansal & Prof. (Dr.) Kuldeep Singh
48
for expansion. The handloom sector indeed is capable of exponential growth, with proper identification of its needs, a reasonable level of resource input and structural attention. Any initiative in this direction, however, is hampered by a paucity of detailed ground level data. The generation of such information is an urgent necessity today. The objective of this paper has been to generate such field data, which can become the basis for future interventions. It identifies areas of potential growth in the handloom sector and indicates models for intervention based on ground realities. It focuses on different handloom sectors with a view to bringing out the trends and growth and identifies particular problems. It has been pointed out by Bhatnagar Subhash that in handloom industries successful models for scaling up ITC’s E-Chaupal is the best example of the scheme aimed at up gradation of infrastructure support and skill for handloom weavers, besides strengthening the production base by modernizing the looms. Misra Kinkini Dasgupta has pointed out that keeping in view the plight of rural women, the government is providing special packages for those who are involved in home based or small-scale activities related to handloom, handicraft, sericulture, etc. It has also been observed in a survey that the HEPC has identified five handloom production clusters to be developed as Handloom Export Zones. A scheme has been formulated and submitted to the Ministry of Textiles for sanction. It has been pointed out that the HEPC has embarked upon a project called `Handloom Expo Mart' to give a competitive edge to the exporters. The establishment of an international market will be the right strategy to attract buyers who are increasingly looking up to India as a major sourcing hub for handloom textiles. It has also been observed that the textile ministry is taking steps to brand handloom products to prevent duplication by the power loom industry. The Ministry has also entrusted the textile committee to develop a handloom mark for the industry in the lines of wool mark and silk mark.
2. Research Methodology This Section focuses on the growth rate of Handloom Industry, to accomplish the objective i.e “To examine the pattern of Growth and Present position of Export Handloom industry in India” various ratios like Profit before Interest and Tax (PBIT), Profit After Tax (PAT), Operating Profits (OP) and Earning Per Share (EPS) are calculated which lend a hand for knowing the profitability of industries in Haryana.
Selected Companies: In order to achieve the fourth objective, top ten export handloom companies from Haryana State have been selected on the basis of profitability from Economic Times 500 ranking and these are:
Company Name Rank
Aditya Birla Nuvo Ltd. 1 J B F Industries Ltd. 2 Alok Industries Ltd. 3 S Kumars Nationwide Ltd. 4 Vardhman Textiles Ltd. 5

Financial Performance of Top Ten Export Handloom Units in India 49
Arvind Ltd. 6 S R F Ltd. 7 Garden Silk Mills Ltd. 8 Raymond Ltd. 9 Bombay Rayon Fashions Ltd. 10
Data Analysis and Interpretation
Table 1: Profit before Interest and Tax (PBIT)
Company Name and Ranking Dec-07 Dec-08 Dec-09 Dec-10 Dec-11 CAGR Aditya Birla Nuvo Ltd. 311.08 314.56 162.3 320.3 495.08 9.94 % J B F Industries Ltd. 143.49 213.88 251.56 229.72 359.69 21.04 % Alok Industries Ltd. 232.31 297.59 284.99 374.79 583.19 23.02 % S Kumars Nationwide Ltd. 196.53 304.96 234.52 386.78 515.55 24.19 % Vardhman Textiles Ltd. 225.77 168.98 61.71 287.02 608.86 28.58 % Arvind Ltd. 27.71 29.61 -46.96 52 134.8 -19.56 % S R F Ltd. 493.72 259.28 374.06 470.98 732.71 14.87 % Garden Silk Mills Ltd. 107.38 126.95 123.79 181.08 237.25 21.42 % Raymond Ltd. 125.26 75 104.39 66.94 173.59 5.54 % Bombay Rayon Fashions Ltd. 75.6 171.59 215.34 241.57 282.48 34.69 %
Source: CMIE Prowess Software Lots of Textile industries are there in India and recording good profit. Upon
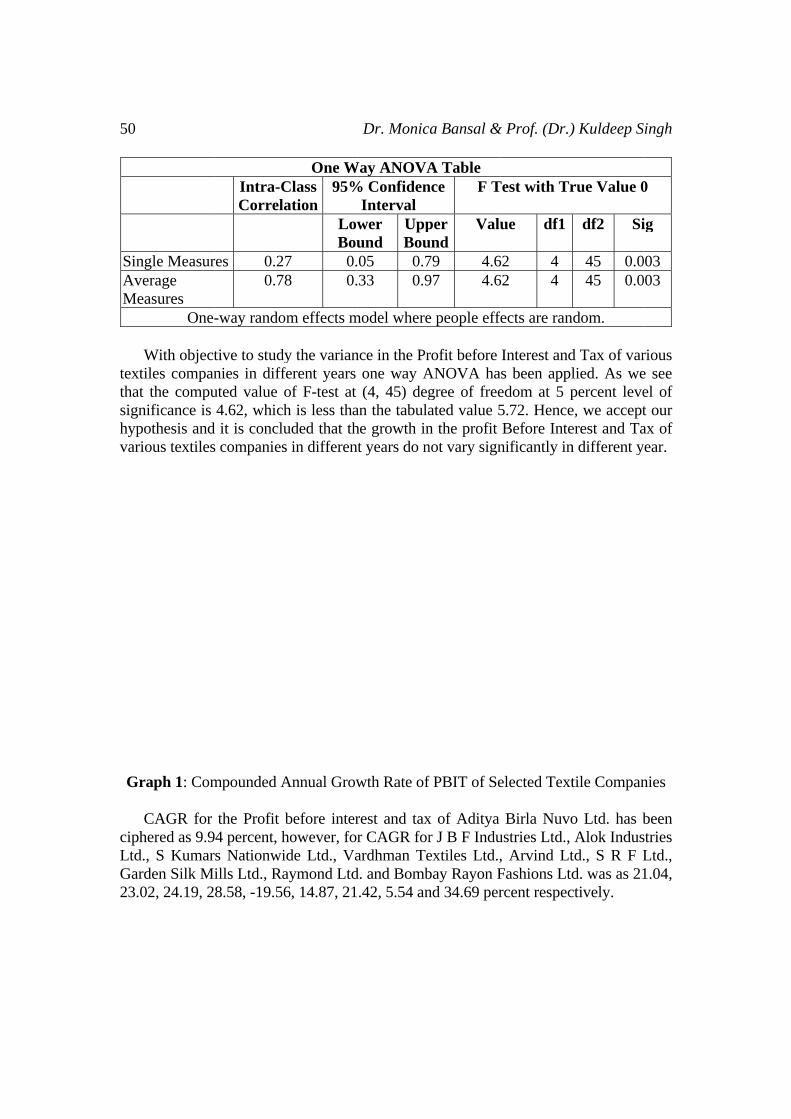
calculation of profit before interest and tax of these companies, it has revealed that PBIT of Aditya Birla Nuvo Ltd. was recorded as 311.08 in December, 2007 and as 495.08 in December 2011. CAGR of profit before interest and tax of Aditya Birla Nuvo Ltd. was recorded as 9.94 percent, however, the maximum CAGR as 34.69 percent has been recorded for Bombay Rayon Fashions Ltd., which commenced on 75.6 percent in December, 2007 and ended at 282.48 in December, 2011 with the maximum growth. Thereafter, Vardhman Textiles Ltd. has shown a good performance with CAGR of 28.58 percent, which started at 225.77 in December, 2007 and after fluctuations it, reached upto 608.86. Next is S Kumars Nationwide Ltd. with a CAGR of 24.19 percent. In December 2007, it showed a Profit before Interest and Tax of 196.53 and by December 2011 it had reached 515.55. Alok Industries Ltd. comes next with CAGR of 23.02 percent commencing at 232.31, ending at 583.19 in December, 2011. Garden Silk Mills Ltd. follows with a CAGR of 21.42 percent and the Profit before Interest and Tax rising from 107.38 in December 2007 and ending at 237.25 in December 2011. CAGR of Profit before Interest and Tax of JBF Industries has scored 21.04 percent commencing at 143.49 in December, 2007 and ending at 359.69. CAGR of S R F Ltd. and Raymond Ltd has scored 14.87 and 5.54 percent, respectively. The only negative CAGR is of Arvind Ltd. and has been recorded as -19.56 percent, which is in an alarming condition.
50
SinAveMe
textthatsignhypvari
Gr
ciphLtd.Gar23.0
ngle Measurerage
easures One-
With object
tiles compant the compunificance is pothesis andious textiles
raph 1: Com CAGR for
hered as 9.9., S Kumarrden Silk Mi02, 24.19, 2
Intra-CCorrela
res 0.270.78
-way rando
tive to studynies in diffeuted value o4.62, which
d it is conclus companies
mpounded A
the Profit b4 percent, h
rs Nationwiills Ltd., Ra8.58, -19.56
One WClass ation
95%
LowBou
7 0.8 0.
m effects m
y the varianferent years of F-test at h is less thauded that ths in differen
Annual Grow
before interhowever, forde Ltd., Va
aymond Ltd6, 14.87, 21
Dr. Monic
Way ANOVA% Confiden
Interval wer und
UppBou
05 0.733 0.9
model where
nce in the Prone way A(4, 45) deg
an the tabulahe growth int years do n
wth Rate of
rest and taxr CAGR forardhman Ted. and Bomb.42, 5.54 an
ca Bansal &
A Table nce F T
per und
Valu
79 4.697 4.6
e people effe
rofit before ANOVA hagree of freeated value 5n the profit not vary sign
f PBIT of Se
x of Aditya r J B F Induextiles Ltd.,bay Rayon Fnd 34.69 per
& Prof. (Dr.)
Test with Tr
ue df1
62 4 62 4
fects are ran
Interest andas been appledom at 5 p5.72. HenceBefore Inte
nificantly in
elected Text
Birla Nuvoustries Ltd., , Arvind LtFashions Ltdrcent respec
) Kuldeep S
rue Value 0
df2 Si
45 0.045 0.0
ndom.
d Tax of varlied. As wepercent levee, we accepterest and Tan different y
tile Compan
o Ltd. has bAlok Indus
td., S R F Ld. was as 21ctively.
Singh
0
ig
003 003
rious e see el of t our ax of year.
nies
been stries Ltd., 1.04,

Financial Performance of Top Ten Export Handloom Units in India 51
Table 2: Profit After Tax (PAT)
Company Name and ranking Dec-07 Dec-08 Dec-09 Dec-10 Dec-11 CAGR
Aditya Birla Nuvo Ltd. 224.97 243.07 137.43 283.4 379.69 12.75 % J B F Industries Ltd. 80.77 138.73 76.27 129 131.42 9.43 % Alok Industries Ltd. 164.86 198.66 188.37 247.34 404.36 22.31 %
S Kumars Nationwide Ltd. 107.47 178.13 60.09 106.1 172.7 4.40 %
Vardhman Textiles Ltd. 171.7 122.54 140.77 213.76 469.7 29.29 %
Arvind Ltd. 25.27 27.36 -47.87 52 134.8 -23.24 % S R F Ltd. 289.07 138.73 163.28 309.42 483.44 20.09 %
Garden Silk Mills Ltd. 23.26 40 49.58 63.2 87.87 36.56 % Raymond Ltd. 201.25 66.12 -270.4 26.37 -104.9 -27.56 %
Bombay Rayon Fashions Ltd. 54.48 121.13 148.5 175.92 226.7 38.05 %
Source: CMIE Prowess Software
Graph 2: Compounded Annual Growth Rate of PAT of Selected Textile Companies
One Way ANOVA Table
Intra-Class Correlation
95% Confidence Interval
F Test with True Value 0
Lower
Bound Upper Bound
Value df1 df2 Sig
Single Measures 0.16 0.00 0.70 2.95 4 45 0.0301Average Measures 0.66 -0.05 0.96 2.95 4 45 0.0301
One-way random effects model where people effects are random. The ten textiles companies have recorded a good Profit After Tax, as is evident
from the above table. Maximum CAGR of 38.05 percent has been recorded in the case of Bombay Rayon Fashions Ltd. Garden Silk Mills Ltd. has a positive growth rate of 36.56 percent after Bombay Rayon Fashions Ltd. On the other hand, in case of Aditya Birla Nuvo Ltd. there is an increasing trend of PAT except in the year December 2009. In case of J B F Industries Ltd. PAT has increased from 80.77 in December 2007 to 131.42 in December 2011 with a CAGR of 9.43 percent. There is a tremendous growth of PAT in case of Alok Industries Ltd. and shows a high degree of positive growth rate of 22.31 percent. The two companies to show negative Profit After Tax are Raymond Ltd. and Arvind Ltd. The lowest is in case of Raymond Ltd. which shows a negative CAGR of -27.56 percent followed by Arvind Ltd. with a CAGR of -23.24 percent.

52
raterate
signthatsignhypcom
AdJ BAloS KVaArvS R
CAGR
fPAT
To conclud
e of Profit Ae. One way A
nificantly int the compunificance i.epothesis. It mmpanies.
Company Ran
ditya Birla NB F Industrieok IndustrieKumars Natardhman Texvind Ltd.
R F Ltd.
‐40
‐30
‐20
‐10
0
10
20
30
40
50
Adi
tya
Bir
laN
uvo
LtdC
AGR of PAT
de, we can sAfter Tax in
ANOVA isn various kinuted value oe. 2.95, is means that th
Name and king
Nuvo Ltd. es Ltd. es Ltd. tionwide Ltdxtiles Ltd.
Adi
tya
Bir
la N
uvo
Ltd
.
J B
F I
ndus
trie
s L
td.
ay that Bomn the last fiv
s also applinds of textilof F-test at less than the PAT doe
Table 3: O
Dec-07
544.29173.99408.36
d. 248.1359.67291.66565.79
Alo
k In
dust
ries
Ltd
.
S K
umar
s N
atio
nwid
e L
td.
Co
Dr. Monic
mbay Rayonve years an
ied to knowle companie(4, 45) deg
the tabulatees not vary s
Operating P
7 Dec-08 D
9 584.769 251.516 535.83
347.057 356.326 228.979 348.92
Var
dhm
an T
exti
les
Ltd
.
Arv
ind
Ltd
.
ompany Nam
ca Bansal &
n Fashions Lnd Raymond
w whether es or not. Wgree of freeed value 5.significantly
Profits (OP)
Dec-09 De
564.58 75291.38 26810.67 12271.26 44400.89 54257.06 30468.09 59
S R
F L
td.
Gar
den
Sil
k M
ills
Ltd
.e
& Prof. (Dr.)
Ltd. has thed Ltd. has t
the profit aWe see from edom at 5 p72. Hence y in various
ec-10 Dec-
59.59 906.066.48 416.0248.6 182842.84 603.41.97 895.809.44 38493.92 805.9
Ray
mon
d L
td.
Bom
bay
Ray
on F
ashi
ons
) Kuldeep S
e highest grothe least gro
after tax vathe above t
percent levewe accept
s kinds of te
11 CAG
07 13.66 07 19.74
8.8 46.88 18 22.39 81 25.16 4 8.89 %96 13.20
Ltd
.(10
)
CAG
Singh
owth owth
aries table el of t our extile
GR
% % % % %
% %
GR

Fina
GaRayBoLtd
SiAv
G
OpemaxbeenInduCAG13.6of O
ancial Perfo
arden Silk Mymond Ltd.mbay Rayo
d.
ingle Measu
verage MeasOne-
Graph 3: Co Regarding
erating Profximum scorn recorded ustries Ltd. GR for the 66 percent, aOperating P
formance of
Mills Ltd. .
on Fashions
Source: C
IntraCorr
ures 0sures 0-way rando
ompounded
the Operatfit (OP) ofe at 51.19; hof Arvind comes nextOperating and for for J
Profit for S
f Top Ten Ex
153.6148.67
92.48CMIE Prowes
One Wa-Class elation
95
LB
.18 0
.68 0m effects m
Annual Gro
ting Profit f Bombay however, thLld., whic
t with maximProfit (OP)J B F IndusKumars N
xport Hand
170.857 91.52
212.46ss Software
Way ANOVA% Confide
IntervalLower Bound
UpBo
0.00 0.0.02 0.
model where
owth Rate o
of the tenRayon Fas
he lowest CAh is in an mum CAGR of Aditya tries Ltd. it
Nationwide L
dloom Units
155.11 23119.35 12
321.29 38
A Table ence F T
pper und Va.72 3..96 3.e people effe
of OP of Sel
n textile coshions Ltd.AGR for thealarming cR of 46.88 pBirla Nuvowas recordLtd., Vardh
in India
35.09 298.628.7 216.6
87.52 540.8
Test with T
alue df1 16 4 16 4
fects are ran
lected Texti
ompanies, . has been e Operatingondition. Tpercent. On
o Ltd. has bed at 19.74
hman Textil
64 17.93 62 11.56
86 51.19
rue Value
df2 Si45 0.0245 0.02
ndom.
le Compani
CAGR forrecorded
g Profit (OP)Thereafter, An the other heen cipherepercent. CAles Ltd., S
53
% %
%
0
ig 226226
ies
r the with ) has Alok hand, ed as AGR R F

Dr. Monica Bansal & Prof. (Dr.) Kuldeep Singh
54
Ltd., Garden Silk Mills Ltd. and Raymond Ltd. remained as 22.39, 25.16, 8.89, 13.20, 17.93 and 11.56 percent respectively.
In order to study the variance in the Operating Profit in different years one way ANOVA has been applied. As we see that the computed value of F-test at (4, 45) degree of freedom at 5 percent level of significance is 3.16, which is less than the tabulated value 5.72. Hence, we accept our hypothesis and it is concluded that the Operating Profit do not vary significantly in different years.
Table 4: Earnings Per Share (EPS) Company Name and
Ranking Dec-07 Dec-08 Dec-09 Dec-10 Dec-11 CAGR
Aditya Birla Nuvo Ltd. 24.11 25.58 14.46 27.51 33.45 7.55% J B F Industries Ltd. 14.85 22.35 12.25 20.73 18.34 3.53% Alok Industries Ltd. 9.68 10.61 9.56 3.14 5.13 -22.02% S Kumars Nationwide Ltd. 5.58 8.48 2.69 4.49 6.06 -4.59% Vardhman Textiles Ltd. 29.72 21.21 24.37 37 73.79 26.81% Arvind Ltd. 1.21 1.25 -2.19 2.24 5.3 -26.12% S R F Ltd. 42.58 20.44 26.91 51.14 79.9 24.31% Garden Silk Mills Ltd. 6.07 10.45 17.27 16.51 22.95 36.58% Raymond Ltd. 32.79 10.77 -44.05 4.3 -17.09 -32.45% Bombay Rayon Fashions Ltd. 8.65 19.23 21.49 15.72 17.72 13.12%
Source: CMIE Prowess Software
One Way ANOVA Table
Intra-Class Correlation
95% Confidence Interval
F Test with True Value 0
Lower Bound
Upper Bound Value df1 df2 Sig
Single Measures -0.01 -0.08 0.40 0.92 4 45 0.461 Average Measures -0.09 -2.36 0.87 0.92 4 45 0.461
One-way random effects model where people effects are random. With regard to the Earning Per Share (EPS) of various textile companies, CAGR
for the EPS of Aditya Birla Nuvo Ltd. has been recorded at 7.55 percent with a steady rise except in the year 2009. The CAGR for the Earning per Share (EPS) of JBF Industries Ltd. has been recorded at 3.53 percent, for Vardhman Textiles Ltd., it has been recorded at 26.81 percent, and for SRF Ltd. 24.31 percent. Bombay Rayon Fashions Ltd.'s CAGR of EPS has been recorded at 13.12 percent. Golden Silk had the

Fina
highnamreco
Gr
waydegrtabuEarn
Ref
[1
[2
[3
ancial Perfo
hest CAGR mely Alok orded a nega
raph 4: Com In order to
y ANOVA hree of freedulated valuenings Per Sh ferences
1] Ashis MGoal PEconomhttp://fi
2] AgenciNov. 27/new
3] SubhasAllevia26-27, 2
formance of
of Earning Industries, ative CAGR
mpounded A
study the vhas been apdom at 5 pe 5.72. Henhare (EPS)
Mishra (20Programminmics, indarticles.cies (2004),
2004, ws/27412516sh Bhatnagation in Indi2004.
f Top Ten Ex
Per Share oS Kumar’
R at -22.02,
Annual Gro
variance in tpplied. As wpercent levence, we accdo not vary
03) “Mediang Approac
com/p/articl“Handloom
http://6_1_handlogar (2004)ia”, Indian
xport Hand
of 36.58 pers Nationwi-4.59, -26.1
owth Rate of
the Earning we see that tel of significept our hyy significant
a Selection ch”, Journa
les/mi_m0Om Demand P
/articles.ecoom-demand
) “WorkshoInstitute of
dloom Units
rcent. The reide, Arvind12 and -32.4
f EPS of Se
Per Share (the computeicance is 0.ypothesis anly in differe
Decision inal of the A
OGT/is_2_1Picks up”, Tonomictimed-minister op on Scalf Manageme
in India
emaining ted Ltd and 45 percent r
lected Texti
(EPS) in diffed value of 92, which
nd it is conent years.
n Social SyAcademy of
/ai_113563The Econom
es.indiatime
ling up ICent, Ahmed
extile compaRaymond
respectively
ile Compan
fferent yearsF-test at (4is less than
ncluded that
ystem: A Fuf Business
3621/pg_3 mic Times, s.com/2004
CT for Povdabad, Febr
55
anies Ltd. .
nies
s one , 45)
n the t the
uzzy and
27th 4-11-
verty ruary

Dr. Monica Bansal & Prof. (Dr.) Kuldeep Singh
56
[4] Kinkini Dasgupta Misra (2004) “Information & Communication Technology for Women’s Empowerment in India”, [email protected]
[5] G. Gurumurthy (2004) “Handloom Exporters' Plea on Customs Provision”, The Hindu Business Line, Thursday, Oct 28, 2004.
[6] Kiran Deep (2004) “Cotton Export Hits Handloom Units”, The Tribune, Wednesday, March 17, 2004, Chandigarh, India.
[7] “The Handloom Industry Does Not Have the Competitive Edge to Face Global Competition”, The Hindu Business Line, 18 January 2005.
[8] “The Handloom Industry Will Never Master the Marketing Capability of the Organized Sector”, The Hindu Business Line, 6 August 2005.
[9] “The Handloom Industry Does Not Possess A Brand Identity”, The Hindu Business Line, 11 Sept. 2005.
[10] Singh Kuldeep & Bansal Monica (2012), “An Analytical Study of Handloom Industry In India”, Radix International Journal of Research in Marketing (RIJM), Volume 1, Issue 12, December 2012, pp 1-11.
[11] Singh Kuldeep & Bansal Monica (2012), “A Study of Export Payments regarding Handloom Products in India”, International Journal of Latest Technology in Engineering, Management & Applied Science (IJLTEMAS), Volume I, Issue X Dec 2012, pp 1-12.
[12] Singh Kuldeep & Bansal Monica (2013), “An Overview of Handloom Industry in Panipat”, International Journal of Research in Computer Application & Management (IJRCM), Volume No. 3, Issue No. 01, January 2013, pp 68-73.
[13] Singh Kuldeep & Bansal Monica (2013), “An Empirical Study of Transportation Problems faced by Handloom Export Units in Panipat”, Indian Journal of Applied Research, Volume No. 3, Issue No. 01, January 2013, pp 3-6.
[14] Ghosh Suntu and Akter Shahriar (2008),“Handloom Industry on the Way of Extinction”, 5th Nov 2008, p 1, http://www.fibre2fashion.com/industry-article/15/1488/handloom-industry-on-the-way-of-extinction1.asp
[15] Ramesh kumar Chidambaram and Anbumani N (2008), “Tatting: 19th Century Treasure!”, Textile Review, Vol. 3, Issue 4, April 2008, http://www.textilereview.com/april08_content.htm