financial performance of esg integration in us …
TRANSCRIPT
The PRI is an investor initiative in partnership with UNEP Finance Initiative and UN Global Compact
FINANCIAL PERFORMANCE OF ESG INTEGRATION IN US INVESTING

2
PREAMBLE TO THE PRINCIPLESAs institutional investors, we have a duty to act in the best long-term interests of our beneficiaries. In this fiduciary role, we believe that environmental, social, and governance (ESG) issues can affect the performance of investment portfolios (to varying degrees across companies, sectors, regions, asset classes and through time). We also recognise that applying these Principles may better align investors with broader objectives of society. Therefore, where consistent with our fiduciary responsibilities, we commit to the following:
THE SIX PRINCIPLES
We will incorporate ESG issues into investment analysis and decision-making processes.1We will be active owners and incorporate ESG issues into our ownership policies and practices.2We will seek appropriate disclosure on ESG issues by the entities in which we invest.3We will promote acceptance and implementation of the Principles within the investment industry.4We will work together to enhance our effectiveness in implementing the Principles.5We will each report on our activities and progress towards implementing the Principles.6
The information contained in this report is meant for the purposes of information only and is not intended to be investment, legal, tax or other advice, nor is it intended to be relied upon in making an investment or other decision. This report is provided with the understanding that the authors and publishers are not providing advice on legal, economic, investment or other professional issues and services. PRI Association is not responsible for the content of websites and information resources that may be referenced in the report. The access provided to these sites or the provision of such information resources does not constitute an endorsement by PRI Association of the information contained therein. Unless expressly stated otherwise, the opinions, recommendations, findings, interpretations and conclusions expressed in this report are those of the various contributors to the report and do not necessarily represent the views of PRI Association or the signatories to the Principles for Responsible Investment. The inclusion of company examples does not in any way constitute an endorsement of these organisations by PRI Association or the signatories to the Principles for Responsible Investment. While we have endeavoured to ensure that the information contained in this report has been obtained from reliable and up-to-date sources, the changing nature of statistics, laws, rules and regulations may result in delays, omissions or inaccuracies in information contained in this report. PRI Association is not responsible for any errors or omissions, or for any decision made or action taken based on information contained in this report or for any loss or damage arising from or caused by such decision or action. All information in this report is provided “as-is”, with no guarantee of completeness, accuracy, timeliness or of the results obtained from the use of this information, and without warranty of any kind, expressed or implied.
PRI DISCLAIMER
PRI's MISSIONWe believe that an economically efficient, sustainable global financial system is a necessity for long-term value creation. Such a system will reward long-term, responsible investment and benefit the environment and society as a whole.
The PRI will work to achieve this sustainable global financial system by encouraging adoption of the Principles and collaboration on their implementation; by fostering good governance, integrity and accountability; and by addressing obstacles to a sustainable financial system that lie within market practices, structures and regulation.

FINANCIAL PERFORMANCE OF ESG INTEGRATION IN US INVESTING | 2018
3
US investors cite two primary reasons for taking account of ESG issues in their investment research and decision-making processes: client demand and financial performance.1 Clients, including DB and DC retirement plans as well as foundations and endowments, are increasingly making public commitments to take account of ESG issues in their investment philosophies, strategies and communications with plan participants.2 Additionally, an increasing number of asset owners and asset managers report that they believe ESG analysis leads to better investment decisions and financial performance. Indeed, the past decade has provided many examples of ESG issues – such as adverse trends in climate change and natural resources, labor and board diversity, as well as cybersecurity – being of sufficient scale to have a material, and often negative, financial impact on corporate performance. However, some degree of skepticism remains among US investors that there is value in ESG integration and that the benefits in financial performance outweigh the costs of ESG research and analysis. The PRI notes that meaningful progress has been made on both sides of this equation.
On the cost side, financial data providers such as MSCI, FTSE Russell and Bloomberg, as well as sell-side research firms and proxy advisory services, are providing high-quality ESG data at scale. As industry knowledge and expertise has grown, so too has the number of investors with the skills and tools necessary to extract investment insights and value from third-party ESG data and analytics. A common first step for clients in the ESG research due diligence process is to ask their advisors, consultants and asset managers to explain how they consider ESG issues. Asset managers have been motivated by their clients to improve their ESG research and reporting capabilities including through building internal expertise and sourcing ESG data.
However, the most important ESG-related developments involve evidence that incorporating ESG issues is a source of investment value. This paper presents three supporting recent US studies, which add to a rapidly growing roster of literature on the topic.3 The three studies validate that ESG factors are materially linked to both equities and fixed income performance. The studies further demonstrate that attractive investment opportunities can be capitalized on in US companies through the use of ESG integration, with the degree of financial materiality varying across individual sustainability factors, fundamental profiles and industry groups.
The commercial case for analysis on ESG issues is growing rapidly in the US. Today, the fiduciary risk for investors is not in the consideration of ESG issues, as was once considered the case, but in the lack of consideration of ESG issues.4 As the Labor Department 2015 interpretive bulletin says, “The guidance also acknowledges that environmental, social, and governance factors may have a direct relationship to the economic and financial value of an investment. When they do, these factors are more than just tiebreakers, but rather are proper components of the fiduciary’s analysis of the economic and financial merits of competing investment choices.”5
The PRI continues to monitor trends and growth in ESG analysis and regularly publishes evidence and case studies on ESG issues. The PRI welcomes feedback on this paper, which can be sent to [email protected].
PREFACE
This briefing paper has been prepared for investment professionals (particularly trustees and investment consultants) interested in the benefits of ESG integration to investment outcomes in the US. It is not intended to be exhaustive nor constitute investment advice. ESG integration is defined as the systematic and explicit inclusion of material environmental, social and governance factors into investment analysis and investment decisions.
For questions or comments, please email [email protected].
1 Investors in international markets, and increasingly US investors, also cite regulatory requirements: See Global Guide to Responsible Investment Regulation: https://www.unpri.org/about/pri-teams/policy/responsible-investment-regulation.
2 See growth in PRI signatories: www.unpri.org3 See appendix 1.4 See www.fiduciaryduty21.org. 5 See https://www.dol.gov/opa/media/press/ebsa/ebsa20152045.htm

4
A May 2017 CFA Institute survey on ESG integration, the backdrop for this paper, reinforced that a proven link between ESG factors and financial performance would be among the top motivating reasons for those US investors that have not done so yet to adopt ESG integration in their investment practice. The survey suggests that there remains variability in the extent and sophistication of ESG integration among US investors relative to the rest of the world. Late adopters in the US would like to see more statistical evidence that companies which demonstrate environmental stewardship and social responsibility, and cultivate a sound and robust governance culture, are consistently rewarded and are therefore better positioned to achieve long-term sustainable positive returns.
THREE EMPIRICAL STUDIES PROVIDE IMPORTANT INSIGHTS ON ESG MATERIALITY IN THE US This paper summarizes the findings from three empirical studies on ESG materiality and should provide the guidance, and ultimately the confidence for US investors who are still doing their due diligence on ESG integration, to fully recognize its value and capitalize on opportunities in the US. The PRI recently conducted a proprietary study using MSCI ESG Research analytics and data to evaluate the relative performance in active cumulative returns from portfolios with improving (i.e. momentum strategy) versus those with high (i.e. tilt strategy) ESG scores against a broad index across geographic regions. In addition, the PRI identified two other empirical studies, by BofA Merrill Lynch Global Research and Calvert Research and Management, which evaluate ESG materiality from equity and fixed income perspectives, respectively.
US INVESTORS SHOULD SEEK ANSWERS TO HOW ESG FACTORS ARE MATERIAL ACROSS VARIOUS DIMENSIONSThe three studies covered in this paper offer insight on the following questions:
■ Does a portfolio that is optimized by ESG performance have an alpha-generating advantage over a broad index?
■ What does an ESG momentum (trending scores) versus tilt (absolute point-in-time scores) strategy convey about alpha generation?
■ How does the US fare in terms of alpha opportunity from ESG integration versus other regions?
■ Is ESG integration effective in both equities and fixed income?
■ Which of the sustainability pillars present the greatest alpha opportunity?
■ How does ESG efficacy vary across market capitalization and credit quality distributions?
■ Do certain industries present a better alpha opportunity from ESG integration than others?
INTRODUCTION

FINANCIAL PERFORMANCE OF ESG INTEGRATION IN US INVESTING | 2018
5
In May 2017, the CFA Institute surveyed its members on how they use ESG integration in their investment practices as well as to gauge their perceptions of ESG issues and data. Having reviewed the global results from the survey, the PRI observed that the US trails the rest of the world regarding ESG integration in areas such as adoption rate, frequency of use, level of conviction in value proposition and belief in the financial impact of climate change. These findings highlight the need for more research on the relationship between ESG integration and financial performance to help US investors capitalize on the opportunities uncovered by ESG research.
The PRI found the below observations from the CFA survey to be the most compelling. We also explain how the three studies covered in this paper might influence positive change in the perceptions of ESG integration among US investors.
US INVESTORS ARE POISED TO BENEFIT FROM EMPIRICAL STUDIES ON MATERIALITY OF ESG INTEGRATION
■ A higher proportion of AMER members than those in APAC and EMEA said that a lack of demand from clients/investors as well as materiality issues prevent them from considering ESG issues.
■ AMER members were just behind APAC members in saying that a proven link between ESG and financial performance would prompt them to begin considering ESG issues.
■ A higher proportion of respondents in EMEA than in AMER and APAC systematically consider ESG issues in their investment analysis.
The PRI, BofA Merrill Lynch Global Research and Calvert Research and Management studies aim to address much of the gaps in empirical research that have created barriers and reasons for some skepticism among US investors, as reflected by the CFA survey. Findings from these studies further uncovered the importance of demonstrating the materiality of ESG factors based on: momentum (trending scores) and tilt (absolute point-in-time scores) strategies; regions; sustainability pillars; market capitalization ranks in equities and credit quality distributions in fixed income; and industries.
US INVESTORS ARE POISED TO BENEFIT FROM RESEARCH ON THE MATERIALITY OF INDIVIDUAL SUSTAINABILITY PILLARS
■ A significantly higher proportion of members in APAC and EMEA than in AMER take ESG issues into account in their investment analysis/decisions, with governance being accounted for the most.
■ AMER members trail behind EMEA in their belief that climate change will impact financial markets.
The CFA survey suggests that among the E, S and G pillars, investors tend to capture governance risk the most across all markets. This finding is consistent with the expectation that investors prioritize corporate governance issues given that deficiencies in this area were responsible for the financial crisis. Furthermore, issues such as executive pay, board independence and diversity, culture of ethics and compliance tend to be material, overarching themes across all industries. Disclosure and data transparency within regular financial filings is also much greater in the area of governance than it is within the environmental and social pillars, where information sometimes needs to be uncovered through less traditional sources such as civil society or labor union reports, and social media outlets. Research by BofA Merrill Lynch Global Research and Calvert Research and Management could further suggest that there is greater alpha opportunity associated with environmental and social factors.
THE CFA INSTITUTE’S ESG SURVEY
“The data shows that incorporating ESG factors into investment decision making is on the rise. Some factors can and have been material to investor analysis. That was a clear influence on the Department of Labor’s revision of their ESG guidance that recognized that ESG factors can be material and an appropriate component of a fiduciary’s analysis and decision making.”Judy Mares, former Deputy Assistant Secretary for Policy, Employee Benefits Security Administration, Department of Labor

6
US INVESTORS ARE POISED TO BENEFIT FROM RESEARCH ON THE MATERIALITY OF ESG FACTORS IN FIXED INCOME INVESTING
■ A higher proportion of respondents in EMEA than in AMER and APAC integrate ESG analysis in fixed income, while those in APAC are more likely to integrate ESG analysis in private equity.
The CFA survey might suggest that US investors believe that equities compared to bonds tend to be more sensitive to ESG-related headlines, similar to the way they are to earnings announcements. The corporate bond market is arguably less affected by short-term noise, and reacts to issues that have a longer-term bottom line impact. For instance, a bond investor is often cognizant of a company’s leverage target; if a company announces a share buyback, dividend distribution or M&A transaction that the investor does not believe is dilutive nor will compromise the company’s credit profile, he/she will be less likely to reduce risk in that name. The same line of reasoning would be applied to an ESG-related headline. The Calvert Research and Management study does, however, demonstrate that ESG integration has similar efficacy in fixed income, suggesting that there is a recognition that material ESG factors can affect the long-term credit profile of a company as reflected in credit spread behavior.
“The AIC has promoted responsible investment in private equity throughout its 10-year history. In 2009 the AIC drafted Responsible Investment Guidelines for private equity general partners. In 2014 the AIC launched semi-annual ESG seminars to educate its members about responsible investing and to convey best practices for integrating ESG in their investment portfolios. ESG integration is valuable to private equity and all investment strategies because it helps to create more long-term value for companies. Companies that adhere to higher environmental, social, and governance standards have more enduring business models, and they also provide evidence to asset allocators that their investments can do well by doing good.”Bronwyn Bailey, Ph.D., VP, Research and Investor Relations, American Investment Council

FINANCIAL PERFORMANCE OF ESG INTEGRATION IN US INVESTING | 2018
7
THE PRI’S ESG AND ALPHA STUDY BASED ON MSCI ESG RESEARCH ANALYTICS AND DATAThe PRI recently conducted a study based on portfolio analytics and ESG data provided by MSCI ESG Research to evaluate the efficacy of optimal mean-variance equities portfolios optimized with assets that had improving ESG scores (momentum strategy) versus high absolute ESG scores (tilt strategy) across the world and geographic regions, including the US, Europe and Japan. The PRI analysed relative performance in active cumulative equity returns over a 10-year period from these portfolios in which diversification constraints were applied against their respective geographic benchmarks. The study effectively tested ESG materiality in equities as a proxy for future returns by strategy and region. Below is a summary of the study’s highlights and implications.
GLOBAL RESULTS DEMONSTRATE ESG EFFICACY OF BOTH MOMENTUM AND TILT STRATEGIES IN EQUITIES INVESTINGESG information offers an alpha advantage in the construction of optimal mean-variance equities portfolios across all regions, based on observed historical meaningful outperformance in active cumulative returns versus respective geographic benchmarks. The world, the US and Japan portfolios benefitted more from the ESG momentum strategy (optimized with year-over-year improvement in ESG scores as a proxy for future returns), as reflected in higher annualized information ratios relative to the ESG tilt strategy. Conversely, the Europe portfolio benefited more from the ESG tilt strategy (optimized with average absolute ESG scores as a proxy for future returns), as reflected in a doubled information ratio of 1.0 relative to the ESG momentum strategy. This observation could suggest that companies in Europe have reached their optimal levels of ESG performance faster compared to the rest of the world, while companies in the US stand to benefit from an upward trend in ESG scores, as illustrated by a momentum strategy.
ESG MOMENTUM ESG TILT
World 0.72 0.43
USA 0.69 -0.06
Europe 0.44 1.00
Japan 0.65 0.16
Information ratio per region and strategy
“There is mounting evidence that ESG issues can affect the performance of investment portfolios and have implications for a company’s earnings and prospects as well as broader economic functioning.”Richard Lacaille, CIO, State Street Global Advisors

8
In the world portfolio, the ESG momentum and tilt strategies outperformed the MSCI World Index by 16.8% and 11.2% in active cumulative returns respectively over a 10-year period (Figure 1). The ESG momentum strategy in particular showed a stronger alpha advantage with a higher active return on a cumulative and annualized basis given the same level of active risk, as well as an almost doubled information ratio of 0.72, compared to the ESG tilt strategy (Table 1). The main source of active outperformance was attributed to style and specific factors, in both ESG momentum and tilt strategies.
The style factor reflects security selection (with respect to fundamental stock characteristics such as size, price and momentum) while the specific factor reflects idiosyncratic risk and return. The largest source of outperformance in the momentum versus tilt strategy came from the specific factor which had a 1.05% versus 0.23% return, respectively. Table 2 shows the active factor-based risk and return attribution of both strategies.
Figure 1: Active Cumulative Performance, World strategies
-0.05
0
0.05
0.1
0.15
0.2
0.25
Jun-
200
7
Nov
-200
7
Apr
-20
08
Sep-
200
8
Feb-
200
9
Jul-2
009
Dec
-200
9
May
-201
0
Oct
-201
0
Mar
-201
1
Aug
-201
1
Jan-
2012
Jun-
2012
Nov
-201
2
Apr
-20
13
Sep-
2013
Feb-
2014
Jul-2
014
Dec
-201
4
May
-201
5
Oct
-201
5
Mar
-201
6
Aug
-201
6
Jan-
2017
Jun-
2017
ESG Momentum, World ESG Tilt, World
Act
ive
Cum
ulat
ive
Ret
urn,
%
ESG MOMENTUM ESG TILTActive return, annualized 1.75% 1.06%
Active risk, annualized 2.45% 2.45%
Information Ratio 0.72 0.43
Active Cumulative return 16.82% 11.23%
Turnover, monthly 7.89% 7.62%
Turnover, annualized 94.64% 91.47%
Average number of assets 215 136
Average number of assets, Benchmark 1677 1677
Average ESG score 6.8 9.8
Average ESG score, Benchmark 5.7 5.7
Table 1: Summary Statistics, World strategies
FINANCIAL PERFORMANCE OF ESG INTEGRATION IN US INVESTING | 2018
9
ESG MOMENTUM ESG TILTAttribution Blocks Return, ann. % Risk, ann. % Return, ann. % Risk, ann. %
Style 0.73% 0.69% 0.93% 0.75%
Industry -0.07% 0.94% 0.05% 0.84%
Country -0.10% 0.47% -0.14% 0.54%
Currency 0.14% 0.48% -0.01% 0.63%
World 0.00% 0.00% 0.00% 0.00%
Specific 1.05% 2.09% 0.23% 2.31%
Total Active 1.75% 2.45% 1.06% 2.45%
Table 2: Active Risk and Return Factor Attribution, World Strategies, GEMLT
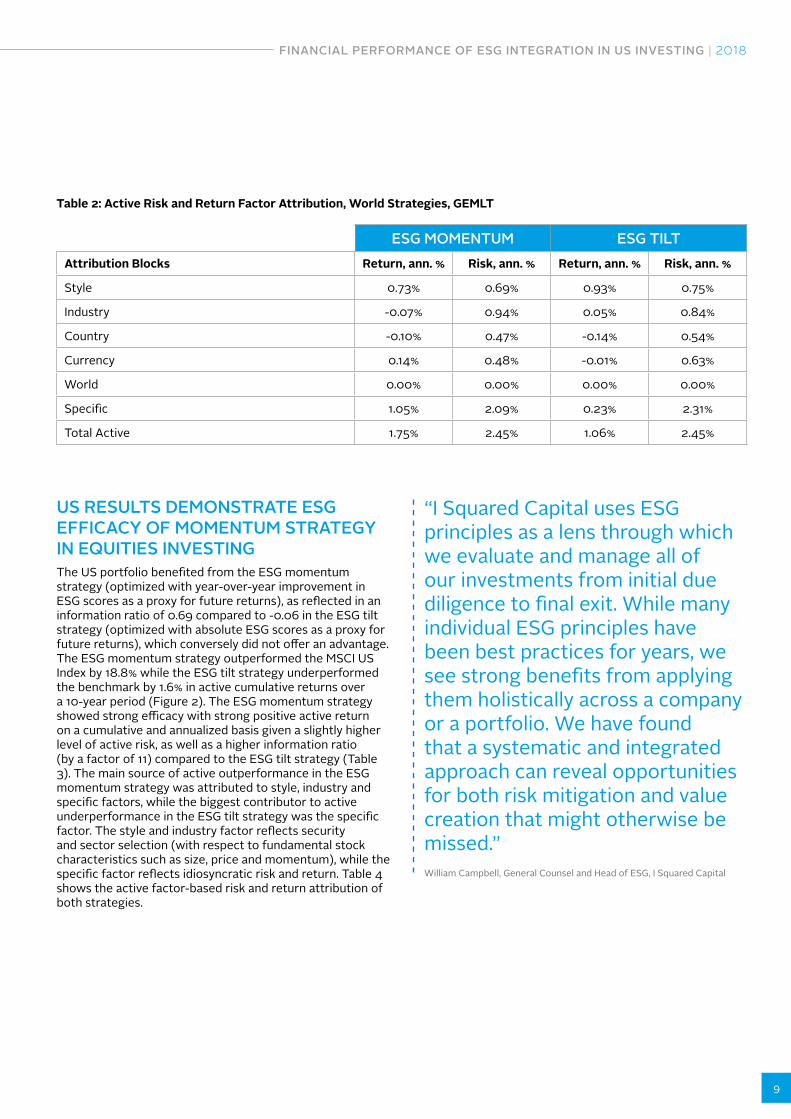
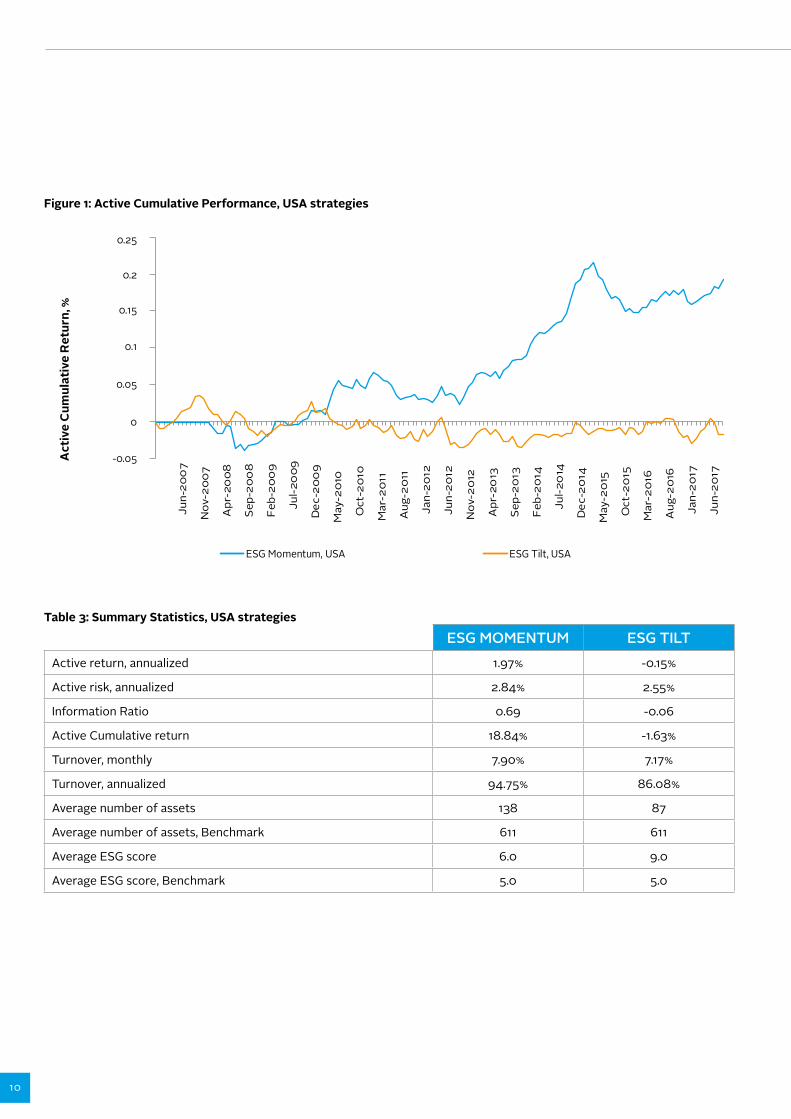
US RESULTS DEMONSTRATE ESG EFFICACY OF MOMENTUM STRATEGY IN EQUITIES INVESTINGThe US portfolio benefited from the ESG momentum strategy (optimized with year-over-year improvement in ESG scores as a proxy for future returns), as reflected in an information ratio of 0.69 compared to -0.06 in the ESG tilt strategy (optimized with absolute ESG scores as a proxy for future returns), which conversely did not offer an advantage. The ESG momentum strategy outperformed the MSCI US Index by 18.8% while the ESG tilt strategy underperformed the benchmark by 1.6% in active cumulative returns over a 10-year period (Figure 2). The ESG momentum strategy showed strong efficacy with strong positive active return on a cumulative and annualized basis given a slightly higher level of active risk, as well as a higher information ratio (by a factor of 11) compared to the ESG tilt strategy (Table 3). The main source of active outperformance in the ESG momentum strategy was attributed to style, industry and specific factors, while the biggest contributor to active underperformance in the ESG tilt strategy was the specific factor. The style and industry factor reflects security and sector selection (with respect to fundamental stock characteristics such as size, price and momentum), while the specific factor reflects idiosyncratic risk and return. Table 4 shows the active factor-based risk and return attribution of both strategies.
“I Squared Capital uses ESG principles as a lens through which we evaluate and manage all of our investments from initial due diligence to final exit. While many individual ESG principles have been best practices for years, we see strong benefits from applying them holistically across a company or a portfolio. We have found that a systematic and integrated approach can reveal opportunities for both risk mitigation and value creation that might otherwise be missed.”William Campbell, General Counsel and Head of ESG, I Squared Capital
10
Figure 1: Active Cumulative Performance, USA strategies
-0.05
0
0.05
0.1
0.15
0.2
0.25
Jun-
200
7
Nov
-200
7
Apr
-20
08
Sep-
200
8
Feb-
200
9
Jul-2
009
Dec
-200
9
May
-201
0
Oct
-201
0
Mar
-201
1
Aug
-201
1
Jan-
2012
Jun-
2012
Nov
-201
2
Apr
-20
13
Sep-
2013
Feb-
2014
Jul-2
014
Dec
-201
4
May
-201
5
Oct
-201
5
Mar
-201
6
Aug
-201
6
Jan-
2017
Jun-
2017
ESG Momentum, USA ESG Tilt, USA
Act
ive
Cum
ulat
ive
Ret
urn,
%
ESG MOMENTUM ESG TILTActive return, annualized 1.97% -0.15%
Active risk, annualized 2.84% 2.55%
Information Ratio 0.69 -0.06
Active Cumulative return 18.84% -1.63%
Turnover, monthly 7.90% 7.17%
Turnover, annualized 94.75% 86.08%
Average number of assets 138 87
Average number of assets, Benchmark 611 611
Average ESG score 6.0 9.0
Average ESG score, Benchmark 5.0 5.0
Table 3: Summary Statistics, USA strategies

FINANCIAL PERFORMANCE OF ESG INTEGRATION IN US INVESTING | 2018
11
ESG MOMENTUM ESG TILTAttribution Blocks Return, ann. % Risk, ann. % Return, ann. % Risk, ann. %
Style 0.62% 0.68% 0.79% 0.65%
Industry 0.29% 0.98% 0.09% 0.91%
Country 0.07% 0.13% 0.04% 0.06%
Currency 0.00% 0.02% 0.00% 0.02%
World 0.00% 0.00% 0.00% 0.00%
Specific 0.99% 2.50% -1.07% 2.29%
Total Active 1.97% 2.84% -0.15% 2.55%
Table 4: Active Risk and Return Factor Attribution, USA Strategies, GEMLT
PORTFOLIO MODELING PARAMETERSBelow we summarize the parameters used in constructing the mean-variance portfolios for both ESG momentum and tilt strategies.
■ ESG ratings: The PRI used MSCI’s ESG Ratings6 system, which ranks companies on a scale of one to 10 (where 10 is the highest score), based on their exposure to industry-specific ESG risks and their ability to manage those risks relative to peers.
■ ESG momentum versus tilt strategy company scores: The ESG score for the momentum strategy is a measure of the difference between a company’s ESG score today and in the prior year. The ESG score for the tilt strategy is a point-in-time measure of the company’s absolute ESG score.
■ Portfolio limits: Diversification constraints were applied to the portfolios, including maximum turnover of 8% per month, maximum stock weight of 5%, individual active stock weights between -2% and +2% of the parent index, as well as country allocation between -5% and +5% of the parent index. Portfolios were rebalanced monthly.
■ Data period: The data period for the ESG momentum strategy was from January 2008 to the middle of 2017 and for the ESG tilt strategy from January 2007 to the middle of 2017.
■ Parent indexes: The parent indexes used to benchmark the regional and single country portfolios were the MSCI World, MSCI USA and MSCI Japan indexes.
6 https://www.msci.com/esg-ratings
“Our emphasis on risk mitigation and our commitment to rigorous fundamental credit research made the decision to integrate ESG a natural one for Breckinridge. We have found that taking such an integrated research approach provides a more comprehensive and forward-looking evaluation of a borrower’s ability to repay on its debt obligations. Ultimately, we believe that ESG integration enables us to gain deeper insight into the underlying risk and value of an investment.”Robert Fernandez, CFA, Director of ESG Research, Breckinridge Capital Advisors

12
The CFA survey revealed that ESG integration is more of a mainstream practice in equities compared to fixed income – in the US and other parts of the world. Equity prices relative to corporate bond spreads tend to be more reactive to ESG issues, as discussed earlier. However, there also appears to be more empirical studies on the public equities versus fixed income side that validates the efficacy of ESG integration. This could be because a fixed income study would be challenged by the ability to make clean comparisons in the bonds of companies with different ESG profiles, due to disparities in their maturity dates, optionality features, interest rate duration risk and levels of subordination.
In July 2015, Calvert Research and Management published the results of a back test study that evaluated the impact of ESG factors (based on Reuters’ scoring system) on fixed income investment performance over a 10-year period (2003-2013) through a series of simulations. The study used credit default swap (CDS) spreads as a proxy for corporate bond returns, given the instrument’s bullet maturity structure and isolation of credit risk, allowing for apples-to-apples comparisons. Below is a summary of the main takeaways from the study and their implications.
ESG FACTORS DEMONSTRATE MEANINGFUL EFFICACY IN FIXED INCOME INVESTINGCompanies ranked in the top half compared to bottom half endtiles by aggregate ESG scores experienced 6.8% and 4.8% in outperformance on a leverage-neutral and sector-neutral basis respectively, as measured by the annual rate of change in CDS spreads. These results appear to statistically validate the value proposition of investing in the credit of companies with superior ESG profiles.
INDIVIDUAL SUSTAINABILITY PILLARS OFFER VARYING DEGREES OF ALPHA-GENERATING ADVANTAGE IN FIXED INCOME INVESTINGCompanies ranked in the top half compared to bottom half endtiles by individual environmental, social and governance scores experienced 5.4%, 4.1% and 0.6% in outperformance on a leverage-neutral basis, as measured by the annual rate of change in CDS spreads.
A simulation conducted on a sector-neutral basis showed meaningful outperformance only on the environmental factor. This simulation suggests that while governance issues, such as a company’s capital allocation strategy (equitable treatment of equity and debt stakeholders), are more commonly linked to equity and fixed income performance and therefore more frequently considered in investment analysis compared to environmental or social factors, the latter two sustainability pillars have the potential to offer greater alpha opportunity.
ESG FACTORS DEMONSTRATE VARYING DEGREES OF EFFICACY ACROSS THE CREDIT QUALITY SPECTRUMIn another simulation, in which the companies were grouped into quartiles based on their leverage ratios (as a proxy for fundamental risk and credit quality), a compelling observation was that, within the lowest leveraged group, those companies ranked in the top half by aggregate ESG score had no alpha-generating advantage over their bottom half-ranked counterparts. On the other hand, within the second lowest, second highest and highest leveraged groups, those companies ranked in the top half compared to the bottom half endtiles lexperienced 14.1%, 7.8% and 15.2% in outperformance respectively. The simulation done on a sector-neutral basis yielded very similar results. This simulation suggests that lower quality as opposed to higher quality investment-grade companies (as represented by the lowest and second lowest leveraged quartiles respectively) are, from a spread performance perspective, more likely to benefit from the consideration of ESG factors. Arguably, companies with the highest credit quality profiles usually have the largest market capitalizations and are best positioned to make significant investments in financial and human capital towards ESG-related implementation. Hence, ESG information for the highest quality companies is disseminated with greatest transparency and efficiency to the marketplace, minimizing their alpha-generating potential compared to lower quality companies, where ESG disclosure is more sporadic and creates an information advantage for ESG-minded investors.
CALVERT RESEARCH AND MANAGEMENT’S ESG IN FIXED INCOME INVESTING STUDY

13
FINANCIAL PERFORMANCE OF ESG INTEGRATION IN US INVESTING | 2018
ESG FACTORS DEMONSTRATE AN IMPORTANT ROLE IN FIXED INCOME INVESTING, DESPITE CHALLENGES IN MEASURING ISOLATED ESG RISKIt is understandable why the adoption rate of ESG integration and the level of confidence in its value proposition has been weaker on the fixed income relative to equities side. Shortcomings exist in the measures that are used as proxies for corporate bond returns. Arguments include credit ratings lagging the market in reacting to fundamental events and average credit spreads not capturing comparable maturities across all corporate bonds7. CDS spreads are arguably a good proxy for bond spreads, as CDS contracts are able to overcome the mismatch problem with bonds and the two markets are tightly coupled under normal market conditions. However, the liquidity of the CDS market has weakened significantly in the last decade as a result of the collapse of the synthetic CDO market which was responsible for driving the high volume of secondary trading in CDS pre-crisis, as well as tighter regulation that has rendered trading in derivative instruments more expensive. Weaker liquidity and higher transaction costs in the CDS market can cause distortions in CDS spreads, and therefore it is important to revisit the most informationally efficient instrument and reliable proxy for corporate bond returns in the future, as market conditions change.
Despite these caveats, the Calvert Research and Management study demonstrated the efficacy of ESG in fixed income investing, and also revealed the importance of breaking down such an analysis further. A closer look at contributions to returns from individual sustainability pillars and leverage ratio quartiles reveals that alpha-generating opportunities vary in magnitude across different cross-sections of the credit universe.
7 For further details on the PRI’s work on credit rating agencies, see: https://www.unpri.org/download_report/36678.
“ESG analysis is an essential part of LGT Capital Partners’ private equity due diligence process. We focus on fund managers’ commitment to ESG and how they integrate the concept into their investment decision-making, ownership policies and reporting practices. We believe that integrating ESG factors into private equity investing helps to identify a broader set of risks than traditional financial analysis and it drives additional value creation over the long term.”Tycho Sneyers, Managing Partner & Chairman of the ESG Committee, LGT Capital Partners
14
In June 2017, BofA Merrill Lynch Global Research released follow-on research to a December 2016 study that evaluated the reliability of ESG data (based on Thomson Reuters’ scoring system) as a signal of future volatility and directional trends in equity market valuations. The BofA Merrill Lynch US Research coverage universe was applied and the period of analysis was from 2002 to 2015. Below are some takeaways from the combined studies as well as the PRI’s commentary on the findings.
ESG FACTORS DEMONSTRATE MEANINGFUL EFFICACY AS MEASURED BY EQUITY VALUATIONS
■ Stocks that ranked within the top third by ESG scores outperformed stocks in the bottom third by 18 percentage points in the 2005 to 2015 period.
■ Relative to other fundamental factors, ESG was a better signal of future earnings volatility, based on findings that the higher the ESG quintile ranking, the lesser the median change in EPS volatility over the next five years.
■ The relative enterprise value/EBITDA ratio for companies within the highest decile by overall current ESG score relative to that of the bottom decile expanded from 2005 to 2016.
■ Governance has impacted valuations, as companies with factors considered to be negative to shareholders, such as zero voting rights, experienced a meaningful compression in their P/E and P/B ratios relative to the market, and those with positive factors such as no dividend cuts and no dilutive equity capital raises experienced a large expansion in their P/E ratios, relative to the market, in the last seven years.
These results appear to statistically validate the value proposition of investing in the stock of companies with superior ESG profiles, as measured by equity valuations. Similarly, the results demonstrate that ESG integration is an effective risk mitigation technique, as companies that rank higher on ESG attributes historically have exhibited lower risks based on price and earnings volatility (and even bankruptcy risk) compared to their lower-ranked peers.
ESG FACTORS DEMONSTRATE VARYING DEGREES OF EFFICACY ACROSS MARKET CAPITALIZATION RANKINGS, SUSTAINABILITY PILLARS AND INDUSTRY GROUPS IN EQUITIES INVESTING
■ Assessing ESG efficacy while adjusting for size based on market capitalization provides an important perspective into the magnitude of size biases, as larger (smaller) companies tend to have higher (lower) ESG ranks. BofA Merrill Lynch Global Research ranked its US coverage universe by ESG scores across quintiles within four size segments, and then assessed performance spreads (returns between highest ESG ranked quintile [Q1] and the lowest ESG ranked quintile [Q5]). The findings showed that performance spreads based on overall ESG score were positive across all four size segments, with the smallest performance spread in the top quartile by size (largest companies) and largest spread in the second quartile by size, followed by the third and then fourth quartiles by size.
■ Additionally, performance spreads were generally equal to or higher for E and S scores individually than for G scores across all size quartiles.
■ Performance spreads across sectors showed inconsistent results across individual E, S and G as well as overall ESG scores, and even showed large negative, counterintuitive results in the consumer staples, healthcare and technology sectors.
Evaluating ESG efficacy adjusting for size appears to reveal that ESG factors, while in general are additive to financial performance, do not contribute to returns consistently across companies with different size profiles. As such, it is important to look at ESG performance in terms of trending as well as absolute point-in-time scores. Alpha opportunities may either be present in a company with a meaningful year-over-year improvement in ESG score or high absolute ESG score, depending on its size profile. The results also showed that performance spreads (based on the highest versus lowest ranked stocks by overall ESG score) were positive across the E and S pillars, but performance based on G scores was not as consistent. Finally, the study uncovered counterintuitive results in performance spreads within certain sectors. The results highlight the need to recognize that certain ESG factors are more relevant and impactful in certain industries than others. SASB (Sustainability Accounting Standards Board) has developed standards that allow for comparability across industries and a framework of materiality-focused, industry-specific key performance indicators.
BOFA MERRILL LYNCH GLOBAL RESEARCH’S ESG IN EQUITIES INVESTING STUDY
FINANCIAL PERFORMANCE OF ESG INTEGRATION IN US INVESTING | 2018
15
The three empirical studies collectively demonstrate that ESG factors are materially linked to both equities and fixed income performance. The three studies also provide a multi-dimensional view of the varying degrees of ESG efficacy across geographic regions, sustainability pillars, market capitalization and credit quality rankings, as well as industry classifications. The results suggest that attractive investment opportunities can be capitalized on in US companies through the use of ESG integration, with certain sustainability factors, fundamental profiles and sectors having greater financial materiality than others.
CONCLUSION
RESPONSIBLE INVESTMENT RESOURCES ■ A practical guide to ESG integration for equity
investing A guide on how to incorporate ESG factors in equity investment strategies, including fundamental, quantitative, smart beta and passive investments.
■ Fixed income investor guide A guide on how to incorporate ESG factors in fixed income.
■ Investment Policy: Process and Practice – A guide for asset owners A guide on how to incorporate ESG factors into investment policy.
For more information, contact Chris Fowle ([email protected]) or visit our website, www.unpri.org.
Empirical Studies:
■ Yuliya Plyakha et. al. Analysis for the PRI: ESG Momentum and Tilt in Portfolio Construction. MSCI: October 2017.
■ Kim Nguyen-Taylor et. al. The ESG Advantage in Fixed Income Investing: An Empirical Analysis. Calvert Research and Management: July 2015
■ Savita Subramanian et. al. ESG: Good Companies Can Make Good Stocks. BofA Merrill Lynch Global Research: December 2016.
■ Savita Subramanian et. al. ESG Part II: A Deeper Dive. BofA Merrill Lynch Global Research: June 2017.
CREDITSThis report has been prepared by Kim Nguyen-Taylor (Senior Consultant) and Will Martindale (Head of Policy, PRI)

The PRI is an investor initiative in partnership withUNEP Finance Initiative and the UN Global Compact.
United Nations Global Compact
The United Nations Global Compact is a call to companies everywhere to align their operations and strategies with ten universally accepted principles in the areas of hu-man rights, labour, environment and anti-corruption, and to take action in support of UN goals and issues embodied in the Sustainable Development Goals. The UN Global Compact is a leadership platform for the development, implementation and disclosure of responsible corporate practices. Launched in 2000, it is the largest cor-porate sustainability initiative in the world, with more than 8,800 companies and 4,000 non-business signatories based in over 160 countries, and more than 80 Local Networks.
More information: www.unglobalcompact.org
United Nations Environment Programme Finance Initiative (UNEP FI)
UNEP FI is a unique partnership between the United Nations Environment Programme (UNEP) and the global financial sector. UNEP FI works closely with over 200 financial institutions that are signatories to the UNEP FI Statement on Sustainable Development, and a range of partner organisations, to develop and promote linkages between sustainability and financial performance. Through peer-to-peer networks, research and training, UNEP FI carries out its mission to identify, promote, and realise the adoption of best environmental and sustainability practice at all levels of financial institution operations.
More information: www.unepfi.org
The Principles for Responsible Investment (PRI)
The PRI works with its international network of signatories to put the six Principles for Responsible Investment into practice. Its goals are to understand the investment implications of environmental, social and governance (ESG) issues and to support signatories in integrating these issues into investment and ownership decisions. The PRI acts in the long-term interests of its signatories, of the financial markets and economies in which they operate and ultimately of the environment and society as a whole.
The six Principles for Responsible Investment are a voluntary and aspirational set of investment principles that offer a menu of possible actions for incorporating ESG is-sues into investment practice. The Principles were developed by investors, for inves-tors. In implementing them, signatories contribute to developing a more sustainable global financial system.
More information: www.unpri.org