financial integration 2017-2 · ii. the frameworks for regulatory cooperation that facilitate...
TRANSCRIPT
Barriers to entry and financial integration in Asia and RCEP countries
Page 1
Australian Centre for Financial Studies +61 3 9666 1050 | australiancentre.com.au
This paper seeks to inform those interested in the Regional Comprehensive Economic
Partnership (RCEP) trade agreement on two topics:
• i. the barriers to trade in financial services and
• ii. the frameworks for regulatory cooperation that facilitate financial integration.
Barriers to entry and financial integration in Asia and RCEP countries Prepared for the project: Financial Integration in the Asia-Pacific Author: Alex Erskine
Financial Integration in the Asia-Pacific
Page 2
Australian Centre for Financial Studies +61 3 9666 1050 | australiancentre.com.au
ABSTRACT This paper seeks to inform those interested in the Regional Comprehensive Economic
Partnership (RCEP) trade agreement on two topics:
i. the barriers to trade in financial services and
ii. the frameworks for regulatory cooperation that facilitate financial integration.
Firstly, it outlines the analysis available on RCEP and other countries’ barriers to trade in
financial services and compares the extent of such industry protection with a range of factors
that are often thought to drive such restrictions. These include a country’s economic and
financial development and its chosen policy regimes for the exchange rate, consumer
protection and systemic risk. The paper finds for instance that the extent of barriers to trade
in financial services seems to vary more according to a country’s exchange rate regime than
its consumer protection or systemic risk regimes. It also finds that some RCEP countries are
more restrictive regarding trade in financial services than the average of all countries that have
adopted the same exchange rate regime. Particularly as RCEP countries transition from fixed
to floating exchange rates, some cooperation between regulators and policymakers to review
what barriers remain necessary would be appropriate.
Secondly, it compares two case studies, the Asia Region Funds Passport and the ASEAN
frameworks for financial integration, as well as other frameworks promoting financial
integration through cooperation between financial regulators. RCEP has greater chance of
making a difference if it establishes a mechanism for progressing financial services
liberalisation and integration that involves negotiators, regulators and the private sector and
encourages countries to opt in to a stipulated timetable for effective dialogue on opportunities
to lower existing high barriers to trade. Such dialogue requires sustained input by all parties
to make region-wide trade facilitation effective and achieve its benefits. However, negotiators
may bear in mind that unilateral reforms to reduce barriers to trade in financial services would
be simpler and quicker, only requiring explanation to trading partners.

Barriers to entry and financial integration in Asia and RCEP countries
Page 3
Australian Centre for Financial Studies +61 3 9666 1050 | australiancentre.com.au
FINANCIAL INTEGRATION IN THE ASIA-PACIFIC In June 2015 the Australian Centre for Financial Studies (ACFS) launched a project on
financial integration in the Asia-Pacific. This study of barriers to entry and financial integration
in Asia and RCEP countries by Alex Erskine is one major component.
THE AUTHOR Alex Erskine leads Erskinomics Consulting and is an ACFS Associate, after a career most
recently with ASIC and earlier with Citibank (in Australia and Asia), Prime Minister & Cabinet,
the EIU and the RBA. He taught on the economics of financial markets for MAFC 2000-08.
Projects on improving the flow of finance include a study of illicit financial flows commissioned
by Bank of Tanzania and funded by Norway, 2014-16; the ACFS ‘Funding Australia’s Future’
paper on Regulating the Australian Financial System, 2014; AusAID-and-GTZ-funded reports
and training on banking sector international integration for State Bank of Viet Nam, 2004-08;
an ASEAN-Australia AADCP study on Liberalizing Capital Movements in the ASEAN Region,
2002-03; and an AusAID capacity building project for Thailand’s finance agencies, 2001-02.
ACKNOWLEDGEMENTS The author is grateful for the support and assistance of the ACFS, the Steering Committee
chaired by Mark Johnson AO and the project’s stakeholders. The author is in debt to Amy
Auster, Martin Foo and Eliana Maddock from ACFS for assistance and to Rod Maddock, David
Norman and Geoff Weir for detailed comments and suggestions. The views in the paper and
all errors are the responsibility of the author.
SUPPORTERS

Financial Integration in the Asia-Pacific
Page 4
Australian Centre for Financial Studies +61 3 9666 1050 | australiancentre.com.au
CONTENTS Abbreviations, acronyms and glossary ............................................................................. 6
Executive Summary .......................................................................................................... 10
1. Introduction ................................................................................................................... 12
1.1 The objectives for this paper ......................................................................................... 12
1.2 Background on RCEP and RCEP countries .................................................................. 12
Economic partnerships ................................................................................................................. 12
Economic and financial development ........................................................................................... 14
1.3 The potential benefit of lesser barriers to international trade in financial services .......... 17
Introducing indices comparing barriers to trade in services, especially financial services .......... 17
1.4 Background on trade in financial services ..................................................................... 20
The modes of supply of services in international trade ................................................................ 20
Data on international trade in financial services ........................................................................... 21
Commercial presence as an indicator of financial integration ...................................................... 26
2. Barriers to trade in financial services in RCEP countries .......................................... 28
2.1 Background on the “noodle bowl” .................................................................................. 29
Databases to cut through the “noodle bowl” ................................................................................ 30
Development outcomes and barriers to trade in financial services .............................................. 36
2.2 Drivers of barriers to trade in financial services ............................................................. 38
The “prudential carve-out” ............................................................................................................ 38
Typologies of the policy regimes within the ambit of the “prudential carve-out” .......................... 40
2.3 Insights from exchange rate regimes............................................................................. 42
More detail on exchange rate regimes and barriers to trade in financial services ....................... 45
2.4 Insights from consumer protection regimes ................................................................... 52
2.5 Insights from systemic risk regimes ............................................................................... 53
2.6 Observations from the ERIA Coverage Index and Hoekman Index ............................... 57

Barriers to entry and financial integration in Asia and RCEP countries
Page 5
Australian Centre for Financial Studies +61 3 9666 1050 | australiancentre.com.au
ERIA’s Coverage Index ................................................................................................................ 57
ERIA’s Hoekman Index ................................................................................................................ 60
2.6 Summary on reducing “unnecessary” barriers to trade in financial services .................. 62
3. Institutional arrangements promoting financial integration ...................................... 63
3.1 The global and regional regulatory structure for financial services ................................ 63
3.2 Regionally-driven financial services regulatory cooperation and integration .................. 65
Case study A. Asia Region Funds Passport ................................................................................ 65
Case study B. ASEAN initiatives on financial integration ............................................................. 68
3.3 Regulatory and other cooperation arising from trade agreements ................................. 74
3.4 Other possibilities for increasing the effectiveness of regulatory cooperation ................ 75
Economic cooperation .................................................................................................................. 76
Technical assistance .................................................................................................................... 77
Public sector-private sector dialogue ........................................................................................... 77
3.5 Further options for engagement leading to increased regulatory cooperation in RCEP . 77
Asia Region Funds Passport ........................................................................................................ 78
FinTech ......................................................................................................................................... 78
Financial inclusion ........................................................................................................................ 79
Improvements in data on trade in financial services .................................................................... 79
4: Conclusion – a need to drive effectiveness ................................................................ 80
ANNEX 1. Global and regional financial services regulation ......................................... 84
A1.1 Oversight of financial services policy and regulation ................................................... 84
A1.2 Banking ...................................................................................................................... 85
A1.3 Insurance .................................................................................................................... 88
A1.4 Securities .................................................................................................................... 89
A1.5 AML/CFT .................................................................................................................... 90
Financial Integration in the Asia-Pacific
Page 6
Australian Centre for Financial Studies +61 3 9666 1050 | australiancentre.com.au
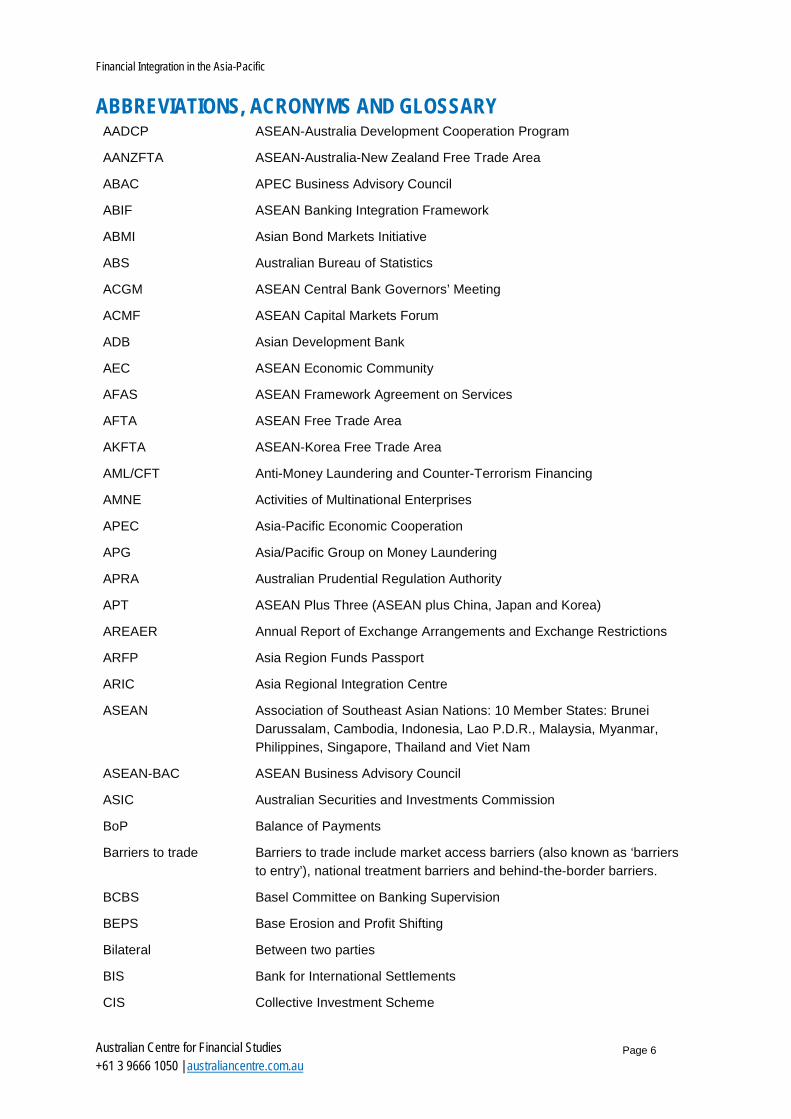
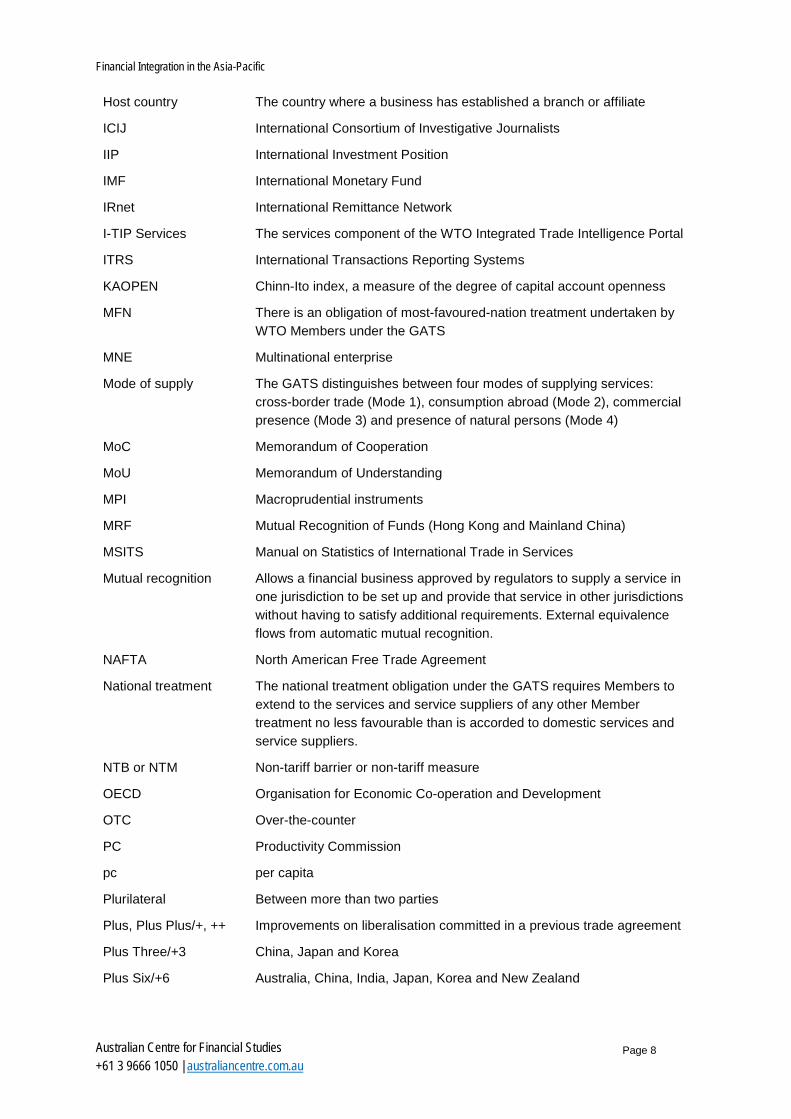
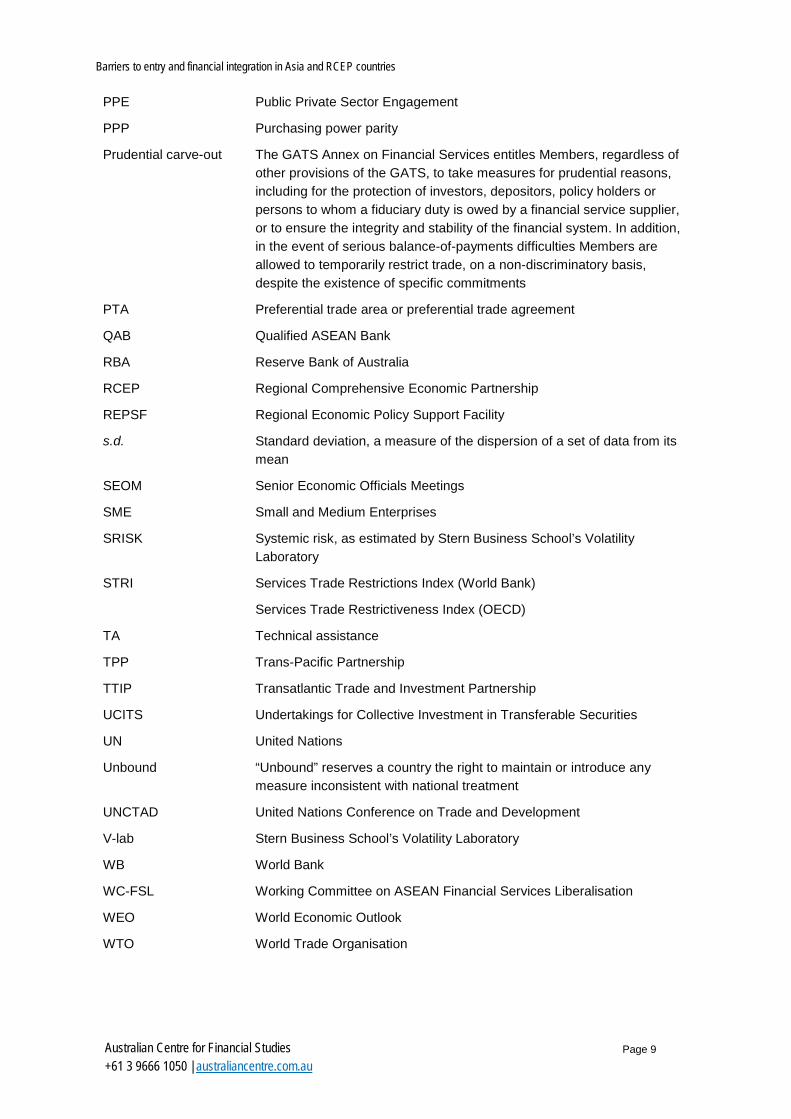
ABBREVIATIONS, ACRONYMS AND GLOSSARY AADCP ASEAN-Australia Development Cooperation Program
AANZFTA ASEAN-Australia-New Zealand Free Trade Area
ABAC APEC Business Advisory Council
ABIF ASEAN Banking Integration Framework
ABMI Asian Bond Markets Initiative
ABS Australian Bureau of Statistics
ACGM ASEAN Central Bank Governors’ Meeting
ACMF ASEAN Capital Markets Forum
ADB Asian Development Bank
AEC ASEAN Economic Community
AFAS ASEAN Framework Agreement on Services
AFTA ASEAN Free Trade Area
AKFTA ASEAN-Korea Free Trade Area
AML/CFT Anti-Money Laundering and Counter-Terrorism Financing
AMNE Activities of Multinational Enterprises
APEC Asia-Pacific Economic Cooperation
APG Asia/Pacific Group on Money Laundering
APRA Australian Prudential Regulation Authority
APT ASEAN Plus Three (ASEAN plus China, Japan and Korea)
AREAER Annual Report of Exchange Arrangements and Exchange Restrictions
ARFP Asia Region Funds Passport
ARIC Asia Regional Integration Centre
ASEAN Association of Southeast Asian Nations: 10 Member States: Brunei Darussalam, Cambodia, Indonesia, Lao P.D.R., Malaysia, Myanmar, Philippines, Singapore, Thailand and Viet Nam
ASEAN-BAC ASEAN Business Advisory Council
ASIC Australian Securities and Investments Commission
BoP Balance of Payments
Barriers to trade Barriers to trade include market access barriers (also known as ‘barriers to entry’), national treatment barriers and behind-the-border barriers.
BCBS Basel Committee on Banking Supervision
BEPS Base Erosion and Profit Shifting
Bilateral Between two parties
BIS Bank for International Settlements
CIS Collective Investment Scheme
Barriers to entry and financial integration in Asia and RCEP countries
Page 7
Australian Centre for Financial Studies +61 3 9666 1050 | australiancentre.com.au
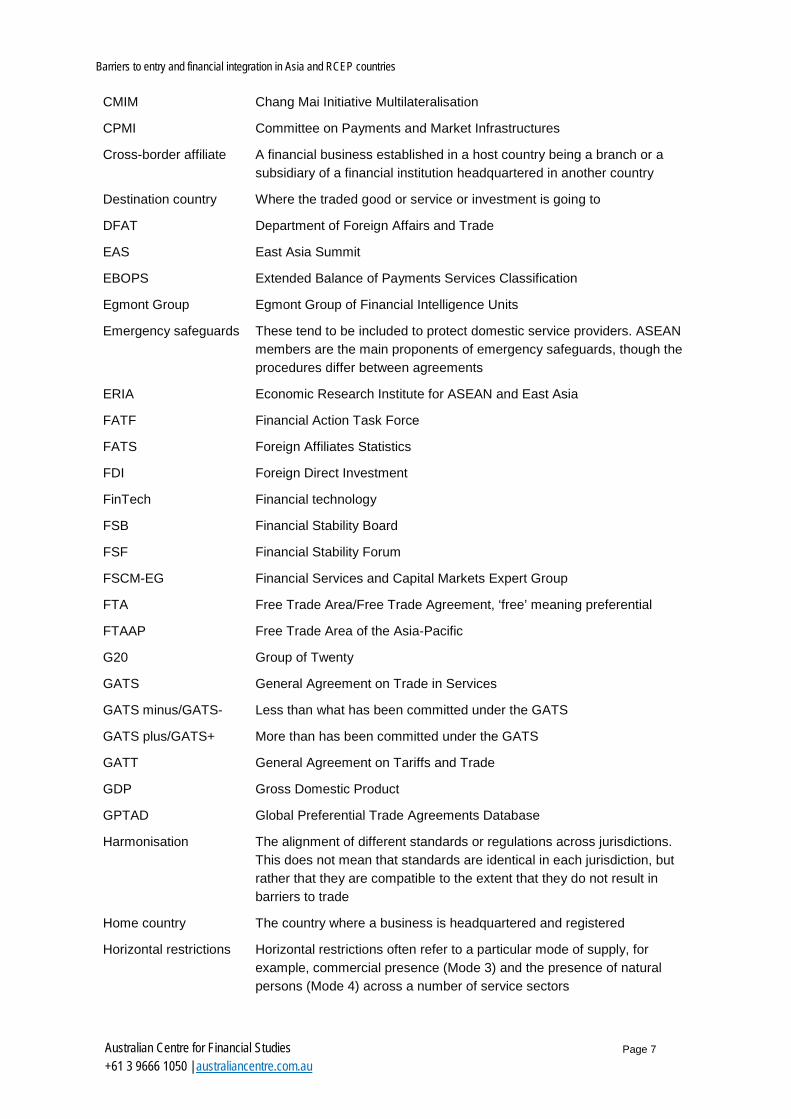
CMIM Chang Mai Initiative Multilateralisation
CPMI Committee on Payments and Market Infrastructures
Cross-border affiliate A financial business established in a host country being a branch or a subsidiary of a financial institution headquartered in another country
Destination country Where the traded good or service or investment is going to
DFAT Department of Foreign Affairs and Trade
EAS East Asia Summit
EBOPS Extended Balance of Payments Services Classification
Egmont Group Egmont Group of Financial Intelligence Units
Emergency safeguards These tend to be included to protect domestic service providers. ASEAN members are the main proponents of emergency safeguards, though the procedures differ between agreements
ERIA Economic Research Institute for ASEAN and East Asia
FATF Financial Action Task Force
FATS Foreign Affiliates Statistics
FDI Foreign Direct Investment
FinTech Financial technology
FSB Financial Stability Board
FSF Financial Stability Forum
FSCM-EG Financial Services and Capital Markets Expert Group
FTA Free Trade Area/Free Trade Agreement, ‘free’ meaning preferential
FTAAP Free Trade Area of the Asia-Pacific
G20 Group of Twenty
GATS General Agreement on Trade in Services
GATS minus/GATS- Less than what has been committed under the GATS
GATS plus/GATS+ More than has been committed under the GATS
GATT General Agreement on Tariffs and Trade
GDP Gross Domestic Product
GPTAD Global Preferential Trade Agreements Database
Harmonisation The alignment of different standards or regulations across jurisdictions. This does not mean that standards are identical in each jurisdiction, but rather that they are compatible to the extent that they do not result in barriers to trade
Home country The country where a business is headquartered and registered
Horizontal restrictions Horizontal restrictions often refer to a particular mode of supply, for example, commercial presence (Mode 3) and the presence of natural persons (Mode 4) across a number of service sectors
Financial Integration in the Asia-Pacific
Page 8
Australian Centre for Financial Studies +61 3 9666 1050 | australiancentre.com.au
Host country The country where a business has established a branch or affiliate
ICIJ International Consortium of Investigative Journalists
IIP International Investment Position
IMF International Monetary Fund
IRnet International Remittance Network
I-TIP Services The services component of the WTO Integrated Trade Intelligence Portal
ITRS International Transactions Reporting Systems
KAOPEN Chinn-Ito index, a measure of the degree of capital account openness
MFN There is an obligation of most-favoured-nation treatment undertaken by WTO Members under the GATS
MNE Multinational enterprise
Mode of supply The GATS distinguishes between four modes of supplying services: cross-border trade (Mode 1), consumption abroad (Mode 2), commercial presence (Mode 3) and presence of natural persons (Mode 4)
MoC Memorandum of Cooperation
MoU Memorandum of Understanding
MPI Macroprudential instruments
MRF Mutual Recognition of Funds (Hong Kong and Mainland China)
MSITS Manual on Statistics of International Trade in Services
Mutual recognition Allows a financial business approved by regulators to supply a service in one jurisdiction to be set up and provide that service in other jurisdictions without having to satisfy additional requirements. External equivalence flows from automatic mutual recognition.
NAFTA North American Free Trade Agreement
National treatment The national treatment obligation under the GATS requires Members to extend to the services and service suppliers of any other Member treatment no less favourable than is accorded to domestic services and service suppliers.
NTB or NTM Non-tariff barrier or non-tariff measure
OECD Organisation for Economic Co-operation and Development
OTC Over-the-counter
PC Productivity Commission
pc per capita
Plurilateral Between more than two parties
Plus, Plus Plus/+, ++ Improvements on liberalisation committed in a previous trade agreement
Plus Three/+3 China, Japan and Korea
Plus Six/+6 Australia, China, India, Japan, Korea and New Zealand
Barriers to entry and financial integration in Asia and RCEP countries
Page 9
Australian Centre for Financial Studies +61 3 9666 1050 | australiancentre.com.au
PPE Public Private Sector Engagement
PPP Purchasing power parity
Prudential carve-out The GATS Annex on Financial Services entitles Members, regardless of other provisions of the GATS, to take measures for prudential reasons, including for the protection of investors, depositors, policy holders or persons to whom a fiduciary duty is owed by a financial service supplier, or to ensure the integrity and stability of the financial system. In addition, in the event of serious balance-of-payments difficulties Members are allowed to temporarily restrict trade, on a non-discriminatory basis, despite the existence of specific commitments
PTA Preferential trade area or preferential trade agreement
QAB Qualified ASEAN Bank
RBA Reserve Bank of Australia
RCEP Regional Comprehensive Economic Partnership
REPSF Regional Economic Policy Support Facility
s.d. Standard deviation, a measure of the dispersion of a set of data from its mean
SEOM Senior Economic Officials Meetings
SME Small and Medium Enterprises
SRISK Systemic risk, as estimated by Stern Business School’s Volatility Laboratory
STRI Services Trade Restrictions Index (World Bank)
Services Trade Restrictiveness Index (OECD)
TA Technical assistance
TPP Trans-Pacific Partnership
TTIP Transatlantic Trade and Investment Partnership
UCITS Undertakings for Collective Investment in Transferable Securities
UN United Nations
Unbound “Unbound” reserves a country the right to maintain or introduce any measure inconsistent with national treatment
UNCTAD United Nations Conference on Trade and Development
V-lab Stern Business School’s Volatility Laboratory
WB World Bank
WC-FSL Working Committee on ASEAN Financial Services Liberalisation
WEO World Economic Outlook
WTO World Trade Organisation

Financial Integration in the Asia-Pacific
Page 10
Australian Centre for Financial Studies +61 3 9666 1050 | australiancentre.com.au
EXECUTIVE SUMMARY The Regional Comprehensive Economic Partnership Agreement (RCEP) negotiations present
an opportunity to put in place mechanisms that lead to lower barriers to trade in financial
services amongst RCEP countries and increases in financial integration. This paper seeks to
find the more promising mechanisms, through exploring the drivers of existing barriers to trade
in financial services and providing a framework under which productive dialogue may occur.
Part 1 of the study sets the scene regarding the region, the ambition of the RCEP, relevant
characteristics of the RCEP countries themselves and indicators of the extent of barriers to
trade in financial services, as well as background on existing trade in financial services.
It observes that the RCEP countries, though individually diverse, as a grouping have been
successful in economic and financial development and might therefore be expected to have
lower-than-average barriers to trade in financial services. Amongst other matters, it also calls
out the need for better data on trade in financial services, including for sales by foreign
affiliates.
However, the reality is that some RCEP countries have significant barriers to trade in financial
services. Part 2 reviews barriers to trade in financial services in light of the countries’ economic
and financial development and their policy choices regarding three policy regimes that may
allow barriers under the broadly-interpreted “prudential carve-out” in World Trade Organization
(WTO) rules, being the regimes for the exchange rate, consumer protection and systemic
risk.1
The case for focusing the RCEP negotiations on reducing unnecessary restrictions to trade in
financial services is strong: it is in the development interests of all RCEP partners and
particularly for the countries that have unnecessarily high barriers to trade in financial services
to develop pathways to lower the unnecessary barriers. Part 2’s main finding is that the
exchange rate regime adopted by a country often appears to influence the extent of barriers
in place for that economy. As a result, discussions on liberalising trade in financial services
will be deficient unless they take exchange rate regime choices into account.
The lowest-hanging fruit, and the most rewarding in terms of improving development and
growth potential by liberalising barriers to trade in financial services, might be in those
1 The extent of the “prudential carve-out” and balance of payments exemptions is subject to legal dispute but is being interpreted as a broad exemption in recent court tests. See Kevin Gallagher and Leonardo Stanley 2012 Global Financial Reform and Trade Rules: The Need for Reconciliation. Pardee, September http://www.bu.edu/pardee/files/2012/09/Pardee-IIB-024-Sept-2012.pdf as well as Ashly Hope 2016 The prudential carve-out. Trade Law Centre (TRALAC), Discussion, 29 June https://www.tralac.org/discussions/article/9991-the-prudential-carve-out.html and its referenced readings.

Barriers to entry and financial integration in Asia and RCEP countries
Page 11
Australian Centre for Financial Studies +61 3 9666 1050 | australiancentre.com.au
countries that have barriers to trade in financial services that are above average or are
transitioning or plan to transition from an exchange rate regime that is relatively fixed or
managed to a more flexible regime.
Part 3 explores the institutional arrangements promoting financial integration through two case
studies (the Asia Region Funds Passport (ARFP) and ASEAN initiatives for financial
integration) and through reviewing other approaches, to develop lessons for the possible role
of the RCEP negotiations in creating a framework for future cooperation in reducing
unnecessary barriers to trade in financial services and making other advances in financial
development. The ASEAN framework seems particularly slow: even the more focused ARFP
initiative still has not seen a dollar of cross-border investment of retail funds after many years
of engagement. The chief lessons are the need to build focus, timeliness and accountability
in the mechanisms for dialogue and follow-up.
One factor determining what can be done now in the RCEP negotiations is the limited time
remaining for negotiation: though there is no agreed date for RCEP’s conclusion, at the most
recent RCEP Ministerial Meeting (in May 2017), Ministers “stressed that all RCEP Participating
Countries must redouble efforts to translate their political commitments into actions to see
through the RCEP towards a swift conclusion”.2 This constrains efforts for progressing specific
items, especially in terms of liberalising trade in financial services, where uncertainties
including lack of data and other organisational complexities hold back substantive progress
on specific issues during negotiating rounds.
The RCEP negotiators should best establish mechanisms for ongoing annual dialogue, with
responsibilities and accountabilities assigned, and wherever possible bringing in the private
sector to help set priorities.
The conclusion of the paper, in Part 4, recognises the challenge ahead for the RCEP
negotiators and others involved in promoting a reduction in barriers to trade in financial
services amongst RCEP countries and in promoting financial integration. Much will depend on
focused, effective cooperation, driven by timeliness and accountability and relevance to the
countries that are RCEP negotiators, both advanced and developing. In addition, the
conclusion draws attention to the benefits seen for countries transitioning from more fixed or
managed exchange rate regimes to more flexible regimes over time, and that dialogue
2 The Third Regional Comprehensive Economic Partnership (RCEP) Intersessional Ministerial Meeting, 21-22 May 2017, Ha Noi, Viet Nam http://asean.org/storage/2017/05/RCEP-3ISSL-MM-JMS-FINAL-22052017.pdf
Financial Integration in the Asia-Pacific
Page 12
Australian Centre for Financial Studies +61 3 9666 1050 | australiancentre.com.au
between regulators and policymakers on financial-services-trade barriers as that transition
occurs would be worthwhile. An alternative, of unilateral liberalisation, can also be considered.
1. INTRODUCTION Part 1 of the study sets the scene regarding the Asia-Pacific region, the ambition of the
Regional Comprehensive Economic Partnership Agreement (RCEP), relevant characteristics
of the RCEP countries themselves and indicators of the extent of barriers to trade in financial
services, as well as background on existing trade in financial services.
It observes that the RCEP countries, though individually diverse, as a grouping have been
successful in economic and financial development and might therefore be expected to have
lower-than-average barriers to trade in financial services. Amongst other matters, it also calls
out the need for better data on trade in financial services, including for sales by foreign
affiliates.
1.1 The objectives for this paper
Increased regional financial integration has been a long-held goal of Asia-Pacific
governments. There is an opportunity to facilitate increased financial integration amongst the
16 countries that are negotiating the RCEP. This paper seeks to show how the RCEP
negotiators might best facilitate financial integration through focusing on reducing
unnecessarily restrictive barriers to trade in financial services, and to draw out how increasing
the effectiveness of cooperation amongst regulators might contribute.
1.2 Background on RCEP and RCEP countries
Economic partnerships
The RCEP countries at this stage are the 10 Association of Southeast Asian Nations (ASEAN)
countries and the “Plus Six” countries (Australia, China, India, Japan, Korea and New
Zealand), all of whom have (or are negotiating) trade agreements with ASEAN: the RCEP is
intended to be a “super-regional” Free Trade Agreement (FTA), and has been envisaged as
an “ASEAN++ FTA”. The Guiding Principles, agreed in 2012, envisage the RCEP agreement
would include an open accession clause that would enable others will to join the RCEP. RCEP
is thus seen as a possible pathway to a still-wider Free Trade Area of the Asia-Pacific (FTAAP)
which would cover almost all of the 25 or so of the Asia-Pacific countries, as in Figure 1 below.
Barriers to entry and financial integration in Asia and RCEP countries
Page 13
Australian Centre for Financial Studies +61 3 9666 1050 | australiancentre.com.au
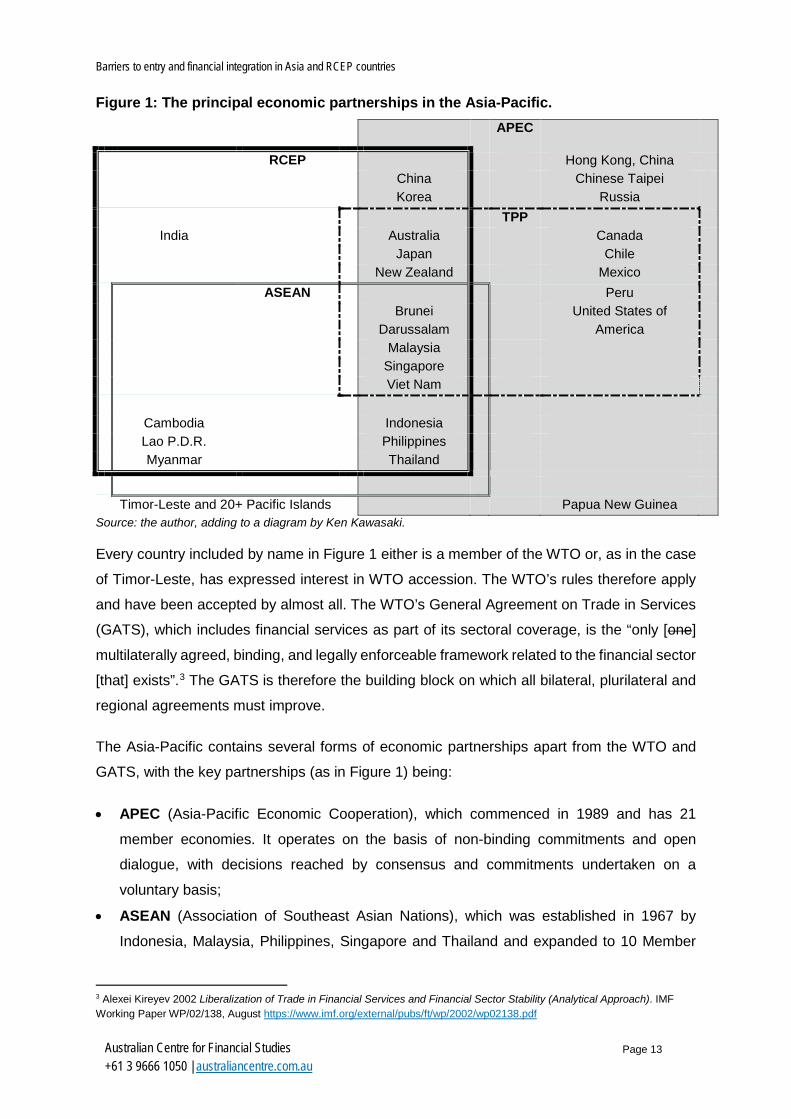
Figure 1: The principal economic partnerships in the Asia-Pacific.
APEC
RCEP Hong Kong, China China Chinese Taipei Korea Russia TPP India Australia Canada Japan Chile New Zealand Mexico ASEAN Peru Brunei
Darussalam United States of
America
Malaysia Singapore Viet Nam Cambodia Indonesia Lao P.D.R. Philippines Myanmar Thailand
Timor-Leste and 20+ Pacific Islands Papua New Guinea
Source: the author, adding to a diagram by Ken Kawasaki.
Every country included by name in Figure 1 either is a member of the WTO or, as in the case
of Timor-Leste, has expressed interest in WTO accession. The WTO’s rules therefore apply
and have been accepted by almost all. The WTO’s General Agreement on Trade in Services
(GATS), which includes financial services as part of its sectoral coverage, is the “only [one]
multilaterally agreed, binding, and legally enforceable framework related to the financial sector
[that] exists”.3 The GATS is therefore the building block on which all bilateral, plurilateral and
regional agreements must improve.
The Asia-Pacific contains several forms of economic partnerships apart from the WTO and
GATS, with the key partnerships (as in Figure 1) being:
• APEC (Asia-Pacific Economic Cooperation), which commenced in 1989 and has 21
member economies. It operates on the basis of non-binding commitments and open
dialogue, with decisions reached by consensus and commitments undertaken on a
voluntary basis;
• ASEAN (Association of Southeast Asian Nations), which was established in 1967 by
Indonesia, Malaysia, Philippines, Singapore and Thailand and expanded to 10 Member
3 Alexei Kireyev 2002 Liberalization of Trade in Financial Services and Financial Sector Stability (Analytical Approach). IMF Working Paper WP/02/138, August https://www.imf.org/external/pubs/ft/wp/2002/wp02138.pdf
Financial Integration in the Asia-Pacific
Page 14
Australian Centre for Financial Studies +61 3 9666 1050 | australiancentre.com.au
States by adding Brunei Darussalam in 1984, Viet Nam in 1995, Lao P.D.R. and Myanmar
in 1997 and Cambodia in 1999. It operates on the basis of what has been called “the
ASEAN way”, favouring consensus over confrontation and process-heavy implementation;
• The TPP (Trans-Pacific Partnership), which was signed in 2015 by 12 countries. However,
its implementation has been at least temporarily derailed by President Trump announcing
on 30 January 2017 that the US would not ratify the TPP. It had set mainly “advanced
country” standards (a so-called “gold standard” agreement that “establishes the new rules
of trade for a new century”) and requires those signing on to commit to have the stipulated
standards at time of joining; and
• The RCEP (Regional Comprehensive Economic Partnership Agreement), for which
negotiations formally commenced in 2012, involving the 10 ASEAN Member States and
the “Plus Six”. With the “Plus Six” all having (or negotiating, in India’s case) FTAs with
ASEAN, it has been generally expected to be negotiated and to build frameworks that
operate broadly along “the ASEAN way”.
The underlying economies are dynamic and diverse, and so the partnership agreements in
practice must continually change and adjust. 4 As Peter Drysdale has said, “a comprehensive
RCEP can aspire to be a model for a global set of principles-based rules for managing trade
and other forms of international commerce in the 21st century”, provided it “sets principles-
based rules for managing contemporary international commerce and entrenches routine
regional cooperation”.
In time, the RCEP agreement may serve as a “building block” for Asia-Pacific (and even
global) free trade so long as it is broad-based, allows new members, and imposes liberalising
discipline on the multiple systems of rules-of-origin and related measures that complicate trade
and discriminate between insiders and outsiders.
Economic and financial development
It is often said that the extent of barriers to trade in financial services (which are “policies”
pursued by countries) will depend on the individual countries’ economic development and
financial development status. Economic development and financial development themselves
are “outcomes” of many influences, and are not in themselves “policies”.
The development spectrum amongst the 16 RCEP countries is very broad, both within ASEAN
and the “Plus Six”. Figure 2 shows where countries stood in terms of GDP per capita in 2013,
4 See Peter Drysdale 2014 Asia’s economic strategy beyond free trade agreements. East Asia Forum, 9 June and Andrew Elek 2014 RCEP will help get Asian integration back on track. East Asia Forum, 7 June http://www.eastasiaforum.org/2014/06/07/rcep-will-help-get-asian-integration-back-on-track/

Barriers to entry and financial integration in Asia and RCEP countries
Page 15
Australian Centre for Financial Studies +61 3 9666 1050 | australiancentre.com.au
both in current US$ and in Purchasing Power Parity (PPP) US$. While either measure is only
a crude proxy for development status of the 16 countries, what stands out is that countries in
both ASEAN and the “Plus Six” span the full development spectrum.
Figure 2: GDP per capita in 2013 for 189 countries, including all 16 RCEP countries.
Source: IMF World Economic Outlook Database, April 2016.
The RCEP countries are a comparatively prosperous grouping. Figure 2 shows there is a “tail”
of countries with lower gross domestic product (GDP) per capita than even the low-income
group amongst the RCEP countries. Because of their differences in development, the ASEAN
10 are habitually subdivided, including by ASEAN itself, into the six longer-standing – and by
now either more advanced- or middle-income – members, and the four more recent – and still
low-income – members (the so-called CLMV).5 However, the “Plus Six” also span a wide range
of development, from India in the low-income grouping with the CLMV, China in the middle-
income grouping with Indonesia, Malaysia, Philippines and Thailand, to Australia, Japan,
Korea and New Zealand in the advanced-income group with Brunei Darussalam and
Singapore.
This simplifying view drives recognition of a need for at least 2- or 3-speed approaches to
economic, financial and trade policy reform and for capacity building for the countries in the
lower (or lowest) tiers. However, each country is unique, and the approach to regional
5 Cambodia, Lao P.D.P., Myanmar and Viet Nam.

Financial Integration in the Asia-Pacific
Page 16
Australian Centre for Financial Studies +61 3 9666 1050 | australiancentre.com.au
economic, financial and trade policy reform in practice in ASEAN has been multi-speed,
allowing each individual country to proceed with trade policy changes beyond WTO
commitments on its own timetable.
Figure 3 draws on a comprehensive and improved dataset on financial development compiled
by the IMF (see Svirydzenka 2016)6 to confirm that there is a strong association between
economic development (proxied by GDP per capita) and financial development.
Figure 3: GDP per capita and Financial Development for 180 countries, including all 16 RCEP countries.
Source: IMF World Economic Outlook Database, April 2016, and Svirydzenka 2016.
Interestingly, according to the trend line in Figure 3, 13 of the 16 RCEP countries (all except
Brunei Darussalam, Cambodia and Myanmar) rank as more financially developed than is
typical of other countries with equivalent levels of GDP per capita.
To the extent that the level of economic development and the state of financial development
might influence countries’ chosen extent of barriers to trade in financial services, it would seem
the RCEP countries in general are starting from sound development positions compared to
their peers and should be expected a priori to have opted for policies involving relatively low
barriers to trade in financial services.
6 Katsiaryna Svirydzenka 2016 Introducing a New Broad-based Index of Financial Development. IMF Working Paper WP/16/5, January. https://www.imf.org/external/pubs/cat/longres.aspx?sk=43621.0 The index is a composite of nine sub-indices that measure the depth, access and efficiency of countries’ financial institutions and financial markets.
Barriers to entry and financial integration in Asia and RCEP countries
Page 17
Australian Centre for Financial Studies +61 3 9666 1050 | australiancentre.com.au
1.3 The potential benefit of lesser barriers to international trade in financial services
One well-recognised contributor to improved economic and financial development is trade
liberalisation, including for financial services.
Introducing indices comparing barriers to trade in services, especially financial services
It is a great benefit to RCEP negotiators, regulators and industry that a number of research
teams have begun to compile analysis of the provisions of countries’ international trade
regulations and trade agreements covering services sectors, including financial services.
Relevant assessments (more fully introduced later) include:
• The World Bank (WB) Services Trade Restrictions Index (STRI) – estimates available
for 103 advanced and developing countries, including 12 RCEP countries (Australia,
Cambodia, China, India, Indonesia, Japan, Korea, Malaysia, New Zealand, Philippines,
Thailand and Viet Nam);
• The OECD Services Trade Restrictiveness Index (STRI) – estimates available for 42
countries (34 OECD members and 8 developing countries), including 7 RCEP countries
(Australia, China, India, Indonesia, Japan, Korea and New Zealand); and
• The Economic Research Institute for ASEAN and East Asia (ERIA) Coverage Index and the ERIA Hoekman Index – some estimates of the coverage and ambition of
ASEAN+n trade agreements available for 13 RCEP countries (all 10 ASEAN member
states and Australia, China and New Zealand).
Showing the potential value to trade policy of these indices, analysis of the financial services
data from the OECD STRI indicates that trade barriers impact adversely on the financial
services sector and have adverse economy-wide effects, and that lesser barriers to trade
produce better outcomes. See Figure 4 for Commercial Banking and Figure 5 for Insurance.7
7 Nordås, H. K. and Rouzet, D. 2015 The Impact of Services Trade Restrictiveness on Trade Flows: First Estimates. OECD Trade Policy Papers, No. 178, OECD Publishing. http://dx.doi.org/10.1787/5js6ds9b6kjb-en OECD 2014 STRI Sector Brief: Commercial banking. May http://www.oecd.org/tad/services-trade/STRI_commercial_banking.pdf OECD 2014 STRI Sector Brief: Insurance. May http://www.oecd.org/tad/services-trade/STRI_insurance.pdf

Financial Integration in the Asia-Pacific
Page 18
Australian Centre for Financial Studies +61 3 9666 1050 | australiancentre.com.au
Figure 4: OECD STRI and sector performance: Commercial banking.
Source: OECD 2014 Sector Note: Commercial banking. Note: Categories defined relative to the average ± 0.5 s.d.
Figure 4 illustrates that, on average, if there is less restrictiveness of international trade in
banking services:
• Domestic credit as a percentage of GDP is higher;
• The net interest margin is lower; and
• Operating expenses of banks are lower.
Figure 5: OECD STRI and sector performance: Insurance.
Source: OECD 2014 Sector Note: Insurance. Note: Categories defined relative to the average ± 0.5 s.d.
Figure 5 shows that, on average, if there is less restrictiveness of international trade in
insurance services:
• Insurance penetration as a percentage of GDP will be higher; and
• Operating expenses as a percentage of insurance gross premiums will be lower.
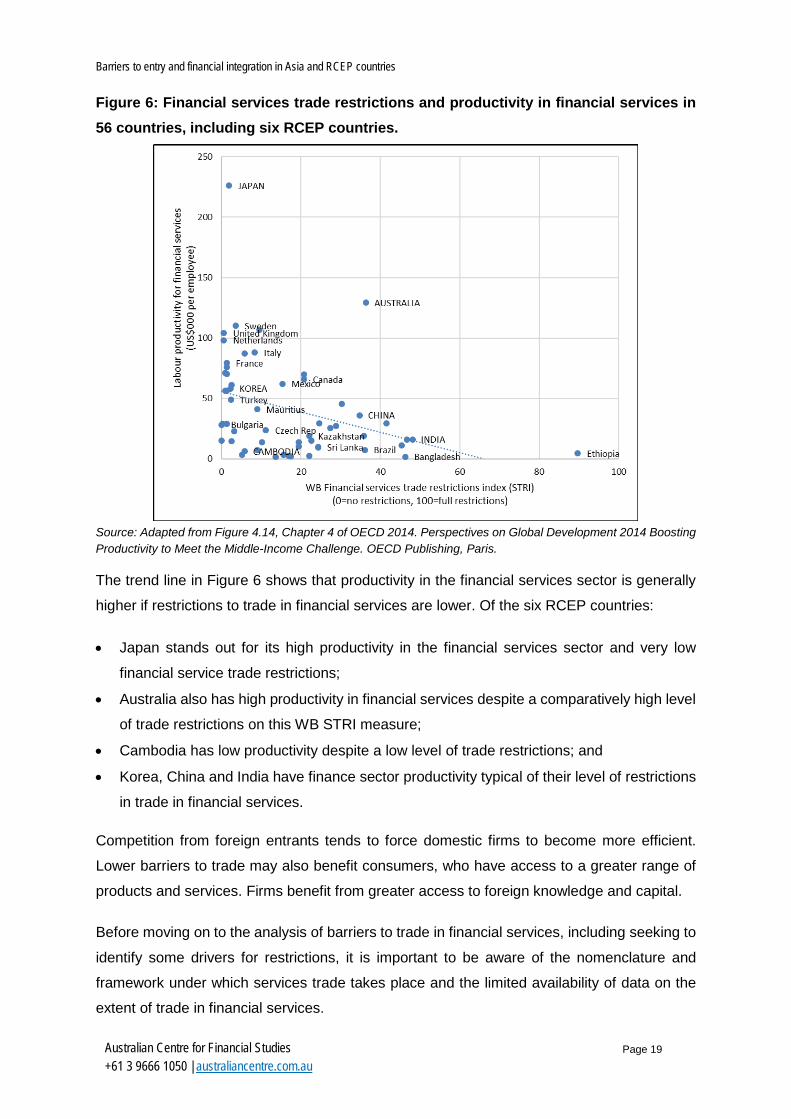
These efficiency benefits of lesser barriers to trade in financial services arise partly from improved productivity in the financial services sector itself. This can be seen in Figure 6, which draws on an OECD comparison of productivity in financial services with the WB STRI for financial services data for 56 countries, including six RCEP countries (Australia, Cambodia, China, India, Japan and Korea).
Barriers to entry and financial integration in Asia and RCEP countries
Page 19
Australian Centre for Financial Studies +61 3 9666 1050 | australiancentre.com.au
Figure 6: Financial services trade restrictions and productivity in financial services in 56 countries, including six RCEP countries.
Source: Adapted from Figure 4.14, Chapter 4 of OECD 2014. Perspectives on Global Development 2014 Boosting Productivity to Meet the Middle-Income Challenge. OECD Publishing, Paris.
The trend line in Figure 6 shows that productivity in the financial services sector is generally
higher if restrictions to trade in financial services are lower. Of the six RCEP countries:
• Japan stands out for its high productivity in the financial services sector and very low
financial service trade restrictions;
• Australia also has high productivity in financial services despite a comparatively high level
of trade restrictions on this WB STRI measure;
• Cambodia has low productivity despite a low level of trade restrictions; and
• Korea, China and India have finance sector productivity typical of their level of restrictions
in trade in financial services.
Competition from foreign entrants tends to force domestic firms to become more efficient.
Lower barriers to trade may also benefit consumers, who have access to a greater range of
products and services. Firms benefit from greater access to foreign knowledge and capital.
Before moving on to the analysis of barriers to trade in financial services, including seeking to
identify some drivers for restrictions, it is important to be aware of the nomenclature and
framework under which services trade takes place and the limited availability of data on the
extent of trade in financial services.

Financial Integration in the Asia-Pacific
Page 20
Australian Centre for Financial Studies +61 3 9666 1050 | australiancentre.com.au
1.4 Background on trade in financial services
Trade in goods is comparatively easy to define, observe and monitor, as are barriers to trade
in goods and any countervailing actions and compensation.8 Trade in services (and in
particular trade in financial services) is more complicated in every respect.
The modes of supply of services in international trade
Four “Modes of Supply” of services have been identified for United Nations (UN) Services
Trade purposes (see Figure 7):
• Mode 1: Cross-border supply
• Mode 2: Consumption abroad
• Mode 3: Commercial presence
• Mode 4: Presence of natural persons
Figure 7: UN Services Trade Modes of Supply.
Source: United Nations Department of Economic and Social Affairs 2012.9
8 Nevertheless, problems remain even with goods, e.g. in determining where value has been added in a global or regional global supply chain, or in determining appropriate taxation to be levied on earnings from goods traded internationally. These are also issues that are yet to be confronted or resolved in international trade in services. 9 United Nations Department of Economic and Social Affairs 2012 Manual on Statistics of International Trade in Services 2010 (MSITS 2010). ST/ESA/M.86/Rev. 1, p15, Figure II.1 A synthetic view of modes of supply. http://unstats.un.org/unsd/tradeserv/tfsits/msits2010/docs/MSITS%202010%20M86%20(E)%20web.pdf
Barriers to entry and financial integration in Asia and RCEP countries
Page 21
Australian Centre for Financial Studies +61 3 9666 1050 | australiancentre.com.au
Data on international trade in financial services
The adage that “you cannot manage what you cannot measure” afflicts efforts to prioritise and
liberalise trade in financial services. There is a lack of comprehensive trade statistics for
financial services. One reason is that the Balance of Payments (BoP) seeks to record
transactions between residents and non-residents: therefore, services trade transactions
taking place through commercial presence (Mode 3) or the presence of natural persons (Mode
4) are not recorded directly as exports or imports. Instead, net income earned by businesses
with commercial presence (that is, supply through Mode 3), as well as the interest, dividends
and earnings by temporary presence of natural persons (that is, Mode 4), should be recorded
as income in the Current Account of the BoP, and flows of capital invested by the foreign
owner (debt or equity) are recorded in the Capital & Financial Account of the BoP and the
countries’ International Investment Positions (IIP). All the data are patchy and outdated.
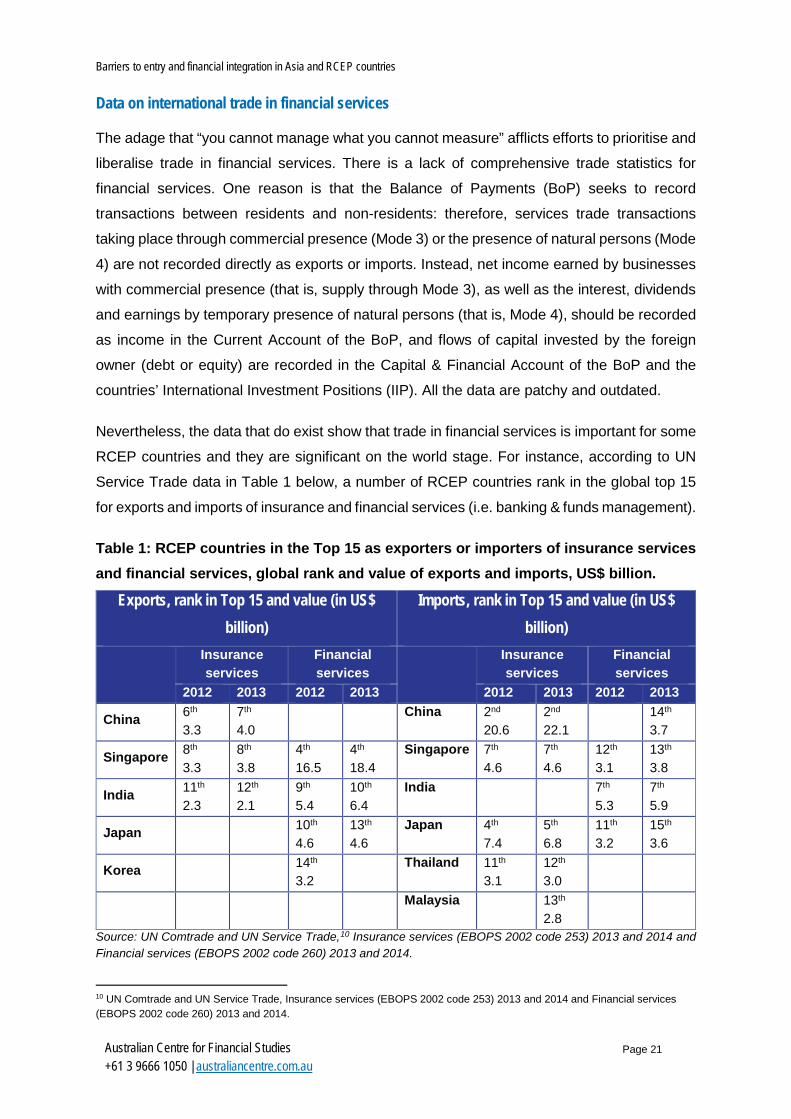
Nevertheless, the data that do exist show that trade in financial services is important for some
RCEP countries and they are significant on the world stage. For instance, according to UN
Service Trade data in Table 1 below, a number of RCEP countries rank in the global top 15
for exports and imports of insurance and financial services (i.e. banking & funds management).
Table 1: RCEP countries in the Top 15 as exporters or importers of insurance services and financial services, global rank and value of exports and imports, US$ billion.
Exports, rank in Top 15 and value (in US$ billion)
Imports, rank in Top 15 and value (in US$ billion)
Insurance services
Financial services
Insurance services
Financial services
2012 2013 2012 2013 2012 2013 2012 2013
China 6th 3.3
7th 4.0
China 2nd
20.6 2nd 22.1
14th 3.7
Singapore 8th 3.3
8th 3.8
4th
16.5 4th 18.4
Singapore 7th 4.6
7th 4.6
12th 3.1
13th 3.8
India 11th 2.3
12th 2.1
9th 5.4
10th 6.4
India 7th 5.3
7th 5.9
Japan 10th 4.6
13th 4.6
Japan 4th 7.4
5th 6.8
11th 3.2
15th 3.6
Korea 14th 3.2
Thailand 11th
3.1 12th 3.0
Malaysia 13th 2.8
Source: UN Comtrade and UN Service Trade,10 Insurance services (EBOPS 2002 code 253) 2013 and 2014 and Financial services (EBOPS 2002 code 260) 2013 and 2014.
10 UN Comtrade and UN Service Trade, Insurance services (EBOPS 2002 code 253) 2013 and 2014 and Financial services (EBOPS 2002 code 260) 2013 and 2014.

Financial Integration in the Asia-Pacific
Page 22
Australian Centre for Financial Studies +61 3 9666 1050 | australiancentre.com.au
Of course, whether these high global rankings are the reality depends not only on the data
from RCEP countries but also on the data supplied by the rest of the world: both appear to be
lacking. Ranking may be questionable but trade amongst RCEP countries is important.
Table 2 below shows that RCEP countries’ insurance trade has been increasing through the
last decade, and that most of the RCEP countries are net importers of insurance services (only
India and Singapore are recorded as net exporters).
Table 2: RCEP countries’ exports and imports of insurance services, US$ million.
Exports Imports
2005 2010 2012 2013 2005 2010 2012 2013
Australia 529.5 308.2 473.2 490.4 676.3 588.0 726.9 795.5
China 549.4 1,726.9 3,329.2 3,996.2 7,199.6 15,754.6 20,600.1 22,092.7
India 941.0 1,782.0 2,257.0 2,144.1 856.0 1,425.0 1,441.4 1,142.3
Japan 825.0 1,284.8 -406.0 177.1 1,833.2 6,860.9 7,583.3 6,751.9
Korea 168.7 515.0 494.6 640.9 732.7 882.4 828.2 812.1
New Zealand 27.5 22.3 34.0 240.9 214.8 509.6
Total “Plus Six” 3,041.0 5,639.2 6,182.1 7,448.6 11,538.6 25,725.6 31,689.5 31,594.6
Brunei Darussalam na na Na na na na na na
Indonesia 14.8 22.2 24.0 24.8 338.3 1,153.3 1,096.5 1,053.7
Malaysia 278.6 330.5 538.5 449.2 523.6 2,181.0 2,880.6 2,764.8
Philippines 17.0 77.0 90.0 92.3 203.0 311.0 364.0 809.9
Singapore 1,391.8 3,539.4 3,253.1 3,767.7 2,036.3 4,044.7 4,571.1 4,614.6
Thailand 39.6 66.6 382.1 230.8 1,431.8 2,162.2 3,071.7 2,976.7
Total long-standing ASEAN
1,741.7 4,035.7 4,287.8 4,564.8 4,532.9 9,852.2 11,983.8 12,219.8
Cambodia 0.8 1.0 1.4 0.7 28.9 47.2 94.3 104.8
Lao P.D.R. 2.9 10.9 3.8 8.7 13.2 42.3
Myanmar 0.0 0.0 3.8 0.0 0.0 84.8 103.5
Viet Nam 45.0 70.0 64.0 60.0 249.0 481.0 583.0 911.0
Total recent ASEAN 48.8 82.0 73.0 60.7 286.6 541.4 804.4 1,119.3
Total RCEP countries 4,831.5 9,756.9 10,542.9 12,074.2 16,358.0 36,119.2 44,477.7 44,933.6
Source: author downloads from UN Comtrade Database for “services”, classification EBOPS 2002, Insurance services (EBOPS 2002 code 253).
http://comtrade.un.org/pb/downloads/2013/Services%20Pages/Insurance%20-%20code%20253.pdf http://comtrade.un.org/pb/downloads/2014/Services%20Pages/IB532014.pdf http://comtrade.un.org/pb/downloads/2013/Services%20Pages/Financial%20-%20code%20260.pdf http://comtrade.un.org/pb/downloads/2014/Services%20Pages/IB602014.pdf

Barriers to entry and financial integration in Asia and RCEP countries
Page 23
Australian Centre for Financial Studies +61 3 9666 1050 | australiancentre.com.au
Table 3 below shows that RCEP countries’ trade in financial services (in the UN EBOPS,
Extended Balance of Payments, terminology this is banking, funds management and other
financial services excluding insurance) also has been increasing through the last decade. Only
Australia, Japan and – especially – Singapore are habitual net exporters.
Table 3: RCEP countries’ exports and imports of financial services, US$ million.
Exports Imports
2005 2010 2012 2013 2005 2010 2012 2013
Australia 762.9 1,809.9 2,526.5 408.4 869.7 1,296.5
China 145.2 1,331.1 1,886.0 3,185.1 159.5 1,387.3 1,925.7 3,691.0
India 1,143.0 5,834.0 5,351.2 6,375.9 869.0 6,787.0 5,343.0 5,892.8
Japan 4,818.1 3,639.1 4,770.6 4,561.2 2,569.7 3,177.9 3,311.8 3,612.6
Korea 1,650.9 2,736.0 3,192.0 1,294.3 235.1 843.1 1,011.7 1,692.4
New Zealand 87.3 100.9(e) 459.2 126.1 108.8 342.7
Total “Plus Six” 8,607.5 13,641.1 17,468.8 17,942.9 4,367.7 12,304.1 12,804.7 16,185.3
Brunei Darussalam na na na na na na na na
Indonesia 367.2 332.2 189.1 213.0 539.1 449.9 486.4 480.5
Malaysia 59.2 194.3 323.0 317.8 109.6 482.9 521.8 454.9
Philippines 53.0 38.0 43.0 37.9 93.0 74.0 113.0 82.7
Singapore 4,604.7 12,224.1 16,496.6 18,355.4 916.1 2,564.6 3,135.1 3,758.3
Thailand 71.8 185.9 372.2 445.2 151.1 116.8 386.2 311.2
Total long-standing ASEAN
5,155.8 12,974.5 17,423.8 19,369.3 1,808.9 3,688.3 4,642.4 5,087.6
Cambodia 60.7 62.2 5.5 28.9
Lao P.D.R. 1.4 0.2
Myanmar
Viet Nam 150.0 182.8 175.0 460.0
Total recent ASEAN 212.0 245.0 180.7 488.9
Total RCEP countries
13,763.3 26,615.6 35,104.6 37,557.2 6,176.6 15,992.3 17,627.8 21,761.8
Source: author downloads from UN Comtrade Database for “services”, classification EBOPS 2002, Financial services (EBOPS 2002 code 260).
It would be useful to see more on the size and the direction of trade in insurance and financial
services, within the region and between regions. Unfortunately, few RCEP countries provide
the UN Services Trade database with a full or even partial destination/source listing of their
exports and imports of insurance services and financial services. Only Japan and Singapore
have contributed destination/source data each year and identified more than three
destination/source countries; Korea has contributed more often than Australia and New
Zealand; the other RCEP countries not at all. Thus any data extraction, for example, a matrix

Financial Integration in the Asia-Pacific
Page 24
Australian Centre for Financial Studies +61 3 9666 1050 | australiancentre.com.au
of insurance services trade data from and to RCEP countries, would suffer from an excess of
“white spaces”.11
More data, more up-to-date, from more reporting countries and about more importing
countries, is required for full analysis of trade in financial services, to identify whether the trade
flows do match potential or are impeded by barriers.12
Data on Mode 3 trade (commercial presence) requires special data collection on activities of
foreign affiliates: notable instances are one-off surveys from the Australian Bureau of Statistics
(ABS)13 and the more regular but still very partial production of foreign affiliate statistics (FATS)
by countries for the WTO14 (see two Tables below: Table 4 for the patchy data on RCEP
countries’ inwards and outwards FATS and Table 5 for the more comprehensive data on
United States (US inwards and outwards FATS involving RCEP countries).
Table 4: Foreign affiliates trade in services (US$ millions, WTO data for RCEP countries).
Inwards and outwards FATS 2010 2011 2012
Sales by affiliates of foreign companies (inwards FATS)
China 134.0
India 8.7
Japan 86.2
New Zealand 5.8
Thailand 22.2 35.6 20.3
Viet Nam 4.4 7.4
Sales by foreign affiliates of resident companies (outward FATS)
Australia 23.3
Japan 41.2
Korea 20.9 Source: WTO International Trade Statistics 2015, Tables I. 24 and I. 25 Note: Several footnotes apply, see publication.
11 Equivalent matrices can be compiled for imports of insurance services by Reporting Countries and for exports and imports of commercial banking by Reporting Countries, but similarly lack content. 12 Regarding Table 4, it is not clear what is represented by reported ‘negative’ exports and ‘negative’ imports. 13 ABS 2011 Australian Outward Finance and Insurance Foreign Affiliate Trade, 2009-10. ABS 5485.0 http://www.abs.gov.au/AUSSTATS/[email protected]/mf/5485.0 14 WTO 2015 World Trade Organisation International Trade Statistics 2015 https://www.wto.org/english/res_e/statis_e/its2015_e/its2015_e.pdf
Barriers to entry and financial integration in Asia and RCEP countries
Page 25
Australian Centre for Financial Studies +61 3 9666 1050 | australiancentre.com.au
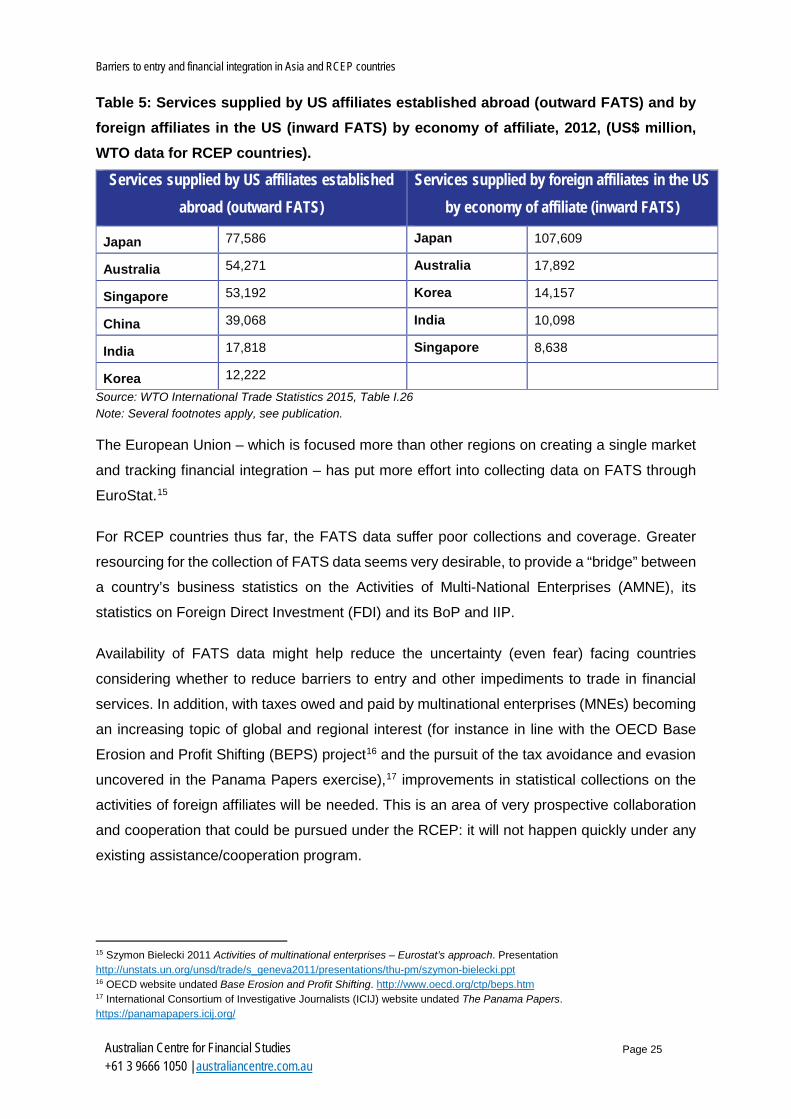
Table 5: Services supplied by US affiliates established abroad (outward FATS) and by foreign affiliates in the US (inward FATS) by economy of affiliate, 2012, (US$ million, WTO data for RCEP countries).
Services supplied by US affiliates established abroad (outward FATS)
Services supplied by foreign affiliates in the US by economy of affiliate (inward FATS)
Japan 77,586 Japan 107,609
Australia 54,271 Australia 17,892
Singapore 53,192 Korea 14,157
China 39,068 India 10,098
India 17,818 Singapore 8,638
Korea 12,222 Source: WTO International Trade Statistics 2015, Table I.26 Note: Several footnotes apply, see publication.
The European Union – which is focused more than other regions on creating a single market
and tracking financial integration – has put more effort into collecting data on FATS through
EuroStat.15
For RCEP countries thus far, the FATS data suffer poor collections and coverage. Greater
resourcing for the collection of FATS data seems very desirable, to provide a “bridge” between
a country’s business statistics on the Activities of Multi-National Enterprises (AMNE), its
statistics on Foreign Direct Investment (FDI) and its BoP and IIP.
Availability of FATS data might help reduce the uncertainty (even fear) facing countries
considering whether to reduce barriers to entry and other impediments to trade in financial
services. In addition, with taxes owed and paid by multinational enterprises (MNEs) becoming
an increasing topic of global and regional interest (for instance in line with the OECD Base
Erosion and Profit Shifting (BEPS) project16 and the pursuit of the tax avoidance and evasion
uncovered in the Panama Papers exercise),17 improvements in statistical collections on the
activities of foreign affiliates will be needed. This is an area of very prospective collaboration
and cooperation that could be pursued under the RCEP: it will not happen quickly under any
existing assistance/cooperation program.
15 Szymon Bielecki 2011 Activities of multinational enterprises – Eurostat’s approach. Presentation http://unstats.un.org/unsd/trade/s_geneva2011/presentations/thu-pm/szymon-bielecki.ppt 16 OECD website undated Base Erosion and Profit Shifting. http://www.oecd.org/ctp/beps.htm 17 International Consortium of Investigative Journalists (ICIJ) website undated The Panama Papers. https://panamapapers.icij.org/
Financial Integration in the Asia-Pacific
Page 26
Australian Centre for Financial Studies +61 3 9666 1050 | australiancentre.com.au
Commercial presence as an indicator of financial integration
Financial integration amongst RCEP countries has been increasing but from a low level. The
predominant feature of international financial interactions of each RCEP country are
transactions with global centres, New York, London, Frankfurt especially. A RCEP country’s
financiers have needed to interact with and (if beneficial) operate in one or two global centres:
they have not needed to invest in learning about lesser centres, including in other RCEP
countries, excepting Singapore and Hong Kong, the two Asia-Pacific intra-regional financial
intermediation centres highlighted by Bank for International Settlements (BIS) research.18
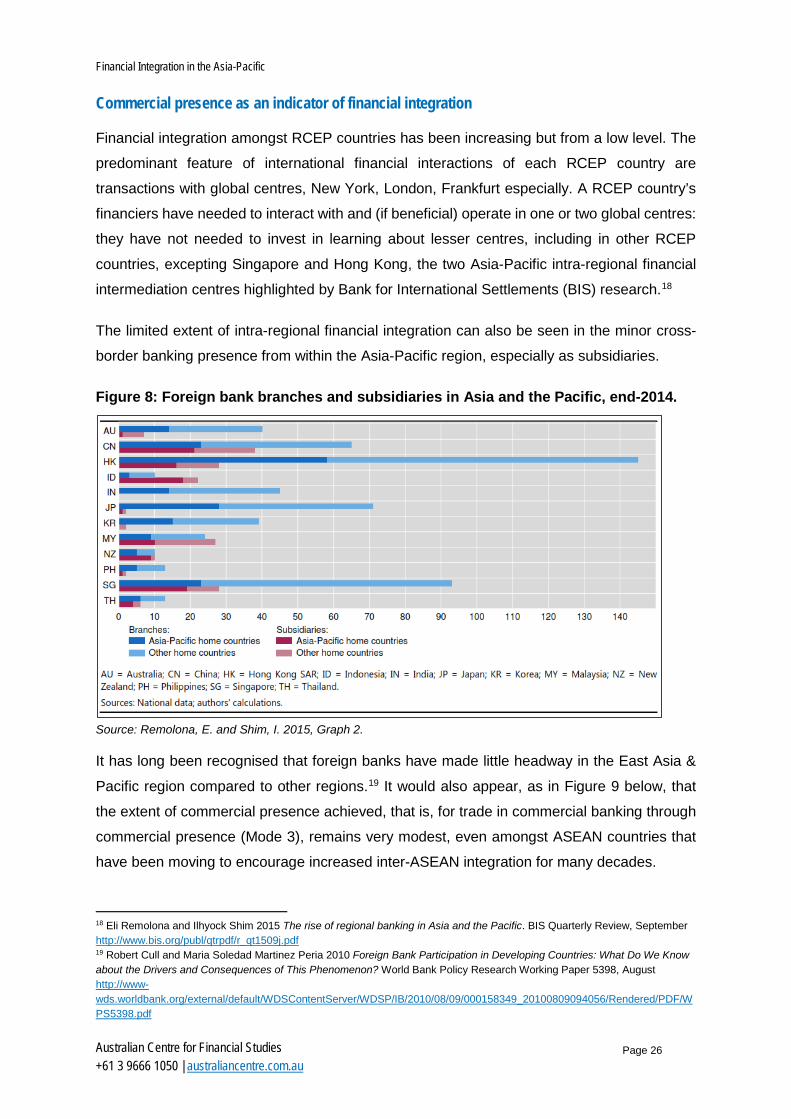
The limited extent of intra-regional financial integration can also be seen in the minor cross-
border banking presence from within the Asia-Pacific region, especially as subsidiaries.
Figure 8: Foreign bank branches and subsidiaries in Asia and the Pacific, end-2014.
Source: Remolona, E. and Shim, I. 2015, Graph 2.
It has long been recognised that foreign banks have made little headway in the East Asia &
Pacific region compared to other regions.19 It would also appear, as in Figure 9 below, that
the extent of commercial presence achieved, that is, for trade in commercial banking through
commercial presence (Mode 3), remains very modest, even amongst ASEAN countries that
have been moving to encourage increased inter-ASEAN integration for many decades.
18 Eli Remolona and Ilhyock Shim 2015 The rise of regional banking in Asia and the Pacific. BIS Quarterly Review, September http://www.bis.org/publ/qtrpdf/r_qt1509j.pdf 19 Robert Cull and Maria Soledad Martinez Peria 2010 Foreign Bank Participation in Developing Countries: What Do We Know about the Drivers and Consequences of This Phenomenon? World Bank Policy Research Working Paper 5398, August http://www-wds.worldbank.org/external/default/WDSContentServer/WDSP/IB/2010/08/09/000158349_20100809094056/Rendered/PDF/WPS5398.pdf

Barriers to entry and financial integration in Asia and RCEP countries
Page 27
Australian Centre for Financial Studies +61 3 9666 1050 | australiancentre.com.au
Figure 9: ASEAN banks operating in other ASEAN countries.
ASEAN Home Country Bank from Home
Country
ASEAN Host Country
ID PH MY SG TH BD CB LP MM VN
TOTA
L
Indonesia (ID) Bank BNI B RO
4 Bank Mandin B Bank BRI B Bank Muamalat B
Philippines (PH) BDO Unibank, Inc. RO 1 Philippine National
Bank B
Malaysia (MY) CIMB S S S B B B RO
23
Maybank S S B S B RO S Maybank Syariah S Hong Leong Bank S S S RHB Bank B B B Public Bank B B B B
Singapore (SG) DBS Bank S RO B RO RO B
14 OCBC Bank S B B B OCBC Al-Amin Bank B UOB Bank S S S S B RO B Bank of Singapore RO
Thailand (TH) Bangkok Bank PLC B B S B B B B B
18
Krung Thai Bank PLC B B B RO Kasikornbank Bank Limited
S RO RO
TMB Bank International
B
Bank of Ayudha PLC B Vinasiam Joint Venture Bank
JV
Siam Commercial Bank PLC
B S B RO
Brunei Darussalam (BD)
Bank Islam Brunei Darussalam Bhd
RO 0
Cambodia (CB) Acieda Bank S S 2
Lao P.D.R. (LP) Lao Viet Bank JV 1
Phongsavanh Bank RO
Myanmar (MM)
Viet Nam (VN) Vietcombank RO
3 Agribank B VietinBank B Lao Viet Bank JV
Total 7 3 6 11 5 3 7 13 2 9 66
Source: Redrawn from 4 March 2016 Presentation by Dr Yati Kurniati, Macroprudential Policy Department, Bank Indonesia on ASEAN Banking Integration Framework.

Financial Integration in the Asia-Pacific
Page 28
Australian Centre for Financial Studies +61 3 9666 1050 | australiancentre.com.au
Notes: B = branch; S = subsidiary; RO = representative office; JV = joint venture; total refers to branches, subsidiaries and joint ventures.
What may be surprising, in view of perceptions of banking and finance potential, is that there
are more branches and subsidiaries of non-host ASEAN-member banks in Lao P.D.R. than in
any other ASEAN member country, even including Singapore. Another perhaps surprising
observation is that there are fewer than six branches/subsidiaries of ASEAN-member banks
on average in each of the (middle- or advanced-income) original ASEAN Six, and almost eight
on average in the (low-income) ASEAN CLMV countries that have joined later: the newcomers
seem more open to trade in financial services.
There are other examples of limited financial sector integration: later in the paper there is a
case study on the Asia Region Funds Passport (ARFP) initiative, which is seeking to increase
integration in the funds management sector amongst Asia-Pacific countries, and another on
the ASEAN approaches to promoting financial sector integration.
2. BARRIERS TO TRADE IN FINANCIAL SERVICES IN RCEP COUNTRIES Part 2 finds the reality is that some RCEP countries have significant barriers to trade in
financial services. It reviews barriers to trade in financial services in light of the countries’
economic and financial development and their trade policy choices regarding three concerns
that permit barriers under the “prudential carve-out” allowed to all countries, these being the
regimes for the exchange rate, consumer protection, and systemic risk.
The case for focusing the RCEP negotiations on reducing unnecessary restrictions to trade in
financial services is strong: it is in the development interests of all RCEP partners and
particularly for the countries that have unnecessarily high barriers to trade in financial services
to develop pathways to lower the unnecessary barriers.
Part 2’s main finding is that the type of exchange rate regime adopted by a country usually
has a discernible influence on the extent of barriers to trade in financial services. As a result,
discussions on liberalising trade in financial services will be more informed if they take current
and likely future exchange rate regime choices into account.
The lowest-hanging fruit, and the most rewarding in terms of assisting those countries to
achieve their development and growth potential, might be those countries that have barriers
to trade in financial services that are above average and are transitioning from an exchange
rate regime that is relatively fixed to a more flexible regime.

Barriers to entry and financial integration in Asia and RCEP countries
Page 29
Australian Centre for Financial Studies +61 3 9666 1050 | australiancentre.com.au
2.1 Background on the “noodle bowl”
Every trade agreement establishes special requirements for trade between the parties,
preferencing insiders over outsiders. Analyses of barriers to trade in financial services in Asia-
Pacific now face a “noodle bowl” of trade agreements, each with different requirements. The
“noodle bowl” is expanding: with more FTAs, both bilateral and plurilateral (see Figure 10).
Figure 10: Number of bilateral and plurilateral trade agreements involving 47 countries monitored by the Asia Regional Integration Centre, including all 16 RCEP countries.
Source: Asian Development Bank (ADB) Asia Regional Integration Centre (ARIC) Database on Free Trade Agreements, Table 3.
The “noodle bowl” was empty in 1975, with only the Asia-Pacific Trade Agreement20 signed
but not yet in effect. By 2000 and 2015 the array has grown and is more complex (Table 6).
Table 6: Free Trade Agreements by status.
YEAR Under negotiation Signed but not yet in effect
Signed and in effect
Total Of which Proposed
Framework agreement
signed
Negotiations launched
Bilateral Plurilateral
1975 0 0 1 0 1 0 1 0
2000 0 6 10 35 51 46 5 3
2015 5 65 10 140 220 158 62 67 Source: Asian Development Bank (ADB) Asia Regional Integration Centre (ARIC) Database on Free Trade Agreements Tables 1 and 3.
20 The Asia-Pacific Trade Agreement, initially known as the Bangkok Agreement, was signed in 1975 as an initiative of United Nations (UN) Economic and Social Commission for Asia and the Pacific (ESCAP). In 2011 the Participating States signed and ratified a Framework Agreement on the Promotion and Liberalization of Trade in Services, following Framework Agreements on Trade Facilitation and Investments. In 2014 there were six countries in APTA: Bangladesh, China, India, Lao P.D.R., Korea and Sri Lanka, and Mongolia was in the process of joining.

Financial Integration in the Asia-Pacific
Page 30
Australian Centre for Financial Studies +61 3 9666 1050 | australiancentre.com.au
The number of FTAs signed and in effect (140 in 2015) is set to more than double if all those
proposed (67), under negotiation (70) and all not yet in effect (10) reach implementation. The
RCEP agreement would contribute to simplicity if it standardised provisions for trade between
its 16 parties, and subsumed differing arrangements in all bilateral agreements between the
16 parties into a single set of within-RCEP arrangements. However, that runs counter to
tailoring arrangements to suit the varied stage of development of individual parties.
Databases to cut through the “noodle bowl”
However, there is improving access to information about trade agreements, with specialised
sites providing links to: the trade agreements; information on the agreements relating to
financial services; and analysis of the restrictions impeding trade in financial services. For the
purposes of this paper, the databases divide between those that make the actual information
accessible and those that provide analysis of the the agreements (Table 7, below).
Table 7: Databases on trade agreements of Asia-Pacific countries.
PRIMARY MOTIVATION FOR DATABASE
Focus on information in the agreements Focus on analysis of the agreements
• WTO I-TIP Services Database21 • WB and Center for International Business
Global Preferential Trade Agreements Database22
• ADB ARIC FTA Database23 and Integration Database24
• APEC STAR Database25
• OECD Services Trade Restrictiveness Index26
• WB Services Trade Restrictions Database27 • ERIA Coverage Index28 and ERIA Hoekman
Index29
Source: the author, compiled from database websites.30
21 WTO I-TIP Services. https://i-tip.wto.org/services/default.aspx 22 Global Preferential Trade Agreements Database (GPTAD). http://wits.worldbank.org/gptad/trade_database.html 23 Asian Development Bank (ADB) Asia Regional Integration Centre (ARIC) FTA Database. https://aric.adb.org/fta and https://aric.adb.org/fta-comparative 24 Asian Development Bank Asia Regional Integration Centre (ARIC) Integration Database. https://aric.adb.org/integrationindicators 25 APEC undated The APEC STAR Database. http://www.servicestradeforum.org/ 26 OECD undated Services Trade Restrictiveness Index. http://www.oecd.org/tad/services-trade/services-trade-restrictiveness-index.htm 27 Development Economics Research Group, the World Bank website undated Services Trade Restrictions Database. http://iresearch.worldbank.org/servicetrade/ 28 Economic Research Institute for ASEAN and East Asia (ERIA). See Hikari Ishido 2015 Liberalisation of Trade in Services under ASEAN+1 FTAs: A Mapping Exercise. Chapter 6 in Ing, L.Y. (ed.) East Asian Integration. ERIA Research Project Report 2014-6, Jakarta: ERIA, pp.157-194. 29 ERIA. See Hikari Ishido 2011 Liberalization of Trade in Services under ASEAN+n: A Mapping Exercise. ERIA Discussion Paper Series ERIA-DP-2011-02, May. 30 There are other databases of FTAs, but which lack focus on financial services, e.g. the UN ESCAP databases at http://www.unescap.org/research .

Barriers to entry and financial integration in Asia and RCEP countries
Page 31
Australian Centre for Financial Studies +61 3 9666 1050 | australiancentre.com.au
The databases oriented at analysis of the agreements are still in their relative infancy and can
be improved, both in terms of the indices deployed and the country coverage. APEC Leaders
have committed to seek better ways to produce services-related statistics and increase the
number of APEC economies with indices for measuring the regulatory environment in services
– including by providing capacity building and exploring the development of an APEC index,
taking into account, as appropriate, existing indices maintained by other forums such as the
OECD.31 RCEP negotiating teams should actively support and contribute to this goal.
In the meantime, this paper seeks to derive value from the analytical databases as they
presently are compiled. We look first in more detail at the WB and OECD STRIs, secondly
assess the estimates of barriers to trade in financial services in the context of economic and
financial development, and thirdly review them against countries’ choices of policy regimes for
the exchange rate, consumer protection and systemic risk. Later, the paper draws on insights
from the coverage and ambition of ASEAN+n trade agreements compiled by ERIA.
The World Bank Services Trade Restrictions Index
The WB STRI is constructed for 19 service subsectors in 103 developing and advanced
countries, with the information initially collected in 2008 and updated in 2012 and 2013.32 The
service subsectors include insurance and banking services. The index only accounts for
policies or regulations that affect foreign businesses, and does not include services consumed
in the exporting country (that is, supply through Mode 2). The database focuses on countries’
Most-Favoured Nation (MFN) policies, “which in (paradoxical) trade parlance means their
non-preferential policies, and contains only limited information on their preferential policies”.33
The latest WB STRI, compiled for 2013, includes 12 RCEP countries, being all six of the “Plus
Six” (Australia, China, India, Japan, Korea, and New Zealand) and six of the 10 ASEAN
countries (Cambodia, Indonesia, Malaysia, Philippines, Thailand and Viet Nam) amongst its
103 countries.34
31 APEC 2015 2015 Leaders' Declaration. Manila, Philippines 19 November, especially Annex B: APEC Services Cooperation Framework (ASCF). 19 November http://www.apec.org/Meeting-Papers/Leaders-Declarations/2015/2015_aelm/2015_Annex%20B.aspx 32 Some new estimates, from surveys in 2015, have been released in Batshur Gootiiz and Aaditya Mattoo 2017. Services in the trans-pacific partnership: what would be lost? World Bank Policy Research Working Paper 7964, February http://documents.worldbank.org/curated/en/512711486497950394/Services-in-the-trans-pacific-partnership-what-would-be-lost 33 Ingo Borchert, Batshur Gootiiz and Aaditya Mattoo 2012 Guide to the Services Trade Restrictions Database. World Bank Policy Research Working Paper 6108, June http://www-wds.worldbank.org/external/default/WDSContentServer/WDSP/IB/2012/06/28/000158349_20120628130854/Rendered/PDF/WPS6108.pdf 34 That is, it still excludes Singapore, Lao P.D.R and Myanmar, even though the data exists in the ASEAN Secretariat and the World Bank 2015 ASEAN Services Integration Report. A Joint Report by the ASEAN Secretariat and the World Bank. Jakarta
Financial Integration in the Asia-Pacific
Page 32
Australian Centre for Financial Studies +61 3 9666 1050 | australiancentre.com.au
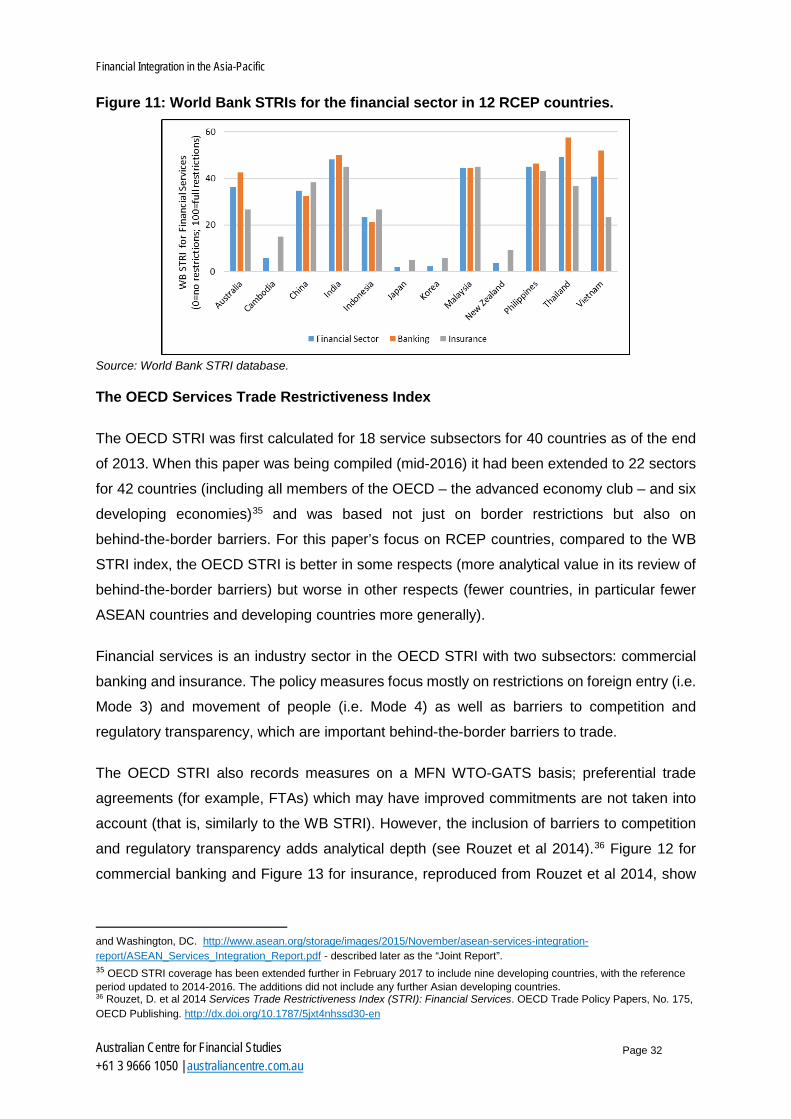
Figure 11: World Bank STRIs for the financial sector in 12 RCEP countries.
Source: World Bank STRI database.
The OECD Services Trade Restrictiveness Index
The OECD STRI was first calculated for 18 service subsectors for 40 countries as of the end
of 2013. When this paper was being compiled (mid-2016) it had been extended to 22 sectors
for 42 countries (including all members of the OECD – the advanced economy club – and six
developing economies)35 and was based not just on border restrictions but also on
behind-the-border barriers. For this paper’s focus on RCEP countries, compared to the WB
STRI index, the OECD STRI is better in some respects (more analytical value in its review of
behind-the-border barriers) but worse in other respects (fewer countries, in particular fewer
ASEAN countries and developing countries more generally).
Financial services is an industry sector in the OECD STRI with two subsectors: commercial
banking and insurance. The policy measures focus mostly on restrictions on foreign entry (i.e.
Mode 3) and movement of people (i.e. Mode 4) as well as barriers to competition and
regulatory transparency, which are important behind-the-border barriers to trade.
The OECD STRI also records measures on a MFN WTO-GATS basis; preferential trade
agreements (for example, FTAs) which may have improved commitments are not taken into
account (that is, similarly to the WB STRI). However, the inclusion of barriers to competition
and regulatory transparency adds analytical depth (see Rouzet et al 2014).36 Figure 12 for
commercial banking and Figure 13 for insurance, reproduced from Rouzet et al 2014, show
and Washington, DC. http://www.asean.org/storage/images/2015/November/asean-services-integration-report/ASEAN_Services_Integration_Report.pdf - described later as the “Joint Report”. 35 OECD STRI coverage has been extended further in February 2017 to include nine developing countries, with the reference period updated to 2014-2016. The additions did not include any further Asian developing countries. 36 Rouzet, D. et al 2014 Services Trade Restrictiveness Index (STRI): Financial Services. OECD Trade Policy Papers, No. 175, OECD Publishing. http://dx.doi.org/10.1787/5jxt4nhssd30-en

Barriers to entry and financial integration in Asia and RCEP countries
Page 33
Australian Centre for Financial Studies +61 3 9666 1050 | australiancentre.com.au
that the OECD STRI is much higher (greater restrictiveness) for China, India and Indonesia
than for Australia, Japan, Korea or New Zealand. The former are far more restrictive than the
average of the 40 countries at that time in the OECD STRI database.
Figure 12: OECD STRI for commercial banking, by policy area of restrictions, for 40 countries including seven RCEP countries (0 is complete absence of restriction; 1 is complete restriction).
Source: Rouzet et al 2014, Figure 6, p24.
Figure 13: OECD STRI for insurance, by policy area of restrictions, for 40 countries including seven RCEP countries (0 is complete absence of restriction; 1 is complete restriction).
Source: Rouzet et al 2014, Figure 7, p24.

Financial Integration in the Asia-Pacific
Page 34
Australian Centre for Financial Studies +61 3 9666 1050 | australiancentre.com.au
Comparing the estimates in the World Bank and OECD Services Trade Restrictions Indexes
Comparing the STRIs for banking and insurance estimated by the WB with those estimated
by the OECD37 shows up some interesting differences, driven by their differing focus and
coverage (see Figures 14 and 15 below).
Figure 14: Barriers to trade (STRIs) for banking for 33 countries, including seven RCEP countries.
Source: WB and OECD STRI databases.
37 As available in mid-2016.

Barriers to entry and financial integration in Asia and RCEP countries
Page 35
Australian Centre for Financial Studies +61 3 9666 1050 | australiancentre.com.au
Figure 15: Barriers to trade (STRIs) for insurance for 33 countries, including seven RCEP countries.
Source: WB and OECD STRI databases.
The comparative Figures 14 and 15 above show that:
• The STRI estimates made by the WB (restrictions) and OECD (restrictiveness) for most
countries are generally quite similar, but differences are also not unusual;
• Developed countries typically are ranked as relatively unrestrictive for trade in financial
services (both banking and insurance) in both the WB and OECD STRI databases, and
the few developing countries for which there are STRI estimates from both WB and OECD
typically are ranked as relatively restrictive in both databases; and
• The WB and OECD STRIs differ most in their estimates for Indonesia (the OECD estimate
of restrictiveness is much higher than the WB estimate for restrictions) and for Australia

Financial Integration in the Asia-Pacific
Page 36
Australian Centre for Financial Studies +61 3 9666 1050 | australiancentre.com.au
(the WB estimate for restrictions is much higher than the OECD estimate for
restrictiveness, because the WB index puts greater weight on restrictions on acquisition of
domestic banks by foreign banks, e.g., the “Four pillars” policy).
Development outcomes and barriers to trade in financial services
It is perplexing that such a successful grouping in terms of economic and financial
development as the RCEP countries is paradoxically also a grouping in which the majority
pursue policies involving comparatively high barriers to trade in financial services.
This judgement allows for the observation that barriers to trade in financial services (banking
and insurance services combined) typically are higher in less developed economies than in
more advanced economies. Drawing on data in the WB STRI Database,38 which is based on
surveys in developing economies and data accessed for developed economies, this
observation is found to be generally – though not always – the case amongst RCEP countries
(Figure 16).
Figure 16: GDP per capita and trade restrictions for financial services for 103 countries, including 12 RCEP countries.
Source: World Bank Services Trade Restrictions Index (STRI) dataset and IMF World Economic Outlook (WEO) April 2016 database.
The simple (that is, unweighted) average WB STRI for the 12 RCEP countries for financial
services (combining banking and insurance services) in Figure 16 above is 28.0, compared to
a simple average STRI for all 103 countries of 22.5. The RCEP-country region is thus
comparatively restrictive regarding barriers to trade in financial services. However, more of
38 Borchert, Ingo; Gootiiz, Batshur; Mattoo, Aaditya. 2012. Guide to the services trade restrictions database. Policy Research working paper no. WPS 6108. Washington, DC: World Bank. http://documents.worldbank.org/curated/en/878251468178764639/Guide-to-the-services-trade-restrictions-database
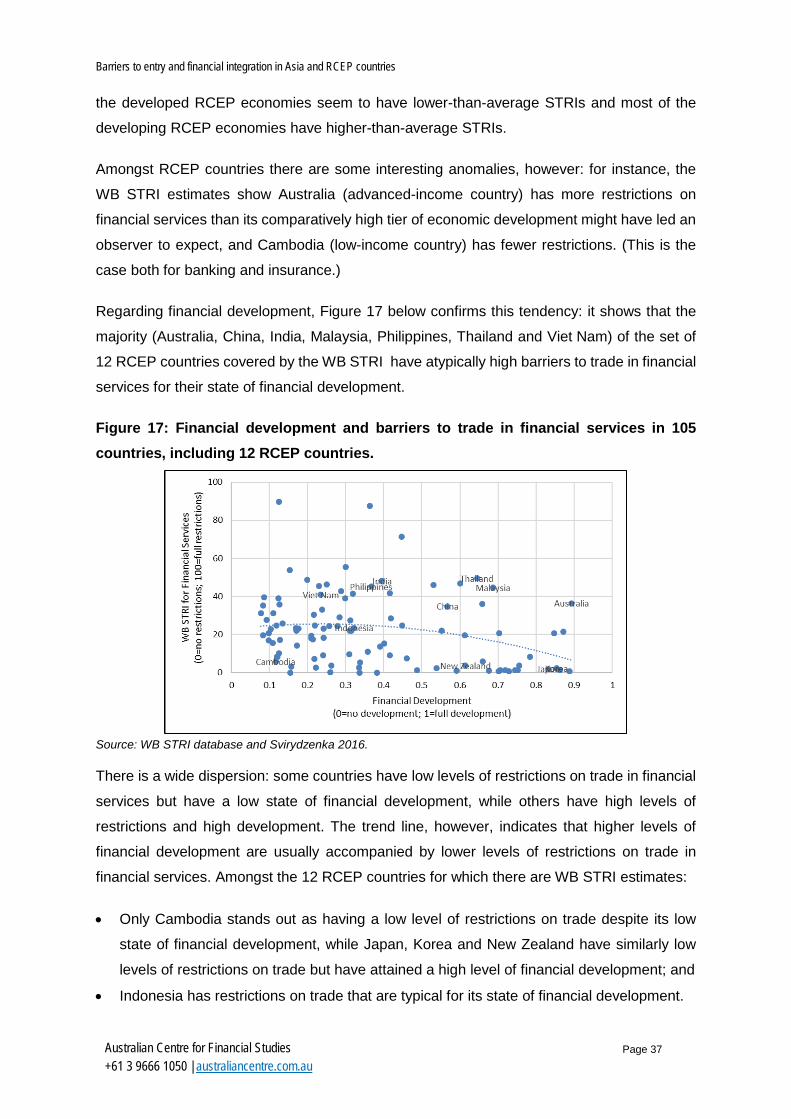
Barriers to entry and financial integration in Asia and RCEP countries
Page 37
Australian Centre for Financial Studies +61 3 9666 1050 | australiancentre.com.au
the developed RCEP economies seem to have lower-than-average STRIs and most of the
developing RCEP economies have higher-than-average STRIs.
Amongst RCEP countries there are some interesting anomalies, however: for instance, the
WB STRI estimates show Australia (advanced-income country) has more restrictions on
financial services than its comparatively high tier of economic development might have led an
observer to expect, and Cambodia (low-income country) has fewer restrictions. (This is the
case both for banking and insurance.)
Regarding financial development, Figure 17 below confirms this tendency: it shows that the
majority (Australia, China, India, Malaysia, Philippines, Thailand and Viet Nam) of the set of
12 RCEP countries covered by the WB STRI have atypically high barriers to trade in financial
services for their state of financial development.
Figure 17: Financial development and barriers to trade in financial services in 105 countries, including 12 RCEP countries.
Source: WB STRI database and Svirydzenka 2016.
There is a wide dispersion: some countries have low levels of restrictions on trade in financial
services but have a low state of financial development, while others have high levels of
restrictions and high development. The trend line, however, indicates that higher levels of
financial development are usually accompanied by lower levels of restrictions on trade in
financial services. Amongst the 12 RCEP countries for which there are WB STRI estimates:
• Only Cambodia stands out as having a low level of restrictions on trade despite its low
state of financial development, while Japan, Korea and New Zealand have similarly low
levels of restrictions on trade but have attained a high level of financial development; and
• Indonesia has restrictions on trade that are typical for its state of financial development.

Financial Integration in the Asia-Pacific
Page 38
Australian Centre for Financial Studies +61 3 9666 1050 | australiancentre.com.au
For Australia at least, it is a different story when charting the OECD STRI for Commercial
Banking. There is still a slight curve downwards (“frown”) in the trend line, but in Figure 18
below we see that Australia, Japan, Korea and New Zealand all have barriers to trade in
commercial banking that are quite typical of countries with their attained states of financial
development. By contrast, in this OECD-dominated group, the three RCEP developing
countries (China, India and Indonesia) look very restrictive compared to their assessed state
of financial development.
Figure 18: Financial development and barriers to trade in commercial banking in 42 countries, including seven RCEP countries.
Source: OECD STRI database and Svirydzenka 2016.
2.2 Drivers of barriers to trade in financial services
The WTO and GATS are directed at trade liberalisation and have frameworks and agreements
in place to minimise “unnecessary” barriers to trade.39 Nevertheless, a high level of restrictions
on trade in financial services remains. These are permitted in many instances under the
“prudential carve-out”.
The “prudential carve-out”
Obligations contained in the WTO’s GATS may be categorised into two broad groups:
• General obligations (which apply directly and automatically to all Members and services
sectors); and
• Commitments concerning market access and national treatment in specifically designated
sectors.
39 See WTO Annual Report 2017. https://www.wto.org/english/res_e/booksp_e/anrep_e/anrep17_e.pdf
Barriers to entry and financial integration in Asia and RCEP countries
Page 39
Australian Centre for Financial Studies +61 3 9666 1050 | australiancentre.com.au
Such commitments on market access and national treatment are laid down in individual
country schedules whose scope may vary widely across Members. However, the GATS
expressly recognises the right of Members to regulate the supply of services in pursuit of their
own policy objectives, and does not seek to influence those objectives. Rather, the GATS
seeks to ensure that services regulations are administered in a reasonable, objective and
impartial manner and do not constitute unnecessary barriers to trade40 (author’s emphasis).
Financial Services provisions in FTAs also include the ability for Parties to take measures for
prudential reasons.
Almost all agreements to lower barriers to trade in financial services (that is, the GATS and
regional, plurilateral and bilateral FTAs) retain, in one form or another, this “prudential
carve-out”, which allows countries, despite commitments to liberalise trade, to impose
regulations on trade in order to protect customers and limit systemic risk and financial and
exchange rate instability. Over time there has been general acceptance that the prudential
carve-out is essential. The scope of the prudential carve-out has recently been tested in the
courts (see for instance Hope 2016)41 and has been found to be a broad exemption (subject
perhaps to appeal).
Most analyses, including the WB and OECD STRIs, do not seek to assess whether the barriers
to trade that exist are due to the prudential carve-out. For instance, Rouzet et al 2014, writing
about insights from the OECD STRI data, specifically dodge this difficult issue.42
“There is a delicate balance between implementing effective prudential regulation and
maintaining an[d] open financial sector. Taking a stance on whether a given policy
instrument is in place for prudential reasons is left beyond the scope of the [OECD]
STRI. More modestly, it aims to record in an accurate, objective and comparable
manner the state of legal and regulatory impediments faced by foreign financial
services providers in each market. Such information contributes to transparency.”
This paper seeks to test the extent of the barriers to trade in financial services seen in RCEP
and other countries, which are chosen “policies” of the countries, in view of three chosen policy
regimes that fall within the prudential carve-out. These policy regimes are:
40 Drawn from WTO undated The General Agreement on Trade in Services (GATS): objectives, coverage and disciplines. WTO website https://www.wto.org/english/tratop_e/serv_e/gatsqa_e.htm#2 41 Ashly Hope 2016 The prudential carve-out. Trade Law Centre (TRALAC), Discussion, 29 June http://www.tralac.org/discussions/article/9991-the-prudential-carve-out.html 42 Rouzet, D. et al 2014 Services Trade Restrictiveness Index (STRI): Financial Services. OECD Trade Policy Papers, No. 175, OECD Publishing. http://dx.doi.org/10.1787/5jxt4nhssd30-en Rouzet et al 2014 provide useful detail on the financial services included (and not included) in the OECD STRI.
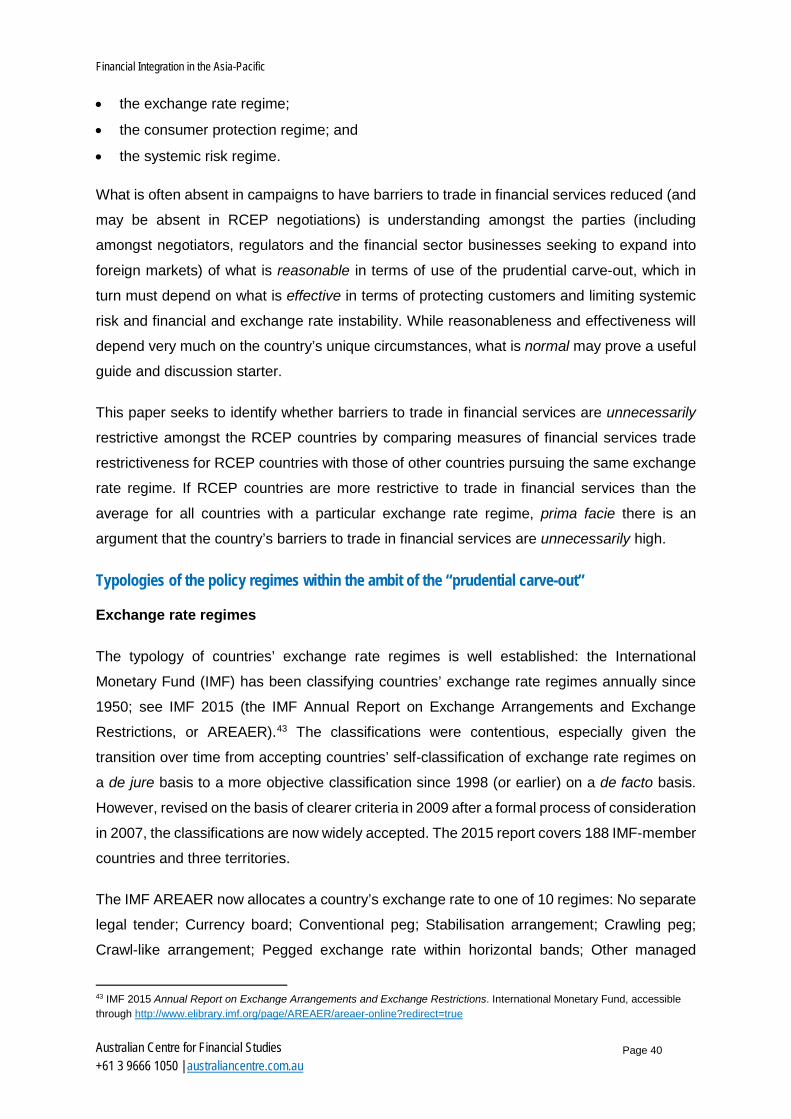
Financial Integration in the Asia-Pacific
Page 40
Australian Centre for Financial Studies +61 3 9666 1050 | australiancentre.com.au
• the exchange rate regime;
• the consumer protection regime; and
• the systemic risk regime.
What is often absent in campaigns to have barriers to trade in financial services reduced (and
may be absent in RCEP negotiations) is understanding amongst the parties (including
amongst negotiators, regulators and the financial sector businesses seeking to expand into
foreign markets) of what is reasonable in terms of use of the prudential carve-out, which in
turn must depend on what is effective in terms of protecting customers and limiting systemic
risk and financial and exchange rate instability. While reasonableness and effectiveness will
depend very much on the country’s unique circumstances, what is normal may prove a useful
guide and discussion starter.
This paper seeks to identify whether barriers to trade in financial services are unnecessarily
restrictive amongst the RCEP countries by comparing measures of financial services trade
restrictiveness for RCEP countries with those of other countries pursuing the same exchange
rate regime. If RCEP countries are more restrictive to trade in financial services than the
average for all countries with a particular exchange rate regime, prima facie there is an
argument that the country’s barriers to trade in financial services are unnecessarily high.
Typologies of the policy regimes within the ambit of the “prudential carve-out”
Exchange rate regimes
The typology of countries’ exchange rate regimes is well established: the International
Monetary Fund (IMF) has been classifying countries’ exchange rate regimes annually since
1950; see IMF 2015 (the IMF Annual Report on Exchange Arrangements and Exchange
Restrictions, or AREAER).43 The classifications were contentious, especially given the
transition over time from accepting countries’ self-classification of exchange rate regimes on
a de jure basis to a more objective classification since 1998 (or earlier) on a de facto basis.
However, revised on the basis of clearer criteria in 2009 after a formal process of consideration
in 2007, the classifications are now widely accepted. The 2015 report covers 188 IMF-member
countries and three territories.
The IMF AREAER now allocates a country’s exchange rate to one of 10 regimes: No separate
legal tender; Currency board; Conventional peg; Stabilisation arrangement; Crawling peg;
Crawl-like arrangement; Pegged exchange rate within horizontal bands; Other managed
43 IMF 2015 Annual Report on Exchange Arrangements and Exchange Restrictions. International Monetary Fund, accessible through http://www.elibrary.imf.org/page/AREAER/areaer-online?redirect=true

Barriers to entry and financial integration in Asia and RCEP countries
Page 41
Australian Centre for Financial Studies +61 3 9666 1050 | australiancentre.com.au
arrangement; Floating and Full floating. In this paper we have subdivided the Full floating
category into Non-Euro and Euro, as the Euro adoptees have entered a virtually barrier-less
single market for capital, goods and services. When appropriate we supplement the IMF
AREAER assessments with the Chinn-Ito index of de jure capital account openness
(KAOPEN), which helps inform the analytical value of the IMF’s more de facto classification of
exchange rate regimes.44
We see if there is an observable association between countries’ exchange rate regimes and
barriers to trade in financial services.
Consumer protection regimes
The typology for countries’ consumer protection regimes is less well-developed and defined:
the most established has been classifying countries by whether deposit insurance is explicit
or not. There have been a considerable number of other initiatives in consumer protection
across a range of financial products beyond bank deposits and extending into education, but
deposit insurance remains the most prevalent form of protection for consumers of financial
services around the world. Demirgüç-Kunt et al (2005) assembled a detailed database of the
main deposit insurance scheme in 181 countries in 2003.45 The database has been expanded
to 190 countries and updated to end-2013 by Demirgüç-Kunt et al 2014.46 Other measures of
consumer protection in financial services have not yet achieved such prominence.
This latest research has taken the analysis an insightful step further, to assess a country’s
main deposit insurance scheme on the extent of the safety net provided to consumers (note
that this Safety Net Index can also be seen by sceptics of the merits of deposit insurance as
an Index of Moral Hazard).
44 Chinn and Ito 2006 What Matters for Financial Development? Capital Controls, Institutions, and Interactions. Journal of Development Economics, Volume 81, Issue 1, Pages 163-192 (October). Notes on The Chinn-Ito Financial Openness Index 2013 Update, 1 May, 2015. http://web.pdx.edu/~ito/Chinn-Ito_website.htm. KAOPEN is based on the binary dummy variables that codify the tabulation of restrictions on cross-border financial transactions reported in the IMF’s Annual Report on Exchange Arrangements and Exchange Restrictions (AREAER). KAOPEN shows a similar wide range of capital account openness in the RCEP countries and the various groupings of RCEP countries as do other measures of development or liberalisation, from fully closed to fully open. According to the Chinn-Ito index, six RCEP countries have capital accounts that – de jure – are fully or virtually fully open (Australia, Cambodia, Japan, Korea, New Zealand and Singapore). Two countries (Indonesia and Viet Nam) have capital accounts that are neither fully open nor fully closed. Seven countries have capital accounts that are fully or virtually fully closed (China, India, Lao P.D.R., Malaysia, Myanmar and the Philippines). Brunei Darussalam is not rated by Chinn and Ito. 45 Demirgüç-Kunt, A., Karacaovali, B. and Laeven, L. (2005), Deposit Insurance around the World: A Comprehensive Database, Policy Research Working Paper 3628, Washington, DC: World Bank. http://econ.worldbank.org/WBSITE/EXTERNAL/EXTDEC/EXTRESEARCH/0,,contentMDK:20699211~pagePK:64214825~piPK:64214943~theSitePK:469382,00.html 46 Demirgüç-Kunt, A., Kane, E, and Laeven, L. (2014), Deposit Insurance Database, IMF Working Paper WP/14/118, Washington, DC, July. https://www.imf.org/external/pubs/ft/wp/2014/wp14118.pdf

Financial Integration in the Asia-Pacific
Page 42
Australian Centre for Financial Studies +61 3 9666 1050 | australiancentre.com.au
We compare countries’ deposit insurance and Safety Net Indices with their barriers to trade in
financial services, to observe any associations.
Systemic risk regimes
The typology of countries’ systemic risk regimes, by contrast, is still in its infancy: driven by
the scramble to avoid, minimise and recover from real world financial crises. Basel-based
committees have been revising microprudential guidelines (though there is no convenient
summary index yet of which countries have implemented Basel II, II.5 or III, nor of their
effectiveness in containing financial system risk) and substantial research effort is being
directed to identifying policy measures and settings that mitigate crises before, during or after
they have broken.
For our purposes, the most useful developments have been the progress by Stern Business
School’s Volatility Laboratory (V-Lab) in measuring the extent of systemic risk posed by
countries’ financial systems,47 and the still early research by Cerutti et al (2015) that seeks to
classify countries’ systemic risk regimes by enumerating the macroprudential instruments
available in a country.48 Realistically, this is just the start of determining the effectiveness of
macroprudential policy regimes and further progress will have to be made and reported to the
G20.49
We review countries’ number of macroprudential instruments and the extent of systemic risk
with barriers to trade in financial services, again to observe any association.
2.3 Insights from exchange rate regimes
The general level of trade restrictions measured by the WB STRIs does vary with the type of
exchange rate regime in place,50 as shown in Figure 19 below (higher readings reflect more
restrictions).
47 The works of NYU Stern Business School V-Lab. 48 Cerutti, E., Claessens, E. and Laeven, L. 2015 The Use and Effectiveness of Macroprudential Policies: New Evidence. March. Including a link to the data http://www.imf.org/external/pubs/ft/wp/2015/Data/wp1561.zip 49 IMF 2011 MacroPrudential Policy Tools and Framework Progress Report to G20. October https://www.imf.org/external/np/g20/pdf/102711.pdf and G20 2016 Communiqué G20 Finance Ministers and Central Bank Governors Meeting. April http://g20.org/English/Documents/Current/201604/t20160427_2269.html 50 As would be expected: see Grenville 2000.

Barriers to entry and financial integration in Asia and RCEP countries
Page 43
Australian Centre for Financial Studies +61 3 9666 1050 | australiancentre.com.au
Figure 19: Barriers to trade in financial services and exchange rate regimes, 103 countries.
Source: World Bank Services Trade Restrictions Index (STRI) and IMF Annual Report on Exchange Arrangements and Exchange Restrictions (AREAER): both are data for 2013. Notes: i. Simple averages of 103 countries in World Bank Services Trade Restrictions Index dataset; ii. Exchange rate regimes classified as full floating subdivided into non-euro and euro groupings.
Figure 20 below confirms that the exchange rate regime, the extent of capital controls and the
restrictiveness of trade in financial services are all connected, for the 103 countries for which
we have WB STRI data as well as IMF AREAER exchange rate regime classifications and an
assessment of de jure capital account openness from Chinn-Ito.
The limited group of countries with currency board regimes and the more numerous group of
countries with full floating regimes have the least restrictions on capital flows and trade in
financial services, whereas the regimes that involve central bank intervention aimed at
managing exchange rate outcomes all are protected by restrictions on capital flows and
barriers to trade in financial services.51
51 The sample sizes of two for both the Currency Board and Crawling Peg regimes are too small to draw a definitive conclusion that they need no restrictions over capital flows or trade in financial services for their sustainability.
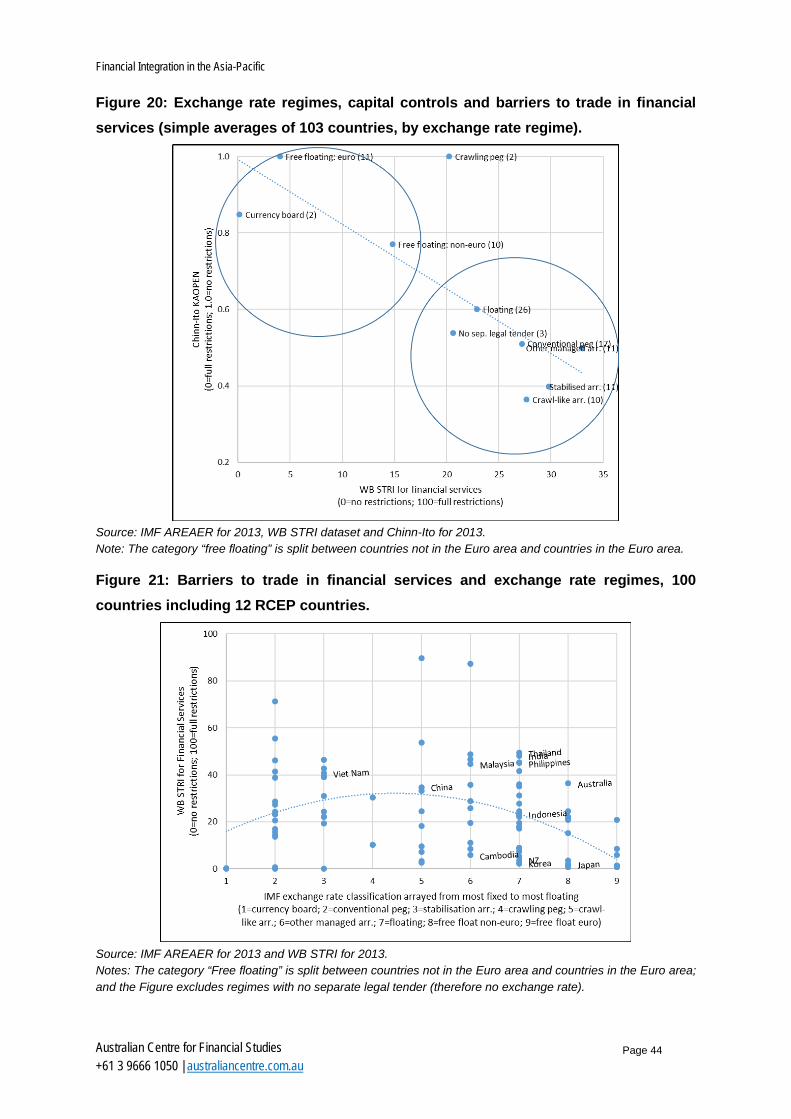
Financial Integration in the Asia-Pacific
Page 44
Australian Centre for Financial Studies +61 3 9666 1050 | australiancentre.com.au
Figure 20: Exchange rate regimes, capital controls and barriers to trade in financial services (simple averages of 103 countries, by exchange rate regime).
Source: IMF AREAER for 2013, WB STRI dataset and Chinn-Ito for 2013. Note: The category “free floating” is split between countries not in the Euro area and countries in the Euro area.
Figure 21: Barriers to trade in financial services and exchange rate regimes, 100 countries including 12 RCEP countries.
Source: IMF AREAER for 2013 and WB STRI for 2013. Notes: The category “Free floating” is split between countries not in the Euro area and countries in the Euro area; and the Figure excludes regimes with no separate legal tender (therefore no exchange rate).

Barriers to entry and financial integration in Asia and RCEP countries
Page 45
Australian Centre for Financial Studies +61 3 9666 1050 | australiancentre.com.au
Figures 20 and 21, and in particular the exchange rate regime trend line “frown” in Figure 21,
show that a vast majority of countries have sought to defy the strictures of the Mundell-Fleming
“trilemma”/“impossible trinity” that the government in an open economy in the long run can
choose only two of the three common desires (monetary policy autonomy, an open capital
account and a stable/fixed exchange rate). Most countries have chosen neither a really hard
peg (that is, a currency board) nor complete hands-off exchange rate flexibility (that is, full
floating), but instead have opted for an intermediate exchange rate regime that allows limited
exchange rate flexibility but requires support from currency intervention, capital controls and
barriers to trade in financial services.
From our trade barriers perspective, what stands out in Figure 21 regarding the choices of the
12 RCEP countries is that:
• only Cambodia, Japan, Korea and New Zealand have lower barriers to trade in financial
services than are typical for countries that have their chosen exchange rate regime;
• the largest grouping (Australia, India, Malaysia, Philippines, Thailand and Viet Nam)
instead have higher barriers to trade in financial services than are typical for their chosen
exchange rate regime; and
• China, contrary to popular impressions, has barriers to trade in financial services that are
quite typical of those countries with crawl-like arrangements, as does Indonesia for its
floating exchange rate regime.
Figures 19, 20 and 21 support the insights of both the Mundell-Fleming “trilemma” and
Grenville 2000.52
• the exchange rate regimes that involve the least barriers to trade in financial services are
the “corner positions” of fully fixed currency board arrangements (the left-most categories
in Figure 19 and 21) and fully floating arrangements (the two right-most categories in
Figures 19 and 21); while
• the countries in the intermediate positions, where exchange rate regimes are more
managed, are both more numerous and have deployed significantly more trade
restrictions.
More detail on exchange rate regimes and barriers to trade in financial services
Separating the countries by their exchange rate regime also throws some light on the
differences in the extent of barriers to trade in commercial banking (Figure 22 below) and
52 Stephen Grenville 2000 Exchange Rate Regimes for Emerging Markets. Reserve Bank of Australia Bulletin, November http://www.rba.gov.au/publications/bulletin/2000/nov/pdf/bu-1100-2.pdf

Financial Integration in the Asia-Pacific
Page 46
Australian Centre for Financial Studies +61 3 9666 1050 | australiancentre.com.au
insurance (Figure 23 below), as assessed by the OECD.53 Countries with full floating
exchange rate regimes are less restrictive to trade in both commercial banking and insurance
than are countries with floating or other more managed exchange rate regimes. In the
judgement of the OECD’s compilers, barriers to foreign entry and barriers to competition are
the most important restrictions (in terms of the weightings allocated to these two categories).
Figure 22: Barriers to trade in commercial banking, by exchange rate regime (simple averages of 42 countries in OECD STRI dataset).
Sources: OECD STRI and IMF AREAER. Note: Category classified as full floating is subdivided into non-euro and euro groupings.
Figure 23: Barriers to trade in insurance services, by exchange rate regime (simple averages of 42 countries in OECD STRI dataset).
Sources: OECD STRI and IMF AREAER. Note: Category classified as full floating is subdivided into non-euro and euro groupings.
53 Using OECD STRI data available in mid-2016.

Barriers to entry and financial integration in Asia and RCEP countries
Page 47
Australian Centre for Financial Studies +61 3 9666 1050 | australiancentre.com.au
OECD Services Trade Restrictiveness Indices find China, India and Indonesia the most restrictive for trade in financial services …
The OECD STRIs54 for the seven RCEP countries are set out in Table 8 below for commercial
banking and in Table 9 below for insurance. The OECD countries (Australia, Japan, Korea
and New Zealand), which are more developed economies, are found to have lower STRI
values for their restrictions than the non-OECD countries (China, India and Indonesia), which
stand out as more restrictive than average. Importantly for those assessing the restrictiveness
of Australia in view of the high levels of restrictions found in the WB STRI, the OECD STRI
finds Australia generally quite unrestrictive across its five categories. China, India and
Indonesia are found to have the most restrictive stances, especially for foreign entry (which
impedes Mode 3 supply). Japan has high barriers to competition in commercial banking and
for regulatory transparency in insurance services.
54 Using the OECD STRI measures available in mid-2016.

Financial Integration in the Asia-Pacific
Page 48
Australian Centre for Financial Studies +61 3 9666 1050 | australiancentre.com.au
Table 8: OECD STRI index values for commercial banking in seven RCEP countries.
WEIGHT IN STRI TOTAL
RESTRICTIONS AUSTRALIA CHINA INDIA INDONESIA JAPAN KOREA NEW ZEALAND
SIMPLE AVERAGE OF RCEP COUNTRIES
42.5 Restrictions on foreign entry 0.086 0.247 0.268 0.268 0.045 0.055 0.099 0.153
8.2 Restrictions on movement of people
0.019 0.019 0.038 0.044 0 0.019 0.019 0.023
13.7 Other discriminatory measures 0 0.039 0.039 0.088 0 0.01 0.01 0.027
22.9 Barriers to competition 0.011 0.12 0.065 0.087 0.076 0.044 0.033 0.062
12.7 Regulatory transparency 0.012 0.046 0.081 0.058 0.035 0.012 0.023 0.038
100.0 STRI Total (weighted) 0.127 0.471 0.491 0.545 0.155 0.139 0.184 0.302
Source: OECD STRI download, 12 April 2016, bold highlights restrictions more than the simple average of RCEP countries.
Table 9: OECD STRI index values for insurance services in seven RCEP countries.
WEIGHT IN STRI TOTAL
RESTRICTIONS AUSTRALIA CHINA INDIA INDONESIA JAPAN KOREA NEW ZEALAND
SIMPLE AVERAGE OF RCEP COUNTRIES
61.9 Restrictions on foreign entry 0.091 0.305 0.42 0.354 0.086 0.027 0.122 0.201
9.1 Restrictions on movement of people
0.02 0.016 0.043 0.043 0.012 0.016 0.012 0.023
6.4 Other discriminatory measures
0.005 0.027 0.014 0.032 0 0 0.009 0.012
17.5 Barriers to competition 0.005 0.126 0.126 0.076 0.049 0.027 0 0.058
5.2 Regulatory transparency 0.006 0.017 0.029 0.017 0.017 0.006 0.011 0.015
100.0 STRI Total (weighted) 0.126 0.491 0.631 0.523 0.164 0.075 0.154 0.309
Source: OECD STRI download, 12 April 2016, bold highlights restrictions more than the simple average of RCEP countries.

Barriers to entry and financial integration in Asia and RCEP countries
Page 49
Australian Centre for Financial Studies +61 3 9666 1050 | australiancentre.com.au
Reviewing the OECD STRI data for RCEP countries according to the exchange rate regimes
being pursued adds some perspective.
… but Australia, New Zealand and Japan are also more restrictive in some aspects than their exchange rate regimes might imply
Tables 10 (commercial banking) and 11 (insurance) focus more acutely on the seven RCEP
countries for which there are OECD STRI estimates and the simple average of all countries
for which there are estimates (bear in mind these are mainly OECD – advanced-income –
countries).55
55 Using OECD STRI data available in mid-2016.

Financial Integration in the Asia-Pacific
Page 50
Australian Centre for Financial Studies +61 3 9666 1050 | australiancentre.com.au
Table 10: Barriers to trade in commercial banking, by exchange rate regime (RCEP countries versus simple averages of countries in OECD STRI dataset).
Exchange rate regimes in countries
Overall OECD STRI
Restrictions on foreign entry
Restrictions on movement of people
Other discriminatory
measures
Barriers to competition
Regulatory transparency
Memo: chinn-ito capital account openness
kaopen (Composite indices, 0.00 representing an open market and 1.00 a market completely closed to foreign services providers) (0.00 = fully closed; 1.00 =
fully open)
OECD (34)
Floating
New Zealand 0.1840 0.0995 0.0190 0.0098 0.0327 0.0231 1.0000
Korea 0.1388 0.0549 0.0190 0.0098 0.0435 0.0115 0.7141
Average of 6 Floating 0.1851 0.0732 0.0243 0.0114 0.0435 0.0327 0.7213
Full floating non-euro
Australia 0.1272 0.0858 0.0190 0 0.0109 0.0115 0.8182
Japan 0.1554 0.0446 0 0 0.0762 0.0346 1.0000
Average of 9 Full floating non-euro
0.1662 0.0778 0.0183 0.0130 0.0314 0.0257 0.8513
Non-OECD (8)
Other
China 0.4710 0.2470 0.0190 0.0390 0.1197 0.0462 0.1639
Average of 2 Other 0.4185 0.1990 0.0380 0.0536 0.0816 0.0462 0.4390
Floating
India 0.4908 0.2676 0.0380 0.0390 0.0653 0.0808 0.1639
Indonesia 0.5446 0.2676 0.0444 0.0878 0.0871 0.0577 0.4111
Average of 5 Floating 0.3750 0.1770 0.0279 0.0449 0.0675 0.0577 0.3122
Source: OECD STRI download, 12 April 2016, bold highlights restrictions more than the simple average of RCEP countries.

Barriers to entry and financial integration in Asia and RCEP countries
Page 51
Australian Centre for Financial Studies +61 3 9666 1050 | australiancentre.com.au
Table 11: Barriers to trade in insurance services, by exchange rate regime (RCEP countries versus simple averages of countries in OECD STRI dataset).
Exchange rate regimes in countries
Overall OECD STRI
Restrictions on foreign entry
Restrictions on movement of
people
Other discriminatory measures
Barriers to competition
Regulatory transparency
Memo: Chinn-Ito capital account openness
KAOPEN (Composite indices, 0.00 representing an open market and 1.00 a market completely closed to foreign services providers) (0.00 = fully closed; 1.00 =
fully open)
OECD (34)
Floating
New Zealand 0.1540 0.1216 0.0118 0.0091 0 0.0115 1.0000
Korea 0.0753 0.0265 0.0158 0 0.0273 0.0057 0.7141
Average of 6 Floating 0.1771 0.1010 0.0203 0.0107 0.0337 0.1771 0.7213
Full floating non-euro
Australia 0.1261 0.0907 0.0197 0.0046 0.0055 0.0057 0.8182
Japan 0.1644 0.0863 0.0118 0 0.0491 0.0172 1.0000
Average of 9 Full floating non-euro
0.1672 0.1135 0.0197 0.0056 0.0182 0.1672 0.8513
Non-OECD (8)
Other
China 0.4911 0.3052 0.0158 0.0274 0.1256 0.0172 0.1639
Average of 2 Other 0.4737 0.3163 0.0315 0.0160 0.0928 0.0172
0.4390
Floating
India 0.6314 0.4202 0.0433 0.0137 0.1256 0.0286 0.1639
Indonesia 0.5228 0.3539 0.0433 0.0320 0.0764 0.0172 0.4111
Average of 5 Floating 0.3847 0.2406 0.0284 0.0219 0.0732 0.0206 0.3122
Source: OECD STRI download, 12 April 2016, bold highlights restrictions more than the simple average of RCEP countries.

Financial Integration in the Asia-Pacific
Page 52
Australian Centre for Financial Studies +61 3 9666 1050 | australiancentre.com.au
From Tables 10 and 11 above it does seem, having taken their chosen exchange rate regime
into account, that:
• China, India and Indonesia are indeed more restrictive regarding trade in financial services
than their exchange rate regime peers across a number of measures;
• Australia and New Zealand are more restrictive than their exchange rate regime peers in
terms of restricting foreign bank entry; and
• Japan is more restrictive for commercial banking as a result of barriers to competition and
regulatory transparency.
2.4 Insights from consumer protection regimes
Deposit insurance is the most generally available instrument for consumer protection in
financial services. Most countries, now including Australia, have explicit insurance schemes
for bank deposits, as shown in Figure 24 below from a recently updated comprehensive global
database (Demirgüç-Kunt et al 2014).56
Figure 24: Consumer protection (deposit insurance) and barriers to trade in financial services for 100 countries, including 12 RCEP countries.
Source: Demirgüç-Kunt et al 2014 and World Bank Services Trade Restrictions Index (STRI).
56 Demirgüç-Kunt, A., E. Kane and L. Laeven, (2014), Deposit Insurance Database, IMF Working Paper WP/14/118, Washington, DC, July https://www.imf.org/external/pubs/ft/wp/2014/wp14118.pdf

Barriers to entry and financial integration in Asia and RCEP countries
Page 53
Australian Centre for Financial Studies +61 3 9666 1050 | australiancentre.com.au
The differences between the schemes are now summarised by Demirgüç-Kunt et al (2014) for
many of the countries in a novel Safety Net Index (see Figure 25 below) which gauges the
extent to which a depositor will be made whole in event of a loss.
Figure 25: Consumer protection (safety net index) and restrictions on trade in financial services for 69 countries, including nine RCEP countries.
Source: Demirgüç-Kunt et al 2014 and World Bank Services Trade Restrictions Index (STRI).
The Safety Net Index gives a guide to the extent of consumer protection. The comparatively
flat trend line suggests there is very little relationship between the Safety Net Index estimate
and the extent of restrictions on trade in financial services.
For the nine RCEP countries in Figure 25 (Australia, India, Indonesia, Japan, Korea, Malaysia,
Philippines, Thailand and Viet Nam), only Thailand stands out as having both a high level of
restrictions on trade in financial services and a high safety net. Be aware that some see the
Safety Net as ambiguous, an index of moral hazard, exposing the banks to less scrutiny from
consumers.
2.5 Insights from systemic risk regimes
As mentioned, it is still early days in the development of typologies of macroprudential policy
regimes. Unlike with exchange rate regimes, we do not yet understand which macroprudential
policy regimes are generally more supportive for financial stability in the long run. In addition,
the measures relating to macroprudential policy regimes are generally quite basic.

Financial Integration in the Asia-Pacific
Page 54
Australian Centre for Financial Studies +61 3 9666 1050 | australiancentre.com.au
Figure 26 compares the WB STRI for financial services with the number of macroprudential
policy instruments chosen by governments.
Figure 26: Barriers to trade in financial services and the regimes for macroprudential policy for 78 countries, including 11 RCEP countries.
Source: WB STRI and IMF dataset for Macroprudential Index. Dataset developed in “The Use and Effectiveness of Macroprudential Policies: New Evidence” by Eugenio Cerutti, Stijn Claessens and Luc Laeven. IMF Working Paper, March 2015.
The trend line dips in the middle of Figure 26 (a “smile”), suggesting that having a moderate
number of available macroprudential instruments is associated with lesser barriers to trade in
financial services than if there are very few macroprudential instruments or many more
macroprudential instruments in place on average.
For the 11 RCEP countries57 for which there is both a WB STRI for financial services and an
MPI reading (the number of macroprudential instruments), it would appear that for the number
of macroprudential instruments selected by the country:
• Australia and the cluster of India, Malaysia, Philippines and Thailand (in all, five RCEP
countries) have more restrictions on international trade in financial services than the
average;
• China and Indonesia (two) have around the average extent of restrictions on international
trade in financial services; and
• Cambodia, Japan, Korea and New Zealand (four) have fewer restrictions on international
trade in financial services than the average.
57 Australia, Cambodia, China, India, Indonesia, Japan, Korea, Malaysia, New Zealand, Philippines and Thailand.

Barriers to entry and financial integration in Asia and RCEP countries
Page 55
Australian Centre for Financial Studies +61 3 9666 1050 | australiancentre.com.au
Figure 27 observes a broadly similar picture for trade in commercial banking in seven RCEP
countries,58 using the OECD STRI data59 and the number of macroprudential policy
instruments.
Figure 27: Restrictions on trade in commercial banking and macroprudential policy regime for 39 countries, including seven RCEP countries.
Source: OECD STRI and IMF dataset for Macroprudential Index. Dataset developed in “The Use and Effectiveness of Macroprudential Policies: New Evidence” by Eugenio Cerutti, Stijn Claessens and Luc Laeven. IMF Working paper, March 2015.
In each case, the trend lines suggest that having more macroprudential instruments at hand
is not associated with having less restrictions/restrictiveness for commercial banking services
trade. It would appear that countries’ decisions on the extent of these restrictions is quite
independent of their chosen arsenal of macroprudential instruments, perhaps reflecting doubts
about the effectiveness of macroprudential policy instruments themselves.
However, there is an alternative perspective on systemic risk regimes if we can look at the
extent of systemic risk estimates for a country, scaled against its underlying economy. For
instance, the Stern Business School V-Lab makes estimates of systemic risk (SRISK) in
countries that have stock-exchange-listed financial institutions, thus focusing on the more
financially developed economies in the world, including eight RCEP countries.60 SRISK varies
significantly over time. As in Figure 28 below, we have chosen to scale the SRISK amounts
as a percent of a country’s GDP, but readily available alternatives are as a percent of bank
assets or stock market capitalisation.
58 Australia, China, India, Indonesia, Japan, Korea and New Zealand. 59 As available in mid-2016. 60 Australia, China, India, Indonesia, Japan, Korea, Malaysia and Thailand.

Financial Integration in the Asia-Pacific
Page 56
Australian Centre for Financial Studies +61 3 9666 1050 | australiancentre.com.au
Figure 28: Barriers to trade in financial services and systemic risk for 36 countries, including eight RCEP countries.
Source: World Bank STRI for 2013 compared to SRISK estimates from Stern Business School Volatility Laboratory as at July 2016. Notes: SRISK is the expected capital shortfall of selected financial firms if there is another crisis (a fall of 40% in equity prices). Being a market-based measure, SRISK can vary significantly over time. See https://vlab.stern.nyu.edu/welcome/risk/
The trend line suggests that an inverse relationship exists between systemic risk as a percent
of GDP and restrictions on trade in financial services, though there is considerable dispersion.
Amongst the eight RCEP countries for which there was a V-Lab estimate of systemic risk as
at July 2016:
• Five had a higher-than-average WB STRI for financial services (Australia, China, India,
Japan, Malaysia and Thailand), with only China recording a significant extent of systemic
risk (around 6 per cent of GDP);
• Indonesia had only a small extent of systemic risk estimated, and its WB STRI for financial
services is typical for countries in that situation; and
• Korea had a significant amount of systemic risk (also about 6 per cent of GDP) and a
lower-than-average WB STRI for financial services, whereas Japan recorded the highest
estimate for systemic risk of the 36 countries in Figure 28 and a low level of barriers to
trade in financial services.
In view of the desirability of reducing extreme levels of systemic risk, it may be that Japan
might consider policy adjustments, such as increasing bank capital requirements.

Barriers to entry and financial integration in Asia and RCEP countries
Page 57
Australian Centre for Financial Studies +61 3 9666 1050 | australiancentre.com.au
2.6 Observations from the ERIA Coverage Index and Hoekman Index
The Economic Research Institute for ASEAN and East Asia (ERIA), based in Jakarta, was
established by the 16 now-RCEP-negotiating countries, after agreement at the Third East Asia
Summit in Singapore in 2007. ERIA works closely with the ASEAN Secretariat and
researchers and research institutes from East Asia to provide intellectual and analytical
research and policy recommendations. From a trade-in-financial-services perspective, ERIA’s
most pertinent contributions have been several research pieces61 on the restrictiveness (or
ambition) of ASEAN’s internal and ASEAN+1 services trade agreements, to seek to advance
liberalisation in services trade negotiations. The services chapters of the ASEAN Framework
Agreement on Services (AFAS) and ASEAN+1 FTAs adopt a GATS-style reporting, which
enables direct comparisons between GATS commitments and other ASEAN+1 FTAs.
Unlike the WB and OECD STRI databases, ERIA website’s database62 does not include this
trade-in-financial-services data, focusing instead on the equally worthy topic of non-tariff
barriers (NTBs) impeding trade in goods: it links through to WTO-UNCTAD-ERIA data on
NTBs based on official regulations (see also Ing et al (eds) 2016).63 It is worth mentioning in
addition that ERIA has also recently released several discussion papers on “regulatory
coherence” in particular RCEP economies.64 Thus far, these have focused on goods and non-
finance services: in due course, it would be very helpful if ERIA were to commission a similar
study on the unintended impediments from regulatory policies that limit achievement of the
goal of financial integration.
ERIA’s Coverage Index
ERIA’s Coverage Index (a concept introduced in Adlung and Roy 2005)65 is focused on the
trade agreements of ASEAN and the “Plus Six”. It is not an index of restrictions or
restrictiveness as are the World Bank or OECD STRIs: instead it measures the coverage of
service sectors by an FTA’s member countries and can thus be used to compare the coverage
61 See Hikari Ishido 2011 Liberalization of Trade in Services under ASEAN+n: A Mapping Exercise. ERIA Discussion Paper Series ERIA-DP-2011-02, May www.eria.org/ERIA-DP-2011-02.pdf ; Hikari Ishido and Yoshifumi Fukunaga 2012 Liberalization of Trade in Services: Toward a Harmonized ASEAN++ FTA. ERIA Policy Brief No. 2012-02, March http://www.eria.org/publications/policy_briefs/liberalization-of-trade-in-services-toward-a-harmonized-asean-fta.html ; Hikari Ishido 2015 Liberalisation of Trade in Services under ASEAN+1 FTAs: A Mapping Exercise. Chapter 6 in Ing, L.Y. (ed.) East Asian Integration. ERIA Research Project Report 2014-6, Jakarta: ERIA, pp.157-194 www.eria.org/RPR_FY2014_No.6_ed.1_Chapter_6.pdf . 62 ERIA website Database. http://www.eria.org/ 63 Lili Yan Ing, Santiago Fernandez de Cordoba and Olivier Cadot (eds) 2016 Non-Tariff Measures in ASEAN. ERIA, April http://www.eria.org/publications/key_reports/FY2015/No.01.html 64 These include regulatory coherence” studies, with case examples, for ASEAN, Australia, Japan, Korea and New Zealand. See ERIA website Discussion Papers. http://www.eria.org/publications/discussion_papers/index.html 65 Adlung, R. and M. Roy 2005 Turning Hills into Mountains? Current Commitments under the General Agreement on Trade in Services and Prospects for Change. Journal of World Trade, 39(6), pp.1161–1194.
Financial Integration in the Asia-Pacific
Page 58
Australian Centre for Financial Studies +61 3 9666 1050 | australiancentre.com.au
of different trade agreements, drawing attention to similarities and differences amongst the
ASEAN+1 FTAs.66
In a recent paper, Ishido (2015)67 ranks the coverage index scores of the Eighth Package of
Commitments under the ASEAN Framework Agreement on Services (AFAS–8),68 the Second
Package of Specific Commitments under the ASEAN–China Free Trade Area (ACFTA–2), the
ASEAN–Australia–New Zealand Free Trade Agreement (AANZFTA) and the ASEAN–Korea
Free Trade Agreement (AKFTA).
Overall, Ishido finds that the Coverage Index shows rather low levels of commitment by the
member countries, both towards financial services and on average for all services, well below
the coverage index for ASEAN’s priority integration sectors.69 However, the level of
commitment regarding opening up the insurance sector is assessed as greater than that for
banking and other financial services. In addition, the degree of liberalisation in terms of the
Coverage Index is highest under AFAS–8, leading Ishido to recommend AFAS–8 as the focal
point for convergence of the ASEAN+1 FTAs (that is, as the benchmark or baseline for RCEP).
According to Ishido, AFAS–8 is quite distinct, whereas the other three FTAs that he reviewed
(ACFTA, AANZFTA and AKFTA) are very similar, except that the Mode 4 commitment under
AANZFTA has a separate chapter on the movement of natural persons (that is, Mode 4).
66 The ‘Coverage Index’ is defined as ‘the share of commitments by FTA members in a certain sector’: when all the participating countries are committed (in each of their specific commitment tables) to a certain service sector, the value of the Coverage Index takes its maximum value of 1.0; when no participating countries are committed, the value is 0.0; when a commitment is made by some (not all) the countries, the Coverage Index takes a value between 0.0 and 1.0, depending on the number of countries with commitments. For instance, when half of the FTA member countries are committed to a particular service sector, the sector’s Coverage Index takes the value 0.5. The higher the estimate, the more liberal the country’s service trade commitments are to the FTA members. There are three broad types of commitments: No limitation (and bound) (N); Limited (or restricted) but bound (L); and Unbound (U). The Coverage Index can be calculated for each of these three commitments (or non-commitment for the case of U). 67 Hikari Ishido 2015 Liberalisation of Trade in Services under ASEAN+1 FTAs: A Mapping Exercise. Chapter 6 in Ing, L.Y. (ed.) East Asian Integration. ERIA Research Project Report 2014-6, Jakarta: ERIA, pp.157-194. 68 ASEAN has concluded nine packages of commitments under the AFAS signed by the AEM through five rounds of negotiations since 1 January 1996. In addition, there has also been five additional packages of commitments in financial services under the AFAS. See http://asean.org/asean-economic-community/sectoral-bodies-under-the-purview-of-aem/services/overview/ 69 ASEAN’s priority integration sectors are ‘01.B. Computer and Related Services’, ‘02.C. Telecommunication Services’, ‘04.B. Wholesale Trade Services’, ‘08.A. Hospital Services’, ‘09.B. Travel Agencies and Tour Operators services’, ‘09.C. Tourist Guides Services’, ‘11.A. Maritime Transport Services’, ‘11.B. Internal Waterways Transport’, ‘11.C. Air Transport Services’, ‘11.E. Rail Transport Services’, and ‘11.F. Road Transport Services’.

Barriers to entry and financial integration in Asia and RCEP countries
Page 59
Australian Centre for Financial Studies +61 3 9666 1050 | australiancentre.com.au
Table 12: Coverage Index calculations for financial services at the 55-sector level, by ASEAN agreement and sub-sector.
ASEAN AGREEMENT
COMMITMENT 07. FINANCIAL SERVICES MEMO: AVERAGE
OF 55 SECTORS
07.A All insurance and
insurance-related
services
07.B Banking and other financial services
07.C Other
AFAS-8 N 0.47 0.38 0.05 0.38
L 0.12 0.10 0.05 0.09
U 0.41 0.52 0.90 0.53
ACFTA-2 N 0.38 0.32 0.02 0.20
L 0.15 0.11 0.00 0.04
U 0.47 0.57 0.98 0.76
AANZFTA N 0.34 0.34 0.03 0.23
L 0.37 0.31 0.26 0.27
U 0.29 0.35 0.71 0.51
AKFTA N 0.32 0.24 0.03 0.19
L 0.15 0.09 0.01 0.04
U 0.53 0.67 0.95 0.77 Source: Hikari Ishido 2015 Liberalisation of Trade in Services under ASEAN+1 FTAs: A Mapping Exercise. Chapter 6 in Ing, L.Y. (ed.), East Asian Integration. ERIA Research Project Report 2014-6, Jakarta: ERIA, pp.157-194. Chapter 6, pp161-163, Table 6.1: List of Coverage Index Calculations at the 55-sector Level, calculated from the database constructed (version updated on 3 October 2013). Notes: Bold is Ishido’s emphasis. Calculations are simple averages of the values for the most detailed 154 sub-sectors under the 55-sector classification code. The types of commitments are ‘No limitation’ (N), ‘Limited commitment’ (L), and ‘Unbound’ (U). The Coverage Index can be calculated for each of these three commitments (or non-commitment for the case of U).
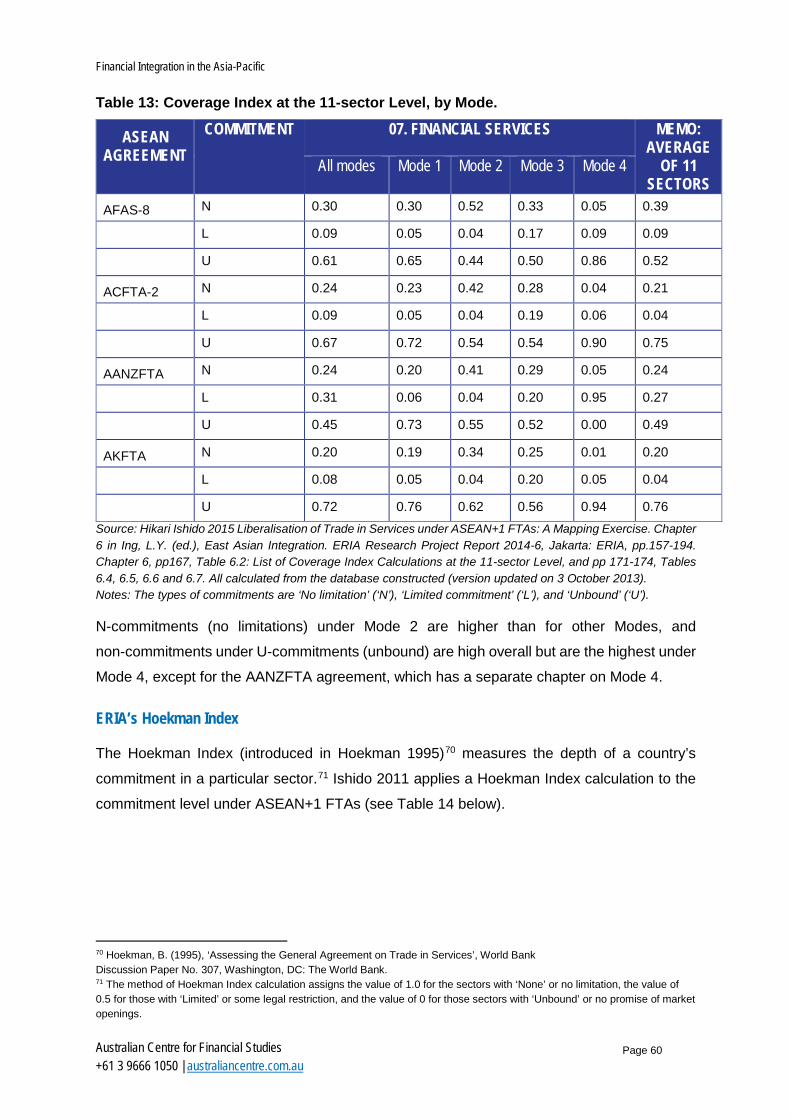
Financial Integration in the Asia-Pacific
Page 60
Australian Centre for Financial Studies +61 3 9666 1050 | australiancentre.com.au
Table 13: Coverage Index at the 11-sector Level, by Mode.
ASEAN AGREEMENT
COMMITMENT 07. FINANCIAL SERVICES MEMO: AVERAGE
OF 11 SECTORS
All modes Mode 1 Mode 2 Mode 3 Mode 4
AFAS-8 N 0.30 0.30 0.52 0.33 0.05 0.39
L 0.09 0.05 0.04 0.17 0.09 0.09
U 0.61 0.65 0.44 0.50 0.86 0.52
ACFTA-2 N 0.24 0.23 0.42 0.28 0.04 0.21
L 0.09 0.05 0.04 0.19 0.06 0.04
U 0.67 0.72 0.54 0.54 0.90 0.75
AANZFTA N 0.24 0.20 0.41 0.29 0.05 0.24
L 0.31 0.06 0.04 0.20 0.95 0.27
U 0.45 0.73 0.55 0.52 0.00 0.49
AKFTA N 0.20 0.19 0.34 0.25 0.01 0.20
L 0.08 0.05 0.04 0.20 0.05 0.04
U 0.72 0.76 0.62 0.56 0.94 0.76 Source: Hikari Ishido 2015 Liberalisation of Trade in Services under ASEAN+1 FTAs: A Mapping Exercise. Chapter 6 in Ing, L.Y. (ed.), East Asian Integration. ERIA Research Project Report 2014-6, Jakarta: ERIA, pp.157-194. Chapter 6, pp167, Table 6.2: List of Coverage Index Calculations at the 11-sector Level, and pp 171-174, Tables 6.4, 6.5, 6.6 and 6.7. All calculated from the database constructed (version updated on 3 October 2013). Notes: The types of commitments are ‘No limitation’ (‘N’), ‘Limited commitment’ (‘L’), and ‘Unbound’ (‘U’).
N-commitments (no limitations) under Mode 2 are higher than for other Modes, and
non-commitments under U-commitments (unbound) are high overall but are the highest under
Mode 4, except for the AANZFTA agreement, which has a separate chapter on Mode 4.
ERIA’s Hoekman Index
The Hoekman Index (introduced in Hoekman 1995)70 measures the depth of a country’s
commitment in a particular sector.71 Ishido 2011 applies a Hoekman Index calculation to the
commitment level under ASEAN+1 FTAs (see Table 14 below).
70 Hoekman, B. (1995), ‘Assessing the General Agreement on Trade in Services’, World Bank Discussion Paper No. 307, Washington, DC: The World Bank. 71 The method of Hoekman Index calculation assigns the value of 1.0 for the sectors with ‘None’ or no limitation, the value of 0.5 for those with ‘Limited’ or some legal restriction, and the value of 0 for those sectors with ‘Unbound’ or no promise of market openings.

Barriers to entry and financial integration in Asia and RCEP countries
Page 61
Australian Centre for Financial Studies +61 3 9666 1050 | australiancentre.com.au
Table 14: Hoekman index for financial services in AFAS, AANZFTA and ACFTA, by country and sub-sector.
AFAS AANZFTA ACFTA
Financial services sub-sector
07A 07B 07C 07A 07B 07C 07A 07B 07C
Country
Brunei 0 0 0 0.39 0.01 0 0 0 0
Cambodia 0 0 0 0.72 0.56 0 0.73 0.52 0
Indonesia 0 0 0 0.28 0.18 0 0 0 0
Laos 0 0 0 0 0.31 0 0.19 0 0
Malaysia 0 0 0 0.36 0.43 0 0.19 0.69 0
Myanmar 0 0 0 0 0 0 0 0 0
Philippines 0 0 0 0.42 0.47 0 0 0 0
Singapore 0 0 0 0.47 0.53 0 0.48 0.51 0
Thailand 0 0 0 0.3 0.03 0 0 0 0
Viet Nam 0 0 0 0.75 0.47 0.44 0.75 0.46 0.44
ASEAN Average 0 0 0 0.37 0.30 0.04 0.27 0.24 0.04
Australia 0.13 0.25 0 - - -
New Zealand 0.2 0.25 0 - - -
China - - - 0 0 0
Total Average 0.33 0.29 0.04 0.24 0.21 0.04 Source: Hikari Ishido 2011 Liberalization of Trade in Services under ASEAN+n: A Mapping Exercise. ERIA Discussion Paper Series ERIA-DP-2011-02, May. Table 1, 2 and 3. Sub-sectors: 07A All Insurance and Insurance-related Services; 07B Banking and Other Financial Services; and 07C Other.
On the Hoekman Index results in Ishido 2011, it would seem Viet Nam and Cambodia made
the greatest depth of commitments in financial services, followed by Singapore and the
Philippines. Amongst ASEAN countries, often the depth of commitment for 07B Banking and
Other Financial Services is slightly higher than the depth of commitment in 07A All Insurance
and Insurance-related Services. The depth of commitments made by Australia and New
Zealand in AANZFTA were found by Ishido to be below the overall average (presumably
because the starting points for Australia and New Zealand were already lower) as were the
depth of commitments made by China in ACFTA.
The Hoekman Index results by country for the various trade agreements seem not to reflect
differences such as exchange rate regime but may reflect better some differences in appetite
to benefit from financial sector opening leading to entry of foreign competition.

Financial Integration in the Asia-Pacific
Page 62
Australian Centre for Financial Studies +61 3 9666 1050 | australiancentre.com.au
2.6 Summary on reducing “unnecessary” barriers to trade in financial services
Of the three “prudential carve-out” drivers of barriers to trade in financial services, it would
seem that the choice of exchange rate regime gives greatest insight. Exchange rate regimes
that are intermediate, neither fully fixed nor fully flexible, seem associated with higher barriers
to trade in financial services, whereas different consumer protection regimes and
macroprudential regimes give more ambiguous signals regarding barriers to trade in financial
services.
On the one hand this is unfortunate, as many RCEP countries have those intermediate
exchange rate regimes and have higher-than-average barriers to trade in financial services.
Grenville (2000) has given the strongest economics-and-central-banking view on the
appropriateness of use of the “prudential carve-out”, making clear it is fundamental in the many
countries that have less advanced financial sectors and less than a fully floating exchange
rate.72 This observation is especially apposite in Asian countries: as is widely recognised after
the 1997 Asian Financial Crisis, the experience of Asian countries has made avoiding a repeat
of such exchange rate instability and financial crisis the highest policy priority in Asia-Pacific
countries, including in ASEAN, China, Japan and Korea.
On the other hand, however, there is some encouragement for the proponents of lower
barriers to trade in financial services. As countries transition between exchange rate regimes
in line with their progress in economic and financial development, there is a general movement
towards more flexible exchange rates.73 China, for instance, is moving to implement a more
market-based exchange rate,74 and other RCEP countries with managed regimes may
harbour similar ambitions. The case for lowering barriers to trade in financial services, where
those barriers are high, is very strong both in its own right but also as more liberalised
exchange rate regimes are adopted.
72 Stephen Grenville 2000 Exchange Rate Regimes for Emerging Markets. Reserve Bank of Australia Bulletin, November http://www.rba.gov.au/publications/bulletin/2000/nov/pdf/bu-1100-2.pdf 73 Naoyuki Yoshino, Sahoko Kaji and Tamon Asonuma 2015 Adjustments of Capital Account Restrictions and Exchange Rate Regimes in East Asia. Asian Development Bank Institute Working Paper No. 518, March https://www.adb.org/sites/default/files/publication/159838/adbi-wp518.pdf 74 Guonan Ma and Rodney Maddock 2017 Chinese capital account liberalisation: process, structure and consequences. Australian Centre for Financial Studies project Financial Integration in the Asia-Pacific, May https://australiancentre.com.au/wp-content/uploads/2017/05/Chinese-capital-account-liberalisation.pdf

Barriers to entry and financial integration in Asia and RCEP countries
Page 63
Australian Centre for Financial Studies +61 3 9666 1050 | australiancentre.com.au
3. INSTITUTIONAL ARRANGEMENTS PROMOTING FINANCIAL INTEGRATION Part 3 explores the institutional arrangements promoting financial integration through two case
studies (the Asia Region Funds Passport (ARPF) and ASEAN initiatives for financial
integration), to develop lessons for the possible role of the RCEP negotiations in creating a
framework for future cooperation in reducing unnecessary barriers to trade in financial services
and making other advances in financial development. The ASEAN framework seems
particularly slow: but even the more focused ARFP initiative still has not seen a dollar of cross-
border investment of retail funds after seven years of engagement. The chief lessons are the
need to build focus and timeliness in the mechanism for dialogue and follow-up.
One key factor determining what can be done now in the RCEP negotiations is the urge to
complete negotiations expeditiously. This may limit time for progressing specific items,
especially in terms of liberalising trade in financial services, where uncertainties including lack
of data and other organisational complexities hold back substantive progress.
The RCEP negotiators should establish mechanisms for ongoing annual dialogue, with
responsibilities and accountabilities assigned, and wherever possible bringing in the private
sector to help set priorities.
3.1 The global and regional regulatory structure for financial services
This section addresses the global and regional bodies involved in international cooperation in
regulation of banking, insurance, securities and anti-money laundering and counter-terrorism
financing (AML/CFT). A key recognition is that financial services regulation has to be national,
even while globalisation and integration urge higher level responses of common standards
and harmonisation.
Both before and especially after the global financial crisis, there has been considerable effort
to strengthen financial services regulation at all levels: global, regional and national. As Table
15 outlines, for every type of regulator and financial issue, there are global organisations
promoting financial sector regulatory philosophy, practices, standards and cooperation, and
in each case there is a corresponding regional organisation that relates to, interacts with
and/or takes on board the deliberations of the global organisations.

Financial Integration in the Asia-Pacific
Page 64
Australian Centre for Financial Studies +61 3 9666 1050 | australiancentre.com.au
Table 15: Summary structure of global and regional organisations for regulation of financial services.
REGULATORY PERSPECTIVE
GLOBAL ORGANISATION ASIA REGIONAL ORGANISATION
• Oversight of financial services policy and regulation
• Group of Twenty (G20) • Financial Stability Board
(FSB) • Joint Forum
• Asia-Pacific Economic Cooperation (APEC)
• Association of Southeast Asian Nations (ASEAN)
• Banking • Basel Committee on Banking Supervision (BCBS)
• Committee on Payments and Market Infrastructures (CPMI)
• Executives’ Meeting of East Asia-Pacific Central Banks (EMEAP)
• South East Asian Central Banks (SEACEN), ASEAN Central Bank Forum ASEAN Plus Three (APT) Macroeconomic Research Office (ACBF), (AMRO), (ABIF) and other groupings
• Insurance • International Association of Insurance Supervisors (IAIS)
• Asian Forum of Insurance Regulators (AFIR)
• ASEAN Insurance Council (ASEANIC)
• Securities • International Organization of Securities Commissions (IOSCO)
• Asia-Pacific Regional Committee (IOSCO) (APRC)
• Anti Money Laundering and Countering the Financing of Terrorism (AML/CFT)
• Financial Action Task Force (FATF)
• Egmont Group of Financial Intelligence Units (Egmont Group)
• Asia/Pacific Group on Money Laundering (APG)
Source: the author.
While the global-regional-country interaction across these organisations is variable, there is
no case for trade negotiators from a group of countries such as the RCEP countries to insert
themselves, or the RCEP agreement being negotiated, into this interaction.
Annex A highlights which global organisations have some members from amongst the RCEP
countries, and the ways in which RCEP economies are also engaged in Asia-Pacific regional
organisations committed to supporting or implementing the global ideals and standards. There
is already a great deal of cooperation amongst the financial regulators in RCEP countries.
Generally, the larger RCEP-negotiating countries are almost always represented in global
organisations, though some are absent from some organisations, presumably by choice. In

Barriers to entry and financial integration in Asia and RCEP countries
Page 65
Australian Centre for Financial Studies +61 3 9666 1050 | australiancentre.com.au
general, even the smaller, less developed RCEP-negotiating countries are well represented
unless they do not have the industry/regulator already established.
The regulators in each country also participate in international cooperation at the bilateral and
sub-regional level depending on resources and demand. Bilateral engagement is often
assisted by memorandums of understanding (MoUs) between the agencies for cooperation,
information exchange and assistance.
3.2 Regionally-driven financial services regulatory cooperation and integration
This section draws out examples of Asia-region-driven financial services regulatory
cooperation and integration, considering two case studies: the ARFP initiative and the financial
services regulatory cooperation and integration pursued by the ASEAN. One focus is on the
role of officials (policy makers, regulators and trade negotiators); another is the extent of
private sector/industry engagement; and a third is the mechanism for cooperation.
Case study A. Asia Region Funds Passport
The ARFP initiative is seeking to open up access in Asia to similar benefits achieved through
the Undertakings for Collective Investment in Transferable Securities (UCITS) scheme first
adopted in the European Union (EU) in 1985. UCITS enables funds to be freely marketable
across the EU provided local individual country marketing requirements are met, distributable
to both retail and institutional investors. Funds issued under the UCITS scheme are often
available in Asian financial markets in the absence of an Asian scheme with broad coverage
for funds passporting.
A Memorandum of Cooperation (MoC) was signed by Australia, Japan, Korea and New
Zealand on 28 April 2016, to come into effect on 30 June 2016.75 The initiative is open to any
APEC economy that signs, and participating economies have up to 18 months from 30 June
2016 to implement domestic arrangements. Activation of the Passport will occur as soon as
any two participating economies implement the arrangements under the MoC.
Background: In September 2013, Singapore, Australia, Korea and New Zealand signed a
Statement of Intent to jointly develop the ARFP to facilitate cross-border offers of funds in the
APEC region76. In April 2014, the signatories, together with Philippines and Thailand, issued
a joint consultation paper on the proposed rules and arrangements that will govern the
75 APEC 2016 Asia Region Funds Passport Memorandum of Cooperation. 28 April http://fundspassport.apec.org/2016/04/28/asia-region-funds-passport-memorandum-of-cooperation/ 76 The ARPF’s official APEC website shows the first milestone of the journey to the ARPF as the Johnson Report of 2010. See http://fundspassport.apec.org/about/asia-region-funds-passport-milestones/

Financial Integration in the Asia-Pacific
Page 66
Australian Centre for Financial Studies +61 3 9666 1050 | australiancentre.com.au
operation of the ARFP. Japan signalled its interest in participating in 2015: thus, seven “pilot”
economies (Australia, Japan, Korea, New Zealand, the Philippines, Singapore and Thailand),
all RCEP countries, have been working together towards the launch of the ARFP and five
have signed the MoC. The cost of the progress to date to one of the parties is said to have
been around US$7 million.77
The ARFP initiative has not been proceeding in isolation. Two somewhat similar Asia funds
management passporting/mutual recognition schemes are already in place and some funds
approved,78 though the absence of data suggests that little cross-border retail investment
funds may actually yet have been raised:
• An ASEAN Collective Investment Scheme (CIS) Framework for cross-border offerings of
collective investment schemes was launched in August 2014 under the ASEAN Capital
Markets Forum (ACMF), with managers in Singapore, Malaysia and Thailand able to
passport their compliant domestic funds to retail investors in these three countries. A
number of funds have been approved by the respective regulators as qualifying ASEAN
CIS under the respective frameworks (most from Malaysia and Singapore), and Viet Nam
and Indonesia have signed on to join. The ACMF indicated in March 2016 that 13 funds
have been recognised by their home jurisdictions as Qualifying ASEAN CIS, five of which
have been approved and launched in a host jurisdiction; and
• Securities regulators of Hong Kong, China and of Mainland China have agreed a Mutual
Recognition of Funds (MRF) arrangement. From July 2015, compliant funds domiciled and
managed by a compliant regulated asset manager in one can be distributed in the other
to retail investors. The first funds under the MRF were approved in December 2015, with
three (“north-bound”) Hong Kong funds being approved to be offered to Chinese investors,
and four (“south-bound”) Chinese funds being approved for distribution in Hong Kong.
Recent reports suggest some 48 or 49 mainland funds have been approved to sell in Hong
Kong (as Recognised Mainland Funds), of which half may have begun actual sales, and a
77 Disclosed by a participant at an RCEP Roundtable in Perth on 25 April 2016. 78 Suzanne Gibson 2015 Asian funds passporting: who will become the Luxembourg of Asia? King Wood Mallesons, 16 September http://www.kwm.com/en/au/knowledge/insights/asian-retail-funds-passporting-20150916 PwC 2015 Mainland and Hong Kong Mutual Recognition of Funds (MRF) – A new era for asset management in China and Hong Kong. July http://www.pwccn.com/webmedia/doc/635689436431726079_am_cnhk_mrf_jun2015.pdf Matthew Nortcliff and David Lazell 2016 Get your passport… cross-border marketing of retail funds in Asia Pacific. Nabarro, 3 February http://www.nabarro.com/insight/briefings/2016/february/get-your-passport%E2%80%A6-cross-border-marketing-of-retail-funds-in-asia-pacific/ ACMF 2016 ASEAN capital market regulators roll out initiatives under ACMF’s new 5-year roadmap. Press Release for 24th ACMF Meeting, Bangkok, 25 March http://www.theacmf.org/ACMF/upload/press_release_for_acmf_meeting_25_mar_2015.pdf

Barriers to entry and financial integration in Asia and RCEP countries
Page 67
Australian Centre for Financial Studies +61 3 9666 1050 | australiancentre.com.au
much smaller number have been approved for mainland distribution but have garnered
more inflows.79
Modus operandi: Passporting operates under a slightly different model to mutual recognition.80
With passporting, participating regulators initially undertake due diligence on each other’s
regulatory frameworks to ensure that they are each satisfied with the level of regulation in the
other jurisdictions: the levels of regulation do not have to be mutually recognised as the same
in effect. Once agreement is reached, a common set of rules is agreed.
Approach: The ARFP initiative has adopted the APEC approach, consistent with the APEC
Leaders’ advocacy of “open regionalism”, involving regional collaboration by governments and
business and communities to implement agreed objectives. As with the “ASEAN way”, no
country has been forced to participate. The ARFP is a pilot: it will be open to others and
increased participation is hoped to bring scale, economic, commercial and social benefits and
advance cross-border issuance across the region.
Direct and indirect benefits: From each participating country’s perspective, the ARFP will bring
gains for industry and consumers, lowering costs and increasing competitiveness in financial
services, contributing to economic growth and increasing efficiencies in the country and in the
region.
The impact on domestic capital markets should include increased diversification and risk
sharing without the risks associated with increased competition from entry of new capital for
credit intermediaries. Achieving the benefits will depend in part on streamlining regulatory and
tax arrangements.
Implementation: To come into force, the MoC for the ARFP requires domestic approval of
arrangements for the governance and operational aspects of the ARFP. There will have to be
a balance between enhanced market efficiency and investor protection. Regulators will be
required to recognize “sufficient equivalence” in their respective regimes. For this to be
effective, there is a requirement for cooperation between relevant regional regulatory
authorities, transparency and clearly agreed guidelines.
79 For instance, see https://bravurasolutions.com/blog/2017/01/hk-china-mutual-recognition-of-funds-slow-start-belies-market-potential/ and http://www.sfc.hk/productlistWeb/searchProduct/UTMF.do and http://www.fundselectorasia.com/news/1036310/schroders-fund-breaks-mrf-approval-deadlock#sthash.W3chXIKi.dpuf 80 Carla Hoorweg 2015 Mutual recognition arrangements - Australia and Asia. Paper for the 20th ACFS Melbourne Money & Finance Conference, July http://www.australiancentre.com.au/sites/default/files/NewsDocs/Day1Paper7%20-%20Carla%20Hoorweg.pdf
Financial Integration in the Asia-Pacific
Page 68
Australian Centre for Financial Studies +61 3 9666 1050 | australiancentre.com.au
Opportunity: One possibility arising from the ARFP progress to date for the RCEP negotiations
is that the seven “pilot” ARFP countries (including the four ARFP MoC signatories) could
specifically commit to providing a forum for attracting some of the nine non-pilot countries to
join the ARFP. This might involve assistance for those countries with newer and more closed
capital markets.
Gauge of effectiveness: the initial tests will be the number of funds launched in countries using
the passporting regime as soon as it is available, the amount of funds raised and the number
of countries joining the ARFP. In the longer term, the test will be the relaxation of some of the
qualifying requirements, to allow more sophisticated CIS offerings, and the achievement of
sustained benefits from cross-border funds flows that exceed the costs of the ARFP
negotiations.
Case study B. ASEAN initiatives on financial integration
The ASEAN, founded in 1967, has been built on aspirational objectives to integrate and
develop, and the financial sector has been recognised as a key sector for development and
integration. It is quite different in all respects from the centralised single-market-with-
passporting-focused EU. A series of ASEAN collective agreements has seen progress across
a wide number of areas and a substantial and inevitably complex framework of institutional
and operational arrangements has developed over the decades. Key milestones have been:
• entry into force of the ASEAN Free Trade Area (AFTA) in 1993;
• signing of the ASEAN Framework Agreement on Services (AFAS) in 1995;
• adoption of the ASEAN Economic Community (AEC) Blueprint in 2007; and
• AEC establishment in 2015 and ambitions set out for the AEC for 2025.
Progress with services integration, including financial services, has been comprehensively
reviewed – with constructive criticism – in the 2015 ASEAN Services Integration Report, a joint
review by the ASEAN Secretariat and the WB,81 henceforth the “Joint Review”.82
81 The ASEAN Secretariat and the World Bank 2015 ASEAN Services Integration Report. A Joint Report by the ASEAN Secretariat and the World Bank. Jakarta and Washington, DC. http://www.asean.org/storage/images/2015/November/asean-services-integration-report/ASEAN_Services_Integration_Report.pdf . An earlier review had set the scene, see The ASEAN Secretariat and the World Bank 2014. ASEAN Integration Monitoring Report. Joint Report of the ASEAN Secretariat and the World Bank. Jakarta and Washington, DC. http://www.asean.org/storage/images/resources/2014/Feb/association%20of%20southeast%20asian%20nations%20asean%20integration%20monitoring%20report%20%20a%20joint%20report%20by%20the%20asean%20secretariat%20and%20the%20world%20bank%20english.pdf 82 The joint review received external contributions and support from the Government of Australia through the ASEAN-Australia Development Cooperation Program Phase II (AADCP II).

Barriers to entry and financial integration in Asia and RCEP countries
Page 69
Australian Centre for Financial Studies +61 3 9666 1050 | australiancentre.com.au
ASEAN progress in reducing barriers to trade in financial services and integrating financial services
The Joint Review found impediments to financial services trade and integration and
recommended significant changes to improve the effectiveness and implementation of agreed
policies, including increased regulatory cooperation. It observed the risk that:
“if ASEAN fails to advance toward the elimination of regulatory restrictions to trade in
services, the conclusion of FTAs with third parties may do away with the ASEAN
services integration agenda altogether. A central message … is that, to maintain the
progress made in obtaining reciprocal preference on services under the AFAS and to
advance toward an effective single market, ASEAN Member States need to strengthen
the agenda for cooperation on the regulation of services”.
The Joint Review recognised that “ASEAN Member States are working to deepen financial
services integration in the ASEAN context”, and itemised the ASEAN Banking Integration
Framework (ABIF) agreed by ASEAN Finance Ministers, which will enable “Qualified ASEAN
Banks” (QABs) to have a greater role in promoting intraregional trade and investment, as an
area of progress that is now part of the Protocol to implement the 6th Package of Financial
Services under the AFAS.
However, it also found in summary that effective liberalisation and integration for all services
including financial services is impeded by the existing ASEAN framework, and needs to focus
on enhanced regulatory cooperation and discipline, and on implementation of commitments.
The Joint Report was able to update to 2012 the WB STRI for the six ASEAN countries in the
2008 WB STRI and collected data for three more ASEAN member states (Singapore, Lao
P.D.R. and Myanmar: only Brunei Darussalam is still not included), and provided in-depth
description of the state of play in ASEAN. It reviewed in detail restrictions in banking and some
insurance sectors regarding foreign ownership:
• Regarding banking, it found that banking sector policies on market access for foreign
banks in Malaysia, Thailand, and Viet Nam were more restrictive than in the other ASEAN
countries, because they restricted the establishment of new financial entities even more
than the acquisition of existing ones and/or discriminated on their operations; and
• In automobile and life insurance, it found that Lao P.D.R., Malaysia, Myanmar, and
Thailand have the more restrictive market access policies.

Financial Integration in the Asia-Pacific
Page 70
Australian Centre for Financial Studies +61 3 9666 1050 | australiancentre.com.au
Worryingly, the Joint Report found that, in regard to all services trade (not just financial
services), the overall policy regime in 2012 was little more liberalised than in 2008, and that
ASEAN has not been integrating faster internally than externally.
Regarding the financial service sectors, the Joint Report found that:
• there is a big gap between what had been committed by ASEAN countries under AFAS (a
very modest liberalisation from what had been committed under GATS and offered in the
Doha Round) and the policies actually applied by ASEAN member states (which are
significantly more restrictive), and further liberalisation has been committed to under the
AEC 2015 Blueprint; and
• “the ASEAN Member States have an average [WB] STRI higher than that of most other
regions, and the pace of recent reform has been gradual. … While the absence of
preferences is not a problem, the absence of reform is. Member States will need to reduce
the remaining explicit barriers to foreign entry and ownership — ideally on an MFN basis
— to achieve the Blueprint Goals”.
ASEAN’s institutional framework for financial services trade liberalisation
Part of the problem, seen by the Joint Review and others, is ASEAN’s institutional framework
for services trade liberalisation, which is sizable and evolving but is insufficiently coordinated,
hampering the region’s ability to conduct a comprehensive, coherent approach to the
integration of services markets.
ASEAN has four bodies covering financial services issues:
• The Coordinating Committee on Services (CCS), the main body involved in services
trade negotiations, reporting to the ASEAN Economic Ministers through the Senior
Economic Officials Meetings (SEOMs), which provide political guidance;
• The ASEAN Finance Ministers Meeting and its Working Committee on ASEAN Financial Services Liberalisation (WC-FSL), carrying forward negotiations on financial
services (the WC-FSL representatives are generally officials from the finance ministries,
central banks, monetary authorities, and securities and insurance regulators);
• The ASEAN Central Bank Governors’ Meeting (ACGM), advancing specific financial
trade integration matters, such as approving the ASEAN Banking Integration Framework
(ABIF) in December 2014, which enables “Qualified ASEAN Banks” (QABs) to conduct
cross-border business. (The provision for enabling QAB implementation was signed by
ASEAN Finance Ministers in March 2015.); and

Barriers to entry and financial integration in Asia and RCEP countries
Page 71
Australian Centre for Financial Studies +61 3 9666 1050 | australiancentre.com.au
• The ASEAN Capital Markets Forum (ACMF), carrying forward initiatives to promote freer
flow of capital and greater connectivity of ASEAN capital markets (including through the
ASEAN Capital Market Development Programme and its Working Committee on Capital
Market Development (WC-CMD)), and the deepening and strengthening bond markets in
the region (also being addressed by the Asian Bond Markets Initiative (ABMI).
The ASEAN Economic Community and the ASEAN Economic Blueprint 2025
The establishment of the ASEAN Economic Community (AEC) in 2015 has been seen as a
major milestone in the regional economic integration agenda in ASEAN, and the outcome of
the AEC Blueprint (2008-2015). A new blueprint, The AEC Blueprint 2025, is aimed towards
achieving the vision of having an AEC by 2025 that is, amongst other development goals,
highly integrated.
The AEC seeks to create Public Private Sector Engagement (PPE),83 under established
ASEAN rules of engagement.84 According to the PPE posting:
• Regular (annual) dialogues have been held between the ASEAN Economic Ministers and
the ASEAN Business Advisory Council (ASEAN-BAC) as well as between ASEAN bodies
and the representatives of industry associations and business councils from ASEAN and
Dialogue Partner countries.
• Such dialogues between ASEAN and private sector representatives have produced
several important recommendations and policy options in support of more effective
ASEAN economic integration.
However, PPE remains a challenge. Researchers85 have observed that the “AEC may be led
by governments, but it cannot succeed without fully engaging business and the public at large.
But it seems that efforts to prepare the private sector have enjoyed negligible success and
public awareness is equally abysmal”.
The ASEAN Banking Integration Framework
ASEAN countries have negotiated an ABIF, endorsed by ASEAN central bank governors in
December 2014, to enable banks with QAB status to operate freely in neighbouring countries
and receive national treatment equivalent to that of local banks. The ABIF arrangements and
83 ASEAN AEC website undated Public Private Sector Engagement (PPE). http://www.asean.org/asean-economic-community/sectoral-bodies-under-the-purview-of-aem/public-private-sector-engagement-ppe/ 84 ASEAN AEC website undated Rules of Procedures for Private Sector Engagement Under the ASEAN Economic Community. http://www.asean.org/storage/images/2013/economic/Rules%20of%20Procedures%20for%20PPE%20-%20for%20website.pdf 85 Menon, Jayant and Melendez, Anna Cassandra 2015 Realizing an ASEAN Economic Community: Progress and Remaining Challenges ADB Economics Working Paper Series, No. 432, http://hdl.handle.net/11540/4381

Financial Integration in the Asia-Pacific
Page 72
Australian Centre for Financial Studies +61 3 9666 1050 | australiancentre.com.au
the specific qualifying criteria for QABs will be agreed between countries mutually on a bilateral
basis.86 The central banks of Philippines and Malaysia in mid-March 2016 agreed on the
guidelines regarding the entry of qualified ASEAN banks between the Philippines and
Malaysia, and Malaysia's central bank has said it has signed agreements with its counterparts
in Thailand and the Philippines on market access and operational flexibility for lenders.
The AEC 2025 Strategic Action Plans for Financial Integration target the establishment of the
first two QABs in 2018-2019 and at least before 2025.87 The potential for more complexity is
obvious:
• There are 45 possible bilateral ABIF QAB agreements within the 10 ASEAN countries
[(10*9)/2]; and
• If the RCEP negotiations were to see the “Plus Six” included in the ABIF, the number of
possible bilateral ABIF QAB agreements would reach 120 [(16*15)/2].
This would appear to add to the fear of multiple ‘noodle bowls’ of agreements.
In addition, others have observed that important issues relating to bankruptcy and
administration, access to lender-of-last-resort facilities, macroprudential policy, depositor
preference and deposit insurance, all issues that might euphemistically be described as
“lessons from Europe”, still need to be addressed within the ABIF framework, see for example
Davis 2015.88
The ASEAN Insurance Integration Framework
Insurance is also being liberalised by ASEAN Member States under AFAS, albeit more slowly
than banking, through the AIIF,89 starting with the cross-border supply of marine, aviation and
goods in international transit insurance and exploring more sub-sectors to liberalise.
The ASEAN Capital Markets initiatives
86 Muhammad bin Ibrahim 2015 ASEAN financial integration - outlook and implications. ASEAN Risk Conference: "ASEAN financial integration - outlook and implications", Kuala Lumpur, 14 May http://www.bis.org/review/r150522a.htm 87 ASEAN Economic Community 2025 Strategic Action Plans (SAP) for Financial Integration 2016-2025 undated. 88 Kevin Davis 2015 Asian Banking Integration, Depositor Preference, and Deposit Insurance. Draft prepared for the Finance in Asia: Regulating Regional Markets Conference at the University of Hong Kong, Faculty of Law, 6 November http://www.kevindavis.com.au/secondpages/workinprogress/Asian%20Banking%20Depositor%20Preference%20and%20Deposit%20Insurance.pdf 89 ASEAN 2015 Insurance Sector Integration: Supporting Growth through Better Risk Management. October http://www.asean.org/storage/images/2015/October/outreach-document/Edited%20Insurance%20Sector%20Integration-1.pdf

Barriers to entry and financial integration in Asia and RCEP countries
Page 73
Australian Centre for Financial Studies +61 3 9666 1050 | australiancentre.com.au
The ASEAN Capital Markets initiatives90 are a joint initiative of the ASEAN central banks and
monetary authorities, the ASEAN Secretariat and the Asian Development Bank (ADB).
The coverage is significant: ASEAN’s financial integration framework spans financial services,
capital accounts, payments and settlement systems, and capital markets. Integration efforts
are to be complemented by capacity-building initiatives, infrastructure building, and an
enabling intermediation environment for effective and efficient for financial flows, while
ensuring that appropriate safeguards are in place to preserve financial stability.
Progress is likely to be gradual, as individual ASEAN member states are accorded flexibility
to determine the timelines and preconditions corresponding to the state of preparedness of
their economies.
Lessons for ASEAN financial services reform from Singapore
One highlight of the Joint Report is that it presented Singapore’s liberalisation of financial
services trade and other regulations as a best-practice example for other ASEAN countries.
Singapore is by far the most successful at trade in financial services within ASEAN and – on
recorded data – amongst all 16 RCEP countries, and its financial services sector is the most
integrated in the region. Singapore’s reforms have been comprehensive and focused on
financial system stability, opening the market to foreign banks and insurance companies with
high prudential standards and actively preparing the domestic financial sector for increased
competition.
The take-away from the Singapore example is that ASEAN processes and the ASEAN
institutional and operational frameworks for services trade liberalisation have not played a
major role in Singapore’s successful development of a sustainable financial services sector.
What has been key to Singapore’s success has been a willingness to benefit from lowering
barriers to trade in financial services and to impose high prudential standards on all in the
financial services sector. Cooperation between policy-makers and regulators has been an
example to all, and other countries’ regulators have had to take the reforms undertaken in
Singapore into account.
90 Asian Development Bank 2013 The road to ASEAN financial integration: A combined study on assessing the financial landscape and formulating milestones for monetary and financial integration in ASEAN. Mandaluyong City, Philippines: Asian Development Bank. http://www.adb.org/sites/default/files/publication/30202/road-asean-financial-integration.pdf

Financial Integration in the Asia-Pacific
Page 74
Australian Centre for Financial Studies +61 3 9666 1050 | australiancentre.com.au
3.3 Regulatory and other cooperation arising from trade agreements
This section seeks to draw out what trade agreements have achieved in terms of liberalisation
of trade in financial services and market access and how it has been achieved. The focus is
on the framework and processes initiated by the negotiations and the Agreements for
regulatory cooperation, transparency and involvement of the private/business sector.
Many trade agreements between RCEP-negotiating countries include the establishment of a
committee or working group on financial services, comprised of policy officials and
representatives from regulators, to implement FTA financial services commitments and
support cooperation efforts in financial services. The key is often responsibility and
accountability, driven by a timetable.
AKFTA (ASEAN Korea Free Trade Agreement)
AKFTA’s agreement on Trade in Services provides for the progressive liberalisation of the
services sector through substantial sectoral coverage, which includes all modes of supply.
Economics ministers are responsible for processes for advancing trade and investment in
financial services, guided by the framework for the ASEAN Korea Comprehensive Economic
Partnership.
AANZFTA (ASEAN + Australia and New Zealand)
One of the key features of the AANZFTA is that it provides a platform for ongoing economic
engagement with ASEAN through a range of built-in agendas, economic cooperation projects
and business outreach activities. ASEAN has said the outcome on services was good, based
on the inclusion of “WTO Plus” services commitments including for financial services.
KAFTA (Korea-Australia FTA)
The KAFTA is seen as one of the more successful FTAs, as it has led to ongoing structured
dialogue on consumer protection issues welcomed by those involved including both regulators
and the private sector. KAFTA includes a provision (apparently unique) encouraging
regulators to continue cooperation efforts including through MoUs. The provision states:
“The Parties support the efforts of their respective financial regulators to provide
assistance to the regulators of the other Party to enhance consumer protection and
those regulators' ability to prevent, detect, and prosecute unfair and deceptive
practices. Each Party confirms that its financial regulators have the legal authority to
exchange information in support of those efforts. The Parties shall encourage financial

Barriers to entry and financial integration in Asia and RCEP countries
Page 75
Australian Centre for Financial Studies +61 3 9666 1050 | australiancentre.com.au
regulators to continue their ongoing efforts to strengthen this cooperation through
bilateral consultations or bilateral or multilateral international cooperative mechanisms,
such as memoranda of understanding or ad hoc undertakings.”
There is always an option of strengthening such provisions in future FTAs, including the
RCEP, through offering tangible benefits, such as technical assistance or other forms of
economic cooperation.
The most salient point is that changes to policies and regulations have to be implemented
nationally, even though the agreements to make these changes are made at a multi-
country/regional level. The best way to ensure a smooth implementation would be if the
negotiations of such trade agreements were to be open and transparent, so that those affected
by the regulations can understand why changes are under discussion and how they ultimately
will be put into effect (see Elliott 2016).91
3.4 Other possibilities for increasing the effectiveness of regulatory cooperation
The most effective reductions in barriers to trade in financial services have been achieved by
unilateral actions, for instance through “one-off” financial sector reform processes such as the
Campbell Inquiry and the Wallis Inquiry in Australia and Singapore’s pursuit of its national
interest in its decisions on promotion and regulation of financial services. Carmichael suggests
decisions on unilateral reforms can be helpful if contributed to regional or bilateral trade
negotiations, as they created a catalyst for action in the Uruguay Round.92
Nevertheless, with GATS and recent bilateral and ASEAN- and APEC-based trade
agreements habitually covering financial services, there has to be an agenda to promote
reductions in barriers to trade in financial services through a broader agenda advanced
through agreements such as the RCEP. What is important in the RCEP context is to
emphasise the development benefits of lowering barriers in order to counter the mercantilist
and instability fears arising from increased foreign market entry.
The broader agenda could contemplate commitments for assistance with economic
cooperation and technical assistance (to offer a development benefit to still-developing
91 Kimberly Ann Elliott 2016 How Much “Mega” in the MegaRegional TPP and TTIP: Implications for Developing Countries. Centre for Global Development CGD Policy Paper 079, March http://www.cgdev.org/sites/default/files/CGD-Policy-Paper-79-Elliott-Mega-Regional-TPP-TTIP_0.pdf 92 Bill Carmichael 2016 Trade policy lessons from Australia. East Asia Forum, 16 April http://www.eastasiaforum.org/2016/04/16/trade-policy-lessons-from-australia/

Financial Integration in the Asia-Pacific
Page 76
Australian Centre for Financial Studies +61 3 9666 1050 | australiancentre.com.au
countries) and public sector-private sector dialogue (to ensure private sector/business input,
which hopefully ensures commerciality in the prioritisation of issues to be negotiated).
Economic cooperation
There are several models for economic cooperation. APEC and ASEAN both provide
templates and experience with the differing approaches to economic cooperation will help
identify the approach that best fits the RCEP negotiations and the operational follow-up to the
RCEP agreement. Annual consultations, transparent setting of objectives and publicised
records of meetings all help. The economic cooperation assistance could be directed at
facilitating trade in financial services or it could have a broader development focus.
The broad scope, depth and engagement of ASEAN interest in fostering economic
cooperation with its trading partners can be seen in its statements. One example is the ASEAN
Plus Three (APT, being ASEAN and China, Japan and Korea) relationship. A 2017 overview93
outlines that there are 67 mechanisms coordinating APT economic and other cooperation,
across “political and security; transnational crime; economic; finance; tourism; agriculture and
forestry; energy; minerals; small and medium-sized enterprises; environment; rural
development and poverty eradication; social welfare; youth; women; civil service; labour;
culture and arts; information and media; education; science, technology, and innovation; and
public health”.
One of the longer-running economic cooperation programs has been the ASEAN-Australia
Development Cooperation Program (AADCP). It grew out of a program initiated in 1974, with
its Phase 1 running from 2002-08. Now in its second phase (AADCP II),94 it is a multi-year
(2008-19), AU$57 million program that supports ASEAN’s goal of establishing an ASEAN
Economic Community by 2015 and the post-2015 vision.
The AADCP and programs from other ASEAN dialogue partners focused on supporting
regional economic integration can be built on. A program of economic cooperation could be
developed with structured dialogue between RCEP countries, involving regulators and
industry, to identify the most propitious reforms that allow gains in trade in financial services
without unnecessarily undermining the prudential carve-out and threatening financial
instability.
93 See ASEAN Secretariat 2017 Overview of ASEAN Plus Three Cooperation. Information Paper, April http://asean.org/storage/2016/01/Overview-of-APT-Cooperation-April-20171.pdf 94 See AADCP II website About AADCP II. http://aadcp2.org/about-us/
Barriers to entry and financial integration in Asia and RCEP countries
Page 77
Australian Centre for Financial Studies +61 3 9666 1050 | australiancentre.com.au
Technical assistance
There is considerable, if somewhat uncoordinated, technical assistance (TA) from a range of
providers, including regional organisations, multilateral development banks and bilateral
donors. In addition to higher profile meetings at organisation-leader level, there are programs
aimed at mid-tier levels amongst banking and securities markets regulators such as the APEC
Financial Regulators Training Initiative (FRTI), which is administered by ADB and financed
from Korea.95
The regulators in RCEP countries with lower GDP per capita and less sophisticated financial
sectors could benefit from additional TA from the regulators in RCEP countries with higher
GDP per capita and more sophisticated financial sectors, directed at providing them with a
sequence of policy reforms appropriate for their circumstances, including their chosen
exchange rate regime, and aimed at liberalising barriers to trade in financial services created
by unnecessary regulations.
A program of effective TA could best be developed through structured dialogue between
RCEP countries, involving regulators and industry to identify the most propitious reforms.
Public sector-private sector dialogue
Dialogue between regulators and industry in RCEP countries, both cross-border and within
each RCEP country, focused on lowering barriers to trade in financial services that are
unnecessary or ineffective in protecting consumers or reducing systemic risk, is very desirable.
Again, structured dialogue between RCEP countries, involving regulators and industry to
identify the most propitious and commercial reforms, would assist.
3.5 Further options for engagement leading to increased regulatory cooperation in RCEP
In any trade negotiation, countries can be expected to advance the financial sector trade
issues they see direct benefit in but, in the context of negotiating the RCEP, developed
countries also need to advance issues likely to appeal to the less developed countries that are
involved.
Such possibilities include using RCEP as a vehicle for:
• expanding the coverage and effectiveness of the ARFP;
95 ADB APEC Financial Regulators Training Initiative https://wpqr4.adb.org/LotusQuickr/apec_frti/Main.nsf/h_Toc/ffc7140cd270fbd84825795f001a6ff1/?OpenDocument

Financial Integration in the Asia-Pacific
Page 78
Australian Centre for Financial Studies +61 3 9666 1050 | australiancentre.com.au
• advancing innovation by improving the regulatory environment for FinTech;
• promoting reforms that will increase financial inclusion; and
• providing assistance to increase the quality and availability of data on trade in financial
services for as many modes of supply as is practical.
Asia Region Funds Passport
As mentioned earlier in Case Study A in Part 3, there is an opportunity to schedule further
discussions with a wider group of RCEP countries interested in joining the ARFP, once the
pilot has come into effect. Ongoing RCEP reviews might usefully provide an annual forum for
such dialogue.
FinTech
Regulatory structures – including the framework for international trade – must keep pace with
evolving technologies in digital finance to protect consumers and the financial system without
suppressing innovation. A level playing field between different providers of similar services is
an important principle regardless of the institutional form of the provider, with regulations
focused on the risk that the provider’s activities pose to consumers and the financial system.
China would seem a particularly attractive cross-border opportunity for FinTech: not only
showing strong FinTech investment and business growth (KPMG has attributed the explosive
development in China’s FinTech industry to the growing partnership among banks, insurance
providers and FinTech firms)96 but also being said to have “the most plentiful supply of skilled
software labour in the world”.97
Regulatory cooperation will be required and there are models that could serve as examples
for RCEP countries. For instance the Japan Financial Services Agency ('JFSA') and Australian
Securities and Investments Commission ('ASIC') have completed a framework for
co-operation to promote innovation in financial services in the two countries. ASIC previously
has made fintech referral and information-sharing agreements with the Monetary Authority of
Singapore, the United Kingdom’s Financial Conduct Authority, Ontario Securities Commission
and Hong Kong's Securities and Futures Commission, while it has signed information-sharing
96 see http://www.shanghaidaily.com/business/finance/VCbacked-fintech-investment-surges/shdaily.shtml 97 Zennon Kapron and Haydn Shaughnessy 2015 The Platform for Disruption How China’s FinTech will change how the world thinks about banking. October http://innotribe.com/wp-content/uploads/2015/10/Innotribe-The-platform-for-disruption-How-Chinas-FinTech-will-change-how-the-world-thinks-about-banking.pdf
Barriers to entry and financial integration in Asia and RCEP countries
Page 79
Australian Centre for Financial Studies +61 3 9666 1050 | australiancentre.com.au
agreements with the Capital Markets Authority, Kenya and Otoritas Jasa Keuangan,
Indonesia.98
RCEP could provide the framework for bringing in developing country participants.
Financial inclusion
Increased financial inclusion is a key stepping stone in the global push to raise the poor out of
poverty. Four frequently identified and inter-related objectives are increased access to
financial services for the unbanked, increased access to money transfer/remittance services
at an affordable price, reversing the decline in access that is arising from banks “de-risking”
their operations for fear of falling foul of Anti Money Laundering/Counter-Terrorism Financing
(AML/CFT) requirements, and increased access to finance for small and medium-sized
enterprises (SMEs). Advances in “mobile money” services have increased financial inclusion,
for instance in parts of Sub-Saharan Africa.
RCEP negotiators might establish an annual mechanism for promoting regional cooperation
on financial inclusion initiatives.
Improvements in data on trade in financial services
Much was made in Part 1 of this paper of the need for more and better data on international
trade in financial services across all modes of supply, including Mode 3, commercial presence.
Similarly, the analysis in Part 2 of this paper was hampered by a lack of data and estimates of
the restrictiveness of regulatory regimes towards trade in financial services.
As a means to promote a focusing of minds in all RCEP countries on the opportunities
presented by liberalising trade in financial services, there is a sound case for the richer RCEP
countries to promote (and fund) a project across all RCEP countries to improve the data and
its coverage: both for the trade data (including for foreign affiliates) and the restrictiveness
indices. In view of the difficulties facing those gathering improved data, the amount to be
committed to such a project should be subject to a cost-benefit test, as assessed by the data
gathering agency, finance and business/tax regulators and the financial services sector.
98 Australian Securities and Investments Commission 17-199MR Japan and Australia cooperate on fintech. 23 June 2017 http://www.asic.gov.au/about-asic/media-centre/find-a-media-release/2017-releases/17-199mr-japan-and-australia-cooperate-on-fintech/ FCA and ASIC 2016 Innovation Hubs Co-operation Agreement between Financial Conduct Authority ("FCA") and ("ASIC"). 23 March http://download.asic.gov.au/media/3797602/fca-asicagreementsigned230316-1.pdf

Financial Integration in the Asia-Pacific
Page 80
Australian Centre for Financial Studies +61 3 9666 1050 | australiancentre.com.au
4: CONCLUSION – A NEED TO DRIVE EFFECTIVENESS The conclusion of the paper, Part 4, recognises the challenge ahead for the RCEP negotiators
and others involved in promoting a reduction in barriers to trade in financial services amongst
RCEP countries and in promoting financial integration. Much will depend on focused, effective
cooperation, driven by timeliness and accountability and relevance to the countries that are
RCEP negotiators, both advanced and developing.
There is a challenge in making increased regulatory cooperation work effectively through
RCEP to reduce barriers to trade in financial services: WTO researchers Latrille and Lee
(2012)99 have summarised that “anecdotal evidence, gathered for instance during the drafting
by the WTO Secretariat of Trade Policies Reviews and factual presentations on RTAs
[Regional Trade Agreements], suggest that in numerous instances, provisions relating to
future negotiations or even regular meetings are not implemented thereby casting doubt on
the effective impact of RTA provisions (including diverging ones) on trade realities”.
They note the range of activities and organisation required to make cooperation effective,
including day-to-day management and operation of the agreement and the pathway for future
negotiations, working through specialized committees and subcommittees, with procedures
for the modification of schedules and future negotiations amongst other matters.
But there are also challenges of engagement. All reforms to barriers to trade in financial
services ultimately have to be made at the local – national – level: barriers to trade are national,
as is access to liquidity support and the lender of last resort.100
Removal of the barriers in the import (destination) country requires commitments and action
from the destination country to reform its domestic policy frameworks. For instance, in the
Australian context, Australia’s Productivity Commission (2015) has rehearsed some of the
ways that the potential gains from the removal of international barriers to service exports can
be realised. It also canvasses the ways that government can facilitate reform (in addition to
unilateral reforms), for example through trade agreements, mutual recognition arrangements
or technical assistance that serves to strengthen domestic policies and regulations relating to
services in other countries.
99 Pierre Latrille and Juneyoung Lee 2012 Services Rules in Regional Trade Agreements How Diverse and How Creative as Compared to the GATS Multilateral Rules? WTO Staff Working Paper ERSD-2012-19, 31 October https://www.wto.org/english/res_e/reser_e/ersd201219_e.pdf 100 Stijn Claessens 2009 Competition in the Financial Sector: Overview of Competition Policies. International Monetary Fund Working Paper WP/09/45, March https://www.imf.org/external/pubs/ft/wp/2009/wp0945.pdf

Barriers to entry and financial integration in Asia and RCEP countries
Page 81
Australian Centre for Financial Studies +61 3 9666 1050 | australiancentre.com.au
Facilitation of increased financial integration through the reduction in unnecessary barriers to
entry, market access and cross-border business will only be achieved by sustained and mutual
understanding of what barriers are unnecessary for the achievement of domestic goals. For
this, dialogue is needed that clearly recognises the importance of chosen exchange rate
regimes to the appropriate extent of barriers to trade in financial services.
In addition, macro-prudential and consumer protection regimes and regulations are rapidly
evolving, and will affect international trade in financial services and other cross-border
activities. Tax laws and regulations in countries are also evolving, to counter international tax
evasion including base erosion and profit shifting.
The most effective way forward is therefore transparency and energy in dialogue, with some
purposeful structure (annual meetings, ambitious objectives, sufficient efficient support and a
process that responds to reviews), retaining as much flexibility as possible and as much scope
for private sector input on priorities as possible.
Speed and ambition are also of the essence: The ERIA Coverage Index and Hoekman Index
data suggest that many RCEP countries have been lagging in prioritising financial services for
opening through trade agreements. However, in contradiction to the conclusion of Ishido that
AFAS-8 should be the benchmark or baseline for RCEP, it seems to this author that the target
for RCEP ought to be some degree of commitment well in excess of AFAS-8, for instance
more aspirational as in the AEC Blueprint. The aspirational statement should include a broad
set of commitments to liberalisation covering all four modes of supply (whereas AFAS-8 leaves
Mode 4, presence of natural persons, aside). If possible, the RCEP should include a chapter
on Mode 4, as with AANZFTA.
There is much less financial integration between RCEP countries than would appear
appropriate or achievable if one considers all the statements in favour of increased integration
and its purported benefits. At the same time, there are already copious discussions between
regulators in the Asia-Pacific and, for some regulators, their “dance card is full”. The keys now
are focus and effectiveness.
Ultimately the focus has to be on determining the necessity of barriers that are put forward for
ostensibly prudential or other (non-protectionist) purposes but effectively frustrate
cross-border flows. These barriers have to be identified by dialogue between regulators,
industry and civil society in each country and in the region. Industry’s voice is especially
important in identifying markets with potential to grow.
Financial Integration in the Asia-Pacific
Page 82
Australian Centre for Financial Studies +61 3 9666 1050 | australiancentre.com.au
What seems to offer the best prospects as some RCEP countries (and especially China, India
and many of the member states in ASEAN) make their transitions from heavily managed
exchange rate regimes and fragile financial sectors to more flexible exchange rate regimes
and more robust financial sectors is to engage their financial sector policy makers and
regulators in a mutual dialogue on what barriers are or will become less necessary as
exchange rate regimes and financial sector robustness transition.
Commitments within RCEP that provide active longer-lasting frameworks for regulatory
cooperation, economic cooperation and consultation between the public sector and private
sector together offer a possible pathway to promoting understanding of the benefits of
reduction in barriers to trade in financial services, leading ultimately to actions that do reduce
those barriers and facilitate trade in financial services.
What could help is a combination of:
1. ‘ABAC-like’ consultations and agenda determination (with annual ‘accountability’
deadlines, review periods and scope to recalibrate priorities and identify new partners that
can be co-opted for consultations and cooperation) to ensure focus on materiality and
commerciality, based on transparency;
2. regulatory MoUs explicitly encouraging discussions of priority issues and problem-solving
between regulators, with provision for private sector identification of some priority issues;
and
3. technical assistance to help bring forward the development of the less developed members
of RCEP (either amongst ASEAN or amongst the Plus Six) focused on what the countries
need.
Flexibility and an educative approach will be needed if the discussions envisaged in this paper
over the unnecessary extent of barriers to trade in financial services are to make headway. As
examples of what works and what does not work, RCEP countries have the ABAC Forum,
ASEAN-BAC, KAFTA, the ARFP negotiations and the ASEAN approach to date in promoting
financial integration. Consensus takes time to achieve; delays emerge frequently; and
sustained political, bureaucratic and industry determination and persistence are required to
keep negotiations on track to ensure objectives are attained. It does seem that the clearer the
objective, the narrower and more focused the discussions and the ease of envisioning the
deliverables (for example, for the ARFP), the greater the prospect of success for trade-
negotiation-style dialogue.
Value-for-money is also a consideration. Regulators’ costs will increase with a rising number
of meetings and a wider range of issues that require discussion and advancement. For

Barriers to entry and financial integration in Asia and RCEP countries
Page 83
Australian Centre for Financial Studies +61 3 9666 1050 | australiancentre.com.au
instance, as mentioned earlier, the work on the ARFP to date is said to have cost one of the
pilot countries’ government some US$7 million to date. While some gains from increased
regulatory cooperation are in the national interest (for example, better insights into emerging
risks), most gains will flow to the financial sector businesses that expand successfully into new
markets. These private gains can be significant101 and may in the fullness of time enable a
mechanism to emerge that has those that sustainably benefit repay the cost of negotiations.
Such dialogue will require sustained input by all parties to achieve the region-wide benefits of
reductions in barriers to trade in financial services through the RCEP negotiations. However,
negotiators and all others may bear in mind that renewed pursuit of unilateral non-
discriminatory reforms to reduce barriers to trade in financial services would be simpler and
quicker, more easily moving beyond border barriers to tackle behind-the-border regulatory
barriers102 and only requiring explanation to trading partners.
101 Eyers 2016 reiterates the Deloitte Access Economics estimates that “for every $100 of foreign funds under management in Australia, fund managers receive $0.60 in annual revenue from services they provide” (that is, 60 basis points pa, or 0.6% pa), the implication being that similar revenues are achievable in future on new foreign funds raised. Deloitte Access Economics 2014 had said “it is likely that fee revenue is equal to at least 0.4% of overseas funds under management [and] at most 1.0% of funds under management”. See James Eyers 2016 Can Australia become an exporter of managed funds? Australian Financial Review, 1 February http://www.afr.com/personal-finance/managed-funds/can-australia-become-an-exporter-of-managed-funds-20160130-gmhuen and Deloitte Access Economics 2014 The economic impact of increasing Australian funds management exports. Financial Services Council, May http://www.fsc.org.au/downloads/file/ResearchReportsFile/2014_0806_EconomicimpactofincreasingAustralianfundsmanagementexports_e64a.pdf 102 Razeen Sally 2009 Economic integration: Will Asia go regional? East Asia Forum, 3 November. http://www.eastasiaforum.org/2009/11/03/economic-integration-will-asia-go-regional/
Financial Integration in the Asia-Pacific
Page 84
Australian Centre for Financial Studies +61 3 9666 1050 | australiancentre.com.au
ANNEX 1. GLOBAL AND REGIONAL FINANCIAL SERVICES REGULATION Annex A takes an Australian perspective on the global arrangements, drawing on material
from the organisations mentioned and from Australia’s financial services regulators:
• the Reserve Bank of Australia (RBA, Australia’s central bank);103
• the Australian Prudential Regulation Authority (APRA, Australia’s prudential supervisor
and one of the “twin peaks”);104
• the Australian Securities and Investments Commission (ASIC, Australia’s securities
regulator and the other “twin peak”);105 and
• the Australian Transaction Reports and Analysis Centre (AUSTRAC, Australia’s Financial
Intelligence Unit).106
It must never be forgotten that financial services regulation, like taxation, is national in its
implementation. It is always in flux, as are the groupings that promote it. Global and regional
groupings wax and wane: for instance, there are many other regional and sub-regional
banking and finance associations and groupings, all promoting regulatory cooperation. Many
have emerged from the need to address particular events (for example, the Asian financial
crisis in 1997) or particular forms of cooperation (for example, the currency swap
arrangements agreed in Chang Mai) and are evolving over time to expand or contract as
priorities shift.107
A1.1 Oversight of financial services policy and regulation
Global – Group of Twenty
The Group of Twenty (G20) is the premier forum for international economic cooperation with
members from 19 countries and the European Union. G20 Leaders, Finance Ministers and
Central Bank Governors meet regularly to address global economic and financial challenges.
103 RBA website undated International Regulatory Forums. http://www.rba.gov.au/fin-stability/intl-reg-fora/ 104 APRA’s website and APRA 2015 Annual Report 2015. Chapter 4: APRA's Activities International Activities http://www.apra.gov.au/AboutAPRA/Publications/Pages/ar2015-chap4.aspx#chap4_5 105 ASIC’s website and ASIC 2015 Annual Report 2014-15. http://download.asic.gov.au/media/3437945/asic-annual-report-2014-15-full.pdf 106 AUSTRAC 2015 AUSTRAC Annual Report 2014–15. November http://www.austrac.gov.au/sites/default/files/austrac-ar-14-15-web.pdf 107 Lim CS, Vincent & Ong LC, Vivien 2012 Banking on Togetherness (II): Singularly Regional. SEACEN Economic letter No 2, June

Barriers to entry and financial integration in Asia and RCEP countries
Page 85
Australian Centre for Financial Studies +61 3 9666 1050 | australiancentre.com.au
Australia is represented on the G20 by the Prime Minister, the Treasurer and the RBA
Governor. Six Regional Comprehensive Economic Partnership (RCEP) countries are
members: Australia, China, India, Indonesia, Japan and Korea.
Regional
The Asia-Pacific Economic Cooperation (APEC) and the Association of Southeast Asian
Nations (ASEAN) are the regional Asia-Pacific G20 equivalents for international cooperation,
but perform different roles from the G20 and from each other, driven by their differing
mandates, modus operandi and membership.
Regional – Asia-Pacific Economic Cooperation (APEC) and the APEC Business Advisory Council (ABAC)
Thirteen RCEP countries are in APEC: RCEP countries that are not in APEC are Cambodia,
Lao P.D.R. and Myanmar, all from the ASEAN grouping.
The APEC Business Advisory Council (ABAC), established in 1995, represents the interests
of business in APEC. ABAC is composed of up to three members from each of the 21 member
economies, with business representatives appointed by APEC Leaders. The annual APEC
CEO Summit and regular Industry Dialogues also provide opportunities for regional business
leaders to interact with APEC and address key issues affecting business in the region.
Regional – Association of Southeast Asian Nations (ASEAN)
ASEAN has sought to build an ASEAN Economic Community (AEC) with several
subcomponents promoting integration to achieve the AEC’s objectives. The most prominent
from a financial services trade perspective are the ASEAN Banking Integration Framework
(ABIF), the ASEAN Insurance Council and ASEAN Insurance Integration Framework (AIIF),
the ASEAN Capital Markets Forum (ACMF) and the Asian Bond Market Initiative (with the
Asian Development Bank and others).
A1.2 Banking
Global – Basel Committee on Banking Supervision (BCBS)
The Basel Committee on Banking Supervision (BCBS) is the primary global standard-setter
for the prudential regulation of banks and provides a forum for cooperation on banking
supervisory matters. Its mandate is to strengthen the regulation, supervision and practices of
banks worldwide with the purpose of enhancing financial stability.
Financial Integration in the Asia-Pacific
Page 86
Australian Centre for Financial Studies +61 3 9666 1050 | australiancentre.com.au
Australia is represented on the BCBS by APRA and the RBA. Seven RCEP countries are
amongst the BCBS membership (Australia, China, India, Indonesia, Japan, Korea and
Singapore).
Global – Committee on Payments and Market Infrastructures (CPMI)
The Committee on Payments and Market Infrastructures (CPMI), formerly the Committee on
Payment and Settlement Systems, contributes to strengthening the financial market
infrastructure through promoting sound and efficient payment, clearing and settlement
systems.
The CPMI is a standard-setting body for payment, clearing and securities settlement systems.
It also serves as a forum for central banks to monitor and analyse developments in domestic
payment, clearing and settlement systems as well as in cross-border and multicurrency
settlement schemes.
Australia is represented on the CPMI by the RBA. CPMI representatives are senior officials of
member central banks: six RCEP central banks are represented (Australia, China, India,
Japan, Korea and Singapore).
Global – Financial Stability Board (FSB)
The Financial Stability Board (FSB) coordinates, at the international level, the work of national
financial authorities and international standard setting bodies, and develops and promotes the
implementation of effective regulatory, supervisory and other financial sector policies. It brings
together national authorities responsible for financial stability in significant international
financial centres, international financial institutions, sector-specific international groupings of
regulators and supervisors, and committees of central bank experts.
Australia is represented on the FSB by the RBA and Treasury; ASIC’s Chairman also attends
the FSB as IOSCO Board Chairman. Seven RCEP countries are amongst the FSB’s 25
country/regional members (Australia, China, India, Indonesia, Japan, Korea and Singapore).
Global – Joint Forum
The Joint Forum was established in 1996 under the aegis of the Basel Committee on Banking
Supervision (BCBS), the International Organization of Securities Commissions (IOSCO) and
the International Association of Insurance Supervisors (IAIS) to deal with issues common to
the banking, securities and insurance sectors, including the regulation of financial
conglomerates.

Barriers to entry and financial integration in Asia and RCEP countries
Page 87
Australian Centre for Financial Studies +61 3 9666 1050 | australiancentre.com.au
The Joint Forum is comprised of an equal number of senior bank, insurance and securities
supervisors representing each supervisory constituency. Australia is a member (represented
by APRA and ASIC), as are four other RCEP countries (China, India, Japan and Korea)
amongst the 15 member countries.
Regional - Executives’ Meeting of East Asia-Pacific Central Banks (EMEAP)
The Executives’ Meeting of East Asia-Pacific Central Banks (EMEAP), founded in 1991, brings
together central banks from 11 economies in the east Asia-Pacific region – Australia, China,
Hong Kong SAR, Indonesia, Japan, Korea, Malaysia, New Zealand, the Philippines,
Singapore and Thailand (all except Hong Kong are RCEP countries) – to discuss issues
relevant for monetary policy and financial stability, foster closer cooperation, and exchange
information and expertise on issues of common interest.
The RBA participates in EMEAP at a number of levels, including the Governor and Deputy
Governor. EMEAP has Working Groups on Financial Markets, Banking Supervision and
Payment and Settlement Systems and regular meetings of IT Directors from EMEAP member
central banks.
At the Governors' and Deputies' meetings during the year in review, members discussed a
range of topics, including economic and financial market developments and risks, and the
implications of international regulatory developments for the EMEAP region. At the Deputy
Governor level, the Monetary and Financial Stability Committee continued to focus on
monitoring economic and financial system risks, including through maintaining close relations
with international institutions such as the IMF and the BIS and through dialogue with the
private sector. EMEAP Deputy Governors are responsible for the ongoing oversight of the
Asian bond funds.
EMEAP’s Working Group on Banking Supervision (which comprises representatives of
EMEAP members' central banks and prudential supervision authorities, including APRA)
provides a regional forum for sharing experiences about best practices in banking supervision
and the implementation of international reforms such as Basel III.
EMEAP’s Working Group on Payment and Settlement Systems has focused on monitoring
the progress of members' implementation of the G20 OTC derivatives market reforms and
examining potential oversight issues arising from real-time retail payment systems.
Regional – South East Asian Central Banks (SEACEN)

Financial Integration in the Asia-Pacific
Page 88
Australian Centre for Financial Studies +61 3 9666 1050 | australiancentre.com.au
The South East Asian Central Banks (SEACEN) Research and Training Centre was
established in 1982 with eight member central banks/monetary authorities: it had since grown
to twenty members by 2014, with an outreach to 15 other central banks and monetary
authorities in the region.
Regional – ASEAN Central Bank Forum (ACBF)
The ASEAN Central Bank Forum (ACBF) was established in 1997.
Regional – ASEAN Plus Three (APT) Macroeconomic Research Office (AMRO)
The ASEAN Plus Three (APT) Macroeconomic Research Office (AMRO) is the surveillance
unit of ASEAN+3 countries (ASEAN, China, Japan and Korea) and was established in 2011.
It monitors and analyses regional economies and contributes to the early detection of risks,
provides policy recommendations for remedial actions and helps decision-making of the
CMIM.
Regional – ASEAN Banking Integration Framework (ABIF)
See Case Study B in Part 3 of this paper.
A1.3 Insurance
Global – International Association of Insurance Supervisors (IAIS)
The International Association of Insurance Supervisors (IAIS) is a voluntary membership
organization of insurance supervisors and regulators from more than 200 jurisdictions in nearly
140 countries. 15 members are from RCEP-negotiating countries (including Malaysia).
Amongst RCEP countries, only Lao P.D.R. and Myanmar are not members on IAIS.
Global – International Association of Deposit Insurers (IADI)
The International Association of Deposit Insurers (IADI) has four categories of participation.
Currently, IADI has 80 Members, 10 Associates, and 13 Partners. Deposit insurers from 11 of
the 16 RCEP countries have memberships: China and New Zealand are missing from
amongst the “Plus Six” and Cambodia, Lao P.D.R. and Myanmar from ASEAN.
Global – International Credit Union Regulators Network (ICURN)

Barriers to entry and financial integration in Asia and RCEP countries
Page 89
Australian Centre for Financial Studies +61 3 9666 1050 | australiancentre.com.au
A group of 48 regulators from 15 countries formed the first-ever Credit Union Regulators
Network (ICURN) in 2007. Australia (APRA) represented Asia/Pacific during its formation.
ICURN now has members from more than 30 countries (though no list seems available).
Global – International Forum of Insurance Guarantee Schemes (IFIGS)
The International Forum of Insurance Guarantee Schemes (IFIGS) has 24 Members (22 Full
& two Associate). The Full Members are from 17 economies, including Australia, Korea,
Malaysia, Singapore and Thailand from amongst RCEP negotiating economies.
Global – International Organisation of Pension Supervisors (IOPS)
The International Organisation of Pension Supervisors (IOPS) is an independent international
body representing those involved in the supervision of private pension arrangements. IOPS
currently has 87 members and observers representing 75 countries and territories worldwide.
Only six RCEP economies are members – Australia, China, India, Indonesia, Korea and
Thailand.
Australia is represented on all insurance bodies by APRA.
Regional – Asian Forum of Insurance Regulators (AFIR)
All 16 RCEP countries are represented in the 32-country membership.
Regional – ASEAN Insurance Council (ASEANIC)
The ASEAN Insurance Council (AIC) is an organization under ASEAN which comprises 13
members of insurance associations from 8 ASEAN member states. There is no representation
from Lao P.D.R. or Myanmar.
A1.4 Securities
Global – International Organization of Securities Commissions (IOSCO)
The International Organization of Securities Commissions (IOSCO) is the global standard
setter for securities regulation. Its cooperative efforts are intended to assist countries to
develop, supervise and enforce the laws in their jurisdictions, helping to underpin investor and
financial consumer trust and confidence, build mutual trust and cooperation between
jurisdictions and promote cross-border capital flows. IOSCO’s Multilateral Memorandum of
Understanding (MMOU) is a cooperation arrangement that enables 105 regulators to share
Financial Integration in the Asia-Pacific
Page 90
Australian Centre for Financial Studies +61 3 9666 1050 | australiancentre.com.au
information to combat cross-border fraud and misconduct and make it easier for IOSCO to
take action on cross-border transactions.
Australia is represented on IOSCO by ASIC. Including Australia there are 13 RCEP countries
that are ordinary members of IOSCO, with the exceptions being Cambodia, Lao P.D.R. and
Myanmar.
Regional – Asia-Pacific Regional Committee (APRC))
22 Asia-Pacific economies are represented (there are 24 members, three from Japan),
including all of the “Plus Six” and seven from ASEAN (the exceptions being Cambodia, Lao
P.D.R. and Myanmar).
A1.5 AML/CFT
Global – Financial Action Task Force (FATF)
FATF is an inter-governmental body focused on fighting money laundering, terrorism financing
and other related threats to the integrity of the international financial system, setting standards
and ensuring the effective implementation of legal, regulatory and operational measures.
AUSTRAC is a member of FATF and participates in a number of working groups and
initiatives. Six other RCEP countries are members of FATF (China, India, Japan, Korea, New
Zealand and Singapore).
Global – Egmont Group of Financial Intelligence Units (Egmont Group)
The Egmont Group is made up of international financial intelligence units (FIUs). It provides a
global network for enhancing cooperation among FIUs, especially in the areas of:
• information exchange;
• training and sharing of knowledge and expertise; and
• fostering the implementation of domestic anti-money laundering/counter-terrorism
financing (AML/CTF) programs.
AUSTRAC is a founding and active member and lead Commonwealth agency to the Egmont
Group. There are 151 countries represented, including 11 other RCEP members in addition
to Australia (the Egmont Group does not include China, Lao P.D.R., Myanmar and Viet Nam).
Regional - Asia/Pacific Group on Money Laundering (APG)

Barriers to entry and financial integration in Asia and RCEP countries
Page 91
Australian Centre for Financial Studies +61 3 9666 1050 | australiancentre.com.au
The APG is a FATF-style regional body for the Asia-Pacific region. Its key roles in the region
include:
• assessing compliance by APG members with global AML/CTF standards;
• coordinating technical assistance and training initiatives; and
• conducting research into money laundering and terrorism financing trends and methods.
Australia is a founding member of the APG and permanent co-chair of the group. The APG
has members from 41 countries, including all 16 RCEP countries.