financial crises, crisis spill-overs and the business cycle stefan straetmans, maastricht university...
TRANSCRIPT

Financial crises, crisis spill-overs and the business cycle
Stefan Straetmans, Maastricht university School of Business and Economics
Risk Forum Paris, March 2015

Motivation and contribution
Tail behavior
- Univariate: fat tails (nonnormality)
- Multivariate: tail dependence Features of the unconditional (time constant) df This paper: do they exhibit regime dependence? Extreme value analysis (EVT) presupposes a
stationary unconditional (“long-term”) df
→ reconcilable with short-term regimes/states

Motivation and contribution (2)
Tail indices, scalig constants, tail copula most likely not invariant over time..
Regime dependence may shed light on the determinants of tail fatness but careful: this is NOT a causality analysis
Is there a way in between volatility and dependence modelling based on conditional df (multivariate GARCH, SV..) vs. “pure” EVT?

Motivation and contribution (3)
Simplest way to introduce regime dependence that preserves unconditional stationarity of df:
- mixture of Pareto tails (univariate EVT)
- mixture of tail copula (multivariate EVT)
In this paper: (exogenous) regime = business cycle
We do find regime dependence for scaling constant, tail index and strength of tail dependence

Anticipating our results....
Recession-based downside asset tail risk highest for large variety of assets
Recession-based bank linkages highest Stock-bond flight-to-quality dominates co-crashes
during recessions; asymmetry much smaller in expansions
Minimum variance portfolios are regime dependent; diversification meltdown in recessions

Univariate mixture model
Survivor function as mixture of survivor functions:
model survivor functions with Pareto tail:
ying!slowly var also
1with
1
21
21
21
12
2
21
xL
xLxxLxL
xxLxXP
xxLxxLxXP
xFxFxF 21 1111

Bivariate mixture model
Survivor function as mixture:
Tail copula 1-1 with joint survivor function:
Mixture in survivor functions transfers to copula and tail copula:
yxFyxFyxF ,11,1,1 21
tvQtuQFtvul t 211
0 ,1lim,
vulvulvul ,1,, 21

Statistical relevance
Regime dependence in tail fatness provides additional source of bias in tail index estimation
Why? Pareto mixture is equivalent to higher order behavior which induces Hill bias
Same should hold for multivariate mixtures and the strength of tail dependence (bias in extreme linkage measures)

Mixtures and higher order behavior
n=2 states:
n=3 states:
122 11
21
xxxF
etc.
11 231332121
321
xxxxF

Economic relevance
Short-term horizon risk managers probably interested to identify regime-dependent risk
...but even financial regulators with long-term focus aim for countercyclical micro/macro prudential risk indicators
Neglecting regime dependence potentially leads to too conservative capital requirements

Application: trading limits for bank traders
Return series s>0 : maximum loss such that pension fund, bank
does not become insolvent/illiquid s depends on actual solvency/liquidity position Maximum allowable investment I in risky position?
estimator quantile extreme 1
/Pr1Pr
1
pFx
xsIpxIXIpxFxX
p
pppp
niX i ,,1
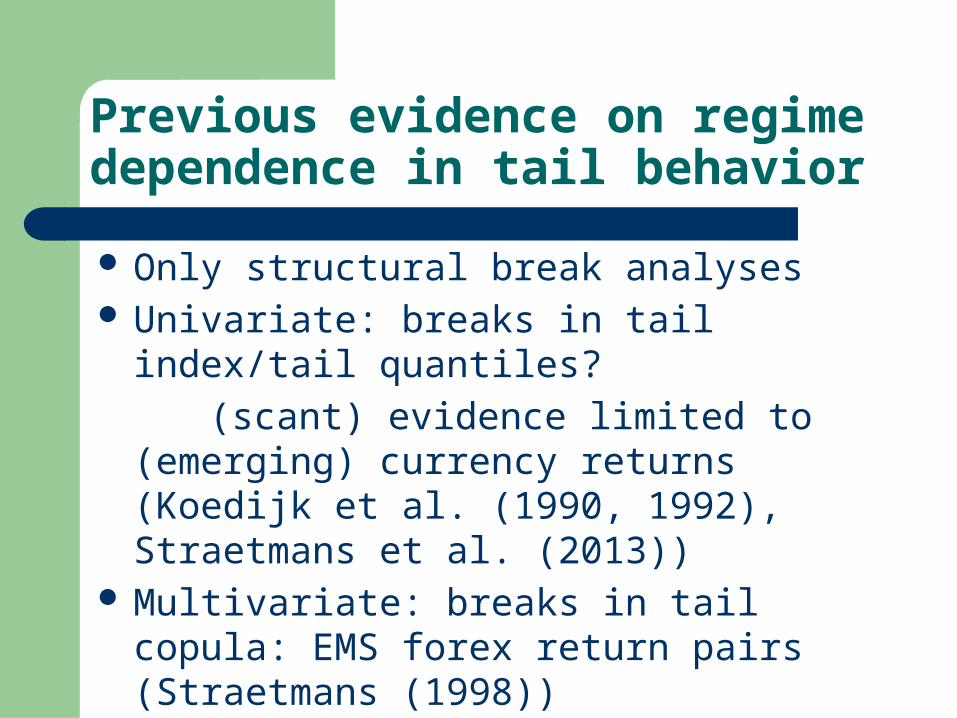
Previous evidence on regime dependence in tail behavior
Only structural break analyses Univariate: breaks in tail index/tail quantiles?
(scant) evidence limited to (emerging) currency returns (Koedijk et al. (1990, 1992), Straetmans et al. (2013))
Multivariate: breaks in tail copula: EMS forex return pairs (Straetmans (1998))
We adopt more complex subsample partitioning

Crisis and crisis spillover indicators
Downside tail risk: tail index/probs/quantiles
- individual assets and portfolios Bivariate co-crash probability
- tail-β as bivariate co-movement indicator
- compare co-crash vs. Flight-to-Quality probs Conditional expected number of co-crashes Multivariate co-crash probability Estimate on full, recession, expansion sample

Tail probs/tail quantiles
Use marginal quantile estimator that exploits fat tails:
Use Hill statistic for α Inverse of estimator renders “extreme” Value-at-Risk
estimate for given p:
1
/1
, ,ˆ
np
pn
mXx nmp
xlarge ,ˆ,
xXn
mxXP nm

Co-crash tail probability
(1992) Huang followingestimator 1,1ˆ
copula" tail"or function" dependence tailstable" :1,1
"-tail" is
1,12
or 2
2
22
22112211
l
l
CPXX
l
pQXP
pQXpQXPppQXpQXPCP
XYM
XY
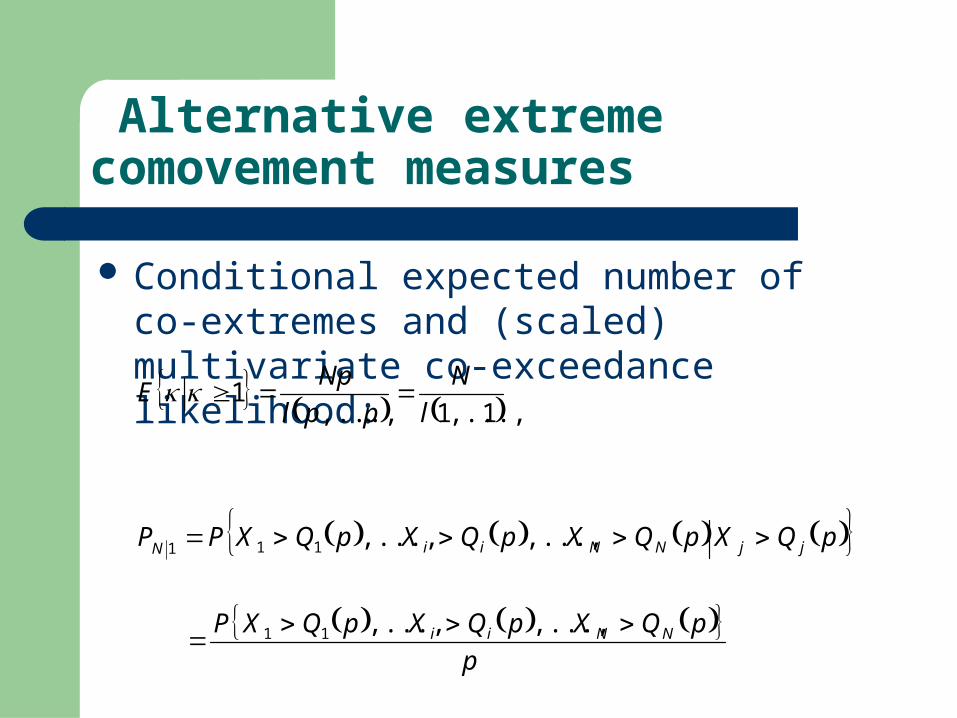
Alternative extreme comovement measures
Conditional expected number of co-extremes and (scaled) multivariate co-exceedance likelihood:
p
pQXpQXpQXP
pQXpQXpQXpQXPP
l
N
ppl
NpE
NNii
jjNNiiN
,...,,...,
,...,,...,
1,...,1,...,1
11
111
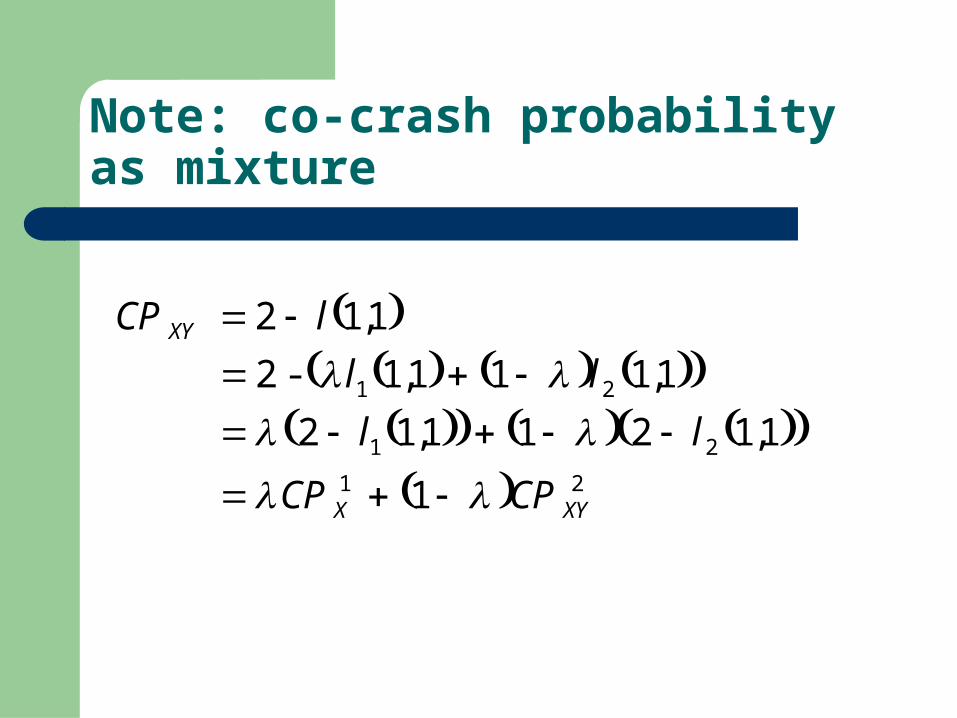
Note: co-crash probability as mixture
21
21
21
1
1,1211,12
1,111,1-2
1,12
XYX
XY
CPCP
ll
ll
lCP

Data
Monthly business cycle dummies (1985-2012)
- US: NBER dating committee
- GE, FR, UK, JP: Economic Cycle Research Institute (ECRI)
DS Daily financial returns (1/2/1985-31/12/2012)
- 16 US bank stocks, G-5 stock and (10-year) sovereign bond indices, commodities (oil, gold, silver), exchange rates

Bank tail risk: representative results (p=0.1%)
Banks Recession Expansion Equality tests
BOA 1.75 0.76 2.73 0.12 -3.29 2.51
BB&T 2.37 0.30 3.13 0.09 -1.98 2.79
NYMellon 1.94 0.46 3.26 0.10 -3.89 2.60
Comerica 1.92 0.49 2.85 0.10 -2.91 2.62
Huntington 1.82 0.84 2.70 0.12 -2.89 2.67
JP Morgan 2.16 0.40 3.23 0.11 -2.96 2.70
Keycorp 1.80 0.69 2.81 0.11 -3.30 2.59
North. Trust 2.09 0.34 2.92 0.10 -2.42 2.52
Wells Fargo 2.04 0.45 3.29 0.09 -3.54 2.79
ER ER qq
R Rq E Eq
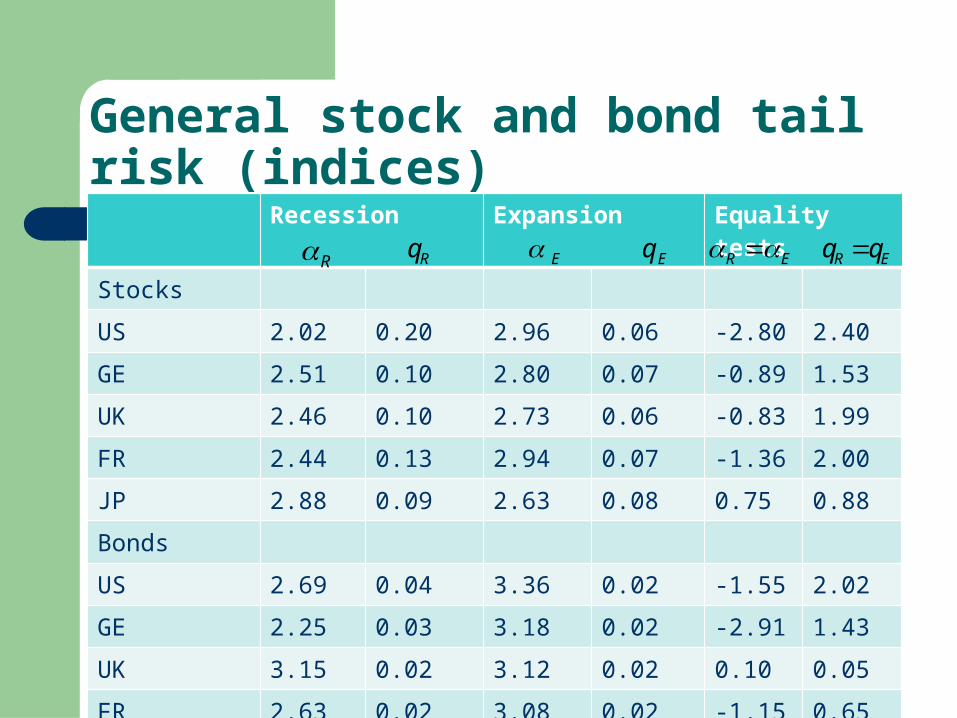
General stock and bond tail risk (indices)
Recession Expansion Equality tests
Stocks
US 2.02 0.20 2.96 0.06 -2.80 2.40
GE 2.51 0.10 2.80 0.07 -0.89 1.53
UK 2.46 0.10 2.73 0.06 -0.83 1.99
FR 2.44 0.13 2.94 0.07 -1.36 2.00
JP 2.88 0.09 2.63 0.08 0.75 0.88
Bonds
US 2.69 0.04 3.36 0.02 -1.55 2.02
GE 2.25 0.03 3.18 0.02 -2.91 1.43
UK 3.15 0.02 3.12 0.02 0.10 0.05
FR 2.63 0.02 3.08 0.02 -1.15 0.65
JP 2.18 0.03 2.27 0.03 -0.31 0.12
R Rq E Eq ER ER qq
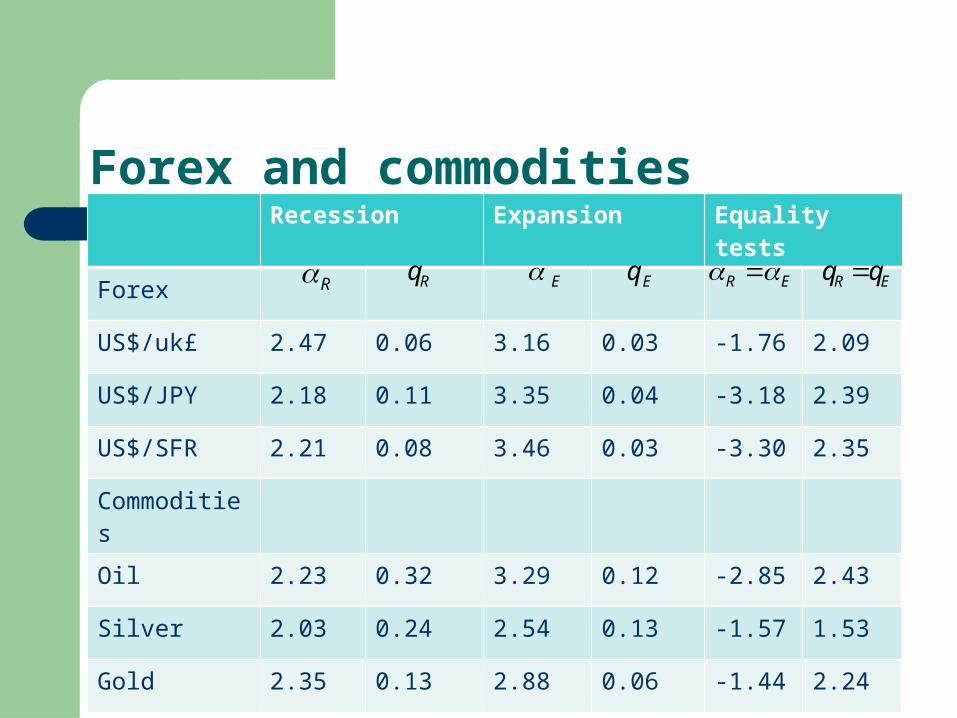
Forex and commodities Recession Expansion Equality tests
Forex
US$/uk£ 2.47 0.06 3.16 0.03 -1.76 2.09
US$/JPY 2.18 0.11 3.35 0.04 -3.18 2.39
US$/SFR 2.21 0.08 3.46 0.03 -3.30 2.35
Commodities
Oil 2.23 0.32 3.29 0.12 -2.85 2.43
Silver 2.03 0.24 2.54 0.13 -1.57 1.53
Gold 2.35 0.13 2.88 0.06 -1.44 2.24
R Rq E Eq ER ER qq

Bank linkages: MES and tail-β Bank Recession Expansion Equality tests
ρ ρ
BOA 0.74 0.14 0.91 0.63 0.04 0.81 1.66 5.87
BB&T 0.62 0.08 0.83 0.46 0.03 0.62 3.17 3.10
NY Mellon 0.58 0.08 0.78 0.54 0.03 0.73 0.72 2.74
Comerica 0.66 0.09 0.85 0.56 0.03 0.72 2.11 4.78
Huntington 0.58 0.14 0.71 0.48 0.03 0.62 1.99 4.99
JP Morgan 0.73 0.09 0.89 0.58 0.04 0.80 2.75 5.33
Keycorp 0.69 0.13 0.80 0.54 0.03 0.74 3.08 3.42
North. Trust 0.62 0.07 0.78 0.51 0.03 0.65 2.06 4.21
Wells Fargo 0.74 0.11 0.92 0.51 0.03 0.75 3.88 4.61
ER ER MESMES R E
RMES EMES

Multivariate systemic risk results
109.0 053.2 :Expansion
319.0 676.3 :Recession
139.0 558.2 :sample Full
16E1
banks 16N
MULEE
MULRR
MUL
PE
PE
PE

Bank tail risk and systemic risk
Consistent with fundamentals-based banking crises literature
Incidence of banking panics increases during recessions cf. Gorton (1988)
How to make it countercyclical? Turn it around... Macro prudential regulation: use recession (expansion)
SR indicators to assess true expansion (recession) SR

Co-crash vs. Flight-to-quality
%05.0
1
:quadrant 2nd
11
:quadrant 3rd
return bond
returnstock
p
pQSpQBPCP
pQSpQBPCP
B
S
SBFTQ
SBCO
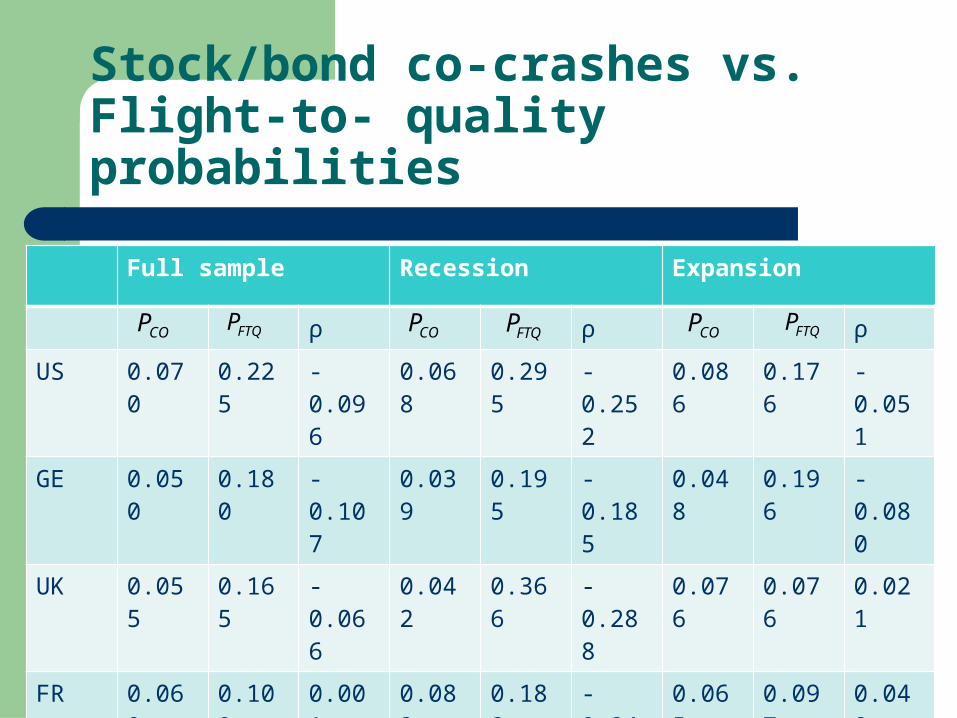
Stock/bond co-crashes vs. Flight-to- quality probabilities
Full sample Recession Expansion
ρ ρ ρ
US 0.070 0.225 -0.096 0.068 0.295 -0.252 0.086 0.176 -0.051
GE 0.050 0.180 -0.107 0.039 0.195 -0.185 0.048 0.196 -0.080
UK 0.055 0.165 -0.066 0.042 0.366 -0.288 0.076 0.076 0.021
FR 0.060 0.100 0.001 0.083 0.188 -0.241 0.065 0.097 0.048
JP 0.060 0.090 -0.068 0.011 0.092 -0.151 0.106 0.099 -0.030
COP FTQP COP FTQP COP FTQP

Minimum tail risk portfolios
Form 2-asset portfolio with pairs of DJ stocks
Minimum variance portfolio:
Minimum Value-at-Risk portfolio for low p-value:
21 1 RwwRRp
2122
21
2122
2
MVw
/1
,ˆ min
pn
mwRwq nmp
w

DJ Correlations and the business cycle
DJ Stock pairs Correlations
Full sample recession expansion
ExxonMobil/Wal Mart 0.33 0.43 0.32
Wall Mart/P&G 0.37 0.57 0.34
PG/J&J 0.47 0.63 0.45
JJ/GE 0.44 0.47 0.44
GE/JP Morgan 0.56 0.63 0.53
JP Morgan/Pfizer 0.34 0.45 0.32
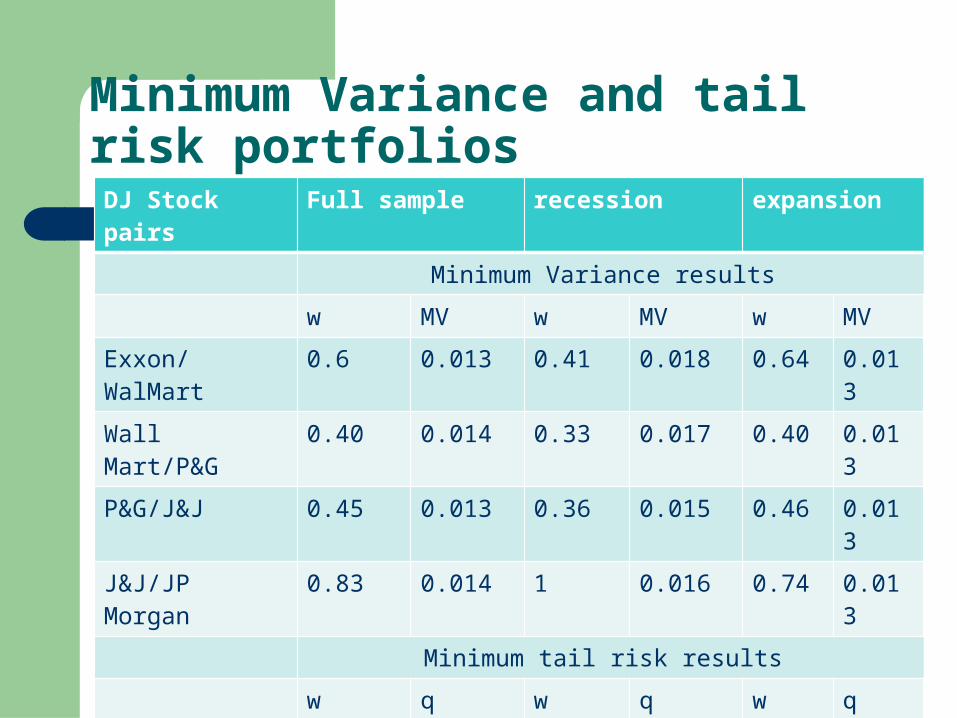
Minimum Variance and tail risk portfolios
DJ Stock pairs Full sample recession expansion
Minimum Variance results
w MV w MV w MV
Exxon/WalMart 0.6 0.013 0.41 0.018 0.64 0.013
Wall Mart/P&G 0.40 0.014 0.33 0.017 0.40 0.013
P&G/J&J 0.45 0.013 0.36 0.015 0.46 0.013
J&J/JP Morgan 0.83 0.014 1 0.016 0.74 0.013
Minimum tail risk results
w q w q w q
Exxon/WalMart 0.59 0.078 0.41 0.095 0.63 0.074
Wall Mart/P&G 0.31 0.084 0.45 0.096 0.30 0.080
P&G/J&J 0.52 0.078 0.28 0.080 0.54 0.075
J&J/JP Morgan 0.78 0.093 0.93 0.089 0.74 0.089

Diversification of portfolio tail risk: summary
Tactical asset allocation: if your aim is to avoid extreme portfolio returns you have to invest differently during recessions
Diversification meltdown during recessions: higher correlation, higher (minimized) portfolio variance and portfolio tail risk (VaR)
Portfolio allocation w for minimum tail risk portfolios strongly differs from minimum variance portfolios

Extensions/avenues for future research
Regime-dependence of left-right tail asymmetry
→to be expected to be much more severe during recessions
Allowing for thin and fat tails (Generalized EVD) Alternatives for the business cycle? Borio’s
financial cycle Endgenous regime determination, more thzn two
regimes...