finance and service strategy report to period …docs.east-ayrshire.gov.uk/crpadmmin/2007...
TRANSCRIPT

FINANCE AND SERVICE STRATEGY REPORT
TO PERIOD 8 (15 NOVEMBER 2009)
CABINET 16 DECEMBER 2009

Efficiency Theme Description
PYI Full year effects of previous years investment
MUA Maximising the utilisation of assets
KSO Focusing resources on activities which deliver key service objectives
CND Adjusting service levels to reflect current need and/or demand
BRS Business Review of specific services to achieve reduced costs which do not impact on service levels or council policies
CIS Closer integration of services within departments
UAF Utilisation of alternative funding
PSP Procurement where a strategy is in place including electronic purchasing to maximise savings potential
ABS Absence Management where a sustained reduction in absence will allow staffing establishments to be reduced
SB1
Streamlining bureaucracy through the implementation of Shared Services Diagnostic projects for which business cases are being developed, These include Central Purchasing, Document Imaging, Single IT based booking system and Review of clerical and administrative support functions across the Council
SB2 Streamlining bureaucracy through reviewing the Council’s management structure immediately below Chief Officer level
SB3 Streamlining bureaucracy through the rationalisation of service delivery boundaries to improve integration of services to the public and avoid duplication
SB4 Streamlining bureaucracy through the review of service and location management resources where appropriate
SB5 Streamlining bureaucracy through the identification of shared services opportunities both within the Council and with other organisations
IEM Energy usage as a result of investment in energy saving measures and continued staff training on energy management
CFS Review of policies and procedures for charging for services

EAST AYRSHIRE COUNCIL
CABINET – 16 DECEMBER 2009
FINANCE AND SERVICE STRATEGY REPORT TO PERIOD 8 (15 NOVEMBER 2009)
Report by Executive Head of Finance and Asset Management
1 PURPOSE OF REPORT 1.1 To advise Members of the projected financial position for the
year based on expenditure to 15 November 2009 (Period 8) and information provided by Executive Directors.
2 BACKGROUND 2.1 As indicated to the Cabinet on 2 September 2009, this report
has now been developed to include performance information from the Council’s Electronic Performance Management System. A selection of indicators is included for each department. The graphs show current year in red, previous year in blue and each is accompanied by a commentary including any planned improvement actions where appropriate. It should be noted that the system is still under development and the format and content of the performance information included in this report will continue to change and improve over time.
3 GENERAL SERVICES 3.1 The overall projected outturn for the year to 31 March 2010 is
a net utilisation of general fund balances of £0.276m. Details are included in the attached report.
3.2 It is anticipated that the department of Educational and Social Services will outturn £0.346m under budget at 31 March 2010 after the utilisation of £0.486m of departmental balances as approved by Cabinet on 2 December 2009 to offset current budget pressures. These relate to termination payments and additional costs in respect of Outwith Placements.
3.3 Social Services is currently anticipated to be £0.037m under
budget at 31 March 2010. This includes additional secure accommodation placement costs required for the remainder of the year and additional elderly residential care costs being offset by savings from the management of vacant posts and by use of £0.360m in non-recurring balances. The Sustainability Board, tasked with realigning budget resources and led by the Executive Director, continues to review a number of areas within the service to ensure the longer term sustainability of the Social Services budget.
3.4 The Executive Director of Neighbourhood Services anticipates
a favourable variance of £0.112m mainly due to savings in employee costs and landfill costs partially offset by additional transport, property and supplies and services costs.
3.5 The Executive Director of Corporate Support anticipates a
break even position at 31 March 2010 after the utilisation of £0.400m of departmental balances as approved by Cabinet on 2 December 2009 to offset current budget pressures including a projected shortfall in Planning and Building Standards income of £0.716m.
3.6 The Executive Head of Finance and Asset Management
anticipates a favourable variance of £0.124m mainly due to funding received from the Department of Work and Pensions, additional income and employee cost savings offset by reduced property related income.

3.7 The level of Housing and Council Tax Benefit shows an increase of 12.8% over the same period last year with the net cost currently over budget by £0.188m. This is offset by the income recovered which is anticipated to outturn £0.264m over budget, resulting in a net favourable variance of £0.076m. The current projection for Council Tax shows a potential shortfall of £0.979m relating primarily to collection of arrears. In addition there is an adverse variance of £0.022m on Non Domestic Rates income due to increased discretionary reliefs.
3.8 In line with Cabinet approval on 11 February 2009 £1.000m
has been transferred from the Capital Fund to smooth the anticipated impact on the revenue budget of the accelerated capital programme. In addition there is currently £0.200m reduction in Debt Charges due to a favourable cash profile and additional investment income in the year.
3.9 Property condition surveys across the Council’s estate have
identified a number of repairs categorised as urgent or essential meaning they require attention before March 2011. In view of the policy to accelerate building works spending where possible it is proposed that repairs to school buildings be instructed now to enable works to be programmed as quickly as possible. The estimated total cost of £2.215m would be met from the £1.200m noted in paragraph 3.8 and from an acceleration of future year capital spending.
3.10 The number of staff on the Redeployment Register as at 30
November 2009 is 14 and the cost of maintaining them is £0.188m. The number of staff on the register fluctuates and during the year a further 19 staff were added to the register and subsequently removed prior to period 8 due to due to contracts ending or being terminated. The total cost of maintaining these 19 staff was £0.096m.
4 LEADER’S INITIATIVES 4.1 At the Council meeting of 14 February 2008 the Leader
detailed a number of specific innovative initiatives to commence in 2008/09, with £1.000m approved to be allocated from the Council’s General Fund uncommitted balance. The table on page 3 details the specific schemes and their current status based on information provided by the departments.
5 HOUSING REVENUE ACCOUNT (HRA)
5.1 It is proposed that the favourable variances in employee
costs, debt charges and voids be used to used to assist capital spending to help offset the affect of reduced house sales and formal approval is sought for this.
5.2 Projected expenditure on the Housing Investment Programme
is £15.365m which is 98% of budgeted expenditure. 6 GENERAL FUND UNCOMMITTED BALANCE 6.1 The Financial Reserves Strategy sets the level of the
Uncommitted General Fund Balance at between 2% and 4 % of Annual Budgeted Expenditure. During the current financial year commitments of £0.764m have been approved by Cabinet. When added to the reallocated funding approved by Cabinet on 2 December 2009 of £2.781m, the uncommitted balance is increased to £8.618m which equates to 2.6% of the annual budgeted expenditure for 2009/10.
7 CAPITAL PROGRAMME 7.1 Projected expenditure on the Capital Programme for the year
is £29.807m which is 103% of budgeted expenditure.

7.2 The Data Centre/Council Meeting Room project under way at
Council Headquarters was originally tendered on the basis that the scope of the initial phase of the works would relate primarily to the construction of the Meeting Room area. The need to undertake remedial works has resulted in an opportunity to accelerate other planned elements of the project including roof, fire separation and electrical works and it is advantageous for these works to be done under the same contract using the same tendered prices. This will increase the contract value by £0.300m or 21% and authority is formally requested from the Cabinet in this regard. It should be noted that these works were planned and included in the overall project cost which remains within budget.
7.3 The work to the front of house and stage at the Palace
Theatre will be completed concurrently with the lift installation which will be installed between January and April 2010. Current cost projections suggest there may be an underspend and it is proposed that this is used to enable limited internal refurbishment of the theatre.
7.4 The Auchinleck Resource Centre project depended on partner
participation and external funding which are not now anticipated in the short term. In these circumstances it is proposed to use the allocation to fund a partial upgrade to Auchinleck Community Centre.
8 RECOMMENDATIONS 8.1 It is recommended that Members:
(i) approve the utilisation of £1.200m of current years balances for essential repairs as noted at paragraph 3.9;
(ii) approve the utilisation of savings within the HRA
budget for additional CFCR/Planned Maintenance works within HRA as at paragraph 5.1;
(iii) note the accelerated works in respect of the London
Road Headquarters as noted at paragraph 7.2;
(iv) agree that any underspend on the Palace Theatre project shown on page 63 should be utilised for internal refurbishment works as noted at paragraph 7.3;
(v) agree that the Auchinleck Resource Centre allocation
be used for a limited refurbishment of Auchinleck Community Centre as noted at paragraph 7.4; and
(vi) otherwise note the contents of this report.
Alex McPhee Executive Head of Finance and Asset Management 10 December 2009
LIST OF BACKGROUND PAPERS - NIL Members wishing further information should contact
Alex McPhee, Executive Head of Finance and Asset Management, Telephone (01563) 576300

2009/2010 FINANCE AND SERVICE STRATEGY REPORT TO PERIOD 8 (15 NOVEMBER 2009)
PAGE INDEX
Overview Page General Fund Summary 1 Capital Summary 2 Leader’s Initiatives 3
Departmental Budgets Page Educational and Social Services 5 Neighbourhood Services 16 Corporate Support 28 Finance and Asset Management 41 Central Services 50

.
2009/2010 FINANCE AND SERVICE STRATEGY REPORT TO PERIOD 8 (15 NOVEMBER 2009)
GENERAL FUND SUMMARY
1
Service 2009/10 Budget
£m
Projected Actual to 31 March
2010
ProjectedVariance
£m 2009/10
Budget £m
Projected Actual to 31 March
2010
ProjectedVariance
£m Educational and Social Services 176.991 176.645 (0.346) Deficit / (Surplus) for the Year 3.057 2.551 (0.506) Neighbourhood Services 66.899 66.787 (0.112) Transfer from Capital Fund 0.000 (1.000) (1.000) Corporate Support 16.881 16.881 0.000 Utilisation of Current Years Balances 0.000 1.200 1.200 Finance and Asset Management 9.170 9.046 (0.124) Utilise Previous Years Balances (3.057) (3.057) 0.000 Central Services– Other 8.058 7.565 (0.493) Departmental Under/(Over) Spend c/f 0.000 0.582 0.582 Central Services – HB/CT Benefit Subsidy 43.414 43.602 0.188 2009/2010 Deficit / (Surplus) 0.000 0.276 0.276 Central Services – Debt Charges 17.350 17.150 (0.200)
Building and Works (0.783) (0.939) (0.156)
Net Expenditure 337.980 336.737 (1.243) Housing Revenue Account
Expenditure 36.793 36.651 (0.142) Funded by Income (36.793) (36.651) 0.142
Council Tax (48.818) (47.839) 0.979 Net Expenditure 0.000 0.000 0.000 Aggregated External Finance (242.789) (242.767) 0.022
HB/CT Benefit Subsidy (43.316) (43.580) (0.264)
Total Income (334.923) (334.186) 0.737

.
2009/2010 FINANCE AND SERVICE STRATEGY REPORT TO PERIOD 8 (15 NOVEMBER 2009)
CAPITAL SUMMARY
2
Service
Revised Budget 2009/10
£m
Actual Expenditure to
Date £m
Projected Expenditure
2009/10 £m
Projected Expenditure as % Budget
Funded by Revised Budget 2009/10
£m
Projected Expenditure
2009/10 £m
Education & Social Services 7.100 2.802 6.250 88% Grants, Partnership Funding , CFCR 10.149 10.149 Neighbourhood Services 14.054 5.065 14.169 101% External Borrowing 18.857 19.658 Corporate Support 2.740 0.857 2.740 100% Total 29.006 29.807 Finance and Asset Management 1.600 0.210 1.728 108% Regeneration, Efficiency & Asset Management 3.477 0.601 4.920 142% Contingency Funding 0.035 0.000 0.000 - Total 29.006 9.535 29.807 103%
Service Revised Budget 2009/10
Actual Expenditure to
Date
Projected Expenditure
2009/10
Projected Expenditure as % Budget
Funded by Revised Budget 2009/10
Projected Expenditure
2009/10 Housing Revenue Account 15.616 4.636 15.365 98% Revenue Funding (CFCR) 5.561 5.947 Sale of Council Dwellings 4.888 2.000 Anticipated Borrowing 5.167 7.418 Total 15.616 15.365

.
2009/2010 FINANCE AND SERVICE STRATEGY REPORT TO PERIOD 8 (15 NOVEMBER 2009)
LEADER’S INITIATIVES
Status: Complete In Progress To Commence 3
No Initiative Lead Department
Projected Expenditure to 31 March 2010
Progress
1 Landscape works being carried out in Kilmarnock Town Centre including Titchfield Street, Glencairn Street and West Langlands Street
Corporate Support £0.040m
Car parking area and landscaping at North Hamilton Place complete and two large hexagonal planters purchased for Langlands St. and Titchfield St. Kilmarnock. Costs revised by £0.010m. Additional landscaping works to be carried out in Spring 2010.
2 The provision of a drop-down façade erected at the opera house site at John Finnie Street, to be developed in partnership with Klin Developments
Corporate Support £0.000m
This activity has been overtaken by Kilmarnock Town Centre developments.
3 The provision of a new floral clock with associated landscaping works at Kilmarnock Railway Station
Corporate Support £0.209m
Cabinet on 8 July 2009 agreed proposals. Total project cost is currently anticipated to be £0.380m with funding of £0.320m secured per Cabinet of 4 November 2009. Tender process for the clock face and wall have still to be completed. Currently also await conclusion of license agreement with Network Rail prior to awarding contract. Stage 2 (Garden Street) is dependant on £0.060m additional funding being secured.
4(a) The installation of floodlighting to highlight key landmark structures - the viaduct
Corporate Support £0.100m
Project completed in 2008/09 and opening ceremony took place on 6 October 2008.
4(b) External Lighting Projects Corporate Support £0.292m
Work continues with regards to the scheme scope and specification. Neighbourhood Services have been instructed to progress with the purchase of lighting equipment for Riccarton Church and Kilmarnock Town Centre and are working on revised schemes for Bank Street. Opening ceremony for Phase 1 took place in November 2009.
5 Feasibility study for cultural activity (per Cabinet 17 December 2008)
Corporate Support £0.070m
Scheme is currently in progress.
6 The development of options for future use of the Co-op building in Darvel
Corporate Support £0.017m
Consultants concluded that the building was structurally unsound and demolition works are complete, paid for by the owner. The feasibility study for the reuse of the site has now been finalised.

.
2009/2010 FINANCE AND SERVICE STRATEGY REPORT TO PERIOD 8 (15 NOVEMBER 2009)
LEADER’S INITIATIVES
Status: Complete In Progress To Commence 4
No Initiative Lead
Department Projected
Expenditure to 31 March 2010
Progress
7 The refurbishment of the Council-owned shops in Ayr Road, Cumnock
Finance & Asset
Management £0.120m
One of the units is now occupied and negotiations are ongoing with an interested party regarding a second unit. Work at the remaining shop is ongoing following it becoming vacant.
8 The extension of summer floral baskets to cover all of the historical centres of Kilmarnock and Cumnock
Neighbourhood Services £0.012m
Scheme completed in 2008/09.
9(a) The purchase of an additional mechanical sweeper to tackle litter
Neighbourhood Services £0.068m
Complete with vehicle purchased in 2008./09.
9(b) Litter Education & Enforcement team Corporate Support -
Scheme completed and funded by the department. The Corporate Enforcement Unit is well established and the programme of planned enforcement and educative activities continue to be delivered and generally well received.
10 Changes to the Shopmobility scheme to make it available on a Saturday
Neighbourhood Services -
Scheme completed in 2008/09 and funded by the department.
11 The availability of a public convenience provision in Kilmarnock seven days a week
Neighbourhood Services £0.025m
Planning application submitted and contract for installation awarded.
12 The provision of new toilet facilities in Mauchline Neighbourhood Services -
Scheme completed and funded by the department.
TOTAL £0.953m

2009/2010 FINANCE AND SERVICE STRATEGY REPORT TO PERIOD 8 (15 NOVEMBER 2009)
EDUCATIONAL AND SOCIAL SERVICES
5
SERVICE SUMMARY Based on current service activity and advice from the Executive Director of Educational and Social Services, it is anticipated that the department of Educational and Social Services will outturn £0.346m under budget at 31 March 2010, after the utilisation of £0.487m of departmental balances approved by Cabinet on 2 December 2009 to offset budget pressures arising from severance payments and the additional costs of outwith placements within Educational Services. The Educational Services position is £0.383m under budget. Additional employee costs for Classroom assistants for additional support are offset by funds held within Central Resources for teachers in 2010/11. In addition, the deployment of additional Probationers and Scottish Government grant funding and ongoing vacancies within the Psychological services section have resulted in favourable variances. Additional property costs are anticipated for transport and relocation costs for pupils and staff at Crossroads Primary School, additional office space at Elmbank Centre and Woodstock School annexe. Additional Supplies and Services costs have been incurred in order to align Secondary School budgets with the new rolls. The Social Services position is £0.037m under budget after the utilisation of General Fund balances brought forward of £0.360m as well as significant savings from management of vacant posts. The figures in this report do not include any adjustments related to service reviews underway within children’s services, adult services and administrative support. It is anticipated that future reports will incorporate required budget adjustments resulting from these reviews. The approved budget for care at home services has been allocated to take account of the review of eligibility criteria for services. The Review Team is fully established and is presently undertaking reviews across individual teams on a phased basis. It is important to highlight that the review process is at an early stage there will inevitably be a lead-in time before cost reductions are fully realised.
Estimate
£m
Projection to 31 Mar 10
£m
Variance (Favourable)
/ Adverse Resources 2.522 2.066 (0.456) PPP 8.242 8.242 0.000 Schools 65.827 65.911 0.084 Community Support 24.036 23.904 (0.132) Facilities Management 13.709 13.904 0.195 Social Work 62.655 62.618 (0.037) Net Expenditure 176.991 176.645 (0.346)
Estimate
£m
Projection to 31 Mar 10
£m
Variance (Favourable)
/ Adverse Employee Costs 119.263 117.946 -1.317 Property Costs 7.773 8.080 0.307 Transport Costs 6.856 6.738 -0.118 Supplies & Services 9.325 9.550 0.225 Third Party Payments 46.820 48.012 1.192 Transfer Payments 6.137 6.509 0.372 Gross Expenditure 196.174 196.835 0.661 Income (19.543) (20.190) (0.647) Net Expenditure 176.631 176.645 0.014 Utilise Balances 0.360 0.000 (0.360) Net Expenditure 176.991 176.645 (0.346)

2009/2010 FINANCE AND SERVICE STRATEGY REPORT TO PERIOD 8 (15 NOVEMBER 2009)
EDUCATIONAL AND SOCIAL SERVICES
6
SUMMARY OF MOVEMENTS IN APPROVED BUDGET Annual
Estimate £m
Budget Adjustments
£m
Revised Budget
£m Comments on Budget Movement
Budget Allocation Approved by Council 12 February 2009 170.244
Additions / Transfers to / (from) Initial Budget:
1 Utilisation of Balances +1.177 Drawdown of Earmarked Balances and use of Departmental Balances
2 Fairer Scotland Fund +0.010 Realignment of Budgets to reflect allocation of Fairer Scotland Fund
3 Teacher Induction Scheme Funding +0.011 Additional Funding for Probationary Teachers
4 Gaelic Education Funding +0.007 Additional Funding for Gaelic Education
5 Realignment of Social Work Income Budgets +0.100 Realignment of Budgets to Reflect actual inflation on Health Board Income
6 Adult Support and Protection Funding +0.362 Additional Funding for Implementation of the Adult Support and Protection (Scotland) Act
7 Community Planning Budget Realignment +0.192 Realignment of Budgets to reflect transfer of Community Planning payments to other external bodies and 2 Staff to Community Learning
8 Departmental Human Resources Budget Realignment -0.743 Realignment of Budgets to reflect transfer of Departmental Human Resources Staff to Corporate Support
9 Grants to Voluntary Organisations Budget Realignment -0.010 Realignment of Budgets to reflect transfer of responsibilities to Neighbourhood Services
10 Budget realignment for Onsite and Vehicle Maintenance +0.033 Transfer budgets for Kay Park Library cleaning and former trading services transfer
11 Social Services Budget realignment -0.045 Realignment of budget to reflect Community Health & Wellbeing Officer to Corporate Support
12 Supporting People Budget Realignment 5.653 Transfer of Formerly Ringfenced Supporting People Budget from Neighbourhood Services
Total Budget adjustments +6.747
Revised Budget Allocation at Period 8 176.991

2009/2010 FINANCE AND SERVICE STRATEGY REPORT TO PERIOD 8 (15 NOVEMBER 2009)
EDUCATIONAL AND SOCIAL SERVICES
Status: Fully met In Progress Unmet 7
EXPENDITURE REDUCTION TARGETS
At the Council meeting on 12 February 2009 the department was been tasked with saving 1.5% of its controllable revenue expenditure which equates to £2.372m. The continuous pursuit of efficiencies to release resources for priority areas is established practice within the Council and whilst the target is challenging it is considered to be achievable without affecting the quality of essential services.
ACTIONS
Theme SAVING
£m Status at 15/11/09
Achieved at 15/11/09
£m Educational and Social Services 2.372 2.158 Reduce the number of school administration and support staff KSO 0.210 0.048 Reduce the number of classroom assistants by natural wastage KSO 0.174 0.174 Reduce costs of school cleaning by 10% including the use of new technology KSO 0.157 0.157 Redesign the Outdoor Learning service KSO 0.125 0.125 Reduce costs within the Educational & Social Services property team KSO 0.022 0.022 Reduce school letting hours KSO 0.010 0.010 Review of Learning Partnerships to improve integration with Children & Families Services CIS 0.396 0.396 Efficiencies in Community Learning and Development (CL&D) CIS 0.078 0.078 Review of early years establishment structures CIS 0.062 0.062 Review the structure of the school psychology service CIS 0.045 0.045 Review how Central Education Continuing Professional Development is delivered BRS 0.198 0.198 Review of Quality Improvement within Educational &Social Services BRS 0.092 0.092 Review of school catering arrangements SB4 0.024 0.024 Review of School Management structures CND 0.556 0.556 Adjustments to school delegated budgets to take account of falling school rolls CND 0.141 0.141 Review of Arts and Culture function CND 0.077 0.077 Recharge of school library support service CND 0.005 0.005

2009/2010 FINANCE AND SERVICE STRATEGY REPORT TO PERIOD 8 (15 NOVEMBER 2009)
EDUCATIONAL AND SOCIAL SERVICES
Previous Year Current Year
8
PERFORMANCE MEASURES
0.00%
1.00%
2.00%
3.00%
4.00%
5.00%
6.00%
7.00%
8.00%
Apr May Jun Jul Aug Sep Oct Nov Dec Jan Feb Mar
Absence Management: Percentage of working days lost - Educational & Social Services
0.0%
20.0%
40.0%
60.0%
80.0%
100.0%
120.0%
Apr May Jun Jul Aug Sep Oct Nov Dec Jan Feb Mar
Attendance: Pupil Attendance Rates.
Absence management is a regular agenda item at Departmental Directorate Team and Service Management Team meetings. Absence increased from 5.61% to 6.16% for ESS employees (excluding Teachers). The only month in which absence was higher was July. There was an increase in both short term and long term absence, with long term absence accounting for 52% of all absences, only a marginal increase since September. Absence management procedures are being applied. Levels of absence are being monitored weekly in relation to pandemic flu. The Corporate Managing Absence group has been looking at a number of areas, including drilling down into the reasons for absence and examining short term persistent absence. Everyone should now have a copy of the new managing absence guidelines and a new toolbox talk DVD has been released and is being rolled out to all staff.
Overall pupil attendance has fallen by 0.9% points from September 2009 but a level of 93.3% remains encouraging as we move into the winter term. Guidelines have been issued from Scottish Government regarding attendance related to Influenza A H1N1 pandemic. These will be followed in monitoring attendance levels as we move into winter. Contingency plans have been agreed at LNCT.

2009/2010 FINANCE AND SERVICE STRATEGY REPORT TO PERIOD 8 (15 NOVEMBER 2009)
EDUCATIONAL AND SOCIAL SERVICES
Previous Year Current Year
9
0
20
40
60
80
100
120
140
160
Apr May Jun Jul Aug Sep Oct Nov Dec Jan Feb
Exclusions: Number of exclusion incidents.
0
50
100
150
200
250
Apr May Jun Jul Aug Sep Oct Nov Dec Jan Feb
Corporate Parenting: Number of children looked after and accommodated.
Overall exclusions show a significant reduction from 84 in September to 56 in October. This is in part due to the shorter month arising from the October holiday week. However there is still a reduction from 70 exclusions for the same time period in 2008. This has resulted in an exclusion rate in the primary sector of 1.4 per 1000 pupils and openings lost of 6.4 per 1000 pupils and the lowest rate in the last 5 years in the secondary sector of 6.0 per 1000 pupils (from a high of 15.4 in October 2006) and openings lost of 26.1 per 1000 pupils (from a high of 73.8 in October 2006). The department will continue to monitor exclusions and encourage schools to redouble efforts linked to promoting positive behaviour and providing appropriate alternative curricula and courses for those in danger of disengagement and
l i The trend in the numbers of looked after and accommodated children being significantly higher than the same period in 12 months prior is continued. This reflects a national trend. This trend has implications for capacity and resources and is a factor being considered within the Social Work Sustainability Review.

2009/2010 FINANCE AND SERVICE STRATEGY REPORT TO PERIOD 8 (15 NOVEMBER 2009)
EDUCATIONAL AND SOCIAL SERVICES
Previous Year Current Year
10
0.0%
20.0%
40.0%
60.0%
80.0%
100.0%
120.0%
Apr May Jun Jul Aug Sep Oct Nov Dec Jan Feb
Criminal Justice: Percentage of reports submitted to the courts by the due date.
0%
20%
40%
60%
80%
100%
120%
Apr May Jun Jul Aug Sep Oct Nov Dec Jan Feb
Child Supervision: Percentage of children seen by their supervising officer within 15days.
The 100% success has been achieved by regular performance monitoring by team managers.
100% performance has been maintained due to the good practice of social workers in giving effect to the supervision requirement at the Children's Hearing.

2009/2010 FINANCE AND SERVICE STRATEGY REPORT TO PERIOD 8 (15 NOVEMBER 2009)
EDUCATIONAL AND SOCIAL SERVICES
Previous Year Current Year
11
0.0%
20.0%
40.0%
60.0%
80.0%
100.0%
120.0%
Apr May Jun Jul Aug Sep Oct Nov Dec Jan Feb
Homecare: Percentage of homecare clients aged 65+ receiving Personal Care.
The measure indicates a continued focus of the homecare service towards the needs of the most vulnerable. As part of the Social Work Sustainability programme all homecare service provision is currently being reviewed with reference to efficient working practices and consistent application of eligibility criteria. Revised Eligibility Criteria for Community Care services were approved by Cabinet on 18 November 2009.

2009/2010 FINANCE AND SERVICE STRATEGY REPORT TO PERIOD 8 (15 NOVEMBER 2009)
EDUCATIONAL AND SOCIAL SERVICES
12
SERVICE PERFORMANCE TO DATE
RESOURCES The variance mainly relates to a sum of £0.325m which was previously anticipated to be required for carry forward at 31 March 2010 to pay for 15 additional Primary teachers and for the restructure of the Secondary Schools promoted post structures as approved by Cabinet on 17 June 2009. This is no longer required and the funding will be utilised to offset additional expenditure elsewhere within the department. This variance is partly offset by the projected recurring cost of 1 FTE Grade 12 post which is part of the resource support admin review. The variance within Third Party Payments is due to claims against the PPP contractor for non performance. Income is under recovered due to reduced recharges within the Technicians Service. FTE STAFFING ANALYSIS
Budget In year Changes Revised Budget Actual to date 62.24 -28.6 33.64 29.06
PPP / BUILDING LEARNING COMMUNITIES There are no material variances anticipated at this time. Any future variances will be retained centrally to fund PPP Unitary Charges in future years.
Estimate
£m
Projection to 31 Mar 10
£m
Variance (Favourable)
/ Adverse Employee Costs 1.970 1.685 (0.285) Property Costs 0.051 0.051 0.000 Transport Costs 0.030 0.030 0.000 Supplies & Services 0.761 0.766 0.005 Third Party Payments 0.186 (0.015) (0.201) Transfer Payments 0.714 0.714 0.000 Gross Expenditure 3.712 3.231 (0.481) Income (1.190) (1.165) 0.025 Net Expenditure 2.522 2.066 (0.456)
Estimate
£m
Projection to 31 Mar 10
£m
Variance (Favourable)
/ Adverse Employee Costs 0.000 0.000 0.000 Property Costs 0.000 0.000 0.000 Transport Costs 0.000 0.000 0.000 Supplies & Services 0.000 0.000 0.000 Third Party Payments 8.242 8.242 0.000 Transfer Payments 0.000 0.000 0.000 Gross Expenditure 8.242 8.242 0.000 Income 0.000 0.000 0.000 Net Expenditure 8.242 8.242 0.000

2009/2010 FINANCE AND SERVICE STRATEGY REPORT TO PERIOD 8 (15 NOVEMBER 2009)
EDUCATIONAL AND SOCIAL SERVICES
13
SCHOOLS The Employee Cost variance is mainly due to the demand for additional support resulting in the employment of additional classroom assistants, additional costs in the HQ Cover budget for Special Schools, partially offset by the deployment of additional probationers and Scottish Government grant funding. In addition the costs for returning pupils in August 2009 exceeds the amount previously anticipated due to higher pupil stay on rates and returning pupils attending college resulting in additional Supplies and Services costs partly offset by the reduced number of SQA exam fees. The adverse variances in third party payments relates to the school library service and the issue has now been resolved. Additional income will be received from recharges to other authorities for classroom assistants.
FTE STAFFING ANALYSIS Budget In year Changes Revised Budget Actual to date 1,547.44 +9.63 1,557.07 1,577.57
COMMUNITY SUPPORT Favourable employee cost variances are anticipated as a result of vacancies and maternity leave mainly within Psychological Services and a restructure of Early Years staffing. There are additional Property Costs in respect of accommodation at Witchhill School for the new Annexe. Supplies and Services variances relate to integrated community schools and common communications. Additional Outwith Placement costs have been partially offset by the cessation of the Ayrshire Household Recycling Project and expenditure on Women’s Aid being less than anticipated. There is additional expenditure anticipated in respect of payments to day carers. The Income variance relates to wraparound care.
FTE STAFFING ANALYSIS Budget In year Changes Revised Budget Actual to date 517.62 -32.04 485.58 469.52
Estimate
£m
Projection to 31 Mar 10
£m
Variance (Favourable)
/ Adverse Employee Costs 58.464 58.450 (0.014) Property Costs 4.753 4.762 0.009 Transport Costs 0.212 0.214 0.002 Supplies & Services 3.022 3.169 0.147 Third Party Payments 0.624 0.650 0.026 Transfer Payments 0.310 0.310 0.000 Gross Expenditure 67.385 67.555 0.170 Income (1.558) (1.644) (0.086) Net Expenditure 65.827 65.911 0.084
Estimate
£m
Projection to 31 Mar 10
£m
Variance (Favourable)
/ Adverse Employee Costs 16.258 16.079 (0.179) Property Costs 0.987 1.034 0.047 Transport Costs 0.256 0.251 (0.005) Supplies & Services 1.547 1.523 (0.024) Third Party Payments 5.740 5.744 0.004 Transfer Payments 0.086 0.101 0.015 Gross Expenditure 24.874 24.732 (0.142) Income (0.838) (0.828) 0.010 Net Expenditure 24.036 23.904 (0.132)

2009/2010 FINANCE AND SERVICE STRATEGY REPORT TO PERIOD 8 (15 NOVEMBER 2009)
EDUCATIONAL AND SOCIAL SERVICES
14
FACILITIES MANAGEMENT The favourable employee costs variance is due to efficiency savings offset by redundancy costs and payments in lieu. These savings have offset additional foodstuff supply costs and reduced meals income, Social Work Centre income, janitors recharges and special catering income. Additional costs of £0.176m are currently anticipated for transport and relocation costs for pupils and staff at Crossroads Primary School and Bellfield Primary School the latter requiring teaching resource alterations and potential capital costs for the playground/car park, as well as refurbishment costs at Elmbank Centre. FTE STAFFING ANALYSIS
Budget In year Changes Revised Budget Actual to date 510.40 0 510.40 502.83
SOCIAL WORK The favourable variance of £0.037m is achieved through utilisation of non-recurring balances of £0.360m, as well as significant savings from management of vacant posts. The figures in this report do not include any adjustments related to service reviews underway within children’s services, adult services and administrative support. It is anticipated that future reports will incorporate required budget adjustments resulting from these reviews. The approved budget for care at home services has been allocated to take account of the review of eligibility criteria for services. The Review Team is fully established and is presently undertaking reviews across individual teams on a phased basis. It is important to highlight that the review process is at an early stage there will inevitably be a lead-in time before cost reductions are fully realised. The report includes additional specialised child placement costs and expenditure related to increased internal foster care placement. As at 18 November, the Council was funding 2 young people within secure accommodation with provision for 1 additional placement for the remainder of the financial year. Additional elderly care costs of £0.136m are also included mainly due to emergency admissions to residential accommodations. Additional adult care package costs of £0.505m are partly offset by lower than anticipated transport costs across the service. FTE STAFFING ANALYSIS
Budget In year Changes Revised Budget Actual to date 1,089.57 +28.44 1,118.01 1,032.26
Estimate
£m
Projection to 31 Mar 10
£m
Variance (Favourable)
/ Adverse Employee Costs 9.340 9.194 (0.146) Property Costs 0.256 0.467 0.211 Transport Costs 4.913 4.919 0.006 Supplies & Services 2.342 2.372 0.030 Third Party Payments 0.000 0.000 0.000 Transfer Payments 0.000 0.000 0.000 Gross Expenditure 16.851 16.952 0.101 Income (3.142) (3.048) 0.094 Net Expenditure 13.709 13.904 0.195
Estimate
£m
Projection to 31 Mar 10
£m
Variance (Favourable)
/ Adverse Employee Costs 33.231 32.538 (0.693) Property Costs 1.726 1.766 0.040 Transport Costs 1.445 1.324 (0.121) Supplies & Services 1.653 1.720 0.067 Third Party Payments 32.028 33.391 1.363 Transfer Payments 5.027 5.384 0.357 Gross Expenditure 75.110 76.123 1.013 Income (12.815) (13.505) (0.690) Net Expenditure 62.295 62.618 0.323 Utilise Balances 0.360 0.000 (0.360) Net Expenditure 62.655 62.618 (0.037)

2009/2010 FINANCE AND SERVICE STRATEGY REPORT TO PERIOD 8 (15 NOVEMBER 2009)
EDUCATIONAL AND SOCIAL SERVICES
15
Service Enhancements 2009/10 Additional funding has been provided for the operation of a number of services experiencing increasing demands and costs including: • Social Work service pressures including foster care, home care,
personalised care and adult care; • Introduction of National Entitlement Cards; • Revenue costs arising from the new Netherthird Community Campus. Additional funding has also been provided in relation to the introduction of the Fairer Scotland Fund which replaced a number of existing funding streams including the Community Regeneration Fund, the Community Voices Programme, Working for Families, the Social Inclusion element of the Changing Children’s Services Fund, the Financial Inclusion Fund, Workforce Plus and More Choices – More Chances.
Strategic Review of the Revenue Budget The Strategic Review of the Revenue Budget resulted in decisions to realign the Revenue Budget and invest additional resources in a number of areas including: • The redesign and development of Social Work Infrastructure to meet
increasing demands for services; • Additional teachers for educational establishments in deprived areas; • Increased resources for the placement of children and young people in
specialist educational establishments outwith East Ayrshire. This will result in net additional funding of £1.037m over the 4 years to 2011/12.

2009/2010 FINANCE AND SERVICE STRATEGY REPORT TO PERIOD 8 (15 NOVEMBER 2009)
NEIGHBOURHOOD SERVICES
16
SERVICE SUMMARY The projected outturn to 31 March 2010 is a favourable variance of £0.112m. This is mainly due to anticipated savings in Central Management Support, Leisure Service, Waste Management and Strong Safe and Attractive Communities. This is partly offset by adverse variances within Community Safety & CCTV, Emergency Planning, General Fund Housing and Supporting People. All other services are anticipated to outturn on budget. Building and Works is expected to outturn above budget at 31 March 2010.
Estimate £m
Projection to 31 Mar 10
£m
Variance (Favourable)
/ Adverse Central Mgt Support 0.889 0.763 (0.126) Leisure Services 12.273 12.233 (0.040) General Fund Housing 11.886 11.927 0.041 Emergency Planning 0.049 0.062 0.013 Police & Fire 30.680 30.680 0.000 Roads & Transport 11.122 11.122 0.000 Net expenditure 66.899 66.787 (0.112)
Estimate
£m
Projection to 31 Mar 10
£m
Variance (Favourable)
/ Adverse Employee Costs 24.286 24.047 (0.239) Property Costs 3.161 3.168 0.007 Transport Costs 3.785 3.935 0.150 Supplies & Services 7.837 7.826 (0.011) Third Party Payments 40.802 40.478 (0.324) Transfer Payments 0.000 0.000 0.000 Gross Expenditure 79.871 79.454 (0.417) Income (12.972) (12.667) 0.305 Net expenditure 66.899 66.787 (0.112)

2009/2010 FINANCE AND SERVICE STRATEGY REPORT TO PERIOD 8 (15 NOVEMBER 2009)
NEIGHBOURHOOD SERVICES
17
SUMMARY OF MOVEMENTS IN APPROVED BUDGET
Annual Estimate
£m
Budget Adjustments
£m
Revised Budget
£m Comments on Budget Movement
Budget Allocation Approved by Council 12 February 2009 72.481
Additions / Transfers to / (from) Initial Budget:
1 Fairer Scotland Fund +0.009 Realignment of Budgets to Reflect Allocation of Fairer Scotland Fund
2 Realignment of SPT Precept Budgets +0.002 Realignment of Budgets to Reflect Actual SPT Precept
3 Realignment of Energy Budgets +0.054 Realignment of Budgets to Reflect Projected Energy Costs
4 Police Specific Grant +0.019 Additional Funding for Police Specific Grants
5 Strategic Waste Fund +0.011 Additional Funding for the Strategic Waste Fund
6 Departmental Human Resources Budget Realignment -0.166 Realignment of Budgets to Reflect Transfer of Departmental Human Resources Staff to Corporate Support
7 Grants to Voluntary Organisations Budget Realignment +0.010 Realignment of Budgets to Reflect Transfer of Responsibilities from Educational and Social Services
8 Adjustment of Income Recharges outwith the General Fund +0.071 Realignment of Budgets income recharges outwith the General Fund
9 Realignment of Property Budgets +0.040 Transfer of property budgets relating to bus stations from Finance and Asset Management
9 Realignment of IT, Vehicle Maintenance & Libraries Budgets -0.038 Transfer of budgets relating to WAN (Corporate Support new buildings), Former Trading Services and Kay Park Library cleaning
9 Supporting People Budget Realignment -5.653 Transfer of formerly ring fenced Supporting People budget to ESS
9 Utilisation of Balances +0.061 Drawdown of Earmarked balances
Total Budget adjustments -5.582
Revised Budget Allocation at Period 8 66.899

2009/2010 FINANCE AND SERVICE STRATEGY REPORT TO PERIOD 8 (15 NOVEMBER 2009)
NEIGHBOURHOOD SERVICES
Status: Fully met In Progress Unmet
18
EXPENDITURE REDUCTION TARGETS The department was been tasked with saving 2.4% of its controllable revenue expenditure which equates to £0.964m. The continuous pursuit of efficiencies to release resources for priority areas is established practice within the Council and whilst the target is challenging it is considered to be achievable without affecting the quality of essential services.
ACTIONS Theme SAVING £m
Status at 15/11/09
Achieved at 15/11/09
£m Neighbourhood Services 0.964 0.946 Reduce Community Safety / Local Action Fund expenditure KSO 0.150 0.150 Reduce promotion expenditure and third party payments in Leisure Services KSO 0.022 0.022 Reduce landfill charges for waste PYI 0.250 0.250 Reduce expenditure on public library books given previous higher spending PYI 0.020 0.020 Maximise use of CCTV PYI 0.008 0.008 Review general project funding within Leisure Services PYI 0.004 0.004 Recharge of Roads and Transportation design fees UAF 0.076 0.076 Review of Roads and Transport functions in Neighbourhood Services BRS 0.171 0.171 Review of General Fund Housing BRS 0.123 0.123 Efficiencies within Leisure Services SB4 0.040 0.026 Savings from Emergency Planning shared services SB4 0.021 0.021 Savings within Central Management Support CND 0.021 0.021 Leisure Services – Skillseeker Provision CND 0.006 0.006 Review of service provision within Leisure Services CND 0.010 0.010 Reduce the opening hours at the Gavin Hamilton Centre to reflect current demand CND 0.013 0.013 Review of contractual arrangements within Roads and Transportation PSP 0.027 0.027 Close unused changing pavilions at New Farm Loch and Bonnyton MUA 0.002 0.002

2009/2010 FINANCE AND SERVICE STRATEGY REPORT TO PERIOD 8 (15 NOVEMBER 2009)
NEIGHBOURHOOD SERVICES
Previous Year Current Year
19
PERFORMANCE MEASURES
0.00%
1.00%
2.00%
3.00%
4.00%
5.00%
6.00%
7.00%
8.00%
Apr May Jun Jul Aug Sep Oct Nov Dec Jan Feb Mar
Absence Management: Percentage of working days lost - Neighbourhood Services
0
10,000
20,000
30,000
40,000
50,000
60,000
Apr May Jun Jul Aug Sep Oct Nov Dec Jan Feb Mar
Community Recreation Games Hall Attendances: All venues
October is a transitional period for recreation services and coincides with the launch of Community Recreations autumn/winter programme. Overall the launch was successful with gains in attendances at Catrine games hall, Hunter Fitness Suite, Muirkirk games hall, New Cumnock games hall and Patna games hall. There were minor losses at Drongan games hall, Gavin Hamilton sports centre and Mauchline games hall. However, over the year the majority of facilities are making gains on 2008/2009 and the eight sports facilities should demonstrate a cumulative increase on last year. St Josephs, Grange and Doon Valley Leisure Centres are performing reasonably well and will improve considerably when the installation of suitable small size goals at the synthetic grass pitches is achieved.
The absence rate decreased to its lowest level since June 2009, dropping from a high of 7% in September to 5.99% in October. The majority of days lost, (54%), were due to long term absence. There were five new referrals to the Occupational Health Service in month, with a further thirteen cases recorded as ongoing. This is closely monitored by Heads of Service and monthly meetings are held with HR Staff and the Executive Director. The DMT monitor absences closely and ensure that the Council's Absence Management Policy is rigorously enforced and that areas with high absence levels are targeted directly. The Corporate Managing Absence Group has been looking at a number of areas, including drilling down into the reasons for absence and examining short term persistent absence. Everyone should now have a copy of the new managing absence guidelines and a new toolbox talk DVD has been released and is being rolled out to all staff.

2009/2010 FINANCE AND SERVICE STRATEGY REPORT TO PERIOD 8 (15 NOVEMBER 2009)
NEIGHBOURHOOD SERVICES
Previous Year Current Year
20
0.00
0.50
1.00
1.50
2.00
2.50
3.00
3.50
4.00
4.50
Period1
Period2
Period3
Period4
Period5
Period6
Period7
Period8
Period9
Period10
Period11
Period12
Period13
Repairs: End to end time (days).
0.0%
20.0%
40.0%
60.0%
80.0%
100.0%
120.0%
Period1
Period2
Period3
Period4
Period5
Period6
Period7
Period8
Period9
Period10
Period11
Period12
Period13
Gas Safety: Percentage of gas safety checks carried out within 12 months.
Performance has improved from last period and from last year. Although performance has fluctuated throughout the year, the difference between the highest and lowest values represents just 30 minutes.
This performance is considerably better than the same period last year and is probably at a peak.

2009/2010 FINANCE AND SERVICE STRATEGY REPORT TO PERIOD 8 (15 NOVEMBER 2009)
NEIGHBOURHOOD SERVICES
Previous Year Current Year
21
0.0%
20.0%
40.0%
60.0%
80.0%
100.0%
120.0%
Period1
Period2
Period3
Period4
Period5
Period6
Period7
Period8
Period9
Period10
Period11
Period12
Period13
Repairs: Appointments kept.
0.0%
20.0%
40.0%
60.0%
80.0%
100.0%
120.0%
Apr May Jun Jul Aug Sep Oct Nov Dec Jan Feb Mar
Street Lighting: Percentage of repairs completed within 7 days.
The performance in this area remains consistently high and failure to keep appointments can be caused by tenants not being at home. Performance on the same period last year is significantly improved.
Performance has declined slightly in period, but remains within target. Year to date, performance demonstrates improvement over last year. The service has recently been short listed for an award as the most improved street lighting service in the UK.

2009/2010 FINANCE AND SERVICE STRATEGY REPORT TO PERIOD 8 (15 NOVEMBER 2009)
NEIGHBOURHOOD SERVICES
22
SERVICE PERFORMANCE TO DATE CENTRAL MANAGEMENT SUPPORT The variance principally relates to staff turnover, reduced other employee related expenses and anticipated savings on other services. FTE STAFFING ANALYSIS
Budget In year Changes Revised Budget Actual to date 12.0 -5.0 7.0 7.00
LEISURE SERVICES Employee Cost savings reflect vacancies within PPP Schools, Outdoor Amenities and Libraries, partly offset by job evaluation appeals and special payments within Registration and Community Recreation. Additional repairs have been completed within Property Costs. Transport Costs variances are related to additional charges in respect of purchased and leased vehicles and non contract repairs which are partially offset by savings on hires and car mileage allowances. Additional Supplies and Services costs due to the purchase of Outdoor Amenities equipment and materials and additional costs in relation to the Burns Monument Centre have been offset by additional income. Additional Third Party payment costs are due to Homecoming expenditure, project expenditure within Dean Castle Country Park and tree works. Additional income is anticipated from registration fees, Cemeteries, Grounds Maintenance, Street Cleansing and theatre and hall charges partially offset by reduced anticipated income from Leisure facilities in PPP schools and golf income. FTE STAFFING ANALYSIS
Budget In year Changes Revised Budget Actual to date 466.28 0 466.28 427.28
Estimate
£m
Projection to 31 Mar 10
£m
Variance (Favourable)
/ Adverse Employee Costs 0.259 0.221 (0.038) Property Costs 0.000 0.000 0.000 Transport Costs 0.000 0.000 0.000 Supplies & Services 0.395 0.324 (0.071) Third Party Payments 0.330 0.330 0.000 Transfer Payments 0.000 0.000 0.000 Gross Expenditure 0.984 0.875 (0.109) Income (0.095) (0.112) (0.017) Net expenditure 0.889 0.763 (0.126)
Estimate £m
Projection to 31 Mar 10
£m
Variance (Favourable)
/ Adverse Employee Costs 11.849 11.701 (0.148) Property Costs 1.267 1.303 0.036 Transport Costs 1.015 1.113 0.098 Supplies & Services 1.777 1.904 0.127 Third Party Payments 0.390 0.447 0.057 Transfer Payments 0.000 0.000 0.000 Gross Expenditure 16.298 16.468 0.170 Income (4.025) (4.235) (0.210) Net expenditure 12.273 12.233 (0.040)
2009/2010 FINANCE AND SERVICE STRATEGY REPORT TO PERIOD 8 (15 NOVEMBER 2009)
NEIGHBOURHOOD SERVICES
23
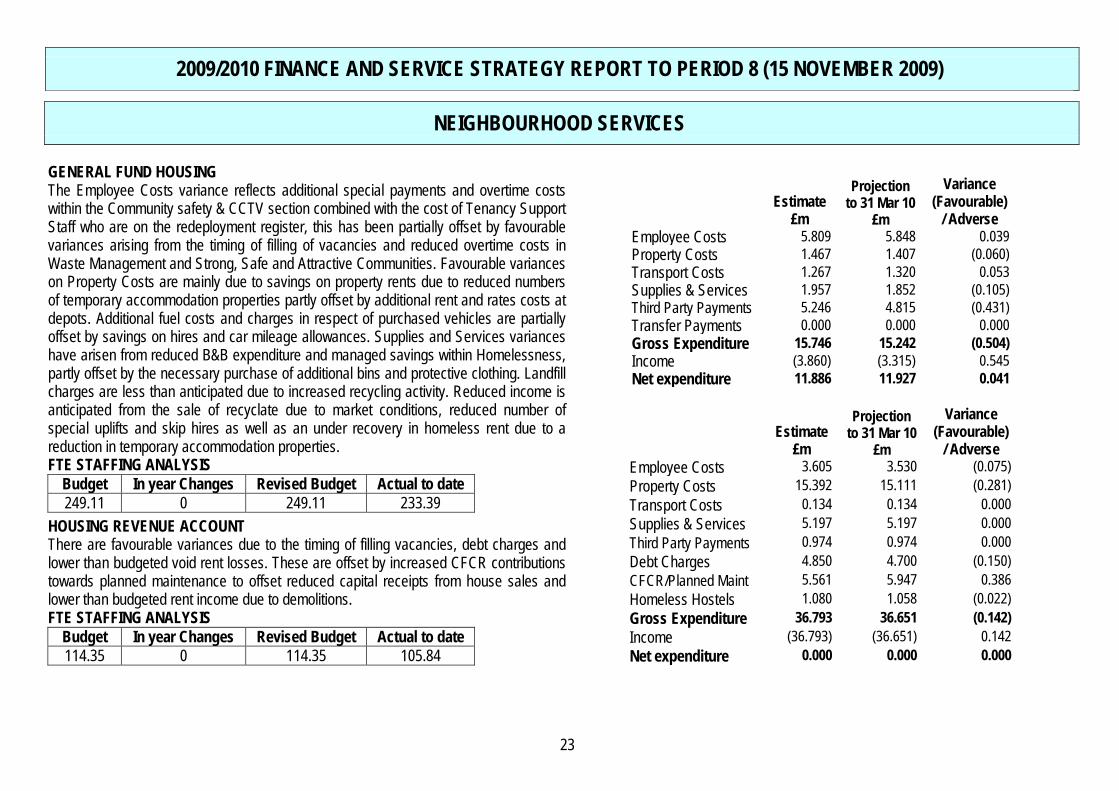
GENERAL FUND HOUSING The Employee Costs variance reflects additional special payments and overtime costs within the Community safety & CCTV section combined with the cost of Tenancy Support Staff who are on the redeployment register, this has been partially offset by favourable variances arising from the timing of filling of vacancies and reduced overtime costs in Waste Management and Strong, Safe and Attractive Communities. Favourable variances on Property Costs are mainly due to savings on property rents due to reduced numbers of temporary accommodation properties partly offset by additional rent and rates costs at depots. Additional fuel costs and charges in respect of purchased vehicles are partially offset by savings on hires and car mileage allowances. Supplies and Services variances have arisen from reduced B&B expenditure and managed savings within Homelessness, partly offset by the necessary purchase of additional bins and protective clothing. Landfill charges are less than anticipated due to increased recycling activity. Reduced income is anticipated from the sale of recyclate due to market conditions, reduced number of special uplifts and skip hires as well as an under recovery in homeless rent due to a reduction in temporary accommodation properties.
FTE STAFFING ANALYSIS Budget In year Changes Revised Budget Actual to date 249.11 0 249.11 233.39
HOUSING REVENUE ACCOUNT There are favourable variances due to the timing of filling vacancies, debt charges and lower than budgeted void rent losses. These are offset by increased CFCR contributions towards planned maintenance to offset reduced capital receipts from house sales and lower than budgeted rent income due to demolitions. FTE STAFFING ANALYSIS
Budget In year Changes Revised Budget Actual to date 114.35 0 114.35 105.84
Estimate £m
Projection to 31 Mar 10
£m
Variance (Favourable)
/ Adverse Employee Costs 3.605 3.530 (0.075) Property Costs 15.392 15.111 (0.281) Transport Costs 0.134 0.134 0.000 Supplies & Services 5.197 5.197 0.000 Third Party Payments 0.974 0.974 0.000 Debt Charges 4.850 4.700 (0.150) CFCR/Planned Maint 5.561 5.947 0.386 Homeless Hostels 1.080 1.058 (0.022) Gross Expenditure 36.793 36.651 (0.142) Income (36.793) (36.651) 0.142 Net expenditure 0.000 0.000 0.000
Estimate
£m
Projection to 31 Mar 10
£m
Variance (Favourable)
/ Adverse Employee Costs 5.809 5.848 0.039 Property Costs 1.467 1.407 (0.060) Transport Costs 1.267 1.320 0.053 Supplies & Services 1.957 1.852 (0.105) Third Party Payments 5.246 4.815 (0.431) Transfer Payments 0.000 0.000 0.000 Gross Expenditure 15.746 15.242 (0.504) Income (3.860) (3.315) 0.545 Net expenditure 11.886 11.927 0.041

2009/2010 FINANCE AND SERVICE STRATEGY REPORT TO PERIOD 8 (15 NOVEMBER 2009)
NEIGHBOURHOOD SERVICES
24
EMERGENCY PLANNING The variance reflects additional training and standby costs and payments to the Ayrshire Civil Contingencies Team. FTE STAFFING ANALYSIS
Budget In year Changes Revised Budget Actual to date 1.0 0 1.0 1.0
JOINT BOARDS – POLICE AND FIRE The Executive Director does not anticipate any material variances at this time.
Estimate
£m
Projection to 31 Mar 10
£m
Variance (Favourable)
/ Adverse Employee Costs 0.037 0.042 0.005 Property Costs 0.000 0.000 0.000 Transport Costs 0.003 0.002 (0.001) Supplies & Services 0.009 0.018 0.009 Third Party Payments 0.000 0.000 0.000 Transfer Payments 0.000 0.000 0.000 Gross Expenditure 0.049 0.062 0.013 Income 0.000 0.000 0.000 Net expenditure 0.049 0.062 0.013
Estimate
£m
Projection to 31 Mar 10
£m
Variance (Favourable)
/ Adverse Employee Costs 0.000 0.000 0.000 Property Costs 0.000 0.000 0.000 Transport Costs 0.000 0.000 0.000 Supplies & Services 0.000 0.000 0.000 Third Party Payments 30.680 30.680 0.000 Transfer Payments 0.000 0.000 0.000 Gross Expenditure 30.680 30.680 0.000 Income 0.000 0.000 0.000 Net expenditure 30.680 30.680 0.000

2009/2010 FINANCE AND SERVICE STRATEGY REPORT TO PERIOD 8 (15 NOVEMBER 2009)
NEIGHBOURHOOD SERVICES
25
ROADS AND TRANSPORTATION There are favourable variances due to the timing of filling vacancies and additional income on rechargeable work. These are offset by additional costs for car park non domestic rates, the purchase of Mass Barriers for bridge protection and contractors fees in relation to a hydro-geological survey for flood management at Newmilns. . FTE STAFFING ANALYSIS
Budget In year Changes Revised Budget Actual to date 193.0 -10.0 183.0 180.0
BUILDING & WORKS Building and Works is anticipated to outturn above budget at 31 March 2010. Income is less than anticipated due to a lower than budgeted workforce and costs are correspondingly lower due to a reduced number of craft operatives, reduced levels of sub contractor work and lower plant and transport costs. Additional costs are anticipated on costs for building repairs. FTE STAFFING ANALYSIS
Budget In year Changes Revised Budget Actual to date 302.0 0 302.0 286.0
General Fund Estimate £m
Projection to 31 Mar 10
£m
Variance (Favourable)
/ Adverse Employee Costs 6.332 6.235 (0.097) Property Costs 0.427 0.458 0.031 Transport Costs 1.500 1.500 0.000 Supplies & Services 3.699 3.728 0.029 Third Party Payments 4.156 4.206 0.050 Transfer Payments 0.000 0.000 0.000 Gross Expenditure 16.114 16.127 0.013 Income (4.992) (5.005) (0.013) Net expenditure 11.122 11.122 0.000
Building & Works Estimate £m
Projection to 31 Mar 10
£m
Variance (Favourable)
/ Adverse Income (21.355) (19.793) 1.562 Labour Costs 9.162 8.457 (0.705) Sub Contractors 4.000 3.125 (0.875) Other Direct Costs 5.424 4.719 (0.705) Overheads 1.237 1.259 0.022 Total Expenditure (1.532) (2.233) (0.701) Pension Accounting 0.192 0.192 0.000 Net expenditure (1.340) (2.041) (0.701) Forecast Transfer GF (0.783) (0.939) (0.156) Forecast Transfer HRA (0.557) (1.102) (0.545)

2009/2010 FINANCE AND SERVICE STRATEGY REPORT TO PERIOD 8 (15 NOVEMBER 2009)
NEIGHBOURHOOD SERVICES
26
PARTNERSHIPS AND PROJECTS
A number of projects are operated and funded from a variety of sources with some funding awarded in one financial year for use in that or subsequent years.
The balance on Leisure Projects relates to schemes including Positive Play, the Talented Athlete Programme, Walking Development and Multi Use Games Areas. These balances will be required to sustain the projects in future years. Additional costs in relation to River Ayr Way will be met from earmarked departmental balances.
Roads and Transport balances relate mainly to the Clyde Local Authority Consortium, A76 Crossroads, the Hopper Bus Service and the Scottish Coal Obligation Funds.
Projected Balances at 31
March 2010 £m
EA Positive Play (0.327) Talented Athlete (0.294) MUGA Streetcages (0.162) Healthy Weight Community (0.051) Walking Development / Sports Council (0.038) Libraries (0.017) DCCP- Outdoor Access / River Irvine / Barskimming 0.150 Museums and Arts (0.036) Scottish Coal (0.077) Hopper Bus (0.069) CLAC (0.090)
Other Roads and Transport Projects (0.022) Total (1.033)

2009/2010 FINANCE AND SERVICE STRATEGY REPORT TO PERIOD 8 (15 NOVEMBER 2009)
NEIGHBOURHOOD SERVICES
27
Service Enhancements 2009/10 Additional funding has been provided for the operation of a number of services experiencing increasing demands and costs including: • Additional waste management services arising from new streets, houses and local
facilities; • Opening of new local facilities; • Maintenance of Floral Clock and Floral Baskets; • Public convenience provision in Kilmarnock seven days per week. Additional funding has also been provided in relation to the introduction of the Fairer Scotland Fund which replaced a number of existing funding streams including the Community Regeneration Fund, the Community Voices Programme, Working for Families, the Social Inclusion element of the Changing Children’s Services Fund, the Financial Inclusion Fund, Workforce Plus and More Choices – More Chances. Strategic Review of the Revenue Budget The Strategic Review of the Revenue Budget resulted in decisions to increase burial charges nearer to the Scottish Average, reductions in the net costs of Waste Disposal and Street Cleansing and a move of funding for roads maintenance to capital to enable a more strategic approach to be implemented. This amounts to net additional savings of £0.450m over the 4 years to 2011/12.

2009/2010 FINANCE AND SERVICE STRATEGY REPORT TO PERIOD 8 (15 NOVEMBER 2009)
CORPORATE SUPPORT
28
SERVICE SUMMARY The projected outturn to 31 March 2010 is a break-even position after the utilisation of £0.400m of departmental balances agreed by Cabinet on 2 December 2009 to fund in year budget pressures including an anticipated shortfall of £0.716m in planning and building standards income as a result of external economic factors. The impact of these factors remains uncertain and the Executive Director of Corporate Support has continued to freeze vacancies within Planning and Economic Development in response to the situation reducing the projected adverse variance by £0.330m. The impact of the economic downturn is anticipated to have a continuing impact into future years and the Executive Director of Corporate Support has initiated a review of options to assist in offsetting this impact. In addition there are a number of significant items particularly within Planning and Economic Development which are multi-annual initiatives and may require any underspend at year end to be earmarked for carry forward to meet future commitments.
Estimate
£m
Projection to 31 Mar 10
£m
Variance (Favourable)
/ Adverse Central Management Support 0.198 0.198 0.000 Human Resources 2.454 2.444 (0.010) Information Technology 3.666 3.666 0.000 Planning & Economic Dev. 4.082 4.141 0.059 Democratic Services 2.866 2.848 (0.018) Legal Procurement & Reg. 2.964 2.933 (0.031) Community Planning P'ship 0.651 0.651 0.000 Net Expenditure 16.881 16.881 0.000
Estimate
£m
Projection to 31 Mar 10
£m
Variance (Favourable)
/ Adverse Employee Costs 14.616 14.002 (0.614) Property Costs 0.199 0.195 (0.004) Transport Costs 0.294 0.312 0.018 Supplies & Services 5.596 5.760 0.164 Third Party Payments 0.867 0.954 0.087 Transfer Payments 0.000 0.000 0.000 Gross Expenditure 21.572 21.223 (0.349) Income (4.691) (4.342) 0.349 Net Expenditure 16.881 16.881 0.000

2009/2010 FINANCE AND SERVICE STRATEGY REPORT TO PERIOD 8 (15 NOVEMBER 2009)
CORPORATE SUPPORT
29
SUMMARY OF MOVEMENTS IN APPROVED BUDGET
Annual
Estimate £m
Budget Adjustments
£m
Revised Budget
£m
Comments on Budget Movement
Budget Allocation Approved by Council 12 February 2009 15.160
Additions / Transfers to / (from) Initial Budget:
1 Fairer Scotland Fund -0.019 Realignment of Budgets to Reflect Allocation of Fairer Scotland Fund
2 Community Planning Budget Realignment -0.192 Realignment of Budgets to Reflect Transfer of Community Planning Staff to Community Learning
3 Departmental Human Resources Budget Realignment +0.909 Realignment of Budgets to Reflect Transfer of Departmental Human Resources Staff to Corporate Support
4 Utilisation of Balances +0.931 Drawdown of Earmarked Balances and use of Departmental Balances
5 Adjustment of income recharges outwith the General Fund / Vehicle Maintenance Budgets -0.007 Realignment of income recharges outwith the General Fund and
charges from the former Trading Services
6 Realignment of IT Budgets +0.054 Transfer of IT budgets relating to operation of WAN in new buildings and Civica host icon
7 Community Health Budget Realignment +0.045 Realignment of Budgets to reflect transfer of Community Health & Wellbeing Officer from Social Work
Total Budget adjustments +1.721
Revised Budget Allocation at Period 8 16.881
2009/2010 FINANCE AND SERVICE STRATEGY REPORT TO PERIOD 8 (15 NOVEMBER 2009)
CORPORATE SUPPORT
Status: Fully met In Progress Unmet
30
EXPENDITURE REDUCTION TARGETS
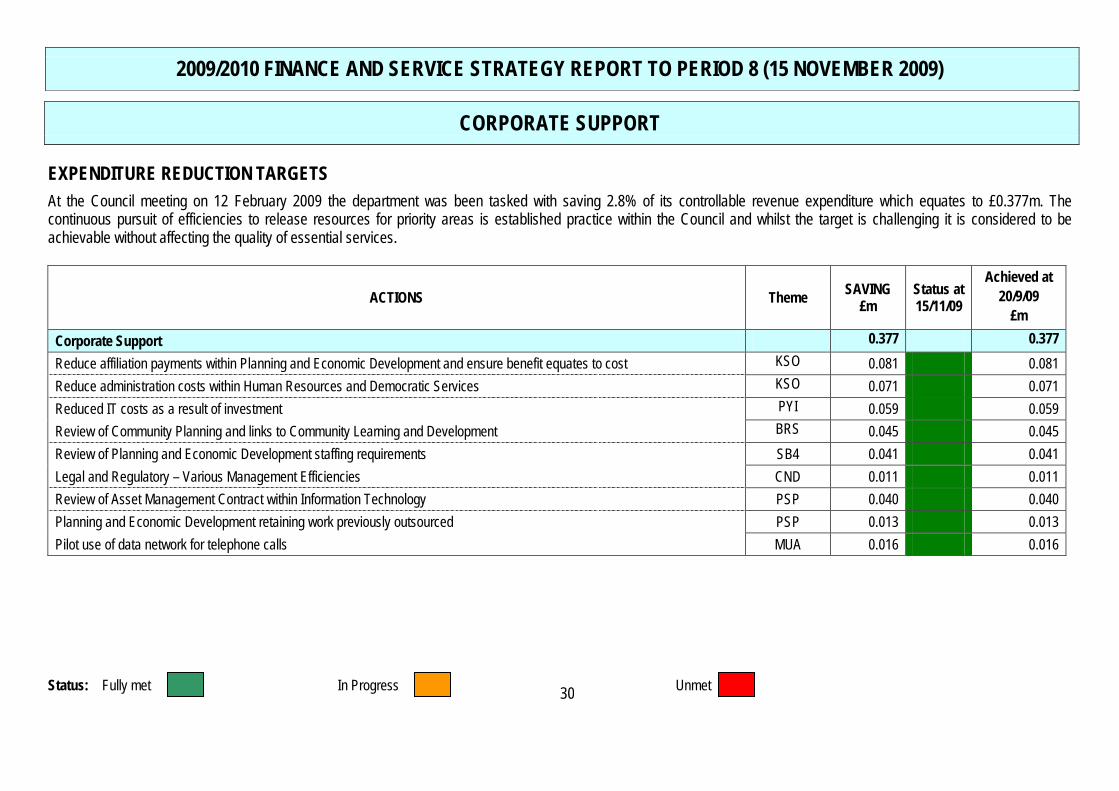
At the Council meeting on 12 February 2009 the department was been tasked with saving 2.8% of its controllable revenue expenditure which equates to £0.377m. The continuous pursuit of efficiencies to release resources for priority areas is established practice within the Council and whilst the target is challenging it is considered to be achievable without affecting the quality of essential services.
ACTIONS Theme SAVING £m
Status at 15/11/09
Achieved at 20/9/09
£m Corporate Support 0.377 0.377 Reduce affiliation payments within Planning and Economic Development and ensure benefit equates to cost KSO 0.081 0.081 Reduce administration costs within Human Resources and Democratic Services KSO 0.071 0.071 Reduced IT costs as a result of investment PYI 0.059 0.059 Review of Community Planning and links to Community Learning and Development BRS 0.045 0.045 Review of Planning and Economic Development staffing requirements SB4 0.041 0.041 Legal and Regulatory – Various Management Efficiencies CND 0.011 0.011 Review of Asset Management Contract within Information Technology PSP 0.040 0.040 Planning and Economic Development retaining work previously outsourced PSP 0.013 0.013 Pilot use of data network for telephone calls MUA 0.016 0.016

2009/2010 FINANCE AND SERVICE STRATEGY REPORT TO PERIOD 8 (15 NOVEMBER 2009)
CORPORATE SUPPORT
Previous Year Current Year
31
0.00%
1.00%
2.00%
3.00%
4.00%
5.00%
6.00%
Apr May Jun Jul Aug Sep Oct Nov Dec Jan Feb Mar
Absence Management: Percentage of working days lost - Corporate Support
0.0%
10.0%
20.0%
30.0%
40.0%
50.0%
60.0%
70.0%
80.0%
Apr May Jun Jul Aug Sep Oct Nov Dec Jan Feb Mar
Trading Standards Complaints: Percentage of consumer complaints completed within 14days.
There was a significant decrease in the rate of absence from 4.32% to 3.62% between September and October. The majority of days lost, (56%), were due to long term absence. The rate of short term absence for the department was 1.57%. The majority of absences were again attributable to colds/flu (22.58% days lost) and to stress/debility (26.19% days lost). There was one new referral to Occupational Health and a further four cases are ongoing. The Department Management Team continues to monitor absence statistics and trends on a regular basis. HR officers are invited to attend these meetings on a regular basis to provide updates. The Corporate Managing Absence Group has been looking at a number of areas, including drilling down into the reasons for absence and examining short term persistent absence. Everyone should now have a copy of the new managing absence guidelines and a new toolbox talk DVD has been released and is being rolled out to all staff.
This month's improvement in performance can be attributed to the section maintaining a full complement of staff over this period (absence/annual leave minimal). Complaints will continue to be reviewed with a view to identifying timeous and effective resolution. This will include discussion of the more detailed complaints being raised and discussed at team meetings.

2009/2010 FINANCE AND SERVICE STRATEGY REPORT TO PERIOD 8 (15 NOVEMBER 2009)
CORPORATE SUPPORT
Previous Year Current Year
32
0.0%
10.0%
20.0%
30.0%
40.0%
50.0%
60.0%
70.0%
80.0%
90.0%
Apr May Jun Jul Aug Sep Oct Nov Dec Jan Feb Mar
Planning Applications: Percentage of householder planning applications determined withintwo months.
0.0%
10.0%
20.0%
30.0%
40.0%
50.0%
60.0%
Apr May Jun Jul Aug Sep Oct Nov Dec Jan Feb Mar
Planning Applications: Percentage of non-householder planning applications determinedwithin two months.
Performance is improved over the last month although it is recognised that month on month figures are less significant than longer term trends. Adoption and implementation of new legislative measures (Planning Act 2006 and new Development Management Regulations) contributed to the previous decline in performance output. Section meeting held to consider both the more difficult operating climate going forward and the possible range of measures (no ideas out of bounds for consideration) which could be introduced as part of a radical reappraisal of the section's business processes. These identified measures will be discussed with the Head of Service on 19 November 2009.
Performance is improved over the last month although it is recognised that month on month figures are less significant than longer term trends. Adoption and implementation of new legislative measures (Planning Act 2006 and new Development Management Regulations) contributed to the previous decline in performance output. Section meeting held to consider both the more difficult operating climate going forward and the possible range of measures (no ideas out of bounds for consideration) which could be introduced as part of a radical reappraisal of the section's business processes. These measures were discussed with the Head of Service on 19 November 2009.

2009/2010 FINANCE AND SERVICE STRATEGY REPORT TO PERIOD 8 (15 NOVEMBER 2009)
CORPORATE SUPPORT
Previous Year Current Year
33
£-
£500,000
£1,000,000
£1,500,000
£2,000,000
£2,500,000
£3,000,000
Apr May Jun Jul Aug Sep Oct Nov Dec Jan Feb Mar
Procurement: Monthly spend via PECOS.
0.0
0.1
0.2
0.3
0.4
0.5
0.6
0.7
0.8
0.9
1.0
Apr May Jun Jul Aug Sep Oct Nov Dec Jan Feb
Domestic Noise Complaints: Average time (hours) between complaint and site visit(Antisocial Behaviour Act)
The number of complaints requiring a site visit under Part V of the Antisocial Behaviour Act was 48 in the month of October, this is comparable to the 49 complaints requiring a site visit in September, although is significantly higher than the same month last year, when only 28 visits were required. However, the average time taken between the time of the complaint and attendance on site decreased to 0.6 hours (36 minutes). No improvement action is proposed at this time as the average time taken to respond to complaints is still within target.
The 15,500th order was placed through PECOS in the month of October (including change orders). As at 31 October, within this financial year 2009/10, there was a recorded throughput of £7.73 million. Key Rollout Updates: - development of Integration Harness with CIVICA ongoing (testing & procedures being finalised) - PECOS CIVICA Integration scheduled for December 2009 (PECOS Version 11.0 upgrade during November) - Training scheduled during November for On Site Services and Social Work

2009/2010 FINANCE AND SERVICE STRATEGY REPORT TO PERIOD 8 (15 NOVEMBER 2009)
CORPORATE SUPPORT
34
SERVICE PERFORMANCE TO DATE CENTRAL MANAGEMENT SUPPORT There are no material variances to report at this time. FTE STAFFING ANALYSIS FTE STAFFING ANALYSIS
Budget In year Changes Revised Budget Actual to date 3.0 0 3.0 3.0
HUMAN RESOURCES
The recent amalgamation of the Human Resources function within Corporate Support has resulted in the favourable variance shown due to the timing of filling vacancies pending a recent Best Value Service Review. The adverse Supplies and Services variance is as a result of subscriptions, promotion and training associated with Equality and Diversity and general office related expenses. Consultancy expenses in relation to the Health & Safety and Physiotherapy have resulted in an adverse variance within Third Party Payments. An under recovery on anticipated income from the National Training Programmes is partly offset by additional sponsorship income and physiotherapy and training fees.
FTE STAFFING ANALYSIS FTE STAFFING ANALYSIS Budget In year Changes Revised Budget Actual to date
36.0 +39.2 75.2 65.6
Estimate
£m
Projection to 31 Mar 10
£m
Variance (Favourable)
/ Adverse Employee Costs 0.178 0.177 (0.001) Property Costs 0.000 0.000 0.000 Transport Costs 0.000 0.000 0.000 Supplies & Services 0.020 0.021 0.001 Third Party Payments 0.000 0.000 0.000 Transfer Payments 0.000 0.000 0.000 Gross Expenditure 0.198 0.198 0.000 Income 0.000 0.000 0.000 Net Expenditure 0.198 0.198 0.000
Estimate
£m
Projection to 31 Mar 10
£m
Variance (Favourable)
/ Adverse Employee Costs 2.539 2.413 (0.126) Property Costs 0.009 0.010 0.001 Transport Costs 0.019 0.020 0.001 Supplies & Services 0.216 0.257 0.041 Third Party Payments 0.049 0.102 0.053 Transfer Payments 0.000 0.000 0.000 Gross Expenditure 2.832 2.802 (0.030) Income (0.377) (0.357) 0.020 Net Expenditure 2.454 2.444 (0.010)

2009/2010 FINANCE AND SERVICE STRATEGY REPORT TO PERIOD 8 (15 NOVEMBER 2009)
CORPORATE SUPPORT
35
INFORMATION TECHNOLOGY The favourable variance in Employee Costs has resulted from reduced overtime levels. This has been offset by an adverse variance in Supplies and Services arising from the repair of the fibre connection between London Road and the Civic Centre South.
FTE STAFFING ANALYSIS FTE STAFFING ANALYSIS Budget In year Changes Revised Budget Actual to date
58 +0.5 58.5 54.2
Estimate
£m
Projection to 31 Mar 10
£m
Variance (Favourable)
/ Adverse Employee Costs 2.253 2.228 (0.025) Property Costs 0.000 0.000 0.000 Transport Costs 0.026 0.026 0.000 Supplies & Services 1.824 1.849 0.025 Third Party Payments 0.000 0.000 0.000 Transfer Payments 0.000 0.000 0.000 Gross Expenditure 4.103 4.103 0.000 Income (0.437) (0.437) 0.000 Net Expenditure 3.666 3.666 0.000

2009/2010 FINANCE AND SERVICE STRATEGY REPORT TO PERIOD 8 (15 NOVEMBER 2009)
CORPORATE SUPPORT
36
PLANNING AND ECONOMIC DEVELOPMENT Management action was taken during 2008/09 to delay filling vacancies following the decline in planning and building standards income and vacancies continue to be frozen. Retirals agreed at Cabinet on 4 November 2009 have an in year cost of £0.094m. The variance on Supplies and Services is due to E-Planning maintenance costs, statutory advertising and legal and professional fees. The impact of the statutory neighbourhood notification will increase stationery and postage costs and this is being managed within existing resources. Within Third Party Payments expenditure on statutory dangerous buildings has increased significantly and current projections are in excess of £0.160m with the potential to recover income from owners.
Income from Building Warrants and Planning Fees are expected to be significantly lower than budget due to external economic factors. Planning and Building Standards income continues to be impacted by the economic downturn with the timing and scale of future fees remaining uncertain. Projected income for 2009/10 is currently based on the 2008/09 out-turn position and continues to be monitored. It should be noted that actual 2009/10 income to date is 4% less than in the same period during 2008/09. The current position is after the utilisation of £0.400m of departmental balances previously approved by Cabinet on 2 December 2009 to fund in year budget pressures.
Income projections include £1.140m of EU income made up of £0.486m due for 2008/09 and £0.654m for 2009/10. External factors have delayed the submission of claims, however, a first tranche of funds was received during October with claims continuing to be submitted.
The Executive Director has tasked the Head of Planning and Economic Development with identifying solutions to further reduce the projected adverse variance in income for 2010/11 with an overall objective to bring the budget back on line.
FTE STAFFING ANALYSIS Budget In year Changes Revised Budget Actual to date 125.5 0 125.5 111.5
Estimate
£m
Projection to 31 Mar 10
£m
Variance (Favourable)
/ Adverse Employee Costs 4.569 4.239 (0.330) Premises Costs 0.135 0.135 0.000 Transport Costs 0.128 0.128 0.000 Supplies & Services 1.483 1.537 0.054 Third Party Payments 0.532 0.566 0.034 Transfer Payments 0.000 0.000 0.000 Gross Expenditure 6.847 6.605 (0.242) Income (2.765) (2.464) 0.301 Net Expenditure 4.082 4.141 0.059

2009/2010 FINANCE AND SERVICE STRATEGY REPORT TO PERIOD 8 (15 NOVEMBER 2009)
CORPORATE SUPPORT
37
DEMOCRATIC SERVICES A favourable variance in Employee Costs due to the timing of filling of vacancies is anticipated to be offset by the purchase of a replacement courier van and reduced income relating to sponsorship, property certificates and printroom recharges. FTE STAFFING ANALYSIS
Budget In year Changes Revised Budget Actual to date 47.8 -1.0 46.8 42.6
LEGAL, PROCUREMENT AND REGULATORY The delay in filling vacancies following the implementation of the Best Value Service Review across the service in addition to funding for Tobacco Test Purchasing has generated a favourable Employee Costs variance. Additional costs have been incurred in respect of car mileage and leasing costs. The Supplies and Services variance relates to costs associated with bad debt provision, Scotland Excel fees, legal and professional fees, licence and software commitments associated with the Licensing Board and general office administration. A shortfall in income for Pest Destruction of £0.016m is offset against higher income from Legal Fees, Verification and Petroleum fees and Enforcement Fines. Licensing Board income continues to be higher this year and offsets all costs associated with the Board, including Northgate system upgrades. FTE STAFFING ANALYSIS Budget In year
Revised Budget Actual to date
90.5 -2.0 88.5 85.3
Estimate
£m
Projection to 31 Mar 10
£m
Variance (Favourable)
/ Adverse Employee Costs 1.540 1.477 (0.063) Property Costs 0.000 0.000 0.000 Transport Costs 0.030 0.045 0.015 Supplies & Services 1.479 1.479 0.000 Third Party Payments 0.009 0.009 0.000 Transfer Payments 0.000 0.000 0.000 Gross Expenditure 3.058 3.010 (0.048) Income (0.192) (0.162) 0.030 Net Expenditure 2.866 2.848 (0.018)
Estimate
£m
Projection to 31 Mar 10
£m
Variance (Favourable)
/ Adverse Employee Costs 3.039 2.983 (0.056) Property Costs 0.029 0.029 0.000 Transport Costs 0.088 0.090 0.002 Supplies & Services 0.536 0.561 0.025 Third Party Payments 0.182 0.182 0.000 Transfer Payments 0.000 0.000 0.000 Gross Expenditure 3.874 3.845 (0.029) Income (0.909) (0.911) (0.002) Net Expenditure 2.965 2.934 (0.031)

2009/2010 FINANCE AND SERVICE STRATEGY REPORT TO PERIOD 8 (15 NOVEMBER 2009)
CORPORATE SUPPORT
38
COMMUNITY PLANNING AND PARTNERSHIP At this time no variance is anticipated. Income generated through support provided to the Community Planning Partnership in carrying out its function in administering/monitoring the Fairer Scotland fund will this year be transferred to the Community Planning Development Fund for utilisation across a variety of Community Planning events. FTE STAFFING ANALYSIS
Budget In year Changes Revised Budget Actual to date 10.5 1 11.5 11.1
Estimate
£m
Projection to 31 Mar 10
£m
Variance (Favourable)
/ Adverse Employee Costs 0.498 0.485 (0.013) Property Costs 0.026 0.021 (0.005) Transport Costs 0.003 0.003 0.000 Supplies & Services 0.039 0.057 0.018 Third Party Payments 0.095 0.095 0.000 Transfer Payments 0.000 0.000 0.000 Gross Expenditure 0.661 0.661 0.000 Income (0.010) (0.010) 0.000 Net Expenditure 0.651 0.651 0.000

2009/2010 FINANCE AND SERVICE STRATEGY REPORT TO PERIOD 8 (15 NOVEMBER 2009)
CORPORATE SUPPORT
39
PARTNERSHIPS AND PROJECTS A number of projects are operated and funded from a variety of sources with some funding awarded in one financial year for use in that or subsequent years.
The Environmental balance principally relates to costs incurred at the Tardoes Open Cast Coal Site which are anticipated to be recovered.
The Employability balance relates to East Ayrshire Woodlands and the deficit is anticipated to be offset by income received by 31 March 2010.
The Wind Farm balance is held for work related to the Whitelee Access Action Plan.
Developer’s Contributions balances are held for leisure and recreation facilities throughout the area in line with the requirements set out in the Local Plan.
The Other balance is principally made up of Cabinet approved funding spent on town centre activities including Christmas events, money held for the Moorfield Entrance Junction which is required to be held during the project retention period and funding committed to the 4 Towns Enquiry by Design project.
Balances at
20 September 2009 £m
Environmental / Community / Heritage 0.097 Employability 0.112 Wind Farm (0.243) Developers Contributions / S75 SLR (0.932) Other (0.154) Total (1.120)
2009/2010 FINANCE AND SERVICE STRATEGY REPORT TO PERIOD 8 (15 NOVEMBER 2009)
CORPORATE SUPPORT
40
Service Enhancements 2009/10
Additional funding has been provided for the operation of a number of services experiencing increasing demands and costs including: • Responsibilities in relation to Abandoned Vehicles and Funerals; • Pest Destruction costs; • Reduced Property Enquiry Certificate income. Additional funding has also been provided in relation to the introduction of the Fairer Scotland Fund which replaced a number of existing funding streams including the Community Regeneration Fund, the Community Voices Programme, Working for Families, the Social Inclusion element of the Changing Children’s Services Fund, the Financial Inclusion Fund, Workforce Plus and More Choices – More Chances. Additional funding has also been provided following the introduction of new Tobacco Sales Enforcement legislation. Strategic Review of the Revenue Budget The Strategic Review of the Revenue Budget resulted in decisions to redirect resources away from support functions to frontline services with proportionate expenditure reductions across Corporate Support. This amounts to additional savings of £0.292m to 2011/12.

2009/2010 FINANCE AND SERVICE STRATEGY REPORT TO PERIOD 8 (15 NOVEMBER 2009)
FINANCE AND ASSET MANAGEMENT
41
SERVICE SUMMARY
There is a favourable variance of £0.124m projected for the current financial year as a result of savings anticipated within Corporate Office Accommodation and the Finance Service after offsetting for pressures experienced within Asset Management, Asset Improvement and Surplus Property. The variance within Finance is attributed to Employee Costs due to vacancies which are being held pending a business review and additional income from the Department for Work and Pensions (DWP) being allocated to meet anticipated additional administrative costs from increased benefit caseloads in the current economic climate. The service anticipates that savings can be achieved by meeting increased caseload requirements within current resources. Additional income is also expected as a result of higher water bill collection. Within the Asset Improvement Service additional consultancy services have been procured to enable the progression of work required to advance the Council’s capital programme, ordinarily supported by fee income recovery. However changes in the required level of support as well as the timing of fee recovery on some project areas results in the current adverse position. Within the Asset Management Service some savings are anticipated in relation to employee costs, the service anticipates an under-recovery of property related income during the year as a result of the current economic climate. Property rental income, rechargeable service costs, fees from house deed plans and income from the sale of surplus assets are all anticipated to be lower than budgeted. The service has alleviated much of this pressure by earmarking balances at the end of the previous financial year to assist with the anticipated shortfall.
Estimate
£m
Projection to 31 Mar 10
£m
Variance (Favourable)
/ Adverse Finance 3.876 3.469 (0.407) Asset Improvement 3.671 4.016 0.345 Asset Management 1.624 1.562 (0.062) Net Expenditure 9.171 9.047 (0.124)
Estimate
£m
Projection to 31 Mar 10
£m
Variance (Favourable)
/ Adverse Employee Costs 9.600 9.333 (0.267) Property Costs 5.393 5.337 (0.056) Transport Costs 0.125 0.113 (0.012) Supplies & Services 1.503 1.283 (0.220) Third Party Payments 0.033 0.408 0.375 HB/CT Benefit 0.000 0.000 0.000 Gross Expenditure 16.654 16.474 (0.180) Income (7.483) (7.427) 0.056 Net Expenditure 9.171 9.047 (0.124)

2009/2010 FINANCE AND SERVICE STRATEGY REPORT TO PERIOD 8 (15 NOVEMBER 2009)
FINANCE AND ASSET MANAGEMENT
42
SUMMARY OF MOVEMENTS IN APPROVED BUDGET Annual
Estimate £m
Budget Adjustments
£m
Revised Budget
£m
Comments on Budget Movement
Budget Allocation Approved by Council 12 February 2009 9.024
Additions / Transfers to / (from) Initial Budget:
1 Adjustment of income recharges outwith the General Fund Budget +0.137 Realignment of income recharges outwith the General Fund
2 Realignment of Property Budgets -0.040 Transfer of property budgets relating to bus stations to Neighbourhood Services
3 IT budget realignment -0.020 Transfer of IT budgets relating to Civica host icon
4 Utilisation of Balances +0.070 Drawdown of earmarked balances
Total Budget adjustments +0.146
Revised Budget Allocation at Period 8 9.171

2009/2010 FINANCE AND SERVICE STRATEGY REPORT TO PERIOD 8 (15 NOVEMBER 2009)
FINANCE AND ASSET MANAGEMENT
Status: Fully met In Progress Unmet
43
EXPENDITURE REDUCTION TARGETS At the Council meeting on 12 February 2009 the department has been tasked with saving 2.8% of its controllable revenue expenditure which equates to £0.252m. The continuous pursuit of efficiencies to release resources for priority areas is established practice within the Council and whilst the target is challenging it is considered to be achievable without affecting the quality of essential services. Although specific actions have yet to be completed, offsetting savings have been achieved.
ACTIONS Theme SAVING £m
Status at 15/11/09
Achieved at 15/11/09
£m Finance and Asset Management 0.252 0.187 Reduce the environmental improvement budget within Finance and Asset management KSO 0.040 0.040 Reduced reliance on external consultants on capital projects PYI 0.088 - Reduced maintenance costs due to new facilities being opened PYI 0.023 0.023 Review of service arrangements and staffing numbers within Finance and Asset management BRS 0.065 - Finance – Tools and Equipment CND 0.006 0.006 Review of Financial Guardianship arrangements PSP 0.020 0.020 Renunciation of leases for industrial units MUA 0.010 0.010

2009/2010 FINANCE AND SERVICE STRATEGY REPORT TO PERIOD 8 (15 NOVEMBER 2009)
FINANCE AND ASSET MANAGEMENT
Previous Year Current Year
44
PERFORMANCE MEASURES
0.0
5.0
10.0
15.0
20.0
25.0
Apr May Jun Jul Aug Sep Oct Nov Dec Jan Feb Mar
Benefit Administration: Average time taken to process new claims and change events.
0.0
2.0
4.0
6.0
8.0
10.0
12.0
14.0
16.0
18.0
Apr May Jun Jul Aug Sep Oct Nov Dec Jan Feb Mar
Benefit Administration: Average time to process change events.
There was a change to benefit legislation this month which needed a recalculation of certain types of claim for this to take effect. As this is a system automated process this had the effect of showing more changes processed within the month but all done within a day. This is not a usual occurrence and it is expected that this figure will increase next period back to a normal operating level of around 13 days.
There was a change to benefit legislation this month which needed a recalculation of certain types of claim for this to take effect. As this is a system automated process this had the effect of showing more changes processed within the month but all done within a day. This is not a usual occurrence and it is expected that this figure will increase next period back to a normal operating level of around 10 days..

2009/2010 FINANCE AND SERVICE STRATEGY REPORT TO PERIOD 8 (15 NOVEMBER 2009)
FINANCE AND ASSET MANAGEMENT
Previous Year Current Year
45
0.0
5.0
10.0
15.0
20.0
25.0
30.0
35.0
Apr May Jun Jul Aug Sep Oct Nov Dec Jan Feb Mar
Benefit Administration: Average time to process new benefit claims.
0.0%
10.0%
20.0%
30.0%
40.0%
50.0%
60.0%
70.0%
80.0%
90.0%
100.0%
Period1
Period2
Period3
Period4
Period5
Period6
Period7
Period8
Period9
Period10
Period11
Period12
Period13
Council Tax: Percentage of Council Tax received.
There was a small increase in the number of claims received in the month. Coupled with the level of staff absence due to sick leave the time to process has increased slightly but the level is still within a normal range.
The way of prioritising incoming work has been amended and it is hoped that this will have the effect of improving processing times. The changes have just been implemented and it is expected that it will take a few months to show if the changes have been successful.
Experian Citizenview and Investigator Software are being used to obtain information to pursue outstanding debt. This information is used to ascertain the best form of diligence applicable for each case. For example it may provide us with a forwarding address or telephone number to allow us to contact the customer, or in high value debt cases it may provide us with an overall picture of their financial situation/ability to pay.

2009/2010 FINANCE AND SERVICE STRATEGY REPORT TO PERIOD 8 (15 NOVEMBER 2009)
FINANCE AND ASSET MANAGEMENT
Previous Year Current Year
46
0.0%
20.0%
40.0%
60.0%
80.0%
100.0%
120.0%
Period1
Period2
Period3
Period4
Period5
Period6
Period7
Period8
Period9
Period10
Period11
Period12
Period13
Invoices: Percentage paid within 30 calendar days of receipt.
During the period, positive improvement in the overall processing times was noted for all Services, with the exception of those which, due to the low volume of in period transactions where already returning a 100% compliance.
The initial stage of the shared services diagnostic exercise has now been completed with the next stage - process re-engineering workshops scheduled for mid December. Whilst these are expected to deliver overall reductions in end to end processing once they are in place close liaison will continue with Departments to ensure overall performance is maintained.

2009/2010 FINANCE AND SERVICE STRATEGY REPORT TO PERIOD 8 (15 NOVEMBER 2009)
FINANCE AND ASSET MANAGEMENT
47
SERVICE PERFORMANCE TO DATE FINANCE SERVICE A variance of £0.407m is anticipated to 31 March 2010 within Finance primarily as a result of additional funding receivable from the Department for Work and Pensions and savings achieved on Employee Costs. This additional funding is being allocated to meet anticipated additional administrative costs from increased benefit caseloads in the current economic climate. The service anticipates that savings can be achieved by meeting increased caseload requirements within current resources. Additional income is also expected as a result of Scottish Water collection rates. FTE STAFFING ANALYSIS
Budget In year Changes Revised Budget Actual to date 185.9 -1.0 184.9 171.75
Estimate
£m
Projection to 31 Mar 10
£m
Variance (Favourable)
/ Adverse Employee Costs 5.757 5.609 (0.148) Property Costs 0.018 0.008 (0.010) Transport Costs 0.027 0.020 (0.007) Supplies & Services 0.752 0.720 (0.032) Third Party Payments 0.000 0.000 0.000 HB/CT Benefit 0.000 0.000 0.000 Gross Expenditure 6.554 6.357 (0.197) Income (2.678) (2.888) (0.210) Net Expenditure 3.876 3.469 (0.407)

2009/2010 FINANCE AND SERVICE STRATEGY REPORT TO PERIOD 8 (15 NOVEMBER 2009)
FINANCE AND ASSET MANAGEMENT
48
ASSET IMPROVEMENT The Asset Improvement Service is currently projecting an adverse position of £0.345m. This is primarily a result of external consultant costs required in order to progress the capital programme, ordinarily supported by fee income recovery. However changes in levels of required service support as well as the timing of fee recovery on some project areas results in the current adverse position. As in previous years pressure is being experienced within property maintenance budgets however the service anticipates an online position at the current time.
FTE STAFFING ANALYSIS Budget In year Changes Revised Budget Actual to date
81.0 0 81.0 77.0
ASSET MANAGEMENT Within the Asset Management Service, a favourable variance is currently projected of £0.062m. This is primarily the result of resources added to the Corporate Office Accommodation budget in preparation for enabling town centre properties to be leased. While some savings are also anticipated in relation to employee costs and premises costs, the service anticipates an under-recovery of property related income during the year as a result of the current economic climate. Property rental income, rechargeable service costs, fees from house deed plans and receipts from the disposal of surplus properties are all anticipated to be lower than budgeted. FTE STAFFING ANALYSIS
Budget In year Changes Revised Budget Actual to date 26.0 0 26.0 22.9
Estimate
£m
Projection to 31 Mar 10
£m
Variance (Favourable)
/ Adverse Employee Costs 2.907 2.842 (0.065) Property Costs 3.985 3.985 0.000 Transport Costs 0.078 0.073 (0.005) Supplies & Services 0.101 0.101 0.000 Third Party Payments 0.000 0.375 0.375 Transfer Payments 0.000 0.000 0.000 Gross Expenditure 7.071 7.376 0.305 Income (3.400) (3.360) 0.040 Net Expenditure 3.671 4.016 0.345
Estimate
£m
Projection to 31 Mar 10
£m
Variance (Favourable)
/ Adverse Employee Costs 0.936 0.882 (0.054) Property Costs 1.390 1.344 (0.046) Transport Costs 0.020 0.020 0.000 Supplies & Services 0.650 0.462 (0.189) Third Party Payments 0.033 0.033 0.000 Transfer Payments 0.000 0.000 0.000 Gross Expenditure 3.029 2.741 (0.288) Income (1.405) (1.179) 0.226 Net Expenditure 1.624 1.562 (0.062)

2009/2010 FINANCE AND SERVICE STRATEGY REPORT TO PERIOD 8 (15 NOVEMBER 2009)
FINANCE AND ASSET MANAGEMENT
49
Service Enhancements 2009/10 Additional funding has been provided for the maintenance of public buildings. Strategic Review of the Revenue Budget The Strategic Review of the Revenue Budget resulted in decisions to redirect resources away from support functions to frontline services with proportionate expenditure reductions across Corporate Support and Finance and Asset Management. This amounts to additional savings of £0.295m to 2011/12.

2009/2010 FINANCE AND SERVICE STRATEGY REPORT TO PERIOD 8 (15 NOVEMBER 2009)
CENTRAL SERVICES
50
SERVICE SUMMARY Miscellaneous Services is anticipated to outturn £0.470m under budget as a result of unutilised contingency resources partially offset by additional expenditure in respect of legal costs for equal pay claims. The variance within Chief Executives is a result of employee cost savings within the Internal Audit Service.
Estimate
£m
Projection to 31 Mar 10
£m
Variance (Favourable)
/ Adverse Chief Executive 0.530 0.507 (0.023) Miscellaneous 5.274 4.804 (0.470) Insurance 2.254 2.254 0.000 Net Expenditure 8.058 7.565 (0.493)
Estimate
£m
Projection to 31 Mar 10
£m
Variance (Favourable)
/ Adverse Employee Costs 2.422 2.430 0.008 Property Costs 0.000 0.000 0.000 Transport Costs 0.006 0.005 (0.001) Supplies & Services 5.807 5.307 (0.500) Third Party Payments 0.725 0.725 0.000 HB/CT Benefit 0.000 0.000 0.000 Gross Expenditure 8.960 8.467 (0.493) Income (0.902) (0.902) 0.000 Net Expenditure 8.058 7.565 (0.493)

2009/2010 FINANCE AND SERVICE STRATEGY REPORT TO PERIOD 8 (15 NOVEMBER 2009)
CENTRAL SERVICES
Previous Year Current Year
51
PERFORMANCE MEASURES
0.00%
1.00%
2.00%
3.00%
4.00%
5.00%
6.00%
7.00%
8.00%
Apr May Jun Jul Aug Sep Oct Nov Dec Jan Feb Mar
Absence Management: Percentage of working days lost - Chief Executive's Office
Absence increased to its highest level since July, increasing from 2.56% in September to 3.7% in October. The majority of days lost were due to short term absence with 63 % of all days lost the result of short term absences. The rate of short term absence for the department was 2.35%. There were two new referrals to Occupational Health and a further three cases are currently ongoing. Absence Management Procedures continue to be rigorously observed. The Corporate Managing Absence Group has been looking at a number of areas, including drilling down into the reasons for absence and examining short term persistent absence. Everyone should now have a copy of the new managing absence guidelines and a new toolbox talk DVD has been released and is being rolled out to all staff.

2009/2010 FINANCE AND SERVICE STRATEGY REPORT TO PERIOD 8 (15 NOVEMBER 2009)
CENTRAL SERVICES
52
SERVICE PERFORMANCE TO DATE CHIEF EXECUTIVE The favourable variance is due to a vacancy within the Internal Audit service. FTE STAFFING ANALYSIS
Budget In year Changes Revised Budget Actual to date 10.61 0 10.61 10.0
MISCELLANEOUS SERVICES
A favourable variance of £0.470m is anticipated due to unutilised contingency resources which is partially offset by legal costs in respect of equal pay claims.
Estimate
£m
Projection to 31 Mar 10
£m
Variance (Favourable)
/ Adverse Employee Costs 0.566 0.544 (0.022) Property Costs 0.000 0.000 0.000 Transport Costs 0.006 0.005 (0.001) Supplies & Services 0.017 0.017 0.000 Third Party Payments 0.000 0.000 0.000 Gross Expenditure 0.589 0.566 (0.023) Income (0.059) (0.059) 0.000 Net Expenditure 0.530 0.507 (0.023)
Estimate
£m
Projection to 31 Mar 10
£m
Variance (Favourable)
/ Adverse Employee Costs 1.856 1.886 0.030 Property Costs 0.000 0.000 0.000 Transport Costs 0.000 0.000 0.000 Supplies & Services 3.536 3.036 (0.500) Third Party Payments 0.725 0.725 0.000 Transfer Payments 0.000 0.000 0.000 Gross Expenditure 6.117 5.647 (0.470) Income (0.843) (0.843) 0.000 Net Expenditure 5.274 4.804 (0.470)

2009/2010 FINANCE AND SERVICE STRATEGY REPORT TO PERIOD 8 (15 NOVEMBER 2009)
CENTRAL SERVICES
53
INSURANCE There are no material variances to report at this time.
Estimate
£m
Projection to 31 Mar 10
£m
Variance (Favourable)
/ Adverse Employee Costs 0.000 0.000 0.000 Property Costs 0.000 0.000 0.000 Transport Costs 0.000 0.000 0.000 Supplies & Services 2.254 2.254 0.000 Third Party Payments 0.000 0.000 0.000 Transfer Payments 0.000 0.000 0.000 Gross Expenditure 2.254 2.254 0.000 Income 0.000 0.000 0.000 Net Expenditure 2.254 2.254 0.000
2009/2010 FINANCE AND SERVICE STRATEGY REPORT TO PERIOD 8 (15 NOVEMBER 2009)
EDUCATIONAL AND SOCIAL SERVICES
54
Capital Programme Expenditure to date is £2.802m, which represents 39.5% of the available budget. The Projected Expenditure for 2009/10 is £6.250m. The projected underspend on the Education and Social Services capital programme primarily relates to a number of schemes which are anticipated to be less than originally budgeted or are forecast to slip into future financial years. The underspend is partially offset by a number of schemes including the Galston Primary, Netherthird Community Campus and Stewarton Townhouse projects are anticipated to be higher than the available budgets.

2009/2010 FINANCE AND SERVICE STRATEGY REPORT TO PERIOD 8 (15 NOVEMBER 2009)
EDUCATIONAL AND SOCIAL SERVICES
55
Major Projects
Galston Community / Office Facilities
Financial Status As agreed by Cabinet on 18 November 2009 the budget allocations from Galston Community Facilities, Galston Local Office and Town Centre projects have been consolidated to form above budget.
Budget Allocation
£m
Expenditure to Date
£m
Forecast Expenditure
£m
4.335 0.000 4.130
Development Design Tender Construction TBC TBC TBC TBC
Expected Progress Actual Progress
Project Life Cycle Cabinet on 18 November 2009 approved proposals to refurbish existing community facilities and office accommodation and construct new office space in Galston Town Centre.
Darvel Primary School and Nursery School
Financial Status Budget revised following Cabinet decision of 6 May 2009.
Budget Allocation
£m
Expenditure to Date
£m
Forecast Expenditure
£m
5.000 0.000 5.000
Development Design Tender Construction Start
15-05-09 Finish
03-09-09 Start
04-09-09 Finish
02-03-10 Start
03-03-10 Finish
04-05-10 Start Finish
05-05-10 19-05-10 Expected Progress Actual Progress 80%
Project Life Cycle Following a series of detailed discussion a draft design which meets the minimum requirement of the Executive Director of Educational and Social Services has been agreed. The indicative cost is £5.5m. It is proposed to go to tender on this basis given that current market conditions may result in the final price being closer to budget.

2009/2010 FINANCE AND SERVICE STRATEGY REPORT TO PERIOD 8 (15 NOVEMBER 2009)
EDUCATIONAL AND SOCIAL SERVICES
56
Flowerbank Nursery
Financial Status No expenditure is anticipated to be incurred in 2009/10
Budget Allocation
£m
Expenditure to Date
£m
Forecast Expenditure
£m
1.750 0.000 1.750
Development Design Tender Construction TBC TBC TBC TBC
Expected Progress Actual Progress
Project Life Cycle Options for refurbishment or replacement of existing facilities still to be determined. Next meeting of Project Team to meet shortly to discuss outline brief and options, and recommend a preferred solution.
Merger of Witchhill and Woodstock Schools
Financial Status Budget revised following Cabinet decision of 6 May 2009. Project costs will be accurately determined after detailed designs are finalised and tenders received.
Budget Allocation
£m
Expenditure to Date
£m
Forecast Expenditure
£m
10.000 0.069 10.000
Development Design Tender Construction
Concept Design Image
Complete Start 07-07-09
Finish 31-05-10
Start 31-03-10
Finish 31-10-10
Start Finish 01-11-10 31-03-12
Expected Progress Actual Progress 20%
Project Life Cycle Outline design and floor plan formally approved. Demolition of the former Park School site is complete. Work progressing as planned.

2009/2010 FINANCE AND SERVICE STRATEGY REPORT TO PERIOD 8 (15 NOVEMBER 2009)
EDUCATIONAL AND SOCIAL SERVICES
57
New Cumnock Nursery and Primary School
Financial Status Budget revised following Cabinet decision of 6 May 2009. Project costs will be accurately determined after detailed designs are finalised and tenders received.
Budget Allocation
£m
Expenditure to Date
£m
Forecast Expenditure
£m
9.600 0.148 9.600
Development Design Tender Construction TBC TBC TBC TBC
Expected Progress Actual Progress
Project Life Cycle Response of Stage 2 Flood Risk Assessment received from SEPA. Early indications are that flood prevention works will be required. Works to temporarily relocate nursery to Cairnhill Primary have been delayed due to problems with water ingress. Further works to roof are in progress.
Patna / St Xavier’s Primary Schools Co-location
Financial Status Anticipated expenditure in 2009/10 relates to an allowance for ancillary investigation works.
Budget Allocation
£m
Expenditure to Date
£m
Forecast Expenditure
£m
9.000 0.000 9.000
Development Design Tender Construction
Start 27-01-09
Finish 21-12-09
Start 22-12-09
Finish 29-10-10
Start 01-11-10
Finish 10-02-11
Start 11-02-11
Finish 15-08-12
Expected Progress Actual Progress 35%
Project Life Cycle Outline designs being developed based on brief prepared by Education and Leisure Services.

2009/2010 FINANCE AND SERVICE STRATEGY REPORT TO PERIOD 8 (15 NOVEMBER 2009)
EDUCATIONAL AND SOCIAL SERVICES
58
Replacement Schools
Financial Status Budgets to be revised to take account of Scottish Government funding once more information is available.
Budget Allocation
£m
Expenditure to Date
£m
Forecast Expenditure
£m
19.000 0.000 19.000
Development Design Tender Construction TBC TBC TBC TBC
Expected Progress Actual Progress
Project Life Cycle The Scottish Government recently announced funding will be made available to support the construction of a new Gargieston Primary School.
Auchinleck Community Facilities
Financial Status No expenditure is anticipated to be incurred in 2009/10
Budget Allocation
£m
Expenditure to Date
£m
Forecast Expenditure
£m
0.956 0.000 0.956
Development Design Tender Construction
Start TBC
Finish TBC
Start TBC
Finish TBC
Start TBC
Finish TBC
Start TBC
Finish TBC
Expected Progress Actual Progress
Project Life Cycle Original funding in respect of Auchinleck Resource Centre is now proposed to be used to fund a partial upgrade to Auchinleck Community Centre.
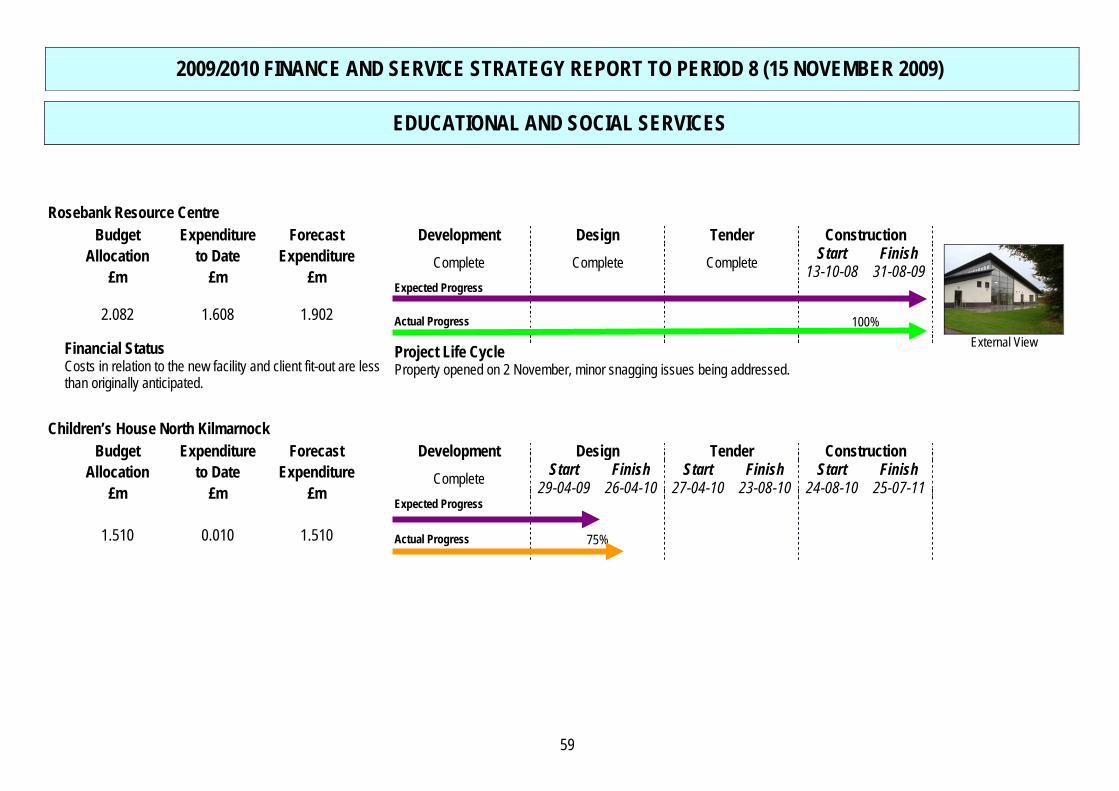
2009/2010 FINANCE AND SERVICE STRATEGY REPORT TO PERIOD 8 (15 NOVEMBER 2009)
EDUCATIONAL AND SOCIAL SERVICES
59
Rosebank Resource Centre
Financial Status Costs in relation to the new facility and client fit-out are less than originally anticipated.
Budget Allocation
£m
Expenditure to Date
£m
Forecast Expenditure
£m
2.082 1.608 1.902
Development Design Tender Construction
External View
Complete Complete Complete Start Finish 13-10-08 31-08-09
Expected Progress
Actual Progress 100%
Project Life Cycle Property opened on 2 November, minor snagging issues being addressed.
Children’s House North Kilmarnock Budget
Allocation £m
Expenditure to Date
£m
Forecast Expenditure
£m
1.510 0.010 1.510
Development Design Tender Construction Complete Start Finish Start Finish Start Finish
29-04-09 26-04-10 27-04-10 23-08-10 24-08-10 25-07-11 Expected Progress
Actual Progress 75%

2009/2010 FINANCE AND SERVICE STRATEGY REPORT TO PERIOD 8 (15 NOVEMBER 2009)
EDUCATIONAL AND SOCIAL SERVICES
60
Financial Status Minor expenditure on site investigations is currently anticipated to be incurred during 2009/10.
Project Life Cycle Discussions currently ongoing with the PPP contractor regarding removal of “spoil” which is delaying access to the site. Work on the last 2 boreholes has now been completed. Official results awaited from the first 4 boreholes.
Hurlford Day Centre
Financial Status No expenditure is anticipated to be incurred in 2009/10
Budget Allocation
£m
Expenditure to Date
£m
Forecast Expenditure
£m
2.500 0.000 2.500
Development Design Tender Construction Start Finish Start Finish Start Finish Start Finish
TBC TBC TBC TBC TBC TBC TBC TBC Expected Progress Actual Progress
Project Life Cycle Scope of works to be defined by Social Services; awaiting completion of model for day care services.

2009/2010 FINANCE AND SERVICE STRATEGY REPORT TO PERIOD 8 (15 NOVEMBER 2009)
EDUCATIONAL AND SOCIAL SERVICES
61
General Projects
There are a number of minor projects which are due to start and finish within the current financial year:- Fabric Upgrades and Refurbishments The underspend primarily relates to a number of schemes which are anticipated to be less than originally budgeted, although some schemes have also slipped in terms of progress and will now be completes in 2010/11. The underspends identified will be required, in part, to offset schemes which are currently projected to cost more than available budget. Projects The Netherthird Community Centre project carried forward from 2008/09 is anticipated to be £0.137m more than the available budget. Costs of approximately £0.100m in relation to the new Galston Primary School are anticipated to be incurred during the 2009/10 financial year. Elderly Day Care Facilities The costs in relation to the Stewarton Townhouse project are anticipated to be approximately £0.016m more than the available budget due to additional IT / telephony requirements, and structural issues identified with the roof area. Telecare The Telecare project is anticipated to incur only £0.100m of the £0.200m budget in the current year.
Revised Budget 2009/10
£m
Actual Expenditure
to Date £m
Projected Expenditure
2009/10 £m
Variance £m
Fabric Upgrades & Refurbishments 3.645 1.463 2.917 (0.728) Projects 0.535 0.180 0.740 0.205 PPP Schools 0.200 0.080 0.200 0.000 Care Homes Elderly 0.008 0.000 0.008 0.000 Elderly Day Care Facilities 0.435 0.091 0.451 0.016 Children’s Homes 0.004 0.000 0.004 0.000 Telecare 0.200 0.000 0.100 (0.100) TOTAL EDUCATION & SOCIAL SERVICES 5.027 1.814 4.420 (0.607)

2009/2010 FINANCE AND SERVICE STRATEGY REPORT TO PERIOD 8 (15 NOVEMBER 2009)
NEIGHBOURHOOD SERVICES
62
Capital Programme Expenditure to date is £5.065m, which represents 36% of the available budget. The projected expenditure for 2009/10 is £13.969m. The variance primarily relates to anticipated underspend on Sports Pavilions and Decriminalisation of Parking Enforcement, offset to some extent by additional costs to complete the CCTV / Risk Monitoring Centre and Stewarton Community Facilities projects.

2009/2010 FINANCE AND SERVICE STRATEGY REPORT TO PERIOD 8 (15 NOVEMBER 2009)
NEIGHBOURHOOD SERVICES
63
Crosshouse Resource Centre
Financial Status Early indications are that there may be an underspend overall.
Budget Allocation
£m
Expenditure to Date
£m
Forecast Expenditure
£m
3.866 2.306 3.866
Development Design Tender Construction
Internal View
Start N/A
Finish 20-09-07
Start 18-10-07
Finish 04-07-08
Start 07-07-08
Finish 31-10-08
Start 24-04-09
Finish 28-05-09
Expected Progress Actual Progress 80%
Project Life Cycle Internal works ongoing. Construction works are anticipated to be completed ahead of schedule, possibly late February / early March.
Palace Theatre / Grand Hall
Financial Status Budget has been enhanced by the £0.200m swapped from revenue balances in line with the Cabinet report of 2 December 2009.
Budget Allocation
£m
Expenditure to Date
£m
Forecast Expenditure
£m
1.481 0.843 1.481
Development Design Tender Construction Complete Complete Complete Start
11-01-10 Finish
31-03-10 Expected Progress Actual Progress 0%
Project Life Cycle The front of house and stage works has been delayed due to contractor inability to deliver project within agreed timescales. These works will therefore be completed concurrently with the lift installation which will be installed between January and April 2010. Current cost projections suggest there may be an underspend and it is proposed that this is used to enable limited internal refurbishment of the theatre.

2009/2010 FINANCE AND SERVICE STRATEGY REPORT TO PERIOD 8 (15 NOVEMBER 2009)
NEIGHBOURHOOD SERVICES
64
Baird Institute
Financial Status Project is currently estimated to be underspent by £0.009m. However, this will be used to match fund a bid for CARS funding.
Budget Allocation
£m
Expenditure to Date
£m
Forecast Expenditure
£m
0.650 0.599 0.641
Development Design Tender Construction Complete Complete Complete Start Finish
02-02-09 24-04-09 Expected Progress Actual Progress 100%
Project Life Cycle Phase 1 works are now complete; currently in snagging period. Proposals are being developed to support a CARS bid to fund Phase 2 works to stonework, handrail and roof. Outcome dependent on planning and Historic Scotland approval.
Kilmarnock Athletics Facilities
Financial Status Budget revised to £5.625m following Cabinet decision on 6 May 2009.
Budget Allocation
£m
Expenditure to Date
£m
Forecast Expenditure
£m
5.625 0.046 5.625
Development Design Tender Construction
Artists Impression
Complete Start 02-03-09
Finish 21-08-09
Start 24-08-09
Finish 22-05-10
Start 28-06-10
Finish 27-06-11
Expected Progress Actual Progress 8%
Project Life Cycle Discussions currently on-going with SEPA regarding flood risk and drainage issues. Work ongoing to determine extent of facilities deliverable within proposed budget allocation.

2009/2010 FINANCE AND SERVICE STRATEGY REPORT TO PERIOD 8 (15 NOVEMBER 2009)
NEIGHBOURHOOD SERVICES
65
Depot Improvements
Financial Status £0.150m set aside for staff welfare facilities; to be incurred in 2009/10
Budget Allocation
£m
Expenditure to Date
£m
Forecast Expenditure
£m
5.600 0.000 5.600
Development Design Tender Construction
Start Finish Start Finish Start Finish Start Finish TBC TBC TBC TBC TBC TBC TBC TBC
Expected Progress Actual Progress
Project Life Cycle Works currently ongoing with regard to site selection and determination of operations to be delivered from new depot facility. Indicative layouts prepared for discussion with departments. Report on recommended option anticipated to be with Cabinet early 2010.
Stewarton Sports Facilities
Financial Status No expenditure is anticipated to be incurred in 2009/10
Budget Allocation
£m
Expenditure to Date
£m
Forecast Expenditure
£m
4.300 0.000 4.300
Development Design Tender Construction
Artist’s Impression
Start Finish Start Finish Start Finish Start Finish N/A N/A 07/10/08 16/10/09 19/10/09 28/05/10 01/06/10 04/10/11
Expected Progress
Actual Progress 20%
Project Life Cycle Designs are “locked-down”. Planning application has been submitted, anticipated decision early 2010. Design works and tender document ongoing.

2009/2010 FINANCE AND SERVICE STRATEGY REPORT TO PERIOD 8 (15 NOVEMBER 2009)
NEIGHBOURHOOD SERVICES
66
Dean Ford Bridge
Financial Status Anticipated expenditure in 2009/10 relates to feasibility works.
Budget Allocation
£m
Expenditure to Date
£m
Forecast Expenditure
£m
1.000 0.000 1.000
Development Design Tender Construction
Start Finish Start Finish Start Finish Start Finish TBC TBC TBC TBC TBC TBC TBC TBC
Expected Progress
Actual Progress
Project Life Cycle Preliminary design work will be carried out during 2009/10. It is anticipated that construction will be carried out during 2010/11.

2009/2010 FINANCE AND SERVICE STRATEGY REPORT TO PERIOD 8 (15 NOVEMBER 2009)
NEIGHBOURHOOD SERVICES
67
General Projects There are a number of minor projects due to start and finish within 2009/10. Strategic Priorities The final costs in relation to the CCTV Monitoring Centre and the Stewarton Community Centre were higher than originally anticipated. Facility Improvement Slippage of £0.200m is currently projected on the Sports Pavilions projects. Additional works at the Scott Ellis pavilion have been added. Traffic and Road Safety Additional costs in respect of the spend to save traffic signal renewal have been incurred. There is a projected underspend of £0.130m in respect of the spend to save Decriminalisation of Parking Enforcement project.
Revised Budget 200910
£m
Actual Expenditure
to Date £m
Projected Expenditure
2009/10 £m
Variance £m
Strategic Priorities 0.000 0.000 0.090 0.090
Facility Improvements 2.190 0.359 1.990 (0.200)
Cemetery Extension 0.576 0.045 0.576 0.000
Playparks 0.531 0.198 0.531 0.000
Traffic & Road Safety 2.749 0.354 2.633 (0.116)
Structures 1.094 0.293 1.094 0.000
Carriageways & Footways 2.175 1.283 2.175 0.000
Street Lighting 0.220 0.108 0.220 0.000
Flood Prevention Schemes 0.055 0.005 0.055 0.000
Depots 0.110 0.017 0.110 0.000
TOTAL NEIGHBOURHOOD SERVICES 9.700 2.662 9.474 (0.226)

2009/2010 FINANCE AND SERVICE STRATEGY REPORT TO PERIOD 8 (15 NOVEMBER 2009)
NEIGHBOURHOOD SERVICES
68
Housing Investment Programme As at Period 8 the projected spend is £15.365m, which is £0.251m below budget. The underspend on the Housing Investment Programme primarily relates to slippage on the Modern Facilities programme, and the proposed works to renew the roof at St Maur’s Gardens which is anticipated will now be completed in 2010/11. There is a long term programme to refurbish council dwellings to meet the Scottish Housing Quality Standards by 2015. Investment levels are therefore not uniform each year, which may result in levels of over or under commitment.
Service
Revised Budget 2009/10
£m
Actual Expenditure
to Date £m
Projected Expenditure
2009/10 £m
Variance £m
Asbestos 0.250 0.084 0.356 0.106 Energy Efficiency 3.194 0.570 3.476 0.282 Efficient Heating 2.922 1.020 3.147 0.225 External Envelope Enhancement 1.409 0.235 1.166 (0.243) Modern Facilities & Services 6.384 2.054 5.879 (0.505) Neighbourhood Improvements 0.386 0.506 0.704 0.318 Safe & Secure Neighbourhood 0.381 0.160 0.259 (0.122) Sheltered Housing Safety & Improvement 0.690 0.007 0.378 0.312 Total Housing Expenditure 15.616 4.636 15.365 (0.251)
Asbestos Projected spend over budget reflects increased number of addresses.
Energy Efficiency The uPVC Window Replacement Programme has been accelerated to reduce the overall variance.
Efficient Heating Another phase of work has been added to the Gas Central Heating programme in order to offset slippage on other phases.
External Envelope Enhancement Projected variance reflects possible issues with private owners and concerns over ability to deliver programme within the current year.
Modern Facilities & Services Underspend projected due to risk of work on kitchens and bathrooms carrying on into 2010/11.
Neighbourhood Improvements Additional timber clad addresses have been included in projections.
Safe & Secure Neighbourhood Increased risk of private owners slowing progress on the Door Entry programme.
Sheltered Housing Safety & Improvement The renewal of the roof at St Maur’s Gardens has been added to the projected spend however it is anticipated that all phases cannot be completed in 2009/10 resulting in further expenditure in 2010/11.

2009/2010 FINANCE AND SERVICE STRATEGY REPORT TO PERIOD 8 (15 NOVEMBER 2009)
NEIGHBOURHOOD SERVICES
69
Sources of Funding
Approved Budget 2009/10
£m
Actual Expenditure
2009/10 £m
Revenue Funding (CFCR) 5.561 5.947 Sale of Council Dwellings and Other Capital Receipts 4.888 2.000 Anticipated Borrowing 5.167 7.418 Total 15.616 15.365
As a result of current economic conditions, the contribution to the Housing Investment Programme from capital receipts generated from council house sales is likely to be significantly less than originally anticipated. This will therefore result in an increased borrowing requirement for the HRA in 2009/10 and beyond. However, this will be offset by higher rental income in the current year than originally anticipated and greater forecast receipts in future years after the current economic conditions have dissipated. This will continue to be kept under regular review.

2009/2010 FINANCE AND SERVICE STRATEGY REPORT TO PERIOD 8 (15 NOVEMBER 2009)
CORPORATE SUPPORT
70
Capital Programme Expenditure to date is £1.457m, which represents 23% of the available budget. The projected expenditure for 2009/10 is £7.660m. The projected variance on the Corporate Support capital programme primarily relates to the cost of the fit out of the Strand Street Building.

2009/2010 FINANCE AND SERVICE STRATEGY REPORT TO PERIOD 8 (15 NOVEMBER 2009)
CORPORATE SUPPORT
71
Major Projects
Data Centre, Council Chambers and Associated Works on Council Chambers
Financial Status Current projections estimate the costs will be containable within the overall budget allocations relating to the London Road Headquarters.
Budget Allocation
£m
Expenditure to Date
£m
Forecast Expenditure
£m
3.900 0.443 3.900
Council Chambers Development
Design
Tender
Construction
New Timber Joist
Start Finish Start Finish Start Finish Start Finish N/A N/A N/A N/A N/A N/A 27/07/09 26/01/10
Expected Progress Actual Progress 40%
Project Life Cycle Work is currently in progress. Additional structural works required to the roof are anticipated to delay the completion date by between 4 to 6 weeks (estimated completion March 2010). A formal Project Management Team has been established to monitor closely delivery of project to completion.
Data Centre Development
Design
Tender
Construction
Start Finish Start Finish Start Finish Start Finish
17-07-09 13-08-09 14-08-09 04-03-10 05-03-10 05-05-10 06-05-10 13-09-10 Expected Progress Actual Progress 60%
Project Life Cycle Work on preliminary designs is ongoing and these are currently ahead of schedule. Construction works due for completion mid September 2010, however, centre will not become fully operational until after December 2010 as switch over planned for Christmas holiday period. Funding of IT equipment proposed through reallocation of future years IT capital allocations.

2009/2010 FINANCE AND SERVICE STRATEGY REPORT TO PERIOD 8 (15 NOVEMBER 2009)
CORPORATE SUPPORT
72
Kilmarnock Town Centre Regeneration
Financial Status Budget has been revised to take account of £1.156m award from the TCRF and £0.075m from Scottish Enterprise. However, it is anticipated that expenditure in respect of this funding will not be incurred until 2010/11.
Budget Allocation
£m
Expenditure to Date
£m
Forecast Expenditure
£m
22.992 0.511 21.760
Development Design Tender Construction
Start Finish Start Finish Start Finish Start Finish TBC TBC TBC TBC TBC TBC TBC TBC
Expected Progress
Actual Progress
Project Life Cycle Cabinet on 21 October 2009 approved the distribution of the allocation across a number of individual projects. These projects will be progressed by those departments deemed responsible for delivering each scheme. Purchase of Hill Street offices and fit out of Strand Street anticipated to be concluded this financial year.
Cumnock Town Centre
Financial Status The budget has been augmented to include the TCRF funding award of £0.749m, which has to be spent by 31 March 2010.
Budget Allocation
£m
Expenditure to Date
£m
Forecast Expenditure
£m
14.718 2.091 14.718
Acquisition Design Construction Distribution
Start Finish Start Finish Start Finish Start Finish 01-10-08 31-03-09 31-01-08 TBC 31-10-09 TBC TBC TBC Expected Progress
Actual Progress
Project Life Cycle Office / Retail Development – Scottish Government has responded to the CPO application requesting some issues to be clarified. Following a fire there is extensive damage to cottages on the site; dangerous buildings notice to demolish has been served. Planning permission for demolition of bingo hall and civic space works approved 2 October 2009, awaiting Historic Scotland approval.
80%

2009/2010 FINANCE AND SERVICE STRATEGY REPORT TO PERIOD 8 (15 NOVEMBER 2009)
CORPORATE SUPPORT
73
Corporate Support General Projects As at Period 8, there are no material variances on the Corporate Support general projects.
Revised Budget 2009/10
£m
Actual Expenditure
to Date £m
Projected Expenditure
2009/10 £m
Variance £m
Corporate Information Technology 1.440 0.414 1.440 0.000
TOTAL CORPORATE SUPPORT 1.490 0.414 1.440 0.000

2009/2010 FINANCE AND SERVICE STRATEGY REPORT TO PERIOD 8 (15 NOVEMBER 2009)
FINANCE & ASSET MANAGEMENT
74
Capital Programme Expenditure to date is £0.210m, which represents 13% of the available budget. The Projected Expenditure for 2009/10 is £1.728m. Contingency Funding This represents the balance of available contingency funding in 2009/10. Drawdowns on this funding may reduce the projected underspend throughout the year. Vehicle Procurement Following an option appraisal a vehicle costing £0.128m will be purchased rather than leased.
Revised Budget 2009/10
£m
Actual Expenditure
to Date £m
Projected Expenditure
2009/10 £m
Variance £m
Contingency Funding 0.035 0.000 0.000 (0.035)
Corporate Office Accommodation 1.600 0.082 1.600 0.000
Vehicle Procurement 0.000 0.128 0.128 0.128
TOTAL FINANCE AND ASSET MANAGEMENT 1.635 0.210 1.728 0.093