finan- cial report - geberit · financial report geberit key figures geberit annual report 2016 85...
TRANSCRIPT

Finan-cialReport Geberit Group 2016
GeberitGroup

Financial report
Geberit Annual Report 2016 83
Highlights of the financial year 2016
Net sales
+6.4%
Organic, currency-adjusted net sales growth in 2016
Net sales development
(in CHF million)
07 08 09 10 11 12 13 14 15 16
0
500
1,000
1,500
2,000
2,500
3,000
EBIT, EBITDA, Net income,Earnings per share (EPS)
(in CHF million) (EPS: in CHF)
1 EBIT 2 EBITDA 3 Net income 4 EPS
2014 2015* 2016*
0
200
400
600
800
0
5
10
15
20
1 1
12
2
2
3 3
34 4
4
Net income development
(in CHF million)
07 08 09 10 11 12 13 14 15* 16*
0
100
200
300
400
500
600
Operating cashflow margin(EBITDA margin)
*
28.3%
1.6 percentage higher than prior year
Free cashflow(in CHF)
563.9 mio.
16.5% above prior year
Financial report
Geberit Annual Report 2016 84
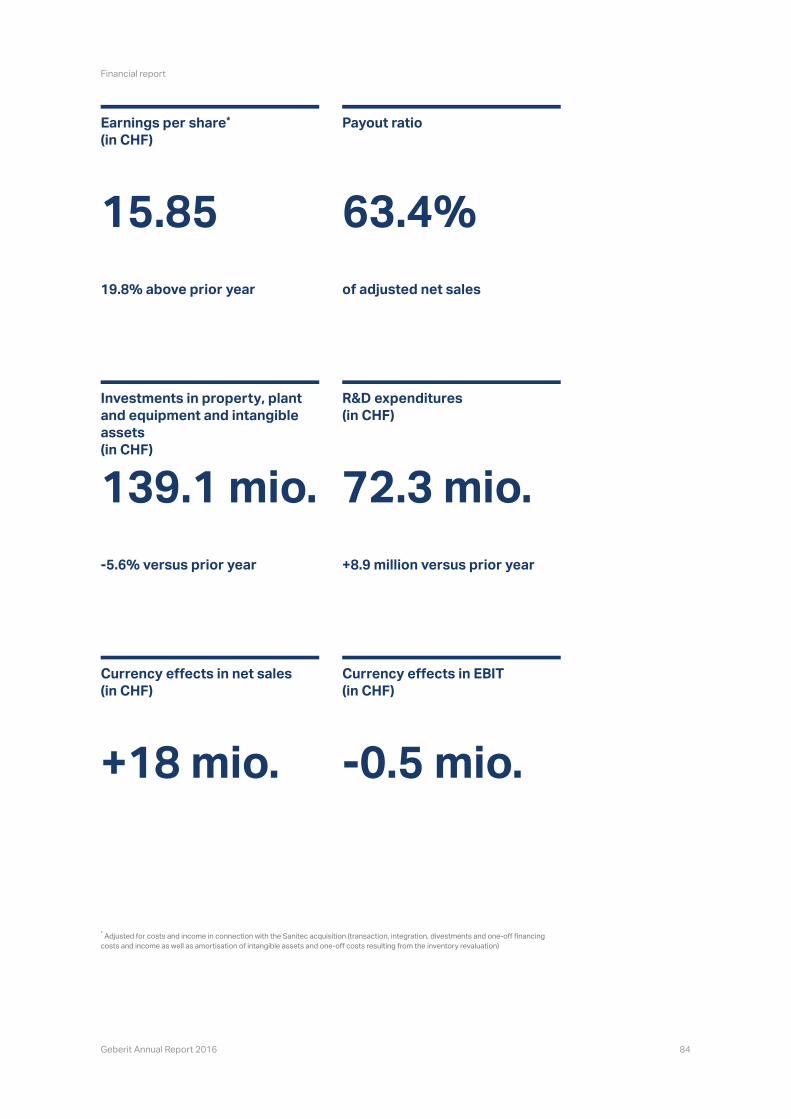
Sanitec acquisition (transaction, integration, divestments and one-off financing
costs and income as well as amortisation of intangible assets and one-off costs resulting from the inventory revaluation)
Earnings per share(in CHF)
*
15.85
19.8% above prior year
Payout ratio
63.4%
of adjusted net sales
Investments in property, plant and equipment and intangible assets(in CHF)
139.1 mio.
-5.6% versus prior year
R&D expenditures(in CHF)
72.3 mio.
+8.9 million versus prior year
Currency effects in net sales(in CHF)
+18 mio.
Currency effects in EBIT(in CHF)
-0.5 mio.
*

Financial report
Geberit key figures
Geberit Annual Report 2016 85
Geberit key figures
2016 2015 2014 2013 2012
Net sales MCHF 2,809.0 2,593.7 2,089.1 1,999.9 1,919.6
Change on previous year % +8.3 +24.2 +4.5 +4.2 +2.8
Operating profit (EBIT) MCHF 686.5 590.9 576.9 510.7 456.5
Margin in % of net sales % 24.4 22.8 27.6 25.5 23.8
Net income MCHF 584.0 493.1 498.6 435.8 387.5
Margin in % of net sales % 20.8 19.0 23.9 21.8 20.2
Operating cashflow (EBITDA) MCHF 794.9 693.5 657.1 592.8 536.6
Margin in % of net sales % 28.3 26.7 31.5 29.6 28.0
Free cashflow MCHF 563.9 484.0 460.4 444.3 391.0
Margin in % of net sales % 20.1 18.7 22.0 22.2 20.4
Financial results, net MCHF -9.3 -17.2 -1.7 -5.5 -7.2
Capital expenditures MCHF 139.1 147.3 104.8 98.0 86.0
Research and development expenses
MCHF 72.3 63.4 55.8 50.9 49.8
In % of net sales % 2.6 2.4 2.7 2.5 2.6
Earnings per share CHF 15.85 13.23 13.28 11.59 10.16
Distribution per share CHF 10.00 8.40 8.30 7.50 6.60
Employees
Number of employees (31.12) 11,592 12,126 6,247 6,226 6,134
Annual average 11,972 12,477 6,303 6,219 6,150
Net sales per employee TCHF 234.6 207.9 331.4 321.6 312.1
Balance sheet 31.12.2016 31.12.2015 31.12.2014 31.12.2013 31.12.2012
Total assets MCHF 3,601.1 3,553.8 2,431.5 2,226.0 2,007.4
Liquid funds and marketable securities
MCHF 509.7 459.6 749.7 612.8 423.1
Net working capital MCHF 147.3 146.6 169.1 127.9 134.4
Property, plant and equipment MCHF 726.5 715.4 550.9 536.4 521.2
Goodwill and intangible assets MCHF 1,681.1 1,757.1 645.3 645.5 638.1
Total debt MCHF 970.9 1,139.2 10.5 11.7 14.7
Equity MCHF 1,635.2 1,482.2 1,717.1 1,664.1 1,431.3
Equity ratio % 45.4 41.7 70.6 74.8 71.3
Gearing % 28.2 45.9 -43.0 -36.1 -28.5
ROIC % 21.5 20.1 35.5 32.1 28.9
Based on the 1:10 stock split implemented on May 8, 2007.
2015 and 2016: Adjusted for costs and income in connection with the Sanitec acquisition (transaction, integration, divestments and one-off financing costs and income as well
as amortization of intangible assets and one-off costs resulting from the inventory revaluation)
Restatement see in the consolidated financial statements of the Geberit Group 2013
3
2
2
2
2
2
2
2
1,2
2
1
2
3

Financial report
Geberit key figures
Geberit Annual Report 2016 86
Geberit key figures
2011 2010 2009 2008 2007
Net sales MCHF 1,867.6 1,900.0 1,931.0 2,178.9 2,206.4
Change on previous year % -1.7 -1.6 -11.4 -1.2 +14.0
Operating profit (EBIT) MCHF 449.2 486.2 526.7 563.4 553.8
Margin in % of net sales % 24.1 25.6 27.3 25.9 25.1
Net income MCHF 384.0 406.8 397.5 466.3 463.3
Margin in % of net sales % 20.6 21.4 20.6 21.4 21.0
Operating cashflow (EBITDA) MCHF 532.0 573.7 611.0 649.1 637.9
Margin in % of net sales % 28.5 30.2 31.6 29.8 28.9
Free cashflow MCHF 386.0 493.8 349.7 407.9 362.7
Margin in % of net sales % 20.7 26.0 18.1 18.7 16.4
Financial results, net MCHF -7.3 -14.3 -13.5 5.4 -11.4
Capital expenditures MCHF 92.6 80.5 106.4 152.5 103.5
Research and development expenses
MCHF 48.4 44.2 45.6 46.0 48.1
In % of net sales % 2.6 2.3 2.4 2.1 2.2
Earnings per share CHF 9.82 10.32 10.18 11.90 11.67
Distribution per share CHF 6.30 6.00 6.40 5.40 5.20
Employees
Number of employees (31.12) 6,004 5,820 5,608 5,697 5,344
Annual average 5,992 5,793 5,634 5,684 5,360
Net sales per employee TCHF 311.7 328.0 342.7 383.3 411.6
Balance sheet 31.12.2011 31.12.2010 31.12.2009 31.12.2008 31.12.2007
Total assets MCHF 2,122.7 2,171.2 2,212.2 2,054.1 2,298.3
Liquid funds and marketable securities
MCHF 542.0 586.6 406.5 302.6 450.1
Net working capital MCHF 114.1 108.5 180.9 156.5 168.7
Property, plant and equipment MCHF 516.2 514.3 576.2 555.5 529.3
Goodwill and intangible assets MCHF 645.2 658.8 753.1 756.2 828.8
Total debt MCHF 75.6 73.4 110.9 152.3 273.9
Equity MCHF 1,419.5 1,520.9 1,509.2 1,311.9 1,404.4
Equity ratio % 66.9 70.0 68.2 63.9 61.1
Gearing % -32.9 -33.7 -19.6 -11.5 -12.5
ROIC % 28.8 28.7 28.5 28.2 25.9
Based on the 1:10 stock split implemented on May 8, 2007.
2015 and 2016: Adjusted for costs and income in connection with the Sanitec acquisition (transaction, integration, divestments and one-off financing costs and income as well
as amortization of intangible assets and one-off costs resulting from the inventory revaluation)
2
2
2
2
2
2
2
1,2
2
1
2
Financial report
Consolidated financial statements Geberit Group
Geberit Annual Report 2016 87
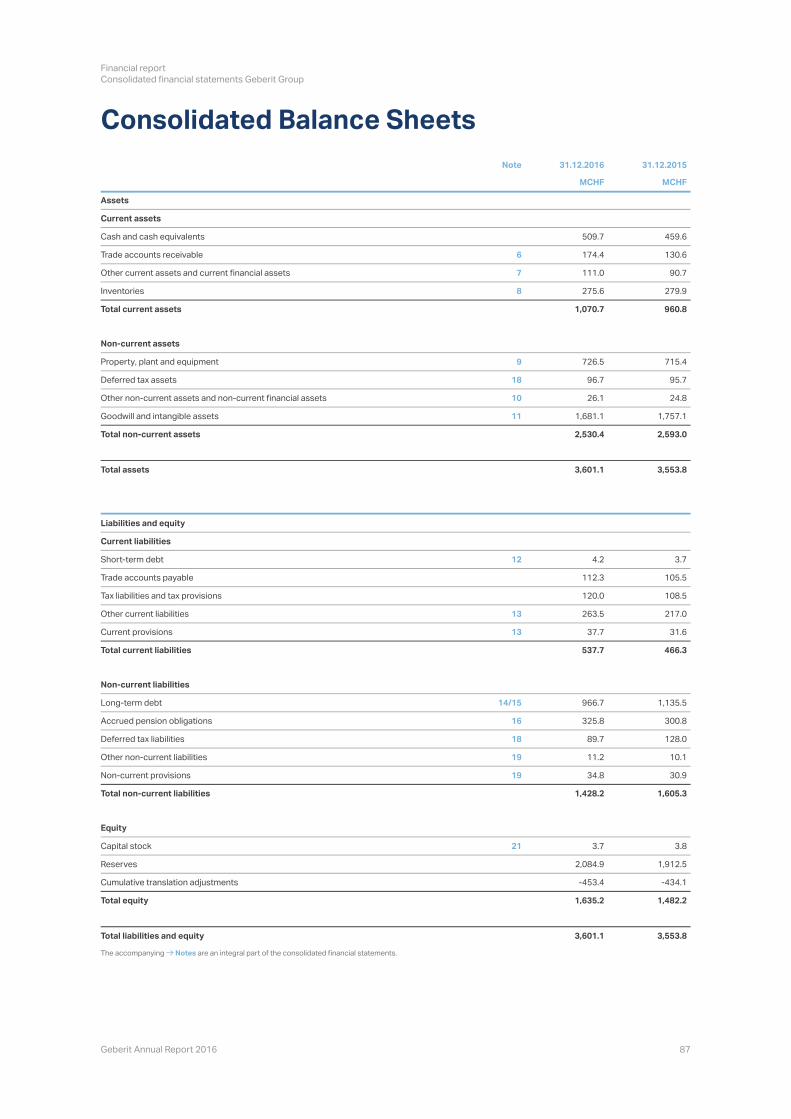
Consolidated Balance Sheets
Note 31.12.2016 31.12.2015
MCHF MCHF
Assets
Current assets
Cash and cash equivalents 509.7 459.6
Trade accounts receivable 6 174.4 130.6
Other current assets and current financial assets 7 111.0 90.7
Inventories 8 275.6 279.9
Total current assets 1,070.7 960.8
Non-current assets
Property, plant and equipment 9 726.5 715.4
Deferred tax assets 18 96.7 95.7
Other non-current assets and non-current financial assets 10 26.1 24.8
Goodwill and intangible assets 11 1,681.1 1,757.1
Total non-current assets 2,530.4 2,593.0
Total assets 3,601.1 3,553.8
Liabilities and equity
Current liabilities
Short-term debt 12 4.2 3.7
Trade accounts payable 112.3 105.5
Tax liabilities and tax provisions 120.0 108.5
Other current liabilities 13 263.5 217.0
Current provisions 13 37.7 31.6
Total current liabilities 537.7 466.3
Non-current liabilities
Long-term debt 14/15 966.7 1,135.5
Accrued pension obligations 16 325.8 300.8
Deferred tax liabilities 18 89.7 128.0
Other non-current liabilities 19 11.2 10.1
Non-current provisions 19 34.8 30.9
Total non-current liabilities 1,428.2 1,605.3
Equity
Capital stock 21 3.7 3.8
Reserves 2,084.9 1,912.5
Cumulative translation adjustments -453.4 -434.1
Total equity 1,635.2 1,482.2
Total liabilities and equity 3,601.1 3,553.8
The accompanying Notes are an integral part of the consolidated financial statements.
Financial report
Consolidated financial statements Geberit Group
Geberit Annual Report 2016 88
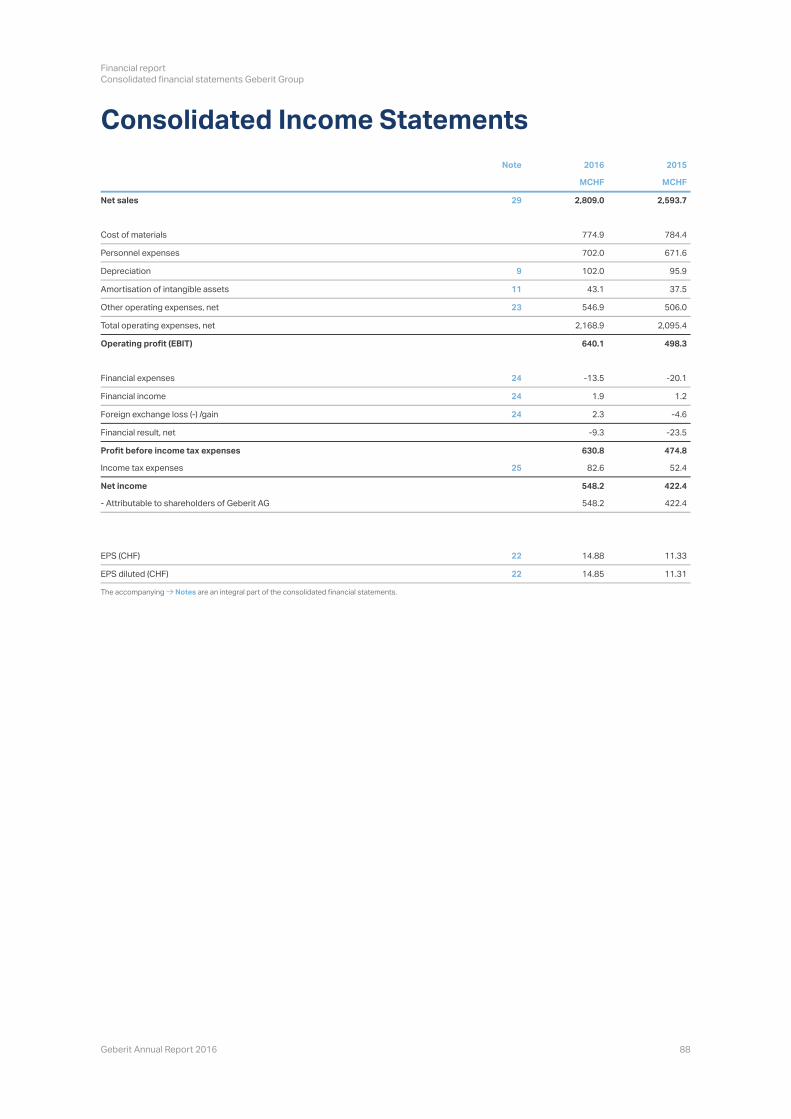
Consolidated Income Statements
Note 2016 2015
MCHF MCHF
Net sales 29 2,809.0 2,593.7
Cost of materials 774.9 784.4
Personnel expenses 702.0 671.6
Depreciation 9 102.0 95.9
Amortisation of intangible assets 11 43.1 37.5
Other operating expenses, net 23 546.9 506.0
Total operating expenses, net 2,168.9 2,095.4
Operating profit (EBIT) 640.1 498.3
Financial expenses 24 -13.5 -20.1
Financial income 24 1.9 1.2
Foreign exchange loss (-) /gain 24 2.3 -4.6
Financial result, net -9.3 -23.5
Profit before income tax expenses 630.8 474.8
Income tax expenses 25 82.6 52.4
Net income 548.2 422.4
- Attributable to shareholders of Geberit AG 548.2 422.4
EPS (CHF) 22 14.88 11.33
EPS diluted (CHF) 22 14.85 11.31
The accompanying Notes are an integral part of the consolidated financial statements.
Financial report
Consolidated financial statements Geberit Group
Geberit Annual Report 2016 89
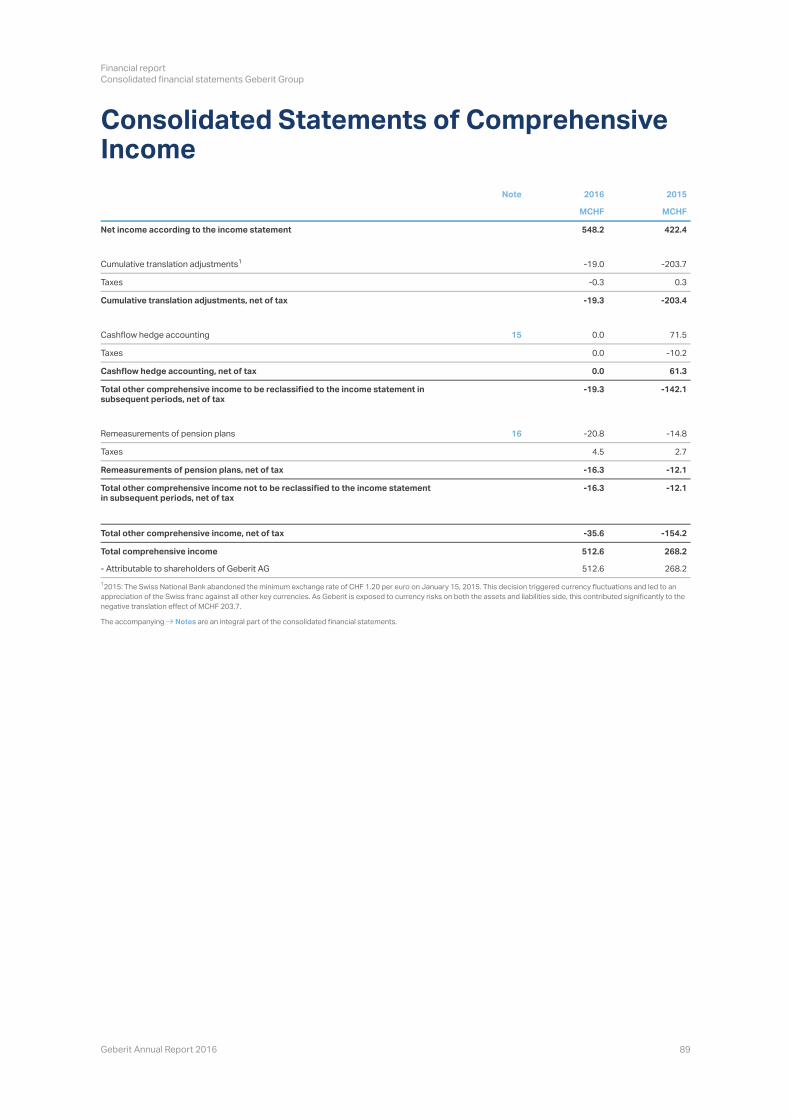
Consolidated Statements of Comprehensive Income
Note 2016 2015
MCHF MCHF
Net income according to the income statement 548.2 422.4
Cumulative translation adjustments -19.0 -203.7
Taxes -0.3 0.3
Cumulative translation adjustments, net of tax -19.3 -203.4
Cashflow hedge accounting 15 0.0 71.5
Taxes 0.0 -10.2
Cashflow hedge accounting, net of tax 0.0 61.3
Total other comprehensive income to be reclassified to the income statement in subsequent periods, net of tax
-19.3 -142.1
Remeasurements of pension plans 16 -20.8 -14.8
Taxes 4.5 2.7
Remeasurements of pension plans, net of tax -16.3 -12.1
Total other comprehensive income not to be reclassified to the income statement in subsequent periods, net of tax
-16.3 -12.1
Total other comprehensive income, net of tax -35.6 -154.2
Total comprehensive income 512.6 268.2
- Attributable to shareholders of Geberit AG 512.6 268.2
2015: The Swiss National Bank abandoned the minimum exchange rate of CHF 1.20 per euro on January 15, 2015. This decision triggered currency fluctuations and led to an
appreciation of the Swiss franc against all other key currencies. As Geberit is exposed to currency risks on both the assets and liabilities side, this contributed significantly to the
negative translation effect of MCHF 203.7.
The accompanying Notes are an integral part of the consolidated financial statements.
1
1
Financial report
Consolidated financial statements Geberit Group
Geberit Annual Report 2016 90
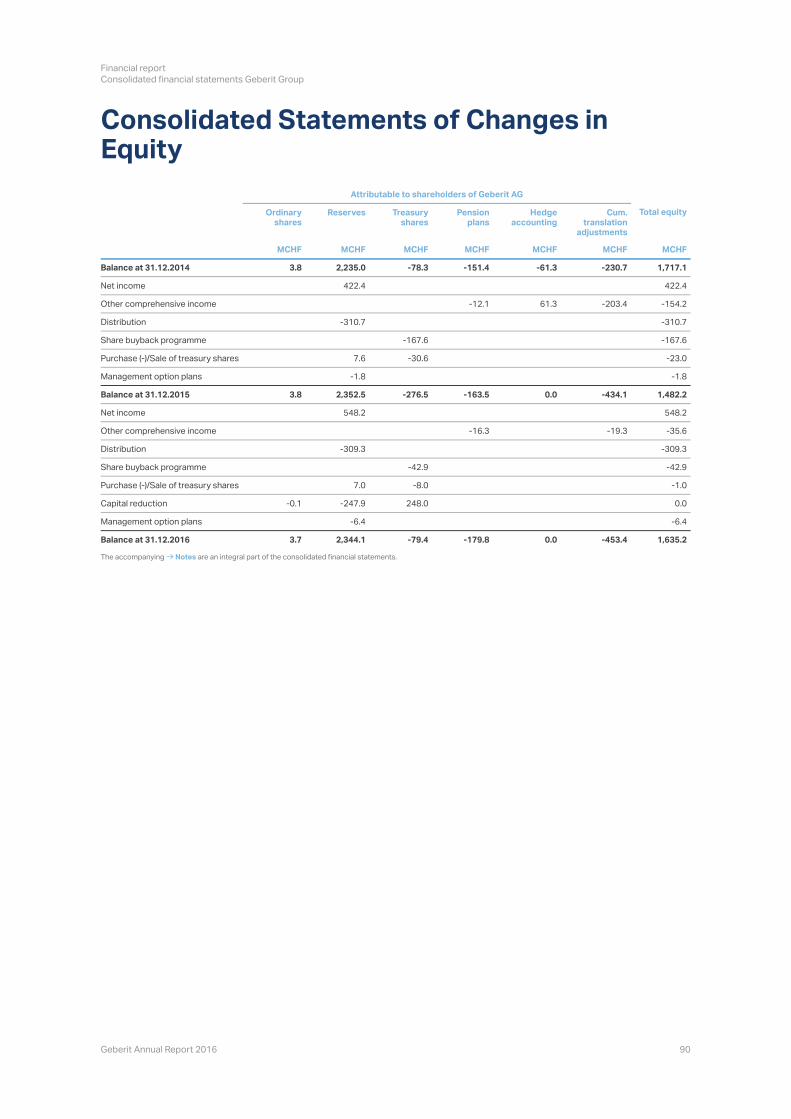
Consolidated Statements of Changes in Equity
Attributable to shareholders of Geberit AG
Ordinary shares
Reserves Treasury shares
Pension plans
Hedge accounting
Cum. translation
adjustments
Total equity
MCHF MCHF MCHF MCHF MCHF MCHF MCHF
Balance at 31.12.2014 3.8 2,235.0 -78.3 -151.4 -61.3 -230.7 1,717.1
Net income 422.4 422.4
Other comprehensive income -12.1 61.3 -203.4 -154.2
Distribution -310.7 -310.7
Share buyback programme -167.6 -167.6
Purchase (-)/Sale of treasury shares 7.6 -30.6 -23.0
Management option plans -1.8 -1.8
Balance at 31.12.2015 3.8 2,352.5 -276.5 -163.5 0.0 -434.1 1,482.2
Net income 548.2 548.2
Other comprehensive income -16.3 -19.3 -35.6
Distribution -309.3 -309.3
Share buyback programme -42.9 -42.9
Purchase (-)/Sale of treasury shares 7.0 -8.0 -1.0
Capital reduction -0.1 -247.9 248.0 0.0
Management option plans -6.4 -6.4
Balance at 31.12.2016 3.7 2,344.1 -79.4 -179.8 0.0 -453.4 1,635.2
The accompanying Notes are an integral part of the consolidated financial statements.
Financial report
Consolidated financial statements Geberit Group
Geberit Annual Report 2016 91
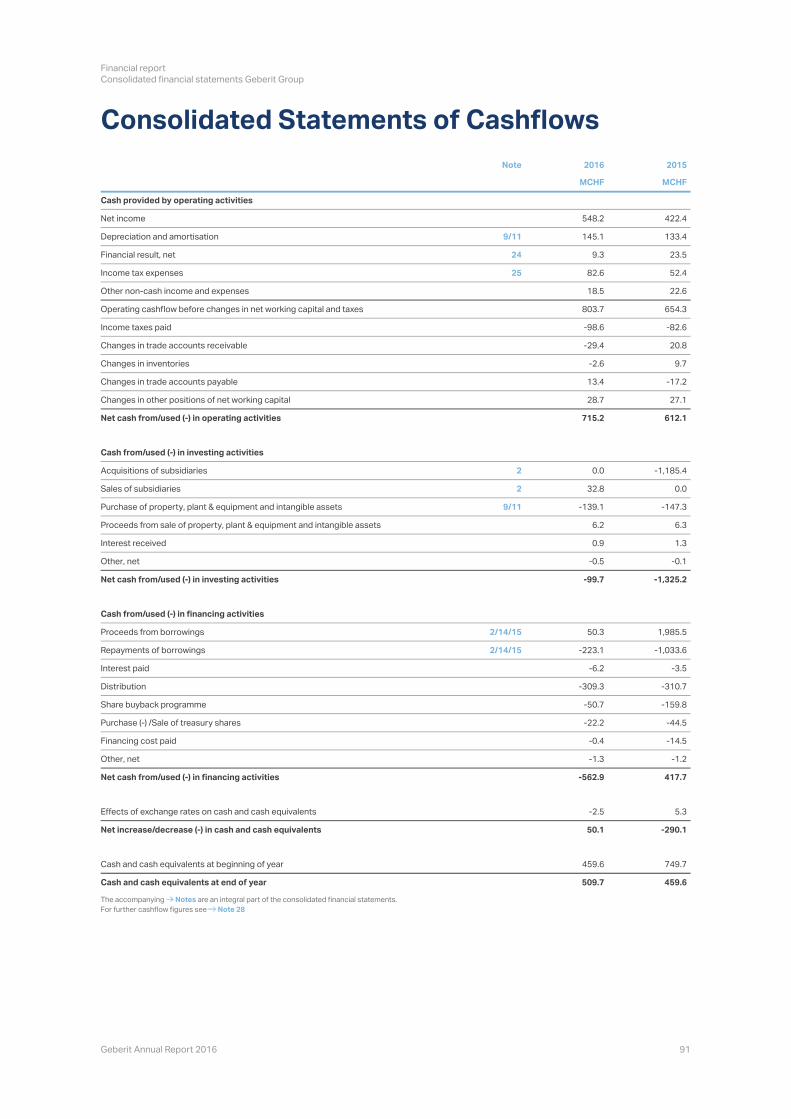
Consolidated Statements of Cashflows
Note 2016 2015
MCHF MCHF
Cash provided by operating activities
Net income 548.2 422.4
Depreciation and amortisation 9/11 145.1 133.4
Financial result, net 24 9.3 23.5
Income tax expenses 25 82.6 52.4
Other non-cash income and expenses 18.5 22.6
Operating cashflow before changes in net working capital and taxes 803.7 654.3
Income taxes paid -98.6 -82.6
Changes in trade accounts receivable -29.4 20.8
Changes in inventories -2.6 9.7
Changes in trade accounts payable 13.4 -17.2
Changes in other positions of net working capital 28.7 27.1
Net cash from/used (-) in operating activities 715.2 612.1
Cash from/used (-) in investing activities
Acquisitions of subsidiaries 2 0.0 -1,185.4
Sales of subsidiaries 2 32.8 0.0
Purchase of property, plant & equipment and intangible assets 9/11 -139.1 -147.3
Proceeds from sale of property, plant & equipment and intangible assets 6.2 6.3
Interest received 0.9 1.3
Other, net -0.5 -0.1
Net cash from/used (-) in investing activities -99.7 -1,325.2
Cash from/used (-) in financing activities
Proceeds from borrowings 2/14/15 50.3 1,985.5
Repayments of borrowings 2/14/15 -223.1 -1,033.6
Interest paid -6.2 -3.5
Distribution -309.3 -310.7
Share buyback programme -50.7 -159.8
Purchase (-) /Sale of treasury shares -22.2 -44.5
Financing cost paid -0.4 -14.5
Other, net -1.3 -1.2
Net cash from/used (-) in financing activities -562.9 417.7
Effects of exchange rates on cash and cash equivalents -2.5 5.3
Net increase/decrease (-) in cash and cash equivalents 50.1 -290.1
Cash and cash equivalents at beginning of year 459.6 749.7
Cash and cash equivalents at end of year 509.7 459.6
The accompanying Notes are an integral part of the consolidated financial statements.
For further cashflow figures see Note 28

Financial report
Consolidated financial statements Geberit Group
Geberit Annual Report 2016 92
Notes to the Consolidated Financial Statements
1. Basic information and principles of the report
The Geberit Group is an international company that focuses on the sanitary industry and, specifically, the areas of sanitary
tary Ceramics product areas. Worldwide, the vast majority of its products are sold through the wholesale channel. Geberit
sells its products in 122 countries. The Group is present in 49 countries with its own sales employees.
The consolidated financial statements include Geberit Geberit
Group eliminates all intra-group transactions as part of the Group consolidation process. A company is consolidated for the
first time or deconsolidated from the date on which the Group exercises or loses control over the company.
The consolidated financial statements of the Group have been prepared in accordance with International Financial Reporting
refers to the shareholders of Geberit AG.
In 2016, all functions (production, marketing and sales, R&D, corporate functions) of the Sanitec Group acquired in 2015 were
integrated fully into the Geberit Sanitec sales organisations were
decoupled from the individual Sanitec companies and merged with the corresponding Geberit sales companies. As a result,
there is no longer any profit responsibility and information at the level of the group that was originally acquired. The same is
sure made in Note 11 was adjusted accordingly.
Main sources of estimation uncertainty
The preparation of consolidated financial statements requires management to make estimates and assumptions that affect
the reported amounts of assets and liabilities, the disclosure of contingent assets and liabilities at the balance sheet date,
timates and assumptions are continually reviewed and based
tions of future events that are believed to be reasonable under the prevailing circumstances.
Important estimates and assumptions (with the related uncertainties) were primarily made in the following areas:
2. Changes in Group structure
2016
Sale of the Koralle Group
The Group sold the Koralle Group to AFG Arbonia-Forster-Holding AG on July 1, 2016. The sales price was MEUR 33.0 plus
net cash and cash equivalents. The Koralle Group companies are Bekon Koralle AG, Koralle Sanitärprodukte GmbH, Baduscho
Dusch- und Badeeinrichtungen Produktions- und Vertriebsgesellschaft mbH and Servico Gesellschaft für Sanitärtechnik
mbH. The Koralle Group was acquired as part of the Sanitec acquisition in 2015. The provider of shower enclosures primarily
tributed MCHF 22.6 to the Geberit MCHF 2.1 to the EBIT, and MCHF 1.7 to the net income as of June 30,
2016. In 2015 (11 months), the Koralle Group contributed MCHF 42.2 to the Geberit MCHF 2.4 to the EBIT,
and MCHF 1.9 to the net income. On June 30, 2016, the Koralle Group had current assets of MCHF 17.1, non-current assets
of MCHF 33.7, current liabilities of MCHF 7.3, and non-current liabilities of MCHF 7.3.
In addition there were various changes to the legal structure of the Group mainly in connection with the integration of the
Sanitec Group but with no effect on the consolidated results.
Impairment tests for goodwill and intangible assets with an indefinite useful life (see Note 11)-
Capitalisation of development costs (see Note 27)-
Assumptions for the recognition of defined benefit pension plans (see Note 16)-
Valuation of deferred tax assets and liabilities (see Note 3)-
Financial report
Consolidated financial statements Geberit Group
Geberit Annual Report 2016 93
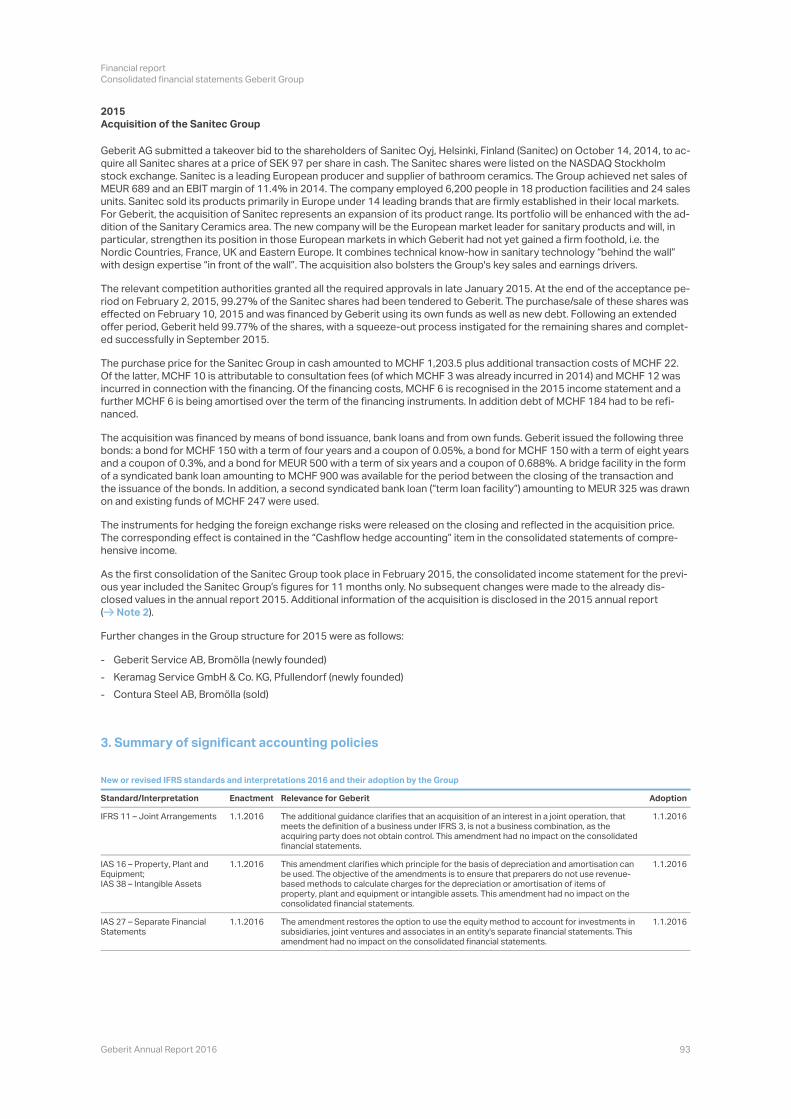
2015Acquisition of the Sanitec Group
Geberit AG submitted a takeover bid to the shareholders of Sanitec Oyj, Helsinki, Finland (Sanitec
quire all Sanitec shares at a price of SEK 97 per share in cash. The Sanitec shares were listed on the NASDAQ Stockholm
stock exchange. Sanitec is a leading European producer and supplier of bathroom ceramics. The Group achieved net sales of
MEUR 689 and an EBIT margin of 11.4% in 2014. The company employed 6,200 people in 18 production facilities and 24 sales
units. Sanitec sold its products primarily in Europe under 14 leading brands that are firmly established in their local markets.
For Geberit, the acquisition of Sanitec
dition of the Sanitary Ceramics area. The new company will be the European market leader for sanitary products and will, in
particular, strengthen its position in those European markets in which Geberit had not yet gained a firm foothold, i.e. the
riod on February 2, 2015, 99.27% of the Sanitec shares had been tendered to Geberit. The purchase/sale of these shares was
effected on February 10, 2015 and was financed by Geberit using its own funds as well as new debt. Following an extended
offer period, Geberit
ed successfully in September 2015.
The purchase price for the Sanitec Group in cash amounted to MCHF 1,203.5 plus additional transaction costs of MCHF 22.
Of the latter, MCHF 10 is attributable to consultation fees (of which MCHF 3 was already incurred in 2014) and MCHF 12 was
incurred in connection with the financing. Of the financing costs, MCHF 6 is recognised in the 2015 income statement and a
further MCHF 6 is being amortised over the term of the financing instruments. In addition debt of MCHF 184
nanced.
The acquisition was financed by means of bond issuance, bank loans and from own funds. Geberit issued the following three
bonds: a bond for MCHF 150 with a term of four years and a coupon of 0.05%, a bond for MCHF 150 with a term of eight years
and a coupon of 0.3%, and a bond for MEUR 500 with a term of six years and a coupon of 0.688%. A bridge facility in the form
of a syndicated bank loan amounting to MCHF 900 was available for the period between the closing of the transaction and
on and existing funds of MCHF 247 were used.
The instruments for hedging the foreign exchange risks were released on the closing and reflected in the acquisition price.
hensive income.
As the first consolidation of the Sanitec
ous year included the Sanitec
closed values in the annual report 2015. Additional information of the acquisition is disclosed in the 2015 annual report
( Note 2).
Further changes in the Group structure for 2015 were as follows:
3. Summary of significant accounting policies
New or revised IFRS standards and interpretations 2016 and their adoption by the Group
Standard/Interpretation Enactment Relevance for Geberit Adoption
1.1.2016 The additional guidance clarifies that an acquisition of an interest in a joint operation, that meets the definition of a business under IFRS 3, is not a business combination, as the acquiring party does not obtain control. This amendment had no impact on the consolidated financial statements.
1.1.2016
Equipment;
1.1.2016 This amendment clarifies which principle for the basis of depreciation and amortisation can be used. The objective of the amendments is to ensure that preparers do not use revenue-based methods to calculate charges for the depreciation or amortisation of items of property, plant and equipment or intangible assets. This amendment had no impact on the consolidated financial statements.
1.1.2016
Statements
1.1.2016 The amendment restores the option to use the equity method to account for investments in subsidiaries, joint ventures and associates in an entity's separate financial statements. This amendment had no impact on the consolidated financial statements.
1.1.2016
Geberit Service AB, Bromölla (newly founded)-
Keramag Service GmbH & Co. KG, Pfullendorf (newly founded)-
Contura Steel AB, Bromölla (sold)-

Financial report
Consolidated financial statements Geberit Group
Geberit Annual Report 2016 94
New or revised IFRS standards and interpretations as from 2017 and their adoption by the Group
Standard/Interpretation Enactment Relevance for Geberit Planned adoption
1.1.2017 These amendments on the recognition of deferred tax assets for unrealised losses clarify how to account for deferred tax assets related to debt instruments measured at fair value. This amendment has no impact on the consolidated financial statements.
1.1.2017
Instruments
1.1.2018 The main characteristics of the new standard are on:1) Classification and measurement of financial instruments: Financial assets are classified and subsequently measured at amortised cost or fair value through income statement depending on the business model followed for managing them and their contractual cash flow characteristics. Classification of financial liabilities remains unchanged.2) Impairment of financial assets: The new impairment model is an expected credit loss (ECL) model which implies both an earlier recognition of credit losses and disclosure of additional forward looking information. A simplified approach is applied for trade receivables or contract assets that do not contain a significant financing component for which the tracking of changes in credit risk is not required but instead the base lifetime expected credit loss at all times is applied.3) Hedge accounting: The new hedge accounting model is less rules-based, aligns hedge accounting more closely with the Group`s risk management practices and enables a wider range of economic hedging strategies to achieve hedge accounting.
The early adoption of the above standard does not have a material impact on the consolidated financial statements.
1.1.2017
Contracts with Customers
1.1.2018 The new standard on the recognition of revenue from contracts with customers is based on a five step approach:1) Identify the contract with the customer2) Identify the separate performance obligations in the contract3) Determine the transaction price4) Allocate the transaction price to separate performance obligations5) Recognise revenue when a performance obligation is satisfied.
Based on a preliminary assessment the Group does not expect any material impact on recognition and measurement of revenue, and is expected to result in additional disclosures.
1.1.2018
Payment
1.1.2018 The amendment clarifies the accounting treatment of:1) The effects of vesting and non-vesting conditions on the measurement of cash-settled
2) Share-based payment transactions with a net settlement feature for withholding tax obligations3) Modifications to the terms and conditions of a share-based payment that changes the classification of the transaction from cash-settled to equity-settled.
This amendment has no impact on the consolidated financial statements.
1.1.2018
1.1.2019 Under current IAS 17 lessees are required to make a distinction between a finance lease (on balance sheet) and an operating lease (off balance sheet). The new standard requires
short-term leases and leases of low-value assets. Under IFRS 16, a contract is, or contains, a lease if the contract conveys the right to control the use of an identified asset for a period of time in exchange for consideration.
These amendments will have an impact on the consolidated financial statements and they are currently under evaluation, e.g. a significant leasing commitment will have to be recognised in the balance sheet.
1.1.2019
Foreign currency translation
nominated in foreign currencies are recorded at the rate of exchange prevailing at the dates of the transaction, or at a rate
change rate differences charged to the income statement. Exchange rate differences related to loans that are part of the net
investment in foreign entities are recorded in
justments.
For the consolidation, assets and liabilities stated in functional currencies other than Swiss francs are translated at the rates
of exchange prevailing at the consolidated balance sheet date. Income and expenses are translated at the average exchange
rates (weighted sales) for the period. Translation gains or losses are recorded in
closed as cumulative translation adjustments.
Cash and cash equivalentsCash and cash equivalents consist of cash on hand, balances with banks and short-term, highly liquid financial investments
with maturities of three months or less at their acquisition date that are readily convertible to known amounts of cash and
which are subject to an insignificant risk of change in value. The carrying amount of cash and cash equivalents approximates
to their fair value due to the short-term maturities of these instruments.
Financial report
Consolidated financial statements Geberit Group
Geberit Annual Report 2016 95
Inventories
prise all directly attributable costs of material and manufacture and other costs incurred in bringing the inventories to their
ing cost is determined using the standard cost formula. Net realisable value corresponds to the estimated selling price in the
ordinary course of business less the estimated costs of completion and the selling costs. Allowances are made for obsolete
and slow-moving inventories.
Property, plant and equipment
Property, plant and equipment are carried at historical or manufacturing costs less accumulated depreciation. Betterment
tion in operating costs is capitalised and depreciated over the remaining useful lives. Depreciation of property, plant and
equipment is calculated using the straight-line method based
ment are charged to the income statement as incurred.
Borrowing costs of all material qualifying assets are capitalised during the construction phase in accordance with IAS 23. A
qualified asset is an asset for which an extensive period (generally more than a year) is required to transform it to its planned
vestment income earned on the temporary investment of these borrowings. If the borrowed funds are part of a general pool,
the amount that can be capitalised must be determined by applying a capitalisation rate to the expenses related to this asset.
If there is any indication for impairment, the actual carrying amount of the asset is compared to its recoverable amount. If the
carrying amount is higher than its estimated recoverable amount, the asset is reduced accordingly and the difference is
charged to the income statement.
Intangible assets and goodwillThe Group records goodwill as the difference between the purchase price and the net assets of the company acquired, both
come statement.
quently measured at cost. Goodwill, trademarks and other intangible assets with an indefinite useful life are not regularly
ness model of the Geberit Group and are therefore used over an indefinite time period, they are assigned an indefinite useful
life. Impairments are recorded immediately as expenses in the consolidated income statements and, in the case of goodwill,
not reversed in subsequent periods. The amortisation of intangible assets with a definite useful life is calculated using the
straight-line method based
Valuation of intangible assets and goodwillIntangible assets with an indefinite useful life and goodwill are tested for impairment at each reporting date, at least. In this
process, the actual carrying amount of the asset is compared with the recoverable amount. If the carrying amount is higher
coverable amount and carrying amount as expense. The valuation is based
ble, on the level of the group of assets for which separately identifiable cashflows exist.
For the impairment tests of intangible assets with an indefinite useful life and goodwill, the Group applies the most recent
business plans (period of four years) and the assumptions therein concerning development of prices, markets and the
ters for the calculation of the recoverable amount. More detailed information is disclosed in Note 11.
Provisions
ucts against defects and accrues provisions for such warranties at the time of sale based
ty costs are charged against the accrued provisions when incurred.
Net salesNet sales are recognised when the risks and rewards are transferred, which normally happens when the products are shipped,
i.e. when they are handed over to the carrier at the ramp of a Geberit logistics centre. Net sales include the invoiced amounts
ly are deducted as well.
ductions recognised on receipt of timely payments.
Financial report
Consolidated financial statements Geberit Group
Geberit Annual Report 2016 96
Marketing expensesAll costs associated with advertising and promoting products are recorded as expenses in the financial period during which
they are incurred.
Taxes
The consolidated financial statements include current income taxes based on the taxable earnings of the Group companies
and are calculated according to national tax rules. Deferred taxes are recorded on temporary differences between the tax
tion of future tax savings related to tax loss carryforwards and other deferred tax assets is not or no longer probable, then the
deferred tax assets are reduced accordingly.
A liability for deferred taxes is recognised only for non-refundable taxes at source and other earning distribution-related taxes
dend policy (see Note 18).
Leasing
fied under finance leasing. Leased property, plant and equipment are capitalised and depreciated over their estimated useful
ating expenses on a straight-line basis and charged directly to the income statement accordingly.
Research and development expendituresThe majority of the expenses are incurred in relation to basic research, product and product range management, customer
penses relate to development costs for new products. If these concern major development projects, they are reviewed at
each balance sheet date in order to verify if the capitalisation criteria of IAS 38.57 are fulfilled. In the case that all criteria are
fulfilled, the expenses are capitalised and amortised over a period of six years (see Note 27).
Retirement benefit plans
The Group manages different employee pension plans structured as both defined benefit and defined contribution plans.
These pension funds are usually governed by the regulations of the countries in which the Group operates.
sion actuaries using the projected unit credit method on the basis of the service years and the expected salary and pension
based on the discount
rate) and any effects of an asset ceiling adjustment. For defined benefit plans with an independent pension fund, the funded
status of the pension fund is included in the consolidated balance sheet. Any surplus is capitalised in compliance with IAS
19.64 and IFRIC 14. The annual net periodic pension costs calculated for defined benefit plans are recognised in the income
statement in the period in which they occur.
For defined contribution plans, the annual costs are calculated as a percentage of the pensionable salaries and are also
charged to the income statement. Except for the contributions, the Group does not have any other future obligations.
Participation plans
Rebates granted to employees when buying Geberit shares under share purchase plans are charged to the income statement
in the year the programmes are offered.
The fair value of the options allotted as part of the management long term incentive and the management share purchase
plan is determined at the grant date and charged on a straight-line basis to personnel expenses over the vesting period. The
values are determined using the binomial model.
Earnings per share
age of the issued ordinary shares less the weighted average number of the treasury shares. For the calculation of diluted
earnings per share, an adjusted number of shares is calculated as the sum of the total of the ordinary shares used to calculate
the earnings per share and the potentially dilutive shares from option programmes. The dilution from option programmes is
determined on the basis of the number of ordinary shares that could have been bought for the amount of the accumulated
difference between the market price and exercise price of the options. The relevant market price used is the average Geberit
share price for the financial year.
ber of ordinary shares.
Financial instruments
counts payable and other payables are carried at amortised cost. The carrying amount of such items virtually corresponds to
their fair value.

Financial report
Consolidated financial statements Geberit Group
Geberit Annual Report 2016 97
Debts are initially recorded at fair value, net of transaction costs, and measured at amortised cost according to the effective
interest rate method. The Group classifies debts as non-current when, at the balance sheet date, it has the unconditional right
to defer settlement for at least 12 months after the balance sheet date.
Derivatives are initially recorded at fair value and subsequently adjusted for fair value changes. The recognition of derivatives
Note 15).
Hedge accounting
Geberit
ing income statement volatility. Changes in the value of instruments designated as fair value hedges are recorded together
with the change in fair value of the underlying item directly in the income statements, net. The effective portion of instruments
designated as cashflow hedges is recognised in
nised in the income statement.
4. Risk assessment and management
GeneralThe Group runs a risk-management system approved by the Board of Directors.
The policy defines a structured process according to which the business risks are systematically managed. In this process,
surements are determined. Each member of management is responsible for the implementation of the risk-management
measures in his area of responsibility. The Board of Directors
sessment and about risk-management actions taken. The permanent observation and control of the risks is a management
trol process. The Geberit internal control system for financial reporting defines in this regard control measures that reduce
the related risks.
Financial risks are monitored by the treasury department of the Geberit Group, which acts in line with the directives of the
treasury policy issued by the Group. Risk management focuses on recognising, analysing and hedging foreign exchange rate,
sures its risks with the value-at-risk method for foreign exchange rate risks and the cashflow-at-risk method for interest rate
risks.
Management of counterparty risks from treasury activities
be relevant to the financial system. Management believes that the risk of losses from the existing contracts is remote.
ment bonds (maximum MCHF 70 per country and usually with terms of less than 12 months). The residual liquid funds are
generally held at banks on a short-term basis. To avoid cluster risks, the value of an investment per third party may not exceed
MCHF 50 (or MCHF 70 for the major Swiss banks). In addition, investments with the same counterparty may not exceed half of
Management of foreign exchange rate riskThe Group generates sales and costs in Switzerland and abroad in foreign currencies. Therefore, exchange rate changes have
tion of profits generated abroad can still substantially influence the consolidated results depending on the level of currency
Any remaining currency risks are measured with the value-at-risk (VaR) method. By using statistical methods, the effect of
sult of the Group is evaluated. The risk is controlled with the key figure (VaR +/- unrealised gains/losses from foreign exchange
positions)/equity. based
change contracts are used as hedging instruments. The limit for the key figure is determined annually and amounts to 0.5%
(PY: 0.5%) of equity for the reporting period.

Financial report
Consolidated financial statements Geberit Group
Geberit Annual Report 2016 98
The following parameters have been used for the calculation of the value-at-risk (VaR):
Model Method Confidence level Holding period
J. P. Morgan Variance-covariance approach 95% 30 days
Foreign exchange rate risk as of December 31:
2016 2015
MCHF MCHF
Value-at-risk +/- unrealised gains/losses 6.3 5.6
Equity 1,635.2 1,482.2
(Value-at-risk +/- unrealised gains/losses)/equity 0.4% 0.4%
Management of interest rate riskBasically, two types of interest rate risk exist:
a) the fair market value risk for financial positions bearing fixed interest rates
b) the interest rate risk for financial positions bearing variable interest rates
sured. The refinancing risk of positions with fixed interest rates is taken into account with the integration of financial positions
bearing fixed interest rates with a maturity under 12 months in the measurement of the interest rate risk.
est rate changes on the cashflow of a financial position is evaluated. The calculation of the CfaR is based on the same model
as the calculation of the value-at-risk regarding the foreign exchange rate risk.
based
ternal limits, it is decided whether any hedging measures have to be taken. The limit is reviewed annually and amounts to a
minimum of 20 for the reporting period (PY: 20).
Interest rate risk as of December 31:
2016 2015
MCHF MCHF
EBITDA 785.2 631.7
Financial result, net + CfaR 9.8 12.7
EBITDA/(Financial result, net + CfaR) 80x 50x
Combined foreign exchange rate and interest rate riskThe following table shows the combined foreign exchange rate and interest rate risk according to the calculation method of
the value-at-risk model, and includes all foreign exchange rate risk and interest rate risk positions and instruments described
above. Foreign exchange rate risks and interest rate risks are monitored with the key figures as previously mentioned.
2016 2015
MCHF MCHF
Combined foreign exchange rate and interest rate risk 9.7 19.1
Management of liquidity riskLiquid funds, including the committed unused credit lines, must be available in order to cover future cash drains in due time
amounting to a certain liquidity reserve. This reserve considers interest and amortisation payments and capital expenditures
and investments in net working capital. At the balance sheet date, the liquid funds including the committed unused credit
lines exceeded the defined liquidity reserve by MCHF 561.2 (PY: MCHF 516.8).
Management of credit risk
Major credit risks to the Group mainly result from the sale of its products (debtor risk). Products are sold throughout the world,
Financial report
Consolidated financial statements Geberit Group
Geberit Annual Report 2016 99
The maximum credit risk resulting from receivables and other financial assets basically corresponds to the net carrying
amount of the asset. The balance of trade receivables at year-end is not representative because of the low sales volume in
December. In 2016, the average balance of trade receivables is about 141% (PY: 176%) of the amount at year-end.
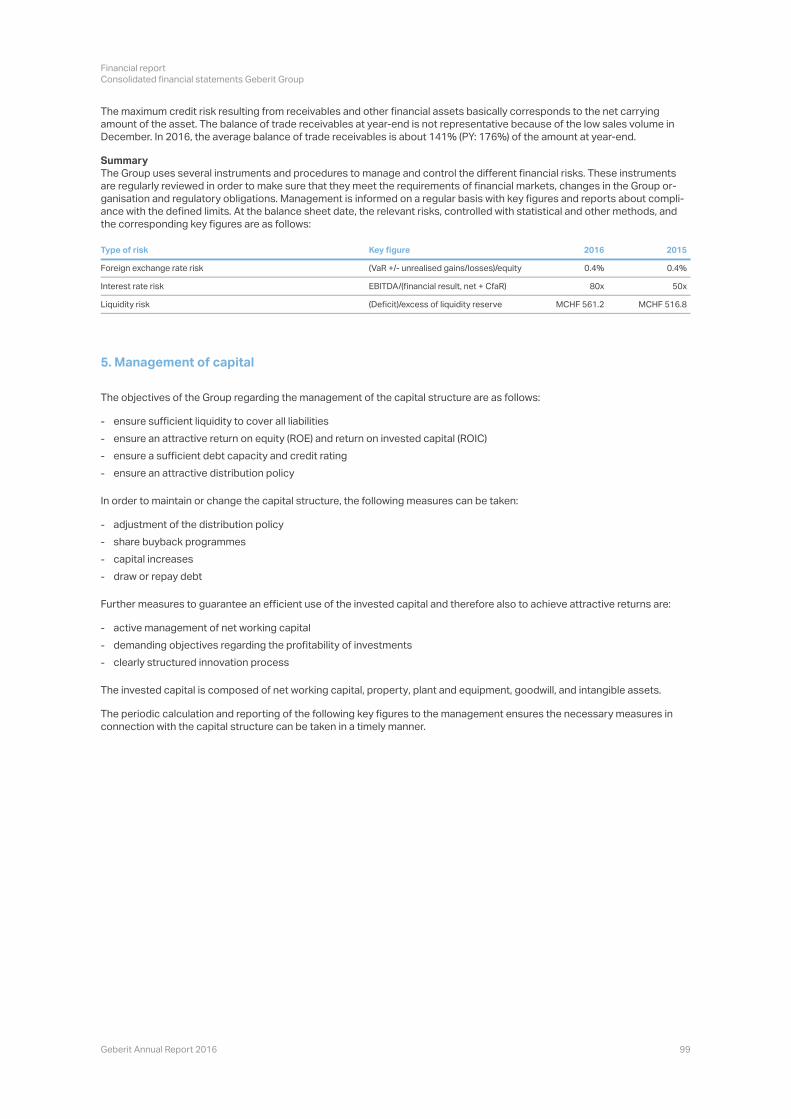
Summary
The Group uses several instruments and procedures to manage and control the different financial risks. These instruments
ance with the defined limits. At the balance sheet date, the relevant risks, controlled with statistical and other methods, and
the corresponding key figures are as follows:
Type of risk Key figure 2016 2015
Foreign exchange rate risk (VaR +/- unrealised gains/losses)/equity 0.4% 0.4%
Interest rate risk EBITDA/(financial result, net + CfaR) 80x 50x
Liquidity risk (Deficit)/excess of liquidity reserve MCHF 561.2 MCHF 516.8
5. Management of capital
The objectives of the Group regarding the management of the capital structure are as follows:
In order to maintain or change the capital structure, the following measures can be taken:
Further measures to guarantee an efficient use of the invested capital and therefore also to achieve attractive returns are:
The invested capital is composed of net working capital, property, plant and equipment, goodwill, and intangible assets.
The periodic calculation and reporting of the following key figures to the management ensures the necessary measures in
connection with the capital structure can be taken in a timely manner.
ensure sufficient liquidity to cover all liabilities-
ensure an attractive return on equity (ROE) and return on invested capital (ROIC)-
ensure a sufficient debt capacity and credit rating-
ensure an attractive distribution policy-
adjustment of the distribution policy-
share buyback programmes-
capital increases-
draw or repay debt-
active management of net working capital-
demanding objectives regarding the profitability of investments-
clearly structured innovation process-
Financial report
Consolidated financial statements Geberit Group
Geberit Annual Report 2016 100
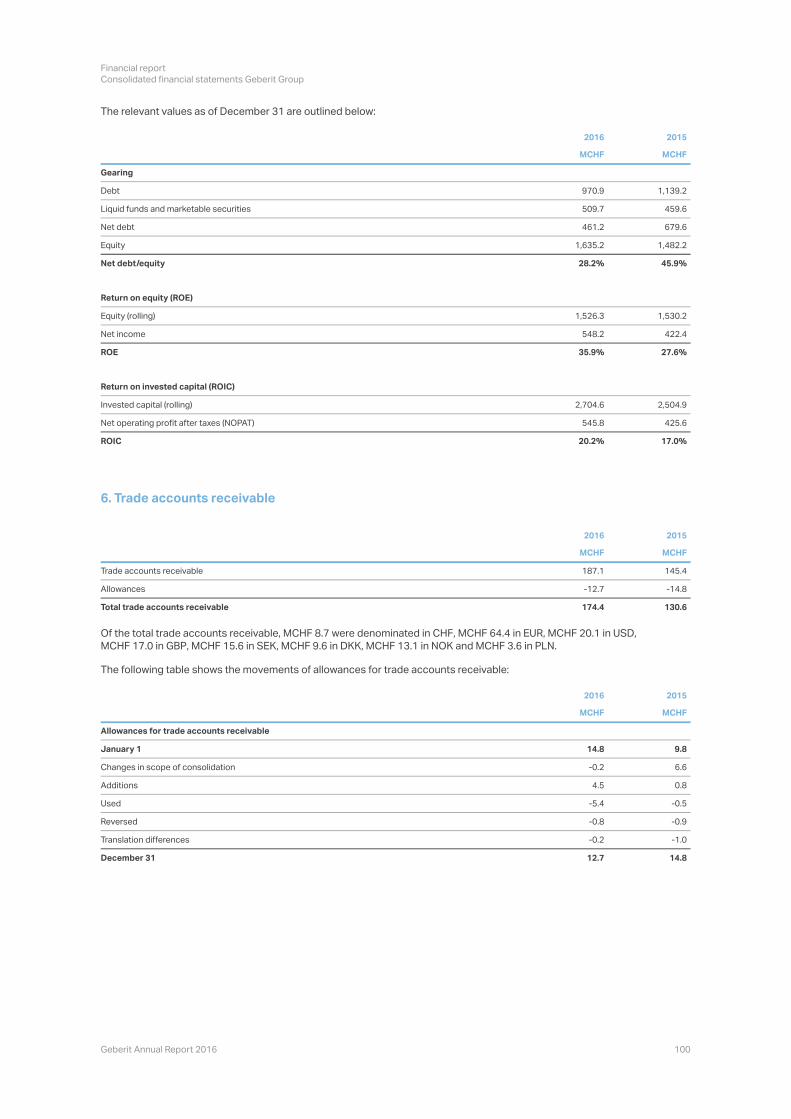
The relevant values as of December 31 are outlined below:
2016 2015
MCHF MCHF
Gearing
Debt 970.9 1,139.2
Liquid funds and marketable securities 509.7 459.6
Net debt 461.2 679.6
Equity 1,635.2 1,482.2
Net debt/equity 28.2% 45.9%
Return on equity (ROE)
Equity (rolling) 1,526.3 1,530.2
Net income 548.2 422.4
ROE 35.9% 27.6%
Return on invested capital (ROIC)
Invested capital (rolling) 2,704.6 2,504.9
Net operating profit after taxes (NOPAT) 545.8 425.6
ROIC 20.2% 17.0%
6. Trade accounts receivable
2016 2015
MCHF MCHF
Trade accounts receivable 187.1 145.4
Allowances -12.7 -14.8
Total trade accounts receivable 174.4 130.6
Of the total trade accounts receivable, MCHF 8.7 were denominated in CHF, MCHF 64.4 in EUR, MCHF 20.1 in USD,
MCHF 17.0
The following table shows the movements of allowances for trade accounts receivable:
2016 2015
MCHF MCHF
Allowances for trade accounts receivable
January 1 14.8 9.8
Changes in scope of consolidation -0.2 6.6
Additions 4.5 0.8
Used -5.4 -0.5
Reversed -0.8 -0.9
Translation differences -0.2 -1.0
December 31 12.7 14.8
Financial report
Consolidated financial statements Geberit Group
Geberit Annual Report 2016 101
2016 2015
MCHF MCHF
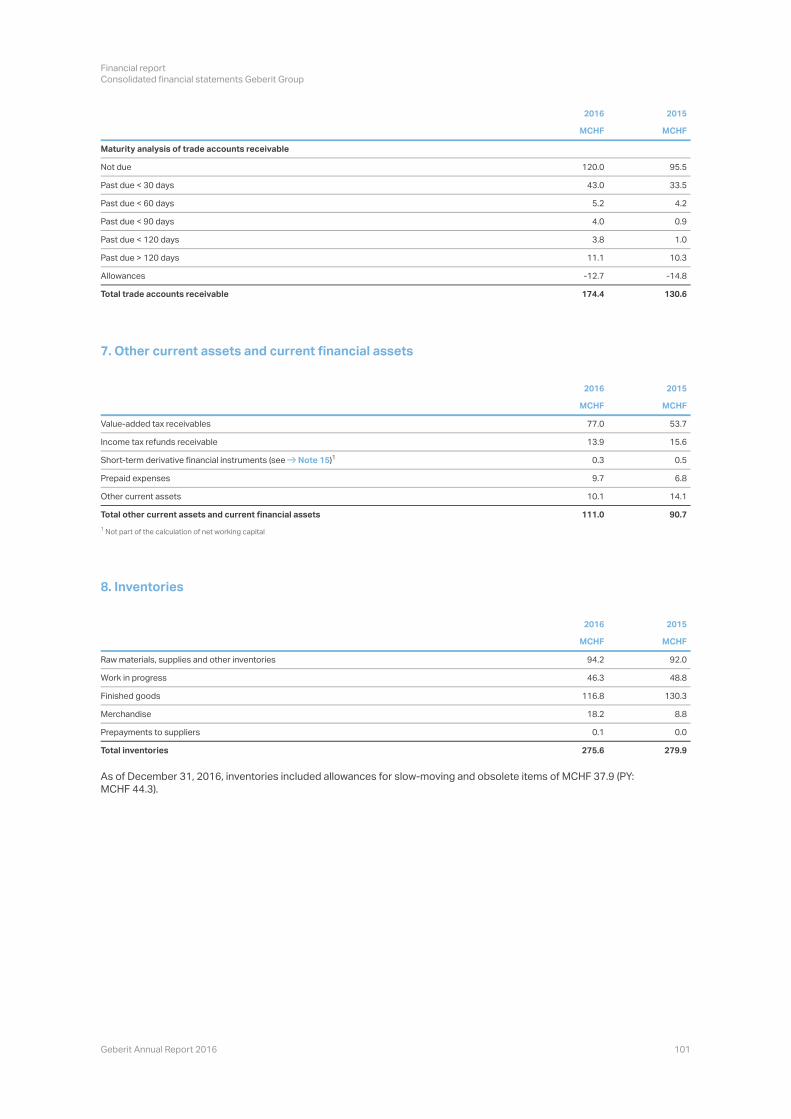
Maturity analysis of trade accounts receivable
Not due 120.0 95.5
Past due < 30 days 43.0 33.5
Past due < 60 days 5.2 4.2
Past due < 90 days 4.0 0.9
Past due < 120 days 3.8 1.0
Past due > 120 days 11.1 10.3
Allowances -12.7 -14.8
Total trade accounts receivable 174.4 130.6
7. Other current assets and current financial assets
2016 2015
MCHF MCHF
Value-added tax receivables 77.0 53.7
Income tax refunds receivable 13.9 15.6
Short-term derivative financial instruments (see Note 15) 0.3 0.5
Prepaid expenses 9.7 6.8
Other current assets 10.1 14.1
Total other current assets and current financial assets 111.0 90.7
Not part of the calculation of net working capital
8. Inventories
2016 2015
MCHF MCHF
Raw materials, supplies and other inventories 94.2 92.0
Work in progress 46.3 48.8
Finished goods 116.8 130.3
Merchandise 18.2 8.8
Prepayments to suppliers 0.1 0.0
Total inventories 275.6 279.9
As of December 31, 2016, inventories included allowances for slow-moving and obsolete items of MCHF 37.9 (PY:
MCHF 44.3).
1
1
Financial report
Consolidated financial statements Geberit Group
Geberit Annual Report 2016 102
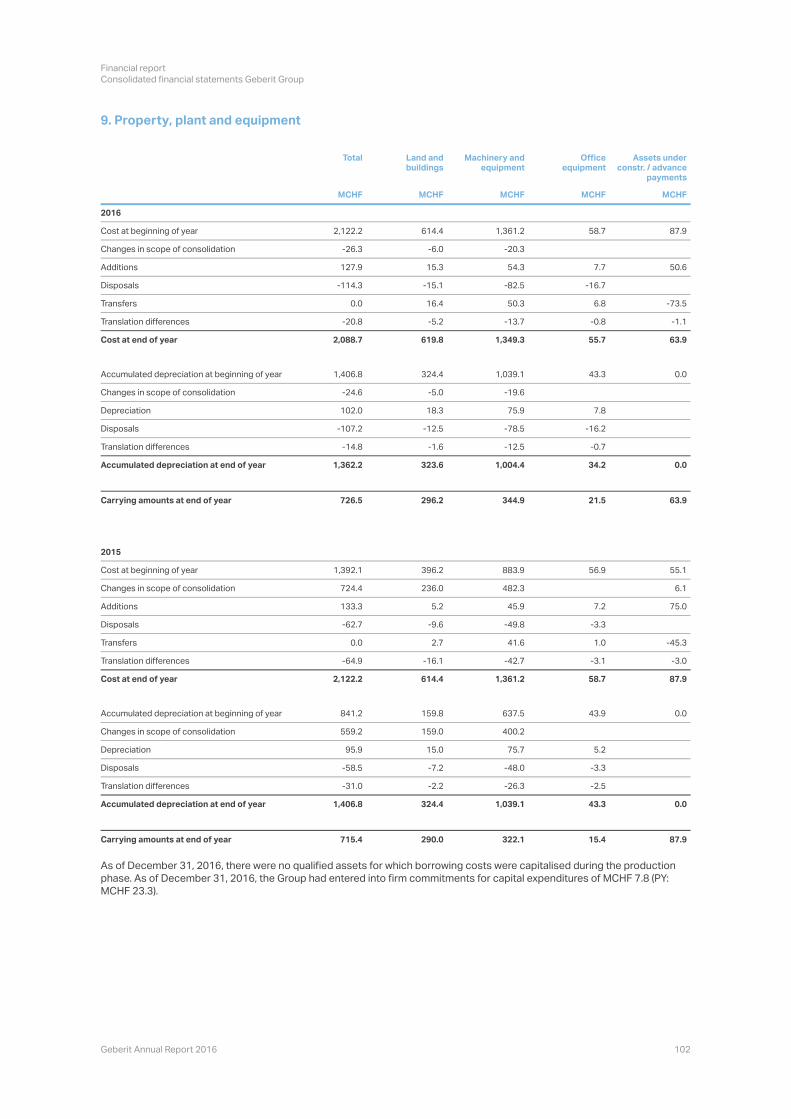
9. Property, plant and equipment
Total Land and buildings
Machinery and equipment
Officeequipment
Assets under constr. / advance
payments
MCHF MCHF MCHF MCHF MCHF
2016
Cost at beginning of year 2,122.2 614.4 1,361.2 58.7 87.9
Changes in scope of consolidation -26.3 -6.0 -20.3
Additions 127.9 15.3 54.3 7.7 50.6
Disposals -114.3 -15.1 -82.5 -16.7
Transfers 0.0 16.4 50.3 6.8 -73.5
Translation differences -20.8 -5.2 -13.7 -0.8 -1.1
Cost at end of year 2,088.7 619.8 1,349.3 55.7 63.9
Accumulated depreciation at beginning of year 1,406.8 324.4 1,039.1 43.3 0.0
Changes in scope of consolidation -24.6 -5.0 -19.6
Depreciation 102.0 18.3 75.9 7.8
Disposals -107.2 -12.5 -78.5 -16.2
Translation differences -14.8 -1.6 -12.5 -0.7
Accumulated depreciation at end of year 1,362.2 323.6 1,004.4 34.2 0.0
Carrying amounts at end of year 726.5 296.2 344.9 21.5 63.9
2015
Cost at beginning of year 1,392.1 396.2 883.9 56.9 55.1
Changes in scope of consolidation 724.4 236.0 482.3 6.1
Additions 133.3 5.2 45.9 7.2 75.0
Disposals -62.7 -9.6 -49.8 -3.3
Transfers 0.0 2.7 41.6 1.0 -45.3
Translation differences -64.9 -16.1 -42.7 -3.1 -3.0
Cost at end of year 2,122.2 614.4 1,361.2 58.7 87.9
Accumulated depreciation at beginning of year 841.2 159.8 637.5 43.9 0.0
Changes in scope of consolidation 559.2 159.0 400.2
Depreciation 95.9 15.0 75.7 5.2
Disposals -58.5 -7.2 -48.0 -3.3
Translation differences -31.0 -2.2 -26.3 -2.5
Accumulated depreciation at end of year 1,406.8 324.4 1,039.1 43.3 0.0
Carrying amounts at end of year 715.4 290.0 322.1 15.4 87.9
As of December 31, 2016, there were no qualified assets for which borrowing costs were capitalised during the production
phase. As of December 31, 2016, the Group had entered into firm commitments for capital expenditures of MCHF 7.8 (PY:
MCHF 23.3).
Financial report
Consolidated financial statements Geberit Group
Geberit Annual Report 2016 103
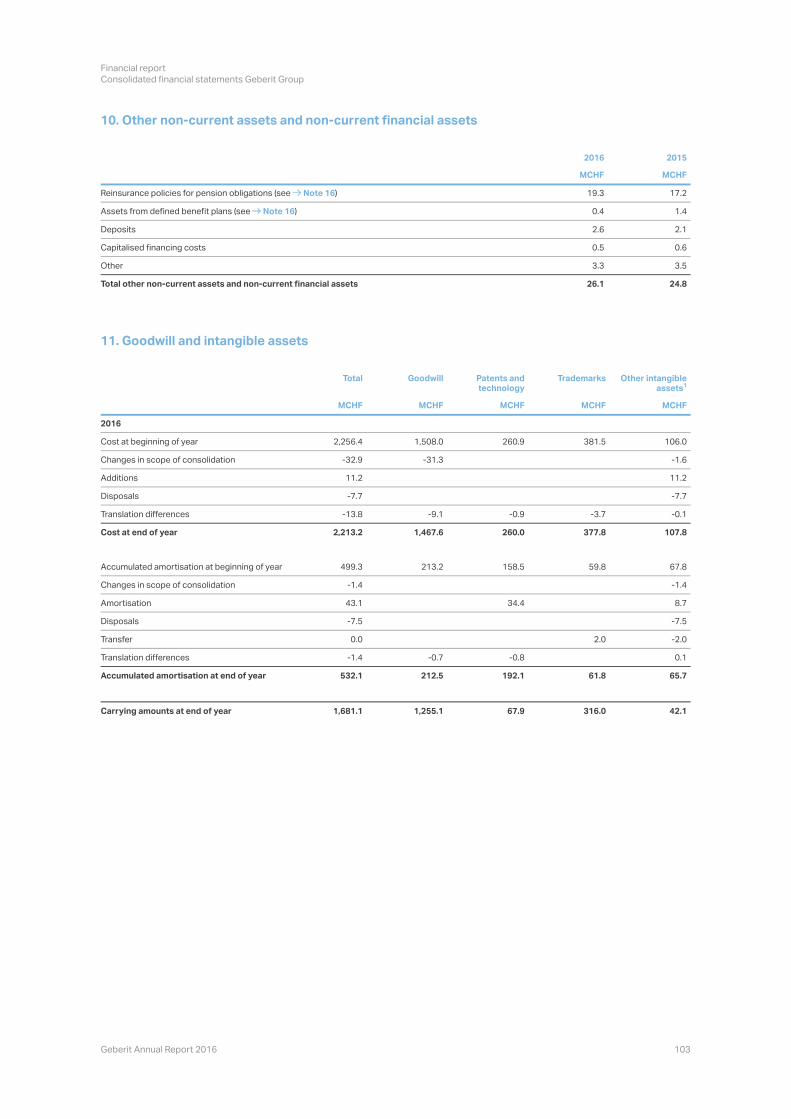
10. Other non-current assets and non-current financial assets
2016 2015
MCHF MCHF
Reinsurance policies for pension obligations (see Note 16) 19.3 17.2
Assets from defined benefit plans (see Note 16) 0.4 1.4
Deposits 2.6 2.1
Capitalised financing costs 0.5 0.6
Other 3.3 3.5
Total other non-current assets and non-current financial assets 26.1 24.8
11. Goodwill and intangible assets
Total Goodwill Patents and technology
Trademarks Other intangible assets
MCHF MCHF MCHF MCHF MCHF
2016
Cost at beginning of year 2,256.4 1,508.0 260.9 381.5 106.0
Changes in scope of consolidation -32.9 -31.3 -1.6
Additions 11.2 11.2
Disposals -7.7 -7.7
Translation differences -13.8 -9.1 -0.9 -3.7 -0.1
Cost at end of year 2,213.2 1,467.6 260.0 377.8 107.8
Accumulated amortisation at beginning of year 499.3 213.2 158.5 59.8 67.8
Changes in scope of consolidation -1.4 -1.4
Amortisation 43.1 34.4 8.7
Disposals -7.5 -7.5
Transfer 0.0 2.0 -2.0
Translation differences -1.4 -0.7 -0.8 0.1
Accumulated amortisation at end of year 532.1 212.5 192.1 61.8 65.7
Carrying amounts at end of year 1,681.1 1,255.1 67.9 316.0 42.1
1
Financial report
Consolidated financial statements Geberit Group
Geberit Annual Report 2016 104
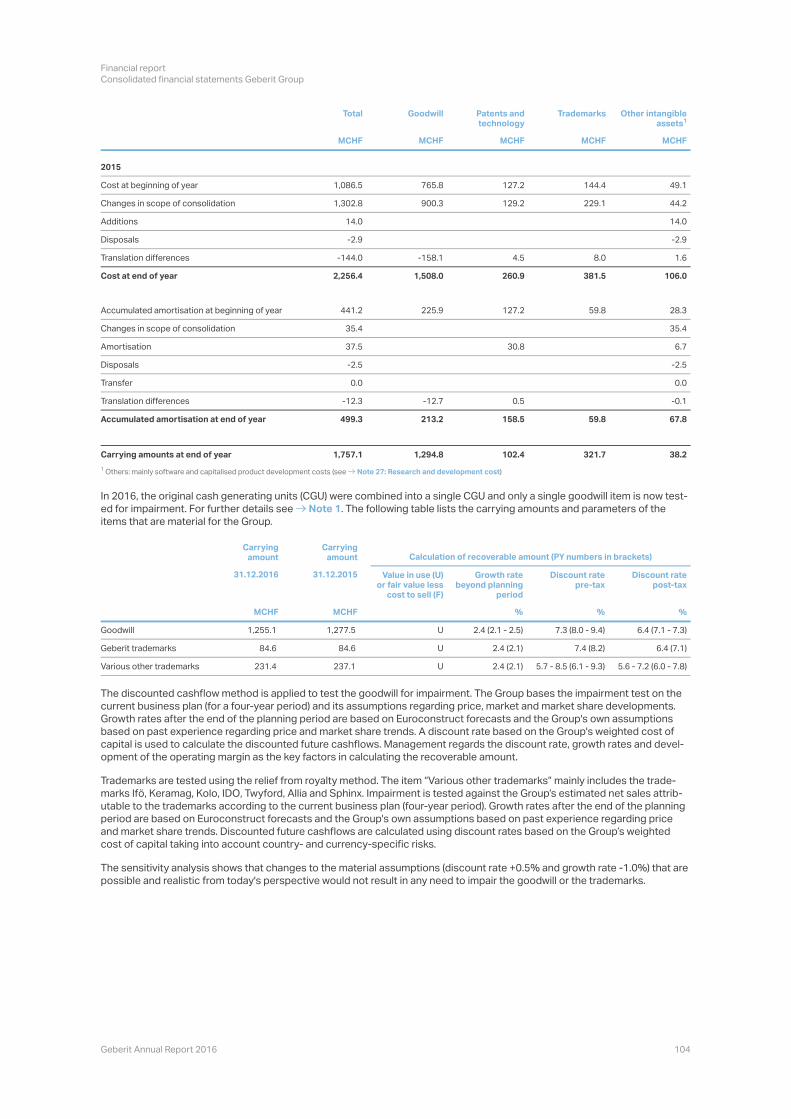
Total Goodwill Patents and technology
Trademarks Other intangible assets
MCHF MCHF MCHF MCHF MCHF
2015
Cost at beginning of year 1,086.5 765.8 127.2 144.4 49.1
Changes in scope of consolidation 1,302.8 900.3 129.2 229.1 44.2
Additions 14.0 14.0
Disposals -2.9 -2.9
Translation differences -144.0 -158.1 4.5 8.0 1.6
Cost at end of year 2,256.4 1,508.0 260.9 381.5 106.0
Accumulated amortisation at beginning of year 441.2 225.9 127.2 59.8 28.3
Changes in scope of consolidation 35.4 35.4
Amortisation 37.5 30.8 6.7
Disposals -2.5 -2.5
Transfer 0.0 0.0
Translation differences -12.3 -12.7 0.5 -0.1
Accumulated amortisation at end of year 499.3 213.2 158.5 59.8 67.8
Carrying amounts at end of year 1,757.1 1,294.8 102.4 321.7 38.2
Others: mainly software and capitalised product development costs (see Note 27: Research and development cost)
ed for impairment. For further details see Note 1. The following table lists the carrying amounts and parameters of the
items that are material for the Group.
Carryingamount
Carryingamount Calculation of recoverable amount (PY numbers in brackets)
31.12.2016 31.12.2015 Value in use (U) or fair value less
cost to sell (F)
Growth rate beyond planning
period
Discount rate pre-tax
Discount rate post-tax
MCHF MCHF % % %
Goodwill U 2.4 (2.1 - 2.5) 7.3 (8.0 - 9.4) 6.4 (7.1 - 7.3)
Geberit trademarks U 2.4 (2.1) 7.4 (8.2) 6.4 (7.1)
Various other trademarks U 2.4 (2.1) 5.7 - 8.5 (6.1 - 9.3) 5.6 - 7.2 (6.0 - 7.8)
The discounted cashflow method is applied to test the goodwill for impairment. The Group bases the impairment test on the
current business plan (for a four-year period) and its assumptions regarding price, market and market share developments.
Growth rates after the end of the planning period are based on Euroconstruct forecasts and the Group's own assumptions
based on past experience regarding price and market share trends. A discount rate based on the Group's weighted cost of
opment of the operating margin as the key factors in calculating the recoverable amount.
utable to the trademarks according to the current business plan (four-year period). Growth rates after the end of the planning
period are based on Euroconstruct forecasts and the Group's own assumptions based on past experience regarding price
and market share trends. Discounted future cashflows are calculated using discount rates based
cost of capital taking into account country- and currency-specific risks.
The sensitivity analysis shows that changes to the material assumptions (discount rate +0.5% and growth rate -1.0%) that are
possible and realistic from today's perspective would not result in any need to impair the goodwill or the trademarks.
1
1
Financial report
Consolidated financial statements Geberit Group
Geberit Annual Report 2016 105
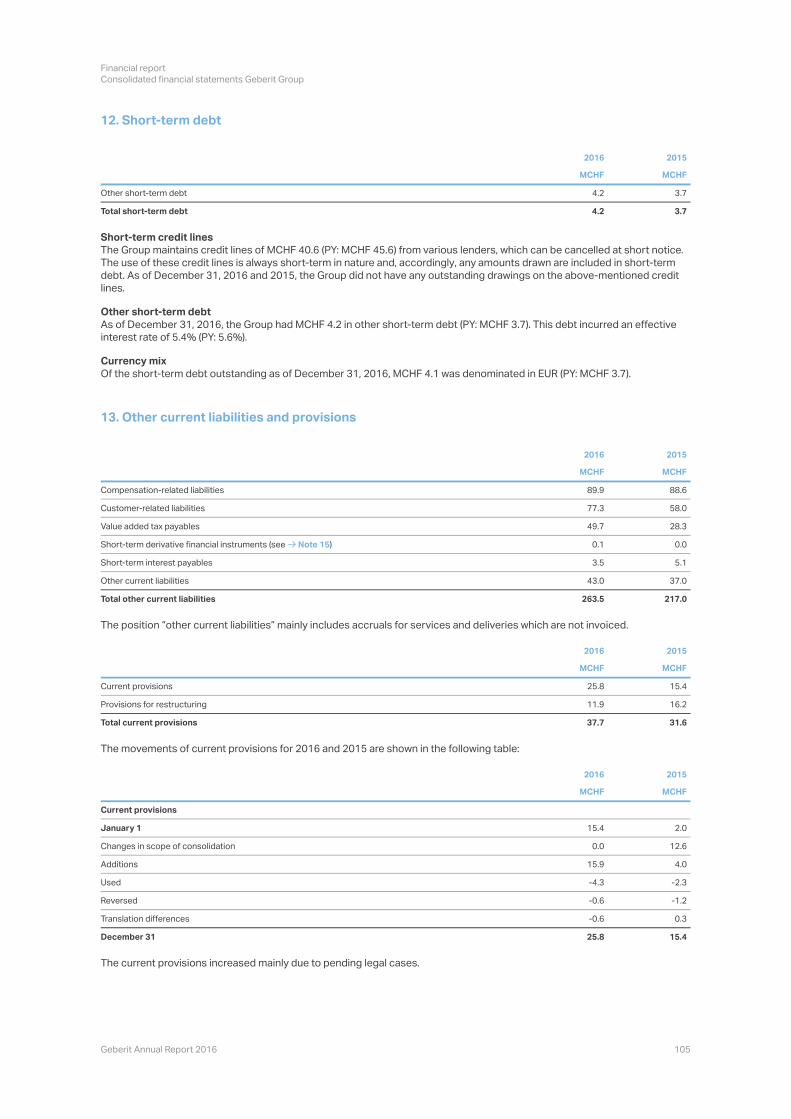
12. Short-term debt
2016 2015
MCHF MCHF
Other short-term debt 4.2 3.7
Total short-term debt 4.2 3.7
Short-term credit lines
The Group maintains credit lines of MCHF 40.6 (PY: MCHF 45.6) from various lenders, which can be cancelled at short notice.
The use of these credit lines is always short-term in nature and, accordingly, any amounts drawn are included in short-term
debt. As of December 31, 2016 and 2015, the Group did not have any outstanding drawings on the above-mentioned credit
lines.
Other short-term debtAs of December 31, 2016, the Group had MCHF 4.2
interest rate of 5.4% (PY: 5.6%).
Currency mix
Of the short-term debt outstanding as of December 31, 2016, MCHF 4.1 was denominated in EUR (PY: MCHF 3.7).
13. Other current liabilities and provisions
2016 2015
MCHF MCHF
Compensation-related liabilities 89.9 88.6
Customer-related liabilities 77.3 58.0
Value added tax payables 49.7 28.3
Short-term derivative financial instruments (see Note 15) 0.1 0.0
Short-term interest payables 3.5 5.1
Other current liabilities 43.0 37.0
Total other current liabilities 263.5 217.0
2016 2015
MCHF MCHF
Current provisions 25.8 15.4
Provisions for restructuring 11.9 16.2
Total current provisions 37.7 31.6
The movements of current provisions for 2016 and 2015 are shown in the following table:
2016 2015
MCHF MCHF
Current provisions
January 1 15.4 2.0
Changes in scope of consolidation 0.0 12.6
Additions 15.9 4.0
Used -4.3 -2.3
Reversed -0.6 -1.2
Translation differences -0.6 0.3
December 31 25.8 15.4
The current provisions increased mainly due to pending legal cases.
Financial report
Consolidated financial statements Geberit Group
Geberit Annual Report 2016 106
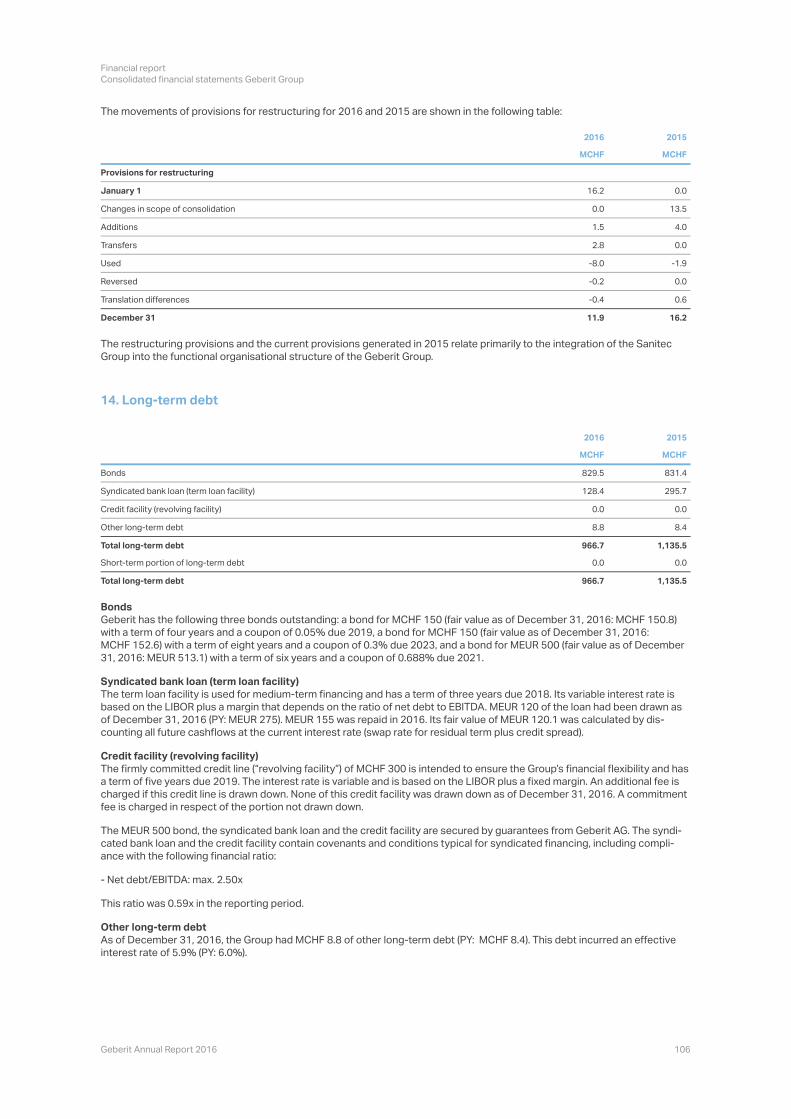
The movements of provisions for restructuring for 2016 and 2015 are shown in the following table:
2016 2015
MCHF MCHF
Provisions for restructuring
January 1 16.2 0.0
Changes in scope of consolidation 0.0 13.5
Additions 1.5 4.0
Transfers 2.8 0.0
Used -8.0 -1.9
Reversed -0.2 0.0
Translation differences -0.4 0.6
December 31 11.9 16.2
The restructuring provisions and the current provisions generated in 2015 relate primarily to the integration of the Sanitec
Group into the functional organisational structure of the Geberit Group.
14. Long-term debt
2016 2015
MCHF MCHF
Bonds 829.5 831.4
Syndicated bank loan (term loan facility) 128.4 295.7
Credit facility (revolving facility) 0.0 0.0
Other long-term debt 8.8 8.4
Total long-term debt 966.7 1,135.5
Short-term portion of long-term debt 0.0 0.0
Total long-term debt 966.7 1,135.5
BondsGeberit has the following three bonds outstanding: a bond for MCHF 150 (fair value as of December 31, 2016: MCHF 150.8)
with a term of four years and a coupon of 0.05% due 2019, a bond for MCHF 150 (fair value as of December 31, 2016:
MCHF 152.6) with a term of eight years and a coupon of 0.3% due 2023, and a bond for MEUR 500 (fair value as of December
31, 2016: MEUR 513.1) with a term of six years and a coupon of 0.688% due 2021.
Syndicated bank loan (term loan facility)The term loan facility is used for medium-term financing and has a term of three years due 2018. Its variable interest rate is
based on the LIBOR plus a margin that depends on the ratio of net debt to EBITDA. MEUR 120 of the loan had been drawn as
counting all future cashflows at the current interest rate (swap rate for residual term plus credit spread).
Credit facility (revolving facility)
MCHF 300
a term of five years due 2019. The interest rate is variable and is based on the LIBOR plus a fixed margin. An additional fee is
charged if this credit line is drawn down. None of this credit facility was drawn down as of December 31, 2016. A commitment
fee is charged in respect of the portion not drawn down.
The MEUR 500 bond, the syndicated bank loan and the credit facility are secured by guarantees from Geberit
ance with the following financial ratio:
- Net debt/EBITDA: max. 2.50x
This ratio was 0.59x in the reporting period.
Other long-term debt
As of December 31, 2016, the Group had MCHF 8.8 MCHF 8.4). This debt incurred an effective
interest rate of 5.9% (PY: 6.0%).
Financial report
Consolidated financial statements Geberit Group
Geberit Annual Report 2016 107
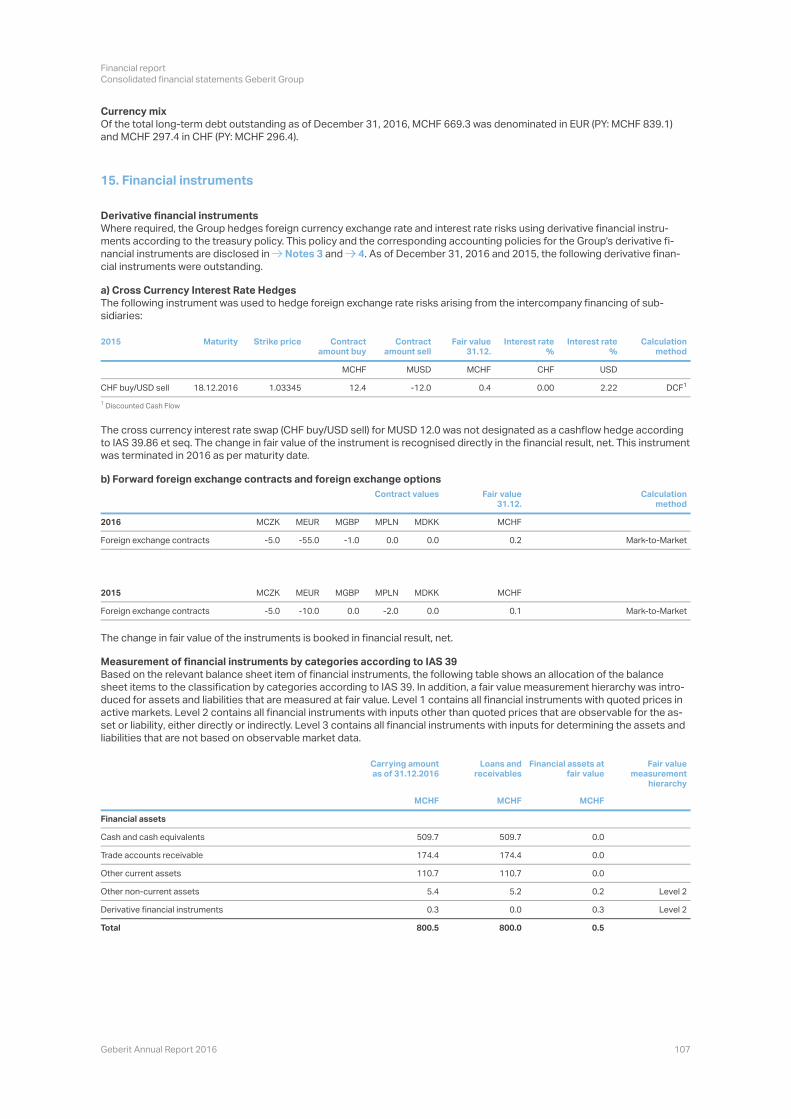
Currency mixOf the total long-term debt outstanding as of December 31, 2016, MCHF 669.3 was denominated in EUR (PY: MCHF 839.1)
and MCHF 297.4 in CHF (PY: MCHF 296.4).
15. Financial instruments
Derivative financial instruments
nancial instruments are disclosed in Notes 3 and 4
cial instruments were outstanding.
a) Cross Currency Interest Rate Hedges
sidiaries:
2015 Maturity Strike price Contract amount buy
Contract amount sell
Fair value 31.12.
Interest rate %
Interest rate %
Calculation method
MCHF MUSD MCHF CHF USD
CHF buy/USD sell 18.12.2016 1.03345 12.4 -12.0 0.4 0.00 2.22 DCF
Discounted Cash Flow
The cross currency interest rate swap (CHF buy/USD sell) for MUSD 12.0 was not designated as a cashflow hedge according
to IAS 39.86 et seq. The change in fair value of the instrument is recognised directly in the financial result, net. This instrument
was terminated in 2016 as per maturity date.
b) Forward foreign exchange contracts and foreign exchange options
Contract values Fair value31.12.
Calculation method
2016 MCZK MEUR MGBP MPLN MDKK MCHF
Foreign exchange contracts -5.0 -55.0 -1.0 0.0 0.0 0.2 Mark-to-Market
2015 MCZK MEUR MGBP MPLN MDKK MCHF
Foreign exchange contracts -5.0 -10.0 0.0 -2.0 0.0 0.1 Mark-to-Market
The change in fair value of the instruments is booked in financial result, net.
Measurement of financial instruments by categories according to IAS 39
Based on the relevant balance sheet item of financial instruments, the following table shows an allocation of the balance
duced for assets and liabilities that are measured at fair value. Level 1 contains all financial instruments with quoted prices in
set or liability, either directly or indirectly. Level 3 contains all financial instruments with inputs for determining the assets and
liabilities that are not based on observable market data.
Carrying amount as of 31.12.2016
Loans and receivables
Financial assets at fair value
Fair value measurement
hierarchy
MCHF MCHF MCHF
Financial assets
Cash and cash equivalents 509.7 509.7 0.0
Trade accounts receivable 174.4 174.4 0.0
Other current assets 110.7 110.7 0.0
Other non-current assets 5.4 5.2 0.2 Level 2
Derivative financial instruments 0.3 0.0 0.3 Level 2
Total 800.5 800.0 0.5
1
1
Financial report
Consolidated financial statements Geberit Group
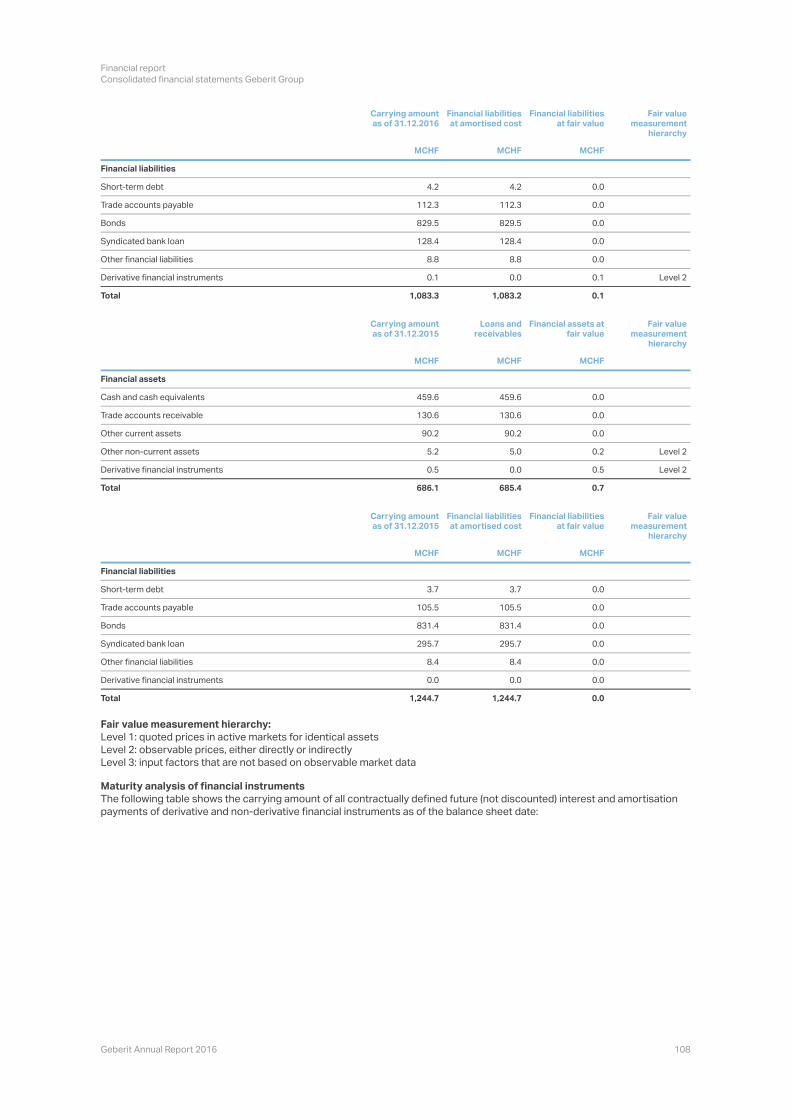
Geberit Annual Report 2016 108
Carrying amount as of 31.12.2016
Financial liabilities at amortised cost
Financial liabilities at fair value
Fair value measurement
hierarchy
MCHF MCHF MCHF
Financial liabilities
Short-term debt 4.2 4.2 0.0
Trade accounts payable 112.3 112.3 0.0
Bonds 829.5 829.5 0.0
Syndicated bank loan 128.4 128.4 0.0
Other financial liabilities 8.8 8.8 0.0
Derivative financial instruments 0.1 0.0 0.1 Level 2
Total 1,083.3 1,083.2 0.1
Carrying amount as of 31.12.2015
Loans and receivables
Financial assets at fair value
Fair value measurement
hierarchy
MCHF MCHF MCHF
Financial assets
Cash and cash equivalents 459.6 459.6 0.0
Trade accounts receivable 130.6 130.6 0.0
Other current assets 90.2 90.2 0.0
Other non-current assets 5.2 5.0 0.2 Level 2
Derivative financial instruments 0.5 0.0 0.5 Level 2
Total 686.1 685.4 0.7
Carrying amount as of 31.12.2015
Financial liabilities at amortised cost
Financial liabilities at fair value
Fair value measurement
hierarchy
MCHF MCHF MCHF
Financial liabilities
Short-term debt 3.7 3.7 0.0
Trade accounts payable 105.5 105.5 0.0
Bonds 831.4 831.4 0.0
Syndicated bank loan 295.7 295.7 0.0
Other financial liabilities 8.4 8.4 0.0
Derivative financial instruments 0.0 0.0 0.0
Total 1,244.7 1,244.7 0.0
Fair value measurement hierarchy:Level 1: quoted prices in active markets for identical assets
Level 2: observable prices, either directly or indirectly
Level 3: input factors that are not based on observable market data
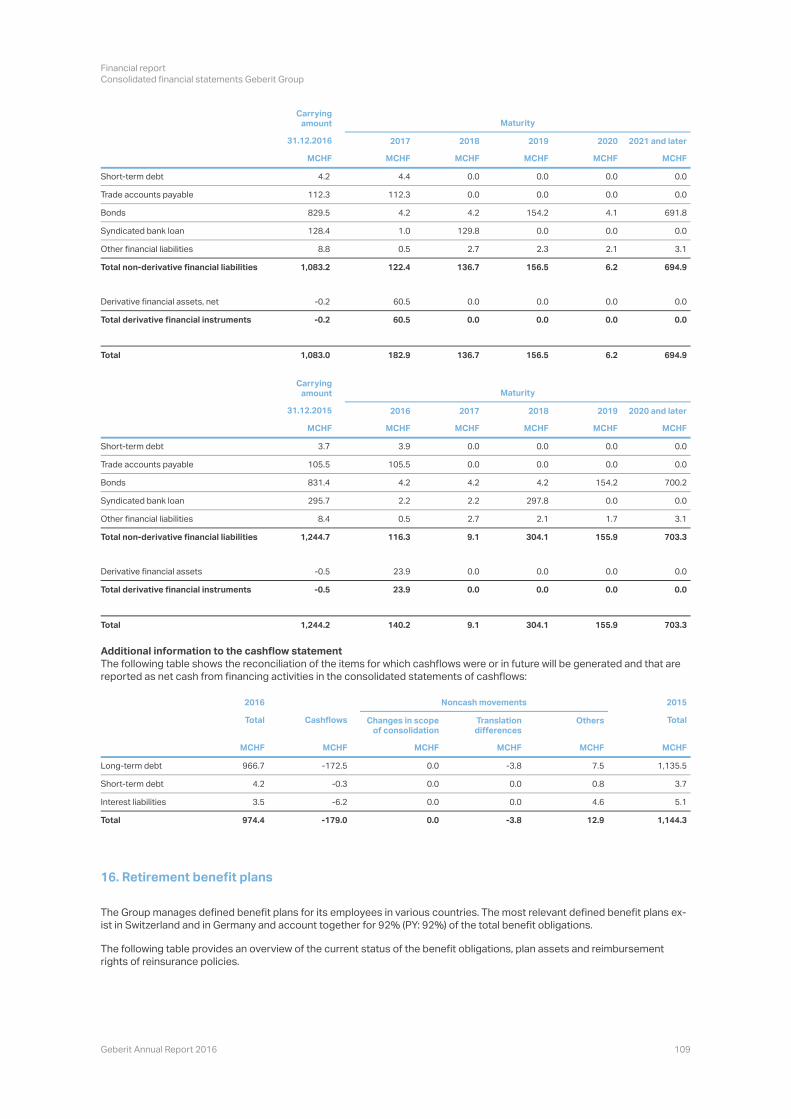
Maturity analysis of financial instrumentsThe following table shows the carrying amount of all contractually defined future (not discounted) interest and amortisation
payments of derivative and non-derivative financial instruments as of the balance sheet date:
Financial report
Consolidated financial statements Geberit Group
Geberit Annual Report 2016 109
Carrying amount Maturity
31.12.2016 2017 2018 2019 2020 2021 and later
MCHF MCHF MCHF MCHF MCHF MCHF
Short-term debt 4.4 0.0 0.0 0.0 0.0
Trade accounts payable 112.3 0.0 0.0 0.0 0.0
Bonds 4.2 4.2 154.2 4.1 691.8
Syndicated bank loan 1.0 129.8 0.0 0.0 0.0
Other financial liabilities 0.5 2.7 2.3 2.1 3.1
Total non-derivative financial liabilities 1,083.2 122.4 136.7 156.5 6.2 694.9
Derivative financial assets, net 60.5 0.0 0.0 0.0 0.0
Total derivative financial instruments -0.2 60.5 0.0 0.0 0.0 0.0
Total 1,083.0 182.9 136.7 156.5 6.2 694.9
Carrying amount Maturity
31.12.2015 2016 2017 2018 2019 2020 and later
MCHF MCHF MCHF MCHF MCHF MCHF
Short-term debt 3.9 0.0 0.0 0.0 0.0
Trade accounts payable 105.5 0.0 0.0 0.0 0.0
Bonds 4.2 4.2 4.2 154.2 700.2
Syndicated bank loan 2.2 2.2 297.8 0.0 0.0
Other financial liabilities 0.5 2.7 2.1 1.7 3.1
Total non-derivative financial liabilities 1,244.7 116.3 9.1 304.1 155.9 703.3
Derivative financial assets 23.9 0.0 0.0 0.0 0.0
Total derivative financial instruments -0.5 23.9 0.0 0.0 0.0 0.0
Total 1,244.2 140.2 9.1 304.1 155.9 703.3
Additional information to the cashflow statementThe following table shows the reconciliation of the items for which cashflows were or in future will be generated and that are
reported as net cash from financing activities in the consolidated statements of cashflows:
2016 Noncash movements 2015
Total Cashflows Changes in scope of consolidation
Translation differences
Others Total
MCHF MCHF MCHF MCHF MCHF MCHF
Long-term debt 966.7 -172.5 0.0 -3.8 7.5 1,135.5
Short-term debt 4.2 -0.3 0.0 0.0 0.8 3.7
Interest liabilities 3.5 -6.2 0.0 0.0 4.6 5.1
Total 974.4 -179.0 0.0 -3.8 12.9 1,144.3
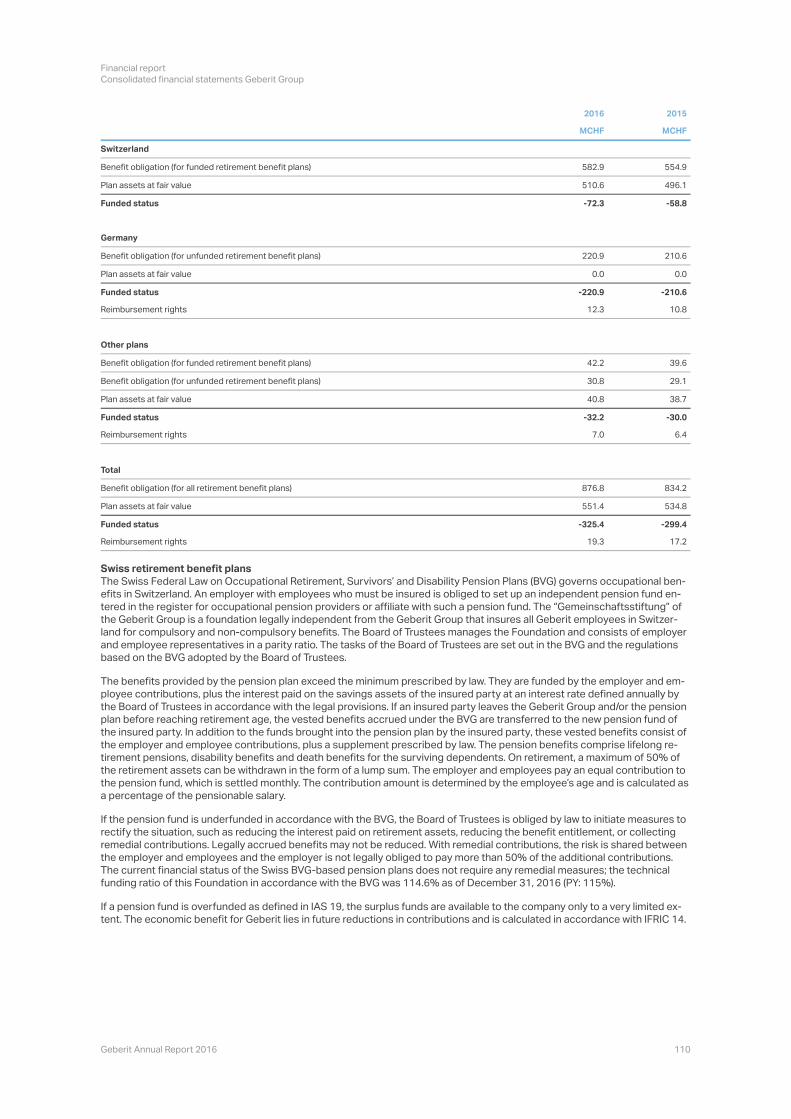
16. Retirement benefit plans
ist in Switzerland and in Germany and account together for 92% (PY: 92%) of the total benefit obligations.
The following table provides an overview of the current status of the benefit obligations, plan assets and reimbursement
rights of reinsurance policies.
Financial report
Consolidated financial statements Geberit Group
Geberit Annual Report 2016 110
2016 2015
MCHF MCHF
Switzerland
Benefit obligation (for funded retirement benefit plans) 582.9 554.9
Plan assets at fair value 510.6 496.1
Funded status -72.3 -58.8
Germany
Benefit obligation (for unfunded retirement benefit plans) 220.9 210.6
Plan assets at fair value 0.0 0.0
Funded status -220.9 -210.6
Reimbursement rights 12.3 10.8
Other plans
Benefit obligation (for funded retirement benefit plans) 42.2 39.6
Benefit obligation (for unfunded retirement benefit plans) 30.8 29.1
Plan assets at fair value 40.8 38.7
Funded status -32.2 -30.0
Reimbursement rights 7.0 6.4
Total
Benefit obligation (for all retirement benefit plans) 876.8 834.2
Plan assets at fair value 551.4 534.8
Funded status -325.4 -299.4
Reimbursement rights 19.3 17.2
Swiss retirement benefit plans
the Geberit Group is a foundation legally independent from the Geberit Group that insures all Geberit
land for compulsory and non-compulsory benefits. The Board of Trustees manages the Foundation and consists of employer
and employee representatives in a parity ratio. The tasks of the Board of Trustees are set out in the BVG and the regulations
based on the BVG adopted by the Board of Trustees.
ployee contributions, plus the interest paid on the savings assets of the insured party at an interest rate defined annually by
the Board of Trustees in accordance with the legal provisions. If an insured party leaves the Geberit Group and/or the pension
plan before reaching retirement age, the vested benefits accrued under the BVG are transferred to the new pension fund of
the insured party. In addition to the funds brought into the pension plan by the insured party, these vested benefits consist of
tirement pensions, disability benefits and death benefits for the surviving dependents. On retirement, a maximum of 50% of
the retirement assets can be withdrawn in the form of a lump sum. The employer and employees pay an equal contribution to
a percentage of the pensionable salary.
If the pension fund is underfunded in accordance with the BVG, the Board of Trustees is obliged by law to initiate measures to
rectify the situation, such as reducing the interest paid on retirement assets, reducing the benefit entitlement, or collecting
remedial contributions. Legally accrued benefits may not be reduced. With remedial contributions, the risk is shared between
the employer and employees and the employer is not legally obliged to pay more than 50% of the additional contributions.
The current financial status of the Swiss BVG-based pension plans does not require any remedial measures; the technical
funding ratio of this Foundation in accordance with the BVG was 114.6% as of December 31, 2016 (PY: 115%).
tent. The economic benefit for Geberit lies in future reductions in contributions and is calculated in accordance with IFRIC 14.
Financial report
Consolidated financial statements Geberit Group
Geberit Annual Report 2016 111
The Board of Trustees is responsible for deciding on a strategy for investment of the plan assets. The objective is to achieve
medium-term and long-term congruence and sustainability between the plan assets and the pension obligations under the
ment structure.
Geberit Group, which provides non-compulsory benefits only.
least the total of all contributions by the insured party.
A pension plan of Bekon-Koralle AG was acquired with the Sanitec Group in 2015. This company belongs to the Koralle Group,
which was sold on July 1, 2016 (see Note 2).
German retirement benefit plansIn Germany, there are capital account plans and annuity plans. The annuity plans are closed-end funds.
Capital account plans
ditions by applying provisos. There can be special commitments based on the labour-management contracts or individual
agreements, sometimes with annuity options. There is no minimum financing obligation.
Every year, a pension contribution is determined as a percentage of the pensionable salary or the employees can choose an
sulting promises of fixed bonus payments and the initial credit from the transitional arrangement, are paid out in the form of a
one-off lump sum or in instalments. Annuitisation is possible with the consent of the employer. The pension is not dependent
The employer manages the retirement accounts, informs the employees of the balance of their retirement assets, manages
sion, the employer must monitor the statutory and contractual obligations to adjust the pension and make adjustments when
necessary.
sion can trigger a longevity risk. Thanks to the contractual adjustment rules applying to annuitisation, the statutory obligation
to make (and review) adjustments is not currently seen to harbour any inflation risk.
The deferred compensation with/without employer contributions and possible demographic contributions retained by the
employer are paid into reinsurance policies where the employer is the beneficiary. This partly covers the pension obligations.
Annuity plans
tractual adjustment obligation. There is no minimum financing obligation.
These are closed-end funds. Pension commitments as prescribed by the Essener Verband (Essen Association) have been
ments.
The employer manages entitlements and claims and makes payments, sometimes involving the services of external service
sary.
statutory obligation to make (and review) adjustments can also harbour an inflation risk.
The acquisition of the Sanitec Group also added various pension plans in Germany. In respect of Keramag Keramische Werke
tion with reinsurance assets.

Financial report
Consolidated financial statements Geberit Group
Geberit Annual Report 2016 112
The net periodic pension costs of all defined benefit plans of the Group were as follows:
2016 2015
MCHF MCHF
Current service cost 33.2 31.1
Contributions of employees -9.2 -8.9
Net interest cost for retirement benefit plans 4.2 4.2
Net periodic pension cost 28.2 26.4
The service cost for the Swiss retirement benefit plans was MCHF 22.5 in 2016 (PY: MCHF 21.5
ment benefit plans MCHF 9.7 (PY: MCHF 8.6). The net interest cost for the Swiss retirement benefit plans was MCHF 0.4 in
2016 (PY: MCHF 0.3) and for the German retirement benefit plans MCHF 3.5 (PY: MCHF 3.6).
dated Statements of Comprehensive Income:
2016 2015
MCHF MCHF
Actuarial gains (-) / losses: 43.1 21.8
- of which from changes in demographic assumptions -1.0 -0.3
- of which from changes in financial assumptions 43.4 22.2
- of which from experience adjustments 0.7 -0.1
Return on plan assets (excluding interest based on discount rate) -22.2 -6.9
Return on reimbursement rights (excluding interest based on discount rate) -0.1 -0.1
Asset ceiling adjustment 0.0 0.0
Total pre-tax remeasurements recognised in other comprehensive income 20.8 14.8
The remeasurements recognised in other comprehensive income in the Consolidated Statements of Comprehensive Income
in 2016 for the Swiss retirement benefit plans amounted to MCHF 13.6 (PY: MCHF 15.6) and for the German retirement benefit
plans to MCHF 5.4 (PY: MCHF 2.7).
The following tables show the changes in benefit obligations, plan assets, reimbursement rights and the asset ceiling from
January 1 to December 31:
2016 2015
MCHF MCHF
Benefit obligation
At beginning of year 834.2 727.5
Changes in scope of consolidation -15.1 87.6
Current service cost 33.2 31.1
Interest cost 10.0 11.9
Actuarial gains (-) / losses 43.1 21.8
New plans / plan adjustments 1.5 0.1
Benefits paid -22.8 -26.8
Translation differences -7.3 -19.0
Benefit obligation at end of year 876.8 834.2
Financial report
Consolidated financial statements Geberit Group
Geberit Annual Report 2016 113
2016 2015
MCHF MCHF
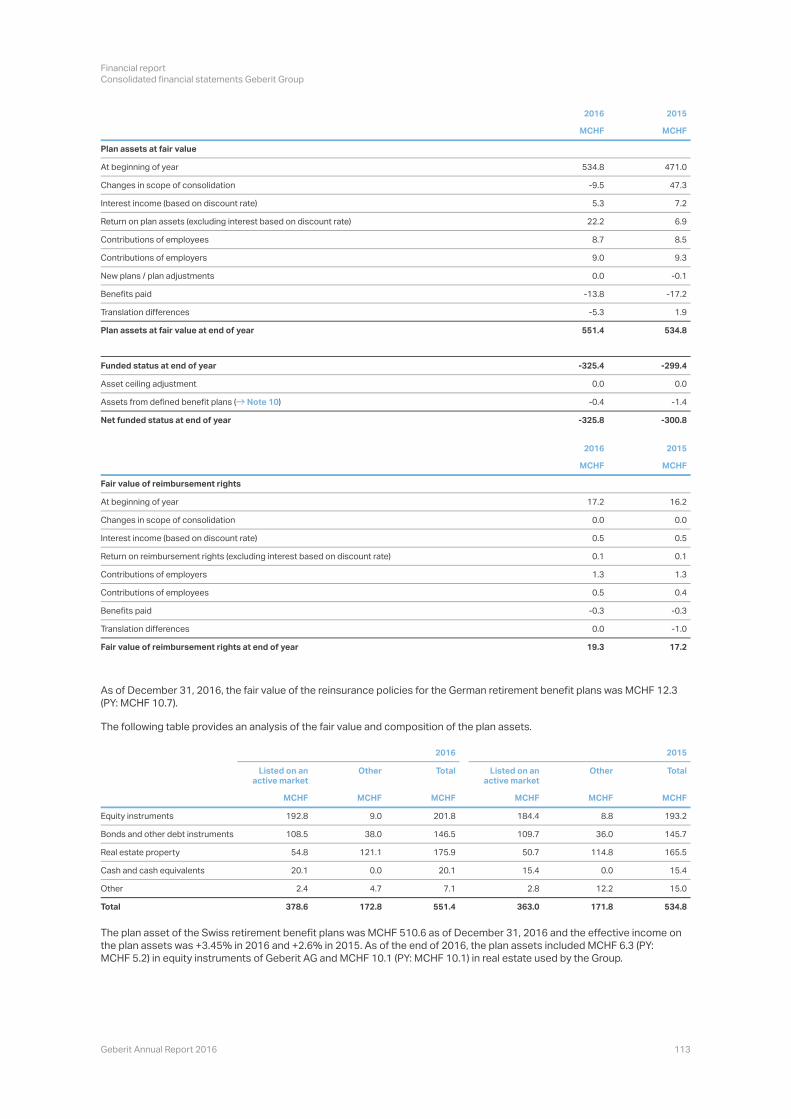
Plan assets at fair value
At beginning of year 534.8 471.0
Changes in scope of consolidation -9.5 47.3
Interest income (based on discount rate) 5.3 7.2
Return on plan assets (excluding interest based on discount rate) 22.2 6.9
Contributions of employees 8.7 8.5
Contributions of employers 9.0 9.3
New plans / plan adjustments 0.0 -0.1
Benefits paid -13.8 -17.2
Translation differences -5.3 1.9
Plan assets at fair value at end of year 551.4 534.8
Funded status at end of year -325.4 -299.4
Asset ceiling adjustment 0.0 0.0
Assets from defined benefit plans ( Note 10) -0.4 -1.4
Net funded status at end of year -325.8 -300.8
2016 2015
MCHF MCHF
Fair value of reimbursement rights
At beginning of year 17.2 16.2
Changes in scope of consolidation 0.0 0.0
Interest income (based on discount rate) 0.5 0.5
Return on reimbursement rights (excluding interest based on discount rate) 0.1 0.1
Contributions of employers 1.3 1.3
Contributions of employees 0.5 0.4
Benefits paid -0.3 -0.3
Translation differences 0.0 -1.0
Fair value of reimbursement rights at end of year 19.3 17.2
As of December 31, 2016, the fair value of the reinsurance policies for the German retirement benefit plans was MCHF 12.3
(PY: MCHF 10.7).
The following table provides an analysis of the fair value and composition of the plan assets.
2016 2015
Listed on an active market
Other Total Listed on an active market
Other Total
MCHF MCHF MCHF MCHF MCHF MCHF
Equity instruments 192.8 9.0 201.8 184.4 8.8 193.2
Bonds and other debt instruments 108.5 38.0 146.5 109.7 36.0 145.7
Real estate property 54.8 121.1 175.9 50.7 114.8 165.5
Cash and cash equivalents 20.1 0.0 20.1 15.4 0.0 15.4
Other 2.4 4.7 7.1 2.8 12.2 15.0
Total 378.6 172.8 551.4 363.0 171.8 534.8
The plan asset of the Swiss retirement benefit plans was MCHF 510.6 as of December 31, 2016 and the effective income on
Geberit AG and MCHF 10.1 (PY: MCHF 10.1) in real estate used by the Group.
Financial report
Consolidated financial statements Geberit Group
Geberit Annual Report 2016 114
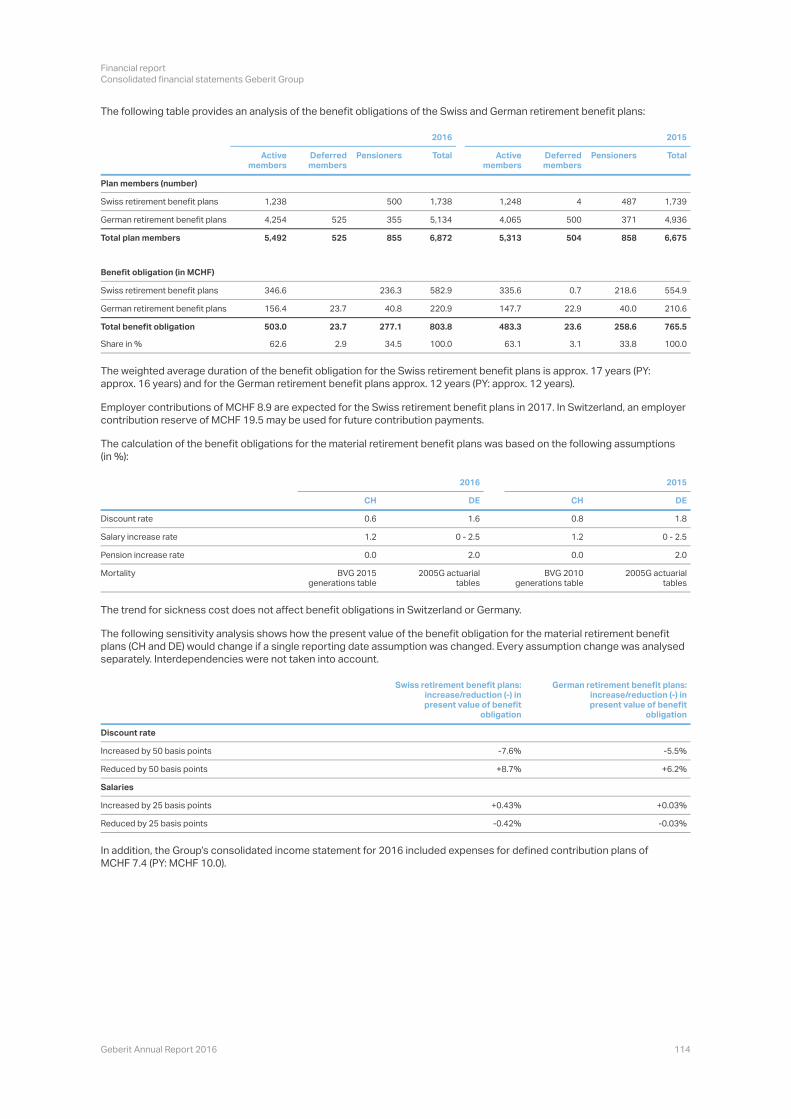
The following table provides an analysis of the benefit obligations of the Swiss and German retirement benefit plans:
2016 2015
Active members
Deferred members
Pensioners Total Active members
Deferred members
Pensioners Total
Plan members (number)
Swiss retirement benefit plans 1,238 500 1,738 1,248 4 487 1,739
German retirement benefit plans 4,254 525 355 5,134 4,065 500 371 4,936
Total plan members 5,492 525 855 6,872 5,313 504 858 6,675
Benefit obligation (in MCHF)
Swiss retirement benefit plans 346.6 236.3 582.9 335.6 0.7 218.6 554.9
German retirement benefit plans 156.4 23.7 40.8 220.9 147.7 22.9 40.0 210.6
Total benefit obligation 503.0 23.7 277.1 803.8 483.3 23.6 258.6 765.5
Share in % 62.6 2.9 34.5 100.0 63.1 3.1 33.8 100.0
The weighted average duration of the benefit obligation for the Swiss retirement benefit plans is approx. 17 years (PY:
approx. 16 years) and for the German retirement benefit plans approx. 12 years (PY: approx. 12 years).
Employer contributions of MCHF 8.9 are expected for the Swiss retirement benefit plans in 2017. In Switzerland, an employer
contribution reserve of MCHF 19.5 may be used for future contribution payments.
The calculation of the benefit obligations for the material retirement benefit plans was based on the following assumptions
(in %):
2016 2015
CH DE CH DE
Discount rate 0.6 1.6 0.8 1.8
Salary increase rate 1.2 0 - 2.5 1.2 0 - 2.5
Pension increase rate 0.0 2.0 0.0 2.0
Mortality BVG 2015 generations table
2005G actuarial tables
BVG 2010 generations table
2005G actuarial tables
The trend for sickness cost does not affect benefit obligations in Switzerland or Germany.
The following sensitivity analysis shows how the present value of the benefit obligation for the material retirement benefit
plans (CH and DE) would change if a single reporting date assumption was changed. Every assumption change was analysed
separately. Interdependencies were not taken into account.
Swiss retirement benefit plans:increase/reduction (-) in present value of benefit
obligation
German retirement benefit plans:increase/reduction (-) in present value of benefit
obligation
Discount rate
Increased by 50 basis points -7.6% -5.5%
Reduced by 50 basis points +8.7% +6.2%
Salaries
Increased by 25 basis points +0.43% +0.03%
Reduced by 25 basis points -0.42% -0.03%
MCHF 7.4 (PY: MCHF 10.0).
Financial report
Consolidated financial statements Geberit Group
Geberit Annual Report 2016 115
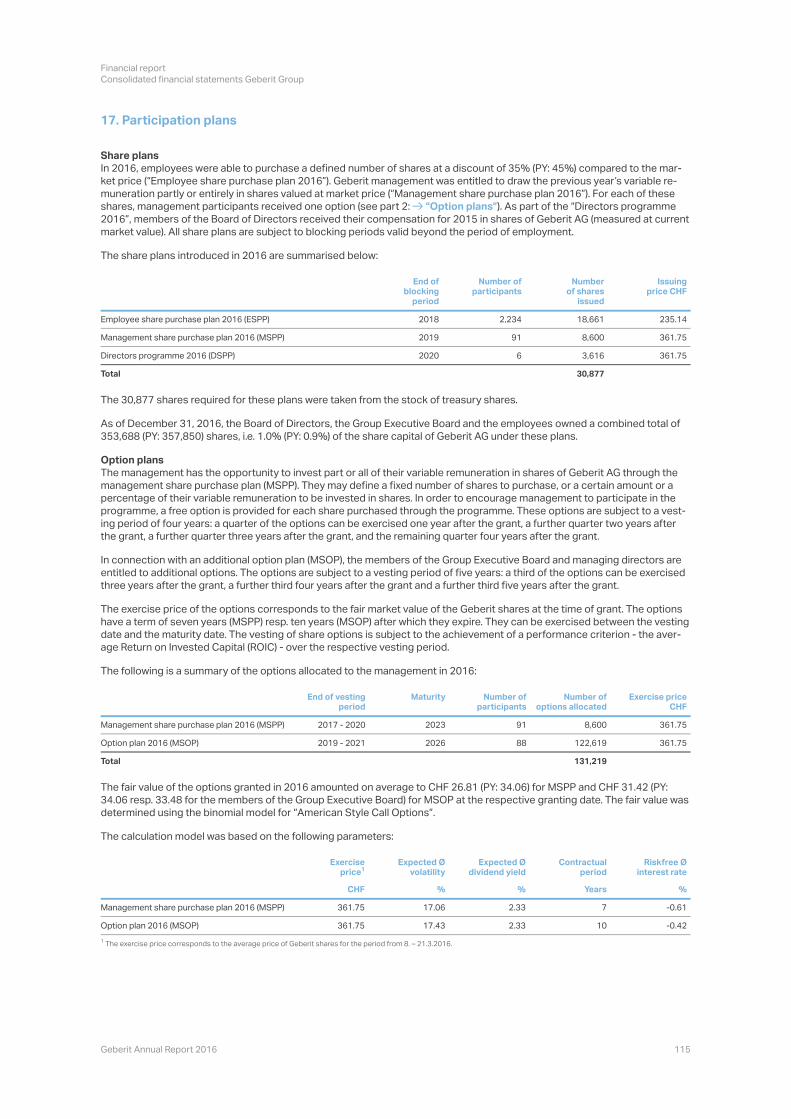
17. Participation plans
Share plans
Geberit
shares, management participants received one option (see part 2: Directors programme
Directors received their compensation for 2015 in shares of Geberit AG (measured at current
market value). All share plans are subject to blocking periods valid beyond the period of employment.
The share plans introduced in 2016 are summarised below:
End ofblocking
period
Number ofparticipants
Numberof shares
issued
Issuingprice CHF
Employee share purchase plan 2016 (ESPP) 2018 2,234 18,661 235.14
Management share purchase plan 2016 (MSPP) 2019 91 8,600 361.75
Directors programme 2016 (DSPP) 2020 6 3,616 361.75
Total 30,877
The 30,877 shares required for these plans were taken from the stock of treasury shares.
As of December 31, 2016, the Board of Directors, the Group Executive Board and the employees owned a combined total of
353,688 (PY: 357,850) shares, i.e. 1.0% (PY: 0.9%) of the share capital of Geberit AG under these plans.
Option plansThe management has the opportunity to invest part or all of their variable remuneration in shares of Geberit AG through the
management share purchase plan (MSPP). They may define a fixed number of shares to purchase, or a certain amount or a
percentage of their variable remuneration to be invested in shares. In order to encourage management to participate in the
ing period of four years: a quarter of the options can be exercised one year after the grant, a further quarter two years after
the grant, a further quarter three years after the grant, and the remaining quarter four years after the grant.
In connection with an additional option plan (MSOP), the members of the Group Executive Board and managing directors are
entitled to additional options. The options are subject to a vesting period of five years: a third of the options can be exercised
three years after the grant, a further third four years after the grant and a further third five years after the grant.
The exercise price of the options corresponds to the fair market value of the Geberit shares at the time of grant. The options
have a term of seven years (MSPP) resp. ten years (MSOP) after which they expire. They can be exercised between the vesting
age Return on Invested Capital (ROIC) - over the respective vesting period.
The following is a summary of the options allocated to the management in 2016:
End of vesting period
Maturity Number of participants
Number of options allocated
Exercise price CHF
Management share purchase plan 2016 (MSPP) 2017 - 2020 2023 91 8,600 361.75
Option plan 2016 (MSOP) 2019 - 2021 2026 88 122,619 361.75
Total 131,219
The fair value of the options granted in 2016 amounted on average to CHF 26.81 (PY: 34.06) for MSPP and CHF 31.42 (PY:
34.06 resp. 33.48 for the members of the Group Executive Board) for MSOP at the respective granting date. The fair value was
The calculation model was based on the following parameters:
Exerciseprice
Expected Ø volatility
Expected Ø dividend yield
Contractual period
Riskfree Ø interest rate
CHF % % Years %
Management share purchase plan 2016 (MSPP) 361.75 17.06 2.33 7 -0.61
Option plan 2016 (MSOP) 361.75 17.43 2.33 10 -0.42
1
1
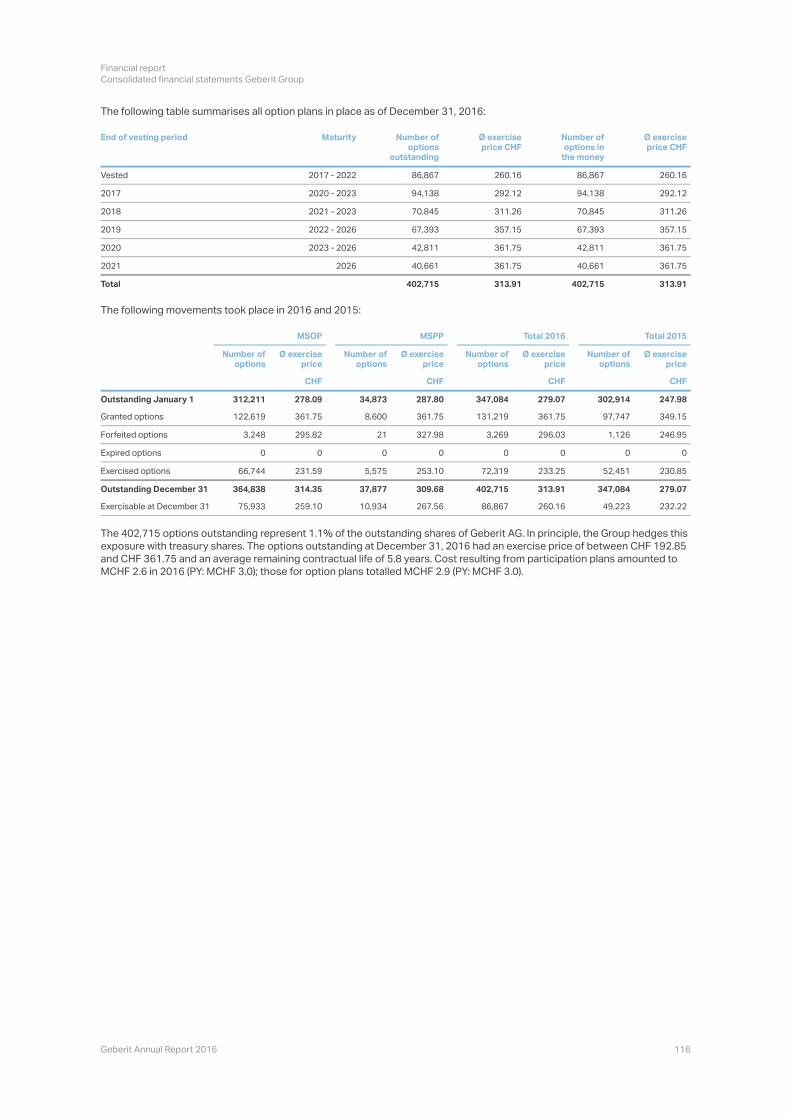
Financial report
Consolidated financial statements Geberit Group
Geberit Annual Report 2016 116
The following table summarises all option plans in place as of December 31, 2016:
End of vesting period Maturity Number of options
outstanding
Ø exerciseprice CHF
Number ofoptions in
the money
Ø exerciseprice CHF
Vested 2017 - 2022 86,867 260.16 86,867 260.16
2017 2020 - 2023 94,138 292.12 94,138 292.12
2018 2021 - 2023 70,845 311.26 70,845 311.26
2019 2022 - 2026 67,393 357.15 67,393 357.15
2020 2023 - 2026 42,811 361.75 42,811 361.75
2021 2026 40,661 361.75 40,661 361.75
Total 402,715 313.91 402,715 313.91
The following movements took place in 2016 and 2015:
MSOP MSPP Total 2016 Total 2015
Number of options
Ø exercise price
Number of options
Ø exercise price
Number of options
Ø exercise price
Number of options
Ø exercise price
CHF CHF CHF CHF
Outstanding January 1 312,211 278.09 34,873 287.80 347,084 279.07 302,914 247.98
Granted options 122,619 361.75 8,600 361.75 131,219 361.75 97,747 349.15
Forfeited options 3,248 295.82 21 327.98 3,269 296.03 1,126 246.95
Expired options 0 0 0 0 0 0 0 0
Exercised options 66,744 231.59 5,575 253.10 72,319 233.25 52,451 230.85
Outstanding December 31 364,838 314.35 37,877 309.68 402,715 313.91 347,084 279.07
Exercisable at December 31 75,933 259.10 10,934 267.56 86,867 260.16 49,223 232.22
The 402,715 options outstanding represent 1.1% of the outstanding shares of Geberit AG. In principle, the Group hedges this
exposure with treasury shares. The options outstanding at December 31, 2016 had an exercise price of between CHF 192.85
and CHF 361.75 and an average remaining contractual life of 5.8 years. Cost resulting from participation plans amounted to
MCHF 2.6 in 2016 (PY: MCHF 3.0); those for option plans totalled MCHF 2.9 (PY: MCHF 3.0).

Financial report
Consolidated financial statements Geberit Group
Geberit Annual Report 2016 117
18. Deferred tax assets and liabilities
2016 Movements 2016 2015
Total (Charged) / credited to
income
Through equity
ThroughOCI
Changes in scope of
consolidation
Translation differences
Total
MCHF MCHF MCHF MCHF MCHF MCHF MCHF
Deferred tax assets
Loss carryforwards 8.2 4.0 0.0 0.0 0.0 0.0 4.2
Accrued pension obligations 37.2 0.4 0.0 3.8 -0.6 -0.1 33.7
Property, plant and equipment 7.5 1.6 0.0 0.0 0.0 -0.3 6.2
Intangible assets 19.0 -9.6 0.0 0.0 0.0 0.0 28.6
Other 24.8 0.9 0.8 0.2 0.1 -0.2 23.0
Total deferred tax assets 96.7 -2.7 0.8 4.0 -0.5 -0.6 95.7
Deferred tax liabilities
Inventories -5.0 -0.2 0.0 -0.1 0.1 -0.1 -4.7
Property, plant and equipment -31.0 -1.5 0.0 0.0 0.1 0.2 -29.8
Intangible assets -48.7 40.1 0.0 -0.4 0.0 0.0 -88.4
Employer contribution reserve
-0.2 0.0 0.0 0.7 0.0 0.1 -1.0
Other -4.8 -1.0 0.0 0.0 0.2 0.1 -4.1
Total deferred tax liabilities -89.7 37.4 0.0 0.2 0.4 0.3 -128.0
Recorded in other comprehensive income
2015 Movements 2015 2014
Total (Charged) / credited to
income
Through equity
ThroughOCI
Changes in scope of
consolidation
Translation differences
Total
MCHF MCHF MCHF MCHF MCHF MCHF MCHF
Deferred tax assets
Loss carryforwards 4.2 -2.6 0.0 0.0 3.8 -0.2 3.2
Accrued pension obligations 33.7 0.2 0.0 3.5 3.8 -2.2 28.4
Property, plant and equipment 6.2 0.4 0.0 0.0 3.1 -0.1 2.8
Intangible assets 28.6 11.8 0.0 0.0 0.4 0.0 16.4
Other 23.0 -1.7 0.7 -10.2 8.9 -0.2 25.5
Total deferred tax assets 95.7 8.1 0.7 -6.7 20.0 -2.7 76.3
Deferred tax liabilities
Inventories -4.7 6.0 0.0 0.0 -4.6 0.0 -6.1
Property, plant and equipment -29.8 -0.3 0.0 0.0 -2.1 1.2 -28.6
Intangible assets -88.4 5.3 0.0 0.0 -81.7 -3.7 -8.3
Employer contribution reserve
-1.0 -0.1 0.0 -0.8 -0.1 0.0 0.0
Other -4.1 0.5 0.0 0.3 -0.2 0.7 -5.4
Total deferred tax liabilities -128.0 11.4 0.0 -0.5 -88.7 -1.8 -48.4
Recorded in other comprehensive income
In general, deferred tax liabilities are recorded for non-refundable withholding taxes or other taxes on unremitted earnings in
Group companies if earnings are planned to be remitted. As of December 31, 2016 and 2015, there were no such earnings,
except for the Chinese subsidiaries. On the unremitted earnings from China, no deferred tax liabilities were recorded, as no
plan exists to remit these earnings. Such a transfer of earnings would lead to income taxes of MCHF 0.1.
1
1
1
1
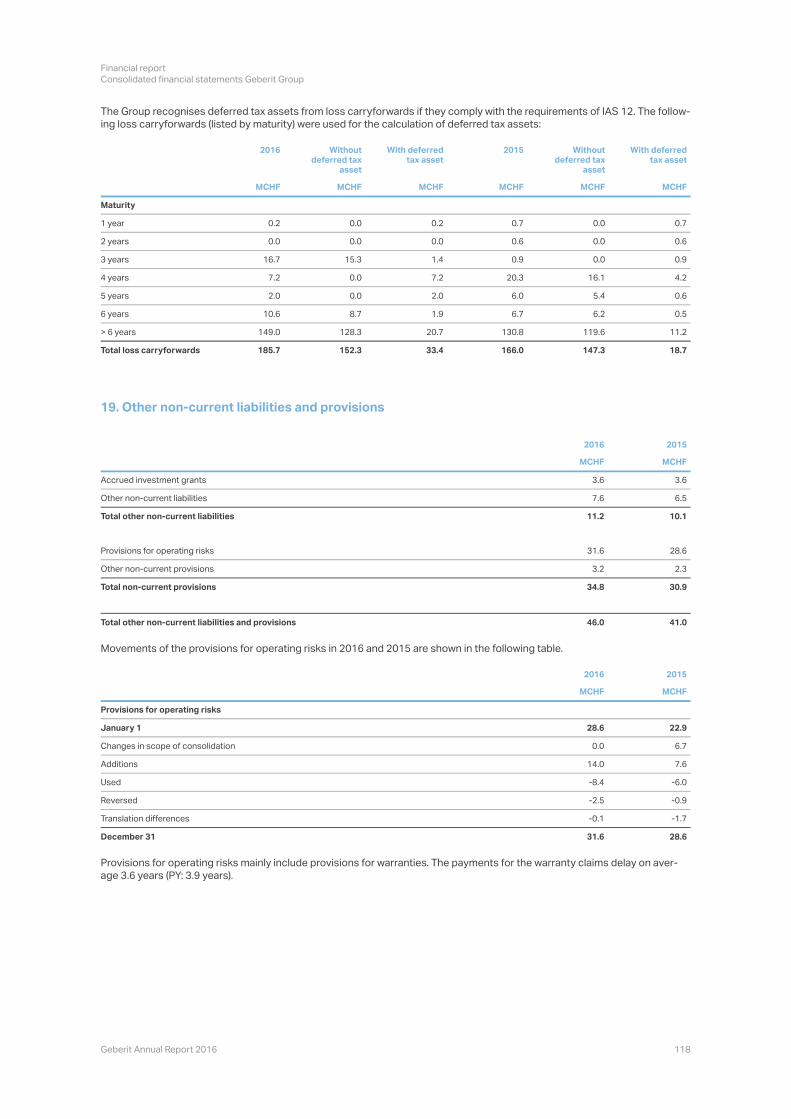
Financial report
Consolidated financial statements Geberit Group
Geberit Annual Report 2016 118
ing loss carryforwards (listed by maturity) were used for the calculation of deferred tax assets:
2016 Withoutdeferred tax
asset
With deferredtax asset
2015 Withoutdeferred tax
asset
With deferredtax asset
MCHF MCHF MCHF MCHF MCHF MCHF
Maturity
1 year 0.2 0.0 0.2 0.7 0.0 0.7
2 years 0.0 0.0 0.0 0.6 0.0 0.6
3 years 16.7 15.3 1.4 0.9 0.0 0.9
4 years 7.2 0.0 7.2 20.3 16.1 4.2
5 years 2.0 0.0 2.0 6.0 5.4 0.6
6 years 10.6 8.7 1.9 6.7 6.2 0.5
> 6 years 149.0 128.3 20.7 130.8 119.6 11.2
Total loss carryforwards 185.7 152.3 33.4 166.0 147.3 18.7
19. Other non-current liabilities and provisions
2016 2015
MCHF MCHF
Accrued investment grants 3.6 3.6
Other non-current liabilities 7.6 6.5
Total other non-current liabilities 11.2 10.1
Provisions for operating risks 31.6 28.6
Other non-current provisions 3.2 2.3
Total non-current provisions 34.8 30.9
Total other non-current liabilities and provisions 46.0 41.0
Movements of the provisions for operating risks in 2016 and 2015 are shown in the following table.
2016 2015
MCHF MCHF
Provisions for operating risks
January 1 28.6 22.9
Changes in scope of consolidation 0.0 6.7
Additions 14.0 7.6
Used -8.4 -6.0
Reversed -2.5 -0.9
Translation differences -0.1 -1.7
December 31 31.6 28.6
age 3.6 years (PY: 3.9 years).
Financial report
Consolidated financial statements Geberit Group
Geberit Annual Report 2016 119
2016 2015
MCHF MCHF
Other non-current provisions
January 1 2.3 1.6
Changes in scope of consolidation 0.0 0.7
Additions 0.0 0.0
Transfers 1.6 0.0
Used -0.6 0.0
Reversed -0.2 0.0
Translation differences 0.1 0.0
December 31 3.2 2.3
20. Contingencies
The Group is involved in several legal proceedings arising from the ordinary course of business. The Group believes that none
position or operating results. The Group has established insurance policies to cover product liabilities and it makes provisions
for potential product warranty claims.
The Group operates in many countries, most of which have sophisticated tax regimes. The nature of its operations and
ongoing significant reorganisations result in complex legal structures for the Group and its subsidiaries. The Group believes
that it performs its business in accordance with the local tax laws. However, it is possible that there are areas where potential
disputes with the various tax authorities could arise. The Group is not aware of any dispute that either individually or in the
The product area Bathroom Ceramics was exposed to many challenges in the past. Declining export markets on a European
level but also for the local demand in France led to production over-capacities and an ongoing cost pressure. As a result, in
France the strategic options regarding the production sites of Allia SAS in La Villeneuve-au-Chêne and Digoin are being
discussed. For this purpose, an information and consultation process was initiated with the central work council of the
company. Closure of the two French production plants is considered in the contemplated project for the sites. This project is
submitted to the information and consultation of Allia employee representative bodies. If this project would materialize the
related cost could be in a range of MCHF 30 to MCHF 40. However, depending on the outcome of the negotiations and the
finally chosen option, the amount could also be below or above this range.
21. Capital stock and treasury shares
2016 2015
pcs. pcs.
Issued shares
January 1 37,798,427 37,798,427
Capital reduction -757,000 0
December 31 37,041,427 37,798,427
The share buyback programme, which began on April 30, 2014, ended on February 29, 2016. A total of 757,000 registered
shares were bought back for MCHF 247.8. When the programme ended, this represented 2.0% of the share capital registered
with the commercial register. The share buyback programme was conducted via a second trading line set up especially for
this purpose. The average purchase price per share was CHF 327.40.
proved the proposal to cancel the repurchased shares by means of a capital reduction. The shares were cancelled on June
20, 2016.
Financial report
Consolidated financial statements Geberit Group
Geberit Annual Report 2016 120
2016 2015
pcs. pcs.
Stock of treasury shares
From share buyback programmes 0 634,600
Other treasury shares 239,869 243,280
Total treasury shares 239,869 877,880
As of December 31, 2016, the Group held a total of 239,869 (PY: 877,880) treasury shares with a carrying amount of
MCHF 79.4 (December 31, 2015: MCHF 276.5), meaning that the Group decreased its net number of treasury shares by
638,011 in 2016. Treasury shares are deducted at cost from equity.
For transactions in connection with the participation plans, see Note 17.
22. Earnings per share
Earnings per share are calculated by dividing the net income attributable to ordinary shareholders by the weighted average
number of ordinary shares issued and outstanding during the year, excluding the weighted average number of ordinary
shares purchased by the Group and held as treasury shares.
2016 2015
Attributable net income according to income statement (MCHF) 548.2 422.4
Weighted average number of ordinary shares (thousands) 36,839 37,279
Total earnings per share (CHF) 14.88 11.33
For diluted earnings per share, the weighted average number of ordinary shares issued is adjusted to assume conversion of
all potentially dilutive ordinary shares (see Note 3
ment to calculate the potentially dilutive ordinary shares.
2016 2015
Attributable net income according to income statement (MCHF) 548.2 422.4
Weighted average number of ordinary shares (thousands) 36,839 37,279
Adjustments for share options (thousands) 72 59
Weighted average number of ordinary shares (thousands) 36,911 37,338
Total diluted earnings per share (CHF) 14.85 11.31
23. Other operating expenses, net
2016 2015
MCHF MCHF
Outbound freight cost and duties 98.0 89.9
Energy and maintenance expenses 129.2 107.9
Marketing expenses 105.2 97.7
Administration expenses 68.7 64.2
Other operating expenses 169.6 161.3
Other operating income -23.8 -15.0
Total other operating expenses, net 546.9 506.0
cost.
assets and subsidiaries and catering revenues.
Financial report
Consolidated financial statements Geberit Group
Geberit Annual Report 2016 121
In 2016, cost of MCHF 16.4 (PY: MCHF 14.6
24. Financial result, net
2016 2015
MCHF MCHF
Interest expenses -9.5 -9.0
Amortisation of deferred financing fees -2.1 -8.7
Other financial expenses -1.9 -2.4
Total financial expenses -13.5 -20.1
Interest income 1.9 1.2
Total financial income 1.9 1.2
Foreign exchange loss (-) /gain 2.3 -4.6
Total financial result, net -9.3 -23.5
25. Income tax expenses
2016 2015
MCHF MCHF
Current taxes 117.3 71.9
Deferred taxes -34.7 -19.5
Total income tax expenses 82.6 52.4
The differences between income tax expenses computed at the weighted-average applicable tax rate of the Group of 14.6%
(PY: 19.3%) and the effective income tax expenses were as follows:
2016 2015
MCHF MCHF
Income tax expenses, at applicable rate 91.8 91.6
Operating losses with no current tax benefit 3.1 11.9
Offsetting of current profits against loss carryforwards without tax assets -6.1 -30.2
Changes in future tax rates -0.4 0.5
Taxable goodwill amortisation 0.0 -3.2
Non-deductible expenses and non-taxable income, net 0.8 -23.0
Other -6.6 4.8
Total income tax expenses 82.6 52.4
"Other" in 2016 includes mainly reversals of tax provisions. In 2015 there were several one-off effects resulting from the
Sanitec acquisition (transaction) or from subsequent integration projects (e.g. transfer of IP rights).
Financial report
Consolidated financial statements Geberit Group
Geberit Annual Report 2016 122
26. Operating Leasing
2016 2015
MCHF MCHF
Minimum lease payments
< 1 year 19.8 16.6
1-5 years 53.7 49.6
> 5 years 71.3 76.9
Total minimum lease payments 144.8 143.1
The permanent (open-ended) contracts were defined to last for a period of eight years in 2016. In 2015 there was no such specific definition. Therefore the figures for 2015
were adjusted on the basis of this new definition.
The lease expenses for 2016 were MCHF 24.8 (PY: MCHF 18.5). The acquisition of the Sanitec Group added various operating
lease agreements in 2015. The leasing agreements are mainly for rent of buildings and equipment.
27. Research and development cost
2016 2015
MCHF MCHF
Research and development expenses 72.3 63.4
Capitalised development expenses -5.7 -7.8
Amortisation of capitalised development expenses 2.1 1.1
Research and development cost 68.7 56.7
Geberit
penses have remained relatively constant over the years. In 2016, research and development expenses totalling MCHF 72.3
four major development projects, the capitalisation criteria according to IAS 38.57 were met and expenses of MCHF 5.7 (PY:
MCHF 7.8) were capitalised.
28. Cashflow figures
Net cashflow is calculated as follows:
2016 2015
MCHF MCHF
EBITDA 785.2 631.7
Financial result, net -9.3 -23.5
Income tax expenses -82.6 -52.4
Changes in deferred taxes and current income tax liabilities and provisions -21.4 -19.5
Changes in non-current provisions 32.0 23.9
Non-cash effective depreciation of the Sanitec inventory revaluation 0.0 28.4
Changes in non-current assets and other -4.9 7.7
Net cashflow 699.0 596.3
tions and non-cash expenses resulting from share participation and option plans charged or credited to net income.
reclassification of gains from the disposal of property, plant and equipment and subsidiaries and the amortisation of deferred
financing fees.
1
1
1
1
2
1
2

Financial report
Consolidated financial statements Geberit Group
Geberit Annual Report 2016 123
Free cashflow is calculated as follows:
2016 2015
MCHF MCHF
Net cashflow 699.0 596.3
Purchase of property, plant and equipment and intangible assets, net -132.9 -141.0
Changes in net working capital 10.1 40.4
Payments charged to non-current provisions -12.3 -11.7
Free cashflow 563.9 484.0
sidiaries, proceeds or repayments of borrowings, the purchase or sale of treasury shares and dividend payments.
current assets, less the aggregate of trade accounts payable and other current provisions and liabilities.
debt, to finance acquisitions, to buy back shares and to pay dividends.
29. Segment reporting
The Geberit Group consists of one single business unit, the purpose of which is to develop, produce and distribute sanitary
products and systems for the residential and commercial construction industry. The major part of the products is distributed
through the wholesale channel in general to plumbers, who resell the products to the end users. Products are produced by
sidiary is always responsible
salers. Research and development of the whole range of products is carried out centrally by Geberit
porate tasks are also centralised at Geberit International AG.
Due to the unity and focus of the business, the top management (Group Executive Board) and the management structure of
the Geberit
erations, Product Management & Innovation, Finance). The financial management of the Group by the Board of Directors and
the Group Executive Board is based on net sales by markets and product lines and on the consolidated income statements,
balance sheets, and statements of cashflows.
Segment reporting is therefore prepared according to IFRS 8.31 et seq. (one single reportable segment) and the valuation is
made according to the same principles as the consolidated financial statements. The geographical allocation of net sales is
based on the domicile of the customers.
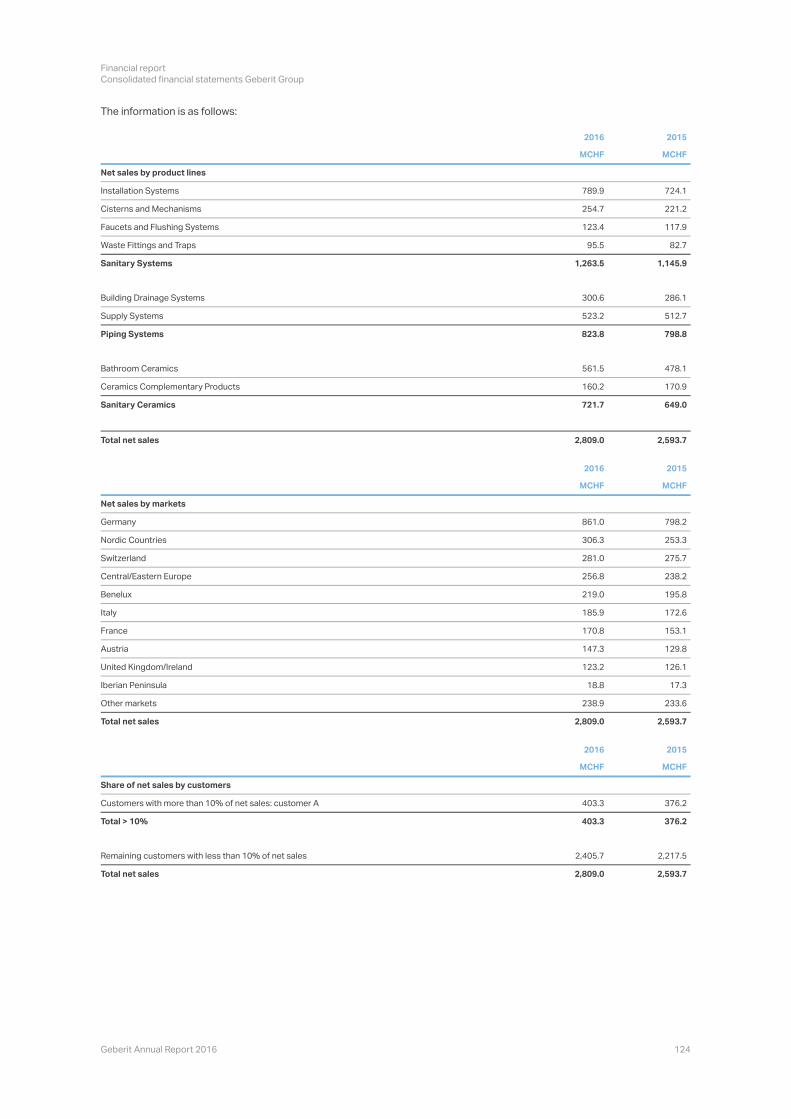
Financial report
Consolidated financial statements Geberit Group
Geberit Annual Report 2016 124
The information is as follows:
2016 2015
MCHF MCHF
Net sales by product lines
Installation Systems 789.9 724.1
Cisterns and Mechanisms 254.7 221.2
Faucets and Flushing Systems 123.4 117.9
Waste Fittings and Traps 95.5 82.7
Sanitary Systems 1,263.5 1,145.9
Building Drainage Systems 300.6 286.1
Supply Systems 523.2 512.7
Piping Systems 823.8 798.8
Bathroom Ceramics 561.5 478.1
Ceramics Complementary Products 160.2 170.9
Sanitary Ceramics 721.7 649.0
Total net sales 2,809.0 2,593.7
2016 2015
MCHF MCHF
Net sales by markets
Germany 861.0 798.2
Nordic Countries 306.3 253.3
Switzerland 281.0 275.7
Central/Eastern Europe 256.8 238.2
Benelux 219.0 195.8
Italy 185.9 172.6
France 170.8 153.1
Austria 147.3 129.8
United Kingdom/Ireland 123.2 126.1
Iberian Peninsula 18.8 17.3
Other markets 238.9 233.6
Total net sales 2,809.0 2,593.7
2016 2015
MCHF MCHF
Share of net sales by customers
Customers with more than 10% of net sales: customer A 403.3 376.2
Total > 10% 403.3 376.2
Remaining customers with less than 10% of net sales 2,405.7 2,217.5
Total net sales 2,809.0 2,593.7
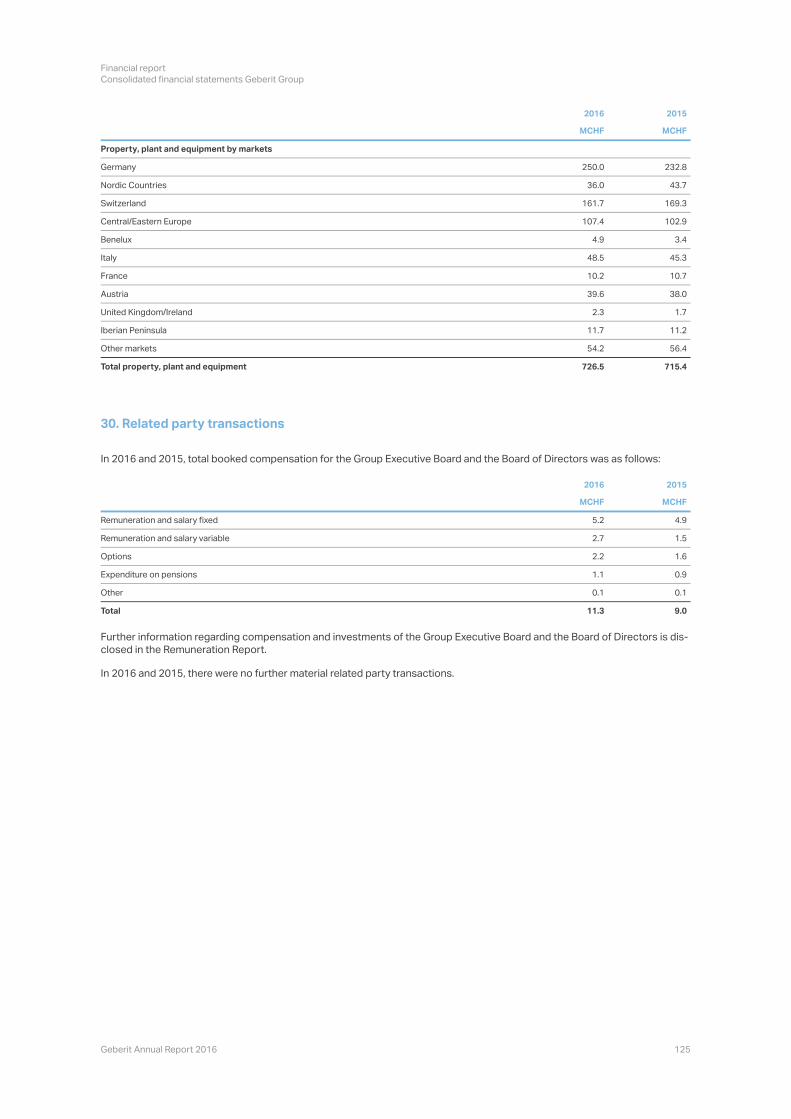
Financial report
Consolidated financial statements Geberit Group
Geberit Annual Report 2016 125
2016 2015
MCHF MCHF
Property, plant and equipment by markets
Germany 250.0 232.8
Nordic Countries 36.0 43.7
Switzerland 161.7 169.3
Central/Eastern Europe 107.4 102.9
Benelux 4.9 3.4
Italy 48.5 45.3
France 10.2 10.7
Austria 39.6 38.0
United Kingdom/Ireland 2.3 1.7
Iberian Peninsula 11.7 11.2
Other markets 54.2 56.4
Total property, plant and equipment 726.5 715.4
30. Related party transactions
In 2016 and 2015, total booked compensation for the Group Executive Board and the Board of Directors was as follows:
2016 2015
MCHF MCHF
Remuneration and salary fixed 5.2 4.9
Remuneration and salary variable 2.7 1.5
Options 2.2 1.6
Expenditure on pensions 1.1 0.9
Other 0.1 0.1
Total 11.3 9.0
Further information regarding compensation and investments of the Group Executive Board and the Board of Directors
closed in the Remuneration Report.
In 2016 and 2015, there were no further material related party transactions.
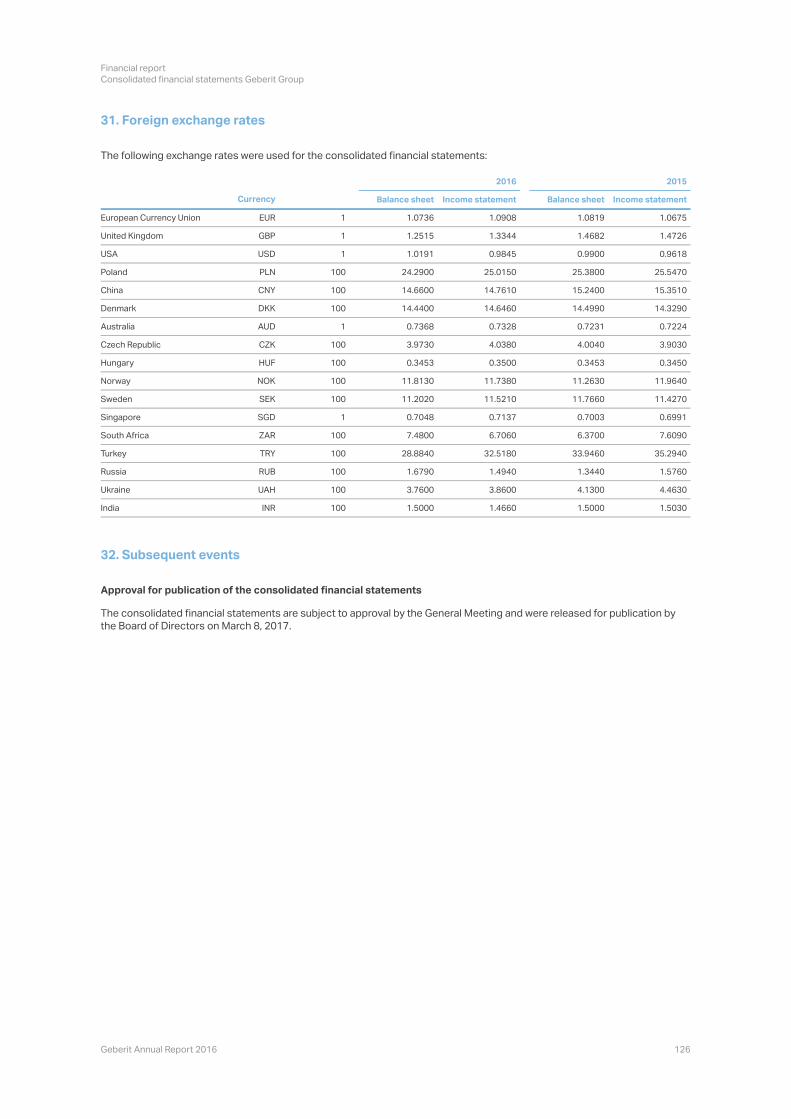
Financial report
Consolidated financial statements Geberit Group
Geberit Annual Report 2016 126
31. Foreign exchange rates
The following exchange rates were used for the consolidated financial statements:
2016 2015
Currency Balance sheet Income statement Balance sheet Income statement
European Currency Union EUR 1 1.0736 1.0908 1.0819 1.0675
United Kingdom GBP 1 1.2515 1.3344 1.4682 1.4726
USA USD 1 1.0191 0.9845 0.9900 0.9618
Poland PLN 100 24.2900 25.0150 25.3800 25.5470
China CNY 100 14.6600 14.7610 15.2400 15.3510
Denmark DKK 100 14.4400 14.6460 14.4990 14.3290
Australia AUD 1 0.7368 0.7328 0.7231 0.7224
Czech Republic CZK 100 3.9730 4.0380 4.0040 3.9030
Hungary HUF 100 0.3453 0.3500 0.3453 0.3450
Norway NOK 100 11.8130 11.7380 11.2630 11.9640
Sweden SEK 100 11.2020 11.5210 11.7660 11.4270
Singapore SGD 1 0.7048 0.7137 0.7003 0.6991
South Africa ZAR 100 7.4800 6.7060 6.3700 7.6090
Turkey TRY 100 28.8840 32.5180 33.9460 35.2940
Russia RUB 100 1.6790 1.4940 1.3440 1.5760
Ukraine UAH 100 3.7600 3.8600 4.1300 4.4630
India INR 100 1.5000 1.4660 1.5000 1.5030
32. Subsequent events
Approval for publication of the consolidated financial statements
The consolidated financial statements are subject to approval by the General Meeting and were released for publication by
the Board of Directors on March 8, 2017.
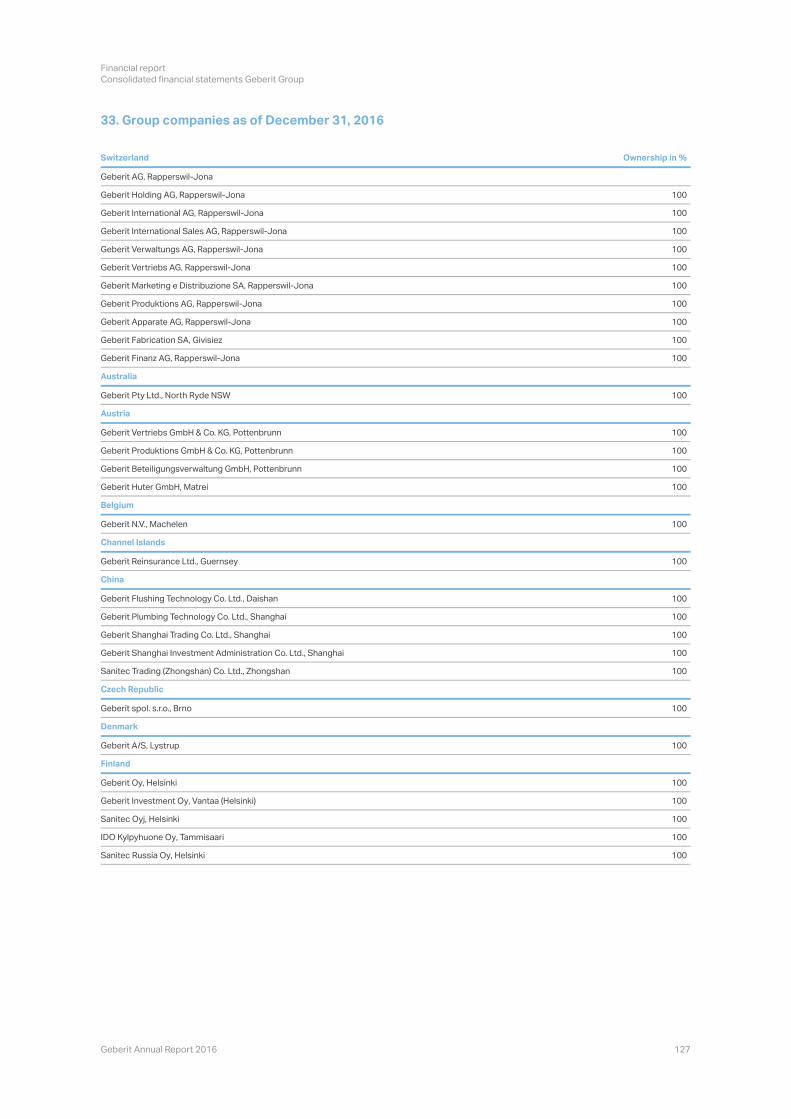
Financial report
Consolidated financial statements Geberit Group
Geberit Annual Report 2016 127
33. Group companies as of December 31, 2016
Switzerland Ownership in %
Geberit AG, Rapperswil-Jona
Geberit Holding AG, Rapperswil-Jona 100
Geberit International AG, Rapperswil-Jona 100
Geberit International Sales AG, Rapperswil-Jona 100
Geberit Verwaltungs AG, Rapperswil-Jona 100
Geberit Vertriebs AG, Rapperswil-Jona 100
Geberit Marketing e Distribuzione SA, Rapperswil-Jona 100
Geberit Produktions AG, Rapperswil-Jona 100
Geberit Apparate AG, Rapperswil-Jona 100
Geberit Fabrication SA, Givisiez 100
Geberit Finanz AG, Rapperswil-Jona 100
Australia
Geberit Pty Ltd., North Ryde NSW 100
Austria
Geberit Vertriebs GmbH & Co. KG, Pottenbrunn 100
Geberit Produktions GmbH & Co. KG, Pottenbrunn 100
Geberit Beteiligungsverwaltung GmbH, Pottenbrunn 100
Geberit Huter GmbH, Matrei 100
Belgium
Geberit N.V., Machelen 100
Channel Islands
Geberit Reinsurance Ltd., Guernsey 100
China
Geberit Flushing Technology Co. Ltd., Daishan 100
Geberit Plumbing Technology Co. Ltd., Shanghai 100
Geberit Shanghai Trading Co. Ltd., Shanghai 100
Geberit Shanghai Investment Administration Co. Ltd., Shanghai 100
Sanitec Trading (Zhongshan) Co. Ltd., Zhongshan 100
Czech Republic
Geberit spol. s.r.o., Brno 100
Denmark
Geberit A/S, Lystrup 100
Finland
Geberit Oy, Helsinki 100
Geberit Investment Oy, Vantaa (Helsinki) 100
Sanitec Oyj, Helsinki 100
IDO Kylpyhuone Oy, Tammisaari 100
Sanitec Russia Oy, Helsinki 100
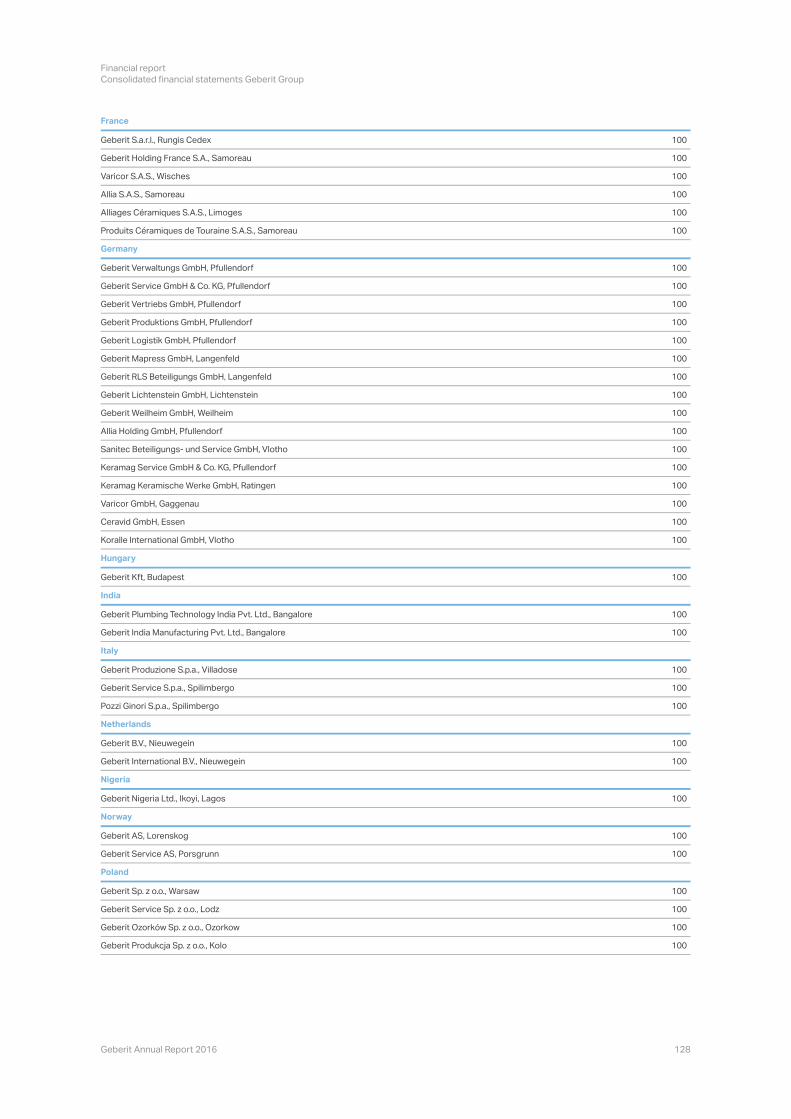
Financial report
Consolidated financial statements Geberit Group
Geberit Annual Report 2016 128
France
Geberit S.a.r.l., Rungis Cedex 100
Geberit Holding France S.A., Samoreau 100
Varicor S.A.S., Wisches 100
Allia S.A.S., Samoreau 100
Alliages Céramiques S.A.S., Limoges 100
Produits Céramiques de Touraine S.A.S., Samoreau 100
Germany
Geberit Verwaltungs GmbH, Pfullendorf 100
Geberit Service GmbH & Co. KG, Pfullendorf 100
Geberit Vertriebs GmbH, Pfullendorf 100
Geberit Produktions GmbH, Pfullendorf 100
Geberit Logistik GmbH, Pfullendorf 100
Geberit Mapress GmbH, Langenfeld 100
Geberit RLS Beteiligungs GmbH, Langenfeld 100
Geberit Lichtenstein GmbH, Lichtenstein 100
Geberit Weilheim GmbH, Weilheim 100
Allia Holding GmbH, Pfullendorf 100
Sanitec Beteiligungs- und Service GmbH, Vlotho 100
Keramag Service GmbH & Co. KG, Pfullendorf 100
Keramag Keramische Werke GmbH, Ratingen 100
Varicor GmbH, Gaggenau 100
Ceravid GmbH, Essen 100
Koralle International GmbH, Vlotho 100
Hungary
Geberit Kft, Budapest 100
India
Geberit Plumbing Technology India Pvt. Ltd., Bangalore 100
Geberit India Manufacturing Pvt. Ltd., Bangalore 100
Italy
Geberit Produzione S.p.a., Villadose 100
Geberit Service S.p.a., Spilimbergo 100
Pozzi Ginori S.p.a., Spilimbergo 100
Netherlands
Geberit B.V., Nieuwegein 100
Geberit International B.V., Nieuwegein 100
Nigeria
Geberit Nigeria Ltd., Ikoyi, Lagos 100
Norway
Geberit AS, Lorenskog 100
Geberit Service AS, Porsgrunn 100
Poland
Geberit Sp. z o.o., Warsaw 100
Geberit Service Sp. z o.o., Lodz 100
Geberit Ozorków Sp. z o.o., Ozorkow 100
Geberit Produkcja Sp. z o.o., Kolo 100
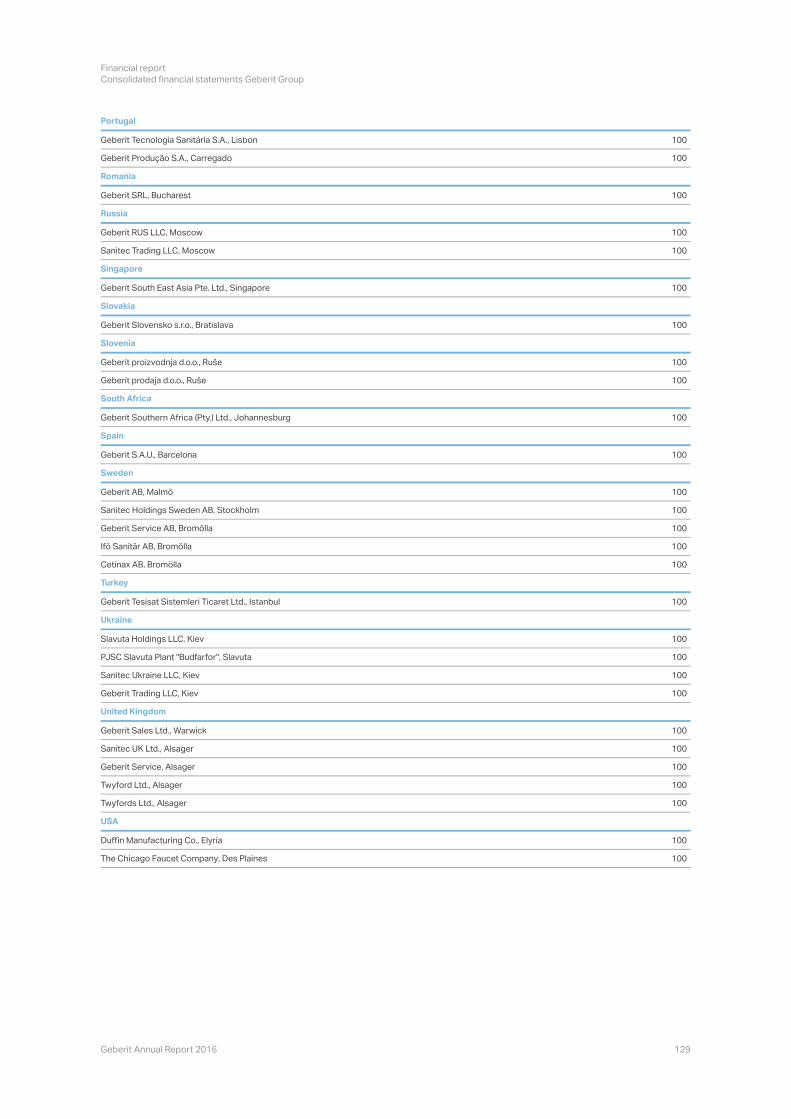
Financial report
Consolidated financial statements Geberit Group
Geberit Annual Report 2016 129
Portugal
Geberit Tecnologia Sanitária S.A., Lisbon 100
Geberit Produção S.A., Carregado 100
Romania
Geberit SRL, Bucharest 100
Russia
Geberit RUS LLC, Moscow 100
Sanitec Trading LLC, Moscow 100
Singapore
Geberit South East Asia Pte. Ltd., Singapore 100
Slovakia
Geberit Slovensko s.r.o., Bratislava 100
Slovenia
100
100
South Africa
Geberit Southern Africa (Pty.) Ltd., Johannesburg 100
Spain
Geberit S.A.U., Barcelona 100
Sweden
Geberit AB, Malmö 100
Sanitec Holdings Sweden AB, Stockholm 100
Geberit Service AB, Bromölla 100
Ifö Sanitär AB, Bromölla 100
Cetinax AB, Bromölla 100
Turkey
Geberit Tesisat Sistemleri Ticaret Ltd., Istanbul 100
Ukraine
Slavuta Holdings LLC, Kiev 100
PJSC Slavuta Plant "Budfarfor", Slavuta 100
Sanitec Ukraine LLC, Kiev 100
Geberit Trading LLC, Kiev 100
United Kingdom
Geberit Sales Ltd., Warwick 100
Sanitec UK Ltd., Alsager 100
Geberit Service, Alsager 100
Twyford Ltd., Alsager 100
Twyfords Ltd., Alsager 100
USA
Duffin Manufacturing Co., Elyria 100
The Chicago Faucet Company, Des Plaines 100
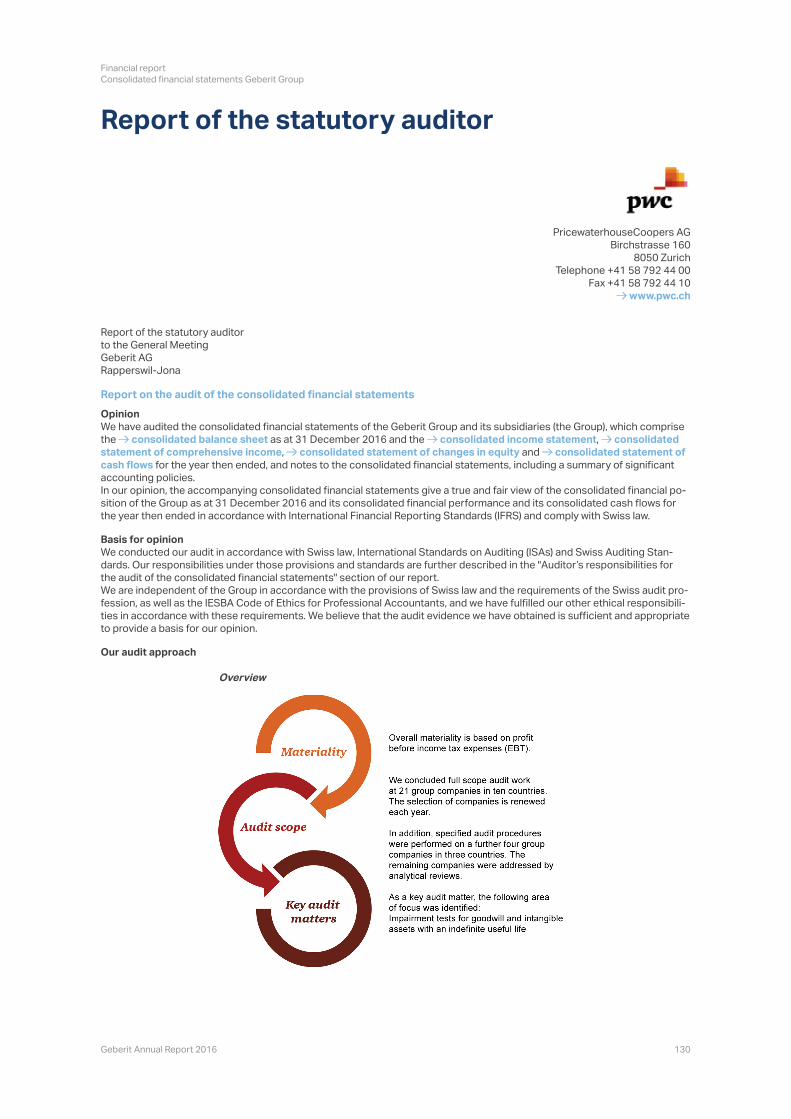
Financial report
Consolidated financial statements Geberit Group
Geberit Annual Report 2016 130
Report of the statutory auditor
PricewaterhouseCoopers AG
Birchstrasse 160
8050 Zurich
Telephone +41 58 792 44 00
Fax +41 58 792 44 10
www.pwc.ch
Report of the statutory auditor
to the General Meeting
Geberit AG
Rapperswil-Jona
Report on the audit of the consolidated financial statements
OpinionWe have audited the consolidated financial statements of the Geberit Group and its subsidiaries (the Group), which comprise
the consolidated balance sheet consolidated income statement, consolidated
statement of comprehensive income, consolidated statement of changes in equity and consolidated statement of
cash flows for the year then ended, and notes to the consolidated financial statements, including a summary of significant
accounting policies.
the year then ended in accordance with International Financial Reporting Standards (IFRS) and comply with Swiss law.
Basis for opinion
the audit of the consolidated financial statements" section of our report.
ties in accordance with these requirements. We believe that the audit evidence we have obtained is sufficient and appropriate
to provide a basis for our opinion.
Our audit approach
Overview
Financial report
Consolidated financial statements Geberit Group
Geberit Annual Report 2016 131
Audit scope
cial statements. In particular, we considered where subjective judgements were made; for example, in respect of significant
accounting estimates that involved making assumptions and considering future events that are inherently uncertain. As in all
eration of whether there was evidence of bias that represented a risk of material misstatement due to fraud.
We tailored the scope of our audit in order to perform sufficient work to enable us to provide an opinion on the consolidated
financial statements as a whole, taking into account the structure of the Group, the accounting processes and controls, and
the industry in which the Group operates.
Materiality
ance that the consolidated financial statements are free from material misstatement. Misstatements may arise due to fraud or
nomic decisions of users taken on the basis of the consolidated financial statements.
Based on our professional judgement, we determined certain quantitative thresholds for materiality, including the overall
ments as a whole. We chose profit before income tax expenses as the benchmark because, in our view, it is the benchmark
against which the performance of the Group is most commonly measured, and it is a generally accepted benchmark.
Key audit matters
ed financial statements as a whole, and in forming our opinion thereon, and we do not provide a separate opinion on these
matters.
Impairment tests for goodwill and intangible assets with an indefinite useful life
Key audit matter How our audit addressed the key audit matter
Impairment testing of goodwill and intangible assets with an indefinite useful life was deemed a key audit matter for the following two reasons.
Goodwill and intangible assets with an indefinite useful life represent a
These assets are not regularly amortised but tested for impairment at least annually. Moreover, in calculating the value-in-use for these tests, the Board of Directors and Management have significant scope for judgement in determining revenue and margin growth assumptions and the discount rates to be applied to the expected cash flows and in specifying the cash generating units (CGUs).
With regard to the accounting policies and information on goodwill and intangible assets with an indefinite useful life, please refer to the notes to the consolidated financial statements,
, 3
and .
Impairment testing of goodwill and intangible assets with an indefinite useful life is based on a process defined by the Board of Directors, using the business plans approved by them. As part of this process, Management estimates the cash flows for the cash-generating units concerned.
We assessed the identification of the relevant CGUs taking into account the IFRS accounting standards and our knowledge of the organisation, structure and management of the Group.
We compared the business results of the year under review with the forecasts prepared in the prior year in order to identify any assumptions that in retrospect might appear too optimistic regarding the cash flows. The business results of the year under review slightly exceeded the
forecasts on the growth rates and margins used in the current business plan of the Geberit Group.
growth and margin growth with industry growth forecasts and historical margins, as appropriate. We compared the discount rate with the cost of capital of the Group and of analogous firms. In addition, we performed a plausibility check on the forecasted change in net working capital.
The assumptions used were consistent and in line with our expectations.
We tested the sensitivity analyses of the key assumptions. These analyses enabled us to assess any potential impairment of goodwill or of intangible assets.
Based on the evidence obtained from our audit, we consider the valuation method and the underlying assumptions to be an appropriate and adequate basis for the impairment testing of goodwill and of intangible assets with an indefinite useful life.
Other information in the annual reportThe Board of Directors is responsible
mation included in the annual report, but does not include the consolidated financial statements, the stand-alone financial
statements and the remuneration report of Geberit
Our opinion on the consolidated financial statements does not cover the other information in the annual report and we do not
express any form of assurance conclusion thereon.
In connection with our audit of the consolidated financial statements, our responsibility is to read the other information in the
cial statements or our knowledge obtained in the audit, or otherwise appears to be materially misstated. If, based on the work
we have performed, we conclude that there is a material misstatement of this other information; we are required to report that
fact. We have nothing to report in this regard.

Financial report
Consolidated financial statements Geberit Group
Geberit Annual Report 2016 132
Responsibilities of the Board of Directors for the consolidated financial statementsThe Board of Directors is responsible for the preparation of the consolidated financial statements that give a true and fair
view in accordance with IFRS and the provisions of Swiss law, and for such internal control as the Board of Directors
mines is necessary to enable the preparation of consolidated financial statements that are free from material misstatement,
whether due to fraud or error.
In preparing the consolidated financial statements, the Board of Directors is responsible
continue as a going concern, disclosing, as applicable, matters related to going concern and using the going concern basis of
accounting unless the Board of Directors
native but to do so.
Our objectives are to obtain reasonable assurance about whether the consolidated financial statements as a whole are free
able assurance is a high level of assurance, but is not a guarantee that an audit conducted in accordance with Swiss law, ISAs
and Swiss Auditing Standards will always detect a material misstatement when it exists. Misstatements can arise from fraud
nomic decisions of users taken based on these consolidated financial statements.
As part of an audit in accordance with Swiss law, ISAs and Swiss Auditing Standards, we exercise professional judgement and
maintain professional scepticism throughout the audit. We also:
We communicate with the Board of Directors or its relevant committee regarding, among other matters, the planned scope
and timing of the audit and significant audit findings, including any significant deficiencies in internal control that we identify
during our audit.
We also provide the Board of Directors or its relevant committee with a statement that we have complied with relevant ethical
requirements regarding independence, and communicate to them all relationships and other matters that may reasonably be
thought to bear on our independence, and where applicable, related safeguards.
From the matters communicated with the Board of Directors or its relevant committee, we determine those matters that were
of most significance in the audit of the consolidated financial statements of the current period and are therefore the key audit
cause the adverse consequences of doing so would reasonably be expected to outweigh the public interest benefits of such
communication.
Identify and assess the risks of material misstatement of the consolidated financial statements, whether due to fraud or
priate to provide a basis for our opinion. The risk of not detecting a material misstatement resulting from fraud is higher
than for one resulting from error, as fraud may involve collusion, forgery, intentional omissions, misrepresentations, or the
override of internal control.
-
Obtain an understanding of internal control relevant to the audit in order to design audit procedures that are appropriate in -
Evaluate the appropriateness of accounting policies used and the reasonableness of accounting estimates and related
disclosures made.-
Conclude on the appropriateness of the Board of Directors based on
the audit evidence obtained, whether a material uncertainty exists related to events or conditions that may cast significant
disclosures are inadequate, to modify our opinion. Our conclusions are based on the audit evidence obtained up to the
concern.
-
sures, and whether the consolidated financial statements represent the underlying transactions and events in a manner
that achieves fair presentation.
-
Obtain sufficient appropriate audit evidence regarding the financial information of the entities or business activities within
the Group to express an opinion on the consolidated financial statements. We are responsible
sion and performance of the Group audit. We remain solely responsible for our audit opinion.
-
Financial report
Consolidated financial statements Geberit Group
Geberit Annual Report 2016 133
Report on other legal and regulatory requirements
In accordance with article 728a paragraph 1 item 3 CO and Swiss Auditing Standard 890, we confirm that an internal control
system exists which has been designed for the preparation of consolidated financial statements according to the instructions
of the Board of Directors.
We recommend that the consolidated financial statements submitted to you be approved.
PricewaterhouseCoopers AG
Beat Inauen
Audit expert
Auditor in charge
Martin Knöpfel
Audit expert
St. Gallen, 8 March 2017
GeberitAG
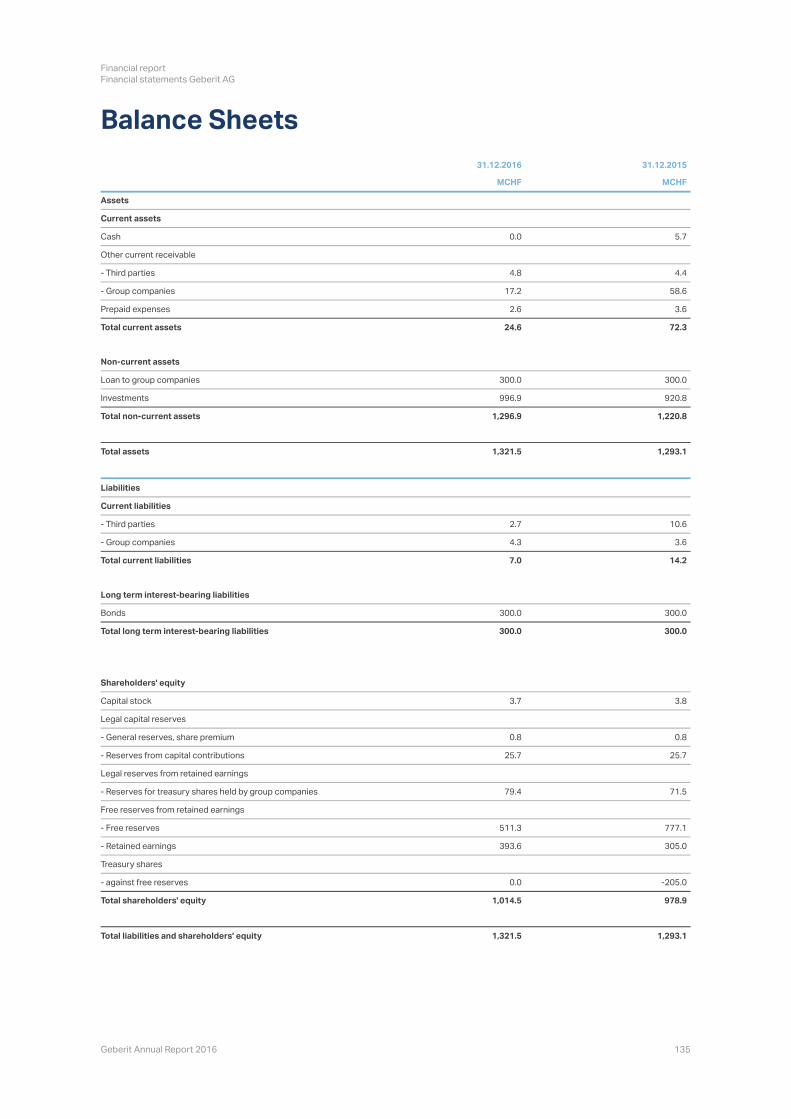
Financial report
Financial statements Geberit AG
Geberit Annual Report 2016 135
Balance Sheets
31.12.2016 31.12.2015
MCHF MCHF
Assets
Current assets
Cash 0.0 5.7
Other current receivable
- Third parties 4.8 4.4
- Group companies 17.2 58.6
Prepaid expenses 2.6 3.6
Total current assets 24.6 72.3
Non-current assets
Loan to group companies 300.0 300.0
Investments 996.9 920.8
Total non-current assets 1,296.9 1,220.8
Total assets 1,321.5 1,293.1
Liabilities
Current liabilities
- Third parties 2.7 10.6
- Group companies 4.3 3.6
Total current liabilities 7.0 14.2
Long term interest-bearing liabilities
Bonds 300.0 300.0
Total long term interest-bearing liabilities 300.0 300.0
Shareholders' equity
Capital stock 3.7 3.8
Legal capital reserves
- General reserves, share premium 0.8 0.8
- Reserves from capital contributions 25.7 25.7
Legal reserves from retained earnings
- Reserves for treasury shares held by group companies 79.4 71.5
Free reserves from retained earnings
- Free reserves 511.3 777.1
- Retained earnings 393.6 305.0
Treasury shares
- against free reserves 0.0 -205.0
Total shareholders' equity 1,014.5 978.9
Total liabilities and shareholders' equity 1,321.5 1,293.1
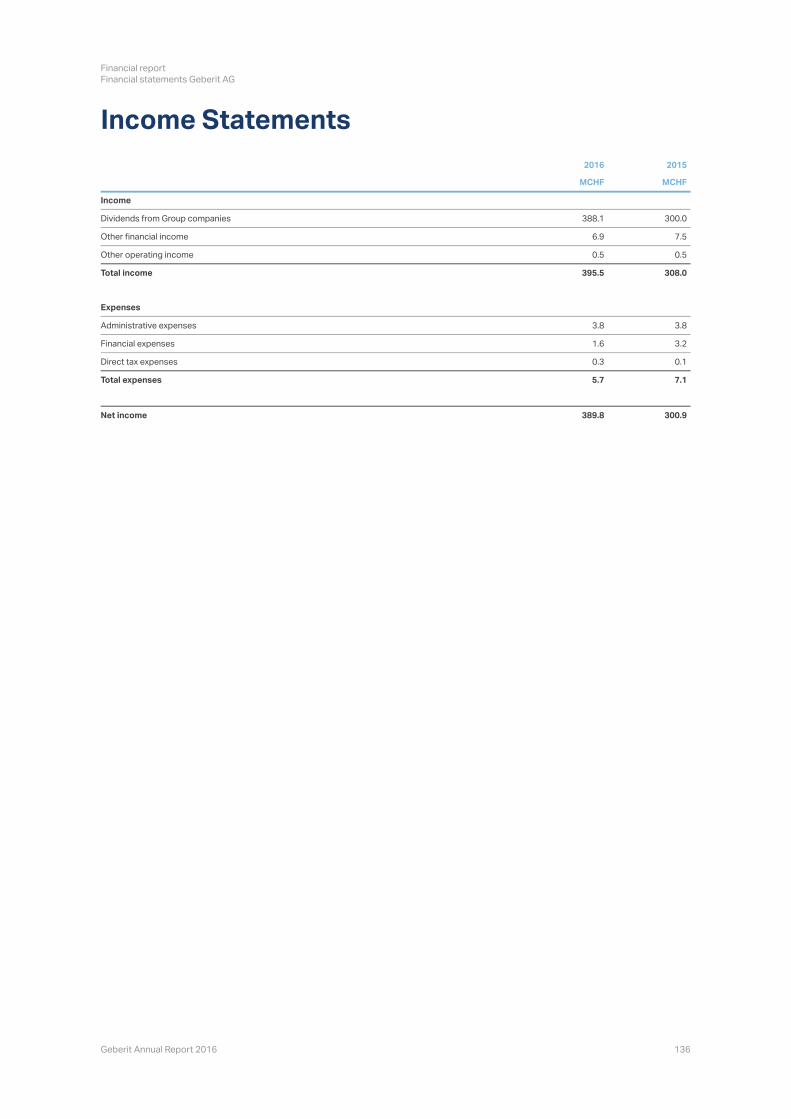
Financial report
Financial statements Geberit AG
Geberit Annual Report 2016 136
Income Statements
2016 2015
MCHF MCHF
Income
Dividends from Group companies 388.1 300.0
Other financial income 6.9 7.5
Other operating income 0.5 0.5
Total income 395.5 308.0
Expenses
Administrative expenses 3.8 3.8
Financial expenses 1.6 3.2
Direct tax expenses 0.3 0.1
Total expenses 5.7 7.1
Net income 389.8 300.9
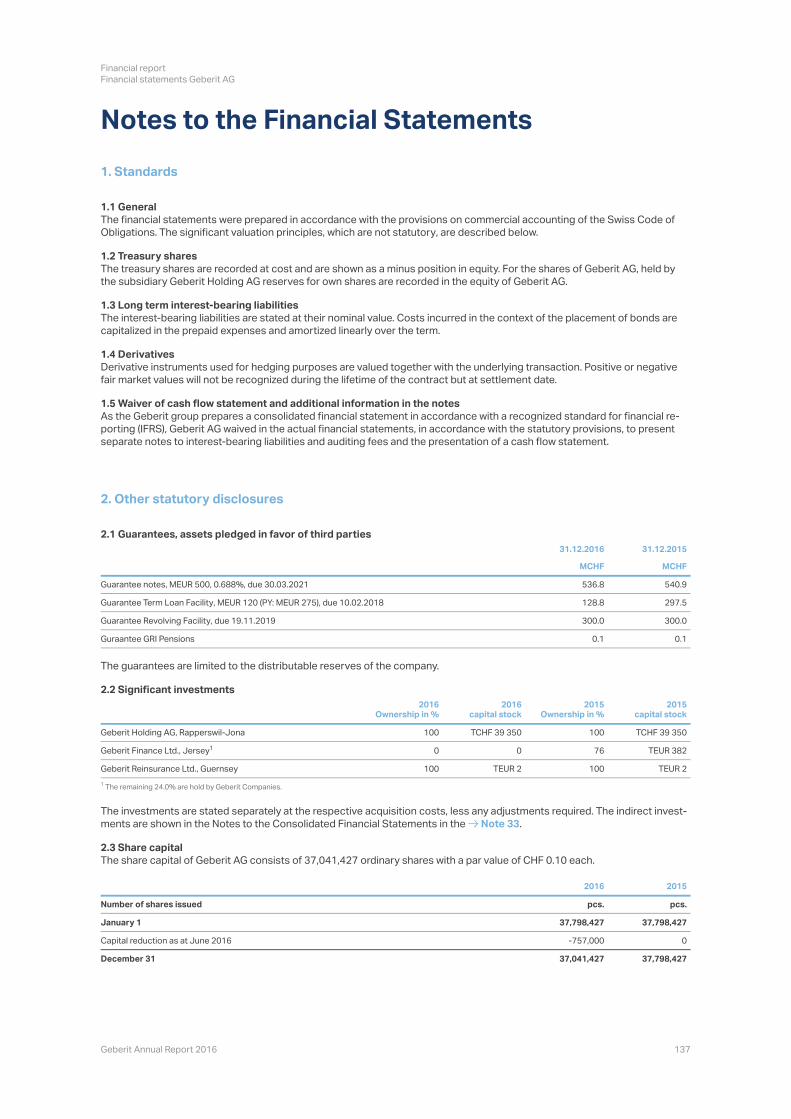
Financial report
Financial statements Geberit AG
Geberit Annual Report 2016 137
Notes to the Financial Statements
1. Standards
1.1 General
The financial statements were prepared in accordance with the provisions on commercial accounting of the Swiss Code of
Obligations. The significant valuation principles, which are not statutory, are described below.
1.2 Treasury sharesThe treasury shares are recorded at cost and are shown as a minus position in equity. For the shares of Geberit
the subsidiary Geberit Holding AG reserves for own shares are recorded in the equity of Geberit
1.3 Long term interest-bearing liabilities
The interest-bearing liabilities are stated at their nominal value. Costs incurred in the context of the placement of bonds are
capitalized in the prepaid expenses and amortized linearly over the term.
1.4 DerivativesDerivative instruments used for hedging purposes are valued together with the underlying transaction. Positive or negative
fair market values will not be recognized during the lifetime of the contract but at settlement date.
1.5 Waiver of cash flow statement and additional information in the notesAs the Geberit
porting (IFRS), Geberit
separate notes to interest-bearing liabilities and auditing fees and the presentation of a cash flow statement.
2. Other statutory disclosures
2.1 Guarantees, assets pledged in favor of third parties
31.12.2016 31.12.2015
MCHF MCHF
Guarantee notes, MEUR 500, 0.688%, due 30.03.2021 536.8 540.9
Guarantee Term Loan Facility, MEUR 120 (PY: MEUR 275), due 10.02.2018 128.8 297.5
Guarantee Revolving Facility, due 19.11.2019 300.0 300.0
Guraantee GRI Pensions 0.1 0.1
The guarantees are limited to the distributable reserves of the company.
2.2 Significant investments
2016Ownership in %
2016capital stock
2015Ownership in %
2015capital stock
Geberit Holding AG, Rapperswil-Jona 100 100
Geberit Finance Ltd., Jersey 0 0 76 TEUR 382
Geberit Reinsurance Ltd., Guernsey 100 TEUR 2 100 TEUR 2
ments are shown in the Notes to the Consolidated Financial Statements in the .
2.3 Share capital
The share capital of Geberit
2016 2015
Number of shares issued pcs. pcs.
January 1 37,798,427 37,798,427
Capital reduction as at June 2016 -757,000 0
December 31 37,041,427 37,798,427
1
1
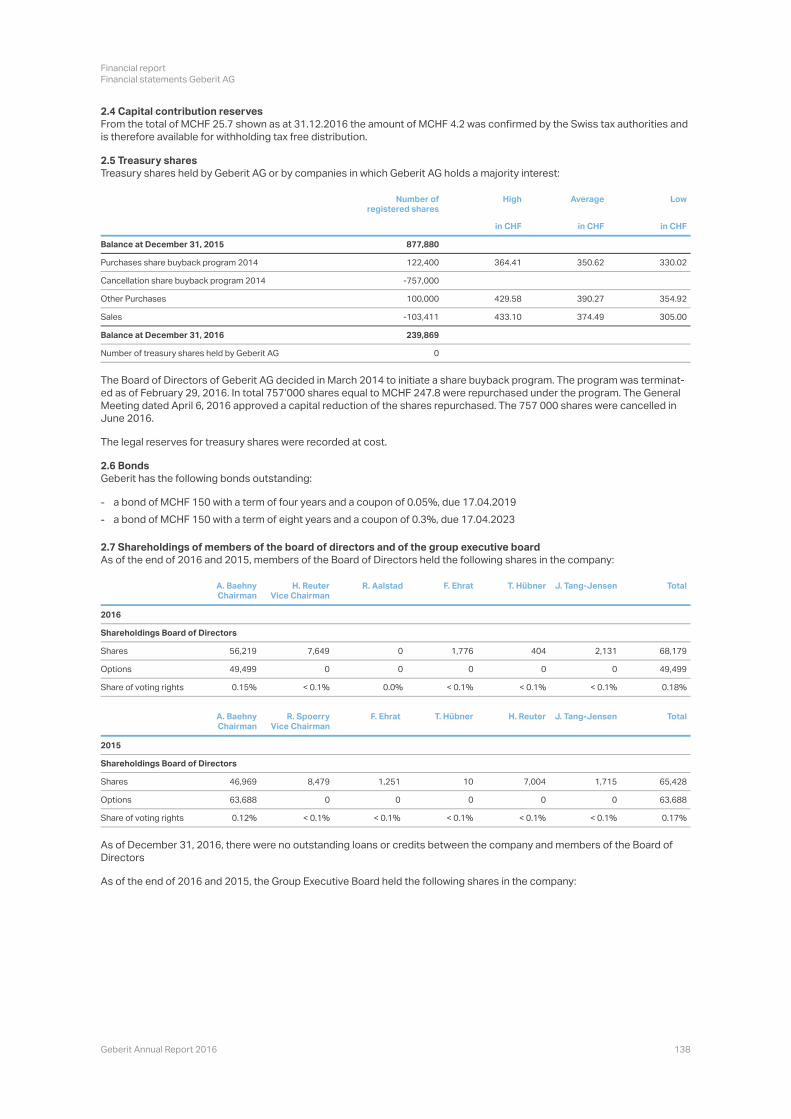
Financial report
Financial statements Geberit AG
Geberit Annual Report 2016 138
2.4 Capital contribution reserves
is therefore available for withholding tax free distribution.
2.5 Treasury shares
Treasury shares held by Geberit Geberit
Number ofregistered shares
High Average Low
in CHF in CHF in CHF
Balance at December 31, 2015 877,880
Purchases share buyback program 2014 122,400 364.41 350.62 330.02
Cancellation share buyback program 2014 -757,000
Other Purchases 100,000 429.58 390.27 354.92
Sales -103,411 433.10 374.49 305.00
Balance at December 31, 2016 239,869
Number of treasury shares held by Geberit AG 0
The Board of Directors of Geberit
June 2016.
The legal reserves for treasury shares were recorded at cost.
2.6 BondsGeberit has the following bonds outstanding:
2.7 Shareholdings of members of the board of directors and of the group executive boardAs of the end of 2016 and 2015, members of the Board of Directors held the following shares in the company:
A. BaehnyChairman
H. ReuterVice Chairman
R. Aalstad F. Ehrat T. Hübner J. Tang-Jensen Total
2016
Shareholdings Board of Directors
Shares 56,219 7,649 0 1,776 404 2,131 68,179
Options 49,499 0 0 0 0 0 49,499
Share of voting rights 0.15% < 0.1% 0.0% < 0.1% < 0.1% < 0.1% 0.18%
A. BaehnyChairman
R. SpoerryVice Chairman
F. Ehrat T. Hübner H. Reuter J. Tang-Jensen Total
2015
Shareholdings Board of Directors
Shares 46,969 8,479 1,251 10 7,004 1,715 65,428
Options 63,688 0 0 0 0 0 63,688
Share of voting rights 0.12% < 0.1% < 0.1% < 0.1% < 0.1% < 0.1% 0.17%
As of December 31, 2016, there were no outstanding loans or credits between the company and members of the Board of
Directors
As of the end of 2016 and 2015, the Group Executive Board held the following shares in the company:
a bond of MCHF 150 with a term of four years and a coupon of 0.05%, due 17.04.2019-
a bond of MCHF 150 with a term of eight years and a coupon of 0.3%, due 17.04.2023-

Financial report
Financial statements Geberit AG
Geberit Annual Report 2016 139
Maturity Average exercise
price in CHF
C. BuhlCEO
R. IffCFO müller hard Sasse mann
R. vanTriest
Total
2016
Shareholdings Group Executive Board
4,588 31,812 1,343 2,500 2,336 8,691 40 51,310
< 0.1% < 0.1% < 0.1% < 0.1% < 0.1% < 0.1% < 0.1% 0.14%
Call options
Lapsed 2017-2022 242.80 1,633 0 3,046 0 1,990 7,314 0 13,983
2017 2020-2023 306.01 5,841 9,172 995 9,308 2,789 8,013 10 36,128
2018 2021-2023 330.95 5,339 6,834 687 7,011 2,477 6,140 10 28,498
2019 2022-2026 355.45 10,896 7,227 600 7,739 3,920 6,647 2,556 39,585
2020 2023-2026 361.75 6,377 3,994 325 4,331 2,006 3,706 2,556 23,295
2021 2026 361.75 6,100 3,866 277 4,206 1,909 3,628 2,546 22,532
Total options 36,186 31,093 5,930 32,595 15,091 35,448 7,678 164,021
Percentage potential share of voting < 0,1% < 0.1% < 0.1% < 0.1% < 0.1% < 0,1% < 0,1% 0.44%
Maturity Average exercise
price in CHF
C. BuhlCEO
R. IffCFO Sasse mann
R. vanTriest
Total
2015
Shareholdings Group Executive Board
3,480 31,300 2,000 1,665 7,462 0 45,907
< 0.1% < 0.1% < 0.1% < 0.1% < 0.1% 0.0% 0.12%
Call options
Lapsed 2017-2021 225.54 1,547 0 375 2,298 2,103 0 6,323
2016 2017-2022 242.80 1,709 7,558 7,567 1,483 6,541 0 24,858
2017 2020-2022 287.43 5,564 9,044 9,183 2,692 7,935 0 34,418
2018 2021-2022 315.55 5,062 6,706 6,886 2,380 6,062 0 27,096
2019 2022 349.15 4,519 3,233 3,408 1,914 2,941 0 16,015
Total options 18,401 26,541 27,419 10,767 25,582 0 108,710
Percentage potential share of voting < 0,1% < 0.1% < 0.1% < 0.1% < 0.1% 0.0% 0.29%
ecutive Board
2.8 Significant shareholders
According to the information available to the Board of Directors, the following shareholders have attained or exceeded the
threshold of 3% of the share capital of Geberit
31.12.2016 31.12.2015
Capital Group Companies, Inc., Los Angeles 4.94% 4.94%
Black Rock, New York 4.84% 5.11%
2.9 EmployeesIn Geberit
1
1
1
1
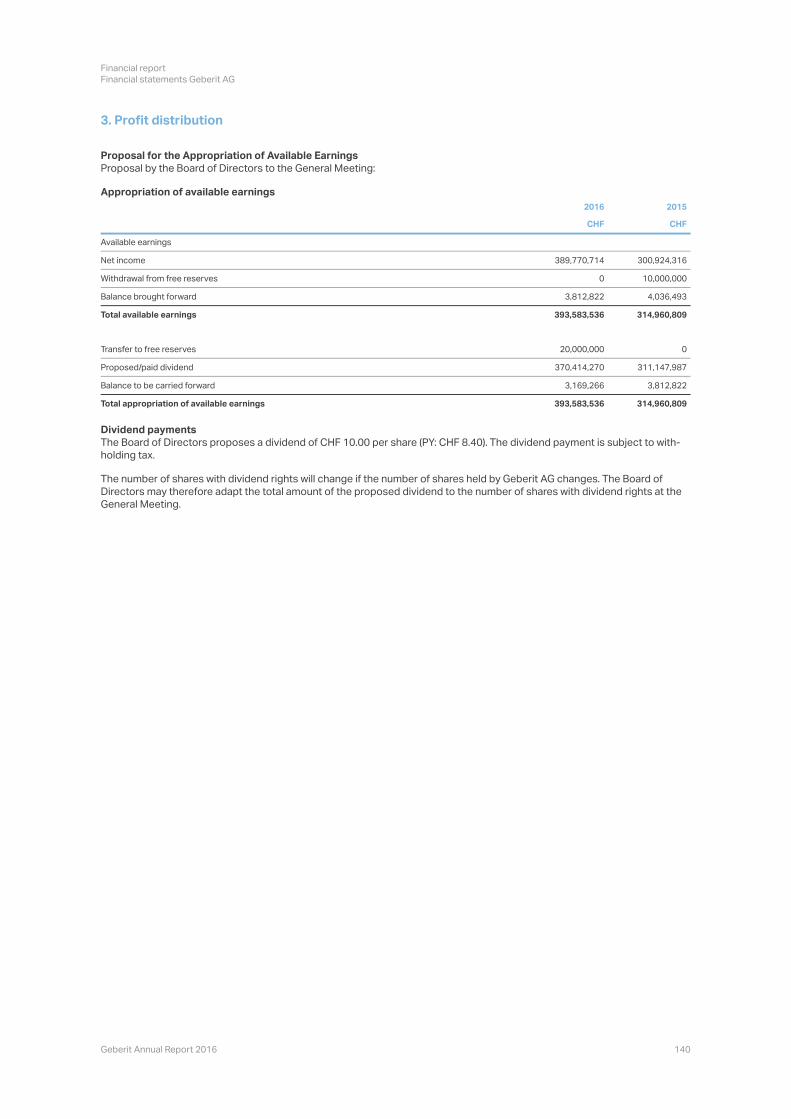
Financial report
Financial statements Geberit AG
Geberit Annual Report 2016 140
3. Profit distribution
Proposal for the Appropriation of Available EarningsProposal by the Board of Directors to the General Meeting:
Appropriation of available earnings
2016 2015
CHF CHF
Available earnings
Net income 389,770,714 300,924,316
Withdrawal from free reserves 0 10,000,000
Balance brought forward 3,812,822 4,036,493
Total available earnings 393,583,536 314,960,809
Transfer to free reserves 20,000,000 0
Proposed/paid dividend 370,414,270 311,147,987
Balance to be carried forward 3,169,266 3,812,822
Total appropriation of available earnings 393,583,536 314,960,809
Dividend paymentsThe Board of Directors proposes a dividend of CHF 10.00 per share (PY: CHF 8.40
holding tax.
The number of shares with dividend rights will change if the number of shares held by Geberit
Directors may therefore adapt the total amount of the proposed dividend to the number of shares with dividend rights at the
General Meeting.

Financial report
Financial statements Geberit AG
Geberit Annual Report 2016 141
Report of the statutory auditor
PricewaterhouseCoopers AG
Birchstrasse 160
8050 Zurich
Telephone +41 58 792 44 00
Fax +41 58 792 44 10
www.pwc.ch
Report of the statutory auditor
to the general meeting of
Geberit AG
Rapperswil-Jona
Report on the audit of the financial statements
OpinionWe have audited the financial statements of Geberit AG, which comprise the balance sheet
income statement for the year then ended and notes, including a summary of significant accounting policies.
ticles of incorporation.
Basis for opinion
our report.
dit evidence we have obtained is sufficient and appropriate to provide a basis for our opinion.
Our audit approach
Overview
Audit scope
ing estimates that involved making assumptions and considering future events that are inherently uncertain. As in all of our
audits, we also addressed the risk of management override of internal controls, including among other matters consideration
of whether there was evidence of bias that represented a risk of material misstatement due to fraud.
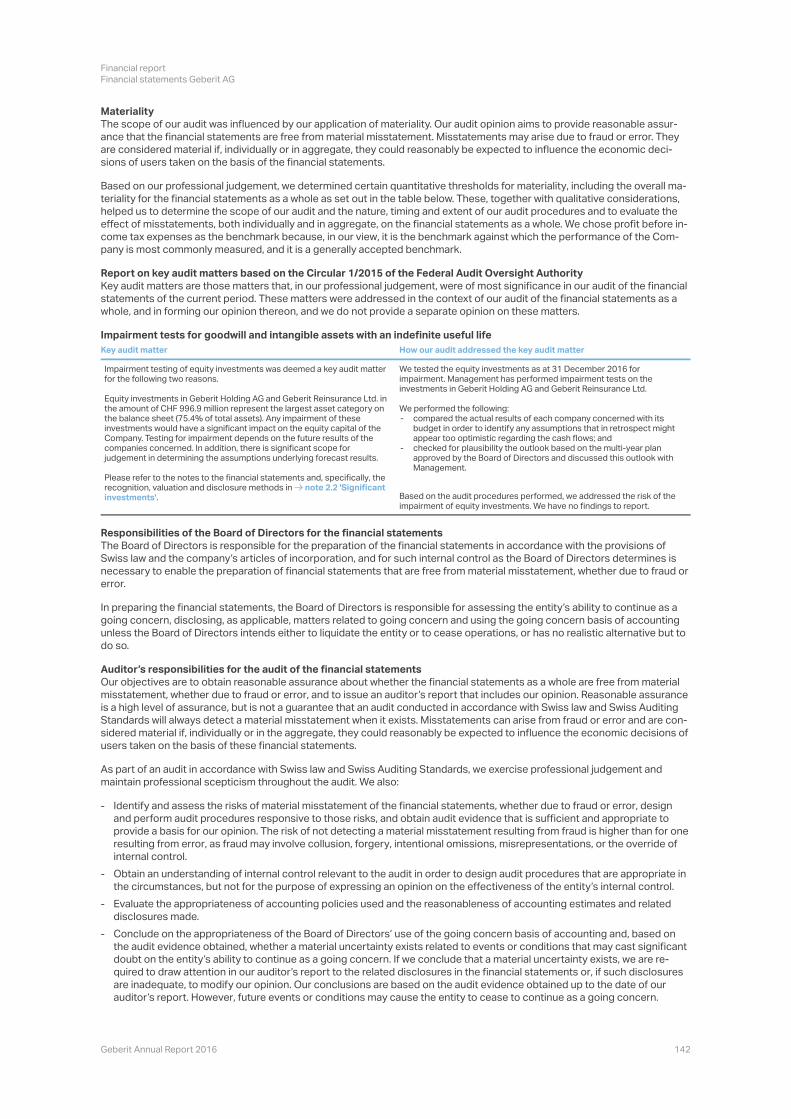
Financial report
Financial statements Geberit AG
Geberit Annual Report 2016 142
Materiality
ance that the financial statements are free from material misstatement. Misstatements may arise due to fraud or error. They
sions of users taken on the basis of the financial statements.
Based
teriality for the financial statements as a whole as set out in the table below. These, together with qualitative considerations,
helped us to determine the scope of our audit and the nature, timing and extent of our audit procedures and to evaluate the
pany is most commonly measured, and it is a generally accepted benchmark.
Report on key audit matters based on the Circular 1/2015 of the Federal Audit Oversight Authority
Key audit matters are those matters that, in our professional judgement, were of most significance in our audit of the financial
statements of the current period. These matters were addressed in the context of our audit of the financial statements as a
whole, and in forming our opinion thereon, and we do not provide a separate opinion on these matters.
Impairment tests for goodwill and intangible assets with an indefinite useful life
Key audit matter How our audit addressed the key audit matter
Impairment testing of equity investments was deemed a key audit matter for the following two reasons.
Equity investments in Geberit Holding AG and Geberit Reinsurance Ltd. in the amount of CHF 996.9 million represent the largest asset category on the balance sheet (75.4% of total assets). Any impairment of these investments would have a significant impact on the equity capital of the Company. Testing for impairment depends on the future results of the companies concerned. In addition, there is significant scope for judgement in determining the assumptions underlying forecast results.
Please refer to the notes to the financial statements and, specifically, the recognition, valuation and disclosure methods in note 2.2 'Significant investments'.
We tested the equity investments as at 31 December 2016 for impairment. Management has performed impairment tests on the investments in Geberit Holding AG and Geberit Reinsurance Ltd.
We performed the following:
Based on the audit procedures performed, we addressed the risk of the impairment of equity investments. We have no findings to report.
Responsibilities of the Board of Directors for the financial statements
The Board of Directors is responsible for the preparation of the financial statements in accordance with the provisions of
Directors determines is
necessary to enable the preparation of financial statements that are free from material misstatement, whether due to fraud or
error.
In preparing the financial statements, the Board of Directors is responsible
going concern, disclosing, as applicable, matters related to going concern and using the going concern basis of accounting
unless the Board of Directors intends either to liquidate the entity or to cease operations, or has no realistic alternative but to
do so.
Our objectives are to obtain reasonable assurance about whether the financial statements as a whole are free from material
is a high level of assurance, but is not a guarantee that an audit conducted in accordance with Swiss law and Swiss Auditing
sidered material if, individually or in the aggregate, they could reasonably be expected to influence the economic decisions of
users taken on the basis of these financial statements.
As part of an audit in accordance with Swiss law and Swiss Auditing Standards, we exercise professional judgement and
maintain professional scepticism throughout the audit. We also:
compared the actual results of each company concerned with its budget in order to identify any assumptions that in retrospect might appear too optimistic regarding the cash flows; and
-
checked for plausibility the outlook based on the multi-year plan approved by the Board of Directors and discussed this outlook with Management.
-
Identify and assess the risks of material misstatement of the financial statements, whether due to fraud or error, design
and perform audit procedures responsive to those risks, and obtain audit evidence that is sufficient and appropriate to
provide a basis for our opinion. The risk of not detecting a material misstatement resulting from fraud is higher than for one
resulting from error, as fraud may involve collusion, forgery, intentional omissions, misrepresentations, or the override of
internal control.
-
Obtain an understanding of internal control relevant to the audit in order to design audit procedures that are appropriate in -
Evaluate the appropriateness of accounting policies used and the reasonableness of accounting estimates and related
disclosures made.-
Conclude on the appropriateness of the Board of Directors based on
the audit evidence obtained, whether a material uncertainty exists related to events or conditions that may cast significant
are inadequate, to modify our opinion. Our conclusions are based on the audit evidence obtained up to the date of our
-
Financial report
Financial statements Geberit AG
Geberit Annual Report 2016 143
We communicate with the Board of Directors or its relevant committee regarding, among other matters, the planned scope
and timing of the audit and significant audit findings, including any significant deficiencies in internal control that we identify
during our audit.
We also provide the Board of Directors or its relevant committee with a statement that we have complied with relevant ethical
requirements regarding independence, and communicate to them all relationships and other matters that may reasonably be
thought to bear on our independence, and where applicable, related safeguards.
From the matters communicated with the Board of Directors or its relevant committee, we determine those matters that were
of most significance in the audit of the financial statements of the current period and are therefore the key audit matters. We
in extremely rare circumstances, we determine that a matter should not be communicated in our report because the adverse
consequences of doing so would reasonably be expected to outweigh the public interest benefits of such communication.
Report on other legal and regulatory requirements
In accordance with article 728a paragraph 1 item 3 CO and Swiss Auditing Standard 890, we confirm that an internal control
system exists which has been designed for the preparation of financial statements according to the instructions of the Board
of Directors.
of incorporation. We recommend that the financial statements submitted to you be approved.
PricewaterhouseCoopers AG
Beat Inauen
Audit expert
Auditor in charge
Martin Knöpfel
Audit expert
St. Gallen, 8 March 2017