final report to calfed - delta stewardship...
TRANSCRIPT

Final report to CalFed on: Project No. SCI-05-C179
Chinook salmon rearing in the San Francisco Bay-Delta system: Identification of geochemical markers to determine Delta use
July 22, 2009 B. Lynn Ingram, Department of Earth and Planetary Science, University of California, Berkeley Peter K. Weber, Lawrence Livermore National Laboratory Corey C. Phillis, Department of Earth and Planetary Science, University of California, Berkeley
Introduction
This report summarizes work performed under CalFed Project No. SCI-05-C179.
The goal of this project was to develop otolith geochemical markers to determine juvenile
salmonid timing and duration of Delta and Bay use. We focused on Delta use because the
role of the Delta in salmonid rearing is a major question in Central Valley ecosystem and
water management. In addition we investigated geochemical markers in regions upstream
and downstream of the Delta.
Our work encompassed investigating numerous potential otolith geochemical
markers utilizing a number of analytical instruments. We first summarize our results by
geochemical marker with recommendations on their efficacy, both in the Delta and in
habitats upstream/downstream. We finish by making recommendations for the
application of geochemical markers in the Delta and beyond.
Elemental Ratio Markers
Elemental ratio markers such as Sr/Ca, and to a lesser extent Ba/Ca, Mn/Ca, Mg/Ca, have
been widely used otolith tools in determining movement from freshwater to salt water
and visa versa. The challenge here was to determine if any of these markers could be
used to determine residence in a region where fresh and marine waters mix. For this
marker to be useful it must detect an exit from the Delta. Two methods were applied to
determining at what point in the Bay-Delta system otolith Sr/Ca begins to increase from

low freshwater values to the higher, marine influenced values, for the use as a potential
Delta exit marker. Otoliths from USFWS juvenile salmon collected from Elkhorn, North
Delta, and South Delta sites were compared to otoliths from Chipps Island, Suisun Bay
and San Pablo Bay. Sr/Ca, Mg/Ca, and Ba/Ca ratios of the outer-most portion of the
otoliths were analyzed by LA-ICPMS surface ablations and nanoSIMS edge analyses.
LA-ICPMS Surface Ablations
The outer-most portion of whole juvenile otoliths were ablated by laser and
analyzed by LA-ICPMS. Otolith Sr/Ca, Ba/Ca, and Mg/Ca was measured for fish
captured from similar locations and compared to values from fish collected at different
sites in the Delta and the outer bays (Figure 1.).
(a)
0
0.2
0.4
0.6
0.8
1
1.2
1.4
1.6
1.8
2
Elkhorn North Delta South Delta Chipps
Island
Suisun Bay Suisun Bay
(Edge
analysis)
San Pablo
Bay
Collection Site
Sr/
Ca
(m
mo
l/m
ol)
(b)
0
0.005
0.01
0.015
0.02
0.025
0.03
0.035
0.04
0.045
0.05
Elkhorn North Delta South Delta Chipps
Island
Suisun Bay Suisun Bay
(Edge
analysis)
San Pablo
Bay
Collection Site
Ba
/Ca (
mm
ol/m
ol)
Figure 1. Surface laser ablation analyses of Sr/Ca (a), Ba/Ca (b), and Mg/Ca (c) for fish collected at six different sites within the San Francisco Bay Delta system. Edge analyses with a 20 micron laser spot size were performed for sectioned otoliths collected in Suisun Bay for comparison to the surface ablation method. Results confirm the edge analysis method samples more material than the most recent otolith material deposited sampled by the surface ablation method.

(c)
0
0.5
1
1.5
2
2.5
3
3.5
4
4.5
Elkhorn North Delta South Delta Chipps Island Suisun Bay Suisun Bay
(Edge
analysis)
San Pablo
Bay
Collection Site
Mg
/Ca (
mm
ol/
mo
l)
Differences in Sr/Ca between the Delta sites and sites west of the Delta were not
significant. Ba/Ca at both the North and South Delta sites were significantly higher than
Suisun and San Pablo Bays, and in the case of the North Delta site, Chipps Island.
Mg/Ca in fish collected at Elkhorn was significantly higher than all other sites. This data
suggests that potentially Mg/Ca could be used as a Delta entry marker and Ba/Ca could
be used as a Delta exit marker. However, this method proved to have much lower
temporal resolution (20 um spot =~1 week) than that of the nanoSIMS edge analyses (see
below).
NanoSIMS Edge Analyses
Juvenile otoliths from fish collected at different sites within the system were
polished to expose the daily banding and analyzed with the nanoSIMS using a spot size
of 2 microns (~1/2 day temporal resolution). The area representing the most recent
otolith growth was analyzed to determine local chemistry. Sr/Ca values near the edge of
the otolith from fish caught in Suisun Bay and San Pablo Bay were higher than the
respective site means measured by LA-ICPMS, suggesting the laser ablation method is
integrating more material than the NanoSIMS method (Figure 2.).
Mean Sr/Ca in the ocean portion of an adult otolith was significantly greater than
the Sr/Ca in the most recently deposited otolith material of a Suisun Bay caught fish, but

not significantly greater than the San Pablo Bay caught fish, suggesting Sr/Ca could
detect a fish’s exit from Suisun Bay, but not from the Delta. The full life-history of a
Butte Creek adult salmon suggests Sr/Ca may exceed the mean ocean Sr/Ca value at
some point in the outer bays or early in the ocean residence before returning to the mean
ocean value; however, it is not known if this is a reflection of local water chemistry or
due to physiological changes occurring in the fish (e.g. smolting).
SFB6
Ocean
San Pablo Bay
Suisun Bay
South Delta
North Delta
Elkhorn
0
0.5
1
1.5
2
2.5
Sr/
Ca (
mm
ol/m
ol)
naoSIMS Laser Ablation Site Means
SFB2
Ocean
San Pablo Bay
Suisun Bay
South Delta
North Delta
Elkhorn
0
0.5
1
1.5
2
2.5
Sr/
Ca (
mm
ol/m
ol)
naoSIMS Laser Ablation Site Means
Figure 2. Sr/Ca Results from a Suisun Bay caught juvenile (SFB6), San Pablo Bay caught juvenile (SFB2), and Butte Creek adult Chinook salmon (BCA10) analyzed by nanoSIMS edge analysis. The laser ablation Sr/Ca site means are plotted for comparison (ocean mean is from the marine portion of a nanoSIMS analyzed adult). For SFB6 and SFB2, the area analyzed represents ~8 days of otolith growth. BCA10 is a full life-history transect from natal river origin to return spawning migration.

BCA10
Ocean
San Pablo Bay
Suisun Bay
South Delta
North Delta
Elkhorn
0
0.5
1
1.5
2
2.5
3
Sr/
Ca
(m
mo
l/m
ol)
naoSIMS Laser Ablation Site Means
Conclusion:
We believe elemental ratios, in particular Sr/Ca, will continue to be useful markers to
detect transitions from freshwater to the marine environment, however they should be
used with a full understanding of their strengths and weaknesses. The major factors that
controls the utility of otolith Sr/Ca in estuaries are the shape of the response to salinity
(Figure 3.), the variability in otolith Sr/Ca relative to water chemistry, and the precision
with which otolith Sr/Ca can be measured (Phillis et al., in prep). For these reasons we
believe Sr/Ca is a suitable marker for detecting anadromy (i.e. ocean going Steelhead vs.
resident Rainbow Trout), but not a particularly effective marker of detecting residence or
habitat use within the Delta or Estuary.

Fig. 3. Sr concentration (●), ∆87Sr (▲), and Sr/Ca (□) at 12 sites within SFBE.
Calculated ∆87Sr (solid black line) and Sr/Ca (solid gray line) mixing curves and the
linear fit of Sr concentration (dashed black line) are plotted (From Phillis et al, in prep). D
elta
Chip
ps
Isla
nd S
uis
un B
ay Suis
un
Bay
Car
quin
ez S
trai
t
Car
qu
inez
Str
ait
San
Pab
lo B
ay
San
Pab
lo B
ayS
an P
ablo
Bay
San
Pab
lo B
ay
San
Fra
nci
sco B
ay
San
Fra
nci
sco
Bay
San
Fra
nci
sco
Bay
Sea
wat
er S
tan
dar
d
0
1
2
3
4
5
6
7
8
9
0 5 10 15 20 25 30 35
Salinity (ppt)
Sr
con
cen
trat
ion
(p
pm
); S
r/C
a (m
mo
l•m
ol
-1)
-300
-250
-200
-150
-100
-50
0
∆8
7S
r
∆87
SrSr/Ca
Sr
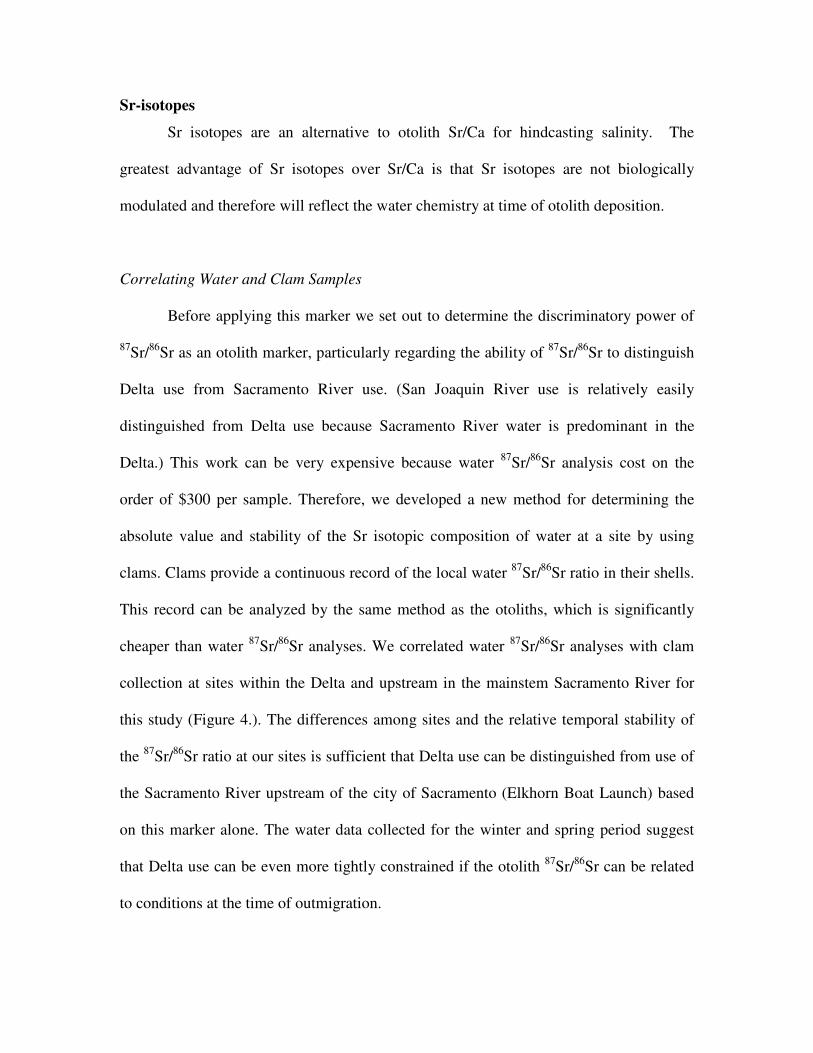
Sr-isotopes
Sr isotopes are an alternative to otolith Sr/Ca for hindcasting salinity. The
greatest advantage of Sr isotopes over Sr/Ca is that Sr isotopes are not biologically
modulated and therefore will reflect the water chemistry at time of otolith deposition.
Correlating Water and Clam Samples
Before applying this marker we set out to determine the discriminatory power of
87Sr/86Sr as an otolith marker, particularly regarding the ability of 87Sr/86Sr to distinguish
Delta use from Sacramento River use. (San Joaquin River use is relatively easily
distinguished from Delta use because Sacramento River water is predominant in the
Delta.) This work can be very expensive because water 87Sr/86Sr analysis cost on the
order of $300 per sample. Therefore, we developed a new method for determining the
absolute value and stability of the Sr isotopic composition of water at a site by using
clams. Clams provide a continuous record of the local water 87Sr/86Sr ratio in their shells.
This record can be analyzed by the same method as the otoliths, which is significantly
cheaper than water 87Sr/86Sr analyses. We correlated water 87Sr/86Sr analyses with clam
collection at sites within the Delta and upstream in the mainstem Sacramento River for
this study (Figure 4.). The differences among sites and the relative temporal stability of
the 87Sr/86Sr ratio at our sites is sufficient that Delta use can be distinguished from use of
the Sacramento River upstream of the city of Sacramento (Elkhorn Boat Launch) based
on this marker alone. The water data collected for the winter and spring period suggest
that Delta use can be even more tightly constrained if the otolith 87Sr/86Sr can be related
to conditions at the time of outmigration.

0.7038
0.7043
0.7048
0.7053
0.7058
0.7063
0.7068
0.7073
Mill
Crk
.
Deer
Crk
.
But
te C
rk.
Uppe
r Sac
. R.
Knigh
ts L
anding
Elkho
rn
Freep
ort
San
Joaq
uin
River
Bra
nnen
Island
She
rman'
s Is
land
Water
Clams
Natal
Tributaries
Upper
Mainsten
Sac. R
Lower
Mainsten
Sac. R
Delta
Figure 4. Water Sr isotopic composition of the San Joaquin River and selected sites along the Sacramento River through the Delta. These data show that the Delta can be distinguished from the Sacramento and San Joaquin rivers based on 87Sr/86Sr ratio, and that the Sacramento River can also be broken down into reaches based on 87Sr/86Sr ratio. Mean and two standard deviations of correlated clam samples are plotted for Elkhorn boat ramp, Freeport, and Brannen Island. Note that the variation in water 87Sr/86Sr at the lower Sacramento and Delta sites is very small. Clam data, which spans a longer period, show more variability.
Application of Otolith Sr-isotopes as a Downstream Migration Marker
The above results, along with previously published work in this system (Barnett-
Johnson et al. 2008, Ingram and Sloan 1992, Ingram and Weber 1999, Weber 2002)
provided evidence that Sr-isotopes would be a potentially viable marker in
retrospectively tracking downstream migration of juvenile salmon. While the spatial
discrimination within the downstream Sacramento River and Delta would be low, it
would allow us to determine the extent this region is used by juvenile salmon, and the
degree to which other markers are needed to further discriminate habitat use within this
area. Before applying the marker we set out to determine which analytical method would
give us the greatest precision and temporal resolution

Natal Stream
Upper Sac. R.
Lower Sac. R. & Delta
SF Bay Estuary
LightLight8787Sr/Sr/8686SrSr
0.70380.7038
HeavyHeavy8787Sr/Sr/8686SrSr
0.70790.7079
Geochemical discrimination
of the California Central
Valley. A strong North-to-
South gradient in Sr-isotopic
ratio allows the Sacramento
River system to be broken
into three regions: Upper
Sacramento River, Lower
Sacramento River and Delta,
and San Francisco Bay
Estuary. Natal streams can
be distinguished from these
three habitats where water
chemistry is distinct (e.g.
Mill Creek, Deer Creek,
Butte Creek.
Figure 5.
Natal StreamNatal Stream
Upper Sac. R.Upper Sac. R.
Lower Sac. R. & DeltaLower Sac. R. & Delta
SF Bay EstuarySF Bay Estuary
LightLight8787Sr/Sr/8686SrSr
0.70380.7038
HeavyHeavy8787Sr/Sr/8686SrSr
0.70790.7079
LightLight8787Sr/Sr/8686SrSr
0.70380.7038
HeavyHeavy8787Sr/Sr/8686SrSr
0.70790.7079
Geochemical discrimination
of the California Central
Valley. A strong North-to-
South gradient in Sr-isotopic
ratio allows the Sacramento
River system to be broken
into three regions: Upper
Sacramento River, Lower
Sacramento River and Delta,
and San Francisco Bay
Estuary. Natal streams can
be distinguished from these
three habitats where water
chemistry is distinct (e.g.
Mill Creek, Deer Creek,
Butte Creek.
Figure 5.
Otolith LA-MC-ICPMS Method Development: Depth Profiling
In our previous report we described a method for measuring the otolith Sr isotope
signal by depth profiling. Advantages of this method are potentially higher temporal
resolution (very little material is ablated with each pass) and higher measurement
precision (parameters may be set to ablate a larger area than a single spot, increasing the
amount of material introduced to the instrument without increasing the depth ablated).
However, our latest work has shown serious drawbacks in this method.
Juvenile salmon otoliths from an experiment where fish were transferred from
Feather River Hatchery to the Fish Health Lab were polished to the core and analyzed by
depth profile and by a more traditional spot transect across the growth axis of the otolith
(Figure 6.). We were looking for two things in this test, 1) is there agreement between

the spot transect and the depth profile, and are they both getting the expected Sr isotope
signal, and 2) are there issues related to the depth of the pit with the depth profile
method?
Figure 6. A juvenile fish reared at the Feather River Hatchery (FRH; 87Sr/86Sr ~0.7070) and then transferred to the Fish Health Lab (FHL; 87Sr/86Sr ~0.7100) was used to compare the laser ablation depth profile and spot transect methods. While it appeared the depth profile method would provide a higher temporal resolution, the lag time in the Sr-isotope signal between the two hatcheries (“Hatchery Transfer”) suggests that there is mixing of material from the walls of the ablation pit.
Results of the analysis indicate that the depth of the analysis pit is an issue to both
precision and accuracy. While both methods agreed and were within error of the
expected Feather River Hatchery (FRH) otolith 87Sr/86Sr, only the spot transect method
produced 87Sr/86Sr values within the expected range of the Fish Health Lab (FHL). The
likely cause of the inaccuracy of the depth profile method in the FHL range is due to the
mixing of material from the walls of the ablation pit (representing earlier otolith
deposition) resulting in an approximate averaging of the FRH and FHL regions. In
FR-FHL 7
FHL expected
otolith 87/86
FRH expected
otolith 87/86
0.70650
0.70750
0.70850
0.70950
0.71050
0 5 10 15 20 25 30 35 40
Depth Profile 60 um spot Expected otolith value from Weber et al., 2005
Core Edge
FRH: Pre First Feeding
FRH: Post First Feeding
Hatchery
Transfer
FHL Residence

addition, as the analysis pit became deeper in the depth profile method, measurement
precision decreased due to the ablated material not being able to escape the analysis pit.
Spot Transects
Spot transects are a widely used and accepted method in otolith geochemistry
because the analysis point is easily matched to the temporal record of the otolith. The
size of the analysis spot presents a tradeoff. Larger spots provide greater measurement
precision, but temporal resolution is sacrificed. Smaller spot size increases the temporal
resolution, but sacrifices the measurement precision because less material is introduced to
the instrument.
We experimented with a number of different spot sizes and instrument parameters
in an effort to maximize both temporal resolution and measurement precision. In the end
we settled on a moderate spot size (60 microns) in two parallel transects offset by 30
microns for an apparent resolution of 30 microns. The method was applied to a series of
otoliths from juvenile salmon raised at Feather River Hatchery, released at Elkhorn Boat
Launch and either recaptured at Elkhorn or on the other side of the Delta at Chipps Island
a known period of time later. In addition to the juvenile otoliths, adult otoliths of
returning spawners from Feather River, Butte Creek, and Coleman Hatchery were
analyzed to determine if the method could sufficiently track downstream migration from
the natal stream or hatchery to ocean entry.
Early results suggest this method has a temporal resolution of approximately one
week and can track downstream migration in the portions of the watershed that are
distinguishable by their Sr isotopic composition (Figure 6). Additionally, the Sr isotopes
appear to distinguish hatchery from in-river reared salmon. Combined, the spot transect
method applied to adult otoliths from in-river carcass surveys could determine if the
individual was a hatchery or wild fish, and where it spent its juvenile life on a weekly
basis from natal river to ocean entry.

Application to populations: Habitat use and timing of downstream migration
We analyzed over 100 otoliths from 2007 spring-run adult spawner carcass surveys on
Mill Creek, Deer Creek, Butte Creek, and winter-run adults collected from Livingston
Stone National Fish Hatchery. Thus, these individuals represent the small fraction of
juveniles with a life history strategy that allowed them to survive to spawning (Figure 7.).
Results from the spring-run populations suggest successful spawners spent very little
time as juveniles (<45 days) in the Sacramento Delta, even though this is often assumed
to be an important rearing habitat. Residence time in natal streams after first feeding
ranged from <2 to 8 months, with most leaving either before 100 days or after 180. Total
residence time ranged from 2 to 11 months, however >70% of individuals spent 6 months
or less in the freshwater system (Figure 8). This bimodality in residence times is
evidence of ocean- and stream-type life-histories. The current dominant extant
populations in the southern range of Chinook salmon are fall-run which only rarely
exhibit stream-type behavior. This represents a shift from historical conditions; stream-
type runs (i.e., spring-run, winter-run) were prevalent in the Sacramento River system
before dams removed much of the headwaters spawning and rearing habitat associated
with stream-type behavior. Habitat degradation of freshwaters likely disproportionately
impacts stream-type salmon, decreasing life-history diversity with consequences for
evolutionary trajectories and population persistence.

Mill Creek
Figure 7. Examples of individual patterns of juvenile downstream migration determined retrospectively from otoliths of spawning adult Chinook salmon recovered in 2007. Time in freshwater is represented as days since the beginning of exogenous feeding. Habitats encountered are bracketed by their Sr-isotope ranges. Top Panel: Four spring-run spawning adults recovered in Mill Creek exhibiting a range of downstream migration patterns. Time spent in the upper watershed (Natal Stream and Upstream Sacramento River) ranged from 70 (yellow line) and 210 (blue line) days. One individual (red line) does not rear in its presumed natal stream of Mill Creek. This individual may have been washed out of Mill Creek before exogenous feeding began, or it is a migrant from Butte Creek. For all individuals migration through the Lower Sacramento River and Delta was rapid. Bottom Panel: Four winter-run spawning adults collected from the Livingston Stone National Fish Hatchery. Of note is one individual (blue line) that enters the American River during its downstream migration (initial Sr-isotope analyses >0.70918 marine value) and another individual (green line) that resides in the Delta ~6 weeks. This is the only individual of the 100 spring-run and winter-run individuals analyzed that exhibited any significant residence in the Delta.
Winter Run
Natal Stream
Upstream Sac. R.
Lower Sac.
R./Delta
San Francisco Bay
Estuary
Pacific Ocean
0.7035
0.7045
0.7055
0.7065
0.7075
0.7085
0.7095
0 45 90 135 180 225 270 315days post exogenous feeding
87S
r/86S
r

Figure 8. Patterns of juvenile habitat use for Mill, Deer, and Butte Creek spring-run Chinook salmon populations. The top panel describes the number of days spent in the natal stream and Upper Sacramento River. Mill and Deer Creek juveniles exhibit bimodality in time spent in these habitats, suggesting sub-yearling and yearling life histories. The range of time spent in these habitats was less for Butte Creek juveniles. Similar patters are seen for total time spent in freshwater (bottom panel). The range of fall-run outmigration time is shown for reference.
Oxygen Isotopes
Sr-isotopes are not a reliable residence marker in waters with salinity greater than
~10 ppt and therefore duration of residence estimates for the San Francisco Bay Estuary
should be treated with caution (Figure 3; Phillis et al., in prep). Use of additional
markers, such as δ18O, can potentially overcome these issues (Malamud-Roam, Phillis,
Weber, et al., in prep). We analyzed otolith δ18O of juvenile Chinook salmon and adult
striped bass otoliths on U.C. Los Angeles’ Secondary Ion Mass Spectrometer (SIMS).

Previous Sr-isotope analyses performed on juvenile Chinook salmon otoliths
suggested migration time through the San Francisco Bay Estuary (Chipps Island to
Golden Gate Bridge) was slow (weeks to months; e.g. Figure 7.). Oxygen isotope
analyses adjacent to the Sr-isotope analyses suggested migration through this region was
rapid (days to weeks). We are inclined to believe the oxygen isotope results because 1)
unlike Sr-isotopes, the oxygen isotopes produce a linear mixing model between
freshwater and marine salinities, increasing the resolution of residence in higher salinity
habitats and 2) the oxygen isotope results corroborate findings by other researchers on
Chinook salmon travel times through this region (e.g. MacFarlane and Norton, 2002).
We also analyzed striped bass otoliths that had previously been analyzed using the
Sr isotope method. Oxygen isotope analyses on these same otoliths greatly decreased the
error in our predicted salinity and habitat residence for these fish.
We believe oxygen isotopes will be a useful tool in the future for identifying
habitat residence of estuarine fish such as striped bass. Fish that utilize the estuarine
habitat for long periods of time (i.e. months) will be the best candidates for this method
because samples may be obtained by micromilling the necessary otolith material and
analyzing it with an isotope ratio mass spectrometer (IRMS). Conversely, the
instrumentation necessary to analyze oxygen isotope incorporation into the otolith at the
weekly scale, as would be necessary to measure juvenile Chinook salmon migration rates
through the estuary, is limited to the more expensive, less available ion probe based mass
spectrometers (e.g. SIMS)

Figure 9. Top panel: Strontium isotope predicted salinity and 2SE for a five year old striped bass. Bottom panel: Oxygen isotope predicted salinity and 2SE with corresponding habitat for the same striped bass. Oxygen isotopes greatly decrease the predicted salinity range inhabited by the fish relative to similar estimates made by strontium isotopes.

PEER-REVIEWED JOURNAL ARTICLES
C.C. Phillis, D.J. Ostrach, Michelle, B.L. Ingram, P.K. Weber. Evaluating otolith Sr/Ca as a tool for reconstructing estuarine habitat use. In Prep. (To be submitted in September 2009 to Canadian Journal of Fisheries and Aquatic Sciences) F. Malamud-Roam, C.C. Phillis, A. Schmitt, B.L. Ingram, P.K. Weber. San Francisco Bay Estuary habitat use determined by otolith stable isotopes. In Prep. (To be submitted in October 2009 to the 4th International Otolith Symposium Special Issue in Environmental Biology of Fishes) C.C. Phillis, P.K. Weber, B.L. Ingram. Life history diversity within imperiled Chinook salmon populations. In Prep. (Tentatively scheduled to be submitted in 2010 to Ecological Applications)
CONFERENCE PRESENTATIONS:
C.C. Phillis, D.J. Ostrach, M.A. Gras, Q.Z. Yin , B.L. Ingram, J.G. Zinkl, P.K.
Weber. A novel method to develop an otolith microchemistry model to determine Striped Bass Habitat Use in the San Francisco Estuary (Oral). CALFED Biennial Science Conference, Sacramento, California, October 2006. C.C. Phillis, P.K. Weber, M.A. Gras, B.L. Ingram. Chinook salmon rearing in the San Francisco Bay-Delta system: Identification of geochemical markers to determine Delta use (Oral). 137th Annual American Fisheries Society Meeting, San Francisco, California, September, 2007. C.C. Phillis, P.K. Weber, B.L. Ingram. The role of juvenile rearing habitats for winter and spring run Chinook salmon, determined by otolith Sr isotopes (poster). ISOSCAPES 2008, Isotope Mapping Workshop, Santa Barbara, California, April, 2008.
C.C. Phillis, P.K. Weber, B.L. Ingram. Freshwater and estuary rearing of successfully spawned adult Chinook salmon, determined by Sr isotopes (Oral). CALFED Biennial Science Conference, Sacramento, California, October 2008.
F. Malamud-Roam, C.C. Phillis, A. Schmitt, B.L. Ingram, P.K. Weber. San Francisco Bay Estuary habitat use determined by otolith stable isotopes (Oral). CALFED Biennial Science Conference, Sacramento, California, October 2008. F. Malamud-Roam, C.C. Phillis, A. Schmitt, B.L. Ingram, P.K. Weber. San Francisco Bay Estuary habitat use determined by otolith stable isotopes (Poster). American Geophysical Union Fall Meeting, San Francisco, California, December 2008.

C.C. Phillis, P.K. Weber, B.L. Ingram. Life history diversity within imperiled Chinook salmon populations (Oral). Fisheries and Marine Ecosystems, Surrey, Canada, April, 2009.
C.C. Phillis, P.K. Weber, B.L. Ingram. Life history diversity within imperiled Chinook salmon populations (Oral). Ecological Society of America, Albuquerque, New Mexico, August 2009.
C.C. Phillis, F. Malamud-Roam, A. Schmitt, B.L. Ingram, P.K. Weber. Life history diversity within imperiled Chinook salmon populations determined by otolith 87Sr/86Sr and δ18O microchemistry (Oral). International Otolith Symposium, Monterey, California, August 2009.
