final report - staffordshire moorlands district council
TRANSCRIPT

Final Report
SMELS 2 FINAL 23 09 08 1

Final Report
SMELS 2 FINAL 23 09 08 2

Final Report
Staffordshire Moorlands Employment Land Study Update
Final Report
September 2008 Notice This report was produced by Atkins Ltd for Staffordshire Moorlands District Council for the specific purpose of Updating the Staffordshire Moorlands Employment Land Review 2006. This report may not be used by any person other than Staffordshire Moorlands District Council without Staffordshire Moorlands District Council’s express permission. In any event, Atkins accepts no liability for any costs, liabilities or losses arising as a result of the use of or reliance upon the contents of this report by any person other than Staffordshire Moorlands District Council.
Document History
JOB NUMBER: 5043757 DOCUMENT REF: Draft Final Report
1 Draft/Final Report MB/MF MF/MB RC RC 30/05/08
2 Final Report MB/MF MF/MB JC JC 23/06/08
3 Final Report JC/MB JC/MB JC JC 18/07/08
4 Final Report JC/MB JC/MB DD JC 14/08/08
5 Final Report JC/MB JC/MB DD JC 23/09/08
Revision Purpose Description Originated Checked Reviewed Authorised Date
SMELS 2 FINAL 23 09 08 3

Final Report
Contents Section Page Executive Summary 7
1. Introduction 9 Background 9 Approach 9 Report Structure 9
2. Planning Policy Review – Update 11 Introduction 11 National Policy Update 11 Regional Policy Update 12 Local Policy Update 17
3. Employment Land Supply - Update 21 Introduction 21 Methodology 21 Analysis of Employment Land Supply 33
4. Employment Land Demand - Update 39 Introduction 39 Economic Profile 39 Employment Forecasts 2006 to 2026 43
5. Commercial Property Market - Update 51 Introduction 51
6. Portfolio of Employment Sites - Update 53 Introduction 53 i) Future Employment Land Requirements 53 ii) Meeting the Demand 54
7. Conclusions 59 Summary of Issues 59 Employment Land Demand-Supply Balance 60 Planning Policy Recommendations 61
List of Tables
Table 3.1 – 2008 Update: Site Typology 22 Table 3.2 – Schedule of Employment Sites Included in the ELS Update 23 Table 3.3 – Employment Land Portfolio – 2006 and 2008 Comparison 33 Table 3.4 – B Class Floorspace Update 34 Table 3.5 – B Class Vacant Floorspace Update 34 Table 3.6 – Premises Update 34 Table 3.7 – Opportunity Land Update 35 Table 3.8 – Summary of Employment Sites – Location 35 Table 3.9 – Potential Development Constraints at New Sites 37 Table 4.1 – Overall Results: Average Annual Growth Rates (%) 44 Table 4.2 – Forecasts for Staffordshire Moorlands by Sector 45 Table 4.3 – Floorspace Requirements by B-Use Class 46 Table 4.4 – Employment Land Requirements by B-Use Class 46 Table 4.5 – B-use Employment in Biddulph, Cheadle & Leek, Person (as % of total in Staffordshire
Moorlands) 47
SMELS 2 FINAL 23 09 08 4

Final Report
Table 4.6 – Indicative Employment Forecast Results 48 Table 4.7 – Indicative Floorspace Requirements in three towns. 49 Table 4.8 – Indicative Employment Land Requirements in three towns. 49 Table 6.1 – Employment Land and Premise Requirements to 2026 54 Table 6.2 – Sites Excluded from Portfolio of Suitable Land 54 Table 6.3 – Existing Sites Suitable for Continued Use 54 Table 6.4 – Potential Opportunity Areas Suitable for Intensification / Redevelopment 57 Appendices Appendix A – Site Specific Information 67
Appendix B Site Supply Findings 79 B.1 Quantitative Findings Update 79 B.2 Accessibility 83 B.3 Access, Servicing and Parking 89 B.4 Property Developed in Last 5 Years – Update* 91 B.5 Environmental Factors 95 B.6 Development Constraints 99 Appendix C Economic Profile 103 C.1 Introduction 105 C.2 Employment Structure 105 C.3 Business Structure 117 C.4 Population and the Labour Market 124 C.5 Travel to Work 131
List of Tables
Table C.C.1 - Staffordshire Moorlands Employment by Broad Sector 106 Table C.C.2 - Employment by Broad Sector across all areas 108 Table C.C.3 - Employment Growth (Average annual % growth between 1998 and 2006) 108 Table C.C.4 - Employment in Staffordshire Moorlands by principle sub-sectors 110 Table C.C.5 – Staffordshire Moorlands by key growth sub-sectors 112 Table C.C.6 – Staffordshire Moorlands key sub-sectors in decline 112 Table C.C.7 – Other Services by 2 Digit Code, Number and as % of total 113 Table C.C.8 - Recreational, Cultural & Sporting Activities in Staffordshire Moorlands 113 Table C.C.9 - SIC Codes Definition of Creative Industries and Tourism & Leisure 114 Table C.C.1 - B-use Employment in all areas 116 Table C.C.2 - B-use Employment Growth Rates 1998/06 116 Table C.C.3 – Business Units by Broad Industrial Sector, as % of total, 2006 118 Table C.C.4 - Business Unit Growth by Sector, 1998/06 118 Table C.C.5 - B-Use Business Units in all areas, as % of 2006 level 119 Table C.C.6 - Business Unit Size Distribution in All areas. 120 Table C.C.7 -Business Unit Size Growth 1998/06 120 Table C.C.8 - Net Change in VAT stock Staffordshire Moorlands by Sector 121 Table C.C.9 - VAT Registrations per 10,000 Population by Sector (2006) 122 Table C.C.10 Self Employment Rates 1998/06 123 Table C. C.11 - Population Growth Rates 124 Table C.C.12 - Population by Age Band, as % of total, 2006 125 Table C.C.13 - ONS Population Projections 2004/29, 000s 126 Table C.C.14 - ONS Working Population Projections 2004/29 126
SMELS 2 FINAL 23 09 08 5

Final Report
Table C. C.15 - Resident Weekly Wages, 2003/07 129 Table C.C.16 - Workplace Weekly Wages, 2003/07 129 Table C.C.17 - Occupational Profile, as % of all in employment 130 Table C.C.18 - Travel Flows from Staffordshire Moorlands 131
List of Figures
Figure C.1 - Total Employment in Staffordshire Moorlands 106 Figure C.1 - Proportion of total employment in Creative Industries and Tourism & Leisure, 2006 115 Figure C.2 - Total Business Units Staffordshire Moorlands 117 Figure C.3 - VAT Registered Businesses in Staffordshire Moorlands 121 Figure C.4 - VAT Registrations per 10,000 Population 122 Figure C.5 - Staffordshire Moorlands Total Population 124 Figure C.6 - Indexed Population Projections, 2004/29 (2004=100) 127 Figure C.7 - Economic Activity 2004/07 128 Figure C.8 - Unemployment1996/2008 128
SMELS 2 FINAL 23 09 08 6

Final Report
Executive Summary This report updates the previous Staffordshire Moorlands Employment Land Study (ELS) which was undertaken in 2006. The ELS update provides advice in respect of the demand and supply for employment land and floorspace for the period 2008 to 2026. The 2026 end-date of the study is consistent with those of the Regional Spatial Strategy for the West Midlands and the Council’s emerging Core Strategy.
Key elements of the study have included updating of the economic forecasting work relating to future employment demand in the District to include current market conditions and the revised end-date of the study.
The employment supply side of the study has also been revised. This has included updating the baseline information relating to certain sites surveyed in 2006 which have experienced significant change in the interim period, and the addition of several new sites which were previously not surveyed. In total, there are a total of 44 employment sites in the District.
Of the existing sites, vacancy level in the District remains low at around 2.4%, although a lack of newer premises including those which could attract higher value industries, is a common theme of the District. A shortage of suitable small scale premises under 100 square metres is also identified.
The ELS update concludes demand exists for an additional 22.2 hectares of employment land in the District to meet demand until 2026. This represents additional need over and above the existing quantum of employment land in the District.
Based on analysis of the site supply findings, there is potential to accommodate this need within existing parcels of vacant land at current employment sites, or within redevelopment opportunity areas at existing sites. There is also potential to meet part of the demand in the Regional Investment Site at Blythe Bridge, although we recommend the intensification of existing employment sites should be prioritised in the first instance. Our findings suggest that additional Greenfield sites are not required to meet future demand for B-class employment land.
SMELS 2 FINAL 23 09 08 7

Final Report
SMELS 2 FINAL 23 09 08 8

Final Report
SMELS 2 FINAL 23 09 08 9
1. Introduction Background
1.1 This report supplements and updates the Staffordshire Moorlands Employment Land Study (ELS) 2006. The ELS provided advice in respect of the demand and supply for employment land and floorspace for the period 2006 to 2021. This report provides an extension of the 2006 ELS from 2021 to 2026 in order to ensure consistency with the plan period in the Council’s emerging Core Strategy and with the RSS for the West Midlands.
1.2 The update does not duplicate the analysis carried out for the 2006 ELS. However where relevant it provides updated information required to inform robust employment land policies for the period 2006 to 2026.
Approach 1.3 The study followed an approach which is consistent with that of the original 2006 ELS in
accordance to the Government’s Guidance on Employment Land Reviews, 2004. The key components of the methodology include:
• An update in the relevant policy context;
• An update to the employment land supply in the District;
• Discussions with local property agents about current employment land supply and demand issues;
• The preparations of employment land demand projections and scenarios extending to 2026; and
• An assessment of the demand-supply balance for the period up to 2026 and implications for policy.
Report Structure 1.4 The remainder of the report is structured as follows:
• Section 1 – Introduction;
• Section 2 – Planning Policy Review Update;
• Section 3 – Employment Land Supply Update;
• Section 4 – Future Employment Demand Update;
• Section 5 – Commercial Property Market Review Update;
• Section 6 – Portfolio of Employment Sites Update; and
• Section 7 – Conclusions & Recommendations

Final Report
SMELS 2 FINAL 23 09 08 10

Final Report
2. Planning Policy Review – Update Introduction
2.1 This section provides a brief update to the policy context set out in the Staffordshire Moorlands Employment Land Study (2006). It focuses on planning policy which has emerged since and does not repeat the review provided previously.
2.2 The revised policy context has been used to inform the recommendations provided as part of this Update report.
National Policy Update PPS3 – Housing
2.3 Since the last study, PPS 3 (November 2006) has replaced PPG3 in respect to housing policy guidance.
2.4 In developing their previously developed land strategies, paragraph 44 of PPS3 states that Local Planning Authorities should consider ‘whether sites that are currently allocated for industrial or commercial use could be more appropriately re-allocated for housing development.’
PPS4 Consultation Draft – Planning for Sustainable Economic Development
2.5 The draft PPS (2007) identifies planning as key to contributing towards improving productivity and the UK’s long term economic performance. Planning can influence productivity and facilitate employment growth, however if it is not responsive to market signals it can also represent a barrier to employment and productivity growth. As such, by providing certainty of land use, the planning system can encourage investment commitments. In addition, well planned infrastructure can improve productivity and create environments where people want to live and work.
2.6 The draft PPS highlights that Local Planning Authorities should plan to encourage economic growth. In seeking planning that positively encourages economic growth the PPS highlights five key objectives:
• Providing a good range of sites identified for economic development and mixed use development;
• Ensuring a good supply of land and buildings offering a range of opportunities for creating new jobs in large and small businesses;
• Focus on high quality development;
• Avoidance of adverse environmental impacts; and
• Shaping travel demand by promoting sustainable travel choices.
2.7 The PPS sets out national planning policies which describe how Local Planning Authorities should plan for economic development. These policies are as follows:
• Local Planning Authorities should plan positively and proactively to encourage economic development in line with principles of sustainable development. Policies should be flexible, in order to respond to economic change.
• Local Planning Authorities should use a wide evidence base to understand both existing business needs and likely changes in the market.
• Local Planning Authorities should plan for and facilitate a supply of land which will be able to cater for differing needs of business and employment needs of the whole community, but this should be flexible enough to respond to changing needs. Designating sites for single or restricted use should be avoided.
SMELS 2 FINAL 23 09 08 11

Final Report
• Local Planning Authorities should seek most efficient use of land and buildings.
• Local Planning Authorities should seek to ensure economic development is high quality and inclusive design. Design should also ensure development addresses climate change.
2.8 In summary, Draft PPS4 promotes a proactive and positive approach to planning for economic development. This includes making provision for a good range of sites (including mixed-use) for large and small businesses. In seeking to engender a more responsive and flexible approach to the provision of employment land, the draft PPS highlights that designating sites for single or restricted use should be avoided.
PPS7 - Sustainable Development in Rural Areas
2.9 PPS7 re-affirms that sustainable development is the core principle underpinning planning and advises that decisions on developments in rural areas should be based on sustainable development principles, including the effective protection of the environment, maintaining high and stable levels of economic growth and employment; and the prudent use of natural resources (paragraph 1). The same paragraph also advises that accessibility should be a key consideration in all development decisions, and that priority should be given to the re-use of previously developed sites in preference to the development of new sites.
2.10 Paragraph 5 of PPS7 advises that Local Planning Authorities should support a wide range of economic activity in rural areas, and in the preparation of Local Development Documents should take account of the need to protect natural resources and provide for the sensitive exploitation of renewable energy sources in accordance with the advice in PPS22 (paragraph 16). In this context, paragraph 17 confirms that the Government’s policy is to support the re-use of appropriately located and suitable constructed existing buildings where this would meet sustainable development objectives. This paragraph goes on to advise that the re-use of existing buildings for economic development purposes will usually be preferable with the following paragraph advising that Local Planning Authorities should be particularly supportive of the re-use of existing buildings for economic development that are adjacent or closely related to existing country towns or villages.
2.11 Paragraph 19 of PPS7 also makes it clear that the Government is supportive of the replacement of suitably located existing buildings of permanent design and construction in the countryside for economic development purposes, and that such replacement should be favoured where this would result in a more acceptable and sustainable development than might be achieved through conversion.
Regional Policy Update Regional Spatial Strategy for the West Midlands
2.12 Employment land and wider issues surrounding economic development are considered in the adopted Regional Spatial Strategy for the West Midlands (January 2008). At the regional level, it is the key planning document in terms of the region’s future growth as Local Development Documents will need to be in conformity with it.
Broad development principles
2.13 One of the main elements of the RSS is to support economic development in Major Urban Areas (MUAs) (Policy PA1). So, in broad planning policy terms, areas inside the MUAs are considered most suitable ‘search areas’ for employment land sites. However, as none of the Staffordshire Moorlands District is classified as a MUA, other guidance comes into force.
2.14 Outside the MUAs, Policy PA1 provides guidance on where development should be located. In terms of location factors the following locations outside MUAs are considered most appropriate where:
• It can help meet the needs of the MUAs and promote positive economic linkages with them in areas accessible by sustainable forms of transport;
• It can help meet the needs of rural renaissance;
SMELS 2 FINAL 23 09 08 12

Final Report
• It can serve the needs of the local regeneration areas; and
• It can help create more sustainable communities by providing a better balance between housing and employment and the need for commuting.
Guidance is also given for sites located on the edge of the MUAs or on other greenfield sites:
• There are no suitable alternatives available on previously developed land and buildings within built up areas;
• The development should be capable of being served by rail or high quality public transport within easy access of centres and facilities; and
• The development respects the natural environment, built environment and
• Historic heritage in accordance with policies QE1-9.
Promoting economic development
2.15 Chapter seven of the RSS contains a range of economic development policies which aim to enhance the prosperity of the region. It encourages the development of new high growth employment sectors and encourages the modernisation of the Region’s existing traditional industries. Policies recognise and promote a ‘portfolio’ approach to ensure the region has the necessary mix of land available for economic growth.
Improving the Region’s Employment Land
2.16 Policy PA5 provides the policy basis for the physical renewal and modernisation of employment sites. The RSS also recognises the need to improve existing sites in Policy UR1, which states the need for land (and transport networks) to be restructured to create employment growth. Policy UR2 identifies towns and cities outside major urban areas where regeneration is a regional priority. Biddulph and Leek are included in this schedule of towns.
Rural Renaissance
2.17 Policy RR1 is of relevance to the District. It identifies that rural areas of the West Midlands will be regenerated in part through the diversification of the rural economy. Policy RR3 gives weight to the redevelopment of market towns and concentration of economic activities in these areas. Policies PA14, Economic Development and the Rural Economy and Policy PA15, Agriculture and Farm Diversification are also important in this regard.
Portfolio of Employment Land
2.18 Consistent with national planning guidance the RSS recommends all relevant bodies should provide a range of land to meet the region’s employment needs. The structure of the hierarchy is arranged in a number of tiers. Criteria are used to determine whether sites are suitable for different employment uses.
• Regional Investment Sites (RIS)
2.19 Support the diversification and modernisation of the region’s economy and the development of the Region’s cluster priorities as identified in the Regional Economic Strategy. Sites are:
- Between 25-50 hectares in terms of their size;‘
- High quality’, attractive to national and international investors;
- Served or are capable or being served by multi-modal transport facilities and broadband IT infrastructure;
- Well related to motorway and trunk road network;
- Located in areas of greatest need;
- Accessible to effective education and training opportunities to ensure that the employment benefits are available to the local workforce.
Major Investment Sites (RIS)
SMELS 2 FINAL 23 09 08 13
Final Report
• Major Investment Sites (MIS)
2.20 The purpose of is to accommodate very large scale investment by single users with an international choice of locations in order to help diversify and restructure the regional economy. They are:
- In the order of 50 hectares in terms of their size;
- High quality sites;
- Served or capable or being served by multi-modal transport facilities and broadband IT infrastructure;
- Well related to motorway network but avoiding sites immediately adjacent to motorway junctions where this is likely to exacerbate existing congestion;
- Located in areas close to a large pool of labour with employment needs;
- Accessible to effective education and training opportunities to ensure that the employment benefits are available to the local workforce;
- Supported by the RPB.
- Examples of Major Investment Sites (MIS) which have been identified in the Region are at Peddimore (Birmingham), Wobaston Road (north of Wolverhampton) and Ansty (north east of Coventry).
• Regional Logistics Sites (RLS)
2.21 Purpose is to provide opportunities for the concentrated development of warehousing and distribution uses. They are:
- Identified in development plans;
- Over 50ha;
- Good quality access to regional rail and highway networks and public transport links;
- Served or capable or being served by multi-modal transport facilities and broadband IT infrastructure;
- Have easy access to an appropriate labour supply and education and training opportunities; and
- Aim to minimise compromise to the local environment.
- The region is expected to have a choice of RLS available at any one time.
• Second tier, locally significant sites)
- High quality attractive sites, generally 10 to 20 ha in size in sustainable urban locations – including market towns – with potential to meet both cluster priorities and local needs. Sites in this category should be suitable to attract clients with an international/national /regional choice of location. Land in this category would usually need to be located on or have a direct link to the strategic highway network and be, or proposed to be, well served by public transport.
• Second tier, Sub Regional Employment Sites Employment Sites (RIS)
- Good quality sites for locally based investment. Sites in this category are likely to exceed 0.4ha. This may include larger sites which are some distance form the strategic highway network as well as sites within rural areas.
• Other Employment Sites
- Land likely to be of interest only to local investors. Sites are likely to be very small (less than 0.4ha) or only likely to be suitable for marginal or ‘bad neighbour activities’. This category may include small sites located within rural areas.
SMELS 2 FINAL 23 09 08 14

Final Report
2.22 The RSS (2008) seeks to meet the region’s future employment needs which will enable economic growth using a portfolio of ‘sustainable located sites attractive to developers and operators and appropriate to market needs’ (para 7.3).
2.23 Policies PA7- PA9 provide further, more detailed criteria, for the first tier of the hierarchy. There is also some realism in terms of being able to provide the full portfolio of sites:
“experience [shows] certain types of site are very difficult and time consuming to provide (para 7.30).”
2.24 A ‘centre first’ approach is encouraged, where provision of employment land should be made in the Major Urban Area, unless there are insufficient sites of an appropriate size available (in which case greenfield sites can be considered).
Phase II Revision of RSS
2.25 Following the approval of the RSS in June 2004, the Secretary of State identified a number of policy issues that needed to be addressed as future revisions. It was agreed this would be done in three phases, with Phase II providing guidance on various issues including employment. Phase II was launched in 2005 and formal consultation has now been undertaken, with the Examination in Public programmed for September 2008.
2.26 Policy PA6A is of direct importance. It maintains the hierarchical approach to provision with first tier employment sites being of regional significance consisting of:
• Regional Investment Sites (RIS);
• Major Investment Sites (MIS); and
• Regional Logistics Sites (RLS).
2.27 Second tier employment sites provide locally significant employment sites. This tier of the hierarchy consists of
• Sub-regional Employment Sites;
• Good Quality Employment Sites; and
• Other Employment Sites.
2.28 Policy PA6A provides further guidance on employment land provision. It states that ‘Local Planning Authorities should make provision for a continuing five-year reservoir of readily available employment land outside town centres throughout the plan period. To ensure the availability of land to meet this requirement local planning authorities are required to take into consideration longer-term employment land requirements taking account of the need to control the release and identification of land through the ‘Plan, Monitor, and Manage’ process. In meeting both the five-year reservoir and longer-term requirements priority should be given to the identification and development of brownfield land...’
2.29 The policy also establishes the district level requirements of both new and redeveloped employment land for the five year reservoir across the region and indicative amounts of land required in the longer term. In respect of longer term provision the figures are indicative to prevent the unnecessary release of large amounts of land. It states future testing is necessary given the indicative nature of the figures before they are included in Core Strategies. It gives an indicative requirement of 6 hectares of employment land as a rolling five year requirement, and 18 hectares for the long term for Staffordshire Moorlands.
2.30 The policy states that in developing employment policies in their development plans, local authorities, in conjunction with AWM, should take account of:
• The needs of existing businesses and taking account of the needs of inward investors:
• The need to ensure that employment opportunities are accessible to areas of significant new housing development.
SMELS 2 FINAL 23 09 08 15

Final Report
• The strategic priority given to Regeneration Zones and High Technology Corridors in meeting employment needs within the Region
• The potential for the maximum use of recycled land for employment purposes to meet these needs but to recognise that the use of some greenfield land may be required, where all other alternatives have been considered.
• That in all cases land allocations should take account of the need to protect and enhance the Region’s natural, built and historic environment
• A classification of employment sites within their areas according to the hierarchy in PA6 both in development plans and for the purposes of regional monitoring through the RELS database
• Any deficiencies in the supply of land, especially within the MUAs, and action required to remedy this, and
• The extent to which office developments should be restricted on certain sites.
2.31 Policy PA6B of the Phase II Revision provides guidance on how employment land and premises should be protected. It outlines the way in which planning authorities should monitor the employment land and their development pipeline and established the mechanisms for the release of land.
2.32 Policies PA7 to PA9 inclusive are also relevant, and provide detailed guidance on the first tier of employment sites (RIS, MIS and RLS).
RENEW, Creative Cities: The Role of Creative Industries in Regeneration
2.33 A report produced by RENEW highlights the potential and importance of providing for the creative industries in any regeneration strategy. The key lessons from this report relevant to Staffordshire Moorlands are:
• Creative industries can create economic value but require sustained and cumulative intelligence and experience which balances economic and cultural dimensions;
• Intermediary agencies which are close to the sector must be able to broker intelligent interventions at all levels involving partners with different priorities and approaches
• Building successful clusters takes time and requires subtle, informed and sustained interventions within a partnership structure
• Cultural dimensions of the creative industries should not be underplayed – they create both tensions and opportunities for economic development and civic wellbeing
• Cultural industries can help kick-start property led regeneration, but without effective planning are driven out by high land values and incompatible new uses
• Creative industry strategies must prioritise investment, with large scale interventions including micro and small businesses, requiring excellent research evidence and a sophisticated approach
• Agencies supporting creative industries must navigate tensions between backing existing winners and those with unrealised potential and balance immediate economic returns with wider enhancement of the cultural milieu.
Regional Employment Land Study
2.34 The Regional Employment Land Study (RELS) is an annual report that describes and analyses the supply of employment land in the West Midlands. It monitors all available land committed for B-class employment use in excess of 0.4ha. The most recent report (2006) recognises the importance of maintaining an adequate supply of employment land to maintain economic prosperity and stresses that: “No desirable investment opportunities should be lost for want of a suitable site (para 2.4).” So, the RELS report monitors the supply and take-up of employment land throughout the region (assessing land allocated for employment use). It states, for example, that
SMELS 2 FINAL 23 09 08 16

Final Report
in the period 2005-2006 the supply of employment land in the region had decreased to just over 3,100 hectares.
2.35 RELS is limited in the respect that the quality of sites is not considered and that its monitoring is based purely on the overall ‘balance’ of employment land (i.e. whether allocated sites have been taken up). It does not go as far as defining what constitutes a ‘good quality’ site and so hides more subtle qualitative factors.
Local Policy Update LDF Core Strategy
2.36 Staffordshire Moorlands District is in the process of preparing its first Local Development Framework. It has begun preparation on one of the core Development Plan Documents (DPDs), the Core Strategy which has been through the issues and options stage and for which a Preferred Option is emerging. Once adopted, the Core Strategy will replace the strategic policies contained in the 1998 Adopted Local Plan. Until the Core Strategy is adopted, the policies of the adopted Local Plan have been saved and will continue to underpin decisions relating to employment policy in the District. Additional DPDs will provide further detail guidance to guide future planning decisions.
2.37 It is understood that the emerging Core Strategy contains two key policies relating to the economy and employment, one of which relates to economic development (E1) and the second to existing employment development (E2).
E1 – New Employment Development
2.38 It is understood that Policy E1 will place a requirement for new employment development to be assessed according to the extent to which it supports the local economy in terms of providing for the needs and skills of the local resident workforce and meeting identified business needs, having regard to the Area Strategies. The policy is likely to include the following policy thrusts:
• All proposals should maintain or enhance the range of employment premises and sites across the District;
• Mixed use schemes should accommodate employment generating uses of a scale and nature appropriate to their location;
• New office uses should be located in sustainable locations with good public transport access;
• New industrial uses, other than B1(a and b) uses, should generally be located in existing or proposed employment areas;
• New warehouse and distribution uses should be located on sites with potential for rail access or otherwise where there is ready access to roads which are higher in the road hierarchy and where sensitive areas are less likely to be affected by heavy goods vehicles;
• The expansion or relocation of existing businesses will be permitted provided that the development is complementary to and does not undermine the role of the towns and larger villages nor shall it undermine wider strategic objectives;
• All employment development should be of an appropriate use and scale to the local area, minimise its impact on amenity and existing uses and not harm interests of acknowledged importance.
• To ensure that the District’s workforce is suitably skilled so that local people can compete for high quality jobs both locally and further afield, the Council will, where appropriate, seek to enter into agreements with developers to contribute towards training programmes and employment support and employment access schemes including the provision of premises in appropriate locations.
SMELS 2 FINAL 23 09 08 17

Final Report
E2 – Existing Employment Areas
2.39 It is understood that Policy E2 will contain the following policy aspects to ensure employment development is appropriate. It is likely to necessitate that employment sites:
• Are well located to the main road and public transport network; and
• Provide, or are physically and viably capable of providing through redevelopment, good quality modern accommodation attractive to the market without harm to the amenity of nearby residents; and
• Are capable of meeting a range of employment uses to support the local economy;
• Will be safeguarded for such purposes.
2.40 Redevelopment of such areas for housing, retail or other non-employment uses is likely to be restricted unless:
• The site is identified in the Site Allocations DPD for redevelopment; or,
• It can be demonstrated that the site would not be suitable or viable for continued employment use having regard to the above criteria and evidence can be provided that no suitable and viable alternative employment use can be found, or is likely to be found in the foreseeable future; or
• Substantial planning benefits would be achieved through redevelopment which would outweigh the loss of the site for employment use.
2.41 Where redevelopment is proposed, preference will be given to a mixed use redevelopment scheme which retains an element of employment provision on the site. Where this would not be viable the Council will negotiate for funding to support off-site employment provision.
Staffordshire Moorlands Economic Strategy
2.42 This five-year strategy has been prepared to update the previous economic development strategy (2000-2005). The strategy is in draft stage but it is understood its objectives will be to:
• To encourage, support and promote the Staffordshire Moorlands as an area for sustainable business growth and investment to strengthen and improve the competitiveness of the local economy;
• Facilitate new and appropriate supplies of employment land and workspace to meet the needs of local and incoming businesses, including the high value-added knowledge based sector;
• To support the enhancement of the quality and provision of the skills base within the District, to provide greater employment potential for local residents;
• Strengthen and diversify the local economy by establishing Town Centres as key areas for sustainable economic activity, whilst supporting the role of rural areas;
• To effectively promote, enhance and develop the tourism products and opportunities that exist within the Market Towns and rural areas; and
• Engage with local, regional, national and European bodies on economic issues that would provide local benefits to the District.
2.43 There is some debate regarding the current health of the economy in the District in the Draft version of the report:
• Positive Outlook: From this perspective the district has a successful economy, working closely with key stakeholders in recent years to bring about economic change, growth and prosperity. The Moorlands provides virtually full employment to its workforce with unemployment rates below the national average, its employment sites are almost at full capacity, it has a number of leading businesses located within its district boundary and is fortunate enough to have approximately a third of its area within the Peak District National
SMELS 2 FINAL 23 09 08 18

Final Report
Park – a worldwide brand to attract visitors and tourists alike. In recent years the Staffordshire Moorlands has benefitted from a number of regeneration programmes and initiatives to the value of approximately £10m to help develop its business and tourism economy.
• Alternative View: An alternative view is that the districts economy has and is underperforming compared to its competitors. It provides low pay to a large proportion of its workforce when compared to the national average, struggles to encourage the growth of new and existing businesses (and to attract new high profile leading brand businesses) due to a perceived lack of inward investment opportunities. Its rural economy is facing change as its market towns are heavily dependent on a limited number of businesses in ‘traditional’ declining industries.
Biddulph Town Centre AAP
2.44 An Area Action Plan has been adopted by SMDC (February 2007) as a Development Plan Document (DPD). This document was prepared to guide the development of Biddulph Town centre, which is identified as a local regeneration area (Policy UR2) in the Regional Spatial Strategy. It provides specific guidance on the key development sites in Biddulph and two of these were identified as employment sites in the 2006 ELR. This update ELR has been prepared to be consistent with the recommendations made in the AAP and boundaries of these two sites are consistent between the two reports.
2.45 The policy guidance for the two sites provided in the AAP is identified below:
Policy DS1: Wharf Road Site
2.46 The Council will pursue comprehensive redevelopment of the site with private sector partner(s) and should include:
• Supermarket of up to approximately 4,500 sq m gross, with the main entrance onto the Primary frontage;
• Car park with 400 - 500 spaces, accessed from Wharf Road;
• Cycle parking facilities;
• Approximately 6 - 8 additional retail units of 100 - 300 sq m each, fronting Wharf Road, High Street and Station Road;
• Landmark gateway building at the junction of Wharf Road and the bypass;
• Landscaping along the boundary to the bypass; and
• Good quality links from the car park into the town centre core, along active frontages.
2.47 A new library comparable in size to the existing library facility will also be sought on the site if the current library site is redeveloped.
2.48 The Council will seek to retain in their current location and make all efforts to integrate into the development scheme:
• a) The Royal Oak Public House. If during later stages it is clearly demonstrated that this is not viable, then the Public House will not be retained.
• b) The Memorial Garden. If during later stages it is clearly demonstrated that this is not viable, an equivalent replacement should be provided within the site, and if this is not possible, then elsewhere in the town centre.
• c) Open space fronting Station Road. Should be retained where possible, otherwise the equivalent re-provision must be provided within the site. If this is not possible, then provision should be made elsewhere in the town centre.
• The comprehensive redevelopment of the site must be undertaken to a high design quality, ensuring that a mix of complementary uses and building types is accommodated in an integrated way. A ‘perimeter block’ urban design arrangement is sought, with the
SMELS 2 FINAL 23 09 08 19

Final Report
SMELS 2 FINAL 23 09 08 20
supermarket wrapped by a series of smaller retail units of a scale that complements the existing Town Centre context and a new ‘gateway’ building facing onto the roundabout. It is anticipated that development of this site is co-ordinated with major landscaping improvements to surrounding streets, enhanced pedestrian linkages and the planting of large, semi-mature trees along the site’s northern boundary, abutting the bypass.
2.49 A planning application for the comprehensive redevelopment of the site should include a Transport Assessment, which includes the requirement for sustainable transport measures and a travel plan, S106 contributions to wider improvements to the town centre will also be required, including improved recycling facilities either on-site or at an appropriate location nearby.
Policy DS4: Walley Street Area
2.50 In the Walley Street area the Council in partnership with landowners will seek:
• the refurbishment of the employment premises; or
• their replacement with more suitable employment premises;
2.51 Where the design will improve the impact on the amenity of neighbouring existing and potential future residential properties.
2.52 Residential development may be acceptable where this helps to bring forward an employment development, including live/work units. However, the overall quantities of land occupied by employment and residential uses should not alter significantly in this area.

Final Report
3. Employment Land Supply - Update Introduction
3.1 This section updates the previous ELS (2006) in terms of the quality and suitability of the existing employment land in the District.
3.2 Since 2006 some changes have taken place in Staffordshire Moorlands which have had some minor implications regarding the supply of employment land. These include:
• Businesses movements both in and out of the District;
• Expansion at some employment sites and contraction at others; and
• Some new additional sites which have been brought forward.
3.3 These issues identified above mean some of the supply side information collected during 2006 has become dated and has created the need to update this element of the work to ensure it remains up-to-date and robust.
3.4 The scope of work relating to updating the employment supply side has involved the following:
• Updating supply side information for selective employment sites which were included in the 2006 ELS but where change has occurred in the interim period, necessitating the need for information relating to these sites to be updated;
• Providing advice on new sites which were not included in the 2006 ELS. Such sites were discussed between SMDC and their consultants at the inception meeting. At this meeting it was decided there would be merit in including them in this update;
• Considering the suitability of sites to meet wider employment needs, including potential for farm diversification, tourism and other alternative uses; and
• Using the updated employment supply baseline to inform revised planning policy guidance in the District in accordance with the revised planning policy framework for employment land (refer to sections 6 and 7).
Methodology 3.5 Advice was taken from SMDC on whether sites would need updating due to their knowledge of the
District. The Council used planning applications, monitoring information and other sources to identify which sites would need re-visiting and updating, and which additional sites should be included. Employment sites which have not changed in terms of their employment portfolio since 2006 were not re-visited as part of this update.
3.6 A total of thirteen sites included in the 2006 audit were updated and ten additional sites were considered for inclusion. Of these ten additional sites, three were discounted on the grounds of them not containing any B class use. This means an additional seven sites were added to the 2006 ELS portfolio of sites. A total of 44 employment sites were carried forward and included in the 2008 ELR update (refer to Table 3.1).
3.7 Appendix A provides an overview map of the District which identifies the location of each employment site. More detailed figures showing individual employment sites (Updated and New Sites only) are also provided, together with a photographic record taken at each of the Updated and New sites. For Unchanged Sites, refer to the appendix of the 2006 ELS for this information.
SMELS 2 FINAL 23 09 08 21

Final Report
SMELS 2 FINAL 23 09 08 22
Table 3.1 – 2008 Update: Site Typology
Site Typology Description Number of Sites
Unchanged Site Sites surveyed in 2006 and not updated in 2008
24
Updated Sites Included in 2006 audit and updated in 2008
13
New Sites Not included in 2006 but included in 2008
10 (3 discounted, 7 taken forward)
Total Number of Sites* 44 *A total of 44 sites are included in the analysis. However, as two sites (7 and 21 were discounted from the 2006 ELR), the site numbering system goes from site number 1 to site number 46.
3.8 A full site appraisal consistent with Employment Land Guidance was carried out at each Updated Site and New Site. The same pro-forma format used in the 2006 ELR was used to guide these visits. An update of the spreadsheet was then made to reflect the new and revised findings of these, and subsequently summary tables were updated.
3.9 Site analysis plans were also updated or created for New Sites in a GIS digital format to enable specific measurements to be taken in terms of site areas, opportunity areas, vacant premises and vacant parcels of land. A photographic record was also made of each site visited (refer to appendix A).
3.10 For Updated Sites and New Sites, a short appraisal was written to summarise the information collected on the Pro-formas. These are provided in Table 3.2 below, which also identifies the typology of each site (i.e. whether it is an unchanged site, an updated site or a new site).
Discounted Sites
3.11 The following three sites were identified for site appraisal by SMDC and were visited as part of the site survey update process. However, as no existing B class use was identified at these sites and as there was considered to be no potential for future employment use at any of them, they were excluded from the supply analysis. The sites discounted from inclusion in the ELS are:
• Land adjacent to New Cottages, Foxt – a rural site surrounding row of cottages in a valley. Site located in a picturesque setting just to the south of the village of Foxt. Understood to be application or interest in using land for equestrian purposes (D2 if not used for race training). Broadly appears to be a suitable location for this type of use, but would oppose proposals for B class use as location is considered inappropriate including its location away from the village centre. Any employment use in Foxt would be better located close to the garage in the heart of the village but the entire village is an extremely sensitive in environmental terms. Not an allocated employment site in the local plan.
• Thornbury Hall - a Georgian Grade II listed building with Tudor origins. Understood to have been restored in 1990 and converted into a high quality restaurant / banqueting venue specialising in Pakistani cuisine. Fits into either A3 or C2 use and is assumed to be important to the local economy in terms of being a tourism / visitor attraction. B class land use not considered appropriate for this site. Not an allocated employment site in local plan.
• Woodstone Nursing Home - in C2 use as a residential nursing care home. A high quality venue in attractive wooded rural location. No scope for B class use identified - would conflict strongly with current use. Not an allocated employment site in local plan.

Final Report
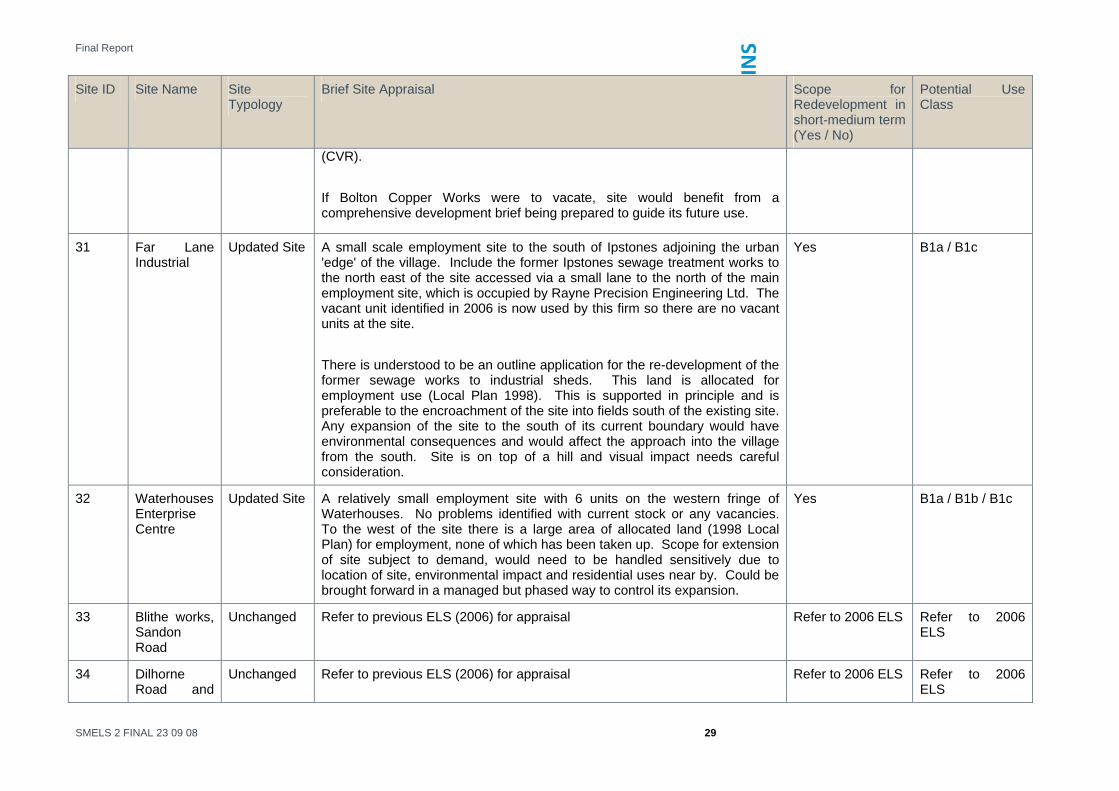
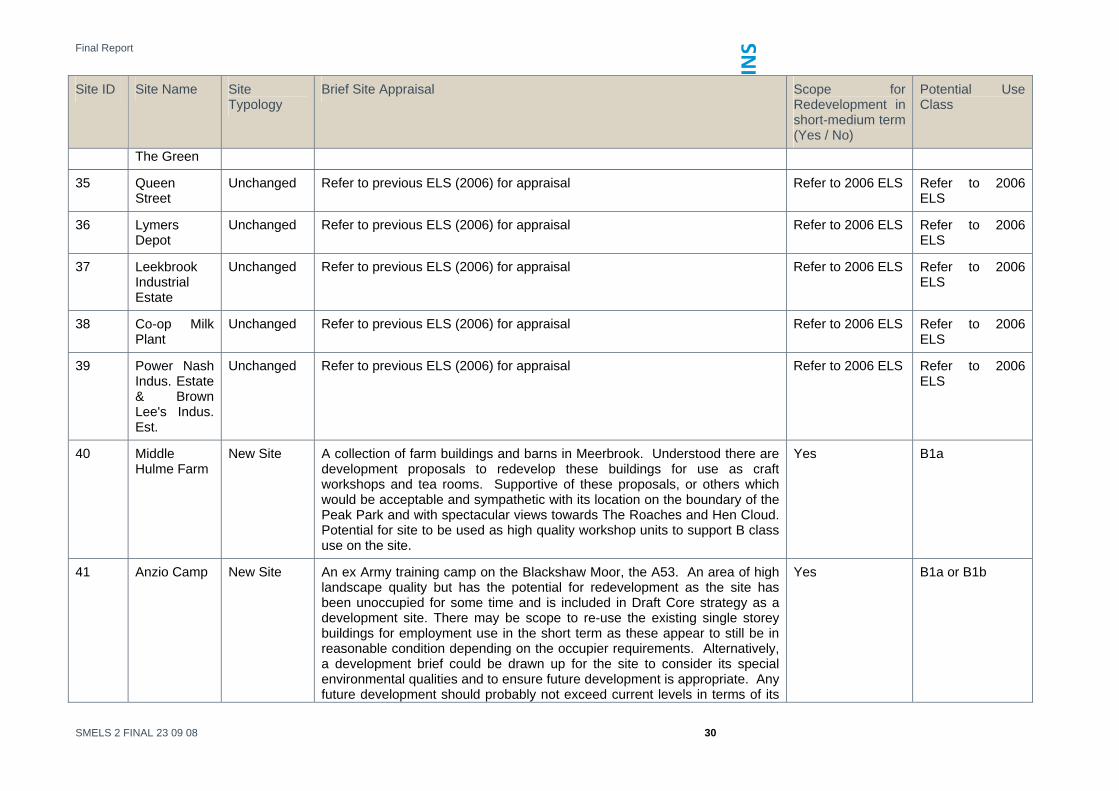
Table 3.2 – Schedule of Employment Sites Included in the ELS Update
Site ID Site Name Site Typology
Brief Site Appraisal Scope for Redevelopment in short-medium term (Yes / No)
Potential Use Class
1 British Trimmings
Updated Site Relatively large vacant site to the east of Leek town centre. Brownfield land with potential for development in short term so long as any contamination issues could be overcome. Evidence on site visit that some preparatory work may be underway for redevelopment. Understood to be outline permission for residential and commercial use on the site.
Yes B1a or B1b
2 Fowlchurch Tip
Unchanged Refer to previous ELS (2006) for appraisal Refer to 2006 ELS Refer to 2006 ELS
3 Springfield Road
Unchanged Refer to previous ELS (2006) for appraisal Refer to 2006 ELS Refer to 2006 ELS
4 Macclesfield Road
Unchanged Refer to previous ELS (2006) for appraisal Refer to 2006 ELS Refer to 2006 ELS
5 Mills on Brook Street
Unchanged Refer to previous ELS (2006) for appraisal Refer to 2006 ELS Refer to 2006 ELS
6 Whites Bridge
Unchanged Refer to previous ELS (2006) for appraisal Refer to 2006 ELS Refer to 2006 ELS
8 Barnfields Industrial Estate
Unchanged Refer to previous ELS (2006) for appraisal Refer to 2006 ELS Refer to 2006 ELS
9 Cattle Market
Updated Site Vacant cattle market site on the southern fringe of Leek. Scope for re-use of the site for employment generating uses subject to planning consent. Are not aware of any proposals. Scope was identified for expansion of this site beyond its current boundaries to the south. Opportunity may exist here subject to environmental constraints being overcome as there is significant coverage of foliage and mature trees. Possible planning environmental designations. Should resist any attempts to further extend car park from the east of Cattle Market Site at Britannia as this would be against sustainability principles and would encourage more trips by car.
Yes B1a, B1b or B1c
10 Britannia Building
Updated Site Previously some opportunity land was identified to the west of the existing car park. It appears this has since been built on as an extension to the firm’s car
No N/A
SMELS 2 FINAL 23 09 08 23

Final Report
Site ID Site Name Site Typology
Brief Site Appraisal Scope for Redevelopment in
Potential Use Class
short-medium term (Yes / No)
Society park and therefore other redevelopment opportunities have disappeared in the short to medium term at least.
11 Town Yard Unchanged Refer to previous ELS (2006) for appraisal Refer to 2006 ELS Refer to 2006 ELS
12 Brooklands Way
Unchanged Refer to previous ELS (2006) for appraisal Refer to 2006 ELS Refer to 2006 ELS
13 Part of Former Joshua Wardle
Unchanged Refer to previous ELS (2006) for appraisal Refer to 2006 ELS Refer to 2006 ELS
14 Churnetside Business Park
Unchanged Refer to previous ELS (2006) for appraisal Refer to 2006 ELS Refer to 2006 ELS
15 Beresford/PMT Depot
Unchanged Refer to previous ELS (2006) for appraisal Refer to 2006 ELS Refer to 2006 ELS
16 John Pointons Site
Updated Site This is an animal processing centre and the extension of the site relates to greenfield land to its north. Extension of the site in this direction could be problematic due to topography constraints and the probable visual impact from the north looking south towards the site. Any proposals would need to be considered with rigour through the planning system. Additional traffic generated a concern to the expansion of this site.
Yes B1a / B1b / B1c or B2
17 JCB, Leek Road
Unchanged Refer to previous ELS (2006) for appraisal Refer to 2006 ELS Refer to 2006 ELS
18 JCB, Oakamoor Road
Unchanged Refer to previous ELS (2006) for appraisal Refer to 2006 ELS Refer to 2006 ELS
SMELS 2 FINAL 23 09 08 24

Final Report
Site ID Site Name Site Typology
Brief Site Appraisal Scope for Redevelopment in
Potential Use Class
short-medium term (Yes / No)
19 New Haden / Brookhouses
Updated Site A large but fragmented employment area to the south west of Cheadle adjoining the adjacent settlement of Brookhouses. The site straddles Draycott Cross Road, a minor road which leaves the settlement of Brookhouses towards the south west Provides valuable accommodation for significant number of businesses and has grown incrementally over the years without the benefit of co-ordinated planning across the site as a whole. Environmentally, the site is located in a greenfield location and there is significant incline/gradient across the site. Because of the local topography the site is not particularly well screened in places and some unsightly views were identified from some neighbouring residential areas. This is a significant issue which should guide future development of the site. To the west of Draycott Cross Road are two employment estates - Hillside Industrial Park and a larger one (name unknown) to its south housing a range of building and engineering contractors as well as a significant amount of outdoor storage space. This area is very disjointed and visually unattractive, especially the further west you go where the site is mainly used for HGV storage. There is also a single premise accessed via a narrow road used by Commonside Fencing and Timber Products. Subject to getting the necessary consents there is significant potential to improve the efficiency of this area of the site and intensify uses to provide higher value services. To the east of the Draycott Cross Road there is a larger and equally mixed employment area consisting of some modern units off Brookhouse Way which include a significant sized employment 'shed' (user unknown). In the area immediately to the east of Draycott Cross Road activities include scrap metal works and other heavier industrial uses. The environmental quality of this area is poor. Future improvements to this site should include the rationalisation of the area immediately to the east of Draycott Cross Road and potential extension of the site to the south of Brookhouse Way on the vacant triangular plot of land. The wider expansion of the site to the east towards Litley Farm would need to be carefully considered in terms of the potential
Yes B1b / B1c / B2
SMELS 2 FINAL 23 09 08 25

Final Report
Site ID Site Name Site Typology
Brief Site Appraisal Scope for Redevelopment in
Potential Use Class
short-medium term (Yes / No)
visual impact of this and the increase of traffic. The fields towards Litley Farm are also steep in terms of their gradient which would be a further constraint. However, this land is allocated for employment use in the 1998 Local Plan. As a general principal, enhancement of the existing areas should be prioritised before further greenfield land is lost. Vehicle safety along Draycott Cross Road is also an issue and would benefit from being addressed. The complexity of the site means it would benefit from a comprehensive development brief being prepared so that future change can be managed and co-ordinated properly.
20 Mobberley Unchanged Refer to previous ELS (2006) for appraisal Refer to 2006 ELS Refer to 2006 ELS
22 Bridge Villa Unchanged Refer to previous ELS (2006) for appraisal Refer to 2006 ELS Refer to 2006 ELS
23 Blythe Bridge (RIS)
Updated Site A large scale opportunity site located on greenfield land either side of the A50 to the south of Blythe Bridge. Inside the settlement development boundary as defined in the 1998 adopted local plan. Understood it is being marketed by AWM and an outline application exists for employment use. Key Characteristics of the area to the south of the A50: area is a greenfield site encompassing 48.0 hectares (119 acres) of agricultural land. It is intended that the site will be primarily developed for B1 and if a need can be demonstrated development of high quality B2 may be acceptable. Access points would need to be developed to enable articulated lorries to turn in and out of the site. Positive aspects of the site include its location in an area with an identified gap of high quality employment land, its size; neighbouring countryside provides a high quality environmental setting for the site. The site has a good strategic location (both SRN and train line border the site) and access from the westbound carriageway of the A50. The site has a development brief produced by Staffordshire Moorlands District Council and is allocated in the Local Plan. Advantage West Midlands consider the site a site of regional significance and is identified in Regional Planning Guidance 11 for the West Midlands. It could be used for B1 use. B2 may be acceptable if it is demonstrated that the development would be of high quality.
Yes B1a / B1b / B1c or B2
SMELS 2 FINAL 23 09 08 26

Final Report
Site ID Site Name Site Typology
Brief Site Appraisal Scope for Redevelopment in
Potential Use Class
short-medium term (Yes / No)
Despite the large scale and good access to the SRN the development brief for the site does not consider B8 acceptable due to environmental considerations. Area to the north of the A50 is less significant in terms of its size but also represents an excellent employment location for premium uses. Access to this site is off the A521 but is awkward as it comes off a bend in the road up Woodlands Road (where a relatively small wood processing firm is currently located). The characteristics for the southern part of the site described above also apply to this northern area.
24 Victoria Business Park
Updated Site A Regional Investment Site catering for larger units off Tunstall Road. Since the ELR there has been some development of this site. A firm called 'The Coach Travel Centre' has been built on a plot to the west of the central spine road and a corner plot immediately south of the entrance is being built out at the moment. A number of plots to the south and the west of the site remain future redevelopment opportunities. Marketed by Daniel and Hume as a priority site in conjunction with AWM. States units of 3,000 to 15k to let.
Yes B1c
25 Wharf Road Updated site A corner plot allocated for employment use which is underutilised at present. Adjacent to a BT sub station and a coach park to the west of the site. Location of Colliers Lane Relief Road provides improved access to the site. Potential for employment use to be provided on the site consistent with the recommendations of the Biddulph AAP. Assumed this site could be brought forward relatively quickly on the cleared part of the site opposite Diamond Close. It is also considered that opportunity exists to expand the site to the west and the south of the road which serves the site, although steep topography could present difficulties or possibly preclude development on these areas. Potentially a good employment location.
Yes B1a / B1b / B1c
26 Former Council Depot
Updated site Proposals for the construction of 10 employment units. This brownfield site is cleared at the moment and could be redeveloped for a number of uses including employment. However, residential nature of the area means this site would also be suitable for this site, depending on its designation on the Proposals Map.
Yes B1a
SMELS 2 FINAL 23 09 08 27

Final Report
Site ID Site Name Site Typology
Brief Site Appraisal Scope for Redevelopment in
Potential Use Class
short-medium term (Yes / No)
27 Walley Street
Updated Site A mixed site to in Biddulph between Congleton Road and Colliers Way. North of site is a larger older building housing a furniture factory and distribution. Older condition but presume serviceable for occupiers. Immediately to the south of this building is Biddulph Timber Limited, in a very poorly constructed building. To the east of the site are various garages and sui generis uses (discount halls and trade car centre). There is also a shop (A1) and several houses, one of which is derelict and vacant. The south west corner of the site used to contain Rory Mack Associates, but is now vacant. There are also several areas of car parking at surface level. This is an interesting site with development potential, as recognised in the Biddulph AAP. Employment redevelopment suitable consistent with recommendations of AAP.
Yes B1a
28 Uplands Mill Unchanged Refer to previous ELS (2006) for appraisal Refer to 2006 ELS Refer to 2006 ELS
29 Gillow Heath Sewage Works
Unchanged Refer to previous ELS (2006) for appraisal Refer to 2006 ELS Refer to 2006 ELS
30 Bolton Copper Works
Updated Site A large site set the Churnet Valley. Little change since the last audit was undertaken in 2006. Main occupier of the site is Bolton Copper Works (manufacturing activities), which is spread across a collection of sites. Understood to be a copper refinery which is a longstanding use, although the current 'health' of the firm is unknown. If closure of the works is a possibility the site would benefit from a comprehensive development brief being prepared to co-ordinate the site's future. The two vacant areas of land identified previously remain, and scope for redevelopment still exists. The opportunity and vacant areas to the south east of the site also still remains, although is partly being used as surface car parking by Bolton at present. This area is allocated in the local plan (1998). There may be opportunities for diversification through spin offs associated with Churnet Valley Railway which would require investigation to determine the nature of project which may be suitable. Railway used to serve the copper refinery but closed, and has since re-opened as part of the Churnet Valley Railway
Yes B1a / B1b / B1c / B2
SMELS 2 FINAL 23 09 08 28
Final Report
Site ID Site Name Site Typology
Brief Site Appraisal Scope for Redevelopment in
Potential Use Class
short-medium term (Yes / No)
(CVR). If Bolton Copper Works were to vacate, site would benefit from a comprehensive development brief being prepared to guide its future use.
31 Far Lane Industrial
Updated Site A small scale employment site to the south of Ipstones adjoining the urban 'edge' of the village. Include the former Ipstones sewage treatment works to the north east of the site accessed via a small lane to the north of the main employment site, which is occupied by Rayne Precision Engineering Ltd. The vacant unit identified in 2006 is now used by this firm so there are no vacant units at the site. There is understood to be an outline application for the re-development of the former sewage works to industrial sheds. This land is allocated for employment use (Local Plan 1998). This is supported in principle and is preferable to the encroachment of the site into fields south of the existing site. Any expansion of the site to the south of its current boundary would have environmental consequences and would affect the approach into the village from the south. Site is on top of a hill and visual impact needs careful consideration.
Yes B1a / B1c
32 Waterhouses Enterprise Centre
Updated Site A relatively small employment site with 6 units on the western fringe of Waterhouses. No problems identified with current stock or any vacancies. To the west of the site there is a large area of allocated land (1998 Local Plan) for employment, none of which has been taken up. Scope for extension of site subject to demand, would need to be handled sensitively due to location of site, environmental impact and residential uses near by. Could be brought forward in a managed but phased way to control its expansion.
Yes B1a / B1b / B1c
33 Blithe works, Sandon Road
Unchanged Refer to previous ELS (2006) for appraisal Refer to 2006 ELS Refer to 2006 ELS
34 Dilhorne Road and
Unchanged Refer to previous ELS (2006) for appraisal Refer to 2006 ELS Refer to 2006 ELS
SMELS 2 FINAL 23 09 08 29
Final Report
Site ID Site Name Site Typology
Brief Site Appraisal Scope for Redevelopment in
Potential Use Class
short-medium term (Yes / No)
The Green
35 Queen Street
Unchanged Refer to previous ELS (2006) for appraisal Refer to 2006 ELS Refer to 2006 ELS
36 Lymers Depot
Unchanged Refer to previous ELS (2006) for appraisal Refer to 2006 ELS Refer to 2006 ELS
37 Leekbrook Industrial Estate
Unchanged Refer to previous ELS (2006) for appraisal Refer to 2006 ELS Refer to 2006 ELS
38 Co-op Milk Plant
Unchanged Refer to previous ELS (2006) for appraisal Refer to 2006 ELS Refer to 2006 ELS
39 Power Nash Indus. Estate & Brown Lee's Indus. Est.
Unchanged Refer to previous ELS (2006) for appraisal Refer to 2006 ELS Refer to 2006 ELS
40 Middle Hulme Farm
New Site A collection of farm buildings and barns in Meerbrook. Understood there are development proposals to redevelop these buildings for use as craft workshops and tea rooms. Supportive of these proposals, or others which would be acceptable and sympathetic with its location on the boundary of the Peak Park and with spectacular views towards The Roaches and Hen Cloud. Potential for site to be used as high quality workshop units to support B class use on the site.
Yes B1a
41 Anzio Camp New Site An ex Army training camp on the Blackshaw Moor, the A53. An area of high landscape quality but has the potential for redevelopment as the site has been unoccupied for some time and is included in Draft Core strategy as a development site. There may be scope to re-use the existing single storey buildings for employment use in the short term as these appear to still be in reasonable condition depending on the occupier requirements. Alternatively, a development brief could be drawn up for the site to consider its special environmental qualities and to ensure future development is appropriate. Any future development should probably not exceed current levels in terms of its
Yes B1a or B1b
SMELS 2 FINAL 23 09 08 30

Final Report
Site ID Site Name Site Typology
Brief Site Appraisal Scope for Redevelopment in
Potential Use Class
short-medium term (Yes / No)
visual impact (single storey height at moment) and floorspace and access onto the road would need thorough consideration.
42 Novi Lane New Site A former mill in a residential location. Part of the mill building still in use by a furniture firm, remainder of site is underutilised with some assumed to be used for storage. Potential for small workshop units or other employment use sympathetic with the residential character of the area.
Yes B1a
43 Bode Business Park
New Site A mixed collection of general business. Four larger units of various ages in a secure compound. No vacant sites noted, so best option forward may be for the site to be redeveloped incrementally as and when sites become vacant in the future. Consideration needed to the sites position between football pitch and a children's play area.
No B1a, B1b, or B1c
44 Nelson Street Industrial Estate
New Site A medium sized site occupied by a single firm, Unitex and its subsidiary companies. Collection of around 6 larger units in good repair, discussion with owner whilst on site revealed business is operating well and is unlikely to vacate in foreseeable future. Main limitation of site is the access via a narrow road, which is unsuitable for HGV access. This would need considering if the site was to be redeveloped.
No N/A
45 Adderley Mill New Site A collection of former mill buildings in some employment use currently. Small scale mill buildings which have fallen into a moderate-poor state of repair but remain attractive premises due to their history. Site also includes a newer warehouse to the north of the mill used in use by one firm for industrial activities. Unclear from visual site visit if the mill buildings remain in use. Signage for Moss Minerals Ltd and Icypea but these may have vacated as there was no sign of activity. Understood that an application exists for replacement of some of the buildings but unclear which ones. Site should be promoted for employment use, ideally would make a high quality conversion opportunity which could provide good studio/workshop accommodation in the countryside. Would need a better understanding of conversion costs. Greenbelt considerations also important as is accessibility. Not an allocated employment site. Part of site within the Protected Floodplain.
Yes B1a, B1b, B1c / B2
SMELS 2 FINAL 23 09 08 31

Final Report
SMELS 2 FINAL 23 09 08 32
Site ID Site Name Site Typology
Brief Site Appraisal Scope for Redevelopment in short-medium term (Yes / No)
Potential Use Class
46 Adams food New Site Site remains operational for food processing and distribution of products. However, the business may be operating under its capacity as there appeared to be relatively few vehicle movements on the site and only one HGV at the time of site visit. May have expected more vehicle movements from a site of this size. Should current occupier vacate the site it would present a significant redevelopment opportunity which could accommodate a number of uses including employment
No N/A
* There are no sites numbered 7 or 21 as they were previously discounted from the 2006 ELS

Final Report
Analysis of Employment Land Supply 3.12 The remainder of this section updates the employment land findings of the 2006 ELS. Information
collected from site visits to Updated Sites and New Sites has been fully integrated with the previous site analysis to bring this aspect of the study fully up to date.
3.13 This section should be read in conjunction with Appendix B, which gives a full breakdown of the updated findings in tabular format, and Appendix A which provides mapping and photos of the Updated and New Sites.
Quantitative Findings Update 3.14 The ‘headline’ quantitative findings based on site visit work and ODPM data are summarised in
this section.
Employment Land and Vacant Land
3.15 Table 3.3 updates the overall amount of employment land and vacant employment land. As a result of the New Sites and amendments made to some of the Updated Sites, the total employment land surveyed and included as part of the analysis has increased by around 25ha to a total of 321.91ha. The amount of vacant land has also increased slightly, up by around 6ha. Using the same approach as the 2006 ELS, a minimum site size threshold of 0.25ha is used, meaning sites smaller than this are not included in the analysis.
Table 3.3 – Employment Land Portfolio – 2006 and 2008 Comparison
Total Employment Land (ha)*
Total Vacant Employment Land (ha)
% Vacant Land
2006 ELS 296.77 18.34 6.18
2008 ELS Update 321.91 24.11 7.49
Change (+ or -) + 25.14 +5.77 1.31
Employment Floorspace and Vacant Floorspace
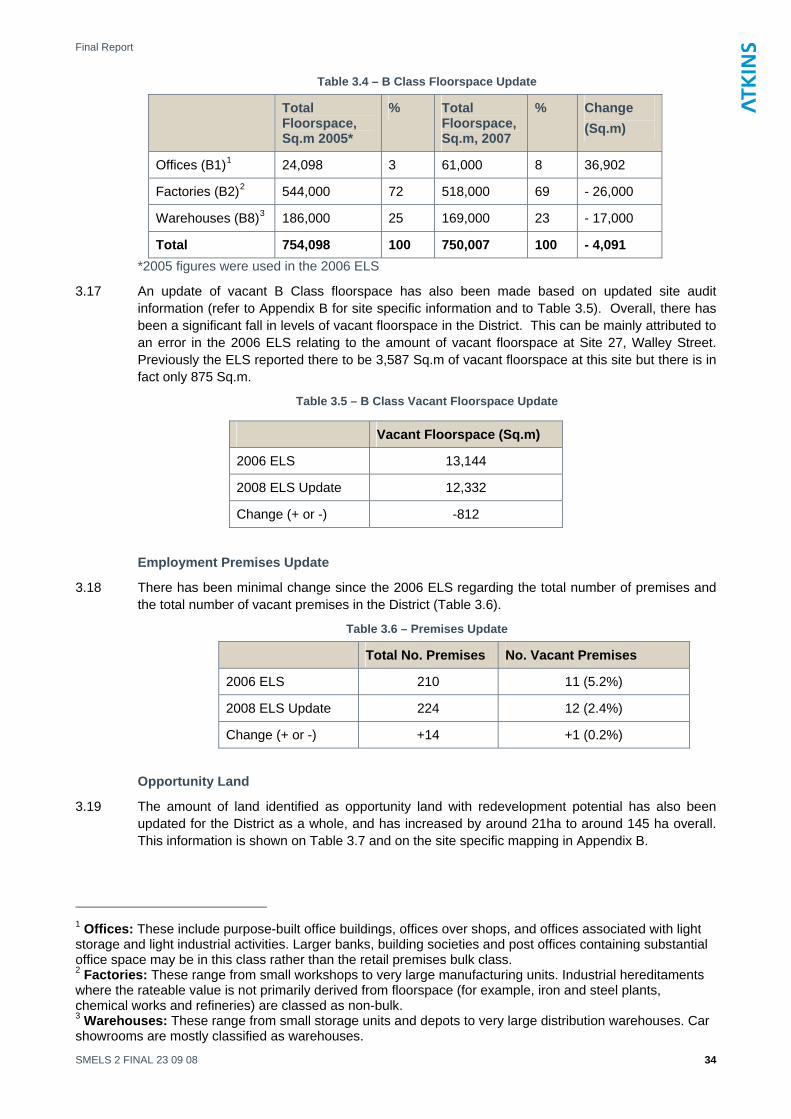
3.16 An update of the overall quantum of floorspace in the District has been undertaken (Table 3.4). Consistent with the previous approach (ELS 2006), this information has been taken from the ODPM and Valuation Office Commercial and Industrial Floorspace Statistics which covers the entire District (including employment sites below 0.25 ha). Overall, there has been some decline in the total amount of floorspace of around 4,100 sq.m between 2005 and the current 2007 figures. This can be attributed to significant decreases in the amount of floorspace in B2 and B8 use of some 43,000 sq.m, which has been offset to some extent by an increase of almost 37,000 sq.m of B1 premises.
SMELS 2 FINAL 23 09 08 33
Final Report
Table 3.4 – B Class Floorspace Update
Total Floorspace, Sq.m 2005*
% Total Floorspace, Sq.m, 2007
% Change (Sq.m)
Offices (B1)1 24,098 3 61,000 8 36,902
Factories (B2)2 544,000 72 518,000 69 - 26,000
Warehouses (B8)3 186,000 25 169,000 23 - 17,000
Total 754,098 100 750,007 100 - 4,091 *2005 figures were used in the 2006 ELS
3.17 An update of vacant B Class floorspace has also been made based on updated site audit information (refer to Appendix B for site specific information and to Table 3.5). Overall, there has been a significant fall in levels of vacant floorspace in the District. This can be mainly attributed to an error in the 2006 ELS relating to the amount of vacant floorspace at Site 27, Walley Street. Previously the ELS reported there to be 3,587 Sq.m of vacant floorspace at this site but there is in fact only 875 Sq.m.
Table 3.5 – B Class Vacant Floorspace Update
Vacant Floorspace (Sq.m)
2006 ELS 13,144
2008 ELS Update 12,332
Change (+ or -) -812
Employment Premises Update
3.18 There has been minimal change since the 2006 ELS regarding the total number of premises and the total number of vacant premises in the District (Table 3.6).
Table 3.6 – Premises Update
Total No. Premises No. Vacant Premises
2006 ELS 210 11 (5.2%)
2008 ELS Update 224 12 (2.4%)
Change (+ or -) +14 +1 (0.2%)
Opportunity Land
3.19 The amount of land identified as opportunity land with redevelopment potential has also been updated for the District as a whole, and has increased by around 21ha to around 145 ha overall. This information is shown on Table 3.7 and on the site specific mapping in Appendix B.
1 Offices: These include purpose-built office buildings, offices over shops, and offices associated with light storage and light industrial activities. Larger banks, building societies and post offices containing substantial office space may be in this class rather than the retail premises bulk class. 2 Factories: These range from small workshops to very large manufacturing units. Industrial hereditaments where the rateable value is not primarily derived from floorspace (for example, iron and steel plants, chemical works and refineries) are classed as non-bulk. 3 Warehouses: These range from small storage units and depots to very large distribution warehouses. Car showrooms are mostly classified as warehouses.
SMELS 2 FINAL 23 09 08 34

Final Report
Table 3.7 – Opportunity Land Update
Total Employment Opportunity Land (ha)
2006 ELS 124.0
2008 ELS Update 144.9
Change (+ or -) +20.9
Size of Premises
3.20 There has been no significant change since the 2006 ELS in terms of the mix of premise sizes in the District, with New and Updated Sites containing a broadly similar mix of premises.
Qualitative Findings Update 3.21 This section updates the key qualitative factors which influence the quality and suitability of sites
for B class employment use.
Location and Accessibility
3.22 Spatially, the portfolio of employment sites is distributed across the District but clustered around the three main towns of Leek, Cheadle and Biddulph. These towns continue to have the main concentration of sites in Staffordshire Moorlands, with two-thirds of sites located in an urban location (refer to Table 3.8).
3.23 Despite the majority of sites being located in an urban location, the rural nature of the District means there is also a significant number of sites outside the main urban areas. Some of the rural sites are based on sites or in buildings which were previously used for another type of use and have subsequently been converted or transferred to employment use.
3.24 It was recognised previously (ELS 2006) that the District is not particularly well served by the strategic road network and that access to the M6 is difficult from certain areas of the authority. It is particularly poor towards the north and eastern fringes. For access reasons, larger employment sites tend to be located to the south and west where access to trunk roads (principally the A50) is better.
3.25 Victoria Business Park (site 24), New Haden/Brookhouses (site 19) and the regional strategic allocation (RIS) promoted by AWM at Blythe Bridge (site 23) have particularly good access relative to other sites in the District.
Table 3.8 – Summary of Employment Sites – Location
Location Type
No. of Sites
Percentage
Town Centre 2 5 Edge of Town Centre 6 14 In Urban Area 9 20 Urban Edge 12 27 Total Urban 29 66 Countryside 8 18 In or Adjoining Rural Settlement 7
16
Total Rural 15 34 District Total 44 100
3.26 Amongst the sites surveyed as part of this update, local accessibility issues were identified at a
number of employment sites. These issues generally relate to the adequacy of access roads to the sites well as problems associated with internal circulation on the sites themselves. Problems
SMELS 2 FINAL 23 09 08 35

Final Report
associated with access and accessibility can present safety concerns, local amenity issues and general inefficiency. The main issues identified relate to:
• Site 10 – Britannia Building Society. Firm has large surface car park and any further expansion is considered likely to create further congestion.
• Site 16 – John Pointons Site. Access to this site is poor along Felthouse Road which is narrow. Concerns over proposed extension of this site to the north on these grounds.
• Site 19 – New Haden / Brookhouses. Various localised issues were identified at this site (refer to Table 5.1). Particular concerns over safety and access along Draycott Cross Road and internal access and servicing at areas west of this road.
• Site 23 – Regional Investment Site at Blythe Bridge. We understand there are difficulties associated with bringing forward the northern area of this site north of the A50 due to topography and existing road configurations. Our site reconnaissance work identified this as an ongoing constraint;
• Site 25 – Wharf Road. Potential identified for expansion of this site in line with AAP recommendations. Topography may present difficulties as the site slopes steeply in places.
• Sites 40 (Middle Hulme Farm), 41 (Anzio Camp) and 45 (Adderley Mill). Rural locations with potential access issues where high trip generators could present difficulties.
• Site 44 – Marling Mill. Access and amenity issues associated with access via Nelson Street.
3.27 Although parking constraints (essentially a shortage of spaces) are often identified by businesses as being an issue which negatively affects the performance of their business, this issue was not identified as a particular problem amongst the Updated and New Sites.
Property Condition Update
3.28 Previously the ELR (2006) concluded the existing portfolio of employment buildings in Staffordshire Moorlands is typically ‘fit for purpose’ in terms of the condition of the property. Only around seven percent of buildings were considered poor quality. That is, premises which are unlikely to be providing businesses with an optimum working environment.
3.29 The findings of this Update are more mixed. None of the ‘new’ additional sites were considered good in terms of the premise condition, leading to a less positive conclusion regarding the overall condition of employment premises across the District. Many of the Updated and New Sites visited as part of this Update were older sites which have not had the benefit of recent investment.
3.30 This issue is backed up by analysis of the number of buildings in Staffordshire Moorlands less than five years old. Of the 44 sites, only four had any evidence of recent investment in their building stock (Britannia Building Society, site 10; John Pointons Site, site 16; JCB Leek Road, site 17; Victoria Business Park, site 24). None of the additional sites surveyed had evidence of recent investment. Where investment has occurred recently, it has been (with the exception of Victoria Business Park) due to private investment in sites occupied by a single business. The District is lacking good quality modern units available for immediate take up.
3.31 This issue is supported through discussions held with local property agents (refer to section 5).
Balance of Uses – Update
3.32 Overall the balance of employment uses in the District has remained mixed since 2006. The additional sites consisted of:
• General industrial / business areas (Novi Lane Bode Business Park, Site number 42, Marling Mills, site number 44, Adderley Mill, site number 45);
• Farm Based Rural Location (Middle Hulme Farm, Site number 40);
• Sites for specific occupiers (Anzio Camp, site number 41 and Adams Food, 46).
3.33 The portfolio of employment sites in the District remains heavily skewed towards the area’s traditional manufacturing activities (silks, fabrics, furniture, antiques) with a significant under
SMELS 2 FINAL 23 09 08 36

Final Report
representation of high quality office locations. As a District, Staffordshire Moorlands also has almost no warehousing and distribution use. This is mainly due to its location and the difficulties associated with reaching the Strategic Road Network. We are not aware of any proposals relating to major road improvements through or close to the District to improve the accessibility to the area and the attractiveness of Staffordshire Moorlands to B8 users.
Size of Premises Update
3.34 The 2006 ELR highlighted the shortage of small sized premises suitable for smaller businesses. A lack of offices suitable for these types of firms is confirmed by the additional site work undertaken as part of the update work as an on-going issue.
3.35 Some units of a smaller scale, or at least sites with the potential to accommodate smaller sized units were identified at New Sites (Middle Hulme Farm, Anzio Camp, Novi Lane, Adderley Mill). However, for a variety of reasons none of these sites have currently got smaller sized units which are available for immediate take up. This issue is likely to be restricting the economic performance of the District.
Development Constraints Update
3.36 Of the New Sites identified, there were potential constraints to development at most of the sites. These possible constraints are identified and described in Table 3.5. The rural location of some of the sites is likely to raise environmental constraints and possible barriers to development, as is the residential nature of land use surrounding other sites.
Table 3.9 – Potential Development Constraints at New Sites
Site ID Site Name Potential Development Constraints
40 Middle Hulme Farm Environmentally sensitive location adjacent to Peak Park. Views important
41 Anzio Camp High quality environment in terms of setting. Topography and view need to be considered.
42 Novi Lane Surrounded by residential use. B class would need to be sensitively handled.
43 Bode Business Park
Residential location, proximity to playing fields and play area.
44
Marling Mills
HGV access not ideal. Residential location surrounds some corners of the site so sensitive in this respect.
45 Adderley Mill High quality environment. Listing status of Mill buildings needs to be investigated.
46 Adams food Surrounded by residential use. B class needs to be sensitively handled.
SMELS 2 FINAL 23 09 08 37

Final Report
SMELS 2 FINAL 23 09 08 38

Final Report
4. Employment Land Demand - Update Introduction
4.1 This section updates the original assessment of future demand for employment land and floorspace and the quantitative forecasts of workplace employment in Staffordshire Moorlands for the period up to 2026. Also provided are our estimates of the future demand for employment floorspace, which are derived from the employment forecasts. These forecasts concentrated on B-use class employment.
4.2 The section draws upon the detailed economic assessment, which has been updated in Appendix C. The main findings of the economic profile are explored and then the implications for future demand in the district are explored.
4.3 The economic profile provides an update of the demand and supply factors affecting the district, which were considered in the original forecasts.
4.4 The economic profile is summarised below, which is then followed by the updated employment forecasts.
Economic Profile 4.5 The socio-economic conditions of Staffordshire Moorlands were profiled in the original
employment land study. These have been updated to include years subsequent to 2004. The aim of the original economic profile was to build our own forecasts and understand the value of existing employment sites for economic development. The economic profile incorporates both the demand aspects of the economy but also the supply side aspects including the employment needs of residents in order to help assess the potential for employment and premises within the area to meet local needs.
4.6 This sub-section highlights the following key findings in respect to the updated economic profile of Staffordshire Moorlands.
Employment 4.7 The total level of employment in the district has grown at 0.5 per cent per annum over the period
1998/06, which was below national growth but in line with regional employment.
4.8 The structure of the economy as shown below in Figure 4.1 is highest, as identified in the original ELS, in the Public administration, education & health sector, which accounted for 27.4per cent of the total level. The sector represents a larger proportion than regionally and nationally (26.6 per cent) and has grown by 2.4 per cent per annum.
4.9 The other key sectors of employment are Distribution, hotels & restaurants and Manufacturing, which in 2006 accounted for 22.8 per cent and 19.1 per cent of the total respectively. The former sector actually accounts for slightly less employment than at the regional and national levels, whilst the latter is particularly overrepresented. For instance Manufacturing in the regional and national economies accounted for 14.7per cent and 11.0 per cent of total employment respectively. Also the Manufacturing sector has experienced a much slower rate of decline, around 3.7 per cent compared to 5.6 per cent regionally.
4.10 The Banking, finance & insurance sector4 is comparatively a very small sector accounting for only 11.2 per cent of employment, which as a national growth sector, could affect future growth in
4 The Banking, Finance and Insurance Sector is a broad industrial sector and thus incorporates many sub-sectors which may not be automatically assumed part of it. In large it incorporates financial intermediation, insurance and pension funding, activities auxiliary to financial intermediation, real estate, renting and business activities, renting of machinery and equipment without operator and of personal and household goods, computer and related activities, research and development and other business activities.
SMELS 2 FINAL 23 09 08 39

Final Report
the area. However this sector has comparatively grown strongly, by 3.7 per cent per annum, over the period 1998/06 although growth is from a much lower bas
19.1%
4.6%
22.8%
4.3%11.2%
27.4%
8.3% 1.6% 0.6%
Agriculture & fishing Energy & water
Manufacturing Construction
Distribution, hotels & restaurants Transport & communications
Banking, finance & insurance, etc Public administration,education & health
Other services
e.
4.11 The Distribution, hotels & restaurants sector has also continued to grow strongly, growing on average by 1.6 per cent per annum.
4.12 Other Services5, a national growth sector, is growing strongly in the district and in 2006 accounted for 8.3 per cent of total employment compared to 5.1 and 5.3 per cent regionally and nationally. However the majority of employment within this sector is within Other entertaient activities, which is likely to reflect the presence and importance of Alton Towers as an employer in the district.
Figure 4.1 – Total Employment by Broad Industrial Sector in Staffordshire Moorlands, expressed as per cent of total.
4.13 The sub-sectors accounting for the highest proportions of employment tend to fall within the Public administration such as Education, Health & social work and Public administration & defence. The Manufacture of machinery & equipment not elsewhere classified is also very significant, accounting for a slightly higher proportion than in the original ELS and has grown at a rate of 4.4 per cent per annum.
4.14 There are very few financial sub sectors listed amongst the principle sub sectors than would be expected in the comparator areas whilst the pace of growth has been slower than the other sectors.
4.15 Furthermore growth in the Banking, finance & insurance sub sectors has also been relatively slow and has been driven by Public administration & defence, Hotels & restaurants and Recreational, sporting & cultural activities.
4.16 The updated review also examined sectors that have been the focus of economic development strategy including Creative Industries, Tourism & Leisure and Healthcare. The district was found to have no real specialism in any of these except Tourism & Leisure; however, this specialism to a degree represents the presence of Alton Towers.
5 The “Other Services” sector incorporates various sub-sectors including other community, social and personal services activities (such as sewage and refuse disposal), activities of membership organisations not elsewhere classified, recreational, cultural and sporting activities and other service activities (such as washing and dry-cleaning, hairdressing and physical well being)
SMELS 2 FINAL 23 09 08 40

Final Report
B-Use Employment
4.17 In 2006, B-use class employment in Staffordshire Moorlands accounts for 52.4 per cent of total employment, which was slightly lower than the county, regional and national proportions. Manufacturing accounts for the highest proportion of B-use employment at 36.4 per cent and this was significantly higher than all the comparator areas. Banking, finance & insurance is the next greatest B-use employment sector but at 21.5 per cent of total employment, is under represented compared to all other areas. The proportion in Other Services was higher at 13.2 per cent compared to all comparator areas (for instance the sector accounted for 11.1 per cent nationally).
4.18 B-use employment has declined in Staffordshire Moorlands but at a much lower rate than the comparator areas, except nationally where the total slightly grew.
Business 4.19 Business unit growth has been fairly strong in the district at 1.9 per cent per annum over the
period 1998/06. This was slightly higher than the regional and national rates of 1.6 per cent and 1.7 per cent respectively.
4.20 The Distribution, hotels & restaurants and Banking, finance & insurance sectors still account for the highest proportions of business units. However, most areas have a higher proportion of businesses within the Banking sector. The proportion of businesses within the Manufacturing sector is comparatively higher than all other areas. Growth has been strongest within the Banking, finance and insurance and construction sectors whilst the decline within the Manufacturing sector has been less severe compared to the regional and national rates.
4.21 The proportion of B-use businesses in 2006 was 66.7 per cent, which was slightly lower than the West Midlands and England & Wales. The Banking, finance & insurance sector also accounts for the highest proportion of B-use businesses, at 32.4 per cent, however, regionally and nationally this sector accounted for 43.9 per cent and 48.3 per cent respectively. The proportion in the Manufacturing sector continues to account for a high proportion at 14.8 per cent although this was slightly lower than the 2004 proportion of 16.4 per cent.
Business Size and Entrepreneurship 4.22 The business structure of the district remains dominated by micro businesses of between 1 and
10 employees, which account for 87 per cent of the total and is slightly higher than the county, regional and national levels.
4.23 However using the VAT Registrations measure, entrepreneurial activity in the district compared to the wider areas is fairly low although this could be due to some of the smaller businesses falling naturally below the registration threshold.
4.24 Indeed self-employment rates within the district have on average been fairly high in the district.
Population and the Labour Market 4.25 The population of Staffordshire Moorlands has grown slightly since 2004 but the age profile
remains skewed towards the older age groups. As a direct consequence the working age population is slightly less at 65.2 per cent than the national proportion of 66.2 per cent.
4.26 The long term projected trend from ONS is that the population will grow fairly slowly over the period 2004/29, at 0.18 per cent compared to 0.29 per cent regionally. The working age population of the district is also forecasted to decline as the age profile of the total population ages.
4.27 The district continues to have very high economic activity rates and low unemployment. The district also continues to have much higher resident to workplace wages, which confirms the high out-commuting levels from Staffordshire Moorlands to better paid jobs outside the district. However wage levels generally remain lower than all other areas whilst the occupational status of the working population remains skewed towards the administrative and skilled trade occupations, with a low level of persons in higher skilled and service occupations.
SMELS 2 FINAL 23 09 08 41

Final Report
4.28 As identified in the original ELS, there is net out commuting from the district to work. The majority of travel to work journeys from Staffordshire Moorlands is within the region itself, to neighbouring districts such as Stoke on Trent and Newcastle-under-Lyme. However, almost 10 per cent of all journeys were also to the North West, destinations including Congleton, Macclesfield, Crewe and Nantwich, Manchester and Stockport.
Summary of Business Needs 4.29 Employment within the district is approximately 29,300 persons and has grown by 0.5 per cent
per annum since 1998, below the regional and national rates.
4.30 The economy still remains over dependent on the public sector for employment; therefore it will be important for the district to continue to assist in accommodating the needs of the private sector in order to grow the private sector employment base in the future. The Distribution, hotels & restaurants sector also continues to grow strongly and therefore planning and economic policy should help to provide suitable sights.
4.31 Future growth is likely to come from the Other Services, which has grown very impressively over 1998/06, and Banking, finance & insurance, which is currently significantly underrepresented.
4.32 Manufacturing remains competitive however as the industry as a whole is in decline there is still a strong need to diversify the economy further towards other private sectors.
4.33 Overall future economic and planning policy must have regard to the following economic trends:
• In terms of manufacturing, there must be a continued provision of land and premises fit for the purposes of modern occupiers including those engaged in light industrial activities. This will enable the industry to continue to be competitive and a degree of decline management;
• Also within the Manufacturing sector there must be a coherent plan for on-going restructuring in order to anticipate downsizing and closure possibilities as well as new and expanding sectors;
• There must be a pro-active approach to encouraging to development of business activities with good growth prospects. For instance there is a degree of specialism within tourism and leisure which could be strengthened and diversified into similar activities. Also despite the Creative and Healthcare sectors being currently underrepresented there is no reason they shouldn’t grow if they are found to be feasible as future areas to target through further investigation;
• The Banking, finance & insurance sector and office service sectors within Other Services are underrepresented. To an extent developing this sector will depend upon wider economic trends within the region, however, as stated in the previous ELS addressing issues of image and pursuing regeneration initiatives in the town centres can assist in creating occupier office markets;
• There is a fairly high proportion of self-employment within the district and a high proportion of micro businesses, which implies the majority of future demand for employment floorspace is likely to be generated by SMEs. However the VAT Registration data did not support a high level of entrepreneurship in the district, which implies that more research should be undertaken into the level and type of enterprise within the district that requires support and investigation into the most appropriate premises. For instance a range of starter premises, managed workspace and live/work units may be beneficial;
• The skill level of the workforce is comparatively low, therefore economic policies must aim to improve this situation if higher level employment is to be attracted and as a result workplace wages are to be increased and employment opportunities strengthened in the long term;
• The working age population in the district is forecasted to decline, which implies that there need to be higher level employment opportunities to attract new residents who work in the district but also to retain those residents who currently commute outside the district to higher paid jobs.
SMELS 2 FINAL 23 09 08 42

Final Report
Employment Forecasts 2006 to 2026 4.34 The updated forecasts are prepared using the labour demand and labour supply techniques used
in the original ELS. The business survey has not been updated hence updated quantitative forecasts are not provided using this technique.
4.35 The forecasts are presented at the district level but also for the preferred scenario disaggregated for the three towns also- Biddulph, Cheadle and Leek.
4.36 Using the findings above to help understand the direction of the forecasts it is useful to contextualise the demand and supply factors influencing the forecasts:
Demand Factors
• Employment is very strong in the Public, administration, education & health sector. However given that the sector is proportionately very high growth is likely to slow down or become stagnant in the future;
• Employment growth has been driven by the Public administration, Distribution, hotels & restaurants and the Banking, finance & insurance sector. However the latter is very under represented compared to the other sectors and future employment is likely to have to increase within this sector to counteract the decline within Manufacturing;
• Manufacturing remains competitive but will continue to decline, hence demand for employment land will weaken over the period;
• Start-up rates are fairly low in the district yet self employment is fairly high, therefore there is potential for policy to influence start up rates.
Supply Side Factors
• The population of the district, if following current trends as predicted by ONS, is likely to grow but growth will focus on the older age groups and the working age population will decline. This is a natural labour market constraint on growth.
• There is net out-commuting in Staffordshire Moorlands to neighbouring districts and to the North West, which is likely to be higher value and better paid jobs given that resident wages at much higher than workplace wages.
• Occupation and qualification levels in the district are comparatively low in the district, which is a constraint on attracting higher level employment opportunities.
• Unemployment is very low and economic activity very high.
Staffordshire Moorlands Future Economic Scenarios 4.37 Three scenarios were developed as part of the original ELS, they were designed with regard to
current employment and historical employment trends in the district. They key scenarios were:
• Scenario 1- There is a decline in employment with a downturn in the larger businesses within the district;
• Scenario 2- Growth is weak in the district with a continued dependency on larger businesses whilst start-ups remain static or decline; and,
• Scenario 3- There is restructuring within the economy and stronger growth as major employers see continued growth and start-up rates increase.
The preferred option in the ELS was Scenario 2, which was considered to provide the most realistic range of outcomes.
Given the update of the economic review has revealed very similar patterns to the original baseline this scenario is updated here to take on board the findings of the updated economic profile. The economic scenario is discussed below in terms of the demand and supply factors.
SMELS 2 FINAL 23 09 08 43

Final Report
Scenario: Growth is weak in the district with a continued dependency on larger businesses whilst start-ups remain static or decline.
Demand Factors
4.38 Growth is in line with the medium-long term growth rates whilst there is continued dependency upon larger businesses. The Distribution, hotels & restaurants and Banking, finance & insurance sectors are the main drivers of economic growth. This is led by a robust performance by major employers and growth opportunities in other business activities and tourism & leisure activities. There is also growth associated with active policy to encourage less obvious growth sectors such as the Creative sector.
4.39 There is also some positive progress in increasing start-ups and enterprise in the district aided by related policy drivers. These initiatives focus on promoting the district as a location for remote workers, home workers, telecommuters and new start ups. There could be a trend toward a 'property lite' economy as homes and live/work units are the new offices. In addition the other services sector continues to grow as the district begins to develop niche sports services and the healthcare sector to service the ageing population. Therefore there is some diversification towards the higher value added industries
Supply Factors
4.40 The working age population of the economy does continue to decline but at a slightly lower rate than ONS projections and the economy begins to diversify and the economy grows. Economic activity and unemployment remain high and do not act as a constraint. In addition as more premises become available for higher value added industries there is slightly less out commuting by persons in higher value occupations.
Forecast Results 4.41 Table 4.1 below sets out the employment forecast results, for both the Labour Demand
Technique and Labour Supply Technique) for total employment and B-use employment in Staffordshire Moorlands under the updated scenario.
Table 4.1 – Overall Results: Average Annual Growth Rates (%)
Results
Total Employment
Labour Supply Technique 0.4
Labour Demand Technique 1.1
B-Use Employment
Labour Supply Technique 0.3
Labour Demand Technique 0.8
4.42 The preferred forecast is taken as the demand technique, as it is better to go with the scenario
predicting the most need if planning policies are to be focused on promoting diversification. Also, the supply side forecasts tend to be lower than the demand side techniques as they recognise explicitly the supply side constraints on the economy such as an ageing population and out-commuting affecting future growth. However supply side constraints could be lessened if there is a proactive approach to economic diversification to stimulate demand in the economy. For instance if the district is successful in attracting higher value occupations out commuting levels may fall and more persons may be attracted to live in the district. The demand forecasts here are on a higher growth trajectory than in the previous ELS and aspirational, they assume considerable diversification efforts. They should be reviewed consistently to ensure that they remain realistic.
SMELS 2 FINAL 23 09 08 44

Final Report
4.43 Figure 4.2 below demonstrates the B-use employment forecasted over the period 2006/26. B-use employment is predicted to grow considerably from approximately 15,300 to 18,000 persons over the period 2006 to 2026.
Figure 4.2 – B-use Employment Forecasts for Staffordshire Moorlands
15,000.0
15,500.0
16,000.0
16,500.0
17,000.0
17,500.0
18,000.0
18,500.0
2006 2008 2010 2012 2014 2016 2018 2020 2022 2024 2026
4.44 The tables below are intended to set out an indication of the nature of the future demand rather than a prescriptive requirement for the District. The demand scenario envisaged is relatively optimistic, assumes continued growth and does rely on continued diversification of the economy.
4.45 Table 4.2 details the employment forecasts by B-use category and the associated floorspace requirements. The numbers of jobs forecasted for the district for each sector were converted into a forecast floorspace requirement using employment densities. An employment density refers to the average floorspace per person in an occupied building and is therefore a measure of how much space each additional job will require. The densities vary across sectors due to the difference in working practices and floorspace requirements.
Table 4.2 – Forecasts for Stafford e Moo s by Sector shir rland
Tota
l
Jobs
in
202
6
%
grow
th
per a
nnum
Cha
nge
in
tota
l jo
bs
2004
-202
0
Empl
oym
ent
Den
sitie
s
Add
ition
al
Floo
rspa
ce
by
2020
B-Use Banking, Finance and Insurance (BC) 5186 2.3 1895 19
36,007
B-Use Construction (BC) 2169 2.4 819 5 4,097
B-Use Distribution and Wholesale (BC) 2587 1.8 776 50
38,823
B-Use Manufacturing (BC) 3435 -2.4 -2149 27 - 58,020
B-Use Other Services (BC) 3131 2.2 1105 19 20,991
B-Use Transport and Communications (BC) 1482 0.8 218 27
5,896
TOTAL 17991 0.8 2665 - - Jobs created - - 4814 - - Jobs lost - - -2149 - - Net change in jobs - - 2665 - - Gross floor space demand
- - - - 105,814
SMELS 2 FINAL 23 09 08 45
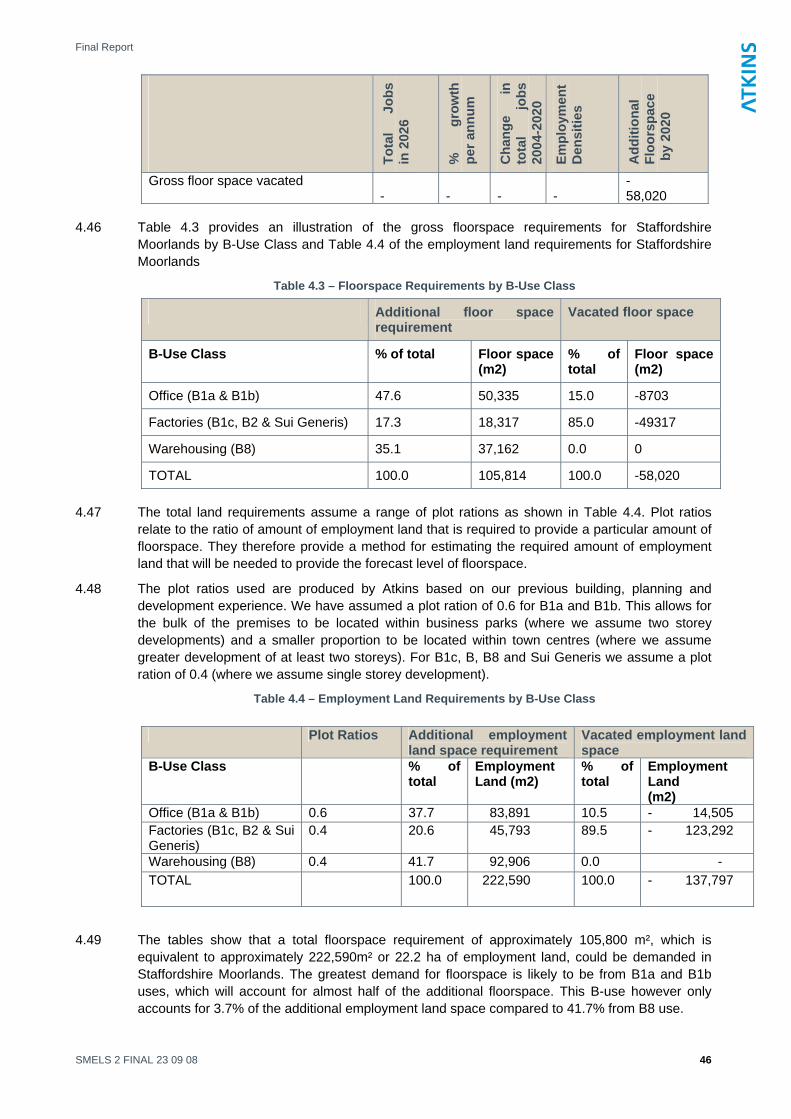
Final Report
Tota
l
Jobs
in
202
6
%
grow
th
Cha
nge
in
tota
l jo
bs
per a
nnum
2004
-202
0
Empl
oym
ent
Den
sitie
s
Add
ition
al
Floo
rspa
ce
by
2020
Gross floor space vacated - - - -
- 58,020
4.46 Table 4.3 provides an illustration of the gross floorspace requirements for Staffordshire
Moorlands by B-Use Class and Table 4.4 of the employment land requirements for Staffordshire Moorlands
Table 4.3 – Floorspace Requirements by B-Use Class
Additional floor space requirement
Vacated floor space
B-Use Class % of total Floor space (m2)
% of total
Floor space (m2)
Office (B1a & B1b) 47.6 50,335 15.0 -8703
Factories (B1c, B2 & Sui Generis) 17.3 18,317 85.0 -49317
Warehousing (B8) 35.1 37,162 0.0 0
TOTAL 100.0 105,814 100.0 -58,020 4.47 The total land requirements assume a range of plot rations as shown in Table 4.4. Plot ratios
relate to the ratio of amount of employment land that is required to provide a particular amount of floorspace. They therefore provide a method for estimating the required amount of employment land that will be needed to provide the forecast level of floorspace.
4.48 The plot ratios used are produced by Atkins based on our previous building, planning and development experience. We have assumed a plot ration of 0.6 for B1a and B1b. This allows for the bulk of the premises to be located within business parks (where we assume two storey developments) and a smaller proportion to be located within town centres (where we assume greater development of at least two storeys). For B1c, B, B8 and Sui Generis we assume a plot ration of 0.4 (where we assume single storey development).
Table 4.4 – Employment Land Requirements by B-Use Class
Plot Ratios Additional employment land space requirement
Vacated employment land space
B-Use Class % of total
Employment Land (m2)
% of total
Employment Land (m2)
Office (B1a & B1b) 0.6 37.7 83,891 10.5 - 14,505 Factories (B1c, B2 & Sui Generis)
0.4 20.6 45,793 89.5 - 123,292
Warehousing (B8) 0.4 41.7 92,906 0.0 - TOTAL 100.0 222,590 100.0 - 137,797
4.49 The tables show that a total floorspace requirement of approximately 105,800 m², which is equivalent to approximately 222,590m² or 22.2 ha of employment land, could be demanded in Staffordshire Moorlands. The greatest demand for floorspace is likely to be from B1a and B1b uses, which will account for almost half of the additional floorspace. This B-use however only accounts for 3.7% of the additional employment land space compared to 41.7% from B8 use.
SMELS 2 FINAL 23 09 08 46

Final Report
4.50 It should be recognised that the above estimates provide only a guide to how the additional floorspace needs are likely to be broken down by Use Class. The exact proportions will depend (for example) on how much useable vacant floorspace comes onto the market from firms who cease trading and the success of initiatives to upgrade the quality of existing B-class building stock. It should also be noted that well located, flexible and adaptable premises may be suitable for occupation by a range of B-class activities, however, the vast majority of demand for will come from B1a and B1b uses.
4.51 The forecasts are also aspirational and make various assumptions not only of the district’s economic development but also continued national economic growth. If growth is slower the forecasts should be revised to reflect a more realistic demand for employment land.
Indicative Scenarios of Need at Sub-district Level 4.52 We have provided indicative scenarios of need at the sub-district level here to provide an
indication of employment land need until 2026. Forecasts at sub-district level are much less accurate as they are looking at very small geographical areas. Therefore it should be noted that these forecasts are only an illustration of the need in the sub areas.
4.53 The broad forecasts results have also been disaggregated at a sub-district level to Cheadle, Leek and Biddulph using the current levels of B-use employment within each.
4.54 The forecasts here been compiled by:
• Firstly, assuming that the rates of growth within each sector are the same as those forecasted in the district as a whole and that the proportions each town holds of total district B-use employment by sector remains the same.
• Secondly, then the growth of broad sectors for each sector has been checked for each town and altered in some instances to better reflect the rate of change in each town. For instance in reality it is unlikely that the rate of growth will be exactly the same given the characteristics of each town. For instance in Cheadle the overall decline of the Manufacturing sector has been made less severe given the sector is currently doing very well and experiencing little decline.
4.55 These sub-district forecasts are only an indication and should be reviewed alongside other indicators of demand such as the performance of the property market and all developments scheduled and their likely impact on jobs etc. This approach is very broad and only gives an indication of what the future employment land demand could be.
4.56 Table 4.5 below displays the level of B-use employment by type within each town. This is based on accumulating the current levels of employment within those wards which best comprise each settlement6.
Table 4.5 – B-use Employment in Biddulph, Cheadle & Leek, Person (as % of total in Staffordshire Moorlands)
B-Use Sector Biddulph Cheadle Leek Staffordshire Moorlands
Banking, Finance & Insurance 290 369 1,787 3,291
Construction 153 284 241 1,350 Distribution and Wholesale 221 229 800 1,811
Manufacturing 381 1,144 1,535 5,584
Other Services 81 155 346 2,026
6 The 2003 CAS wards used as the best fit wards for each town are: Biddulph- Biddulph West, Biddulph South, Biddulph East, Biddulph North and Biddulph Moor Cheadle- Cheadle South East, Cheadle West and Cheadle North East Leek- Leek North, Leek East, Leek South and Leek West.
SMELS 2 FINAL 23 09 08 47

Final Report
SMELS 2 FINAL 23 09 08 48
B-Use Sector Biddulph Cheadle Leek Staffordshire Moorlands
Transport and Communications 279 114 193 1,264
TOTAL 1,406 2,294 4,902 15,327 4.57 Using these figures and projecting forward B-use employment in line with the preferred demand
technique in Table 4.1, Table 4.6 below outlines the broad results for each town in turn.
Table 4.6 – Indicative Employment Forecast Results
B-Use Sector
Bid
dulp
h C
hang
e in
To
tal J
obs
in 2
026
Che
adle
C
hang
e in
To
tal j
obs
in 2
026
Leek
Cha
nge
in T
otal
jo
bs in
202
6
Bid
dulp
h A
dditi
onal
Fl
oors
pace
b
y 20
26
Che
adle
A
dditi
onal
Fl
oors
pace
by
2026
Leek
A
dditi
onal
Fl
oors
pace
by
2026
B-Use Banking, Finance and Insurance (BC) 167 212 1029 3,173 4,037 19,552 B-Use Construction (BC) 93 172 146 464 862 731 B-Use Distribution and Wholesale (BC) 49 79 176 2,433 3,971 8,808 B-Use Manufacturing (BC) -194 -170 -782 - 5,242 - 4,584 - 21,121 B-Use Other Services (BC) 44 85 189 839 1,606 3,585 B-Use Transport and Communications (BC) 48 20 33 1,301 532 900 TOTAL 207 399 791 2,969 6,424 12,455 Total growth per annum 0.7 0.8 0.8 Jobs created 401 569 1573 Jobs lost -194 -170 -782 Net change in jobs 207 399 791 Gross floor space demand 8,211 11,008 33,576 Gross floor space vacated - 5,242 - 4,584 - 21,121
4.58 The main assumptions made behind the forecasts are that Manufacturing declines at a much slower rate (around 0.8% per annum) in Cheadle compared to the other two towns where it continues to decline fairly rapidly. This is largely as the Manufacturing sector has not declined at all over the period 1998/06 in Cheadle or over the longer term 1991/08.

Final Report
Table 4.7 – Indicative Floorspace Requirements in three towns.
Biddulph Cheadle Leek Biddulph
Cheadle Leek B
-Use
C
lass
Add
ition
al
Floo
rspa
ce %
Add
ition
al
Floo
rspa
ce %
Add
ition
al
Floo
rspa
ce %
Vac
ant
Floo
rspa
ce %
Vac
ant
Floo
rspa
ce %
Vac
ant
Floo
rspa
ce %
Office (B1a & B1b) 22,209 66.1
5,296 48 22,209 66.1 - 786
15.0
- 688 15.0 - 3,168
15.0
Factories (B1c, B2 & Sui Generis)
3,207 9.6
1,989 18 3,207 9.6 - 4,456
85.0
- 3,896 85.0 - 17,952
85.0
Warehousing (B8) 8,160 24.3
3,722 33.8 8,160 24.3 - -
- 0.0 - 0.0
total 33,576 100.0
11,008 100.0
33,576 100.0 - 5,242
100.0
- 4,584 100.0 - 21,121
100.0
Table 4.8 – Ind tive Employment La Requirements in three towns. ica nd
Biddulph Cheadle Leek Biddulph Cheadle Leek
B-U
se C
lass
%
of
addi
tiona
l
Add
ition
al
Floo
rspa
ce
%
of
addi
tiona
l
Add
ition
al
Floo
rspa
ce
%
of
addi
tiona
l
Vac
ant
Floo
rspa
ce
% o
f vac
ant
Vac
ant
Floo
rspa
ce
% o
f vac
ant
Vac
ant
Floo
rspa
ce
%
of
vaca
nt
floor
spac
e
Office (B1a & B1b) 6,617.4 38.4
8827.4 38.2
37,015 56.6 -1310.58 10.5 -1145.98 10.5 - 5,280
10.5
Factories (B1c, B2 & Sui Generis)
4,082.4 23.7
4973.5 21.5
8,017 12.3 -11139.9 89.5 -9740.82 89.5 - 44,881
89.5
Warehousing (B8) 6,518.9 37.9
9306.2
40.3
20,400 31.2 0 0.0 0 0.0 - 0.0
total 17,218.7 100.0
23107.1 100.0
65,432 100.0 -12450.5 100.0
-10886.8 100.0 - 50,161
100.0
SMELS 2 FINAL 23 09 08 49

Final Report
4.59 These broad results place employment land demand in the towns Biddulph, Cheadle and Leek at 1.7, 2.3 and 6.5 ha each respectively. Leek is expected to have the most requirements in terms of B1a & B1b employment land. However these above estimates are only a guide as to how the additional floorspace needs are likely to be broken down by Use Class.
4.60 As these forecasts are only an indication of sub area need we not provided specific advice for these areas in our recommendations.
SMELS 2 FINAL 23 09 08 50

Final Report
5. Commercial Property Market - Update Introduction
5.1 This section provides a brief update of the current property market position in the District.
5.2 From conversations with local property agents it was identified that since the 2006 ELS, there had been little significant change to the commercial property market in the Staffordshire Moorlands District.
5.3 The most significant issues identified currently facing the commercial property market in the District are:
• A lack of freehold commercial property available in the District, which is still considered to be the most popular form of ownership;
• It is thought that one of the District’s main employers, Britannia Building Society, is more secure since it recently became part of the Bristol and West Building Society group.
• The general downturn in the economy was identified as an important issue which may affect the direction of future building proposals in the District. It is thought that the possible downturn in the housing market may soften the demand for additional housing sites by developers in the short term.
• The District requires new units of between 1,000 sq ft (92 SQ.M) and 10,000 sq.ft (929 SQ.M). The lack of current units of this size is stifling the local economy and there are few places or sites for smaller businesses to locate in. This may need to be on Greenfield if no alternative sites can be found.
5.4 As previously identified, the District broadly operates on the three markets of Leek, Biddulph and Cheadle. A short overview of market conditions and other issues at each of these is provided below:
• Leek - discussions generally supported the notion that there has been relatively little activity of note in Leek since the 2006 ELS apart from some managed workspace which it is understood has come forward in Leek in a former mill on Cross Street. It is understood that these units have not been let yet.
• Biddulph - discussions held suggested that Victoria Business Park bucks the typical trends of the District so far a quality new employment accommodation is concerned. This site is seen as forming part of the wider Cheshire and Stoke-on-Trent market and so is untypical in this respect. There is new build coming forward on this site as part of a partnership approach by Advantage West Midlands and Staffordshire Moorlands District Council. It was commented that the public sector approach taken at this site involves a long lead in time for companies wanting to locate at Victoria Business Park. A shorter lead in time may have resulted had a private, speculative developer taken the lead role at this site. Restrictions on outside storage at this site also preclude some potential users. However despite these restrictions, Victoria Business Park has ninety per cent of the site under offer, so has been attractive in this respect.
In Biddulph, the by-pass has opened up a couple of sites and agents are receiving enquiries from companies who are likely to be displaced, due to a proposed Sainsbury supermarket development and implications of the proposals contained in the Biddulph Area Action Plan.
• Cheadle – the town’s location to the south of the District means that were Blythe Bridge RIS strategic allocation to come forward (site 23), this site would soak up a significant number of businesses and would encourage new companies to invest in this location at the expense of traditional employment sites.
SMELS 2 FINAL 23 09 08 51

Final Report
Live / Work Accommodation
5.5 Live/work units were discussed as these properties are sometimes popular in rural areas and can lend themselves to former agricultural premises due to the shared residential and employment use with people seeking to locate in a rural area. It was considered that live/work units behave in a similar way to residential properties rather than commercial.
Summary
5.6 To improve the rather constrained property market in the District, the agent considered it would be necessary to bring forward new development sites in additional to new ones. Catering for different market segments was said to be important, particularly smaller office based firms.
5.7 Victoria Business Park was a partnership approach that has brought forward a new, high quality site. This approach, with an increased private sector developer input is considered to represent a good model for enabling future speculative development in the District.
SMELS 2 FINAL 23 09 08 52

Final Report
6. Portfolio of Employment Sites - Update Introduction
6.1 Sections 3, 4 and 5 have updated the supply and demand work associated with the 2006 ELS, bringing them up to date and reflecting the employment issues facing the Staffordshire Moorlands District in 2008.
6.2 This section brings the three sections together and provides advice on a suitable portfolio of employment land which could serve the District’s B-class employment needs until 2026. The advice provided is underpinned by sound evidence provided elsewhere in the report. This section should be read in conjunction with the evaluation matrices provided in Appendix B.
6.3 The process which has been used to update the previous recommendations (ELS, 2006) is summarised as follows:
(i) FUTURE EMPLOYMENT LAND REQUIREMENT - The additional demand for B Class use in Staffordshire Moorlands is 105,814 sq.m, which equates to a need for 22.2ha of land. This has been calculated and rolled forward until 2026 to dovetail with the end date of the emerging Core Strategy and the RSS for the West Midlands.
(ii) MEETING THE DEMAND – employment sites has been considered regarding their physical potential to accommodate B Class Uses. The physical potential of sites has been investigated in further detail with regards to the suitability of land to accommodate growth (refer to Appendix B). A criteria based scoring system using indicators has been used for this purpose.
(iii) RECOMMENDATIONS – Revised recommendations have been provided with regards to which sites are considered most suitable in terms of meeting the District’s future employment land needs (provided in next conclusions section).
i) Future Employment Land Requirements 6.4 In accordance with the ODPM best practice on Employment Land Review’s, the 2006 ELS and
this update provides recommendations regarding the future employment land requirements by Use Class.
6.5 Table 6.1 identifies the amount of additional land forecasted to be required until 2026. The revised forecasts up until 2026 have identified the need to provide an additional 105,814 sq.m of B class employment floorspace, which equates to an additional 22.2ha of land7. As a small proportion of the current employment land supply has been identified as being unsuitable for employment use, there is a need to identify a further 1.3ha to replace the site considered unsuitable (refer to Table 6.2). This equates to a total need of 23.8ha additional land in addition to the supply of sites which are suitable for continued use (248ha).
7 Compared to the ELS 2006 requirement of 88,000 sq.m of floorspace or 18.4 ha of land.
SMELS 2 FINAL 23 09 08 53

Final Report
Table 6.1 – Employment Land and Premise Requirements to 2026
Additional Floorspace Requirement until 2026
(Sq.m)
Additional Land Requirement until 2026
(ha)
Additional B1 a and B1b 50,335 8.3
Additional B1c and B2 18,317 4.5
Additional B8 37,162 9.2
Additional required due to economic growth 105,814 22.2
Additional Supply Required to Replace Unsuitable Sites* N/A 1.3
TOTAL ADDITIONAL REQUIRED 105,814 23.8
EXISTING SUPPLY SUITABLE FOR CONTINUED USE 750,007 248
TOTAL REQUIRED DISTRICT 855,821 271.5 *The unsuitable site (number 34) contains very little floorspace due to the nature of activities and is therefore excluded
Table 6.2 – Sites Excluded from Portfolio of Suitable Land
Site ID Site Name Employment Land (Ha)
Overall suitability Score
34 Dilhorne Road and The Green 1.3 49.0
Regionally Significant Site (excluded from supply)
23 Blythe Bridge RIS 50.4 N/A
ii) Meeting the Demand 6.6 To meet the future needs of the District, analysis identifies the District will need a total of 271.8ha
of land (excluding the Regional Investment Site at Blythe Bridge).
Use of Existing Sites Suitable for Continued Use
6.7 Continued use of existing employment sites identified as suitable can provide 248ha of employment land. Table 6.3 identifies which sites should be used for this. The location of the sites is provided in Figure A1, in the appendix.
Table 6.3 – Existing Sites Suitable for Continued Use
Site ID
Site Name Total Employment Land within boundary (Ha)
Vacant land (Ha)
Opportunity land (Ha)
Vacant Premise (m²)
Suitability Score (%)
Allocated Employment Sites in the Local Plan
24 Victoria Business Park
9.6 5.9 0.0 486.1 93
9 Cattle Market 5.5 0.0 5.4 0.0 70
25 Wharf Road 6.0 4.3 1.7 0.0 64
31 Far Lane Industrial 0.9 0.0 0.4 200.0 64
SMELS 2 FINAL 23 09 08 54
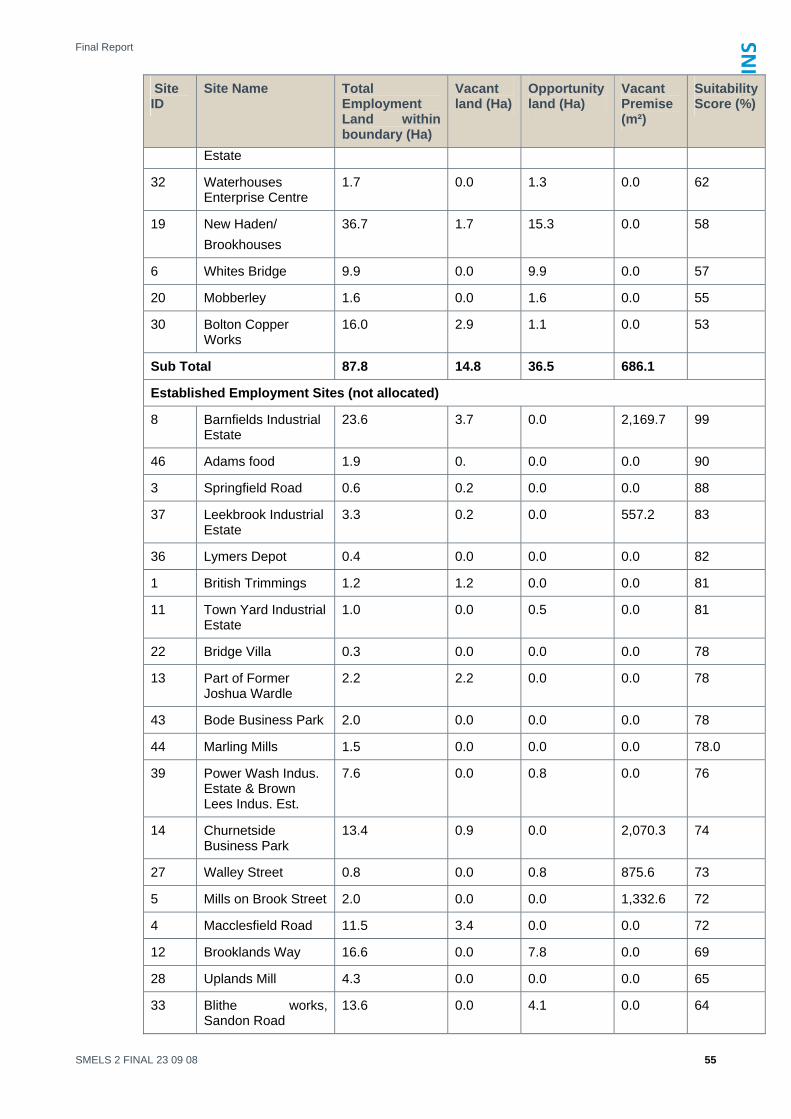
Final Report
Site ID
Site Name Total Employment Land within
Vacant Opportunity Vacant Suitability
boundary (Ha)
land (Ha) land (Ha) Premise Score (%) (m²)
Estate
32 Waterhouses Enterprise Centre
1.7 0.0 1.3 0.0 62
19 New Haden/ Brookhouses
36.7 1.7 15.3 0.0 58
6 Whites Bridge 9.9 0.0 9.9 0.0 57
20 Mobberley 1.6 0.0 1.6 0.0 55
30 Bolton Copper Works
16.0 2.9 1.1 0.0 53
Sub Total 87.8 14.8 36.5 686.1
Established Employment Sites (not allocated)
8 Barnfields Industrial Estate
23.6 3.7 0.0 2,169.7 99
46 Adams food 1.9 0. 0.0 0.0 90
3 Springfield Road 0.6 0.2 0.0 0.0 88
37 Leekbrook Industrial Estate
3.3 0.2 0.0 557.2 83
36 Lymers Depot 0.4 0.0 0.0 0.0 82
1 British Trimmings 1.2 1.2 0.0 0.0 81
11 Town Yard Industrial Estate
1.0 0.0 0.5 0.0 81
22 Bridge Villa 0.3 0.0 0.0 0.0 78
13 Part of Former Joshua Wardle
2.2 2.2 0.0 0.0 78
43 Bode Business Park 2.0 0.0 0.0 0.0 78
44 Marling Mills 1.5 0.0 0.0 0.0 78.0
39 Power Wash Indus. Estate & Brown Lees Indus. Est.
7.6 0.0 0.8 0.0 76
14 Churnetside Business Park
13.4 0.9 0.0 2,070.3 74
27 Walley Street 0.8 0.0 0.8 875.6 73
5 Mills on Brook Street 2.0 0.0 0.0 1,332.6 72
4 Macclesfield Road 11.5 3.4 0.0 0.0 72
12 Brooklands Way 16.6 0.0 7.8 0.0 69
28 Uplands Mill 4.3 0.0 0.0 0.0 65
33 Blithe works, Sandon Road
13.6 0.0 4.1 0.0 64
SMELS 2 FINAL 23 09 08 55

Final Report
Site ID
Site Name Total Employment Land within
Vacant Opportunity Vacant Suitability
boundary (Ha)
land (Ha) land (Ha) Premise Score (%) (m²)
38 Co-op Milk Plant 2.0 0.0 0.0 0.0 62
16 Pointons Site 6.5 0.0 1.4 0.0 57
17 JCB, Leek Road 20.5 0.0 7.7 0.0 56
18 JCB, Oakmoor Road 1.4 0.0 0.0 0.0 56
10 Britannia Building Society
8.3 0.0 1.4 0.0 50
Sub-Total 146.6 11.8 24.5 7,005.3
Other Employment Sites (minor)
26 Former Council Depot
0.2 0.2 0.0 0.0 86
35 Queen Street 0.4 0.1 0.0 3,227 80
41 Anzio Camp 9.5 0 9.5 0.0 71
40 Middle Hulme Farm 0.42 0.0 0.4 0.0 63
42 Novi Lane 0.4 0.0 0.4 0.0 62
15 Beresford/PMT Depot
1.9 0.6 1.3 0.0 60
45 Adderley Mill 0.7 0.0 0.4 1,413.1 52
Sub Total 13.5 0.9 12.0 4,640.5
OVERALL TOTAL 248.0 27.5 73.0 12,332.0 70.3
Meeting the Balance 6.8 Analysis of the supply – demand balance has identified the need to provide an additional 23.8ha
of employment land to meet demand until 2026. This could be done in a number of ways including:
• The use of vacant land within existing employment sites;
• The use of opportunity areas within existing employment sites; and
• The allocation of new employment sites in suitable locations.
Vacant Land and Opportunity Areas
6.9 Given the forecasted need to provide 23.8 of additional land over and above the existing portfolio of sites, our preferred and recommended way of meeting this demand is the use of vacant land and opportunity areas at existing sites. The requirement could, in theory, be met entirely by use of vacant land as 27.5ha of vacant land has been identified (refer to table 6.3). Alternatively, all or part of the need could be met through the use of opportunity areas which, in total, amounts to some 73.4ha.
6.10 The least preferred option to meet future demand would be the use or allocation of new employment sites. In planning and regeneration terms the redevelopment of existing sites is preferable to the development of greenfield land.
6.11 In instances where the use of opportunity land is considered the most appropriate means of meeting demand, opportunity areas identified in Table 6.4 are considered most suitable. The
SMELS 2 FINAL 23 09 08 56

Final Report
council would need to identify strategies for bringing forward land. This may involve the preparation of development briefs or similar strategies to enable development.
6.12 Some of the opportunity areas identified contain existing B class activities (where land is within the site boundary is considered under-used). In instances where this is the case, care should be taken to ensure existing floorspace is re-provided (in addition to new floorspace) so a net gain of floorspace is achieved.
Table 6.4 – Potential Opportunity Areas Suitable for Intensification / Redevelopment
Site No Name Opportunity Area (ha)
Suitability Score
6 Whites Bridge 9.9 57
9 Cattle Market 5.4 70
12 Brooklands Way 7.8 69
19 New Haden / Brookhouses 15.7 58
20 Mobberley 1.6 55
25 Wharf Road 1.7 64
30 Bolton Copper Works 1.1 53
41 Anzio Camp 9.5 71
TOTAL 52.7 N/A
SMELS 2 FINAL 23 09 08 57

Final Report
SMELS 2 FINAL 23 09 08 58

Final Report
7. Conclusions 7.1 This section sets out our revised recommendations in respect of the future policy approach to
employment land in Staffordshire Moorlands as an update to those provided in the 2006 ELS.
7.2 Our conclusions and recommendations are based upon the cumulative findings of the 2006 ELS together with this subsequent work. The Update has included additional work on both the employment land supply and demand sides and associated analysis. Our approach taken is consistent with current policy and ODPM government guidance. The conclusions consist of the following:
• A brief summary of the main economic and employment land issues in the District;
• A summary of the employment land and demand balance;
• Planning policy recommendations to inform LDF policy making; and
• Implementation
Summary of Issues Economic Context
7.3 The key economic conditions of the Staffordshire Moorlands District are:
Demand Factors
• Employment is very strong in the Public, administration, education & health sector. However given that the sector is proportionately very high growth is likely to slow down or become stagnant in the future;
• Employment growth has been driven by the Public administration, Distribution, hotels & restaurants and the Banking, finance & insurance sector. However the latter is very under represented compared to the other sectors and future employment is likely to have to increase within this sector to counteract the decline within Manufacturing;
• Manufacturing remains competitive but will continue to decline, hence demand for employment land will weaken over the period;
• Start-up rates are fairly low in the district yet self employment is fairly high, therefore there is potential for policy to influence start up rates.
Supply Side Factors
• The population of the district, if following current trends as predicted by ONS, is likely to grow but growth will focus on the older age groups and the working age population will decline. This is a natural labour market constraint on growth;
• There is net out-commuting in Staffordshire Moorlands to neighbouring districts and to the North West, which is likely to be higher value and better paid jobs given that resident wages at much higher than workplace wages;
• Occupation and qualification levels in the district are comparatively low in the district, which is a constraint on attracting higher level employment opportunities;
• Unemployment is very low and economic activity very high.
Employment Land Supply 7.4 The update of supply identified the following key issues:
• Vacancy levels at employment sites are low (around 2.4%) and considered to be at a frictional level necessary to allow businesses the opportunity to re-locate within the District;
SMELS 2 FINAL 23 09 08 59

Final Report
• Lack of new premises – since the ELS (2006) the balance of newer premises identified in the District has remained
• Regional Spatial Strategy for the West Midlands continues to promote the greenfield Regional Investment Site at Blythe Bridge (site 23) to serve wider sub regional needs;
• A shortage of small scale premises (especially up to 100 Sq.m) has been identified and continues to present availability issues for smaller firms in the District;
• Many existing employment sites and premises are dated and no longer offer the most efficient, modern working space for businesses wishing to operate from the District. Potential opportunities to improve the efficiency and attractiveness of such areas have been identified.
• Vacant parcels of land inside the boundaries of employment sites have been identified and in many cases may offer the best short term option for increasing floorspace in areas of high demand;
• Some of the larger sites are used by single occupiers. Many of these are longstanding firms who have been located in the District for some time (Britannia Insurance / JCB). There is a risk that if any of these businesses were to leave the District a significant number of jobs could be lost which could be difficult to replace;
• Traditional manufacturing activities of the District (antiques, silk and fabrics) are not as strong as they were and some are in decline. This has led to some sites suffering from a lack of investment and now requiring improvement;
• In terms of accessibility much of the District is poorly served by the strategic road network which restricts the suitability of some parts of Staffordshire Moorlands for certain types of B class use. In particular, modern B8 requires quick and reliable access to motorways for optimum efficiency. The Blythe Bridge Regional Investment Site (23) is the only site with direct access onto the A50 which leads directly to the M6. Given the lack of other sites in the District with such good access to the SRN, bringing forward this site is particularly important. Attracting further B8 users to the District in areas away from the SRN is likely to remain challenging without the benefit investment to the road network;
• Local accessibility onto some sites has been identified as poor and should be given greater importance in future decisions relating to the suitability of land for B class employment. At some sites, local amenity issues are created where minor roads are used for HGV deliveries; and
• Although the District benefits from a number of former mill buildings which have the potential for reuse or conversion for new employment use, there are often problems and high costs associated with achieving this.
Employment Land Demand-Supply Balance • Estimated requirement for future employment floorspace amounts to over 105,814 Sq.m for
the period 2008-2026 (23.8 ha).
• Our analysis demonstrates the need for 23.8ha of additional land can be met through the use of vacant land at existing sites or through the redevelopment of opportunity areas. This is considered preferable to redeveloping further Greenfield land.
• An additional 50.4ha of high quality B-Class employment land is known to be coming forward at the Regional Investment Site at Blythe Bridge (Site 23). Although this site has been excluded from the analysis on the basis that it is intended primarily to serve a wider regional role, it is acknowledged that it will also have a more localised role in terms of providing additional employment land in the District. If around half (47%) of the Blythe Bridge site (23.8ha) were used solely for local businesses, this site alone would have the potential to serve the entire future needs of the District until 2026.
SMELS 2 FINAL 23 09 08 60
Final Report
• Although in quantitative terms the Blythe Bridge site could serve the future needs of the District, priority should be given to the redevelopment and intensification of identified opportunity areas before the Blythe Bridge site is used. This strategy is considered desirable in terms of having the scope to distribute future investment around the District and in terms of bringing environmental benefits to some of the existing employment sites, rather than all new investment being concentrated in the south of the District.
• Our demand projections and analysis suggest it is unlikely that further employment land will need to be allocated before 2026.
Planning Policy Recommendations 7.5 Reflecting the emerging policy contained in Draft PPS4, it is important that LDF employment
policies promote a proactive and positive approach to planning for economic development in the District. Importantly, this includes the need for flexibility to be built into future policies so that unnecessary restrictions are not placed regarding acceptable use of employment sites. Previously, these are now recognised to have hindered economic development in some circumstances.
7.6 It is recommended that based on the analysis and findings of this Update and the previous ELS (2006) the following issues are addressed in forthcoming planning policies.
1. Future Employment Land Policy 7.7 Staffordshire Moorlands should adopt policies which strongly protect the best employment sites
identified earlier in this ELS update. Loss of these sites to alternative uses runs the risk of constraining employment growth, limiting economic diversification and fuelling an imbalance between the number of local residents of a working age and the number of jobs available locally.
7.8 Adopting policies which strongly encourage the redevelopment, intensification and improvement of existing employment areas is particularly important. The Council should consider undertaking further site analysis work to comprehensively assess the potential of these sites and the mechanisms needed to be put in place to realise this. This could include the preparation of specific development briefs for larger opportunity areas to enable a co-ordinated approach is taken.
7.9 Given the current situation in the District, safeguarding existing employment areas for business and industrial use is extremely important. In doing so, it is important for designations and supporting policy text to reflect up to date policy considerations including the West Midland’s Regional Spatial Strategy and its Regional Economic Strategy. Priority should be given in policy terms to the redevelopment of opportunity areas in existing sites before the Blythe Bridge site is used to meet future needs.
7.10 The contribution of smaller sites towards the overall provision of employment generating uses needs to be recognised and protected appropriately. Consequently, there is a need for the LDF to identify and designate a comprehensive portfolio employment sites over and above the large established employment areas.
7.11 Our findings suggest it will not be necessary to allocate further employment land over and above the regional Investment Site at Blythe Bridge. Blythe Bridge could support future local employment growth but it is considered more appropriate if investment was prioritised towards the re-development of vacant land and opportunity areas in existing sites rather than the majority of future development being concentrated in one specific site.
7.12 We recommend future investment in employment sites is spread across the three main towns of Leek, Cheadle and Biddulph so each of these towns has a relatively equal proportion of ‘quality’ employment sites.
Loss of Employment Land
7.13 The site typologies reflect a variety of economic and employment roles that should be catered for in the District. Consequently, sites which have been assessed and demonstrated that they meet
SMELS 2 FINAL 23 09 08 61

Final Report
the criteria outlined for each site type should be protected against loss. In identifying the sites and the supporting policies, it is important the LDF demonstrates a rigorous process of assessment has been undertaken. However, the LDF should also build in periodic reviews in order to update, and if necessary, revise the employment land assessment.
7.14 Other types of employment sites should also be subject to robust policies which protect the sites from transfer to other uses except when it can be demonstrated that clear criteria can be met. This should include evidence of marketing activity which has taken place over a defined period of time (one year):
• Policies should highlight the need for applicants to demonstrate the land and rental values being sought through the marketing process. It is important that these are appropriate in light of local and sub-regional market conditions and in relation to the specific characteristics of the site or premises being offered to the market.
• Also of particular importance, policies should require developers or landowners to demonstrate that sites have appropriately been offered to the market in terms of potential redevelopment opportunities for employment use. It is critical that the marketing process is not constrained by the current condition and/or specification of the buildings on the site.
7.15 It is also appropriate for the policies to give wider consideration to issues of viability of sites for employment use. This could include the potential intervention of public bodies to ensure viability for key sectors and/or types of businesses (e.g. start-ups). In guiding the viability of development proposals, it will be important that applicants have regard to guidance prepared by the local authority. We recommend that benchmarks should be established jointly with surrounding districts having regarding to variations in location, size, type / quality of premises (fit for purpose), lease length and conditions, business sector and affordability.
7.16 Critically, it will be essential for benchmarks to compare like with like. Moreover, a standard monitoring and review process should be established to account for changing local, sub-regional and regional market conditions. This should form part of an annual monitoring review process undertaking jointly with surrounding local authorities. This should include the involvement of private and public sector property professionals who are active in the area.
7.17 In addition to the marketing tests, other exception criteria which could be adopted to manage the potential loss of other employment sites could include circumstances where it can be demonstrated that:
• A) The proposal is for other non-residential uses that provides significant employment, and there is no identified need for the site or buildings for Class B uses; or
• B) The proposal is wholly for affordable housing, the site is vacant and the development would not prejudice the continuation of adjacent employment uses; or
• C) The proposal is for any other use and the application is supported by a statement of the efforts made to secure re-use for Class B1-B8 or similar uses or other non-residential use that provides employment, which indicates that there is no realistic prospect of the site or buildings being used or re-used including redevelopment for these purposes. Mixed use schemes incorporating B class use are encouraged so long as a net loss of employment does not result. In some circumstances, the council could allow a contribution towards employment development being made elsewhere; or
• D) The site or buildings would be physically unsuitable for re-use for Classes B1-B8 or similar use, even after adaptation (such as sub-division into smaller units), refurbishment or redevelopment, in terms of siting, design, access, layout and relationship to neighbouring buildings and uses.
7.18 The supporting text should state that, where an application is made under clause (C) the applicant should include as a minimum requirement:
• The length of time the property has been unused for employment purposes;
SMELS 2 FINAL 23 09 08 62
Final Report
• The length of period during which it has been actively marketed for such purposes which should include the possibility of redevelopment and should provide evidence of this marketing (not normally less than 12 months). The evidence should show where the property has been marketed including publications and a wide circulation such as property journals;
• The prices at which the land and buildings have been marketed during this period which should reflect that obtained for similar property in the locality;
• A list of all expressions of interest during this period; and,
• An evaluation of why it is considered that the property has failed to attract interest from potential occupiers or for redevelopment for B Class use.
2. Diversity of Business Use 7.19 Promoting economic diversity in Staffordshire Moorlands is important so the District develops an
economic base which is robust and responds to modern working practices and its needs.
7.20 Over the longer term the predicted slowdown of manufacturing activities in the District needs to be countered by growth in other sectors including the service sector which is currently underrepresented. A pro-active and supportive stance needs to be taken in policy terms towards encouraging knowledge based and creative sectors. Diversification of premises in rural areas also has the potential to diversify the District’s economic base, coupled with the potential benefit of increasing visitor numbers.
3. Rural Enterprise 7.21 Growth of jobs in rural areas can benefit rural communities if appropriately handled and controlled.
It also has the potential to encourage flexible working patterns and the need to travel if managed correctly. However, growth of employment in rural areas can also bring negative problems if managed unsuccessfully. Transport implications of proposed development in the countryside should therefore be a key consideration.
7.22 The policy review (Section 2) highlighted the requirement PPS7 places on rural local authorities to promote and enable economic development in different locations. This is reinforced by the emerging guidance provided in Draft PPS4. Based on the principal of promoting economic development in rural areas, we consider that the following factors should be used to define the criteria in rural areas of the Staffordshire Moorlands District. This could be promoted or encouraged through:
• i) A presumption in favour of maximising the use of existing buildings in the countryside. This could include policy measures to ensure proposals for new development in rural areas would have to demonstrate that there are no alternative buildings available within a reasonable catchment area (subject to factors of viability).
• ii) Need for social and or economic investment to help sustain the local economy, including the retention of existing employment. This could be based on an authority assessment of need in rural areas using socio-economic indicators:
- Amount and extent of unemployment / deprivation;
- Patterns of in/out commuting; and
- Economic health of village centres.
Planning policy could identify rural priority areas based on this analysis where rural enterprise is particularly required to meet need (but not to the exclusion of all other areas). Applicants would also be asked to demonstrate the positive socio-economic impact of their development proposals relative to identified priorities.
• iii) Demonstrable social or economic need for proposals to be located in the countryside relative to an urban location (e.g. access to a specific market, raw material or particular labour force).
SMELS 2 FINAL 23 09 08 63

Final Report
• iv) Definition of a size threshold to guide the scale of development (e.g. maximum 200 sq.m). Development or occupation of floorspace in excess of this threshold should be subject to a more rigorous demonstration of need for the particular need.
• v). No adverse impact on the character or environment of the rural area (as defined by the assessment of rural need and priorities). Proposals which provide a net benefit to the environment would be promoted (e.g. reduction in out commuting).
• (vi) Demonstrate that traffic generation from the scheme can be accommodated by the existing or planned local road system. Also ensure that access arrangements are acceptable for the scale and type of development.
• (vii) Safeguard the employment function of the development from other uses through planning conditions/planning gain mechanisms.
4. Design Guidance for Re-use of Agricultural Buildings 7.23 Design guidance for conversion of former agricultural buildings could be produced to ensure
conversions are brought forward in a sensitive way which respects the integrity and historic fabric and architectural heritage and also ensure the use of buildings that retain an element of employment use. Such guidance could be prepared to cover:
• Local building vernaculars and local styles;
• Access and circulation around buildings
• Design considerations regarding the use of contemporary architecture and traditional styles;
• Wider amenity issues;
• Energy, waste and water efficiency and other sustainable design considerations.
5. Re-use of Manufacturing and Mill Buildings 7.24 The difficulties associated with bring forward older buildings including mills has been identified as
an issue in the District.
7.25 Some older mill buildings and other premises used for past heavy manufacturing activities are often attractive in terms of their appearance and their history. However, certain aspects of the sort of buildings can be problematic in terms of their suitability for B class use.
• Low floor to ceiling heights often characterise these buildings and can be problematic in so far that they do not meet the needs of modern businesses (especially IT needs which demand artificial floors and ceilings).
• Older buildings which have been underused or moth balled for long periods of time are often in a poor physical state of repair which adds significant costs associated with bringing them back into use.
• Contamination from previous manufacturing activates can also present additional remediation costs.
• Planning and heritage constraints including listed buildings, Conservation Areas and environmental designations can present significant issues in redevelopment terms. They can preclude alterations being made to the premises necessary for re-use.
7.26 In some cases where land values associated with B class employment are not sufficient to raise sufficient monies to bring forward these sites without being subsidised, consideration should be given to bringing these sites forward on a mixed use basis with an element of residential to raise values. However, in policy terms there should be sufficient weight to ensure any enabling development used to bring forward employment sites does not result in an overall loss of B class floorspace.
SMELS 2 FINAL 23 09 08 64
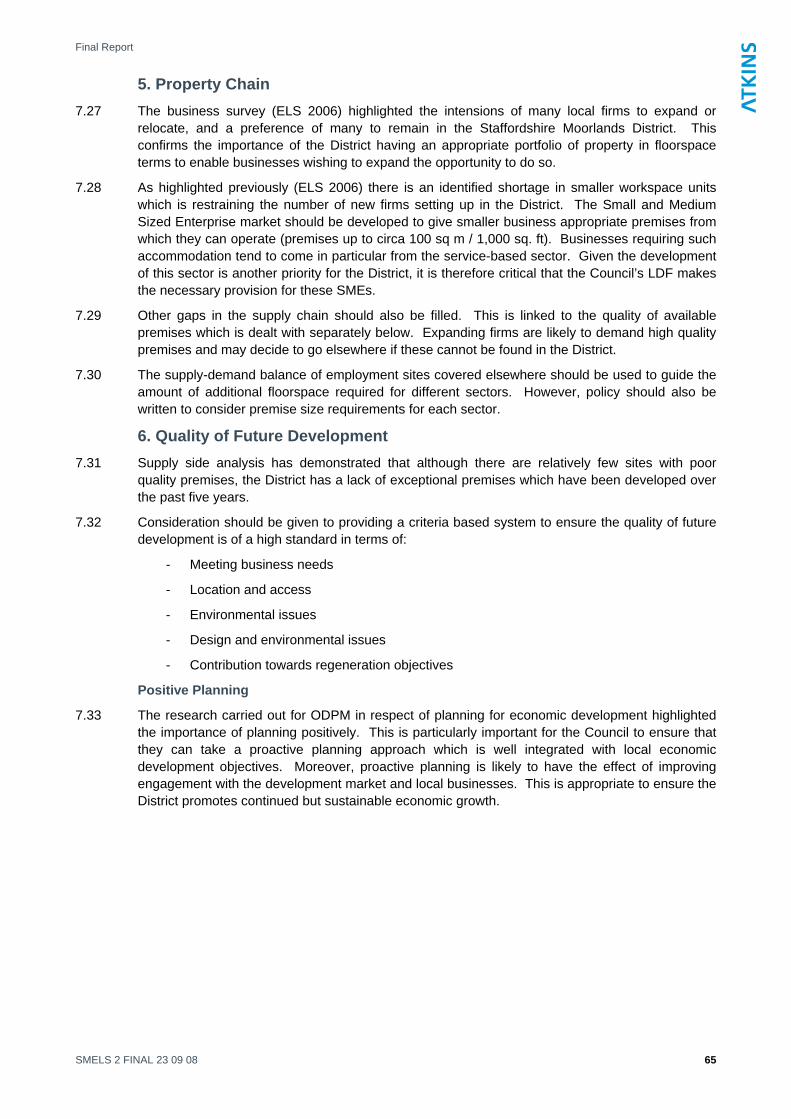
Final Report
5. Property Chain 7.27 The business survey (ELS 2006) highlighted the intensions of many local firms to expand or
relocate, and a preference of many to remain in the Staffordshire Moorlands District. This confirms the importance of the District having an appropriate portfolio of property in floorspace terms to enable businesses wishing to expand the opportunity to do so.
7.28 As highlighted previously (ELS 2006) there is an identified shortage in smaller workspace units which is restraining the number of new firms setting up in the District. The Small and Medium Sized Enterprise market should be developed to give smaller business appropriate premises from which they can operate (premises up to circa 100 sq m / 1,000 sq. ft). Businesses requiring such accommodation tend to come in particular from the service-based sector. Given the development of this sector is another priority for the District, it is therefore critical that the Council’s LDF makes the necessary provision for these SMEs.
7.29 Other gaps in the supply chain should also be filled. This is linked to the quality of available premises which is dealt with separately below. Expanding firms are likely to demand high quality premises and may decide to go elsewhere if these cannot be found in the District.
7.30 The supply-demand balance of employment sites covered elsewhere should be used to guide the amount of additional floorspace required for different sectors. However, policy should also be written to consider premise size requirements for each sector.
6. Quality of Future Development 7.31 Supply side analysis has demonstrated that although there are relatively few sites with poor
quality premises, the District has a lack of exceptional premises which have been developed over the past five years.
7.32 Consideration should be given to providing a criteria based system to ensure the quality of future development is of a high standard in terms of:
- Meeting business needs
- Location and access
- Environmental issues
- Design and environmental issues
- Contribution towards regeneration objectives
Positive Planning
7.33 The research carried out for ODPM in respect of planning for economic development highlighted the importance of planning positively. This is particularly important for the Council to ensure that they can take a proactive planning approach which is well integrated with local economic development objectives. Moreover, proactive planning is likely to have the effect of improving engagement with the development market and local businesses. This is appropriate to ensure the District promotes continued but sustainable economic growth.
SMELS 2 FINAL 23 09 08 65

Final Report
SMELS 2 FINAL 23 09 08 66

Final Report
Appendix A – Site Specific Information
A1 Site Location Plan
A2-A37 Figures of Updated and New Sites
SMELS 2 FINAL 23 09 08 67

Final Report
SMELS 2 FINAL 23 09 08 68
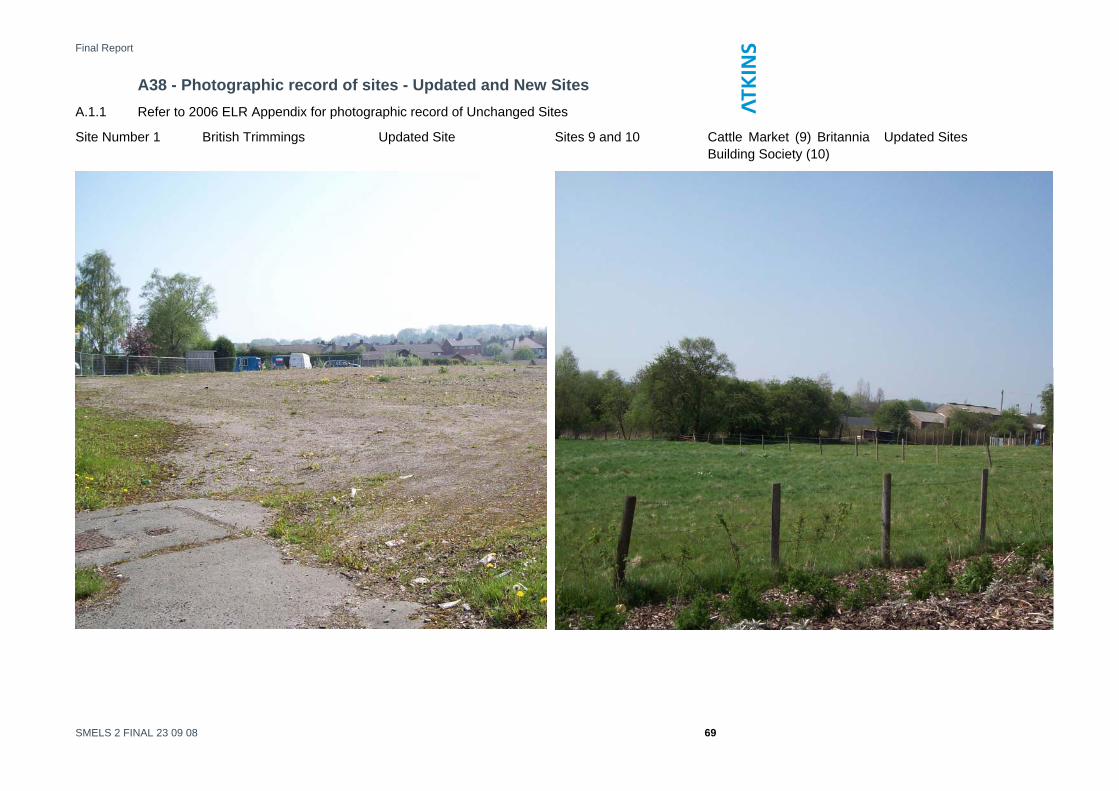
Final Report
A38 - Photographic record of sites - Updated and New Sites A.1.1 Refer to 2006 ELR Appendix for photographic record of Unchanged Sites
Site Number 1 British Trimmings Updated Site Sites 9 and 10 Cattle Market (9) Britannia Building Society (10)
Updated Sites
SMELS 2 FINAL 23 09 08 69

Final Report
Site Number 16 John Pointons Site Updated Site Site Number 19 New Haden / Brookhouses Updated Site
SMELS 2 FINAL 23 09 08 70

Final Report
Site Number 23 (RIS) Blythe Bridge Updated Site Site Number 24 Victoria Business Park Updated Site
SMELS 2 FINAL 23 09 08 71

Final Report
Site Number 25 Wharf Road Updated Site Site Number 26 Former Council Depot Updated Site
SMELS 2 FINAL 23 09 08 72

Final Report
Site Number 27 Walley Street Updated Site Site Number 30 Bolton Copper Works Updated Site
SMELS 2 FINAL 23 09 08 73

Final Report
Site Number 31 Far Lane Industrial Updated Site Site Number 32 Waterhouses Enterprise Centre
Updated Site
SMELS 2 FINAL 23 09 08 74

Final Report
Site Number 40 Middle Hulme Farm New Site Site Number 41 Anzio Camp New Site
SMELS 2 FINAL 23 09 08 75
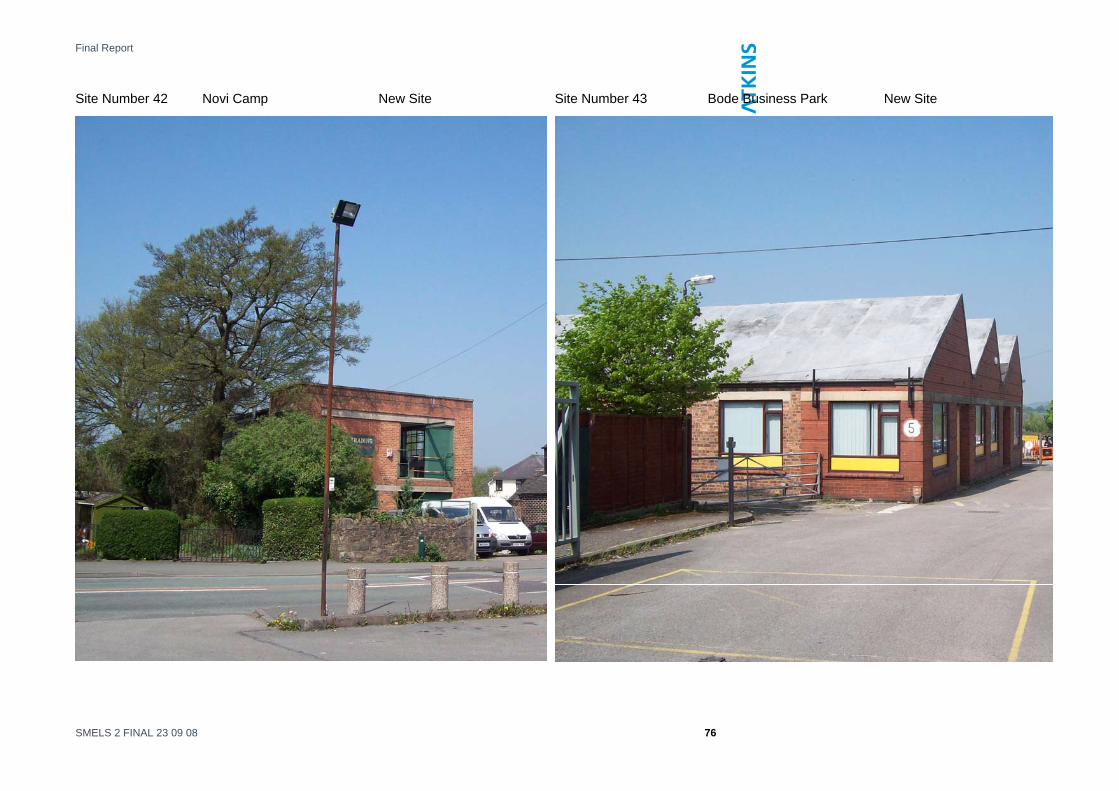
Final Report
Site Number 42 Novi Camp New Site Site Number 43 Bode Business Park New Site
SMELS 2 FINAL 23 09 08 76

Final Report
Site Number 44 Marling Mills New Site Site Number 45 Adderley Mill New Site
SMELS 2 FINAL 23 09 08 77

Final Report
SMELS 2 FINAL 23 09 08 78
Site Number 46 Adams Food Updated Site

Final Report
Appendix B - Site Supply Findings B.1 Quantitative Findings Update
Site Numb
er
Site Name Sub Area Total Employment Land within boundary
(Ha)
vacant land (Ha)
opportunity land
(Ha)
vacant premises
(m²)
Overall Suitability Score
Allocated Employment Sites in the Local Plan
24 Victoria Business Park Biddulph 9.6 5.9 0.0 486.1 93.0 9 Cattle Market Leek 5.5 0.0 5.4 0.0 70.0
25 Wharf Road Biddulph 6.0 4.3 1.7 0.0 64.0 31 Far Lane Industrial Estate Outside larger
settlements 0.9 0.0 0.4 200.0 64.0
32 Waterhouses Enterprise Centre Outside larger settlements
1.7 0.0 1.3 0.0 62.0
19 New Haden/Brookhouses Cheadle 36.7 1.7 15.3 0.0 58.0 6 Whites Bridge Leek 9.9 0.0 9.9 0.0 57.0
20 Mobberley Cheadle 1.6 0.0 1.6 0.0 55.0 30 Bolton Copper Works Outside larger
settlements 16.0 2.9 1.1 0.0 53.0
Sub- Total 87.8 14.8 36.5 686.1 Established Employment Sites (not allocated)
8 Barnfields Industrial Estate Leek 23.6 3.7 0.0 2,169.7 99.0 46 Adams food Leek 1.9 0.00 0.00 0.0 90.0 3 Springfield Road Leek 0.6 0.2 0.0 0.0 88.0
37 Leekbrook Industrial Estate Leek 3.3 0.2 0.0 557.2 83.0 36 Lymers Depot Outside larger
settlements 0.4 0.0 0.0 0.0 82.0
1 British Trimmings Leek 1.2 1.2 0.0 0.0 81.0 11 Town Yard Industrial Estate Leek 1.0 0.0 0.5 0.0 81.0
SMELS 2 FINAL 23 09 08 79

Final Report
Site Numb
er
Site Name Sub Area Total Employment Land within boundary
(Ha)
vacant land (Ha)
opportunity land
(Ha)
vacant Overall Suitability premises Score
(m²)
22 Bridge Villa Outside larger settlements
0.3 0.0 0.0 0.0 78.0
13 Part of Former Joshua Wardle Leek 2.2 2.2 0.0 0.0 78.0 43 Bode Business Park Leek 2.0 0.00 0.00 0.0 78.0 44 Marling Mills Leek 1.5 0.00 0.00 0.0 78.0 39 Power Wash Indus. Estate & Brown
Lees Indus. Est. Biddulph 7.6 0.0 0.8 0.0 76.0
14 Churnetside Business Park Leek 13.4 0.9 0.0 2,070.3 74.0 27 Walley Street Biddulph 0.8 0.0 0.8 875.6 73.0 5 Mills on Brook Street Leek 2.0 0.0 0.0 1,332.6 72.0 4 Macclesfield Road Leek 11.5 3.4 0.0 0.0 72.0
12 Brooklands Way Leek 16.6 0.0 7.8 0.0 69.0 28 Uplands Mill Biddulph 4.3 0.0 0.0 0.0 65.0 33 Blithe works, Sandon Road Outside larger
settlements 13.6 0.0 4.1 0.0 64.0
38 Co-op Milk Plant Outside larger settlements
2.0 0.0 0.0 0.0 62.0
16 John Pointons Site Outside larger settlements
6.5 0.0 1.4 0.0 57.0
17 JCB, Leek Road Cheadle 20.5 0.0 7.7 0.0 56.0 18 JCB, Oakmoor Road Cheadle 1.4 0.0 0.0 0.0 56.0 10 Britannia Building Society Leek 8.3 0.0 1.4 0.0 50.0 34 Dilhorne Road and The Green Cheadle 1.3 0.3 0.0 0.0 49.0
Sub-Total 147.9 12.1 24.5 7,005.3 Additional Employment Land Sites
26 Former Council Depot Biddulph 0.2 0.2 0.0 0.0 86.0 35 Queen Street Leek 0.4 0.1 0.0 3,227 80.0 41 Anzio Camp Outside larger
settlements 9.5 0 9.5 0.0 71.0
40 Middle Hulme Farm Outside larger settlements
0.42 0.00 0.42 0.0 63.0
42 Novi Lane Leek 0.4 0.00 0.4 0.0 62.0 15 Beresford/PMT Depot Outside larger 1.9 0.6 1.3 0.0 60.0
SMELS 2 FINAL 23 09 08 80

Final Report
Site Numb
er
Site Name Sub Area Total Employment Land within boundary
(Ha)
vacant land (Ha)
opportunity land
(Ha)
vacant Overall Suitability premises Score
(m²)
settlements 2 Fowlchurch Tip Leek 14.4 0.0 14.4 0.0 45.0
29 Gillow Heath Sewage Works Biddulph 7.7 0.0 4.8 0.0 41.0 45 Adderley Mill Outside larger
settlements 0.7 0.00 0.4 1,413.1 36.0
Sub Total 35.6 0.9 31.2 4,640.5 Overall Total* 271.4 27.8 92.4 12,332.0
*Excludes Regional Investment Site 23 at Blythe Bridge
SMELS 2 FINAL 23 09 08 81

Final Report
SMELS 2 FINAL 23 09 08 82

Final Report
B.2 Accessibility
Site ID
Site Name Location Public Transport and Access
Access to Strategic Road Network
Freight Access
1 British Trimmings
On Ball Haye Road - A Central Buxton site. There was no congestion observed. Have to go up a hill to get to the site. The site is within walking distance from Leek Town Centre.
No congestion. No public transport observed.
The site is accessed off a secondary road.
No.
2 Fowlchurch Tip
North of Leek settlement boundary. No public transport. Restricted Access. No HGV Access.
Poor. Access to the site is a key constraint.
No.
3 Springfield Road
On Springfield Road connecting to A53 Buxton Road and A523 Ashbourne Road. Good accessibility.
Public bus serves Springfield Road and High School located opposite.
Good strategic access. Site access limited by shared access with a single carriageway.
No.
4 Macclesfield Road
Located at urban fringe on Macclesfield Road. The River Churnet cuts across the site from East to West. Main Access via Abbey Green Road Bridge - this is a possible constraint of the site.
Public bus services along Macclesfield Road.
Access issue. A new bridge is required but Environment Agency said 'no' due to flooding issue. A523 Macclesfield Road.
No.
5 Mills on Brook Street
Highly accessible. Located in centre of Leek on Brook Street. Double-yellow lines restrict car parking at the site. Road traffic is heavy in the centre of Leek. Traffic lights manage traffic flow on main roads, whereas narrow roads are used as rat-runs.
Bus travel and main road to building frontage.
Directly onto the A-road network.
No.
6 Whites Bridge
Situated on the West side of Leek on the Macclesfield Road with good accessibility.
The site is served by public transport.
The site is linked to the strategic network by the A523.
No.
SMELS 2 FINAL 23 09 08 83

Final Report
Site ID
Site Name Location Public Transport and Access
Access to Strategic Freight Access Road Network
8 Barnfields Industrial Estate
Accessible site to south west of Leek. Sunnyhills Road and Barnfields Road.
Accessibility is good from A53 Newcastle Road linking to Stoke-on-Trent.
A53 Newcastle Road linking Leek to Stoke.
Possible road haulage but no rail access.
9 Cattle Market
Located off a minor road - Junction Road which connects to the A53.
Reasonable access No direct linkage. A53 is the main road. The site has reasonable access from Junction Road. HGV trucks gain entry to the site to transport livestock. Access is reasonable.
No.
10 Britannia Building Society
On A520 Cheddleton Road to the south of Leek linking to Leekbrook.
Bus service stops at the site.
To A520 - a reasonably accessible site.
No.
11 Town Yard Tight on road structure - Accessible from Station Road. Within a built up area.
No public transport and restrictive access.
No. No.
12 Brooklands Way
South of Leek in small settlement Leekbrook. Dedicated employment land use area. Intensification possible.
Public transport was not observed.
Brooklands Way is a minor access road that links to the A520 Cheddleton Road to Leek.
None.
13 Part of Former Joshua Wardle
14 Churnetside Business Park
Towards Mere, after Leekbrook in Cheddleton, rural settlement.
No public transport observed.
Busy road - Cheadle road A520 connecting to the M50. (9 miles from the A50).
No.
15 Beresford/PMT Depot
Cheddleton with main road A520 frontage.
No public bus stops observed.
A520 - frontage No.
SMELS 2 FINAL 23 09 08 84

Final Report
Site ID
Site Name Location Public Transport and Access
Access to Strategic Freight Access Road Network
16 John Pointons Site
Area out in open countryside off Felthouse Lane which connects to A520.
No public transport Link to A520. HGVs do access the site off Felthouse Lane, but it may be difficult to convince a new potential occupier that the access is on.
17 JCB, Leek Road
Situated off Leek Road (A52) between Cheddleton and Cheadle.
Not observed. Access directly to the A52. Alton Towers traffic causes congestion.
None.
18 JCB, Oakamoor Road
The premises are located on Oakamoor Road, a narrow road in a residential area in central Cheadle.
No public transport observed.
Oakamoor Road (B5417) connects to (A521) Tape Street and A52 road.
None.
19 New Haden/Brookhouses
The employment land straddles Brookhouses Road at the Draycott Road Area.
None observed. Brookhouses Road is a minor road that links to the A521 in Cheadle. Narrow and restricted access to this site.
No.
20 Mobberley Very remote, located on the Tean Road.
None observed. On A522 at the back of nowhere.
None.
22 Bridge Villa This site is located on Draycott Road in Upper Tean.
No public transport observed.
Draycott Road links to the A522 High Street in Upper Tean and to be A521 that links to the A50 at Blythe Bridge.
No.
23 (RIS) Blythe Bridge
Very accessible with link to A50. None observed. Highly accessible site. No.
24 Victoria Business Park
Victoria Business Park is situated on the A527 Tunstall Road approximately 1.5 miles (2.3km) from the centre of Biddulph and
Bus services evident on Tunstall Road.
Serviced development plots - access from A527 and Brown Lees.
No.
SMELS 2 FINAL 23 09 08 85

Final Report
Site ID
Site Name Location Public Transport and Access
Access to Strategic Freight Access Road Network
approximately 4 miles from Junction 16 of the M6 Motorway.
25 Wharf Road The site is located to the west of the High Street in Biddulph.
A coach depot was observed on the east part of the site and a hardware/DIY retailed named 'Options'.
Site is adjacent to the A257.
No potential.
26 Former Council Depot
Located to west of Biddulph to west of district. The site is within the settlement boundary but adjacent to open countryside to the west.
Not observed. A527 Colliers Way links to Congleton and Stoke-on-Trent and M6 Motorway network.
No potential.
27 Walley Street
A central location in Biddulph town centre off Congleton Road (A527).
Buses were observed on Congleton Road.
The A527. No potential.
28 Uplands Mill The site is on the northern edge of Biddulph.
None evident. Approximately 500m from A527, which is accessed via residential roads.
No potential.
29 Gillow Heath Sewage Works
On settlement fringe, remote from strategic road network in Biddulph. Biddulph is the second largest town at the north west boundary of the District.
Public transport was not evident.
Biddulph is situated on the A527, close to the M6 motorway.
No potential.
30 Bolton Copper Works Car Park
Froghall is situated within a cluster of small settlements within an area of special landscape area within a rural and central part of the district. North of the village of Kingsley. North and East of River Churnet and Churnet Valley tourist railway.
Bus stop located on A52 outside of the site. A track runs through the site and was observed to be used by dog walkers.
A52 serves the site at junction of the B5053.
Potential from railway, although used for tourist attraction.
31 Far Lane Industrial
On the edge of Ipstones to the south of the settlement. Ipstones is a small village situated centrally
No public transport was observed. Access off the B5053
Site located on B5053 (Froghall Road).
No potential.
SMELS 2 FINAL 23 09 08 86

Final Report
Site ID
Site Name Location Public Transport and Access
Access to Strategic Freight Access Road Network
within the district. It is within a Special Landscape Area.
a relatively remote location.
32 Waterhouses Enterprise Centre
South west edge of Waterhouses. Waterhouses is a small settlement in a rural and central part of the district.
None observed. The site is located on and accessed from the A523.
No potential.
33 Blithe works, Sandon Road
In proximity to the A50 connecting Stoke on Trent and Uttoxeter.
Good. None.
34 Dilhorne Road and The Green
On a site surrounded by residential and open country side. Poor access.
No. Limited access. Poor access. No.
35 Queen Street
Off A53 Buxton Road. Pubic transport on Buxton Road.
Fair. However roads around the Mill are densely packed terraced housing. Causes congestion.
No.
36 Lymers Depot
Located in the centre of Upper Tean, a dormitory town to the south of District. Accessed by St Thomas Road, a narrow lane.
The High Street is served by public transport.
Link to the A522 No.
37 Leekbrook Industrial Estate
Situated 1.5 miles from Leek in Leekbrook on A520. The railway bridge is not a constraint to HGV access.
Public transport was observed.
Access to A520 No.
38 Co-op Milk Plant
The dairy is located on Uttoxeter Road in Fole near Checkley. It is relatively remote on the A522.
None observed. The A522 runs parallel and connects to the A50.
No
39 Power Nash Indus. Estate & Brown Lees
South of Biddulph on Tunstall Road A527.
Yes. Good accessibility.
Good linkage to strategic road network via A527.
None.
SMELS 2 FINAL 23 09 08 87

Final Report
Site ID
Site Name Location Public Transport and Access
Access to Strategic Freight Access Road Network
Indus. Est.
40 Middle Hulme Farm
North of Leek on the edge of the Peak Park. East of the village of Meerbrook.
Assumed to be none. Along minor road towards A53 to the east.
None.
41 Anzio Camp To the east of the A53 heading away from Leak towards the Peak park
May be some kind of bus service
Straight access onto A53
Off A53 - potential but internal configuration of site not designed with HGVs in mind.
42 Novi Lane Located on Novi Lane, just to the west of the A53
Residential area so likely to be some service
Two minute drive from the A53
Not appropriate as too small
43 Bode Business Park
To the north east of Leek town centre to the north of Ball Haye Green
Services likely along Ball Haye Green
Close to A53 and Leek town centre routes
Yes, HGV access to this site
44 Marling Mills
To the north east of Leek town centre to the north of Ball Haye Green off Nelson St, a residential cul-de-sac leading to the site
Services likely along Ball Haye Green
Close to A53 and Leek town centre routes
Yes, HGV access to this site although Nelson Street is narrow and not ideally suited to HGV movements
45 Adderley Mill
Rural location to the north of Brookhouses along Trimpos Road to the west of the lane
None considered likely Through Brookhouses out towards Blythe Bridge and the A50
Not appropriate as access roads are too small
46 Adams food In Leek urban area. Off A523 Buxton Road and then site access off Prince St
Likely to be some as in the urban area
Good access to A523 Yes, HGVs currently use site and is suitable for this use
SMELS 2 FINAL 23 09 08 88

Final Report
B.3 Access, Servicing and Parking Site ID
Site Name Evidence of Parking Difficulties Relating to Employment Use
Access / Servicing Inadequate for Existing Occupiers
Adequacy of Internal Access Servicing and Parking
1 British Trimmings 0 0 None. 2 Fowlchurch Tip 0 0 None. 3 Springfield Road 0 0 None observed. 4 Macclesfield Road 1 0 Not modern standards. Some parking difficulties to those premises
with Macclesfield Road frontage. 5 Mills on Brook Street 0 0 Poor. 6 Whites Bridge 0 0 Not developed, so not applicable. 8 Barnfields Industrial Estate 1 0 Good. HGVs parked the full length of Sunnyhills Road. 9 Cattle Market 0 0 There is hardstanding for car parking on site 10 Britannia Building Society 0 0 Site benefits from a significant number of spaces, although few were
empty at time of site visit 11 Town Yard 0 0 OK. 12 Brooklands Way 0 0 OK. 13 Part of Former Joshua Wardle 0 0 14 Churnetside Business Park 0 0 (Fit for purpose). Average. 15 Beresford/PMT Depot 0 0 A crescent track enables access through one entrance and exit via
another. 16 John Pointons Site 0 0 Appear to be good. 17 JCB, Leek Road 0 0 Good. 18 JCB, Oakamoor Road 0 0 Ok. 19 New Haden/Brookhouses 0 0 Poor. Cars are parked on verges and on roads. There is no clear
layout but a messy arrangement of premises. 20 Mobberley 0 0 None. 22 Bridge Villa 1 0 The internal parking was quite restricted. 23 (RIS) Blythe Bridge 0 0 Not developed yet. 24 Victoria Business Park 0 0 Access Road developed with street lighting. 25 Wharf Road 1 1 Poor quality internal layout means access and servicing difficult. 26 Former Council Depot 0 0 None visible. Site may have electricity/gas/water etc.
SMELS 2 FINAL 23 09 08 89

Final Report
Site ID
Site Name Evidence of Parking Difficulties Relating to Employment Use
Access / Servicing Inadequate for
Adequacy of Internal Access Servicing and Parking
Existing Occupiers
27 Walley Street 0 0 None. 28 Uplands Mill 0 0 Dedicated parking, access and service fine. 29 Gillow Heath Sewage Works 0 0 Fit for purpose. 30 Bolton Copper Works Car Park 0 0 No internal services, although a substation was noted to the north
west corner of the site. 31 Far Lane Industrial 0 0 Appropriate internal layout with sufficient turning areas and some
space for parking. 32 Waterhouses Enterprise
Centre 0 0 The site has sufficient parking access and serving areas.
33 Blithe works, Sandon Road 0 0 OK. 34 Dilhorne Road and The Green 0 0 None. 35 Queen Street 1 1 Practically no parking as it exists. On-street parking which causes
congestion on terraced narrow streets. 36 Lymers Depot 0 0 None. 37 Leekbrook Industrial Estate 0 0 No problems identified. 38 Co-op Milk Plant 0 0 Ok. 39 Power Nash Indus. Estate &
Brown Lees Indus. Est. 0 0 None.
40 Middle Hulme Farm 0 0 None 41 Anzio Camp 0 0 None 42 Novi Lane 0 0 None 43 Bode Business Park 0 0 Appears adequate 44 Marling Mills 0 0 Access not ideally suited to HGVs 45 Adderley Mill 0 0 Adequate for existing use 46 Adams food 0 0 Adequate for existing use Total 5 2
SMELS 2 FINAL 23 09 08 90

Final Report
B.4 Property Developed in Last 5 Years – Update*
Site ID
Site Name
Esta
blis
hed
or
Pote
ntia
l Offi
ce
Loca
tions
Hig
h Q
ualit
y B
usin
ess
Park
s
Res
earc
h &
Te
chno
logy
/ Sci
ence
Pa
rks
War
ehou
se &
D
istr
ibut
ion
Park
s
Gen
eral
Indu
stria
l/ B
usin
ess
Are
as
Hea
vy/ S
peci
alis
t In
dust
rial S
ites
Incu
bato
r/SM
E C
lust
er S
ites
Spec
ialis
t Fre
ight
Te
rmin
als
Site
s fo
r Spe
cific
O
ccup
iers
Rec
yclin
g/
Envi
ronm
enta
l In
dust
ries
Farm
Bas
ed
Empl
oym
ent L
ocat
ion Total
1 British Trimmings 0 0 0 0 0 0 0 0 0 0 0 0
2 Fowlchurch Tip 0 0 0 0 0 0 0 0 0 0 0 0
3 Springfield Road 0 0 0 0 0 0 0 0 0 0 0 0
4 Macclesfield Road 0 0 0 0 0 0 0 0 0 0 0 0
5 Mills on Brook Street 0 0 0 0 0 0 0 0 0 0 0 0
6 Whites Bridge 0 0 0 0 0 0 0 0 0 0 0 0
8 Barnfields Industrial Estate
0 0 0 0 0 0 0 0 0 0 0 0
9 Cattle Market 0 0 0 0 0 0 0 0 0 0 0 0
10 Britannia Building Society
0 50 0 0 0 0 0 0 0 0 0 50
11 Town Yard 0 0 0 0 0 0 0 0 0 0 0 0
12 Brooklands Way 0 0 0 0 0 0 0 0 0 0 0 0
13 Part of Former Joshua Wardle
0 0 0 0 0 0 0 0 0 0 0 0
14 Churnetside Business Park
0 0 0 0 0 0 0 0 0 0 0 0
SMELS 2 FINAL 23 09 08 91

Final Report
Site ID
Site Name
Esta
blis
hed
or
Pote
ntia
l Offi
ce
Loca
tions
Hig
h Q
ualit
y B
usin
ess
Park
s
Res
earc
h &
Te
chno
logy
/ Sci
ence
Pa
rks
War
ehou
se &
D
istr
ibut
ion
Park
s
Gen
eral
Indu
stria
l/ B
usin
ess
Are
as
Hea
vy/ S
peci
alis
t In
dust
rial S
ites
Incu
bato
r/SM
E C
lust
er S
ites
Spec
ialis
t Fre
ight
Te
rmin
als
Site
s fo
r Spe
cific
O
ccup
iers
Rec
yclin
g/
Envi
ronm
enta
l In
dust
ries
Farm
Bas
ed
Total
Empl
oym
ent L
ocat
ion
15 Beresford/PMT Depot
0 0 0 0 0 0 0 0 0 0 0 0
16 John Pointons Site 0 0 0 0 0 0 0 0 20 0 0 20
17 JCB, Leek Road 0 0 0 0 0 0 0 0 100 0 0 100
18 JCB, Oakamoor Road
0 0 0 0 0 0 0 0 0 0 0 0
19 New Haden/Brookhouses
0 0 0 0 0 0 0 0 0 0 0 0
20 Mobberley 0 0 0 0 0 0 0 0 0 0 0 0
22 Bridge Villa 0 0 0 0 0 0 0 0 0 0 0 0
23 (RIS) Blythe Bridge 0 0 0 0 0 0 0 0 0 0 0 0
24 Victoria Business Park
0 100 0 0 0 0 0 0 0 0 0 100
25 Wharf Road 0 0 0 0 0 0 0 0 0 0 0 0
26 Former CounciDepot
l 0 0 0 0 0 0 0 0 0 0 0 0
27 Walley Street 0 0 0 0 0 0 0 0 0 0 0 0
28 Uplands Mill 0 0 0 0 0 0 0 0 0 0 0 0
29 Gillow Heath Sewage Works
0 0 0 0 0 0 0 0 0 0 0 0
SMELS 2 FINAL 23 09 08 92

Final Report
Site ID
Site Name
Esta
blis
hed
or
Pote
ntia
l Offi
ce
Loca
tions
Hig
h Q
ualit
y B
usin
ess
Park
s
Res
earc
h &
Te
chno
logy
/ Sci
ence
Pa
rks
War
ehou
se &
D
istr
ibut
ion
Park
s
Gen
eral
Indu
stria
l/ B
usin
ess
Are
as
Hea
vy/ S
peci
alis
t In
dust
rial S
ites
Incu
bato
r/SM
E C
lust
er S
ites
Spec
ialis
t Fre
ight
Te
rmin
als
Site
s fo
r Spe
cific
O
ccup
iers
Rec
yclin
g/
Envi
ronm
enta
l In
dust
ries
Farm
Bas
ed
Total
Empl
oym
ent L
ocat
ion
30 Bolton Copper Works Car Park
0 0 0 0 0 0 0 0 0 0 0 0
31 Far Lane Industrial 0 0 0 0 0 0 0 0 0 0 0 0
32 Waterhouses Enterprise Centre
0 0 0 0 0 0 0 0 0 0 0 0
33 Blithe works, Sandon Road
0 0 0 0 0 0 0 0 0 0 0 0
34 Dilhorne Road and The Green
0 0 0 0 0 0 0 0 0 0 0 0
35 Queen Street 0 0 0 0 0 0 0 0 0 0 0 0
36 Lymers Depot 0 0 0 0 0 0 0 0 0 0 0 0
37 Leekbrook Industrial Estate
0 0 0 0 0 0 0 0 0 0 0 0
38 Co-op Milk Plant 0 0 0 0 0 0 0 0 0 0 0 0
39 Power Nash Indus. Estate & Brown Lees Indus. Est.
0 0 0 0 0 0 0 0 0 0 0 0
40 Middle Hulme Farm 0 0 0 0 0 0 0 0 0 0 0 0
41 Anzio Camp 0 0 0 0 0 0 0 0 0 0 0 0
42 Novi Lane 0 0 0 0 0 0 0 0 0 0 0 0
43 Bode Business Park 0 0 0 0 0 0 0 0 0 0 0 0
SMELS 2 FINAL 23 09 08 93

Final Report
Site ID
Site Name
Esta
blis
hed
or
Pote
ntia
l Offi
ce
Loca
tions
Hig
h Q
ualit
y B
usin
ess
Park
s
Res
earc
h &
Te
chno
logy
/ Sci
ence
Pa
rks
War
ehou
se &
D
istr
ibut
ion
Park
s
Gen
eral
Indu
stria
l/ B
usin
ess
Are
as
Hea
vy/ S
peci
alis
t In
dust
rial S
ites
Incu
bato
r/SM
E C
lust
er S
ites
Spec
ialis
t Fre
ight
Te
rmin
als
Site
s fo
r Spe
cific
O
ccup
iers
Rec
yclin
g/
Envi
ronm
enta
l In
dust
ries
Farm
Bas
ed
Total
Empl
oym
ent L
ocat
ion
44 Marling Mills 0 0 0 0 0 0 0 0 0 0 0 0
45 Adderley Mill 0 0 0 0 0 0 0 0 0 0 0 0
46 Adams food 0 0 0 0 0 0 0 0 0 0 0 0
*Figures given relate to percentage of property developed over last 5 years estimated based on a brief visual assessment at each site
SMELS 2 FINAL 23 09 08 94

Final Report
B.5 Environmental Factors
Site ID Site Name Quality of Site Environment, Image and Attractiveness Provision of Amenities / Facilities
1 British Trimmings Reasonable quality environment with distant views. Could be attractive to potential larger developer
None.
2 Fowlchurch Tip On rural/urban fringe. Good views. None.
3 Springfield Road Good frontage. None.
4 Macclesfield Road Prominent location in Leek. In total a large scale site, but broken into smaller premises.
Some signage but this is piecemeal. No catering. There are a couple of local pubs that serve lunchtime food.
5 Mills on Brook Street The Mill is a heritage building. The Mill building appears to have architectural heritage value.
Proximity to town centre catering. None observed.
6 Whites Bridge This site has a frontage on Macclesfield Road - a main commuter route from Macclesfield and South Cheshire.
There is a shell garage and a couple of pubs in proximity to the site.
8 Barnfields Industrial Estate
Large site with various employment uses. Cement works could be rationalised/intensified.
Catering vans noticed. Signage on entering the site. Most premises have individual access points.
9
Cattle Market
Large urban/rural fringe site used as cattle market adjacent to existing Industrial Estate. May afford reasonable extension to Barnfields Industrial Estate or afford a mixed use development with residential located to the rear of the site.
None. A pub is located at the entrance to the site.
10 Britannia Building Society
High quality head office/business park with pond and soft landscaping. Views of the surrounding countryside
Signage at entrance to the sites. Catering assumed to be available on site.
11 Town Yard
Popular. Built between 5-10 year period. Simple. All business units have own front door with central access and car parking and security fencing at perimeter.
None observed. Walking distance to Morrisons Supermarket and Leek Town Centre.
12 Brooklands Way
This is an attractive site for smaller businesses that are non-complementary with residential. The rentals are relatively low cost.
A catering van is operating on the industrial estate.
SMELS 2 FINAL 23 09 08 95

Final Report
Site ID Site Name Quality of Site Environment, Image and Attractiveness Provision of Amenities / Facilities
13 Part of Former Joshua Wardle
This is a rural location adjacent to Leekbrook Industrial Estate. Views of Staffordshire Moorlands.
Catering available at Leekbrook Industrial Estate and Brooklands Way.
14 Churnetside Business Park
Canal and river frontages. Adjacent to open countryside. No.
15 Beresford/PMT Depot
Surrounding open countryside. Main road frontage. None.
16 John Pointons Site Views of Staffordshire Moorlands. No.
17 JCB, Leek Road Attractive site with owner occupation. JCB developed this site for own purpose.
18 JCB, Oakamoor Road
In terms of JCB the site occupier, the whole site is covered by the building footprint with a small amount of parking and service routing.
None observed.
19 New Haden/Brookhouses
The employment land is arranged in a haphazard and somewhat messy manner.
Catering vans and signage was observed.
20 Mobberley The local agent believes this site to be unattractive to developers and business interests.
None. Although the Crown Public House is situated on the site facing.
22 Bridge Villa Fully occupied and constrained by layout of units. None observed.
23 (RIS) Blythe Bridge A very prominent and accessible site. Not developed yet.
24 Victoria Business Park
Immediately available serviced development plots in attractive location within Staffordshire Moorlands. All main services are provided to the site.
All main services.
25
Wharf Road
Not a high quality business location, appears to serve the needs of the existing user, however the site may have problems attracting new occupiers. However, scope for improvements due to the new relief road and better access which has resulted.
None on site.
26 Former Council Depot
Area of new housing at the edge of Biddulph. Main access A527. Employment uses on site previously and exist on telephone exchange on adjacent land.
None.
SMELS 2 FINAL 23 09 08 96

Final Report
Site ID Site Name Quality of Site Environment, Image and Attractiveness Provision of Amenities / Facilities
27 Walley Street Town centre town. Good location. Access issues. Town centre serves the site.
28
Uplands Mill
Site is well maintained secure single occupier site. Buildings are in good condition. Site is of sufficiently good quality to attract another large manufacturer should the site become vacant.
No amenities on site.
29 Gillow Heath Sewage Works
Semi-rural settlement with access of Marsh Green Road a narrow country lane. A water course is situated to the east of the site - Biddulph Brook.
Fit for purpose.
30
Bolton Copper Works Car Park
The site is in an attractive semi-rural setting adjacent to the Churnet river and Churnet Valley Railway. The Bolton Copper Works dominates the land to the north and is currently the subject of a Planning Application for a mixed use development.
None.
31
Far Lane Industrial
Well maintained purpose built industrial site, secure site entrance. Some landscaping and signage at entrance would attract small general industrial occupier that doesn't require an urban location.
None on site or nearby.
32
Waterhouses Enterprise Centre
Purpose built industrial estate, well located in terms of Strategic Road network some landscaping at entrance to site and premises in good condition. Site entrance sign with occupiers and units identified. Would attract small light industrial occupiers.
No amenities on site, site sign at entrance identifying units and occupiers.
33 Blithe works, Sandon Road
This is an attractive employment location. May be considered relatively remote. White van man location. Can see the site from A50.
Catering and signage were observed.
34 Dilhorne Road and The Green
Open countryside. None.
35 Queen Street This is predominantly a residential area and no longer suitable for modern day employment requirements.
None.
36 Lymers Depot Central village site. None.
SMELS 2 FINAL 23 09 08 97
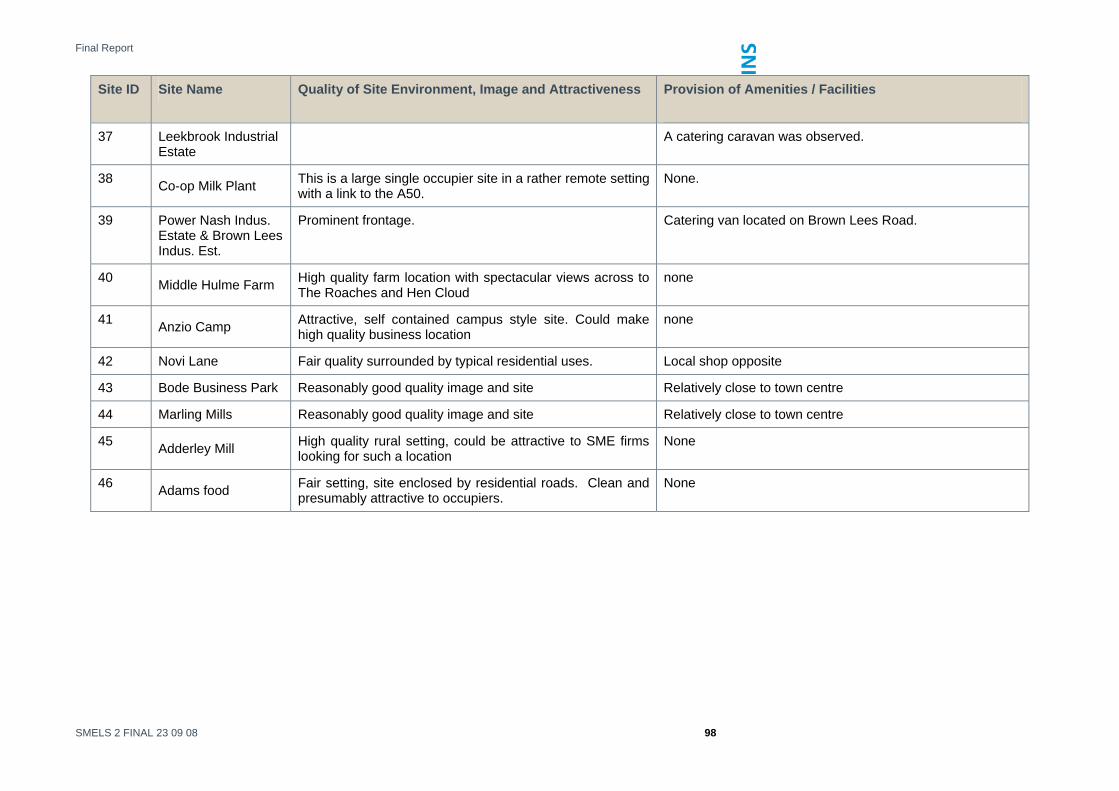
Final Report
SMELS 2 FINAL 23 09 08 98
Site ID Site Name Quality of Site Environment, Image and Attractiveness Provision of Amenities / Facilities
37 Leekbrook Industrial Estate
A catering caravan was observed.
38 Co-op Milk Plant This is a large single occupier site in a rather remote setting with a link to the A50.
None.
39 Power Nash Indus. Estate & Brown Lees Indus. Est.
Prominent frontage. Catering van located on Brown Lees Road.
40 Middle Hulme Farm High quality farm location with spectacular views across to The Roaches and Hen Cloud
none
41 Anzio Camp Attractive, self contained campus style site. Could make high quality business location
none
42 Novi Lane Fair quality surrounded by typical residential uses. Local shop opposite
43 Bode Business Park Reasonably good quality image and site Relatively close to town centre
44 Marling Mills Reasonably good quality image and site Relatively close to town centre
45 Adderley Mill High quality rural setting, could be attractive to SME firms looking for such a location
None
46 Adams food Fair setting, site enclosed by residential roads. Clean and presumably attractive to occupiers.
None

Final Report
B.6 Development Constraints
Site ID Site Name Potential to Support 24 hour Working
Introduction of non-B Class Uses may Compromise the Effective Operation of the Site
Existing Operations Incompatible with Sensitive Neighbouring Land Uses
Description of other Development Constraints and Environmental Problems
1 British Trimmings
0 0 0 There is a brook to the south of the site. Contamination is likely from earlier manufacturing processes. The site has significant changes in topography throughout.
2 Fowlchurch Tip 1 0 0 Graded site. Contamination issues relating to disused tip.
3 Springfield Road 1 0 0 Access to back of site. Existing site and premises layout. [Possible 24 hour operation already. Access signed as 24 hour].
4 Macclesfield Road
1 1 1 River Churnet causes a flood risk. The bridges collect debris and cause the water to back up. There were plans for a White Bridge Industrial Estate but the Environment Agency said no due to the flood risk. Possible contamination from dying factories.
5 Mills on Brook Street
0 0 0 Currently, the Mill occupies 90% of site. Difficult for modern requirements. Building touches neighbouring premises.
6 Whites Bridge 1 0 0 This site may be politically contentious due to existence of Hockey Club. Possible flooding constraints.
8 Barnfields Industrial Estate
1 1 0 Fully occupied
9 Cattle Market 1 1 0 Edge of urban area. Environmental constraints to the west of the site's car park.
10 Britannia Building Society
0 1 0 Edge of urban area. Environmental constraints to the west of the site's car park.
11 Town Yard 0 0 0 The site is densely built. No potential to intensify unless further land to south west is acquired. Site has site level changes.
SMELS 2 FINAL 23 09 08 99

Final Report
Site ID Site Name Potential to Support 24 hour Working
Introduction of non-B Class Uses may Compromise the Effective Operation of
Existing Description of other Development Constraints and Environmental
the Site
Operations Problems Incompatible with Sensitive Neighbouring Land Uses
12 Brooklands Way 1 0 0 A water course runs through the site and this may present a flooding issue.
13 Part of Former Joshua Wardle
0 0 0 There are major ground conditions associated with the previous use. There is a pond and shifting sand bed.
14 Churnetside Business Park
1 0 0 Rail bridge limits HGV access to the east.
15 Beresford/PMT Depot
1 0 0
16 John Pointons Site
1 0 0 Contamination is possible from rendering use.
17 JCB, Leek Road 1 1 0 None.
18 JCB, Oakamoor Road
0 0 0 None.
19 New Haden/Brookhouses
1 0 0 The area is not very accessible.
20 Mobberley 1 0 0 Land level variance, former concrete use may require remediation.
22 Bridge Villa 0 0 0 None observed.
23 (RIS) Blythe Bridge
1 1 0 Land levels.
24 Victoria Business Park
0 0 0 None.
25 Wharf Road 0 1 0 Number of ownerships and leases may represent a constraint.
SMELS 2 FINAL 23 09 08 100

Final Report
Site ID Site Name Potential to Support 24 hour Working
Introduction of non-B Class Uses may Compromise the Effective Operation of
Existing Description of other Development Constraints and Environmental
the Site
Operations Problems Incompatible with Sensitive Neighbouring Land Uses
26 Former Council Depot
0 0 0 Some fly-tipping evident.
27 Walley Street 0 0 0 Multiple ownerships likely. Transport/Access may constrain.
28 Uplands Mill 0 0 0 Topography of land to the west would mean expansion to this side difficult.
29 Gillow Heath Sewage Works
0 0 0 Sewage Works Infrastructure is on the site and in active use.
30 Bolton Copper Works Car Park
1 0 0 Area of natural beauty may restrict potential uses, although Breakers Yard to west boundary. Possible contamination if previously used for copper Works.
31 Far Lane Industrial
0 0 0 Potential for expansion onto disused sewage works.
32 Waterhouses Enterprise Centre
0 0 0
33 Blithe works, Sandon Road
1 0 0 Possible flooding due to contamination form dye works is likely. Access via low bridge.
34 Dilhorne Road and The Green
0 0 0 Access. Housing.
35 Queen Street 0 0 0 Mill structure and layout across majority of site. Traffic congestion.
36 Lymers Depot 0 0 0 Poor access; hemmed in site; contamination; changes in level.
37 Leekbrook Industrial Estate
1 0 0
38 Co-op Milk Plant 0 0 0 Remote. The site would need to be surveyed to check ground levels and flooding risk.
SMELS 2 FINAL 23 09 08 101

Final Report
SMELS 2 FINAL 23 09 08 102
Site ID Site Name Potential to Support 24 hour Working
Introduction of non-B Class Uses may Compromise the Effective Operation of the Site
Existing Operations Incompatible with Sensitive Neighbouring Land Uses
Description of other Development Constraints and Environmental Problems
39 Power Nash Indus. Estate & Brown Lees Indus. Est.
1 0 0 Not known.
40 Middle Hulme Farm
0 0 0 Environmentally sensitive location adjacent to Peak Park. Views important
41 Anzio Camp 0 0 0 High quality environment in terms of setting. Topography and view need to be considered
42 Novi Lane 0 0 0 Surrounded by residential use. B class would need to be sensitively handled.
43 Bode Business Park
0 1 0 Residential location, proximity to playing fields and play area.
44 Marling Mills 0 1 0 HGV access not ideal. Residential location surrounds some corners of the site so sensitive in this respect.
45 Adderley Mill 0 0 0 High quality environment. Listing status of Mill buildings needs to be investigated.
46 Adams food 0 1 0 Surrounded by residential use. B class needs to be sensitively handled.
Total 18 7 1

Final Report
Appendix C - Economic Profile
SMELS 2 FINAL 23 09 08 103

Final Report
SMELS 2 FINAL 23 09 08 104
Final Report
SMELS 2 FINAL 23 09 08 105
C.1 Introduction C.1.1 This section provides an update of the original economic review as part of the Employment Land
Study. Its purpose is to provide the economic context and economic factors which shapes employment land and supply factors in the District as well as our projections for the period up to 2026. This includes examining those sectors with good growth prospects and those which have experienced losses.
C.1.2 In the original economic profile we analysed the economy of Staffordshire Moorlands against Staffordshire, the West Midlands and England & Wales. However in order to also understand the wider economic patterns we will also examine neighbouring districts Newcastle-under-Lyme, Stoke-on-Trent, Macclesfield and Congleton on some of the broad indicators to understand how these areas are changing in terms of sectoral growth. The two North West districts have been included as the original review showed a fair degree of out commuting to Macclesfield and Congleton.
C.1.3 The original ELS examined data up to 2004; therefore this update concentrates on examining how the district has changed or whether patterns identified originally have continued over the last two years.
C.1.4 In this appendix the analysis is set out as follows:
• Employment Structure
• Business Structure
• Business Size
• Enterprise
• Population and the Labour Market
• Travel to Work Patterns
C.2 Employment Structure Note on Annual Business Inquiry (ABI) Data
C.2.1 Employment is examined below through using the Annual Business Inquiry (ABI) data from 1998/06 for both workplace and employment analysis. This source was also used in the ELS for years 1998/04. However previously we used data from 1996 and 1997 as well which comes from an earlier data set called the Annual Employment and Business Survey. Therefore there are slight differences as the original ELS would have used 1996 as its starting year to examine growth rates etc.
Total Employment C.2.2 In 2006, total employment in Staffordshire Moorlands stood at approximately 29,300 persons,
which represents around 9% and 1.2% of total employment in Staffordshire and the West Midlands respectively. This level of employment is very similar but slightly less than the 2004 position examined in the original ELS, which appears to be in line with the pattern shown below in Figure C.1. Employment has tended to fluctuate between 28,000 and 29,500 persons over the period 1998/06.
C.2.3 Overall employment over the period 1998/06 grew by 0.5% per annum over the eight year period. This is much smaller than the rate over 1996/04 identified in the original ELS but is likely to be due to datasets for 1996 and 1997 differing slightly to datasets dated 1998 and beyond as discussed above.

Final Report
27,000
27,500
28,000
28,500
29,000
29,500
30,000
1998 1999 2000 2001 2002 2003 2004 2005 2006
Num
ber o
f Job
s
-3.0
-2.0
-1.0
0.0
1.0
2.0
3.0
4.0
% G
row
th
Number of Jobs % Growth
Figure C.1 - Total Employment in Staffordshire Moorlands
Source: Annual Business Inquiry, 1998/06
Broad Sector Analysis C.2.4 Employment within the district has remained highest in Public administration, education & health,
Distribution, hotels & restaurants and Manufacturing, which collectively accounted for 69.3% of total employment in 2006. Interestingly, although Manufacturing has clearly declined since 1998 it actually accounts for a higher proportion of total employment in 2006 than it did in 2004 (when it accounted for 17.8%).
C.2.5 The next sector to account for the highest proportion of employment, at 11.2% of the total, is the Banking, finance & insurance sector , however, the sector is much less represented than nationally (shown in the following table) and actually employs less persons than it did in 2004.
Table C.C.1 - Staffordshire Moorlands Employment by Broad Sector
1998 Level
% of total
2006 Level
% of total
Agriculture & fishing 766 2.7 480 1.6 Energy & water 363 1.3 187 0.6 Manufacturing 7,528 26.9 5,584 19.1 Construction 1,252 4.5 1,350 4.6 Distribution, hotels & restaurants 5,868 20.9 6,659 22.8 Transport & communications 1,401 5.0 1,264 4.3 Banking, finance & insurance, etc 2,468 8.8 3,291 11.2 Public administration, education & health 6,647 23.7 8,029 27.4 Other services 1,723 6.2 2,419 8.3 Total 28,015 100.0 29,263 100.0
Source: Annual Business Inquiry, 1998/06
C.2.6 Tables C.2 and C.3 below compare Staffordshire Moorlands to all benchmark areas in terms of the distribution of employment in the broad industrial sectors and the growth rates of each. The following broad conclusions are applicable:
• Staffordshire Moorlands accounts for a very small proportion of national employment compared to all areas and is relatively small. The only other district the size is comparable to is Congleton, which has around 32,200 persons in employment. The average annual growth
SMELS 2 FINAL 23 09 08 106

Final Report
SMELS 2 FINAL 23 09 08 107
rate of employment in Staffordshire Moorlands at 0.5%, on par with the West Midlands, has been higher than all the district levels. All areas have had much lower growth than the national level of 1.0% per annum.
• The proportion of employment accounted for by Manufacturing is actually the highest in Staffordshire Moorlands, however, the sector is clearly important to the surrounding area as with the exception of Newcastle-under-Lyme, the sector accounts for at least 15% in all the other district comparators compared to only 11% nationally. The sector is declining throughout all areas, however, the rate of decline at -3.7% is much smaller in Staffordshire Moorlands than all areas except Macclesfield (-1.3%). For instance the sector has declined by -8.9% and -9.7% in Stoke-on-Trent and Newcastle-under-Lyme.
• Distribution, hotels & restaurants although the second highest sector of employment is slightly smaller than all other areas in proportion terms except Stoke on Trent whilst Newcastle-under-Lyme has a particularly high level of employment attributed to this sector at 32.2%. Growth in the sector was second highest in Staffordshire Moorlands at 1.6%, which reflects that presently the sector is slightly smaller than other areas.
• Transport & Communications, accounts for only 4.3% of total employment in Staffordshire Moorlands compared to 6.0% nationally. However, Congleton and Macclesfield have even lower proportions whilst Newcastle-under-Lyme has a particularly high proportion of employment in this sector at 11.3%.
• The Banking, finance & insurance sector accounts for the smallest proportion of employment in Staffordshire Moorlands compared to all areas. However, with the exception of Macclesfield, the sector is underrepresented in all the surrounding areas including Staffordshire and the West Midlands. The sector accounts for an extra 10.3% of the total at the national level compared to Staffordshire Moorlands. However this sector has grown at a much higher rate in the district, at 3.7% than most areas, although as noted above, the level has declined over the last couple of years.
• The Public administration, education & health sector has a higher proportion of employment in Staffordshire Moorlands compared to all areas except Stoke-on-Trent. It has also grown at a fairly high rate over the period 1998/06 at 2.4% although this rate was below the regional and national rates.
• Other services has a very high proportion of employment at 8.3% compared to all areas, for instance the sector only accounts for 5.1% and 5.3% regionally and nationally respectively. This is reflected in the high growth rate of the sector, which at 4.3% per annum was 1.7% above the national rate.
• Overall, all the surrounding district economies slightly differ in their employment structures, however, they are all with the exception of Newcastle-under-Lyme, still dependent upon the manufacturing sector to a degree whilst all three West Midlands districts have an under-represented Banking, finance & insurance sector.
C.2.7 Overall the level and distribution of employment in Staffordshire Moorlands has remained at a fairly similar level throughout the period 1998/06 and as in the previous ELS employment growth has been driven by the Distribution, hotels & restaurants, Public administration, education & health and Banking, finance & insurance. All of these except Public administration, education & health have grown at higher rates than regionally and nationally. However, in addition other services are clearly an important growth sector, which has comparatively grown rapidly over the period 1998/06.

Final Report
Table C.C.2 - Employment by Broad Sector across all areas
Staf
ford
shire
M
oorla
nds
Stok
e on
Tre
nt
New
cast
le-
unde
r-Ly
me
Con
glet
on
Mac
cles
field
Staf
ford
shire
Wes
t Mid
land
s
Engl
and
&
Wal
es
TOTAL 29,263 106,051 45,496 32,237 80,436 322,819 2,377,433 23,950,036 Agriculture & fishing 1.6 0.1 0.7 0.9 1.7 0.2 0.9 0.8 Energy & water 0.6 0.5 0.1 1.2 0.3 0.3 0.5 0.5 Manufacturing 19.1 17.5 9.2 19.1 16.8 15.8 14.7 11.0 Construction 4.6 4.2 4.5 6.7 3.8 5.4 5.0 4.7 Distribution, hotels & restaurants 22.8 22.4 32.2 26.1 24.1 24.9 23.7 23.6 Transport & communications 4.3 6.8 11.3 3.5 3.3 7.1 5.6 6.0 Banking, finance & insurance, etc 11.2 12.6 12.6 16.1 25.7 15.0 17.8 21.5 Public administration, education & health
27.4 30.8 26.0 21.5 18.8 26.1 26.6 26.6
Other services 8.3 5.1 3.3 4.9 5.6 5.1 5.1 5.3 Total 100.0 100.0 100.0 100.0 100.0 100.0 100.0 100.0
Table C.C.3 - Employment Growth (Average annual % growth between 1998 and 2006)
Staf
ford
shi
re
Moo
rland
s
Stok
e on
Tr
ent
New
cast
le-
unde
r-Ly
me
Con
glet
on
Mac
cles
fiel
d Staf
ford
shi
re
Wes
t M
idla
nds
Engl
and
&
Wal
es
Agriculture & fishing -5.7 3.6 -2.7 -5.5 -2.1 2.7 -1.4 -2.7 Energy & water -8.0 -6.5 -20.1 5.3 -1.5 -4.3 -6.0 -3.5 Manufacturing -3.7 -8.9 -9.7 -7.2 -1.3 -4.6 -5.6 -4.2 Construction 0.9 -3.0 -0.2 7.3 4.0 1.6 3.3 1.8 Distribution, hotels & restaurants 1.6 -0.6 -0.5 1.4 0.0 0.3 0.5 0.6 Transport & communications -1.3 4.3 15.2 1.2 -1.2 5.7 2.6 1.2 Banking, finance & insurance, etc 3.7 1.2 3.9 1.3 0.4 3.6 2.2 2.6 Public administration, education & health
2.4 1.6 2.5 5.7 2.0 1.7 2.8 2.6
Other services 4.3 1.8 -0.9 5.6 2.0 2.9 3.9 2.6 Total 0.5 -1.7 0.2 0.1 0.4 0.6 0.5 1.0
Source: Annual Business Inquiry, 1998/06
SMELS 2 FINAL 23 09 08 108

Final Report
Sub-Sector Analysis C.2.8 The ELS examined more detailed sub-sectors of employment in Staffordshire Moorlands by
examining 2 Digit SIC codes, this information is updated in Tables C.4- C.6.
C.2.9 The two principle sectors of employment, displayed in Table C.4, remain as Education and Health & social work, accounting for 11.5% and 9.2% of total employment in 2006. However since 2004 the former has become larger than the latter reflected in the high growth rate of 2.1% compared to a fall in employment in Health & social work.
C.2.10 Hotels & restaurants also remains the third highest sector of employment accounting for at 8.4% of total employment and has grown rapidly since 1998 at 4.3% per annum.
C.2.11 Retail Trade, except motor vehicles and motorcycles; repair of personal and household goods and Public administration and defence; compulsory social security also continue to account for fairly high proportions of employment, at 8.1% and 6.8% respectively.
C.2.12 However beyond these five top sub-sectors Recreational, sporting & cultural activities accounts for a much higher proportion of employment in 2006 than in 2004 at 6.2% and has grown very rapidly at 5.7% per annum. As noted in the previous ELS this sub-sector is clearly very vulnerable to outside trends and influences and employment has fluctuated widely over the period. This difference could also be due to the different ABI datasets.
C.2.13 In addition the Manufacture of machinery & equipment not elsewhere classified accounts for a slightly higher proportion than in the original ELS profile and Financial intermediation accounts for a slightly lower proportion. The former represents the importance of the JCB plant around Cheadle and associated supply chain businesses.
C.2.14 There are still few financial sub sectors listed amongst the principle sub sectors than would be expected in the comparator areas whilst the pace of growth has been slower than the other sectors.
SMELS 2 FINAL 23 09 08 109

Final Report
Table C.C.4 - Employment in Staffordshire Moorlands by principle sub-sectors
1998 Level
% 2002 Level
% 2006 Level
% Absolute Change
Average Annual Growth
80 : Education 2,846 10.2 3,341 11.3 3,366 11.5 520 2.1 85 : Health and social work 3,066 10.9 3,129 10.6 2,688 9.2 -378 -1.6 55 : Hotels and restaurants 1,771 6.3 2,180 7.4 2,472 8.4 701 4.3 52 : Retail trade, except of motor vehicles and motorcycles; repair of personal and household goods
2,308 8.2 2,512 8.5 2,376 8.1 68 0.4
75 : Public administration and defence; compulsory social security
735 2.6 1,814 6.1 1,976 6.8 1,241 13.2
92 : Recreational, cultural and sporting activities 1,169 4.2 593 2.0 1,824 6.2 655 5.7 29 : Manufacture of machinery and equipment not elsewhere classified
1,004 3.6 1,084 3.7 1,412 4.8 408 4.4
65 : Financial intermediation, except insurance and pension funding
1,131 4.0 1,787 6.0 1,404 4.8 273 2.7
45 : Construction 1,252 4.5 1,103 3.7 1,350 4.6 98 0.9 74 : Other business activities 763 2.7 1,563 5.3 1,281 4.4 518 6.7 51 : Wholesale trade and commission trade, except of motor vehicles and motorcycles
1,072 3.8 746 2.5 1,180 4.0 108 1.2
60 : Land transport; transport via pipelines 936 3.3 922 3.1 906 3.1 -30 -0.4 28 : Manufacture of fabricated metal products, except machinery and equipment
835 3.0 767 2.6 690 2.4 -145 -2.4
15 : Manufacturing of food and beverages 648 2.3 828 2.8 673 2.3 25 0.5 50 : Sale, maintenance and repair of motor vehicles and motorcycles; retail sale of automotive fuel
717 2.6 804 2.7 631 2.2 -86 -1.6
Source: Annual Business Inquiry, 1998/06
SMELS 2 FINAL 23 09 08 110

Final Report
C.2.15 Tables C.5 and C.6 overleaf detail the key sub-sectors in growth and decline within Staffordshire Moorlands. Public administration & defence, Hotels & restaurants and Recreational, cultural & sporting activities have been the highest growth sectors accounting for employment growth of approximately 2,600 persons.
C.2.16 Growth in the Banking, finance & insurance sub sectors has been relatively slow, Other business activities and Financial intermediation, only accounted for growth of approximately 800 persons.
C.2.17 Manufacturing is still clearly important to the economy. Manufacture of machinery and Manufacture of basic metals experienced healthy growth over the period.
C.2.18 Table C.6 reiterates the importance but continuing demise of parts of the Manufacturing sector, eight of the 12 major declining sub-sectors are manufacturing activities. Health and social work also accounted for fairly high job losses, at 378 persons.
SMELS 2 FINAL 23 09 08 111

Final Report
Table C.C.5 – Staffordshire Moorlands by key growth sub-sectors
1998 % 2006 % Absolute Change
Average Annual Growth
75 : Public administration and defence; compulsory social security 735 2.6 1,976 6.8 1,241 13.2 55 : Hotels and restaurants 1,771 6.3 2,472 8.4 701 4.3 92 : Recreational, cultural and sporting activities 1,169 4.2 1,824 6.2 655 5.7 80 : Education 2,846 10.2 3,366 11.5 520 2.1 74 : Other business activities 763 2.7 1,281 4.4 518 6.7 29 : Manufacture of machinery and equipment not elsewhere classified
1,004 3.6 1,412 4.8 408 4.4
27 : Manufacture basic metals 15 0.1 333 1.1 318 47.3 65 : Financial intermediation, except insurance and pension funding 1,131 4.0 1,404 4.8 273 2.7 51 : Wholesale trade and commission trade, except of motor vehicles and motorcycles
1,072 3.8 1,180 4.0 108 1.2
93 : Other service activities 291 1.0 393 1.3 102 3.8 Table C.C.6 – Staffordshire Moorlands key sub-sectors in decline
1998 % 2006 % Absolute Change
Average Annual Growth
17 : Manufacture of textiles 1,311 4.7 311 1.1 -1,000 -16.5 18 : Manufacture of wearing apparel; dressing and dyeing of fur 760 2.7 77 0.3 -683 -24.9 85 : Health and social work 3,066 10.9 2,688 9.2 -378 -1.6 01 : Agriculture, hunting and related service activities 762 2.7 464 1.6 -298 -6.0 26 : Manufacture of other non-metallic mineral products 615 2.2 350 1.2 -265 -6.8 22 : Publishing, printing and reproduction of recorded media 287 1.0 116 0.4 -171 -10.7 34 : Manufacture of motor vehicles, trailers and semi-trailers 484 1.7 323 1.1 -161 -4.9 21 : Manufacture of pulp, paper and paper products 179 0.6 20 0.1 -159 -24.0 28 : Manufacture of fabricated metal products, except machinery and equipment
835 3.0 690 2.4 -145 -2.4
24 : Manufacture of chemicals and chemical products 666 2.4 533 1.8 -133 -2.7 36 : Manufacture of furniture; manufacturing not elsewhere classified
292 1.0 168 0.6 -124 -6.7
14 : Other mining and quarry 273 1.0 166 0.6 -107 -6.0 Source: Annual Business Inquiry, 1998/06
SMELS 2 FINAL 23 09 08 112

Final Report
Other Services
C.2.19 This section in addition examines the sub-sectors within the Other Services sector given it comprises a comparatively high proportion of employment and has been growing strongly. Table C.7 below displays employment shares in all sub sectors. Clearly in 2006 a great deal of employment within the Other Services sector is accounted for by the Recreational, cultural and sporting activities.
Table C.C.7 - Other Services by 2 Digit Code, Number and as % of total
Staffordshire Moorlands West Midlands 90 : Sewage and refuse disposal, sanitation and similar activities
124 5.1 9694 7.9
91 : Activities of membership organisations not elsewhere classified
78 3.2 24314 19.9
92 : Recreational, cultural and sporting activities 1,824 75.4 58804 48.2 93 : Other service activities 393 16.2 29128 23.9
Source: Annual Business Inquiry, 1998/06
C.2.20 This sector and its constituent elements are explored below:
Table C.C.8 - Recreational, Cultural & Sporting Activities in Staffordshire Moorlands
1998 as % of total
2006 as % of total
Average Annual Growth, %
921 : Motion picture and video activities - - - 922 : Radio and television activities - - - 923 : Other entertainment activities 70.8 66.0 4.8 924 : News agency activities 0.0 0.0 0 925 : Library, archives, museums and other cultural activities
8.6 8.4 5.3
926 : Sporting activities 13.4 20.5 11.5 927 : Other recreational activities 6.8 5.0 1.6 100 100.0 5.7
Source: Annual Business Inquiry, 1998/06
C.2.21 Clearly the vast majority of employment is within other entertainment activities, and within this sector within fair and amusement parks, which reflects the presence and importance of Alton Towers as an employer in the district. The sporting activities sector has also experienced substantial growth of 11.5% over the period.
Creative Industries and Tourism & Leisure Sectors
C.2.22 Since the last ELS it has been brought to light that the Creative Industries, Tourism & Leisure and Healthcare sectors have also been highlighted as potential areas to target economic strategies towards. Therefore they are briefly quantified in employment terms in the following analysis.
C.2.23 These have been explored examining employment figures for relevant 4 Digit SIC Codes, which are defined as follows. The definition also includes healthcare technologies.
SMELS 2 FINAL 23 09 08 113

Final Report
Table C.C.9 - SIC Codes Definition of Creative Industries and Tourism & Leisure
Creative Industries Tourism & Leisure Healthcare 2211 : Publishing of books 5510: Hotels 8511 : Hospital activities 2212 : Publishing of newspapers 5521: Youth hostels and
mountain refuges 8512 : Medical practice activities
2213 : Publishing of journals and periodicals
5522: Camping sites, including caravan sites
8513 : Dental practice activities
2214 : Publishing of sound recordings
5523: Other provision of lodgings
8514 : Other human health activities
2215 : Other publishing 6330: Activities of travel agencies etc
2441 : Manufacture of basic pharmaceuticals
7420 : Architectural and engineering activities and related technical consultancy
9232: Operation of arts facilities
2442 : Manufacture of pharmaceutical preparations
7440 : Advertising 9233: Fair and amusement park activities
3310 : Manufacture of medical and surgical equipment and orthopaedic appliances
7481 : Photographic activities 9234: Other entertainment activities
7310 : Research and experimental development on natural sciences and engineering
9211 : Motion picture and video production
9251: Library and archives activities
9212 : Motion picture and video distribution
9252: Museum activities etc
9213 : Motion picture projection 9253: Botanical and zoological gardens etc
9220 : Radio and television activities
9261: Operation of sports arenas and stadiums
9231: Artistic and literary creation and interpretation
9262: Other sporting activities
9271: Gambling and betting activities
9272: Other recreational activities
C.2.24 Using these definitions Figure C.2 below explores the proportion of total employment in 2006 in the district, set against the regional and national figures.
SMELS 2 FINAL 23 09 08 114

Final Report
Figure C.1 - Proportion of total employment in Creative Industries and Tourism & Leisure, 2006
Source: Annual Business Inquiry, 1998/06
0.01.02.03.04.05.06.07.08.09.0
10.0
Staffordshire Moorlands West Midlands England & Wales
Creative industries Tourism & Leisure Healthcare
C.2.25 Clearly the Tourism & Leisure sector accounts for a high comparative proportion of employment in Staffordshire Moorlands, at 8.9%. However if the sub sector identified above, operation of fair and amusement parks is omitted, it is around 4.8%, which is only slightly above the national average of 3.8%. Other tourism sub-sectors that account for higher proportions of employment include hotels and the operation of sports arenas.
C.2.26 There is a very small proportion of total employment within the creative industries within Staffordshire Moorlands, at just around 1%, which is much lower than national employment of 2.9%.
C.2.27 The Healthcare sector also accounts on this measure for a lower proportion of total employment, 6.6%, compared to the regional and national figures of 7.8% and 8.3% respectively.
B-Use Class Employment
C.2.28 This section provides an update of the distribution of B-use employment in Staffordshire Moorlands and compares it to the neighbouring districts also.
C.2.29 In 2006 there were approximately 15,300 B-use jobs in Staffordshire Moorlands, which accounted for 52.4% of total employment in the district. This was higher than Newcastle-under-Lyme (51.0%) and Stoke on Trent (51.6%) but slightly lower than all other areas.
C.2.30 Clearly, Manufacturing accounts for the highest proportion of B-use employment in Staffordshire Moorlands at 36.4%, which is a higher than all other areas. Banking, finance & insurance is the next greatest B-use employment sector but at 21.5% is smaller proportionately than all other areas. B-use employment in Construction, Distribution & wholesale and Transport & Communications is relatively smaller than most areas whilst the proportion in Other Services is much higher at 13.2%.
SMELS 2 FINAL 23 09 08 115

Final Report
Table C.C.1 - B-use Empl t in all areas oymen
B-U
se
Con
stru
ctio
n
B-U
se
Dis
trib
utio
n an
d W
hole
sale
B-U
se
Ban
king
, Fi
nanc
e &
In
sura
nce
B-U
se
Man
ufac
turin
g
B-U
se
Oth
er
Serv
ices
B-U
se
Tran
spor
t an
d C
omm
unic
atio
ns
Tota
l
Staffordshire Moorlands 8.8 11.8 21.5 36.4 13.2 8.2 15,327 Newcastle-under-Lyme 8.8 22.1 24.7 18.0 4.1 22.2 23,222 Stoke on Trent 8.1 12.3 24.3 33.9 8.1 13.2 54,713 Congleton 12.2 11.3 29.3 34.9 5.9 6.4 17,703 Macclesfield 6.4 9.5 43.5 28.4 6.6 5.6 47,571 Staffordshire 10.0 13.9 27.6 29.0 6.6 13.0 175,666 West Midlands 9.2 13.1 32.9 27.2 7.2 10.3 1,287,980 England & Wales 0.1 0.1 0.4 0.2 0.1 0.1 12,839,193Source: Annual Business Inquiry, 1998/06
C.2.31 All areas apart from the national economy have experienced declines in the amount of B-use employment. However in Staffordshire Moorlands decline, of 0.4% per annum, has been less than most other areas. Stoke on Trent and Newcastle-under-Lyme have experienced very high decline of -4.6% and -4.0% per annum.
C.2.32 Decline in Staffordshire Moorlands, as most of the comparators, has been driven by the manufacturing sector. All remaining B-use sectors actually experienced growth over the period, Banking, finance & insurance and other services accounted for the vast majority of growth and grew fairly highly comparatively.
Table C.C.2 - B-use Employment Growth Rat 998/06 es 1
B-U
se
Con
stru
ctio
n
B-U
se
Dis
trib
utio
n an
d W
hole
sale
B-U
se
Ban
king
, Fi
nanc
e &
In
sura
nce
B-U
se
Man
ufac
turin
g
B-U
se
Oth
er
Serv
ices
Tota
l Staffordshire Moorlands 0.9 0.2 3.7 -3.7 4.4 -0.4 Stoke on Trent -3.0 -2.6 1.2 -8.9 2.2 -4.6 Newcastle-under-Lyme -0.2 -5.5 3.9 -9.7 -2.6 -4.0 Congleton 7.3 -0.7 1.3 -7.2 7.2 -2.2 Macclesfield 4.0 -2.9 0.4 -1.3 3.1 -0.2 Staffordshire 1.6 -2.3 3.6 -4.6 2.8 -1.0 West Midlands 3.3 -1.2 2.2 -5.6 4.4 -1.0 England and Wales 1.8 -0.6 2.6 -4.2 2.8 0.2
Source: Annual Business Inquiry, 1998/06
SMELS 2 FINAL 23 09 08 116

Final Report
C.3 Business Structure Total Businesses
C.3.1 In 2006 the total number of business units in Staffordshire Moorlands reached over 3,400, which has followed continual growth since 1998. Over the period 1998/06 growth has averaged 1.9% per annum, which was slightly higher than the regional and national rates of 1.6% and 1.7% respectively.
Figure C.2 - Total Business Units Staffordshire Moorlands
Source: Annual Business Inquiry, 1998/06
Broad Sector Analysis
2,700
2,800
2,900
3,000
3,100
3,200
3,300
3,400
3,500
1998 1999 2000 2001 2002 2003 2004 2005 2006
Num
ber o
f bus
ines
s un
its
0.0
1.0
2.0
3.0
4.0
5.0
6.0
7.0
% g
row
th
Total Businesses % Growth
C.3.2 Tables C.12 and C.13 overleaf explore business units in terms of distribution in 2006 by broad industrial sector and growth over the period 1998/06.
C.3.3 The Distribution, hotels & restaurants and Banking, finance & insurance sectors still account for the highest proportion of business units, at 29.6% and 21.6% of total businesses respectively. This pattern is broadly the same across all areas; however, most areas have a higher proportion of businesses within the Banking sector.
C.3.4 The proportion of businesses within Construction in Staffordshire Moorlands is the highest at 13.6% whilst Manufacturing also accounts for the highest share, with the exception of Stoke on Trent, at 9.8%.
C.3.5 Interestingly, the Other services sector accounts for a similar proportion of businesses to all other areas at 7.5% despite the sector comparatively accounting for a much higher proportion of employment.
C.3.6 Staffordshire Moorlands had the highest total growth rate in businesses apart from Congleton and Staffordshire. Growth was largely fuelled by the Banking, finance & insurance and Public administration sectors in Staffordshire Moorlands, indeed the former at 6.6% was higher than all other areas whilst the latter grew at 3.0% which was higher than all areas except Congleton.
C.3.7 The number of businesses did fall in the Manufacturing sector at 0.9% per annum but this rate was much slower than the comparator areas.
SMELS 2 FINAL 23 09 08 117

Final Report
Table C.C. Business Units by Broad Industrial Sector, as % of total, 2006 3 - St
affo
rdsh
ire
Moo
rland
s
Stok
e on
Tr
ent
New
cast
le-
unde
r-Ly
me
Con
glet
on
Mac
cles
field
Staf
ford
shire
Wes
t M
idla
nds
Engl
and
&
Wal
es
TOTAL 3,464 7,234 3,655 4,060 8,928 30,985 200,368 2,174,794 Agriculture and fishing 0.5 0.2 0.3 0.4 0.5 0.3 0.3 0.4 Energy and water 0.3 0.2 0.1 0.3 0.3 0.2 0.2 0.2 Manufacturing 9.8 11.4 7.7 7.5 5.7 8.7 9.3 7.1 Construction 13.6 9.8 11.2 8.9 6.8 12.4 9.7 9.6 Distribution, hotels and restaurants 29.6 35.8 32.4 27.3 26.0 29.0 29.6 27.9 Transport and communications 8.0 5.4 4.7 4.7 3.7 5.5 4.8 4.4 Banking, finance and insurance, etc 21.6 19.9 25.3 35.8 41.9 27.1 29.6 32.9 Public administration, education & health 9.1 9.7 9.7 7.3 6.3 9.0 9.0 9.2 Other services 7.5 7.6 8.7 7.7 8.8 7.6 7.5 8.4
Table C.C.4 siness Unit Growth by Sector, 1998/06 - Bu
Staf
ford
shire
M
oorla
nds
New
cast
le-
unde
r-Ly
me
Stok
e on
Tr
ent
Con
glet
on
Mac
cles
field
Staf
ford
shire
Wes
t M
idla
nds
Engl
and
&
Wal
es
Agriculture and fishing 0.8 0.0 0.0 2.6 0.3 0.7 -0.3 0.0 Energy and water -4.9 -15.2 -3.0 7.9 0.9 -2.3 -0.7 -2.8 Manufacturing -0.9 -1.1 -3.0 0.2 -2.1 -0.8 -2.2 -1.5 Construction 3.9 2.6 2.4 3.7 2.3 3.1 2.3 2.8 Distribution, hotels and restaurants 0.1 -0.2 -1.1 0.7 0.0 0.3 0.0 0.1 Transport and communications -1.0 1.7 3.6 0.5 0.5 2.1 2.1 0.9 Banking, finance and insurance, etc 6.6 4.3 3.8 5.5 4.2 5.7 5.1 4.3 Public administration, education & health 3.0 1.9 -0.3 3.2 1.7 3.0 1.9 2.6 Other services 1.7 0.6 0.2 1.5 0.0 0.6 0.1 0.1 TOTAL 1.9 1.4 0.2 2.7 1.7 2.1 1.6 1.7
Source: Annual Business Inquiry, 1998/06
SMELS 2 FINAL 23 09 08 118

Final Report
B-Use Class Business Units
C.3.8 Table C.14 provides an update of the level and distribution of B-use class business units in Staffordshire Moorlands. B-use business units account for 66.7% of the total in Staffordshire Moorlands, which was above the proportion in 2004. This proportion was much higher than Newcastle-under-Lyme (63.4%) and Stoke on Trent (61.8%) but slightly below the West Midlands (67.3%) and significantly lower than Congleton and Macclesfield, 71.3% and 72.1% respectively.
Table C.C.5 - B-Use Business Units i eas, as % of 2006 level n all ar
B-U
se C
onst
ruct
ion
B-U
se D
istr
ibut
ion
and
Who
lesa
le
B-U
se
Fina
ncia
l In
term
edia
tion
and
Oth
er B
usin
ess
B-U
se M
anuf
actu
ring
B-U
se O
ther
Ser
vice
s
B-U
se
Tran
spor
t an
d C
omm
unic
atio
ns
Tota
l
Staffordshire Moorlands 20.4 14.7 32.4 14.8 5.8 12.0 2,309.0 Newcastle-under-Lyme 17.7 16.4 39.8 12.2 6.5 7.3 2,317.0 Stoke on Trent 15.9 17.8 32.1 18.4 7.1 8.7 4,474.0 Congleton 12.5 15.0 50.3 10.6 5.0 6.6 2,893.0 Macclesfield 9.4 13.5 58.1 7.9 6.0 5.2 6,437.0 Staffordshire 18.3 14.9 40.1 12.9 5.6 8.2 20,953.0 West Midlands
14.5 14.7 43.9 13.8 5.9 7.2 134,934.0
England & Wales 14.1 13.1 48.3 10.4 7.7 6.4
1,480,089.0
Source: Annual Business Inquiry, 1998/06
C.3.9 The Financial Intermediation and Other Business is the largest occupier of B-use business units, accounting for 32.4% of the total, which was slightly higher than the 2004 level of 30.3%. This sector also dominates B-use business units but the proportions are also much higher in almost all other areas. For instance regionally and nationally the sector accounts for 43.9% and 48.3% respectively, whilst the proportions in Macclesfield and Congleton are very high at 50.3% and 58.1% respectively.
C.3.10 Construction also accounts for a fairly high proportion in Staffordshire Moorlands at 20.4%, which was higher than all other areas. The proportion of Manufacturing businesses in B-uses also remains high at 14.8% compared to 10.4% nationally, although it is lower than the 2004 proportion of 16.4%.
Business Size
C.3.11 The business structure of Staffordshire Moorlands remains dominated by micro businesses of between 1 and 10 employees. In 2006, they accounted for 87% of the total, which was slightly more than in 2004 (85.6%). Micro businesses dominate across all areas; however, the proportion in Staffordshire Moorlands is more in line with Congleton and Macclesfield than the two other districts within the West Midlands. The proportion is also above the country, regional and national levels of 84.6%, 83.5% and 84.5% respectively.
C.3.12 In line with this Staffordshire Moorlands has a much smaller proportion of medium and large sized businesses accounting for 1.9% and 0.4% of the total.
SMELS 2 FINAL 23 09 08 119

Final Report
Table C.C.6 - Bu ess Unit Size Distrib n in Al eas. sin utio l ar
Mic
ro
(1-1
0 Em
ploy
ees)
Smal
l (1
1-49
Em
ploy
ees)
Med
ium
(5
0-19
9 Em
ploy
ees)
Larg
e (2
00+
Empl
oyee
s)
Mic
ro
A
(1-5
Em
ploy
ees)
Mic
ro
B
(6-1
0 Em
ploy
ees)
Staffordshire Moorlands 87.0 10.6 1.9 0.4 75.7 11.3 Newcastle-under-Lyme 82.8 13.0 3.4 0.8 67.2 15.6 Stoke on Trent 79.8 15.1 4.1 1.0 62.7 17.0 Congleton 87.5 10.1 2.1 0.3 74.3 13.2 Macclesfield 87.6 9.8 2.2 0.4 75.5 12.1 Staffordshire 84.6 12.0 2.7 0.6 70.9 13.7 West Midlands 83.5 12.6 3.2 0.7 69.4 14.2 England & Wales 84.5 12.0 2.8 0.7 70.9 13.7
Source: Annual Business Inquiry, 1998/06
C.3.13 Micro businesses have grown the fastest of all sizes in Staffordshire Moorlands at 2.3% per annum, all of which has been in the emergence of businesses employing up to 5 persons. This rate was only exceeded by Congleton and Staffordshire which have also seen rapid growth in Micro A businesses.
Table C.C. sin Unit Size Grow 1998/067 - Bu ess th
Mic
ro
(1-1
0 Em
ploy
ees)
Smal
l (1
1-49
Em
ploy
ees)
Med
ium
(5
0-19
9 Em
ploy
ees)
Larg
e (2
00+
Empl
oyee
s)
Mic
ro
A
(1-5
Em
ploy
ees)
Mic
ro
B
(6-1
0 Em
ploy
ees)
Tota
l
Staffordshire Moorlands 2.3 -0.7 0.2 1.8 2.9 -1.2 1.9 Newcastle-under-Lyme 1.7 -1.0 2.8 3.7 2.2 -0.1 1.4 Stoke on Trent 0.9 -2.4 -2.4 -1.0 1.9 -2.0 0.2 Congleton 3.0 0.9 0.6 -4.3 3.5 0.8 2.7 Macclesfield 2.0 -0.3 0.8 1.8 2.7 -1.5 1.7 Staffordshire 2.5 0.0 1.1 1.8 3.2 -0.2 2.1 West Midlands 1.9 -0.4 0.8 0.9 2.6 -0.8 1.6 England & Wales 1.9 0.6 1.2 0.8 2.3 -0.1 1.7
Source: Annual Business Inquiry, 1998/06
Enterprise C.3.14 VAT registrations8 and de-registrations can be used as a proxy for measuring enterprise activity
and business survival rates. Figure C.4 updates the level of VAT registered businesses in Staffordshire Moorlands.
8 It is worth noting that the true level of entrepreneurship may be slightly underestimated by VAT Registration data where some businesses fall naturally below the registration threshold.
SMELS 2 FINAL 23 09 08 120

Final Report
Figure C.3 - VAT Registered Businesses in Staffordshire Moorlands
Source: VAT Registrations, NOMIS
0
500
1,000
1,500
2,000
2,500
3,000
3,500
4,000
1994 1995 1996 1997 1998 1999 2000 2001 2002 2003 2004 2005 2006
Num
ber
of b
usin
esse
s
0
50
100
150
200
250
300
Num
ber
of b
usin
esse
s
VAT Stock VAT Registrations VAT De-registrations
C.3.15 Since the last ELS there has been a slight fall in VAT registrations over the last two years, however, de-registrations have been falling hence overall the VAT stock has changed little.
C.3.16 Table C.17 below examines the net-change (VAT Registrations- VAT De-Registrations) in the district over the period 1998/06 whilst total stock in 2006 by sector is also displayed.
C.3.17 The Wholesale, retail and repair and Real estate sectors had the highest stocks of businesses in 2006, at 680 and 580 respectively. The sectors to have experienced the greatest positive net changes in VAT stock are Real estate, hotels & restaurants and construction. Wholesale, retail and repairs has actually in majority of years seen more de-registrations reducing overall stock.
Table C.C.8 - Net Change in VAT stock Staffordshire Moorlands by Sector
1994 1996 1998 2000 2002 2004 2006 2006 Stock (at year end)
Agriculture; Forestry and fishing
-10 -15 -15 -10 0 -5 -10 775
Mining and quarrying; 0 0 0 0 0 0 0 0 Manufacturing 0 -5 5 -10 0 0 0 315 Construction 0 -5 10 5 10 25 -5 430 Wholesale, retail and repairs -25 -30 15 -10 -5 5 0 680 Hotels and restaurants -10 -10 0 5 25 10 15 270 Transport, storage and communication
0 5 0 5 5 -5 5 275
Financial intermediation 0 0 0 0 5 5 0 20 Real Estate, renting and business activities
10 25 25 40 25 15 15 580
Public administration; Other community, social and personal services
15 0 -5 0 0 5 5 175
Education; health and social work
-5 0 0 5 0 5 10 50
Source: VAT Registrations, NOMIS
C.3.18 Figure C.5 looks at VAT registrations per 10,000 resident adults in Staffordshire Moorlands and the benchmark areas. This produces comparable levels of enterprise for each area as it takes account of the number of people living with each area.
SMELS 2 FINAL 23 09 08 121

Final Report
20.0
25.0
30.0
35.0
40.0
45.0
50.0
55.0
60.0
1994 1995 1996 1997 1998 1999 2000 2001 2002 2003 2004 2005 2006
Staffordshire Moorlands Newcastle-under-Lyme Stoke on Trent
Congleton Macclesfield Staffordshire
West Midlands England and Wales
C.3.19 Using this measure, entrepreneurial activity is fairly low in this district compared to the wider areas and has fallen since 2004. In 2006 at 28.1 per 10,000 population the rate was 9.5, 5.7 and 6.9 percentage points below the national, regional and country levels respectively. Furthermore the district compares particularly poorly next to Macclesfield and Congleton which have very high rates of 53.5 and 45 respectively.
Figure C.4 - VAT Registrations per 10,000 Population
Source: VAT Registrations and Mid Year Population Estimates, NOMI
C.3.20 In terms of registrations per 10,000 population by sector, as shown below in Table C.18, Real estate accounts for the highest number of registrations in all areas although much higher in Congleton and Macclesfield, which goes some way in explaining their higher VAT registration rates overall. Wholesale, retail and repairs and Construction in Staffordshire Moorlands also account for a fairly high proportion.
Table C.C.9 - VAT Registrations per 10,000 Population by Sector (2006)
Staf
ford
shire
M
oorla
nds
Stok
e on
Tre
nt
New
cast
le-
unde
r-Ly
me
Con
glet
on
Mac
cles
field
Staf
ford
shire
Wes
t Mid
land
s
Engl
and
&
Wal
es
Agriculture; Forestry and fishing 1.9 0.0 0.5 1.3 0.8 0.8 0.6 0.7 Mining and quarrying; Electricity, gas and water supply
0.0 0.0 0.0 0.0 0.0 0.0 0.0 0.0
Manufacturing 1.9 1.5 0.5 2.0 2.4 1.9 2.0 1.9 Construction 3.1 3.3 4.3 3.3 4.0 5.5 4.4 4.6 Wholesale, retail and repairs 5.6 6.6 4.8 11.1 8.4 6.8 7.3 7.2 Hotels and restaurants 4.4 4.6 5.3 3.9 4.0 4.3 3.8 3.9 Transport, storage and communication 2.5 1.8 1.0 1.3 2.8 2.1 2.0 1.8 Financial intermediation 0.0 0.0 0.0 2.0 0.4 0.1 0.2 0.3 Real Estate, renting and business activities 6.9 6.1 7.7 17.0 25.5 11.1 11.3 14.2 Public administration; Other community, social and personal services
1.2 0.8 1.4 3.3 4.0 1.5 1.7 2.3
Education; health and social work 1.2 0.3 1.0 0.0 0.8 0.7 0.6 0.6 28.7 24.8 26.5 45.0 53.1 34.9 33.7 37.5
SMELS 2 FINAL 23 09 08 122

Final Report
SMELS 2 FINAL 23 09 08 123
Source: VAT Registrations and Mid Year Population Estimates, NOMIS
C.3.21 Another useful indicator of enterprise activity is the level of self-employment in an area. Table C.19 shows the proportion of working age population that were self employed in Staffordshire Moorlands from 2004 to 2007.
Table C.C.10 - Self Employment Rates 1998/06
2004 2005 2006 2007
Staffordshire Moorlands 10.7 10.7 12.2 7.6 Newcastle under Lyme 6.7 7.6 4.2 6.0 Stoke on Trent 6.7 5.9 5.5 6.3 Congleton 8.6 6.4 12.0 10.3 Macclesfield 13.0 13.1 14.1 12.3 Staffordshire 8.7 8.9 8.6 9.5 West Midlands 8.1 8.3 8.3 8.3 England & Wales 9.2 9.4 9.4 9.5
Source: Annual Population Survey, NOMIS 2004/07
C.3.22 The self employment rate in Staffordshire Moorlands, expressed as a percentage of those of working age, has been fairly high across the period above the regional and national levels until the last year. It has been consistently higher than Newcastle under Lyme and Stoke on Trent but the rate in Macclesfield has been the highest throughout.
C.3.23 The Annual Population Survey is sample based therefore it is not unusual to see fairly different rates in certain years, bearing this in mind overall the level of self employment appears fairly high in Staffordshire Moorlands. This coincides with the business size analysis which identified a high proportion of businesses employing 1-5 persons.

Final Report
C.4 Population and the Labour Market C.4.1 This section updates the population profile from 2004/06 including examining ONS population
forecasts again to check for any revisions.
Population C.4.2 In 2006 the population of Staffordshire Moorlands was approximately 94,400 persons and has
actually grown slightly since 2004, to reach its highest point since 1993.
Figure C.5 - Staffordshire Moorlands Total Population
Source: Mid Year Population Estimates, NOMIS
91,000
92,000
93,000
94,000
95,000
96,000
97,000
98,000
1984
1985
1986
1987
1988
1989
1990
1991
1992
1993
1994
1995
1996
1997
1998
1999
2000
2001
2002
2003
2004
2005
2006
-1.2
-1
-0.8
-0.6
-0.4
-0.2
0
0.2
0.4
0.6
0.8
1
Population level % Growth
C.4.3 Table C.20 below explores population growth rates. Due to recent growth in the population the population growth rates are fairly stagnant rather than being negative as they were over the period 1994-2004 and 1984-2004 in the original ELS. However Congleton, Newcastle-under-Lyme, Staffordshire, the West Midlands and England & Wales have had much higher growth rates. Growth in Stoke on Trent has been the most negative in recent periods.
Table C. C.11 - Population Growth Rates
1986-1996 1996-2006 1986-2006
Staffordshire Moorlands -0.2 0.2 0.0 Stoke on Trent 0.0 -0.4 -0.2 Newcastle-under-Lyme 0.2 0.2 0.2 Congleton 0.4 0.6 0.5 Macclesfield 0.0 -0.1 0.0 Staffordshire 0.3 0.3 0.3 West Midlands 0.2 0.2 0.2 England and Wales 0.3 0.4 0.4
Source: Mid Year Population Estimates, NOMIS
C.4.4 Table C.21 overleaf examines population by age band.
SMELS 2 FINAL 23 09 08 124

Final Report
Table C.C.12 - Population by Age Band, as % of total, 2006
Source: Mid Year Population Estimates, NOMIS
Staf
ford
shire
M
oorla
nds
Stok
e on
Tre
nt
New
cast
le-u
nder
-Ly
me
Con
glet
on
Mac
cles
field
Staf
ford
shire
Wes
t Mid
land
s
Engl
and
and
Wal
es
Total Persons 95,300
239,700
123,800
92,400
150,600
822,800
5,366,700
53,728,800
"0-14" 16.1 17.6 16.1 17.1 16.9 17.1 18.3 17.7 "15-29" 15.4 20.9 20.2 15.5 14.9 17.5 19.4 19.6 "30-49" 27.6 27.6 27.3 29.0 29.0 28.4 27.8 28.8 "50-64" 22.1 17.9 19.1 21.0 20.4 20.3 18.1 17.8 "65 " 18.8 15.9 17.3 17.4 18.9 16.8 16.3 16.0 Working Age Population 65.2 66.5 66.6 65.5 64.3 66.1 65.4 66.2
SMELS 2 FINAL 23 09 08 125

Final Report
C.4.5 Overall Staffordshire Moorlands has a much older population than all areas and the distribution has changed little since 2004. Those aged 0-29 years old account for only 31.5% of the total compared to 37.7% and 37.3% in the West Midlands and England & Wales respectively although Congleton and Macclesfield have fairly small proportions also at 32.6% and 31.8% respectively. There are also a smaller proportion of persons in the median age group, 30-49 years old, at 27.6% compared to 28.8% in England & Wales. In line with this the proportion of the population that are aged over 50 is much higher than all areas at 40.9% compared to 33.9% nationally.
C.4.6 Also as a direct consequence of an ageing population the working age population accounts 65.2% of the total in Staffordshire Moorlands which is the lowest of all areas.
Population Projections C.4.7 Long term subnational population projections are an indication of the future trends in population by
age and sex over the next 25 years. These projections also feed into the supply-side employment forecasting.
C.4.8 ONS provides population projections which are trend based projections, which means assumptions for future levels of births, deaths and migration are based on observed levels over the previous five years. They show what the population will be if recent trends in these continue. The projections do not take into account any future policy changes that have not yet occurred.
C.4.9 These projections, published on 27 September 2007 are based on the revised 2004 mid year population estimates (published 22 August 2007).
C.4.10 Tables A.22 and A.23 below and Figure C.7 overleaf explore the ONS population projections for all areas.
C.4.11 Overall the population of Staffordshire Moorlands is projected to grow slowly, at 0.18% per annum compared to growth of 0.28% and 0.29% at the county and regional levels respectively. Furthermore the working age population of the district is forecasted to decline, the highest with Staffordshire of all areas, as the age profile of the total population ages. This will have a direct impact on the supply side employment forecasts.
Table C.C.13 - ONS Population Projections 2004/29, 000s
2004 2016 2029 Annual Growth Rate 2004/29
Staffordshire Moorlands 95 97 99 0.18 Stoke on Trent 239 234 232 -0.11 Newcastle-under-Lyme 124 127 130 0.20 Congleton 92 96 100 0.33 Macclesfield 150 152 157 0.18 Staffordshire 817 849 876 0.28 West Midlands 5,327 5,522 5,732 0.29
Table C.C.14 - ONS Working Population Projections 2004/29
2004 2016 2029 Annual Growth Rate 2004/29
Staffordshire Moorlands 61.7 59.4 56.1 -0.38 Stoke on Trent 158.0 150.9 150.9 -0.18 Newcastle-under-Lyme 81.8 81.1 78.8 -0.15 Congleton 60.4 59.0 57.5 -0.20 Macclesfield 96.3 94.0 91.6 -0.20 Staffordshire 61.7 59.4 56.1 -0.38 West Midlands 3,465.1 3,500.8 3,471.3 0.01
Source: ONS Population Projections, 2004/29 Revised
SMELS 2 FINAL 23 09 08 126

Final Report
Figure C.6 - Indexed Population Projections, 2004/29 (2004=100)
97.0
99.0
101.0
103.0
105.0
107.0
109.0
2004
2005
2006
2007
2008
2009
2010
2011
2012
2013
2014
2015
2016
2017
2018
2019
2020
2021
2022
2023
2024
2025
2026
2027
2028
2029
Staffordshire Moorlands Stoke on Trent Newcastle-under-Lyme CongletonMacclesfield Staffordshire West Midlands
Source: ONS Population Projections, 2004/29 Revised
SMELS 2 FINAL 23 09 08 127

Final Report
SMELS 2 FINAL 23 09 08 128
Economic Activity
7072747678808284868890
2004 2005 2006 2007
Staffordshire Moorlands Newcastle under Lyme Stoke on Trent
Congleton Macclesfield Staffordshire
West Midlands England & Wales
C.4.12 The ELS review in 2004 found that Staffordshire Moorlands has had very high economic activity rates since 2000, which has continued to be the case since 2004. Rates have been consistently high and only exceeded by Congleton or Macclesfield from 2004/07.
Figure C.7 - Economic Activity 2004/07
Source: Annual Population Survey, 2006
Unemployment
0.0
1.0
2.0
3.0
4.0
5.0
6.0
7.0
1996 1997 1998 1999 2000 2001 2002 2003 2004 2005 2006 2007 2008
Staffordshire Moorlands Stoke on Trent Newcastle-under-LymeCongleton Macclesfield StaffordshireWest Midlands England & Wales
C.4.13 Unemployment was also found to be consistently lower than all the wider areas, which remains the case since 2004, where the rate has been very low and similar to Congleton and Macclesfield. Clearly the level is much lower than the two districts within the West Midlands but also the region as a whole.
Figure C.8 - Unemployment1996/2008

Final Report
SMELS 2 FINAL 23 09 08 129
Source: Claimant Count, NOMIS
Wages C.4.14 The update of wage levels post 2004, given the much higher resident to workplace wages,
indicates that there is still a strong pattern of out-commuting from Staffordshire Moorlands to better paid jobs outside the district.
C.4.15 This situation is shared by most of the other districts also especially Congleton and Macclesfield which have very high resident to workplace wages.
C.4.16 Overall wages, both resident and workplace wages, in Staffordshire Moorlands are higher than the regional rates and similar to Staffordshire but significantly behind the national rates and high levels seen in Congleton and Macclesfield.
Table C. C.15 - Resident Weekly Wages, 2003/07
2002 2003 2004 2005 2006 2007
Staffordshire Moorlands 392 386 400 421 456 437 Newcastle-under-Lyme 341 350 368 397 405 457 Stoke on Trent 316 319 334 354 361 382 Congleton 421 476 473 469 475 515 Macclesfield 455 496 507 536 560 560 Staffordshire 385 389 405 421 436 452 West Midlands 366 379 393 405 416 430 England and Wales 395 409 423 435 448 460
Table C.C.16 - Workplace Weekly Wages, 2003/07
2002 2003 2004 2005 2006 2007
Staffordshire Moorlands 359 358 362 394 394 394 Newcastle-under-Lyme 321 335 363 377 371 401 Stoke on Trent 326 323 329 350 361 394 Congleton 349 361 385 396 398 412 Macclesfield 408 450 430 439 460 491 Staffordshire 360 366 387 393 402 417 West Midlands 367 378 392 402 413 430 England and Wales 394 408 423 434 447 460
Source: Annual Survey of Hours and Earnings, NOMIS
Occupational Profile C.4.17 Table C.27 provides an update of the occupational profile of Staffordshire Moorlands for 2006.
C.4.18 There is a higher proportion of those employed in the higher skilled occupations (SOC groups 1-3) at 33.7% than in 2004 (31%), however, it is still much lower than the county, regional and national figures whilst the rate in Congleton and Macclesfield are particularly high at 42.5% and 56.0%.
C.4.19 There is also still a low proportion of persons employed in service occupations (SOC groups 6-7) at 14.5% compared to 15.6% regionally and nationally.
C.4.20 In line with this there are, as in 2004, a higher proportion of persons employed in administration and skilled trade occupations compared to the wider areas. Also in line with the dominance of manufacturing in the area there is a higher proportion of persons in lower skilled occupations.

Final Report
Table C.C.17 - Occupational Profile, as % of all in employment
Staf
ford
shire
M
oorla
nds
Stok
e on
Tre
nt
New
cast
le u
nder
Ly
me
Con
glet
on
Mac
cles
field
Staf
ford
shire
Wes
t Mid
land
s
Engl
and
& W
ales
SOC Major Group 1-3 33.7 30.7 36.0 42.5 56.0 38.9 39.1 42.9 Managers and senior officials
8.2 11.1 15.0 17.9 19.5 13.8 14.7 15.6
Professional occupations 11.2 8.0 10.3 8.2 21.0 11.9 12.1 13.0 Associate professional & technical occupations
14.3 11.6 10.7 16.4 15.5 13.2 12.3 14.3
SOC Major Group 4-5 27.4 22.3 22.3 25.6 19.4 25.3 23.8 22.7 Administrative and secretarial occupations
14.8 8.9 8.7 15.1 9.9 13.1 11.7 11.9
Skilled trades occupations 12.6 13.4 13.6 10.5 9.5 12.2 12.1 10.8 SOC Major Group 6-7 14.5 21.0 16.4 15.1 11.3 15.0 15.6 15.6 Personal service occupations
9.2 10.2 9.2 5.5 5.9 7.5 8.1 8.0
Sales and customer service occupations
5.3 10.8 7.2 9.6 5.4 7.5 7.5 7.6
SOC Major Group 8-9 24.3 25.8 23.9 16.9 13.1 20.6 21.0 18.5 Process, plant and machine operatives
11.3 11.4 5.8 8.5 4.0 8.6 9.0 7.1
Elementary occupations 13.0 14.4 18.1 8.4 9.1 12.0 12.0 11.4 Source: Annual Population Survey, 2006
SMELS 2 FINAL 23 09 08 130

Final Report
C.5 Travel to Work C.5.1 The travel to work maps in the original ELS still stand as the most up to date data, which is based
on the 2001 Census, therefore Figures E.15 and E.16 in Section E.7 of Appendix E of the ELS should be examined along with this section.
C.5.2 In total using Origin Destination statistics from the 2001 Census there were a total of 42,257 trips from wards in Staffordshire Moorlands to other wards; of these 23,403 were trips to wards within the Staffordshire Moorlands, which gives 18,854 trips to wards outside the district. There were a total of 33,242 trips to Staffordshire Moorlands from other wards, of these 23,403 were from wards within the Staffordshire Moorlands hence 9,839 trips were from wards outside the district. This gives a net out commuting level of 9,015 trips.
C.5.3 Here this analysis is added to by using the UK Travel Flows dataset available from the 2001 Census.
Table C.C.18 - Travel Flows from Staffordshire Moorlands
Area of workplace Total People % of total flows from Staffordshire Moorlands
Regional Level West Midlands 39,541 86.8 North West 4,469 9.8 East Midlands 1,090 2.4 District Level Staffordshire Moorlands 23,535 51.6 Stoke-on-Trent UA 10,154 22.3 Newcastle-under-Lyme 2,059 4.5 Congleton 1,984 4.4 Stafford 1,622 3.6 East Staffordshire 1,394 3.1 Macclesfield 1,192 2.6 Derbyshire Dales 398 0.9 Crewe and Nantwich 384 0.8 High Peak 244 0.5 Manchester 225 0.5 Stockport 192 0.4 Derby UA 150 0.3 Birmingham 117 0.3 South East 117 0.3
Source: UK Travel Flow Data, 2001 Census. Only those districts with over 100 trips are included.
C.5.4 The majority of travel to work journeys from residents of Staffordshire Moorlands, using this measure, are at a regional level within the West Midlands itself, 86.8% of the total. Leaving aside journeys within the district itself the majority within the West Midlands were to Stoke on Trent, however, journeys to Newcastle-under-Lyme were also fairly high.
C.5.5 Outside of the West Midlands, journeys were highest to the North West, almost 10% of all journeys. Destinations include Congleton, Macclesfield, Crewe and Nantwich, Manchester and Stockport.
C.5.6 It is important to note that not all destinations are listed above and residents from the district do travel fairly far across the UK.
SMELS 2 FINAL 23 09 08 131

Final Report
SMELS 2 FINAL 23 09 08 132