final report - era.daf.qld.gov.au
TRANSCRIPT

Final Report
Understanding apple and pear production systems in a changing climate
Heidi Parkes
The Department of Agriculture and Fisheries (DAF)
Project Number AP12029
AP12029
This project has been funded by Horticulture Innovation Australia Limited using the Apple and Pear Industry levy and funds from the Australian Government Additional financial support was contributed by Department of Agriculture and Fisheries (Qld) Department of Economic Development Jobs Transport and Resources (Vic) Department of Agriculture and Food Western Australia Pomewest (WA) and University of Tasmania
Hort Innovation makes no representations and expressly disclaims all warranties (to the extent permitted by law) about the accuracy completeness or currency of information in Understanding apple and pear production systems in a changing climate
Reliance on any information provided by Hort Innovation is entirely at your own risk Hort Innovation is not responsible for and will not be liable for any loss damage claim expense cost (including legal costs) or other liability arising in any way (including from Hort Innovation or any other personrsquos negligence or otherwise) from your use or non-use of Understanding apple and pear production systems in a changing climate or from reliance on information contained in the material or that Hort Innovation provides to you by any other means
ISBN 978-0-7341-4336-5
Published and distributed by Hort Innovation Level 8 1 Chifley Square Sydney NSW 2000 Tel (02) 8295 2300 Fax (02) 8295 2399 copy Copyright 2017
2
Contents
Summary 5
Keywords 6
Key personnel 6
Introduction 7
Project objectives 7
General methodology 9
Research methodology 9
Development and extension methodology 11
Outputs 13
Grower publications 13
Grower workshops 13
Websites and tools 13
Technical working group meetings 13
Industry surveys 14
Industry articles 14
Industry conferences 15
Stakeholder and grower engagement 16
Reports 17
Media items 17
Project web pages factsheets and online information 18
Scientific conferences 19
Datasets 19
Post-graduate student projects 19
Outcomes 20
Historical climate trends and future scenarios 20
Impacts of warming autumn winter and spring temperatures on flowering and options for adaptation
24
Impacts of increased frequency of extreme heat days on fruit quality and options for adaptation 32
3
Impacts of warming temperatures on yield 37
Communication development and extension 37
Evaluation and Discussion 39
Measuring project impact 39
Effectiveness of project activities in delivering project outputs and achieving intended outcomes 40
Feedback on activities and quality and usefulness of project outputs 41
Key learnings 42
Recommendations 46
Industry 46
Extension and communications 47
Scientific 47
Scientific Refereed Publications 50
Intellectual PropertyCommercialisation 51
Acknowledgements 52
Appendices 53
References 54
Table of figures
Figure 1 Research sites were located in Applethorpe (Qld) Shepparton (Vic) Manjimup (WA) and
Huonville (Tas) Orange (NSW) and Mt Barker (SA) were included in the climate data analysis 12
Figure 2 Annual anomaly in accumulation of chill portions (1 Mar to 31 Aug) Anomalies are the
difference between the yearly value and a base period of 1981 to 2010 The black line is an 11-year
moving average 21
Figure 3 Annual anomaly in average number of days where maximum temperature exceeds 35deg C
Anomalies are expressed as the difference between the yearly value and a base period of 1981 to 2010
The black line is an 11-year moving average 22
Figure 4 Chill accumulation in Shepparton Applethorpe and Manjimup in 2012 to 2015 Number in
brackets is the total chill portions received up to 31 Aug 24
Figure 5 Green tip (green) and full bloom (pink) dates for apple cultivars in Applethorpe Shepparton and
Manjimup Data is the average of observations from 2012 to 2015 with bars indicating the confidence
interval 25
Figure 6 The Chill-Overlap Model for flowering in apple Cr is minimum chill required for flowering Co is
4
the maximum additional chill that will reduce the heat requirement Hr is the heat required when Co chill
is accumulated and Ho is the maximum possible heat requirement for flowering (Redrawn from
Darbyshire et al 2016) 28
Figure 7 Variable bud burst and flowering in Cripps Pink Manjimup spring 2014 30
Figure 8 Green tip first flower and full bloom in Gala apples treated with and without dormancy
breaking sprays Dormexreg Waikenreg and Erger in Huonville Applethorpe and Manjimup in 2015 31
Figure 9 Fruit surface temperature (degC) recordings and related air temperatures (degC) Necrosis and
browning fruit surface temperature thresholds represent 52 and 478 degC respectively Figure sourced
from Darbyshire et al 2015 33
Figure 10 Western Australian netting demonstration site at the Lyster Matijari Orchard Manjimup 36
Figure 11 Fruit surface temperature (FST) and air temperature measured in the black net white net and
no net rows at the Lyster Matijari orchard (Manjimup) from February to mid-March 2014 36
Table of tables
Table 1 Average chill portions (1 Mar to 31 Aug) for 2030 and 2050 using a minimum to medium
(RCP45) and worst (RCP85) case scenario The average is of 30 years with the lowest and highest chill
portions in brackets 23
Table 2 Chilling requirements of apple cultivars and a crab apple polliniser cultivar measured in chill
portions chill units and chill hours 27
Table 3 Average date of full bloom for lsquoCripps Pinkrsquo apple in 2030 and 2050 using a minimum to medium
(RCP45) and worst case scenario (RCP85) modelling approach 29
Table 4 Distribution of potential damage days in January for sites in Australiarsquos growing regions for 10th
50th and 90th percentiles of data Table sourced from Darbyshire et al 2015 33
Table 5 Average sunburn browning risk (percentage of days in the January to February period) for lsquoRoyal
Galarsquo apples grown at sites across Australia with and without netting 35
Table 6 Barriers to communication and extension around climate change adaptation 41
5
Summary The objective of this project was to reduce the vulnerability of the Australian apple and pear industry to
climate change by investigating the potential impacts of a changing climate on winter chill flowering
fruit sunburn and yield exploring the effects of adaptation such as netting and dormancy-breaking
products and developing and extending appropriate adaptive responses to industry The project used a
broad range of research and technology transfer activities encompassing field observational data
collection controlled environment experimentation biophysical modelling website development
communication and extension
Australia has undergone a consistent warming trend since 1910 however analysis of historical climates
undertaken in this project indicated that the experience of climate change has been different in each
pome fruit growing region For example milder pome fruit growing regions of Australia have experienced
a decline in annual winter chill accumulation since 1968 while the colder regions of Huonville and Orange
have not changed In modelling studies of future climate scenarios warmer locations were projected to
experience a reduction in winter chill of more than 20 by 2050 with a decline of less than 10 to 14
projected for the coldest production areas over the same period
Flowering observations from 2012 to 2015 indicated that low winter chill in Manjimup was associated with
greater variability in flowering dates between seasons cultivars and individual trees and irregular and protracted flowering across most apple cultivars relative to Applethorpe and Shepparton The variable
pattern of flowering observed in Manjimup was likely the result of mild winter conditions and inadequate
chilling for some cultivars Use of climate analogues and modelling analyses suggest that milder winter
growing regions of Australia are likely to experience symptoms of inadequate chilling with increasing
frequency in future years
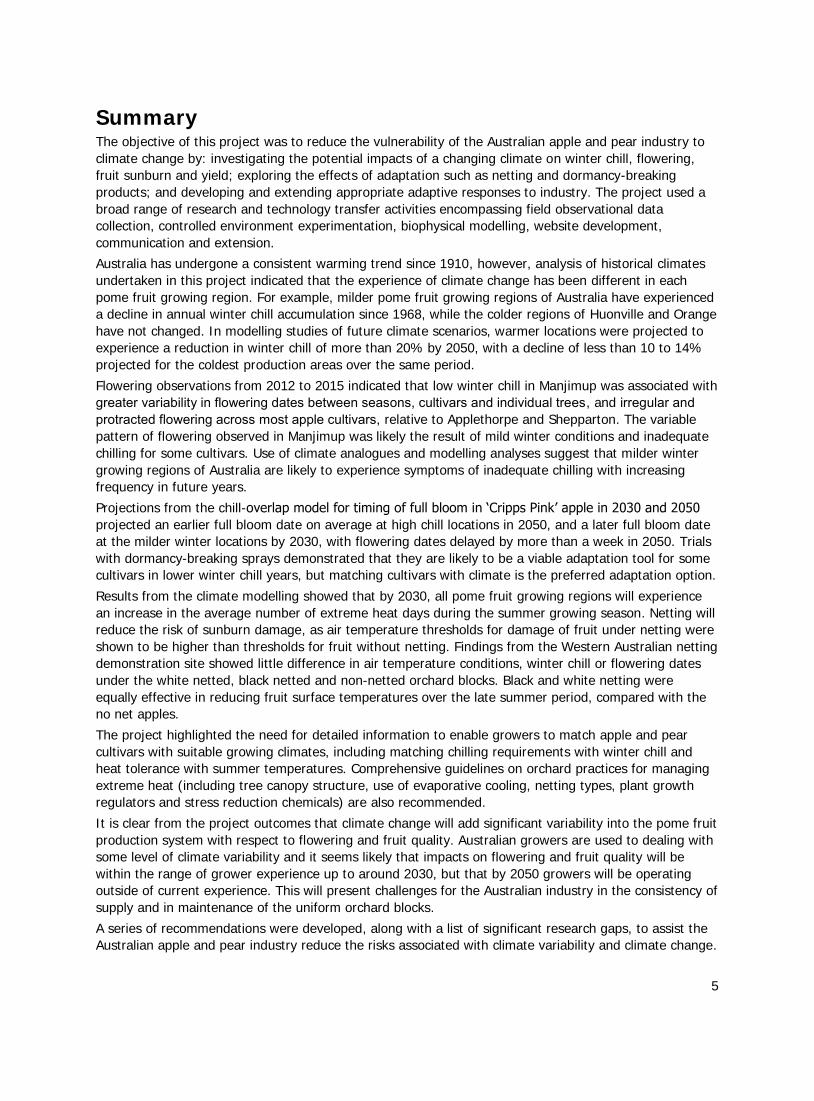
Projections from the chill-overlap model for timing of full bloom in lsquoCripps Pinkrsquo apple in 2030 and 2050
projected an earlier full bloom date on average at high chill locations in 2050 and a later full bloom date
at the milder winter locations by 2030 with flowering dates delayed by more than a week in 2050 Trials
with dormancy-breaking sprays demonstrated that they are likely to be a viable adaptation tool for some
cultivars in lower winter chill years but matching cultivars with climate is the preferred adaptation option
Results from the climate modelling showed that by 2030 all pome fruit growing regions will experience
an increase in the average number of extreme heat days during the summer growing season Netting will
reduce the risk of sunburn damage as air temperature thresholds for damage of fruit under netting were
shown to be higher than thresholds for fruit without netting Findings from the Western Australian netting
demonstration site showed little difference in air temperature conditions winter chill or flowering dates
under the white netted black netted and non-netted orchard blocks Black and white netting were
equally effective in reducing fruit surface temperatures over the late summer period compared with the
no net apples
The project highlighted the need for detailed information to enable growers to match apple and pear
cultivars with suitable growing climates including matching chilling requirements with winter chill and
heat tolerance with summer temperatures Comprehensive guidelines on orchard practices for managing
extreme heat (including tree canopy structure use of evaporative cooling netting types plant growth
regulators and stress reduction chemicals) are also recommended
It is clear from the project outcomes that climate change will add significant variability into the pome fruit
production system with respect to flowering and fruit quality Australian growers are used to dealing with
some level of climate variability and it seems likely that impacts on flowering and fruit quality will be
within the range of grower experience up to around 2030 but that by 2050 growers will be operating
outside of current experience This will present challenges for the Australian industry in the consistency of
supply and in maintenance of the uniform orchard blocks
A series of recommendations were developed along with a list of significant research gaps to assist the
Australian apple and pear industry reduce the risks associated with climate variability and climate change
6
Keywords Climate change scenarios climate change impact climate change adaptation dormancy winter chill
flowering extreme heat sunburn browning netting
Key personnel
Department of Agriculture and Fisheries Queensland
Heidi Parkes (project leader) Neil White Osi Tabing Peter Nimmo Allan McWaters John Wilkie and
Clinton McGrath
Department of Economic Development Jobs Transport and Resources Victoria
Ian Goodwin Jenny Treeby Lexie McClymont and Susanna Turpin
Pomewest Western Australia
Susie MurphyWhite
Department of Agriculture and Food Western Australia
Lisa Starkie and Martine Combret
Tasmanian Institute of Agriculture University of Tasmania
Sally Bound
University of Melbourne
Rebecca Darbyshire (leader of the Federal Department of Agriculture funded project lsquoCrossing the
threshold adaptation tipping points for Australian fruit treesrsquo and project collaborator)
7
Introduction Australiarsquos climate has warmed since 1910 and is likely to continue warming with more hot days and
fewer cold days expected in the future (State of the climate 2016) Research has broadly identified a
range of potential impacts of climate change on the productivity and profitability of the Australian apple
and pear industry including inadequate winter chilling increased fruit sunburn and changes to the upper
limit of pome fruit productivity (Darbyshire et al 2013b Putland et al 2011) However the nature and
timing of these potential impacts in different growing regions across Australia remains unclear
Understanding climate change impacts is essential for the timely implementation of appropriate
adaptation strategies (Cobon et al 2009)
Future changes in climate are predicted to result in reduced winter chilling in many apple and pear
growing regions of Australia (Darbyshire et al 2013b Hennessy et al 1995) It is not yet clear what the
impact of this will be on the timing and quality of bud dormancy release and flowering in commercial
pome fruit cultivars and therefore the potential impacts on productivity Advancement in flowering with
increased historical temperature has been observed in temperate fruit trees globally (Legave et al
2013) however effects of recent warming on flowering in Australian pome trees are less obvious
(Darbyshire et al 2013a) Options for adaptation to lower winter chill include appropriate cultivar
selection and the use of plant growth regulators however current understanding around cultivar chilling
requirements and the use of dormancy-breaking sprays to compensate for a lack of winter chill is poor
The risk of fruit sunburn damage is likely to increase under future climates and associated rising summer
temperatures Predictions regarding changes to sun damage risk and evaluation of adaptation options are
therefore important for future planning In Australia apple growers currently estimate typical losses to
vary from 6 to 30 depending on season and fruit cultivar (Lolicato 2011)
Netting has been identified as a potential climate change adaptation strategy to reduce fruit exposure to
solar radiation and hence reduce sunburn damage while also providing protection from hail events
Practical questions remain on the use of hail netting particularly in warm growing regions including the
effect of different types of netting (weave density and colour) on temperature fruit quality and yield The
effectiveness of netting as an adaptation strategy to reduce the risk of sunburn browning under predicted
climate change is also unknown
Project objectives The broad objective was to reduce the vulnerability of the Australian apple and pear industry to climate
change through 1) investigation of the overarching research question lsquoWhat are the potential impacts of
a changing climate on apple and pear production in Australia and how can the industry adapt to minimize
the risksrsquo and 2) developing and extending appropriate adaptive responses to industry
Specific objectives for the research component of the project were to
1 Develop climate change scenarios for pome fruit growing regions of Australia in 2030 and 2050
including the likely impact of climate change on winter chill and extreme heat
2 Understand how changes in autumn winter and spring temperatures might impact the timing
and quality of flowering in cultivars of apple and pear
8
3 Identify adaptations to manage any negative effects of climate change on flowering
4 Understand how changes in the frequency of extreme heat days might impact on the incidence of
sunburn in pome fruit and the effectiveness of netting as an adaptation strategy
5 Understand how different colours of netting impact on the orchard environment fruit yield and
quality
6 Understand how the changing climate might impact the yield potential of apples
The development and extension components of the project were targeted at the Australian apple and
pear industry Target groups were apple and pear growers industry consultants Apple and Pear Australia
Limited (APAL) and temperate fruit tree researchers Specific objectives of this component were to
1 Facilitate greater understanding of how the climate is likely to change by 2030 and 2050 in apple
and pear growing regions of Australia how this might impact on apple and pear production and
potential adaptation strategies to reduce the associated risks
2 Increase knowledge and skills to enable informed decision-making around climate change
adaptation and orchard investment and planning based on scientific evidence
3 Build a connected and collaborative approach between research partners funding bodies
industry and growers around managing and adapting to climate change
9
General methodology The objectives were investigated through a broad range of research and technology transfer activities
encompassing field observational data collection controlled environment experimentation biophysical
modelling website development written and oral communication and extension The project combined
research of immediate adaptive responses to current climate risks with long-term climate change impacts
and adaptation The general methodological approach and associated activities undertaken for each of
the stated project objectives are described in this section Details of specific methods are given in the
appropriate appendices as indicated in the text
Research methodology
The approach was to validate and refine models of flowering time fruit surface temperature and yield
potential and use them in conjunction with regional climate projections to model the effects of the
changing climate on apple and pear production systems and the effectiveness of specific adaptation
strategies Climate analogues were also investigated as an alternative approach to understanding climate
change impacts and adaptation
1 Develop climate change scenarios for pome fruit growing regions of Australia in 2030 and
2050 including the likely impact of climate change on winter chill and extreme heat
Future climate scenarios were constructed for two representative concentration pathways (RCPs) RCP45
(minimum to medium case scenario) and RCP85 (worst case scenario) to represent a plausible range of
future climates (Appendix 1) RCPs are greenhouse gas concentration trajectories adopted by the
Intergovernmental Panel on Climate Change in its fifth Assessment Report in 2014 (a detailed description
of these is given in Appendix 1) Scenarios were developed for 2030 and 2050 to support the mid to long-
term orchard decision-making process Trees planted in 2017 will be in their 13th leaf in 2030 the height
of production and therefore planting decisions made now will impact orchard profitability in 2030
Climate projections were not made beyond 2050 due the high degree of climate uncertainty associated
with long-term projections
Climate scenarios were expressed in terms of relevant horticultural metrics (chill portions and number of
sunburn browning risk days) rather than simply as mean temperature changes to enable better
understanding of how warming temperatures might impact pome fruit production
Winter chill was calculated in chill portions using the Dynamic Model (Erez et al 1990 Fishman et al
1987) This is the current lsquobest-practicersquo model and has been shown to perform better than other models
for calculating winter chill particularly in mild winter climates such as Australia (Luedeling et al 2011)
2 Understand how changes in winter and spring temperatures might impact the timing and
quality of flowering in cultivars of apple and pear
Detailed baseline data sets for temperature bud burst and flowering were collected from three
climatically distinct pome fruit growing regions of Australia (Applethorpe Queensland Manjimup
Western Australia Shepparton Victoria Figure 1) for apple and pear cultivars and their pollinisers from
2012 to 2015 Phenology observation and collection methodology was standardised across locations
making this dataset unique in Australia
The data set was used to assess the variation in bud burst and flowering time across locations seasons
10
and cultivars (Appendix 2) and to validate a phenology model (chill overlap model (Darbyshire et al
2016)) for prediction of flowering time in apple now and under future climates (Appendix 1)
Climate analogue analysis involves a detailed comparison between locations where the current climate of
one location is similar to the projected future climate of the location of interest This approach was
investigated using Stanthorpe as a case study to predict impacts of climate change on pome fruit
flowering in Stanthorpe and to identify possible methods for adaptation (Appendix 3)
3 Identify adaptations to manage any negative effects of climate change on flowering
Forced bud experiments using controlled environment conditions were undertaken to determine cultivar
chilling requirements for use by industry in selection of suitable cultivars for different winter chill
climates Methods for collecting bud burst and flowering records were developed for growers to use for
assessing cultivar performance in their local climate (Treeby et al 2017a)
A one-year trial was conducted in three locations (Applethorpe Queensland Manjimup Western
Australia Huonville Tasmania) to determine the efficacy of using dormancy-breaking sprays in Gala as
an adaptation to low winter chill years (Appendix 4)
Potential adaptations were also identified through the capture of grower experiences at national grower
workshops and industry conferences
4 Understand how changes in the frequency of extreme heat days might impact on the incidence
of sunburn in pome fruit and the effectiveness of netting as an adaptation strategy
Two methodological approaches were taken using weather and fruit surface temperature data collected
from two adjacent lsquoRoyal Galarsquo sites in Shepparton Victoria one netted and one non-netted site The first
approach was to determine minimum air temperature thresholds for lsquoRoyal Galarsquo apples grown with and
without net with potential to lead to sunburn damage under current climates (Appendix 5) Once
established these minimum air temperature thresholds were used to investigate the frequency of days
exceeding these threshold air temperatures in current and future climates The future sunburn risk and
the effectiveness of netting in reducing this risk was determined for growing locations around Australia
for 2030 and 2050 (Appendix 1 and 7)
The second approach was to validate the thermodynamic Smart-Sinclair model for prediction of fruit
surface temperature (Appendix 6)
5 Understand how different colours of netting impact on the orchard environment fruit yield
and quality
A netting demonstration site was established over a block of lsquoCripps Pinkrsquo trees in Manjimup Western
Australia to expand on results from existing studies on the effects of netting on air temperature relative
humidity wind and solar radiation (Darbyshire et al 2015 Middleton et al 2002) and to compare the
effects of black and white net on the orchard environment flowering fruit yield and quality (Appendix 8)
6 Understand how the changing climate might impact the yield potential of apples
An apple physiological model MaluSim (Lakso et al 1990) was used to understand the effects of
predicted climate change on net carbon exchange of apples and the upper limit of apple production (yield
11
potential) The model was evaluated for lsquoRoyal Galarsquo with regard to prediction of apple yield under
current Australian conditions in netted and non-netted orchard sites and yield was predicted under
warmer future climate conditions (Appendix 9)
Development and extension methodology
Extension and research activities were coordinated and conducted side-by-side to encourage the flow of
information between growers industry representatives extension officers and researchers throughout
the project with industry feedback continuously informing the research
The technology transfer activities undertaken as part of the extension component are outlined under each
of the following objectives
1 Facilitate greater understanding of how the climate is likely to change by 2030 and 2050 in
apple and pear growing regions of Australia how this might impact on apple and pear
production and potential adaptation strategies to reduce the associated risks
Multiple activities were undertaken to provide information to and obtain feedback from the apple and
pear industry A review of available climate change information relevant to Australian apple and pear
growers was conducted at the project start to identify information needs A grower survey was
performed to gain insight into grower attitudes and knowledge in regards to climate change and its
impacts
Communication and extension was undertaken throughout the project and included two years of national
grower workshops (Appendix 10) regular publications in industry magazines and websites presentations
at industry conferences field days and seminars dedicated project web pages (APAL and Horticulture
Industry Network (HIN)) and general media items
Climate change information specific to Australiarsquos apple and pear industry was published in a series of
three grower publications at the conclusion of the project to communicate key project findings as well as
important climate change information for the industry generally (Treeby et al 2017a Treeby et al
2017b White et al 2017)
2 Increase knowledge and skills to enable informed decision making around climate change
adaptation and orchard investment and planning based on scientific evidence
The grower publications and winter chill website were designed to provide practical information to
growers for use in every day decision making and for long-term strategic planning
3 Build a connected and collaborative approach between research partners funders industry
and growers around managing and adapting to climate change
Relationships between stakeholders were established maintained and developed through
- Regular project teleconferences and face-to-face meetings
- Close links with the University of Melbourne project lsquoCrossing the threshold adaptation
tipping points for Australian fruit treesrsquo undertaken within the Primary Industries Climate
12
Challenges Centre (PICCC)1
- Meetings with APAL staff at the head office in Melbourne at conferences or via phone hook-
up
- Informal links with other apple and pear industry research programs such as the PIPS
program as well as with researchers and industry representatives from other horticultural
industries for example cherries and almonds
- Establishment of the netting demonstration site in Western Australia
- Data collection trials conducted on grower properties which provided avenues for informal
engagement growers
- Involvement and participation in industry conferences and events
- Organisation and participation in national grower workshops
- Involvement with the Climate Change Research Strategy for Primary Industries (CCRSPI)
- Involvement of post-graduate students and work experience students in project activities
Figure 1 Research sites were located in Applethorpe (Qld) Shepparton (Vic) Manjimup
(WA) and Huonville (Tas) Orange (NSW) and Mt Barker (SA) were included in the climate
data analysis
1 httpwwwpicccorgauresearchproject440
13
Outputs
Grower publications
Treeby J Goodwin I MurphyWhite S Darbyshire R White N McClymont L Richards S
Measham P Bound S and Parkes H 2017 Winter chill and flowering ndash what is there to know
Department of Agriculture and Fisheries Queensland
Treeby J Goodwin I MurphyWhite S Darbyshire R White N McClymont L Richards S Webb
L Erwin T and Parkes H 2017 Netting for heat ndash what is there to know Department of
Agriculture and Fisheries Queensland
White N Parkes H and Treeby J 2017 Future climates in pome fruit orchards ndash what is there to
know Department of Agriculture and Fisheries Queensland
Grower workshops
Heidi Parkes Jenny Treeby and Ian Goodwin presented ldquoclimate change impacts and adaptation research
for the pome fruit industryrdquo at Fruit Grower Victoriarsquos end of season review Mooroopna Vic 12
May 2014 httpwwwhincomauassociationsfruit-growersfgv-end-of-season-review
httpwwwhincomauresourcesextreme-heat-powerpoint-may-2014
httpwwwhincomauresourcesapples-and-pears-in-a-changing-climate-powerpoint-may2014
Heidi Parkes Neil White and Clinton McGrath presented an ldquoapple climate change workshoprdquo at
Applethorpe Research Facility Qld 23 July 2014
Heidi Parkes and Susie MurphyWhite presented ldquoapples and pears in a changing climaterdquo at an orchard
walk in Manjimup WA 1 October 2014 httpwwwhincomauassociationsapples-and-
pearspit-stop-wa-for-the-national-roadshow
Heidi Parkes presented a ldquowinter chill and floweringrdquo workshop for the Perth Hills Orchard Improvement
Group at Applethorpe Research Facility Qld 31 July 2015
Clinton McGrath Heidi Parkes and Neil White presented a climate change risk management matrix
workshop in Thulimbah Qld 5 August 2015
Heidi Parkes Rebecca Darbyshire and Jenny Treeby presented a ldquowinter chilling and climate adaptation
workshoprdquo in Bilpin NSW 16 September 2015
Websites and tools
White N and Parkes H 2017 Winter chill and growing degree day website an interactive tool to
calculate and interpret local chill and growing degree day accumulation httpshort-
scienceshinyappsioChillCalculator
Technical working group meetings
Queensland technical working group meeting facilitated by Clinton McGrath Applethorpe Research
Facility Qld 20 August 2013
South Australian technical working group meeting facilitated by Jenny Treeby and Paul James (Lenswood
Co-op) Lenswood SA April 2013
14
Victorian technical working group meeting facilitated by Jenny Treeby and Michael Crisera (Fruit Growers
Victoria) Shepparton Vic October 2013
Industry surveys
A nation-wide survey of apple and pear growers was developed and coordinated by Jenny Treeby (based
on input from DEDJTRrsquos Service Innovations branch) to ascertain growersrsquo attitudes perceptions
and knowledge of climate change 2013 httpswwwsurveymonkeycomsQTG7QKH
A nation-wide survey of apple and pear growers was developed and coordinated by Heidi Parkes Jenny
Treeby and Susie MurphyWhite to gauge grower understanding and perceptions of winter chill
2015
Industry articles
Calderon M 2014 Bud burst in lsquoWilliamsrsquo Pears highly variable Australian Fruitgrower 8(8) 32
Darbyshire R and Parkes H 2014 Whatrsquos the blooming difference Australian Fruitgrower 8(10) 30
Darbyshire R and Parkes H 2015 Get in the chill zone Australian Tree Crop Winter edition pp 14
Darbyshire R Goodwin I and MurphyWhite S 2016 New understandings to better predict apple
flowering- introducing the chill overlap model Australian Fruitgrower JuneJuly edition
httpapalorgauaustralian-fruitgrower-june-july-2016
McClymont L Goodwin I and Sessions W 2013 Net benefits- the sun protection factor in 2050
Australian Fruitgrower 7(6) 28-31
McClymont L Goodwin I and Sessions W 2013 Effectiveness of netting in reducing sun damage Part
I Tree Fruit August 5-8
McClymont L Goodwin I and Sessions W 2013 Effectiveness of netting in reducing sun damage Part
II Tree Fruit September 8-11
MurphyWhite S 2014 Netting the benefits of a changing climate Australian Fruitgrower 8(5) 21
httpapalorgaunetting-benefits-changing-climate
MurphyWhite S 2014 Manjimup apple update- netting quality results for south west apples South-West
AgMemo August issue 5 httpswwwagricwagovaunewsletterssouth-west-agmemo-august-
2014-issue-5page=02C3smartpaging_toc_p3_s0_h2
MurphyWhite S 2014 Blooms affected by winter chill South-West AgMemo October issue 5
httpswwwagricwagovaunewsletterssouth-west-agmemo-october-2014-issue-
5page=02C2smartpaging_toc_p2_s0_h2
MurphyWhite S 2015 Investigating fruit surface temperature in apples South West AgMemo February
issue 1 httpswwwagricwagovaunewsletterssouth-west-agmemo-february-2015-issue-
1page=08smartpaging_toc_p8_s0_h2
MurphyWhite S Prince R and Starkie L 2016 Black or white netting Is there a difference Or just a
preferencehellip WA Grower Autumn 68 - 70 httppomewestnetauwp-
contentuploadsnewslettersWAGROWERAutumn16_POMEWESTPDF
MurphyWhite S Prince R and Starkie L 2016 Black or white netting Is there a difference Or just a
preferencehellip VegetablesWA Autumn 71 - 73 httpwwwvegetableswacomauwa-growers-
magazine
15
MurphyWhite S Prince R and Starkie L 20152016 Black or white netting which is best Australian
Fruitgrower 9(11) 22 ndash 24 httpapalorgaublack-or-white-netting-which-is-best
Parkes H 2015 Producing Apples and Pears in a changing climate Australian Tree Crop Winter edition
26
Parkes H 20152016 Sharing ideas to climate change-proof orchards Australian Fruitgrower 9(11) 12
httpapalorgausharing-ideas-to-climate-change-proof-orchards
Parkes H MurphyWhite S and Bound S 2016 Dormancy-breaking sprays for low chill years
Australian Fruitgrower AugSept httpapalorgaudormancy-breaking-sprays
Parkes H MurphyWhite S and Bound S 2016 Dormancy-breaking sprays for low chill years (Part 1
and 2) Tree Fruit AugSept httpwwwtreefruitcomauorchardcrop-growth-
managementitem712-dormancy-breaking-sprays-for-low-chill-years
httpwwwtreefruitcomauorchardcrop-growth-managementitem723-dormancy-breaking-
sprays-for-low-chill-years-part-2
Parkes H White N and Darbyshire R 2015 Winter chill how did 2014 compare with previous years
Australian Fruitgrower 9(3) 32 ndash 33 httpapalorgauwinter-chill-how-did-2014-compare-with-
previous-years
Prince R and MurphyWhite S 2015 Netting trial results in WA Australian Fruitgrower 9(9) 26 - 29
httpapalorgaunetting-trial-results-in-wa
Thomson G McClymont L Goodwin I 2014 Sunburn protection Part 1 Adapt and limit apple sunburn
during heatwaves Tree Fruit November 5ndash9
Thomson G McClymont L Goodwin I 2014 Part 2 Orchard design tree training and pruning for
apple sunburn reduction Tree Fruit December 3ndash6
Thomson G McCaskill M McClymont L Goodwin I 2015 Part 3 Fruit protection with spray-on
products shade-netting or evaporative cooling can help reduce sunburn during heatwaves Tree
Fruit January 3ndash5
Thomson G McCaskill M McClymont L Goodwin I 2015 Part 4 Fruit protection with spray-on
products shade-netting or evaporative cooling can help reduce sunburn during heatwaves Tree
Fruit February-March 3ndash4
Thomson G McCaskill M McClymont L Goodwin I 2015 Part 5 Fruit protection with spray-on
products shade-netting or evaporative cooling can help reduce sunburn during heatwaves Tree
Fruit April 3ndash4
Treeby J 2014 Apple and pears weathering the climate Australian Fruitgrower 8(2) 18
Treeby J 2014 Research Roadshows on coping with extreme weather Australian Fruitgrower 8(10) 11
Wilkie J Combret M Goodwin I McGrath C McClymont L Middleton S Nimmo P Starkie L
Tabing O and Treeby J 2013 The apple and pear climate change research program Australian
Fruitgrower 7(6) 20-23
Industry conferences
MurphyWhite S 2015 Netting the benefits of climate change APAL Speed Updating Day National
Horticulture Convention Gold Coast 25 June httpapalorgauresearch-development-
extensionprojectsresearch-reviews
16
Parkes H 2015 Towards understanding bud burst and flowering in a changing climate approaches to
research and extension APAL Speed Updating Day National Horticulture Convention Gold Coast
25 June httpapalorgauresearch-development-extensionprojectsresearch-reviews
Parkes H 2016 Reducing vulnerability to a changing climate in Australian temperate fruit tree industries
CCRSPI 2016 conference- striving for climate resilience Sydney 27-28 April
httpwwwccrspinetaureducing-vulnerabilities-temperature-extremes
Parkes H 2016 Winter chill how much is enough for profitable yields APAL Industry Updating Day
National Horticulture Convention Gold Coast 23 June httpapalorgauwp-contentuploads5-
Heidi-Parkes_APAL_Industry_Updating_2016_withnotescompressedpdf
Wilkie J 2013 Understanding apple and pear production systems in a changing climate APAL speed
updating day Apple and Pear Industry Conference Gold Coast 17 July
Stakeholder and grower engagement
Lexie McClymont 2013 Outcomes from the fruit temperature and yield modelling research Fruit Growers
Victoria Young Growerrsquos group (Goulburn Valley) Shepparton Vic 24 October
Lexie McClymont 2013 Climate change and Horticulture - Impacts and Adaptation Meeting with DEPI
Deputy Secretary James Flintoft Tatura Vic 15 November
Heidi Parkes 2013 Understanding apple and pear production systems in a changing climate DAFFQ
regional stakeholders meeting Applethorpe Qld 26 November
Ian Goodwin 2014 Apple and pear productivity Reducing weather losses Meeting with DEPI Deputy
Secretary James Flintoft Tatura Vic 7 February
Susie MurphyWhite 2014 Extreme temperatures and sunburn Netting demonstration site orchard walk
Manjimup WA 23 April
Heidi Parkes 2014 Climate change impacts and adaptations for horticultural industries EE Muirs Pty Ltd
growerrsquos evening Stanthorpe Qld 23 October
Ian Goodwin 2015 Climate change project progression DEDJTR Victoria group Rural Development and
Transition Policy Tatura Vic 3 March
Heidi Parkes 2015 Approaches and challenges to studying climate change impacts on apple production
Applethorpe Research Facility open day Applethorpe Qld 1 April
Susie MurphyWhite 2015 Dynamic chill portions for pome fruit in WA Donnybrook Apple Festival WA 4
ndash 5 April
Jenny Treeby Susie MurphyWhite Rebecca Darbyshire and Heidi Parkes 2015 Winter chill poster- A bit
chilly Climate change project stand as part of the DEDJTR booth National Horticulture
Convention Gold Coast 25 - 27 June
Heidi Parkes 2015 Current research in the area of apple production in a changing climate Applethorpe
Research Facility Qld 24 November
Heidi Parkes 2015 Current and future research into climate change impacts and adaptation for the
Horticulture industry DAF South Regional Leaders Team and the Director General Applethorpe
Research Facility Qld 25 November
17
Susie MurphyWhite 2016 Dormancy-breaking spray trial Pomewest Growers Meeting Manjimup WA
17 May
Ian Goodwin 2016 Dealing with seasonal climate risk and extreme weather events Regional Innovation
Forum Tatura Vic 18 May httpwwwhincomauassociationshorticulture-centre-of-
excellenceregional-innovation-forum
Heidi Parkes 2016 Winter chill website Stanthorpe Apple Growerrsquos meeting Applethorpe Research
Facility Qld 26 May
Reports
Darbyshire R and McClymont L 2016 Assessing the potential yield model lsquoMaluSimrsquo The University of
Melbourne and Department of Economic Development Jobs Transport and Resources 27 pp
MurphyWhite S Prince R and Starkie L 2016 Western Australian apple netting demonstration site
Pomewest 24 pp
Parkes H and White N 2016 Flowering in pome fruit trees across Australia implications of a changing
climate Department of Agriculture and Fisheries Queensland 21 pp
Parkes H and White N 2016 A climate analogue approach to understanding the impact of climate
change on flowering in Australian temperate fruit trees Department of Agriculture and Fisheries
Queensland 17 pp
Parkes H MurphyWhite S and Bound S 2016 Dormancy-breaking sprays for low winter chill in
apples Department of Agriculture and Fisheries Queensland Pomewest University of Tasmania
28 pp
Treeby J 2013 Review of current apple and pear climate change grower information Department of
Economic Development Jobs Transport and Resources 6 pp
httpwwwhincomauresourcesreview-of-current-apple-and-pear-climate-change-information-
for-growers
Treeby J 2016 Understanding apples and pears in a changing climate overview of the grower
workshops Department of Economic Development Jobs Transport and Resources 5 pp
White N 2016 Analysis of historical and future climate and the production of pome fruit Department of
Agriculture and Fisheries Queensland 29 pp
Media items
ldquoNew Development Officer to continue research into climate changerdquo was published in AgMemo South
West Agricultural Region February 2014 Issue 1 The article introduced Susie Murphy White to
the West Australian growers httpswwwagricwagovaunewsletterssouth-west-agmemo-
2014-issue-1page=02C1smartpaging_toc_p1_s0_h2
Susie MurphyWhite 14 March 2014 Interviewed by ABC Rural on the Manjimup netting trial ldquoStates first
trial tests heat impactsrdquo httpwwwabcnetaunews2014-03-17apple-netting-trial5326112
Susie MurphyWhite 25 March 2014 Interviewed by GWN7 rural news on the use of netting to reduce
sunburn
18
lsquoClimate threats studiedrsquo was published in The Border Post and Warwick Daily News Southern Downs
Qld 16 December 2014 Heidi Parkes was interviewed for the article
httpwwwruralweeklycomaunewsclimate-threats-studied2485263
lsquoA model for the futurersquo was published in the Bush Telegraph Southern Downs Qld 9 April 2015 The
article featured a summary of the presentation given by Heidi Parkes on the climate change
research program at the Applethorpe Research Facility open day
Horticulture Innovation Australia media release 13 April 2015 Reducing the vulnerability of apple and
pear production to a changing climate
Heidi Parkes 21 April 2015 Interviewed by Australian Rural Communication Network on reducing the
vulnerability of apple and pear production to a changing climate
lsquoClimate research crucial for apple and pear growers in Australiarsquo was published by The Weekly Times
Vic 8 July 2015 Heidi Parkes was interviewed for the article following the Speed Updating Day
presentation at the National Horticulture Convention
httpwwwweeklytimesnowcomauagribusinesshorticultureclimate-research-crucial-for-apple-
and-pear-growers-in-australiastory-fnker6g8-1227431799897
Susie MurphyWhite 18 August 2015 Interviewed by ABC local radio morning rural report on the progress
of winter chill in the South West of WA
Heidi Parkes 28 October 2015 Interviewed by the ABC Country hour Tasmania during the Greenhouse
2015 conference in Hobart on the potential impacts of warming climate on Australiarsquos apple and
pear industry
Heidi Parkes 23 June 2016 Interviewed live by the ABC Country hour during the 2016 National
Horticulture Convention on potential impacts of warming climate on Australiarsquos apple and pear
industry
Project web pages factsheets and online information
Horticulture Industry Network project page httpwwwhincomauprojectsapple-and-pear-production-
in-a-changing-climate
Apple and Pear Australia Limited project page httpapalorgauresearch-development-
extensionprojectsclimate-change
Regional chill factsheets httpwwwhincomauregional-chill-accumulation-victoria
httpwwwhincomauregional-chill-accumulation-queensland
httpwwwhincomauregional-chill-accumulation-for-new-south-wales
httpwwwhincomauregional-chill-accumulation-for-south-australia
httpwwwhincomauregional-chill-accumulation-for-tasmania
httpwwwhincomauregional-chill-accumulation-for-western-australia
Jenny Treeby 15 May 2015 httpwwwhincomauprojectsapple-and-pear-production-in-a-changing-
climateexplore-your-regional-climate
Heidi Parkes 4 November 2014 httpwwwhincomauprojectsapple-and-pear-production-in-a-
changing-climatewill-extreme-october-heat-impact-on-fruit-size
Heidi Parkes 6 December 2013 httpapalorgaua-discussion-on-dormancy-and-why-its-worth-
thinking-about-in-early-december
19
Scientific conferences
Parkes HA Tabing O McClymont L Combret M and Wilkie JD 2014 Variation in the Flowering
Phenology of Apple and Pear in Australia 29th International Horticulture Congress Brisbane
Convention and Exhibition Centre 17-22 August (Oral presentation)
Parkes HA White NA MurphyWhite S 2015 Understanding the impact of climate change on flowering
in Australian temperate fruit trees Greenhouse 2015 Wrest Point conference center Hobart
Tasmania 26 ndash 30 October (Oral presentation)
Datasets
Spring phenology observations for pome-fruit cultivars in Australia 2013 ndash 2015 Available at
httpsdataqldgovau
Post-graduate student projects
Marco Calderon 2014 Orcharding the future the influence of temperature on pome fruit flowering
across Australia University of Melbourne Masterrsquos Degree
20
Outcomes
Historical climate trends and future scenarios
Historical trends in average temperatures winter chill and heat days
(Appendix 1)
Australia has undergone a consistent warming trend since 1910 (State of the climate 2016) In pome
fruit growing regions across Australia this changing climate has been experienced in different ways at the
local level Changes in average minimum and maximum temperatures experienced in autumnwinter and
springsummer since 1968 differ between regions (appendix 1) The milder growing regions of
Applethorpe Manjimup and Mt Barker have experienced a decline in the number of chill portions over this
period while Shepparton has seen a small reduction in winter chill and the colder regions of Huonville
and Orange have not changed (Figure 2) Increases in the number of extreme heat days have been
experienced in Shepparton and Mt Barker while the last seven years in Manjimup have been above the
long-term average (Figure 3)
21
Applethorpe
Shepparton
Manjimup Huonville
Orange Mount Barker
Figure 2 Annual anomaly in accumulation of chill portions (1 Mar to 31 Aug) Anomalies are the difference
between the yearly value and a base period of 1981 to 2010 The black line is an 11-year moving average
22
Applethorpe
Shepparton
Manjimup
Huonville
Orange Mount Barker
Figure 3 Annual anomaly in average number of days where maximum temperature exceeds 35deg C
Anomalies are expressed as the difference between the yearly value and a base period of 1981 to 2010
The black line is an 11-year moving average
23
Climate projections for average winter chill and heat days
(Appendix 1)
Climate projections were developed for minimum to medium (RCP45) and worst case (RCP85) scenarios
for 2030 and 2050 for each of the pome fruit growing regions Winter chill accumulation declined at all
sites in 2030 and 2050 under both scenarios The greatest declines were in the milder growing regions of
Applethorpe and Manjimup (greater than 20 in 2050) and the smallest declines in Huonville and Orange
(around 5 in 2030 and less than 15 in 2050) (Table 1)
By 2050 growers will be managing orchards under a different climatic environment For example in
Applethorpe a low chill year is currently around 60 chill portions This will be a good year in 2050 and
the worst years will be outside the existing range of experience
Table 1 Average chill portions (1 Mar to 31 Aug) for 2030 and 2050 using a minimum to
medium (RCP45) and worst (RCP85) case scenario The average is of 30 years with the
lowest and highest chill portions in brackets
Average chill portions Present
2030 2050
RCP45 RCP85 RCP45 RCP85
Applethorpe 72 (62-83) 63 (48-75) 60 (44-73) 56 (41-69) 51 (36-65)
Shepparton 84 (73-93) 75 (63-85) 74 (62-86) 71 (58-81) 67 (57-79)
Manjimup 67 (55-82) 57 (43-76) 55 (42-75) 50 (36-72) 47 (33-68)
Huonville 105 (94-113) 98 (81-112) 97 (78-110) 93 (74-105) 90 (71-104)
Orange 100 (90-110) 94 (85-104) 93 (82-101) 90 (81-99) 87 (78-94)
Mount Barker 84 (67-93) 74 (55-88) 73 (53-88) 70 (53-84) 65 (47-80)
The climate projections for 2030 and 2050 show that all pome fruit regions across Australia can expect to
experience an increase in the number of extreme heat days during the growing season with the greatest
impacts likely to be in regions such as Shepparton with hot summer climates (data not shown) Impacts
on the risk of sunburn browning in apples are described in the section lsquoPotential impact of an increased
frequency in extreme heat events on the incidence of sunburn and the effectiveness of netting as an
adaptation strategyrsquo on p34
24
Impacts of warming autumn winter and spring temperatures on flowering and
options for adaptation
Understanding relationships between temperature and flowering
1 Variation in flowering of pome fruit trees across Australia
(Appendix 2)
Differences in the pattern of chill accumulation (Figure 4) were accompanied by variability in the timing
and pattern of green tip and flowering between locations and between years (Figure 5) Green tip and full
bloom dates were more variable between years cultivars and individual trees in Manjimup compared with
Applethorpe and Shepparton and trees consistently displayed a more protracted pattern of flowering
(Figure 5) Delayed and uneven flowering are symptoms of inadequate chill and it is likely that the
observed patterns of bud burst and flowering in Manjimup were in response to the mild winter conditions
experienced in that location in 2012 to 2014
Figure 4 Chill accumulation in Shepparton Applethorpe and Manjimup in 2012 to 2015
Number in brackets is the total chill portions received up to 31 Aug
25
Figure 5 Green tip (green) and full bloom (pink) dates for apple cultivars in Applethorpe
Shepparton and Manjimup Data is the average of observations from 2012 to 2015 with bars
indicating the confidence interval
Applethorpe
Shepparton
Manjimup
26
2 Chilling requirements
A collection of apple chilling requirements in chill portions chill units and chill hours were produced for
the mild climatic region of Applethorpe Queensland Australia (Table 2)
The chilling requirements measured were higher across a number of cultivars when compared with
previously published thresholds (Ghariani et al 1994 Hauagge et al 1991) For example Darbyshire et
al (2016) estimated a chilling requirement of 34 chill portions for lsquoCripps Pinkrsquo notably lower than the
chilling requirement of 73 chill portions calculated here Comparison of chilling requirements between
studies is problematic due to the use of vastly different methodologies for threshold determination
(Dennis 2003) Research to understand the genetic basis of progression through the phases of dormancy
is needed to enable accurate definition of cultivar chilling requirements (Cooke et al 2012)
Regardless of these gaps in knowledge the chilling requirements measured using the forced bud
methodology can be used to put apple cultivars into groups with low (lsquoCripps Redrsquo lsquoManchurianrsquo crab
apple) medium (lsquoRS103-110rsquo lsquoGranny Smithrsquo lsquoCripps Pinkrsquo lsquoKaleirsquo) and higher chilling requirements
(lsquoGalaxyrsquo Fujirsquo lsquoHi-Earlyrsquo) These groupings provide practical benefit to industry by enabling growers to
make more informed cultivar and pollinizer choices at planting particularly when considering projected
changes to future climate
A draft manuscript titled lsquochilling requirements of apple varieties grown in mild Australian winter
conditionsrsquo details this work and has been prepared for submission to the journal HortScience
27
Table 2 Chilling requirements of apple cultivars and a crab apple polliniser cultivar measured in chill portions chill units and chill
hours
Cultivar Year Dynamic (CP) meanplusmnsd CV() Utah (CU) meanplusmnsd CV() Chill Hours (CH) meanplusmnsd CV()
Cripps Red 2014 549 57plusmn29 51 947 976plusmn403 41 694 662plusmn445 67
2015 59
1004
631
Manchurian 2014 585 61plusmn36 59 1016 1031plusmn216 21 748 724plusmn332 46
2015 636
10465
701
RS103-110 2014 687 708plusmn29 41 1207 1186plusmn293 25 845 838plusmn106 13
2015 728
11655
830
Granny Smith 2014 729 728plusmn01 01 1312 1239plusmn1036 84 875 852plusmn318 37
2015 728
11655
830
Cripps Pink 2014 729 733plusmn06 09 1312 1242plusmn99 8 875 856plusmn276 32
2015 738
1172
836
Kalei 2014 729 755plusmn37 49 1305 1275plusmn421 33 875 883plusmn113 13
2015 781
12455
891
Galaxy 2014 795 767plusmn4 53 1429 1300plusmn1817 14 950 893plusmn806 9
2015 738
1172
836
Fuji 2014 76 77plusmn15 19 1368 1307plusmn866 66 924 908plusmn233 26
2015 781
12455
891
Hi Early 2014 76 77plusmn15 19 1368 1307plusmn866 66 924 908plusmn233 26
2015 781
12455
891
lowest coefficient of variation CV() across the three chill models
28
3 Modelling to predict the timing of flowering in apple under current climates
(Appendix 1)
The relationship between winter chill heat and flowering was described mathematically in the chill-
overlap model of flowering developed for almonds (Pope et al 2014) (Figure 6) This model assumes
that there is a minimum amount of chill and a minimum amount of heat required for flowering The more
chill that is received over and above the minimum chilling requirement the lower the amount of heat that
is needed In this way the timing of flowering is determined by the complex relationship between the
amount of chill and heat that is received during dormancy
The baseline flowering and temperature datasets collected as part of this project were used to
successfully validate the chill-overlap model for lsquoCripps Pinkrsquo apple (Darbyshire et al 2016) enabling
projections of climate change impacts on the timing of flowering to be made (Table 3)
Figure 6 The Chill-Overlap Model for flowering in apple Cr is minimum chill required for
flowering Co is the maximum additional chill that will reduce the heat requirement Hr is the
heat required when Co chill is accumulated and Ho is the maximum possible heat
requirement for flowering (Redrawn from Darbyshire et al 2016)
29
Potential impacts of warming temperatures on flowering
1 Modelling to predict changes in the timing of apple flowering under future
climates
(Appendix 1)
The chill-overlap model for lsquoCripps Pinkrsquo apple was used to predict changes in the timing of full bloom in
growing regions across Australia in 2030 and 2050 In Orange a high chill location the average date of
full bloom was advanced (earlier bloom) in 2050 by 4 to 5 days The milder winter locations showed a
delayed full bloom date in 2030 and 2050 with the greatest impact felt at Manjimup
Changes in flowering time for lsquoCripps Pinkrsquo in 2030 are likely to be within the current range of grower
experience However by 2050 flowering times are predicted to be considerably later in milder winter
regions To determine how flowering time in other apple cultivars will be impacted by climate change the
chill-overlap model would require validation with flowering data from each cultivar
Table 3 Average date of full bloom for lsquoCripps Pinkrsquo apple in 2030 and 2050 using a
minimum to medium (RCP45) and worst case scenario (RCP85) modelling approach
Average Predicted Full Bloom date Present
2030
2050
RCP45 RCP85 RCP45 RCP85 Applethorpe 4 Oct 7 Oct 9 Oct 12 Oct 16 Oct
Shepparton 30 Sep 3 Oct 3 Oct 5 Oct 6 Oct
Manjimup 16 Oct 22 Oct 25 Oct 30 Oct 2 Nov
Huonville 26 Sep 27 Sep 29 Sep 29 Sep 29 Sep
Orange 2 Oct 28 Sep 28 Sep 28 Sep 27 Sep
Mount Barker 1 Oct 5 Oct 4 Oct 6 Oct 8 Oct
2 Using climate analogues
(Appendix 3)
The climate analogue analysis using Manjimup as an analogue for Stanthorpe in 2030 indicated that
growers in the Stanthorpe region were likely to experience a more variable and protracted pattern of
flowering across many apple cultivars by 2030 (Figure 7) but without any clear negative impact on
productivity Use of dormancy-breaking sprays was identified as a possible adaptation with no obvious
requirement to shift to different cultivars or tree crop species at this stage
Results from this case study indicated that the climate analogue approach can provide valuable
information around potential climate change impacts and adaptation strategies for horticultural industries
30
This finding comes with a note of caution however Climate and plant physiology are complex systems
and the information gained from using climate analogues should be considered in a broad context with
care taken to the detail
Figure 7 Variable bud burst and flowering in Cripps Pink Manjimup spring 2014
Options for adaptation management of flowering under future climates
1 Cultivar selection mdash matching cultivars with appropriate winter climates
Ideally apple and pear cultivars should be matched with suitable growing climates which in this case
refers to selection of cultivars with chilling requirements that are comfortably below the minimum winter
chill received in a particular location (Atkinson et al 2013 Luedeling et al 2015) However there are
multiple factors that influence cultivar choice (for example market opportunities) and uncertainty around
determination of cultivar chilling requirements make this somewhat difficult
The collection of flowering time observations undertaken as part of this study indicated that more
detailed monitoring and recording of green tip and flowering dates across the orchard would enable
growers to identify cultivars that are performing well in the local climate and those that are not getting
enough chilling from season-to-season (providing early indication of cultivars that might be impacted by
warmer winters in the future changing climate) These records could also be used to identify subtle shifts
in the timing of flowering between cultivars and their pollinisers New sensing technologies will enable
simpler collection of large amounts of data in the future (Panda et al 2010)
31
2 Dormancy-breaking sprays as an adaption to inadequate winter chill
(Appendix 4)
The dormancy-breaking sprays assessed in this 2015-16 study were able to advance flowering time and
compact the flowering period in lsquoGalarsquo apple with differences observed between products and sites
(Figure 8) A more compact and uniform flowering period has been shown to have a number of benefits
including improved management of flowering pests and chemical thinning practices (Bound et al 2004
Theron 2013)
Despite the compaction of flowering there were no clear differences observed in fruit set yield or
variability of apple maturity in trees treated with dormancy-breaking sprays More work is required to test
the potential of these products to improve fruit quality and reduce the length of harvest Advances in
harvest timing were observed with the dormancy-breakers and generally reflected differences in
flowering dates The ability to manipulate harvest timing can be useful in situations where advantage can
be taken of a high-price market window
The results suggest that dormancy-breaking products are likely to be a viable adaptation tool for some
cultivars in lower winter chill years but the degree to which flowering can be managed with dormancy-
breakers as the climate continues to warm is yet to be determined
Figure 8 Green tip first flower and full bloom in Gala apples treated with and without
dormancy breaking sprays Dormexreg Waikentrade and Ergerreg in Huonville Applethorpe and
Manjimup in 2015
32
3 Changing cultural practices
(Appendices 2 and 3)
A review of the scientific literature undertaken as part of this project together with information gained
from personal communication with growers and industry suggest that irregular and protracted flowering
can be difficult to manage and will likely require changes in thinning practices (Bound et al 2004
Theron 2013) Determining an appropriate thinning program is likely to be challenging when buds are at
multiple stages of green tip and flowering on individual trees (Theron 2013) Fruitlets may vary more in
size and developmental stage and careful hand thinning will likely be required to optimise crop
uniformity (personal comm) Where uniformity cannot be achieved the greater spread of fruit maturity
at harvest may require greater effort to pick at the appropriate time (personal comm)
Impacts of increased frequency of extreme heat days on fruit quality and options for
adaptation
Understanding relationships between summer temperatures and the incidence of
sunburn under net and no net
1 Air temperature thresholds for sunburn damage
(Appendix 5)
Minimum air temperatures for potential sun damage were determined for lsquoRoyal Galarsquo apple in Australia
The air temperature thresholds were 341 and 387degC respectively for browning and necrosis for non-
netted fruit and 379degC for browning under netting (Figure 9)
When the air temperature thresholds were applied across southern Australia it was found that some
fruit-growing regions were more exposed to potential sun damage risk than others Cooler summer
regions (such as Huonville and Applethorpe) illustrated very little risk while warmer summer regions
(such as Shepparton) displayed a greater potential risk accompanied by substantial variability between
years (Table 4) Managing this variability in potential risk is important to maintain yield and quality
Air temperature thresholds can be used by growers as a guide for timing the use of overhead sprinklers
for evaporative cooling in efforts to minimize potential damage
33
Figure 9 Fruit surface temperature (degC) recordings and related air temperatures (degC)
Necrosis and browning fruit surface temperature thresholds represent 52 and 478 degC
respectively Figure sourced from Darbyshire et al 2015
Table 4 Distribution of potential damage days in January for sites in Australiarsquos growing
regions for 10th 50th and 90th percentiles of data Table sourced from Darbyshire et al
2015
Browning non-netted Browning netted Necrosis non-netted
Site 10th 50th 90th 10th 50th 90th 10th 50th 90th
Spreyton1 0 0 0 0 0 0 0 0 0
Huonville 0 0 1 0 0 0 0 0 0
Applethorpe 0 0 2 0 0 0 0 0 0
Batlow1 0 0 4 0 0 0 0 0 0
Yarra Valley1 0 2 5 0 0 1 0 0 1
Manjimup 0 3 5 0 0 2 0 0 1
Lenswood1 0 3 6 0 0 2 0 0 1
Young1 1 7 16 0 1 5 0 05 4
Shepparton 2 6 12 0 1 5 0 1 4
Donnybrook1 3 7 11 0 1 3 0 05 2 1additional locations included in this table were part of the Crossing the threshold adaptation tipping
points for Australian fruit trees project
2 Predicting fruit surface temperature from weather data using the
lsquothermodynamic Smart-Sinclairrsquo model
(Appendix 6)
The thermodynamic Smart-Sinclair model (Smart et al 1976) was tested on lsquoRoyal Galarsquo grown under
34
net and no net The optimised model produced was able to predict fruit surface temperature with a root
mean square error of 2 to 3degC The presence of netting reduced the median fruit surface temperatures by
15 to 20degC The mechanism for this netting effect was through the reduction of the intensity of the solar
beam by interception and scattering while still allowing sufficient air flow to enable transfer of heat from
the fruit surface to the air
This type of modelling can be used to understand processes and quantify the effects of various netting
structures on fruit surface temperature and sun damage risk However the thermodynamic fruit surface
temperature model cannot be used for predicting the effects of climate change due to the lack of reliable
projected solar radiation and wind speed data for future climates For applications such as assessing the
benefits of netting in Australiarsquos apple growing regions for a range of climate change scenarios the air
temperature threshold approach of Darbyshire et al 2015 described above is more appropriate
Potential impact of an increased frequency in extreme heat events on the incidence of
sunburn and the effectiveness of netting as an adaptation strategy
(Appendices 1 and 7)
Minimum air temperature thresholds for sunburn damage in lsquoRoyal Galarsquo apple grown with and without
net (Darbyshire et al 2015) were used to consider the risk of sunburn damage under future climates in
pome fruit growing regions of Australia and the effectiveness of netting to reduce this risk (Table 5)
Exposure to sunburn browning-risk was highly dependent on the geographical location Some locations
were found to maintain minimal sunburn browning-risk up to 2050 while others will potentially
experience the risk for a significant proportion of the JanuaryFebruary fruit growing period Shepparton
Mt Barker and Manjimup will be most adversely affected however the installation of over-tree netting
substantially reduced the impact of sunburn browning
Analysis of multiple locations enables the use of climate analogues (Whetton et al 2013) for impact and
adaptation assessments
35
Table 5 Average sunburn browning risk (percentage of days in the January to February
period) for lsquoRoyal Galarsquo apples grown at sites across Australia with and without netting
Sunburn browning risk classifications
5 gt 5 to 10 gt 10 to 20 gt 20 to 30 gt 30 to 50
Without Netting 2030 2050
Site Present RCP45 RCP85 RCP45 RCP85
Applethorpe 11 24 28 28 49
Shepparton 183 239 268 275 358
Manjimup 100 152 152 166 198
Huonville 24 34 38 45 42
Orange 24 38 44 37 84
Mt Barker 173 207 229 232 258
With Netting
2030 2050
Site Present RCP45 RCP85 RCP45 RCP85
Applethorpe 00 00 01 01 04
Shepparton 48 70 90 88 132
Manjimup 16 38 39 44 60
Huonville 03 06 10 12 11
Orange 01 01 01 01 07
Mt Barker 54 72 91 94 107
36
Black and white netting impacts on the orchard environment fruit yield and quality
(Appendix 8)
Observations from the Western Australian netting demonstration site (Figure 10) showed similar air
temperature conditions (including winter chill accumulation) under the netted and non-netted orchard
blocks There was a slight increase in humidity under net which was associated with a higher incidence of
pest and disease There were no differences in bud burst and full bloom dates between trees under
black white and no net
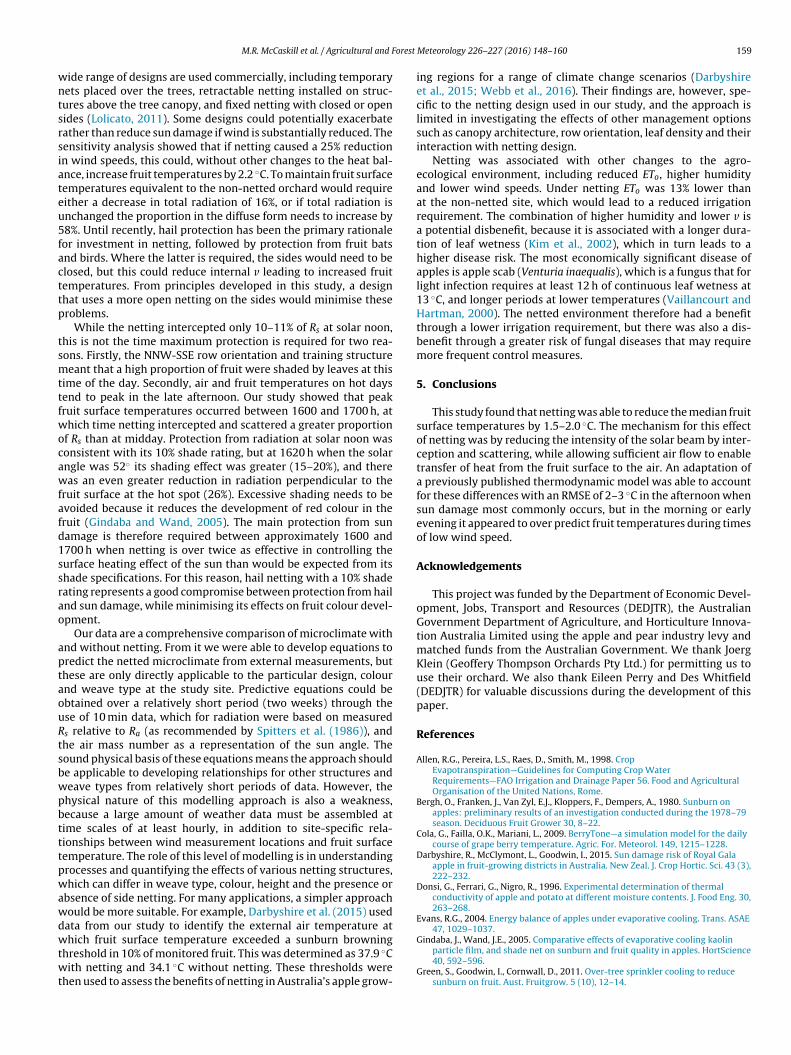
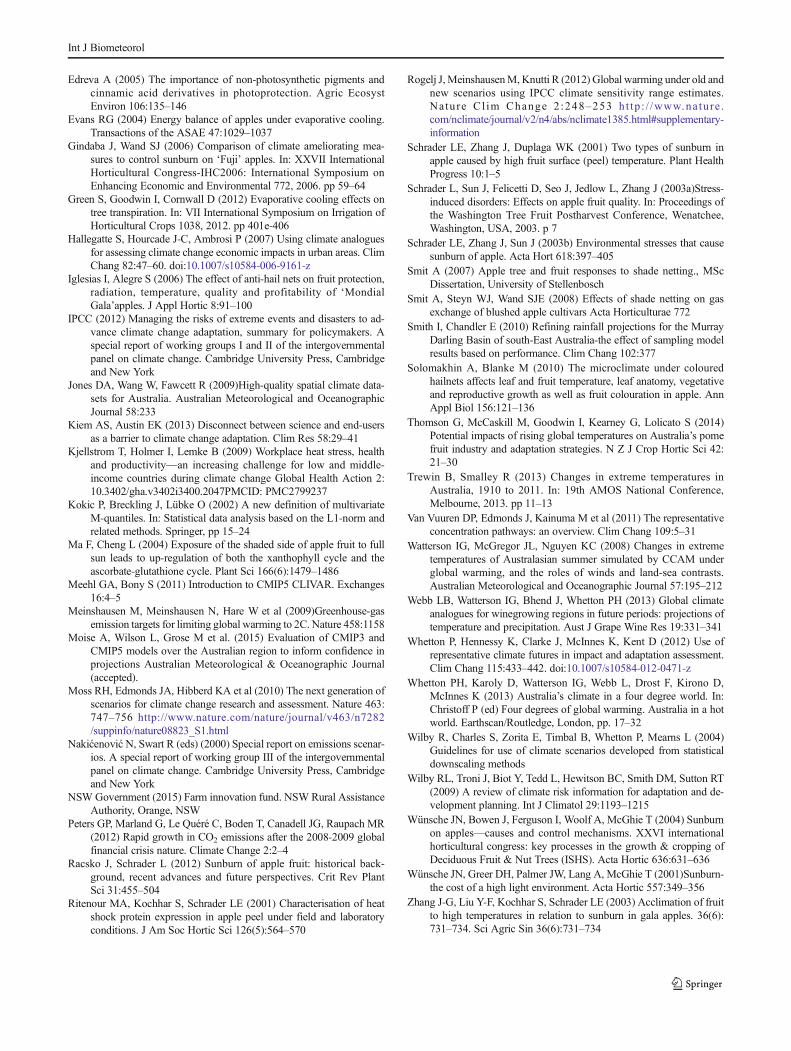
Fruit surface temperatures recorded in apples over the late summer period were higher in the non-netted
apples (Figure 11) Fruit size was similar between netted and non-netted blocks however fruit colour
management using reflective mulch was required under the nets
Figure 10 Western Australian netting demonstration site at the Lyster Matijari Orchard
Manjimup
Figure 11 Fruit surface temperature (FST) and air temperature measured in the black net
white net and no net rows at the Lyster Matijari orchard (Manjimup) from February to mid-
March 2014
37
Impacts of warming temperatures on yield
(Appendix 9)
Modelling potential yield in apple using Malusim
In a recent report Darbyshire and McClymont (2016) concluded that positive validation of MaluSim under
Australian conditions was not achieved based on poor prediction of yield by MaluSim for lsquoRoyal Galarsquo and
lsquoCripps Pinkrsquo at multiple sites in Australia However performance of MaluSim in predicting fruit weight of
lsquoRoyal Galarsquo trees at the North Shepparton site supported use of the model for preliminary investigation
of influences of climate change on potential yield as part of this project
Potential impacts of warming temperatures on yield in apple
Using Malusim the predicted impact of increased temperatures (+ 2degC) on yield in lsquoRoyal Galarsquo apples in
north Victoria was minor under the conditions modelled in this investigation However further research
into possible effects of changes in harvest timing leaf fall and elevated atmospheric carbon dioxide
concentrations is required to better understand yield responses to climate change
Communication development and extension
Assessing the status of available information around climate change in the apple and
pear industry in 2013
A review of climate change information available to the Australian apple and pear industry showed a lack
of readily accessible reliable and consistent information available to growers at the time As a result it
was concluded that a) scientific outcomes from this project need to be published in a grower friendly
format b) research should be extended in a consistent manner through national grower workshops
across the country and online blogs and c) information generated needs to be stored online for easy
access
Improving industry understanding of likely changes in climate potential impacts on
apple and pear production and options for adaptation
Outcomes from the national grower workshops (appendix 10) were overwhelmingly positive with the
specific feedback varying depending on the location A number of knowledge gaps were identified during
the workshops including the need for cultivar chilling requirements for existing and new cultivars the
role of soil temperature in dormancy breaking and the need for more accurate in-season and long-term
climate forecasting There was a strong focus on the potential impact of extreme events on the industry
under future climate scenarios with less understanding about the potential impacts of more subtle
increases in temperature
Three grower publications were put together reporting on the latest project outcomes and information
already available from either earlier research in Australia andor other pome fruit growing regions The
publications were written with input from the project researchers and APAL (as the technical working
group) on the topics of winter chill netting for heat and climate scenarios The guides will be available
online (wwwhincomau) and as hardcopies from APAL andor the participating agencies
38
Increasing knowledge and skills to enable informed decision making on climate change
adaptation
Research outcomes were interpreted and communicated with a clear focus on practical on-farm
application For example findings from the fruit surface temperature research were interpreted and
communicated as regional sunburn browning-risk with analysis of the effectiveness of netting as an
adaptation strategy to increased frequency of extreme heat days The Western Australian netting
demonstration site enabled on-site communication with growers in that state around the effectiveness of
netting and the associated practical implications Green tip and flowering data collection methods were
developed for growers to use in their personal orchard record systems to determine cultivar performance
and identify shifts in flowering time andor quality A winter chill website was developed to assist growers
and industry more broadly to access and interpret winter chill data for their local region
Building a connected and collaborative approach to climate change in the apple and
pear industry
A strong network of researchers extension officers industry development officers growers and other
industry representatives was established nationally and continued to grow until project completion The
success of this project objective is discussed in the lsquoevaluation and discussionrsquo (p39)
39
Evaluation and Discussion
Measuring project impact
The proposed project outcome was to provide Australian apple and pear growers pome fruit researchers
and industry consultants with a greater understanding of predicted climate change in their region the
potential impacts and strategies for adaptation A formal evaluation of the projectrsquos ability to deliver on
this outcome was undertaken at the mid-way point through Horticulture Innovation Australiarsquos
independent mid-term review process
Through extensive research development and extension activities this project delivered new knowledge
to industry on regional climate change scenarios potential impacts of changing climate on flowering and
fruit quality and options for adaptation
Project outputs were produced across a broad variety of print digital and oral communication mediums
(refer to p13) The list includes 3 dedicated grower publications communicating climate risk and
adaptation information for the apple and pear industry a website for provision of up-to-date winter chill
information 6 grower workshops 3 grower technical working group meetings 2 industry surveys 28
articles published in industry magazines 5 presentations at industry conferences 15 presentations at
government and industry stakeholder meetings 11 media items in-print and on radio 9 technical reports
2 dedicated project web pages 6 regional chill factsheets numerous blogs 5 scientific publications and
presentation at 2 scientific conferences
The project trial sites were located in three growing regions (Western Australia Victoria and
Queensland) however significant effort was made to extend and communicate project outcomes more
broadly across the industry Grower workshops and technical working group meetings were held in New
South Wales and South Australia Collaboration with researchers from the University of Tasmania through
the lsquoCrossing the threshold adaptation tipping points for Australian fruit treesrsquo project and the dormancy-
breaking spray trial facilitated effective communication with industry in that state In addition multiple
members of the research and extension team organized and operated a project stand in the trade hall of
the 2015 National Horticulture Convention in conjunction with the Department of Economic Development
Jobs Transport and Resources
To measure lsquogreater understandingrsquo of climate change by the apple and pear industry an extensive
surveying process before and after project completion would have been required This was not
undertaken as part of the project however the extent of project outputs delivered across the country
give a good indication of the level of engagement that this project successfully achieved
In the next few years the project impact will be measurable by assessing the level of uptake and use of
the grower publications and lsquowinter chill and growing degree dayrsquo website In addition national networks
developed over the last four years between members of the project team and industry are likely to
continue to provide ongoing benefit to Australian horticulture as its members move to reduce
vulnerability to climate change risks
40
Effectiveness of project activities in delivering project outputs and achieving intended
outcomes
Efficiency of the delivery mechanisms and appropriateness of the methodology
A mid-term project review conducted in 2014 by Professor Snow Barlow from The University of
Melbourne found the research to be lsquoscientifically rigorous and directed towards the contracted objectives
of the projectrsquo The review highlighted the good progress made by the research and extension team in
engaging with industry and in the delivery of a broad information mix incorporating immediate adaptive
strategies such as netting to reduce sunburn risk and future long-term climate change impacts
Our use of small grower-based technical working groups to receive guidance on research project direction
and outputs was sound methodology but required considerably more resources to maximize its value
The process of establishing these groups nationally running meetings compiling and disseminating
outcomes and maintaining communication with the groups throughout the project was significant
Ideally the groups need to be coordinated by a local industry representative with strong connections to
the industry in their region and good knowledge of the industry itself
Barriers to communication and extension around climate change adaptation
Effective communication between researchers and growers is particularly important in delivering
messages on climate change impact and adaptation due to the vast quantity of information and
misinformation in the public sphere A number of communication and extension barriers were identified
during the course of project engagement activities (Table 6) and these learnings were used to improve
the effectiveness of our communications
For example widespread confusion in the industry around measurement of winter chill and chilling
requirements was identified as a significant barrier to effective communication of research findings
related to climate change impacts on winter chill and flowering As a result the lsquowinter chill and growing
degree dayrsquo website was developed (as part of a project variation) to provide chill calculation tools and
supporting information for industry with the aim of improving understanding and enabling better
management of low winter chill years in orchards across Australia
41
Table 6 Barriers to communication and extension around climate change adaptation
Barriers Comments
Skepticism of climate change Communication with growers nationally
suggested that this was a minority of industry
Conflicting messages from Governments
regarding potential climate change impacts and the need for adaptation
Feeling of responsibility for climate change
without having realistic strategies to combat it
Resistance to implementing changes required for climate change adaptation
Could be for a variety of reasons including financial and family pressures
Timing of communication- needs to be considered in the context of production
stresses more broadly
Growers in the midst of battling drought are unlikely to be concentrating on understanding
chilling requirements Information provided needs
to be carefully matched with local industry needs
Large knowledge gaps in the science For example it is difficult for growers to make
cultivar choices based on climate suitability due
to the lack of basic understanding around chilling requirements and tolerance to heat
Confusion around chilling requirements and measurement of winter chill
Generated historically by the reporting of winter chill in different units and general spread of
misinformation
Confusion around the terms lsquoclimate variabilityrsquo versus lsquoclimate changersquo
Confusion over the use of different scientific
terminologies
Need to use consistent terminology in all
communications for example around winter chill and phenological stages
Feedback on activities and quality and usefulness of project outputs
Feedback on research and extension activities was obtained from a broad cross-section of apple and pear
growers and industry representatives nationally through meetings with APAL staff and discussions and
evaluations at grower workshops A formal evaluation completed by 12 growers at the Bilpin workshop in
2015 indicated that 100 of them found the workshop content useful for their orchard businesses and
that they would like to attend further events Similarly positive results were obtained elsewhere through
informal discussions
In addition feedback was sought via the project websites through Australian Fruitgrower articles and
regular discussions with growers on-site during research data collection and various grower meetings
Grower experiences of local climate change impacts were often communicated during one-on-one
conversations The APAL industry conferences were utilized as an effective medium for sharing project
outcomes A dedicated project stand and display was set up in the exhibition hall at the National
Horticulture Convention on the Gold Coast in 2015 for the purpose of sharing project outcomes
responding to targeted inquiries and obtaining feedback from industry nationally
42
The value of online project outputs can be quantified through the number lsquohitsrsquo to project website pages The project pages on the Horticulture Industry Network site have received 987 hits since they were developed in 2014 indicating the usefulness of this medium for project communication
Scientific feedback was obtained from within the project team as well as through linkages with
researchers nationally Critique of research methodology and results was sought from international
scientists through publication in peer-reviewed journals presentations at scientific conferences and
through hosting visits from international researchers
Feedback received was discussed with the project team during the monthly teleconferences and annual
face-to-face meetings and was incorporated back into the project as deemed appropriate by the group
Key learnings
Climate change will add significant variability into the pome fruit crop production system with respect to
flowering and fruit quality Most Australian growers are already used to dealing with some level of climate
variability and it seems likely that impacts on flowering and fruit quality may be within the range of
grower experience up to around 2030 but that by 2050 growers will be operating outside of current
experience This will present challenges for the Australian industry in the consistency of supply and in
maintenance of the uniform orchard blocks that are a prerequisite for the efficient use of mechanisation
Precise timeframes for impacts of warming temperatures on pome fruit production are difficult to
determine because of the amount of variability in both the climate (including microclimate) and orchard
production systems For example under the worst case scenario Manjimup is projected to receive an
average of 46 chill portions in 2050 This means that in cold years there is likely to be plenty of chill for
apple production but warm years will challenge many current commercial cultivars If the grower has
adapted by planting lower chill cultivars and adjusted their management practices they are more likely to
grow a good crop every year
The Australian apple and pear industry in Australia and globally has a strong capacity for adaptation to
the changing climate due to the availability of new technologies for crop sensing opportunities for
protected cropping a strong research history in crop physiology and availability of a broad diversity of
scion and rootstock genetics Genetic diversity in particular can be exploited to ensure commercial
cultivars are better adapted to the changing climatic conditions
Successful adaptation to the changing climate will be supported by capture and interpretation of data on
tree phenology climate and orchard practices Australiarsquos industry is made up of growing regions with
diverse climates and much can be learnt about climate change impacts and options for adaptation by
sharing of knowledge In future more comprehensive data will be collected on orchards through the use
of sensing and mapping technologies This data can be used to undertake more sophisticated and
comprehensive analysis of flowering patterns and variability between and within locations
Specific research learnings are listed under the stated project objectives
1 Develop climate change scenarios for pome fruit growing regions of Australia in 2030
and 2050 including the likely impact of climate change on winter chill and extreme
heat
- Australia has undergone a consistent warming trend since 1910 however at a local level the
experience of climate change has been different in each pome fruit growing region Changes in
average minimum and maximum temperatures and extreme heat for the period from 1968 to
43
2016 varied between locations
- Milder growing regions have experienced a decline in annual winter chill accumulation since 1968
while the colder regions of Huonville and Orange have not changed
- Increases in the number of extreme heat days have been experienced in Shepparton and Mt
Barker while the frequency of extreme heat days in Manjimup in the last seven years has been
above the long-term average
- The climate projections for 2030 and 2050 show that all pome fruit regions across Australia can
expect to experience
Declines in winter chill accumulation Warmer winter growing regions such as Manjimup and
Applethorpe were projected to experience a reduction in winter chill of 20 to 30 by 2050
A decline of between 10 and 15 chill was projected for the coldest regions (Huonville and
Orange) over the same period
An increase in the number of extreme heat days during the growing season The greatest
impacts were projected to be in regions such as Shepparton and Mt Barker with hot summer
climates
- Climate change impacts on winter chill are likely to be within grower experiences of season-to-
season variability up to approximately 2030 On-farm adaptation to this variability will reduce
longer term climate change risk to orchard profitability By 2050 it is likely that growers will be
operating under climates outside of the current range of experience for a particular region
- Expression of climate change projections in terms of meaningful horticultural climate metrics
(chill portions and sunburn browning risk days) instead of average temperatures improves their
value to industry by directly linking projected changes in climate with impacts on production
2 Understand how changes in autumn winter and spring temperatures might impact
the timing and quality of flowering in cultivars of apple and pear
- Analysis of winter chill and flowering from 2012 to 2015 in Applethorpe Shepparton and
Manjimup showed
Low winter chill as observed in Manjimup was associated with uneven chill accumulation caused by short periods of warm weather throughout the autumn and winter seasons
Low winter chill in Manjimup was associated with greater variability in flowering dates between seasons cultivars and individual trees and irregular and protracted flowering across most apple cultivars relative to the other sites
The variable pattern of flowering observed in Manjimup was likely the result of mild winter
conditions and inadequate chilling for some cultivars
- Analysis using Manjimup as a climate analogue for Stanthorpe in 2030 indicated that growers in
the Stanthorpe region were likely to experience a more variable and protracted pattern of
flowering across many apple cultivars by 2030 but without any clear negative impact on
productivity Use of dormancy-breaking sprays is an adaptation option There was with no clear
need to shift to different cultivars or species at this stage (objective 3)
- Projections from the chill-overlap model for timing of full bloom in lsquoCripps Pinkrsquo apple in 2030 and
2050 showed
An earlier full bloom date on average in some high chill locations (for example in Orange) in
44
2030 and 2050
A later full bloom date at the milder winter locations (Applethorpe Manjimup and even
Shepparton) in 2030 with average flowering dates delayed by more than a week in 2050
Changes in flowering time for lsquoCripps Pinkrsquo in 2030 are likely to be within the current range of
grower experience
- Increased frequency of low chill years in milder winter growing regions will likely result in
symptoms of inadequate chill in some cultivars Advances in the timing of flowering might be
observed in cooler winter regions Changes in the timing of flowering can result in reduced yields
in cases where the flowering period of polliniser trees no longer overlaps that of the commercial
cultivar
3 Identify adaptations to manage any negative effects of climate change on flowering
- The dormancy-breaking spray trial in lsquoGalarsquo apple in Qld WA and Tas demonstrated that
Dormexreg Waikentrade and Ergerreg were able to advance flowering time and compact the
flowering period
Fruit maturity was advanced with dormancy-breakers and generally reflected differences in
flowering dates
Dormancy-breaking sprays are likely to be an effective tool for managing flowering in lsquoGalarsquo
and other apple cultivars in lower chill years in Australia
Benefits from the use of dormancy-breakers are likely to be greater in low chill years when
the potential impacts of inadequate chill on flowering are greatest Therefore benefits are
likely to increase under future climate scenarios
- Changes to cultural practices will be required to manage symptoms of inadequate chill such as
delayed irregular and protracted flowering
Development of an appropriate chemical thinning program for managing buds at multiple
stages of green tip and flowering on individual trees
Careful hand thinning to optimise crop uniformity when fruitlets vary considerably in size and
developmental stage
Additional labour input to pick fruit at the appropriate stage of maturity when there is a
greater spread of fruit maturity at harvest
Pollination management to reduce the risk of poor flowering overlap in any particular year
caused by large shifts in flowering dates between cultivars and seasons
- The increased irregularity and unevenness of flowering is likely to be a greater management
challenge for Australian growers than managing changes in flowering time as growers are
already experienced at dealing with large shifts in flowering dates between seasons
- Using forced bud methodology to determine chilling requirements apple cultivars fell into groups
with low (lsquoCripps Redrsquo lsquoManchurianrsquo crab apple) medium (lsquoRS103-110rsquo lsquoGranny Smithrsquo lsquoCripps
Pinkrsquo lsquoKaleirsquo) and higher chilling requirements (lsquoGalaxyrsquo lsquoFujirsquo lsquoHi-Earlyrsquo) Groupings such as these
enable growers to make more informed cultivar and polliniser choices at planting based on the
winter chill climate in their region
45
4 Understand how changes in the frequency of extreme heat days might impact on the
incidence of sunburn in pome fruit and the effectiveness of netting as an adaptation
strategy
- Minimum air temperatures for potential sun damage in lsquoRoyal Galarsquo apple were established
341degC and 387degC respectively for browning and necrosis for non-netted fruit
379degC for browning under netting
- Air temperature thresholds were applied across southern Australia and potential sun damage risk
and effectiveness of netting was determined under future climates
Shepparton Mt Barker and Manjimup were the most adversely affected by projected
increases in the percentage of days with potential sunburn browning risk in January and
February
The percentage of risk days in Shepparton was projected to increase from 18 at present to
28 to 36 in 2050 with the installation of netting reducing the risk considerably to around 9
to 13
- Most growing regions are likely to notice an increased sunburn risk by 2030 (if they havenrsquot
already) By 2050 growers in regions with currently milder summers will need to have adapted
their current orchard practices to manage the impacts that an increased frequency of heat events
will have on fruit quality
- The thermodynamic Smart-Sinclair model was tested on lsquoRoyal Galarsquo grown under net and no net
and was able to predict fruit surface temperature with a root mean square error of 2 to 3degC
Netting reduced the median fruit surface temperatures by 15 to 20degC
- The thermodynamic Smart-Sinclair model can be used to understand processes and quantify the
effects of various netting structures on fruit surface temperature and sun damage risk but
cannot be used for predicting the effects of climate change due to the lack of reliable projected
solar radiation and wind speed data
5 Understand how different colours of netting impact on the orchard environment fruit
yield and quality
- Comparison of black and white netting at the Western Australian netting demonstration site
showed little difference in environmental conditions or bud burst and flowering under the black
netting white netting and non-netted orchard blocks Fruit surface temperatures were higher in
the no net apples
6 Understand how the changing climate might impact the yield potential of apples
- The Malusim model for the prediction of potential apple yield could not be positively validated
under Australian conditions as it was generally a poor predictor of yield for lsquoRoyal Galarsquo and
lsquoCripps Pinkrsquo at multiple sites in Australia
- The MaluSim model was able to predict fruit weight of lsquoRoyal Galarsquo trees at the North Shepparton
site and supported use of the model for preliminary investigation of influences of climate change
on potential yield The predicted impact of increased temperatures (+ 2degC) on yield in lsquoRoyal
Galarsquo apples in north Victoria was minor under the conditions modelled in this investigation
46
Recommendations
Industry
- The following tools and strategies are recommended for adaptation to an increased frequency of low
chill years in milder growing regions of Australia
Planting lower chill cultivars Matching cultivars to their chilling climate is the best option but
it is not always possible due to market pressures and a lack of information on chilling
requirements
Management of delayed and variable flowering with the use of dormancy-breakers
Development of a set of broad guidelines around the use of dormancy-breaking sprays based
on existing knowledge Such guidelines could include information on when dormancy-
breaking sprays should be used and in which cultivars and regions
Adjustments to chemical and hand thinning practices to reduce variability in fruit size and
maturity
Use of the lsquowinter chill and growing degree dayrsquo website for monitoring in-season chill
accumulation
Preparation of an orchard management strategy to enact in low chill years This would likely
include monitoring of winter chill accumulation and the use of dormancy-breakers
Comprehensive in-orchard monitoring of flowering dates across cultivars to provide early
indication of cultivars that might be impacted by warmer winters as well as identification of
subtle shifts in the timing of flowering between cultivars and their pollinisers
In blocks where flowering is becoming increasingly irregular growers will need to assess the
point at which the increased cost of inputs and effort required to produce a consistently high
quality crop make a block of trees unprofitable
- To reduce the risks to pollination from shifting flowering times planting of multiple polliniser cultivars
with early middle and late flowering habits to ensure a good supply of pollen throughout the
flowering period is recommended where possible Use of floral bouquets or artificial pollination
methods can be considered to compensate for loss in flowering overlap
- The following tools and strategies are recommended for adaptation by the apple and pear industry to
increased frequency of extreme heat
Continued investment in netting in locations such as Manjimup and Orange where many
orchards are currently un-netted
Use of air temperature thresholds as a guide for using overhead sprinklers for evaporative
cooling in efforts to minimize potential sunburn damage
Planting heat tolerant cultivars As for winter chill matching cultivars to their growing climate
is the best option but it is not always possible due to market pressures and a lack of
information on different heat tolerances of cultivars
Development of orchard practice guidelines for managing extreme heat (bringing together
47
aspects of tree canopy structure evaporative cooling netting types irrigation nutrition
spray-on protectants and other stress reduction products)
Development of orchard practice guidelines for optimising post-harvest fruit quality in warm
to hot summerautumn conditions (pre and post-harvest management)
- For improved tactical and strategic planning in the orchard use of the Bureau of Meteorology climate
outlook videos (httpwwwbomgovauclimateoutlooksoverviewsummary) State of the Climate
reports (httpwwwbomgovaustate-of-the-climate) and the lsquoclimate change in Australiarsquo website
(httpswwwclimatechangeinaustraliagovauen) is recommended
- It is recommended that the Australian apple and pear industry utilise and exploit the genetic diversity
available in scions and rootstocks globally to ensure that commercial cultivars can be better adapted
to the changing climatic conditions
- Climate analogues should be used to better identify the timeframes for impacts of low chill and
extreme heat on apple and pear production and the best strategies for adaptation For example
growers in Manjimup are already successfully managing the impacts of inadequate chill in some
years lessons can be learnt from their knowledge and experience
- This project focussed specifically on climate change impacts on crop physiology and it is
recommended that the industry undertake a broad economic assessment of climate change impacts
from storm events drought increased wind changes in evapotranspiration and so on
- The industry needs to consider how basic research gaps such as knowledge around relationships
between temperature and tree physiology may be filled in future years to ensure the flow of new
information and ideas into the industry does not become limited
Extension and communications
- Having an extension and research team working side-by-side from project start to end has significant
benefits for communications and industry engagement
- National collaboration was enormously beneficial to the success of this project as were linkages
between projects and across industries
- Having a core team responsible for communication ensured timely relevant and consistent
information was made available and utilising well established local grower groups and extension
officers ensured ease of facilitation
Scientific
Priority research needs
- Determination of significant biological thresholds (chilling requirements sunburn damage thresholds
pest and disease development thresholds) to enable conversion of weather and climate data into
useful horticultural metrics for everyday decision making
- Investigation of methods programs for evaluation of new and existing scions and rootstocks with
the objective of providing sufficient information to enable matching of apple and pear cultivars with
suitable growing climates including matching chilling requirements with winter chill and heat
48
tolerance with summer temperatures
- New genetics breeding programs are needed that focus on lower chill cultivars with good tolerance
for heat alongside other quality parameters
- Determination of genetic andor physiological markers of flower bud progression into dormancy and
out of dormancy prior to bud burst This would improve the definition of apple and pear chilling
requirements
- Efficacy of using dormancy-breaking sprays for long-term adaptation to warming temperatures
including the extent to which dormancy-breaking sprays can be used as an adaptation to low chill
years relationships between dormancy-breaking sprays and fruit quality particularly in cultivars and
investigations into alternatives to Dormexreg
- Methods for managing heat in the orchard for improved fruit quality
Efficient tree canopies for balancing multiple requirements including low sunburn damage
optimal fruit quality (including colour development) water-use efficiency and disease
management
Understanding relationships between orchard temperatures during the growing season and
fruit quality at harvest and after storage
Use of plant growth regulators and stress reduction chemicals
Additional research gaps
- Pest and disease management under warmer climates Codling moth are likely to increase generation
number per season fruit fly are likely to have an extended range and disease management under
netting on trellis systems will present new challenges particularly when combined with the use of
evaporative cooling
- Determination of the limits of profitable apple production with regards to winter chill Production
areas with very low winter chill accumulation in South Africa and Southern Brazil rely heavily on
dormancy-breakers and would be obvious target locations for a global investigative study
- Potential impacts of low winter chill on marketable yield
- For improved definition of apple and pear chilling requirements
Cultivar specific parameterisation of the Dynamic model for improved chill model
performance
Relationship between bud temperature and dormancy breaking
Standardisation of methods for determination of chilling requirements
Investigation of the potential role of day length in dormancy breaking in apples
Effectiveness of early versus late season chill in dormancy breaking
Role of root-zone temperature and rootstocks in bud burst
Relationship between temperatures received during autumn prior to dormancy and quality of
bud burst and flowering
Impacts of pruning and defoliation on modifying winter chill requirements
49
- Validation of the chill-overlap model with flowering data from cultivars other than lsquoCripps Pinkrsquo apple
to determine how flowering time will be impacted by climate change
- Better understanding of flowering in new and existing pear cultivars and the likely impacts of
changing climate
- Fruit surface temperature thresholds for sunburn for a wide variety of cultivars Transferability of fruit
surface temperature thresholds across cultivars and locations needs to be investigated
- Effectiveness of different types (colours weaves) of netting in reducing the risk of sunburn damage
and its effect on assimilation transpiration and fruit quality
- Impact of climate change on the duration of fruit development and maturity times for apple and pear
cultivars of interest
- Potential impacts of the extended growing season (caused by the later onset of cold temperatures in
autumn and warmer springs) on canopy management and fruit quality
- Impacts of warming spring and summer temperatures on flower bud initiation and development
- The impact of elevated CO2 temperature shifts on fruit maturation colour development and leaf fall
to improve predictions of yield under different climate scenarios
- Pollination in a changing climate Warming temperatures will impact bee behavior synchronisation of
flowering (due to changes in the timing of flowering) flower viability and floral bud initiation
- Potential for POAMA (Predictive Ocean Atmosphere Model for Australia) to make in-season and short
to medium-term climate forecasts with a level of accuracy necessary to inform decision making at
tactical and strategic levels
50
Scientific Refereed Publications Darbyshire R McClymont L Goodwin I 2015 Sun damage risk of Royal Gala apple in fruit growing
districts in Australia New Zealand Journal of Crop amp Horticultural Science 43 222 -232
McCaskill M R McClymont L Goodwin I Green S Partington DL How hail netting reduces apple
fruit surface temperature a microclimate and modelling study Agricultural and Forest
Meteorology 226ndash227 148ndash160
Parkes HA Tabing O McClymont L Combret M and Wilkie JD 2016 Variation in the flowering
phenology of apple and pear in Australia Acta Horticulturae 1130 (8) 55 - 61
Parkes H Darbyshire R and White N Chilling requirements of apple varieties grown in mild Australian
winter conditions Prepared for HortScience
Webb L Darbyshire R Erwin T and Goodwin I 2016 A robust impact assessment that informs
actionable climate change adaptation Future browning-risk in apple crops International Journal
of Biometeorology Doi101007s00484-016-1268-y
51
Intellectual PropertyCommercialisation
No commercial IP generated
52
Acknowledgements The research described in this final report is a culmination of the inputs and efforts of a great many
individuals over the course of the last four and a half years
The project team would like to thank the following people for their work in the provision of technical and
farm support and for their contribution of knowledge and ideas along the way Jeff Paten John
Finocchiaro Wendy Sessions David Cornwall Diana Fisher Rohan Prince John Sutton Penny Measham
and Steve Paterson We also thank Marco Calderon for his work analysing individual bud data for his
Masterrsquos degree from the University of Melbourne
The cooperation and collaboration of a number of growers was essential for the timely collection of
phenology fruit quality and netting data used for this research The project team would like to thank
Steven and Ugo Tomasel Celeste from C Pozzebon amp Co Anne and Mauri Lyster Maurice Silverstein
Geoffrey Thompson and Scott Price
For their support in providing us with opportunities to speak at industry events publish in the Fruitgrower
magazine and deliver information via the APAL website we would like to thank Angus Crawford Sophie
Clayton and Richelle Zealley The project team also thank Kevin Dodds Marcel Veens and Fruit Growers
Victoria for on-the-ground help with the organization and delivery of the grower workshops
And finally we acknowledge the valuable contributions of all of the industry representatives and apple
and pear growers across Australia who attended workshops and seminars answered surveys and
provided us with the comments and interesting anecdotes that kept challenging our thinking and helped
us focus our work Thank you
53
Appendices
1 White N 2016 Technical report Analysis of historical and future climate and the production of
pome fruit Department of Agriculture and Fisheries Queensland 29 pp
2 Parkes H and White N 2016 Technical report Flowering in pome fruit trees across Australia
implications of a changing climate Department of Agriculture and Fisheries Queensland 21 pp
3 Parkes H and White N 2016 Technical report A climate analogue approach to understanding
climate change impacts on flowering in Australian pome fruit trees Department of Agriculture
and Fisheries Queensland 17 pp
4 Parkes H MurphyWhite S and Bound S 2016 Technical report Dormancy-breaking sprays for
low winter chill in apples Department of Agriculture and Fisheries Queensland Pomewest
University of Tasmania 28 pp
5 Darbyshire R McClymont L Goodwin I 2015 Sun damage risk of Royal Gala apple in fruit
growing districts in Australia New Zealand Journal of Crop amp Horticultural Science 43 222 - 232
6 McCaskill M R McClymont L Goodwin I Green S Partington DL How hail netting reduces
apple fruit surface temperature a microclimate and modelling study Submitted to Agricultural
and Forest Meteorology 226-227 148 ndash 160
7 Webb L Darbyshire R Erwin T and Goodwin I 2016 A robust impact assessment that
informs actionable climate change adaptation Future browning-risk in apple crops International
Journal of Biometeorology Doi101007s00484-016-1268-y
8 MurphyWhite S Prince R and Starkie L 2016 Technical report Western Australian apple
netting demonstration site Pomewest 24 pp
9 McClymont L Darbyshire R and Goodwin I 2016 Technical report Apple yield response to
climate change and netting Department of Economic Development Jobs Transport and
Resources and University of Melbourne 15 pp
10 Treeby J 2016 Understanding apples and pears in a changing climate overview of the grower
workshops Department of Economic Development Jobs Transport and Resources 5 pp
54
References
Atkinson C J Brennan R M amp Jones H G (2013) Declining chilling and its impact on temperate perennial crops Environmental and Experimental Botany 91
Bound S A amp Jones K M (2004) Hydrogen cyanamide impacts on flowering crop load and fruit
quality of red Fuji apple (Malus domestica) [Article] New Zealand Journal of Crop and Horticultural Science 32(2) 227-234
Cobon D H Stone G S Carter J O Scanlan J C Toombs N R Zhang X et al (2009) The climate change risk management matrix for the grazing industry of northern Australia Rangeland Journal 31(1)
Cooke J E K Eriksson M E amp Junttila O (2012) The dynamic nature of bud dormancy in trees
environmental control and molecular mechanisms Plant Cell and Environment 35(10) 1707-
1728 Darbyshire R McClymont L amp Goodwin I (2015) Sun damage risk of Royal Gala apple in fruit-
growing districts in Australia New Zealand Journal of Crop and Horticultural Science 43(3) 222-232
Darbyshire R Pope K amp Goodwin I (2016) An evaluation of the chill overlap model to predict
flowering time in apple tree Scientia Horticulturae 198 142-149 Darbyshire R Webb L Goodwin I amp Barlow E W R (2013a) Evaluation of recent trends in
Australian pome fruit spring phenology International Journal of Biometeorology 57(3) Darbyshire R Webb L Goodwin I amp Barlow E W R (2013b) Impact of future warming on winter
chilling in Australia International Journal of Biometeorology 57(3) 355-366 Dennis F G Jr (2003) Problems in standardizing methods for evaluating the chilling requirements for
the breaking of dormancy in buds of woody plants HortScience 38(3)
Erez A Fishman S Linsley-Noakes G C amp Allan P (1990) The dynamic model for rest completion in peach buds Acta Horticulturae 276 165-174
Fishman S Erez A amp Couvillon G A (1987) The temperature dependence of dormancy breaking in plants mathematical analysis of a two-step model involving a cooperative transition Journal of Theoretical Biology 124 473 - 483
Ghariani K amp Stebbins R L (1994) Chilling requirements of apple and pear cultivars Fruit varieties journal 48(4) 215 - 222
Hauagge R amp Cummins J N (1991) Phenotypic variation of length of bud dormancy in apple cultivars and related Malus species Journal of the American Society for Horticultural Science 116(1) 100-
106
Hennessy K J amp Clayton-Greene K (1995) Greenhouse warming and vernalisation of high-chill fruit in southern Australia Climatic Change 30(3)
Lakso A N amp Johnson R S (1990) A simplified dry matter production model for apple using automatic programming simulation software Acta Horticulturae 276 141 - 148
Legave J M Blanke M Christen D Giovannini D Mathieu V amp Oger R (2013) A comprehensive overview of the spatial and temporal variability of apple bud dormancy release and blooming
phenology in Western Europe International Journal of Biometeorology 57(2)
Lolicato S (2011) Sun protection for fruit a practical manual for preventing sunburn on fruit - 2011 Department of Primary Industries Farm Services Victoria Division Melbourne Australia
Luedeling E Blanke M amp Gebauer J (2015) Chilling challenges in a warming world In J C Mauget amp S Godet (Eds) Acta Horticulturae (pp 901-907) Leuven Belgium International Society for
Horticultural Science (ISHS)
Luedeling E amp Brown P H (2011) A global analysis of the comparability of winter chill models for fruit and nut trees International Journal of Biometeorology 55(3)
Middleton S amp McWaters A (2002) Hail netting of apple orchards- Australian experience The Compact Fruit Tree 35(2) 51 - 55
Panda S S Hoogenboom G amp Paz J O (2010) Remote sensing and geospatial technological
55
applications for site-specific management of fruit and nut crops A review [Review] Remote Sensing 2(8) 1973-1997
Pope K S Da Silva D Brown P H amp DeJong T M (2014) A biologically based approach to
modeling spring phenology in temperate deciduous trees Agricultural and Forest Meteorology 198ndash199(0) 15-23
Putland D Deuter P Hayman P Hetherington S Middleton S Nidumolu U et al (2011) The apple and pear industrys response to climate change and climate variability a desktop study Growcom Fortitude Valley Queensland Australia
Smart R E amp Sinclair T R (1976) Solar heating of grape berries and other spherical fruits [Article] Agricultural Meteorology 17(4) 241-259
State of the climate (2016) Australian Bureau of Meteorology amp CSIRO Theron K (2013) Chemical thinning of apple South African perspective Acta Horticulturae 998 85 -
90
Treeby J Goodwin I MurphyWhite S Darbyshire R White N McClymont L et al (2017a) Winter chill and flowering- what is there to know Queensland
Treeby J Goodwin I MurphyWhite S Darbyshire R White N McClymont L et al (2017b) Netting for heat- what is there to know Queensland
Whetton P H Karoly D Watterson I G Webb L Drost F Kirono D et al (2013) Australias
climate in a four degree world In P Christoff (Ed) Four degrees of global warming Australia in a hot world (pp 17 - 32) London EarthscanRoutledge
White N Parkes H amp Treeby J (2017) Future climates in pome fruit orchards- what is there to know Queensland
TechnicalReportAnalysisofHistoricalandFutureClimateandtheProductionofPomeFruitNeilWhite
February2017
2
TableofContents
Technical Report Analysis of Historical and Future Climate and the Production of Pome Fruit1
Introduction5
Site Descriptions and Data Preparation5
Reliability of techniques used to interpolate between daily and hourly temperatures7
Models of Chill Accumulation8
What is winter chill8
Chill Hours9
Utah Chill Units9
Dynamic Model9
Trends in Temperature and Chill Accumulation11
Autumn and winter11
Winter chill13
Spring and Summer15
Extreme Heat17
Climate Scenarios for apple growing regions for 2030 and 205018
How were the scenarios chosen18
Selection of Global Climate Models20
Calculation of Climate Projections for Station Data21
Future Climate Projections and the Impact on Flowering23
Future Projections of Impact on Quality25
Discussion and Conclusions27
Take-home messages from the historical record28
Take-home messages from the future scenarios28
References29
3
ListofTablesTable1Descriptionofweatherstationsusedintheanalysis6
Table2DescriptionofGCMsusedinthisstudy21
Table3Summaryofaveragechillportions(1Marchndash31August)for2030and2050usingamoderate(RCP45)toworstcasescenario(RCP85)modellingapproachbasedonhistoricaldatafrom1985to2014Meanof30yearswithlowestandhighestinparentheses24
Table4Safewinterchillcalculationsfortheperiod1985to201424
Table5Summaryofaveragedateoffullbloom(CrippsPink)for2030and2050usingamoderate(RCP45)toworstcasescenario(RCP85)basedonhistoricaldatafrom1985to201425
Table6Summaryofmeanvaluesforbrowningrisk(percentageofdays)forJanuaryandFebruary26
ListofFigures
Figure1Australiarsquosappleandpearindustrycentres(white)andlocationsreferredtointhetext5
Figure2ExamplesoftheuseoftheinterpolationroutinetoconvertdailymaximumandminimumtemperaturestohourlyTheorangelineis21December2015andthebluelineis21June2015forApplethorpeDotsindicatethemaximum(orange)andminimum(blue)foreachdaythatwereusedtogeneratetheinterpolatedhourlydata7
Figure3MeasuredhourlytemperaturedataandhourlydatainterpolatedfromdailymaximumandminimumforApplethorpeLineshowsthe11correlation8
Figure4ComparisonofchillportionaccumulationcalculatedfromorchardhourlydatahourlydatainterpolatedfromtheorcharddailymaximaandminimaandthenearbyAWS8
Figure5Trendsintemperaturefrom1970to2015RedshowsthatthetrendintemperaturehasbeentowardshottertemperatureswhileblueshowsatrendtowardscoolertemperaturesThehighertheintensityofcolourthestrongerthetrendcopyCommonwealthofAustralia2016AustralianBureauofMeteorology11
Figure6Averageautumn-winterminimumtemperatureanomaliescomparedtoabaseperiodof1981to2010Theblacklineisan11-yearmovingaverage12
Figure7Averageautumn-wintermaximumtemperatureanomaliescomparedtoabaseperiodof1981to2010Theblacklineisan11-yearmovingaverage13
Figure8Annualanomaly(averagechange)inaccumulationofchillportions(1Marchndash31August)comparedtoabaseperiodof1981to2010Theblacklineisan11-yearmovingaverage14
Figure9Averagespring-summerminimumtemperatureanomaliescomparedtoabaseperiodof1981to2010Theblacklineisan11-yearmovingaverage15
Figure10Averagespring-summermaximum(right)temperatureanomaliescomparedtoabaseperiodof1981to2010Theblacklineisan11-yearmovingaverage16
Figure11Annualanomaly(averagechange)inaveragenumberofdayswheremaximumtemperatureexceeds35degCcomparedtoabaseperiodof1981to2010Theblacklineisan11-yearmovingaverage17
Figure12Measured(CapeGrimTasmaniaandMaunaLoaHawaii)andFutureCO2forRCP45andRCP85andmeasuredandpredictedtemperatureanomaly(TA)usingtherelationshownintheinset19
4
Figure13AccumulationofchillforhistoricalaverageconditionsatManjimupandforaprojectedclimatefor2030underRCP45andRCP85(top)Themonthlychangeinaveragetemperaturethatcausedthedifferenceinthechillaccumulationinthefutureisshowinthelowergraph20
Figure14MeanmonthlyminimumtemperaturesforApplethorpefor2030underRCP45(left)andRCP85(right)22
Figure15MeanmonthlyminimumtemperaturesforApplethorpefor2050underRCP45(left)andRCP85(right)22
Figure16TheChill-OverlapModelCristhechillrequiredforfloweringCoisthemaximumadditionalchillthatwillreducetheheatrequirementHristheheatrequiredwhenCochillisaccumulatedandHoistheheatrequiredwhenchillisanCr(RedrawnfromDarbyshireetal2016)23
5
IntroductionThisreportsetsoutourcurrentknowledgeofhowclimatechangewillaffectpomefruitgrowing
regionsinAustraliaAllthepomefruitgrowingregionsinAustraliahaveseenaconsistentwarming
trendsince1970forbothwinterandsummertemperaturesInresponsetothisgrowershavebegun
toadaptthemanagementoftheirorchardstocopewiththesechangestoremainprofitableThese
trendsarelikelytocontinuesowhatcangrowersexpectinthefuture
SiteDescriptionsandDataPreparation
Trendsintemperatureovertheperiod1968to2015havebeenpresentedastheyearlyaverage
change(anomaly)fromabaselineperiodof1981to2010(30years)foreachofthesitesshownin
Figure1
DatawereobtainedfromSILO1
(Jeffreyetal2001)arepositoryof
climatedataforAustraliaThereare
twosetsofdataavailableagridded
dailydatasetandthepatchedpoint
dataset(PPD)Dataforthesites
showninTable1wasextracted
fromthePPDwhichprovidesdaily
maximumandminimum
temperaturesfrom1889tothe
presentInterpolatedvaluesare
insertedtomaintaincontinuitywhen
dataaremissingforsomereason
egthestationwasnotoperating
duetomalfunctionInterpolationis
usuallyfromdailysurfacesbutinsomecasesmightcomefrommorelong-termandhenceless
accuratespatialdataThesitesselectedforthestudyhadagenerallylownumberofdayswhendata
wasmissing(Table1)
1httplongpaddockqldgovau
Figure1Australiarsquosappleandpearindustrycentres(white)andlocationsreferredtointhetext
6
MeteorologicalstationsinAustraliathatrecordtemperatureareasmallfractionofthetotalnumber
ofstationsStationsatlocalpostofficesthatrecordeddatabyhandhavesometimesbeenclosedin
favourofautomaticweatherstations(AWS)nearbyoftenatanairfieldThePPDresolvessomeof
theseproblemsandprovidesdataforstationsregardlessoftheirprevioushistoryHoweverthis
reducesthereliabilityofdatasetsfromstationswithalotofmissingobservationsMountBarkerand
OrangewereusedhereinpreferencetoLenswoodandBatlowrespectivelybecausethesestations
havemorereliablehistoricaltemperaturerecords
Table1Descriptionofweatherstationsusedintheanalysis
StationNumber
StationName2
(Shortname)
LongitudeLatitude
FirstObservation LastObservation
Missing()
41175 Applethorpe 15195degE2862degS
1Jan1968 Current 74
81049 TaturaInstituteforSustainableAgriculture
(Shepparton)
14539degE3643degS
2July1965 Current 32
9573 Manjimup 11614degE3425degS
2Jan1968 Current 37
63254 OrangeAgriculturalInstitute
(Orange)
14908degE3332degS
2Jan1976 Current 203
94069 Grove
(Huonville)
14708degE4298degS
1Jan1968 10Feb2010 203
23733 MountBarker 13885degE3507degS
1Jan1968 Current 19
2DataforSheppartonandHuonvillecomesfromtheTaturaInstituteforSustainableAgricultureandGroverespectively
7
ModelsforcalculatingwinterchillrelyonhourlydataHoweverhourlydataisnotgenerallyavailable
fromtheBureauofMeteorologyweatherstationsandneedstobegeneratedfromdailymaximaand
minima
DailydatawereconvertedtohourlyusingtheroutineinthechillRpackage(Luedelingetal2013)
usingtheRStatisticalLanguage(RCoreTeam2015)Thisusestheinterpolationroutinedevelopedin
Linvill(1990)AnexampleofthisinterpolationisshowninFigure2
Figure2ExamplesoftheuseoftheinterpolationroutinetoconvertdailymaximumandminimumtemperaturestohourlyTheorangelineis21December2015andthebluelineis21June2015forApplethorpeDotsindicatethemaximum(orange)andminimum(blue)foreachdaythatwereusedtogeneratetheinterpolatedhourlydata
Reliabilityoftechniquesusedtointerpolatebetweendailyandhourlytemperatures
Hourlytemperaturedatafor2013inApplethorpe(collectedfromanon-siteorchardtemperature
loggerARS1)wasusedtoassesstheaccuracyoftheinterpolationmethodThedailymaximaand
minimaweretakenfromtheorchardhourlydatasetandtheinterpolationmethodwasappliedto
recreatethehourlydataTheorchardhourlydatawasthencomparedwiththeinterpolatedhourly
dataFigure3
Thecorrelationcoefficientis097indicatingacloserelationshipbetweenthetwosetsofdata
howevertheeffectoftheinterpolationcanstillbeseenThesensitivityoftheDynamicModeltothe
discrepanciesbetweenobservedandinterpolatedhourlydataneedstobeassessedintermsofchill
accumulationandheatstress
8
Figure3MeasuredhourlytemperaturedataandhourlydatainterpolatedfromdailymaximumandminimumforApplethorpeLineshowsthe11correlation
Figure4ComparisonofchillportionaccumulationcalculatedfromorchardhourlydatahourlydatainterpolatedfromtheorcharddailymaximaandminimaandthenearbyAWS
Thechillportionscalculatedfromthethreedatasetswereincloseagreementwhichisimportantas
theSILOdataneedstobeusedtoconsiderfutureclimateprojectionsFigure4
Theimpactoftheinterpolationonthecalculationofheatthresholdsismoreproblematic
Interpolationfromdailyorcharddatatohourlyoverestimatedthenumberofhoursexceeding30degC
by36Importantlybasedonthenumberofdaysexceedingthe30degCthresholdtherewasonlya
differenceoftwodaysbetweenorcharddailyandtheautomaticweatherstation(AWS)dataThisis
acceptableandistheapproachthatisusedinourstudy
ModelsofChillAccumulationWhatiswinterchill
Thedormantwinterphaseisanevolutionaryadvantagethatprotectsfruittreesfromcoldweather
damagebypreventingthegrowthofcold-sensitiveshootsandflowersinresponsetoawinterwarm
spellFortreestoresumegrowthinspringthisdormantphasemustbebrokenPerennialfruittrees
breakdormancyaftercertainwinterconditionshavepassed-thetreehasthendeterminedthat
winterhasfinishedandwillbegintoflowerinresponsetowarmtemperaturesThewinterchill
requiredtobreakdormancythechillingrequirementdiffersbycropandvarietyandpossibly
locality
AccumulationofwinterchilltobreakdormancyislargelyatemperaturedependentprocessThe
relationshipofdifferenttemperaturesandtemperatureregimestodormancybreakingarespecies
andcultivar-specificbuttherearesomegeneralaspectsthatarethoughttobeinvolved
bull Freezingtemperaturesdonotcontributetodormancybreaking
9
bull Thereareoptimumtemperaturesfortheaccumulationofwinterchill
bull Temperatureseithersideoftheoptimumdecreasethecontributiontowinterchill
bull Hightemperaturescanundopreviouslyaccumulatedchill
bull Cyclingmoderatetemperatureswitheffectivechillingtemperaturesenhancesthe
accumulationofwinterchill
bull Itisstilllargelyunknownwhenatreebecomessensitivetothechillingtemperaturendashitcould
evenbebeforeleafdrop
TheseassumptionscanbeexpressedasasetofcalculationsthattogetherformachillmodelThe
threemostcommonmodelsareChillHoursUtahChillUnitsandtheDynamicModel
ChillHours
TheChillHoursmodel(Weinberger1950)isbyfarthesimplestmodelItaccumulatesthenumberof
thehourswherethetemperatureislessthan72degCandgreaterthan0degCThereisaformthatalso
includeshoursbelow0degCbutinthisstudywehaveusedthe0degCthreshold
UtahChillUnits
Thismodel(Richardsonetal1974)usesaslightlymorecomplicatedprocedureinwhichlowandhigh
temperaturesadverselyaffecttheaccumulationofchillThemethodofcalculationisasfollows
whereTisthetemperaturerecordedforthehourindegC
LowerLimit(TgtdegC) UpperLimit(Tlt=degC) ChillUnitsContributed
14 0
14 24 05
24 91 10
91 159 05
159 18 -05
18 -10
Hoursspentatorbelow14degCdonotcontributetochillaccumulationGreatestchillaccumulationis
between24andlessthanorequalto91degCTemperaturesabove159degCreducethechill
accumulationastheycontributenegativechillunits
DynamicModel
10
TheDynamicModel(Fishmanetal1987Erezetal1990)whichcalculateschillinChillPortionsis
themostcomplexofthechillmodelsItisthecurrentbestpracticemodelespeciallyinwarmer
climates(Erez2000Luedelingetal2011)andisthereforethemodelwehaveusedforwinterchill
calculationsInthismodelaccumulationofchillisadynamicprocesswherebytheequationsdescribe
thebuild-upofahypotheticaldormancybreakingfactor(DBF)throughatwo-stepprocess
TheaccumulationofDBFisreferredtoasChillPortionsandaChillPortionhasaccumulatedwhenthe
amountofDBFreaches1AtthispointitformspartofthestablepoolandcannotbedestroyedIf
lessthan1iscurrentlyinthelabilepoolitcanbereducedThisisseenwhenwarmtemperatures
occurandthereisnochillaccumulationHoweverthecurrentnumberofChillPortionsisnot
reducedProductionofDBFoccursbetween0degCand12degCandisoptimalbetween6degCand8degCThe
modelalsocapturesthesituationobservedinsometreecropswhereaccumulationofchillis
enhancedwheniftemperaturesintherange13degCto16degCarecycledwithlowertemperatures
11
TrendsinTemperatureandChillAccumulationTrendsintemperaturehavebeenassessedintermsofannualtemperatureandseasonalmaximum
andminimumtemperaturesforeachofthesitesTheBureauofMeteorology(BoM)maintainsaweb
pagethatallowstrendsinclimatevariablestobeassessed3ThemapsshowninFigure5show
consistentwarmingtrendsacrossthepomeandstonefruitgrowingregions
Figure5Trendsintemperaturefrom1970to2015RedshowsthatthetrendintemperaturehasbeentowardshottertemperatureswhileblueshowsatrendtowardscoolertemperaturesThehighertheintensityofcolourthestrongerthetrendcopyCommonwealthofAustralia2016AustralianBureauofMeteorology
Autumnandwinter
Autumnandwintertemperatureslargelydetermineprogressionthroughdormancyandsignificantly
impactfloweringtimingandqualityinpomefruittreesForexamplewarmweatherinautumn
causesdelaysinleafdropandslowstheentranceintodormancyMildwintersresultinginalackof
winterchillcausedelayedunevenandprotractedflowering
3httpwwwbomgovauclimatechangetabs=Trackeramptracker=timeseries
12
MinimumtemperaturesinautumnandwinterhaveincreasedinHuonvilleOrangeandMtBarker
since1968(Figures6)InHuonvilleandOrangethewarmingtrendismoreapparentinminimum
temperaturesthanmaximumsoverthisperiodwhileApplethorpeSheppartonManjimupandMt
Barkerallshowanincreaseinmaximumautumnandwintertemperatures(Figure7)
Applethorpe Shepparton
Manjimup Huonville
Orange MountBarker
Figure6Averageautumn-winterminimumtemperatureanomaliescomparedtoabaseperiodof1981to2010Theblacklineisan11-yearmovingaverage
AtApplethorpeSheppartonandMountBarkeritwasmorelikelythatafter1990maximum
temperaturesduringautumnandwinterwouldgreaterthanthelong-termaverage(Figure7)
13
Applethorpe Shepparton
Manjimup Huonville
Orange MountBarker
Figure7Averageautumn-wintermaximumtemperatureanomaliescomparedtoabaseperiodof1981to2010Theblacklineisan11-yearmovingaverage
Winterchill
ThemildergrowingregionsofApplethorpeManjimupandMtBarkerhaveexperiencedadeclinein
thenumberofchillportionsaccumulatedsince1968(Figure8)Sheppartonhasseenasmall
reductioninwinterchilloverthisperiodwhilethecolderregionsofHuonvilleandOrangehavenot
changedEightoutoftenyearsinManjimupfrom2006to2016havehadlesswinterchillthanthe
long-termaverageFigure8
14
Applethorpe Shepparton
Manjimup Huonville
Orange MountBarker
Figure8Annualanomaly(averagechange)inaccumulationofchillportions(1Marchndash31August)comparedtoabaseperiodof1981to2010Theblacklineisan11-yearmovingaverage
15
SpringandSummer
Temperaturesexperiencedinspringandsummerareanimportantdriverofflowerandfruit
developmentandsignificantlyimpactonfruitqualityinappleandpeartreesForexamplewarm
weatherinspringtendstoshortentheperiodoffloweringandheatinsummerimpactscolour
developmentthroughinhibitionofanthocyanins(Lin-Wangetal2011)Extremesummer
temperaturesinhibitfruitgrowthandcausesunburnbrowning(Flaishmanetal2015)
Applethorpe Shepparton
Manjimup Huonville
Orange MountBarker
Figure9Averagespring-summerminimumtemperatureanomaliescomparedtoabaseperiodof1981to2010Theblacklineisan11-yearmovingaverage
16
TherewereclearwarmingtrendsintheminimumspringandsummertemperaturesatOrangeand
MtBarker(Figure9)AtSheppartonOrangeandMountBarkeritwasthreetofourtimesmorelikely
thattheaverageminimumtemperaturemeasuredafter1990wasgreaterthanthelong-term
averagecomparedtothatmeasuredbefore1990Springandsummermaximumtemperatureshave
warmedinmostlocationssince1968exceptforHuonville(Figure10)Thishasimplicationsforthe
frequencyofextremeheateventsandwarmerspringtemperaturesmayhaveoffsetthereductionin
chillingobservedinmildergrowingregions
Applethorpe Shepparton
Manjimup Huonville
Orange MountBarker
Figure10Averagespring-summermaximum(right)temperatureanomaliescomparedtoabaseperiodof1981to2010Theblacklineisan11-yearmovingaverage
17
ExtremeHeat
Sheppartonhasexperiencedanincreaseinthenumberofextremeheatdays(iemaximum
temperatureexceeded35degC)receivedperyearsince1968(Figure11)Maximumtemperaturesrarely
exceedthisthresholdinApplethorpeandHuonvilleandthesesiteshavenotseenmuchchangeover
theperiodMountBarkershowedasignificanttrendinthenumberofheatdaysandthelastsixyears
inManjimuphavebeenabovethelong-termaverage
Applethorpe Shepparton
Manjimup Huonville
Orange MountBarker
Figure11Annualanomaly(averagechange)inaveragenumberofdayswheremaximumtemperatureexceeds35degCcomparedtoabaseperiodof1981to2010Theblacklineisan11-yearmovingaverage
18
ClimateScenariosforapplegrowingregionsfor2030and2050
Howwerethescenarioschosen
Futureclimateprojectionsarederivedusingsimulationsoftheearthrsquosclimatesystem(GlobalClimate
ModelorGCM)underdifferentscenariosoffuturegreenhousegasandaerosolemissionsThe
scenariosarereferredtoasrepresentativeconcentrationpathways(RCPseeinsetbelow)and
representaplausiblesetoffutureemissionsAGCMusesthisinformationthroughthecomplexset
ofequationsthatdeterminehowtheclimaterespondstochangesintheatmosphereRCPsare
classifiedbytheamountofradiativeforcing(seeinset)thatwillbeexperiencedin2100
The measured and projected levels of atmospheric CO2 are shown in Figure12 It is worth noting
that the projected level in 2100 under RCP 45 is the same as the level reached in 2050 under
RCP 85 The observed emission trends (2005-2012) are in line with the worst-case scenario
RCP85(Petersetal2012) Policy decisions made over the next decade or so will be critical in
RepresentativeConcentrationPathways(RCPs)
Radiativeforcingistheextraheatthattheloweratmospherewillretainasthe
resultofadditionalgreenhousegasesIn1979thisamountedto17Wm-2By
2014thishasrisento29Wm-2In1979theCO2concentrationwas335ppmThe
currentlevelasofFebruary2016is398ppm
RCP45andRCP85havebeenselectedtorepresenttherangeofplausiblefuture
climates
RCP45achievingloweremissionsduetosomemitigationeffortsandtheCO2
concentrationreaching540ppmby2100(risingmoderatelyrapidlyandthen
peakingearly)ndashsettingaminimumtomediumcaseclimatechangescenario
RCP85abusiness-as-usualapproachwithCO2concentrationcontinuingtorapidly
risereaching940ppmby2100ndashsettingaworst-caseclimatechangescenario
Source(ButlerandMontzka2016CSIRO2016)
19
determining the pathway that is taken Data from BoM4 of the global temperature anomaly and
yearly maximum atmospheric CO2 recorded at Mauna Loa from 1958 to 2016 were used to
derive a simple relationship between them that accounts for 82 of the variation (see inset
Figure12)
Figure12Measured(CapeGrimTasmaniaandMaunaLoaHawaii)andFutureCO2forRCP45andRCP85andmeasuredandpredictedtemperatureanomaly(TA)usingtherelationshownintheinset
Todeterminetheprojectionsoffutureclimatechangeitisfirstnecessarytoextractthemonthly
changefactorsClimatechangefactorsallowtheinformationfromcoarse-grainedGCMs(typically
100-200km)toberepresentedatalocalscaleAclimatechangefactorforJanuary2030usingthe
ACCES10modelmightbe+1degCthisisaddedtothedailyobservationsforJanuarytocreatea
possibleclimateThisprocessisrepeatedforeachmonthtimescaleandGCMThisallowsafuture
climatesettobecreatedthatincorporateshistoricalvariability
4httpwwwbomgovauclimatechangeindexshtmltabs=Trackeramptracker=global-timeseries
20
Whiletheactualchangesmaybesmallrelativetodailytemperaturevariationsthebiological
responsemaybesignificantbecauseoftheimpactofthresholdtemperaturesCalculationsofchilling
forexampleusethresholdtemperaturestodeterminethecontributionmadetodailychill
accumulationAsmallshiftintemperaturethroughoutautumnandwintercanhavealargeeffecton
theoutcomeasdemonstratedforManjimupin2030Figure13Theindividualtemperaturechange
foragivenmonthandRCPmayonlybeintheregionof05to12degCbutovertheseasonthisis
enoughtoreducetheaccumulatedchill
Figure13AccumulationofchillforhistoricalaverageconditionsatManjimupandforaprojectedclimatefor2030underRCP45andRCP85(top)Themonthlychangeinaveragetemperaturethatcausedthedifferenceinthechillaccumulationinthefutureisshowinthelowergraph
SelectionofGlobalClimateModels
GlobalClimateModels(GCM)wereselectedfromthelistofmodelsgeneratedbytheClimateFutures
ToolattheClimatechangeinAustraliawebsite5ThreeGCMs(Table2)wereselectedbasedonahigh
Mscore(Watterson1996)thatmeasurestheabilityoftheGCMtorepresenthistoricalobservations
AperfectmatchwouldhaveanMscoreof1000TheGCMsselectedandtheiraverageMscores
wereACCCES1-0(727)HadGEM2-ES(720)andMPI-ESM-LR(720)Inthiscasetheagreement
betweenmodelledandobservedclimatewasbasedontemperaturerainfallandmeansealevel
pressureforthefourseasonsoverthewholeofAustraliaThesemodelsscoredgreaterthan800for
5httpwwwclimatechangeinaustraliagovau
21
surfacetemperaturealoneForRCP45theseGCMswereinagroup(2338GCMs)thatpredicted
warmerwintermaximumandminimumtemperaturesTheprojectedchangeintemperaturewas
from05degCto15degCForRCP85HadGEM2-ESwasgroupedwiththosethatshowedawarmer
minimumtemperaturebuthottermaximumtemperatures15degCto30degC(1340GCMs)ACCESS10
andMPI-ESM-LRweregroupedwiththosethatshowedwarmerminimumandmaximum
temperaturesinwinter(2440)
Table2DescriptionofGCMsusedinthisstudy
GCM Institute AverageM
score1000
FurtherInformationandspatialresolution
(latitudexlongitude)
ACCESS1-0 CSIROand
Bureauof
Meteorology
727 httpsconfluencecsiroaudisplayACCESSHome
(125degx1875deg)
HadGEM2-
ESM
MetOffice
HadleyCentre
720 httpwwwmetofficegovukresearchmodelling-
systemsunified-modelclimate-modelshadgem2
(125degx1875deg)
MPI-ESM-LR MaxPlanck
Institutefor
Meteorology
720 httpwwwmpimetmpgdeensciencemodelsmpi-
esmhtml
(1865degx1875deg)
CalculationofClimateProjectionsforStationData
ClimatechangefactorswereobtainedfromgriddeddatasetsintheCIMP5multi-modelensemble6
(seeTayloretal2011)andappliedasmonthlyclimatechangefactorstothedailydataforeachof
thesites
Themethodusedtoperturbthepresentclimatetoafutureclimateresultsinashiftthatcanbeseen
onamonthlyscale(Figures14and15)Thisisbecausethechangefactorappliedtodaily
temperaturesisthesamewithineachmonth
Figures14and15demonstratethatuntil2030thechoiceoftheRCPhaslittleimpactbutby2050
thedifferencescausedbythehigheremissionsintheRCP85pathwaycanbeclearlyseen
6httpnrm-erddapnciorgauerddapindexhtml
22
Figure14MeanmonthlyminimumtemperaturesforApplethorpefor2030underRCP45(left)andRCP85(right)
Figure15MeanmonthlyminimumtemperaturesforApplethorpefor2050underRCP45(left)andRCP85(right)
23
FutureClimateProjectionsandtheImpactonFloweringThe relationship between chilling and flowering can been described mathematically (Popeetal
2014) such that the amount of chill that accumulates affects the flowering date because the
amount of heat required to promote
flowering is altered(Darbyshireetal
2016) found that for Cripps Pink
apples the minimum amount of chill
required is 34 Chill Portions Less
than this critical amount of chill
cannot be compensated for with
heating and there is no effective
flowering If additional chill is
accumulated then there is a lower
requirement for heat This
relationship between the
accumulation of chill and the heat
requirement is referred to as the
Chill-Overlap Model Figure16
FuturechillaccumulationasmeasuredbyChillPortions(CP)willdeclinein2030and2050under
boththeRCP45andRCP85scenariosatgrowingregionsacrossAustralia(Table3)Thehighest
declineswillbeforManjimupApplethorpeandMtBarkeralthoughallsitesshowadeclineThe
smallestdeclinesareatOrangeandHuonvillewhichdeclinebylessthan5in2030andbylessthan
15in2050undereitherRCP45orRCP85
Using the mathematical relationships embodied in the Chill-Overlap model (Figure16) it is
possible to compare how full bloom dates might change in the future and whether the
increased temperatures during spring and summer can compensate for the reduced chill
accumulation (Table5)
Figure16TheChill-OverlapModelCristhechillrequiredforfloweringCoisthemaximumadditionalchillthatwillreducetheheatrequirementHristheheatrequiredwhenCochillisaccumulatedandHoistheheatrequiredwhenchillisanCr(RedrawnfromDarbyshireetal2016)
24
Table3Summaryofaveragechillportions(1Marchndash31August)for2030and2050usingamoderate(RCP45)toworstcasescenario(RCP85)modellingapproachbasedonhistoricaldatafrom1985to2014Meanof30yearswithlowestandhighestinparentheses
Present
2030 2050
RCP45 RCP85 RCP45 RCP85
Applethorpe 72(62-83) 63(48-75) 60(44-73) 56(41-69) 51(36-65)
Shepparton 84(73-93) 75(63-85) 74(62-86) 71(58-81) 67(57-79)
Manjimup 67(55-82) 57(43-76) 55(42-75) 50(36-72) 47(33-68)
Huonville 105(94-113) 98(81-112) 97(78-110) 93(74-105) 90(71-104)
Orange 100(90-110) 94(85-104) 93(82-101) 90(81-99) 87(78-94)
MountBarker 84(67-93) 74(55-88) 73(53-88) 70(53-84) 65(47-80)
Theconceptofsafewinterchill(SWC)wasintroducedbyLuedelingetal(2009)ameasurethatcan
bethoughtofasthenumberofchillportionsthatagrowercouldexpectin90ofyears
Table4Safewinterchillcalculationsfortheperiod1985to2014
Present
2030 2050
RCP45 RCP85 RCP45 RCP85
Applethorpe 67 55 55 47 46
Shepparton 76 67 68 66 59
Manjimup 60 49 52 44 41
Huonville 99 91 94 88 86
Orange 94 87 87 85 81
MountBarker 74 62 66 60 56
ReductionsintheSWCinApplethorpeManjimupandMountBarkerweresimilarandrangedfrom
16to17in2030and18to32in2050
25
Orangealocationwithahighchillaccumulationtheaveragedateoffullbloomisadvanced(earlier
bloom)by4to5daysOtherlocationsshowedadelayedfullbloomdatewiththegreatestimpactfelt
atManjimupthelocationwiththeleastchillatpresentandintothefuture
Table5Summaryofaveragedateoffullbloom(CrippsPink)for2030and2050usingamoderate(RCP45)toworstcasescenario(RCP85)basedonhistoricaldatafrom1985to2014
Average
PredictedFull
BloomDate Present
2030
2050
RCP45 RCP85 RCP45 RCP85
Applethorpe 4Oct 7Oct 9Oct 12Oct 16Oct
Shepparton 30Sep 3Oct 3Oct 5Oct 6Oct
Manjimup 16Oct 22Oct 25Oct 30Oct 2Nov
Huonville 26Sep 27Sep 29Sep 29Sep 29Sep
Orange 2Oct 28Sep 28Sep 28Sep 27Sep
MountBarker 1Oct 5Oct 4Oct 6Oct 8Oct
Delaysinfullbloomdatearecausedwhenlesswinterchillisaccumulatedduringtheautumnand
winterperiodandconsequentlymoreheatisneededtopromotefloweringManjimupislikelyto
experiencethegreatestdelayinfullbloomdatesinfutureclimatescomparedwithotherlocations
Thisisbecausechillaccumulationabove34CPthisisCrFigure16-thechilloverlapmodelin
Manjimupdropsfrom22CPinthepresentclimateto14ndash16CPin2030and10ndash12CPin2050To
compensateforthisagreateraboutofheatneedstobeaccumulated(iemovingfromHrtowards
HoinFigure16)andthisrequiredanextra6to9daysin2030and14to17daysin2050In
comparisonatOrangethemuchcoolerwintertemperaturesandhighchillaccumulationloweredthe
requirementforheatThishelpedtoadvancethedatefullbloombecauseofhigherspring
temperatures(Figure9andFigure10)
FutureProjectionsofImpactonQualityOneofthemainrisksforproductionisextremeheatdaysasthisleadstosunburnbrowningSun
damageriskinRoyalGalawasstudiedinapplegrowingregionsinAustralia(Darbyshireetal2015)
Theydevisedabrowningriskdayfornon-nettedandnettedorchardsbasedonairtemperaturesand
26
foundthatdailymaximumtemperaturesgreaterthan341degCinnon-nettedorchardsand379degCin
nettedorchardswereassociatedwithanincreasedriskofbrowningWhilethatstudyandWebbet
al(2016)consideredJanuarytemperatureswehaveextendedtheanalysistoincludeFebruaryas
thiscoincideswiththefruitingperiodUsingthedailymaximumtemperaturesforJanuaryand
Februaryfrom1981to2010(present)andfutureclimatesin2030and2050wecalculatedthe
browningriskasthepercentageofdaysthatexceededthetemperaturethresholdswithandwithout
nettingFollowingWebbetal(2016)weclassifiedbrowningriskin5categories
pound5 gt5to10 gt10to20 gt20to30 gt30to50
Table6Summaryofmeanvaluesforbrowningrisk(percentageofdays)forJanuaryandFebruary
WithoutNetting 2030 2050
Site Present RCP45 RCP85 RCP45 RCP85
Applethorpe 11 24 28 28 49
Shepparton 183 239 268 275 358
Manjimup 100 152 152 166 198
Huonville 24 34 38 45 42
Orange 24 38 44 37 84
MtBarker 173 207 229 232 258
WithNetting 2030 2050
Site Present RCP45 RCP85 RCP45 RCP85
Applethorpe 00 00 01 01 04
Shepparton 48 70 90 88 132
Manjimup 16 38 39 44 60
Huonville 03 06 10 12 11
Orange 01 01 01 01 07
MtBarker 54 72 91 94 107
27
SheppartonMountBarkerandManjimupwillbemostadverselyaffectedwithoutnettinghowever
thiscanbelargelyoffsetwithnettingWithoutnettingManjimupmovestothesamecategoryby
2030thatSheppartonandMountBarkercurrentlyexperienceApplethorpeHuonvilleandtoalesser
extentOrangeareinlowriskcategoriesandarelikelytoremainthatwayinthefuture
DiscussionandConclusionsClimatechangerepresentsanimportantfactorforperennialtreecropswhetherthatisbecauseof
reducedchillorincreasedriskofsunburnbrowningTherehasbeenatendencytoconsiderthat
applesgenerallyhaveahighchillingrequirementyetsuccessfulcropsaregrowninSouthAfrica
(Cook2010)andManjimupwherethechillislowincomparisontotraditionalgrowingregionsLow
chillcancausearangeofproblemsincludingdelayedorerraticbudbreakbudabscissionlower
flowerandfruitqualityandreducedyield(seetableinAtkinsonetal2013)Safewinterchill
(Luedelingetal2009)underfutureclimatesisapossibleindicationofwhattoexpectApplethorpe
recordsalowerSWCin2030forthemoreoptimisticRCP45thanpresentdayManjimup(Table4)
Perennialtreecropindustriesareparticularlyvulnerabletoclimatechangebecauseofthecostand
longevityoforchardestablishmentWhilemanygrowershavebeenadaptingtothetrendsalready
evidentinahighlyvariableclimatetheimpactoffutureclimatemightbeunderestimatedbecauseof
thelanguageusedbyclimatescientistsandthemediaA1-2degCincreaseintemperaturemightseem
trivialconsideringdailyfluctuationshoweverascanbeseenfromtheanalysesthesecan
accumulateacrosstheseasonandhavelargerimpactsthroughdelayedfloweringandincreasedrisk
ofsundamage
Theimpactofchangesintemperaturesonfloweringinthefuturearecomplicatedbytheinteraction
betweenareductioninchillaccumulationduringwinterandincreasedspringandsummer
temperaturesWhilethechill-overlapmodelisusefulinunderstandingtheserelationshipsitisbased
largelyonhypotheticalprocessesGapsinourknowledgesuchasunderstandingwhenplantsstart
andstopchillaccumulationneedtobebasedonphysiologyietheunderstandingofthechemical
processes(Atkinsonetal2013)Thishasproveddifficultbecausetherearenooutwardsignsthat
canbeusedItishopedthatchemicalmarkersfortheseprocessescanbefoundsothatour
understandingwillbegreatlyadvancedThiswouldhavetheadvantageofbeingabletomakebetter
estimatesofhowthingsmightchangeinthefutureandpossiblyleadtobreakthroughsinbreeding
programsAtamorefundamentallevelourcurrentbestmodelformeasuringandpredictingchill
accumulationtheDynamicModelusesparametersthathaveonlybeenparameterisedforpeach
28
becausetheonerousexperimentalproceduresrequiredtoderivethemFurthermoreitreliesona
hypotheticalfactorthatmayormaynotexistThemodelespeciallyaspartofthechilloverlap
modelremainsthemostusefulwayofpredictingflowering
Take-homemessagesfromthehistoricalrecord
bull Allpomefruitgrowingregionshavegenerallyseenanincreasingtrendinmaximum
temperaturesinwinterandmaximumandminimumspringtemperatures
bull Thestrongestdownwardstrendinchillaccumulationhasoccurredatthemilderlocationsof
ApplethorpeManjimupandMountBarker
bull SpringandsummermaximumtemperaturesatalllocationsexceptHuonvilleshowan
upwardtrendThisisparticularlynoticeableforManjimupwhichhasrecordedahigherthan
long-termaveragemaximumsince2009
bull ExtremeheatisanemergingprobleminManjimupandgrowingregionsinNSWHeatdamage
hasbeenaprobleminVictoriaandtheincreaseobservedinManjimuphasprompteddetailed
studiesofhowandwhenbrowningoccursandatrialofnetsinthoseareas
Take-homemessagesfromthefuturescenarios
bull Smallincreasesinaveragetemperaturesmultiplytheireffectthroughtheaccumulationof
timeaboveorbelowthresholds
bull Theresponseofthepomefruittreetoreducedchillmaybepartiallyoffsetbyincreased
springandsummertemperaturesbutourcurrentbestunderstandingofthissuggeststhat
thiscannotoccurindefinitely
bull Upto2030-2040thedifferencesbetweentheclimatechangescenariosaresmallThe
childrenofthegrowerswhoarefarmingtodaymayin2050befacingaverydifferent
growingenvironmentInApplethorpewherealowchillyearis60CPnowwillfeellikeagood
yearandtheworstyearswillbelikenothingthathasbeenencounteredbefore
bull Thereisacomplexinterplaybetweenchillingandwarmingonthetimingoffloweringthatwe
areonlyjuststartingtounderstandMuchofourknowledgeofhowpomefruittreesrespond
hasbeeninconditionswherechillhasbeenmorethanadequateThechilloverlapmodelhas
beenusefulasmodelofthissituationbutthebiologicalbasisisuncertain
bull ExtremeheatwillcontinuetobeaprobleminhotsummerregionssuchasSheppartonwhere
italreadypresentschallengesforfruitqualityandisanemergingproblemforregionslike
ManjimupwhichcurrentlyhaveamildersummerclimateTheimpactonmarketablequalityis
wellknownandinvestmentinnettingseemstobethemostpracticalsolution
29
ReferencesAtkinsonCJRMBrennanandHGJones2013Decliningchillinganditsimpactontemperate
perennialcrops9148ndash62
ButlerJHandSAMontzka2016theNOAAannualgreenhousegasindex(AGGI)
httpwwwesrlnoaagovgmdaggiaggihtml
CookNC2010Appleproductionunderconditionsofsub-optimalwinterchillinginSouth
Africa199ndash204
CSIRO2016CapeGrimGreenhouseGasdataCSIROhttpwwwcsiroaugreenhouse-gases
DarbyshireRKPopeandIGoodwin2016Anevaluationofthechilloverlapmodeltopredict
floweringtimeinappletree198142ndash149
DarbyshireRLMcClymontandIGoodwin2015SundamageriskofRoyalGalaappleinfruit-
growingdistrictsinAustralia43222ndash232
ErezA2000BudDormancyPhenomenonProblemsandSolutionsintheTropicsandSubtropics
Pages17ndash48inTemperateFruitCropsinWarmClimatesSpringerNetherlandsDordrecht
ErezASFishmanGCLinsley-NoakesandPAllan1990TheDynamicModelforRestCompletion
inPeachBuds165ndash174
FishmanSAErezandGACouvillon1987Thetemperaturedependenceofdormancybreakingin
plantsMathematicalanalysisofatwo-stepmodelinvolvingacooperativetransition124473ndash483
FlaishmanMAYPelesYDahanSMilo-CochaviAFriemanandANaor2015Differential
responseofcell-cycleandcell-expansionregulatorstoheatstressinapple(Malusdomestica)
fruitletsPlantScience23382ndash94
JeffreySJJOCarterKBMoodieandARBeswick2001Usingspatialinterpolationto
constructacomprehensivearchiveofAustralianclimatedata16309ndash330
Lin-WangKUIDMichelettiJPalmerRVolzLLozanoREspleyRPHellensDChagnEgraveDD
RowanMTroggioIIglesiasandACAllan2011Hightemperaturereducesapplefruitcolourvia
modulationoftheanthocyaninregulatorycomplex341176ndash1190
LinvillDE1990CalculatingChillingHoursandChillUnitsfromDailyMaximumandMinimum
TemperatureObservations2514ndash16
30
LuedelingEAKunzandMBlanke2013Identificationofchillingandheatrequirementsofcherry
treesmdashastatisticalapproach57679ndash689
LuedelingEEHGirvetzMASemenovandPHBrown2011ClimateChangeAffectsWinter
ChillforTemperateFruitandNutTreesPLoSONE6e20155
LuedelingEMZhangandEHGirvetz2009ClimaticChangesLeadtoDecliningWinterChillfor
FruitandNutTreesinCaliforniaduring1950ndash2099PLoSONE4e6166
PetersGPRMAndrewTBodenJGCanadellPCiaisCLeQuereGMarlandMRRaupach
andCWilson2012Thechallengetokeepglobalwarmingbelow2degC34ndash6
PopeKSDDaSilvaPHBrownandTMDeJong2014Abiologicallybasedapproachto
modelingspringphenologyintemperatedeciduoustreesAgriculturalandForestMeteorology198ndash
19915ndash23
RCoreTeam2015RALanguageandEnvironmentforStatisticalComputingRFoundationfor
StatisticalComputingViennaAustria
RichardsonEASDSeeleyandRDWalker1974Amodelforestimatingthecompletionofrest
forRedHavenandElbertapeach9331ndash332
TaylorKERJStoufferandGAMeehl2011AnOverviewofCMIP5andtheExperimentDesign
93485ndash498
WattersonIG1996Non-dimensionalmeasuresofclimatemodelperformance16379ndash391
WebbLRDarbyshireTErwinandIGoodwin2016Arobustimpactassessmentthatinforms
actionableclimatechangeadaptationfuturesunburnbrowningriskinapple
WeinbergerJH1950Chillingrequirementsofpeachvarieties56122ndash128
Flowering in pome fruit trees across Australia
Implications of a changing climate
Heidi Parkes and Neil White Department of Agriculture and Fisheries Queensland
November 2016
This publication has been compiled by Heidi Parkes and Neil White of Horticulture and Forestry Science Department of Agriculture and Fisheries copy State of Queensland 2016 The Queensland Government supports and encourages the dissemination and exchange of its information The copyright in this publication is licensed under a Creative Commons Attribution 30 Australia (CC BY) licence Under this licence you are free without having to seek our permission to use this publication in accordance with the licence terms
You must keep intact the copyright notice and attribute the State of Queensland as the source of the publication Note Some content in this publication may have different licence terms as indicated For more information on this licence visit httpcreativecommonsorglicensesby30audeeden The information contained herein is subject to change without notice The Queensland Government shall not be liable for technical or other errors or omissions contained herein The readeruser accepts all risks and responsibility for losses damages costs and other consequences resulting directly or indirectly from using this information
Summary
Australia has warmed by 1degC in the last 100 years and temperatures are predicted to continue warming This will result in reduced winter chill for many apple and pear growing regions of Australia and it is not clear how this will impact on pome fruit production To better understand how climate change will impact flowering in pome fruit trees research was undertaken to evaluate the timing and quality of flowering in cultivars of apple and pear across Australia and how they relate to temperatures received in the orchard Green tip flowering and temperature data was collected in the spring of 2012 2013 2014 and 2015 for cultivars of apple and pear grown in the climatically distinct regions of Applethorpe (Queensland) Shepparton (Victoria) and Manjimup (Western Australia)
For all years of the study Shepparton received the most winter chill with 89 chill portions on average followed by Applethorpe (75 chill portions) and Manjimup (63 chill portions) Low winter chill in Manjimup was associated with greater variation in green tip and full bloom dates between years cultivars and individual trees compared with observations from Applethorpe and Shepparton Additionally trees in Manjimup displayed a long and protracted flowering period compared with the other sites The patterns of flowering observed in Manjimup are possibly the result of inadequate chill Shepparton the site with the most winter chill showed the greatest consistency in green tip and flowering dates
Results from this research support findings from previous studies performed in other parts of the world showing that apples grown in warmer climates exhibit increased variability in flowering Uneven and irregular flowering results in the reduced ability to predict timing of orchard operations more difficult pollination management challenges for thinning and crop load management and can result in increased variability of fruit maturity at harvest
As the climate warms low chill years will become more frequent in milder growing regions of Australia and will likely result in symptoms of inadequate chill in some cultivars Advances in the timing of flowering might be observed in cooler growing regions Australian growers already manage seasonal changes in flowering time and it may be the increasingly protracted and variable flowering that presents the greater management challenge
Options for adaptation to low chill years include planting lower chill cultivars management of delayed and variable flowering with the use of dormancy-breakers and adjustments to chemical and hand thinning practices to reduce variability in fruit size and maturity
Climate change will add significant variability into the pome fruit crop production system This will present challenges for the Australian industry in its ability to consistently supply high quality fruit into export markets and in maintenance of the uniform orchard blocks required to maximise the benefits of mechanisation Ongoing observations of flowering performance and its relationship with chilling will be necessary for making informed predictions about future block and cultivar profitability
Table of contents
Introduction 1
Study objectives 1
Materials and methods 1
Site description 1
Green tip and flowering data collection 3
Calculation of winter chill 5
Results and discussion 5
Winter chill and spring heat 5
Green tip and flowering 7
Green tip and flowering time 7
Variation between cultivars and locations 7
Variation between years 9
Quality of flowering 13
Variation between cultivars and locations 13
Flowering overlap and pollination 15
Flowering and temperature implications of a changing climate 15
Conclusions 17
Key messages 17
Recommendations 18
Industry 18
Scientific research needs 19
Acknowledgements 20
References 20
Table of figures
Figure 1 Site locations across Australia (large blue dot) 2
Figure 2 Mean monthly temperatures for Shepparton Applethorpe and Manjimup 3
Figure 3 Chill accumulation across sites and years Number in brackets is the total chill portions received up to 31 August 5
Figure 4 Green tip (green) and full bloom (pink) dates for apple cultivars in Applethorpe Shepparton and Manjimup Data is the average of observations from 2012 to 2015 with bars indicating the confidence interval 8
Figure 5 Green tip (green) and full bloom (pink) dates for pear cultivars in Applethorpe Shepparton and Manjimup Data is the average of observations from 2012 to 2015 with bars indicating the confidence interval 9
Figure 6 Green tip (green) and full bloom (pink) dates for apple cultivars grown in Applethorpe Shepparton and Manjimup 2013 and 2014 Data points are the average of individual tree observations 11
Figure 7 Chill accumulation in Applethorpe Shepparton and Manjimup 2012 to 2015 Number in brackets is the total chill portions received up to 31 August 12
Figure 8 First flower (orange) and full bloom (pink) dates for apple cultivars in Applethorpe Shepparton and Manjimup Data is the average of observations from 2012 to 2015 Bars indicate the confidence interval 14
Figure 9 First flower (orange) and full bloom (pink) dates for pear cultivars in Applethorpe Shepparton and Manjimup Data is the average of observations from 2012 to 2015 Bars indicate the confidence interval 15
Table of tables
Table 1 Site details 2
Table 2 Description of trees used for phenology observations 4
Flowering in pome fruit trees across Australia Department of Agriculture and Fisheries 2016 1
Introduction
Flowering timing and quality in apple and pear trees is determined by interactions between the genetics of a cultivar and the temperatures it experiences in the orchard throughout the year Cultivars require a certain amount of winter chill and a certain amount of heat for bud dormancy release and flowering and these requirements are largely genetically determined (Cannell 1989 Saure 1985 Samish 1954) Day length is not believed to have a significant role in the timing of flowering in apple (Dennis 2003)
Australia has warmed by 1degC in the last 100 years and temperatures are predicted to continue warming (State of the climate 2016) This will result in reduced winter chill for many apple and pear growing regions of Australia (Darbyshire et al 2013b Hennessy and Clayton-Greene 1995) It is not yet clear what the impact of this will be on the timing and quality of bud dormancy release and flowering in commercial pome fruit cultivars and therefore the potential impacts on productivity Advances in flowering time with increased temperatures has been observed in temperate fruit trees globally (Legave et al 2013) however effects of recent warming in Australia on pome tree flowering are not as clear (Darbyshire et al 2013a)
Changes in timing of flowering may have impacts on yield through the loss of flowering overlap between a cultivar and its pollinisers and potential for increased frost risk (Kaukoranta et al 2010) Variable and protracted patterns of flowering are likely to occur in locations where the warmer climate leads to inadequate chill (Erez 2000) Poor quality of flowering impacts production and profitability through reductions in fruit set difficulties with chemical thinning and greater variability of fruit maturity at harvest (Theron 2013 Oukabli 2003)
Understanding potential impacts of climate change is essential for the timely implementation of appropriate adaptation strategies (Cobon et al 2009) To understand how warming temperatures might impact on flowering it is necessary to first understand the existing flowering behaviour of pome fruit tree cultivars across Australia and how it relates to temperatures received in the orchard
Study objectives
The objective of this research was to evaluate the timing and quality of green tip and flowering in cultivars of apple and pear across Australia and how they relate to temperature to contribute towards understanding of how climate change will impact on pome fruit production
Materials and methods
Site description
Green tip and flowering data was collected in the spring of 2012 2013 2014 and 2015 for cultivars of apple and pear grown in commercial orchards and research facilities situated in Applethorpe (Queensland) Shepparton (Victoria) and Manjimup (Western Australia) (Figure 1 and Table 1)
Flowering in pome fruit trees across Australia Department of Agriculture and Fisheries 2016 2
Figure 1 Site locations across Australia (large blue dot)
Table 1 Site details
State Location Orchard Latitude and Longitude
Cultivars
Qld Applethorpe Department of Agriculture and Fisheries Qld Applethorpe Research Facility
2852 S 15190 E
All apples and pears (except Josephine)
C Pozzebon amp Co Orchard 2863 S 15197 E Josephine pear
Vic Shepparton Silversteinrsquos orchard Shepparton East
3642 S 14546 E All apples and pears
WA Manjimup Department of Agriculture and Food WA Manjimup Horticultural research Institute
3418 S 11607 E All apples
Newton Brothers Orchards
3413 S 11607 E All pears
The three study sites are climatically diverse with Shepparton experiencing the hottest summers and Manjimup the warmest winters Applethorpe has the highest average spring temperatures (Figure 2)
Flowering in pome fruit trees across Australia Department of Agriculture and Fisheries 2016 3
Figure 2 Mean monthly temperatures for Shepparton Applethorpe and Manjimup
Green tip and flowering data collection
Cultivars (including crab apple pollinisers) and rootstocks used for phenology data collection are described in Table 2 All observations were taken on mature productive trees
Flowering in pome fruit trees across Australia Department of Agriculture and Fisheries 2016 4
Table 2 Description of trees used for phenology observations
Study site Tree crop Cultivar Rootstock1 Number of trees (yearly observation)
Net
Applethorpe Apple Braeburn M26 5 Yes
Cripps Pink (Pink Ladytrade) M26 MM106
5 3
Yes
Cripps Red (Sundownertrade) M26 MM106
5 5
Yes
Fuji M26 5 Yes
Galaxy (Gala) M26 5 Yes
Granny Smith M26 MM106
4 5
Yes
Hi Early (Red delicious) M26 5 Yes
Jonathan M26 5 Yes
Kalei M26 MM106
5 5
Yes
Manchurian Crab apple MM102 5 Yes
Pear Josephine D6 5 Yes
Packhamrsquos Triumph D6 5 No
Williamsrsquo Bon Chreacutetien D6 5 No
Wintercole D6 5 No
Shepparton Apple Braeburn MM106 5 Yes
Cripps Pink (Pink Ladytrade) MM106 5 Yes
Cripps Red (Sundownertrade) M26 MM106
5 5
Yes
Galaxy (Gala) MM106 5 Yes
Granny Smith MM106 5 Yes
Manchurian Crab apple MM106 5 Yes
Pear Josephine D6 5 Yes
Packhamrsquos Triumph D6 5 Yes
Williamsrsquo Bon Chreacutetien D6 5 Yes
Manjimup Apple
Braeburn MM109 2 No
Cripps Pink (Pink Ladytrade) MM104 M26
2 2
No
Cripps Red (Sundownertrade) MM104 M26
3 1
No
Galaxy (Gala) MM104 2 No
Granny Smith MM104 2 No
Hi Early (Red delicious) MM104 2 No
Jonathan MM106 2 No
Golden Hornet Crab apple MM104 2 No
Red Fuji (Fuji) MM104 2 No
Pear Josephine D6 5 No
Packhamrsquos Triumph D6 5 No
Williamsrsquo Bon Chreacutetien D6 5 No 1 Rootstock effects were not considered in this analysis as previous studies indicated that rootstocks did not significantly impact the timing of green tip and flowering dates in data collected for this study (Darbyshire 2016) Green tip and flowering data was collected three times per week at the whole tree level For each tree the date of green tip first open flower and full bloom were recorded A tree was defined as being at lsquogreen tiprsquo when 5 of the buds had observable green tips corresponding to the 07 stage in the international BBCH code for pome fruit (Meier et al 1994) A tree was defined as being at lsquofull bloomrsquo when 80 of the flowers were open (BBCH code stage 65)
Flowering in pome fruit trees across Australia Department of Agriculture and Fisheries 2016 5
Assessments of flowering quality were made based on the duration between first open flower and full bloom on the assumption that a protracted period of time between these events was a reflection of variable and uneven flowering This assumption was based on our observations of flowering in Manjimup and Applethorpe
A 95 confidence interval was used to represent variability in data about the mean It indicates that 95 of the data values recorded fall within this particular interval
Ideally green tip and flowering data would have been collected from a number of orchards across each region to fully capture variation within regions caused by microclimate soils differences in tree structure nutrition and so on Time and resources required to collect such data were not available and therefore observations were taken from representative orchards in each region In future more comprehensive data will be collected on orchards through the use of sensing and mapping technologies which will enable more sophisticated and comprehensive analysis of flowering patterns and variability between and within locations
Calculation of winter chill
The Dynamic model (Erez et al 1990 Fishman et al 1987) was used to calculate winter chill from on-site hourly temperature data recorded in the orchard This is the current lsquobest-practicersquo model and has been shown to perform better than other models for calculating winter chill particularly in mild winter climates such as Australia (Darbyshire et al 2013a Luedeling et al 2009)
Note that while chill is commonly referred to as lsquowinter chillrsquo it has been calculated here from the beginning of autumn until the end of winter (1 March to 31 August) The point at which tree buds become sensitive to chilling temperatures remains to be determined
Results and discussion
Winter chill and spring heat
Figure 3 Chill accumulation across sites and years Number in brackets is the total chill portions received up to 31 August
Flowering in pome fruit trees across Australia Department of Agriculture and Fisheries 2016 6
The pattern of winter chill accumulation was different between locations and years (Figure 3) For all years of the study Shepparton was the coolest site followed by Applethorpe and Manjimup Shepparton and Applethorpe received above-average chill portions for the four year period while Manjimup received below-average chill in 2013 and 2014 Historical chill portion averages for the 1981 to 2010 period are Shepparton 78 Applethorpe 70 and Manjimup 64
Lower winter chill tended to be associated with a later start to chill accumulation (that is a warmer autumn) and a more uneven chill accumulation curve For example 2012 2013 and 2014 in Manjimup were distinguished by the irregular accumulation of chill portions caused by climatic conditions where cold autumn and winter temperatures were interspersed with spells of warm weather This resulted in somewhat lsquowobblyrsquo chill accumulation curves
In this study winter chill accumulation was calculated from 1 March to 31 August according to previously published protocols (Darbyshire et al 2016) Questions remain about when to start and stop calculating chill It is not clear that it is meaningful to start calculating chill for late season cultivars before fruit has been harvested and or before leaves have fallen or indeed to stop calculating chill before a cultivar such as lsquoHi Earlyrsquo has reached green tip It seems likely that the period of sensitivity to chill accumulation will vary between cultivars however with current gaps in understanding of the physiological processes involved in the movement through dormancy it is not possible to determine cultivar-specific chilling periods
It is also quite likely that there are differences in the impact of chilling temperatures on the dormancy-breaking process depending on the time of year For example chill received earlier in the winter may be more effective than chill received in late winter Further research is required to fully elucidate these features of dormancy-breaking in pome fruit
Table 3 Average spring temperatures1 for 2012 to 2015 in Applethorpe Shepparton and
Manjimup
Location Year Average monthly temperature
September October November
Applethorpe Long term average2 124 154 177 2012 128 152 192 2013 149 171 185 2014 125 175 218 2015 118 170 202
Shepparton Long term average2 114 142 175 2012 118 139 191 2013 133 141 168 2014 121 160 189 2015 115 186 189
Manjimup Long term average2 119 136 160 2012 129 155 163 2013 126 150 180 2014 136 154 163 2015 132 171 186
1Temperature data sourced from Australian Bureau of Meteorology website 2As determined by the Australian Bureau of Meteorology
Flowering in pome fruit trees across Australia Department of Agriculture and Fisheries 2016 7
According to the long term average Applethorpe has the warmest spring compared with Shepparton and then Manjimup (Table 3) With few exceptions spring temperatures were above-average at all sites throughout the period of the study
Green tip and flowering
Differences in chill accumulation and spring heat between locations and years were accompanied by variability in the timing and pattern of green tip and flowering of apple and pear cultivars Results were analysed to develop a picture of green tip and flowering patterns in Applethorpe Shepparton and Manjimup over the four years of the study
Green tip and flowering time
Variation between cultivars and locations
Green tip and flowering dates were later in Manjimup than in Applethorpe and Shepparton (Figure 4) Across all cultivars the average green tip date was 4 September in Applethorpe 3 September in Shepparton and 25 September in Manjimup while the average full bloom date was 1 October in Applethorpe and Shepparton and 25 October in Manjimup
Variability in green tip and full bloom dates between years and individual trees was greater in Manjimup compared with Applethorpe and Shepparton as reflected by the length of the bars in Figure 4 Variability in green tip and full bloom dates between cultivars was also greater in Manjimup compared with the other sites Average green tip dates for all cultivars were spread across 32 days in Manjimup compared with 15 days in Applethorpe and 5 days in Shepparton Similarly average full bloom dates were spread across 19 days in Manjimup compared with 9 days in Applethorpe and 7 days in Shepparton
Overall Shepparton the site with the greatest winter chill showed the most consistency in green tip and flowering time from year to year while the relatively low chill in Manjimup was associated with the greatest variability Greater consistency has benefits for flowering and pollination management including determination of appropriate polliniser plantings and planning of pollination services It also benefits tactical decision making for orchard operations generally Improvements in the ability of models to predict flowering dates would remove the uncertainty associated with variability making it easier to manage
Flowering in pome fruit trees across Australia Department of Agriculture and Fisheries 2016 8
Figure 4 Green tip (green) and full bloom (pink) dates for apple cultivars in Applethorpe Shepparton and Manjimup Data is the average of observations from 2012 to 2015 with bars indicating the confidence interval
Shepparton
Manjimup
Applethorpe
Flowering in pome fruit trees across Australia Department of Agriculture and Fisheries 2016 9
Differences in Green tip and flowering patterns between locations were less consistent for pear cultivars (Figure 5) In Manjimup full bloom dates for lsquoJosephinersquo lsquoPackhamrsquo and lsquoWilliamsrsquo were later across all years compared with the other sites Shepparton showed the least variability in full bloom dates across years trees and cultivars
Figure 5 Green tip (green) and full bloom (pink) dates for pear cultivars in Applethorpe Shepparton and Manjimup Data is the average of observations from 2012 to 2015 with bars indicating the confidence interval
Variation between years
Variability in the dates of green tip and flowering between individual years was evaluated to determine the degree to which growers are currently managing shifts in flowering timing from season to season at each location
In Applethorpe green tip and flowering were consistently later across all cultivars in 2014 compared with the other years of the study (Figure 6 shows comparison between 2013 and 2014 data for other year comparisons not shown) On average green tip was 9 days later in 2014 compared with 2013 and full bloom was 12 days later (Figure 6)
This consistent shift in timing was associated with an unusual autumn and winter chill accumulation pattern (Figure 7) Total chill accumulated up to 31 August was similar in 2013 and 2014 73 and 75 chill portions respectively However in 2014 there was a warm week in late-May to early-June that resulted in a pause in accumulation of chill which can be seen in the chill curve (Figure 7) Even though the total chill accumulated for 2014 eventually caught up with the other curves by the end of August this plateau appears to have impacted the timing of flowering (although other factors such as the role of heat cannot be ruled out in this study) There was little difference in green tip and flowering dates between the other years
In Shepparton there was little variability in green tip and flowering dates between any of the four years of the study When averaged across cultivars green tip varied by 5 days between 2013 and 2014 and full bloom dates varied by 4 days (Figure 6) Plateaus in the accumulation of chill in late-May early-June of 2013 and 2014 (Figure 7) were not associated with big shifts in flowering time as
Flowering in pome fruit trees across Australia Department of Agriculture and Fisheries 2016 10
was observed for Applethorpe perhaps due to the higher amount of overall chill received in Shepparton
In Manjimup green tip and flowering dates were highly variable between years 2013 was a lower chill year than 2014 with 55 and 59 chill portions received respectively Shifts in green tip and full bloom dates were not consistent between cultivars (Figure 6) For example in 2014 full bloom was 15 days earlier in rsquoGalaxyrsquo and 10 days later in lsquoHi Earlyrsquo compared with full bloom dates for those cultivars in 2013 while the full bloom dates for lsquoGranny Smithrsquo were similar in both years (Figure 6)
Flowering in pome fruit trees across Australia Department of Agriculture and Fisheries 2016 11
Figure 6 Green tip (green) and full bloom (pink) dates for apple cultivars grown in Applethorpe Shepparton and Manjimup 2013 and 2014 Data points are the average of individual tree observations
Shepparton
Manjimup
Applethorpe
Flowering in pome fruit trees across Australia Department of Agriculture and Fisheries 2016 12
Figure 7 Chill accumulation in Applethorpe Shepparton and Manjimup 2012 to 2015 Number in brackets is the total chill portions received up to 31 August
Shepparton
Manjimup
Applethorpe
Flowering in pome fruit trees across Australia Department of Agriculture and Fisheries 2016 13
Quality of flowering
Variation between cultivars and locations
The duration between the first flower opening and full bloom was more than twice as long in Manjimup (21 days) as it was in Applethorpe (9 days) and Shepparton (10 days) when averaged across cultivars and years (Figure 8) The protracted pattern of flowering was consistently observed in Manjimup over the period of the study and was largely the result of irregular and uneven bud movement within individual tree canopies (data not shown)
A prolonged and irregular period of flowering can be difficult to manage for a number of reasons Determining an appropriate chemical thinning program is challenging when buds are at multiple stages of green tip and flowering on each tree within the block at any given time (Theron 2013) Fruitlets are likely to vary greatly in size and development stage and therefore careful attention is required at the time of hand thinning to ensure that fruitlets are thinned in a manner that optimises crop uniformity and reduces the spread of fruit maturity at harvest (Theron 2013 Erez 2000)
Flowering in pome fruit trees across Australia Department of Agriculture and Fisheries 2016 14
Figure 8 First flower (orange) and full bloom (pink) dates for apple cultivars in Applethorpe Shepparton and Manjimup Data is the average of observations from 2012 to 2015 Bars indicate the confidence interval
Shepparton
Manjimup
Applethorpe
Flowering in pome fruit trees across Australia Department of Agriculture and Fisheries 2016 15
In cultivars of pear the duration of the period between the first flower opening and full bloom was the greatest in Manjimup (Figure 9) as was observed in apple However the patterns of flowering were less consistent within and between locations
Figure 9 First flower (orange) and full bloom (pink) dates for pear cultivars in Applethorpe Shepparton and Manjimup Data is the average of observations from 2012 to 2015 Bars indicate the confidence interval
Flowering overlap and pollination
Overlap of flowering between a cultivar and its pollinisers is essential for good fruit set (Ramirez and Davenport 2013) Changes in the timing of flowering between seasons or across years that result in the loss of flowering synchronisation can therefore result in reduced yields Large shifts in flowering dates like those observed between cultivars and years in Manjimup (Figure 8) increase the risk of poor flowering overlap in any particular season and make it more difficult to select appropriate pollinisers Use of floral bouquets or artificial pollination methods can compensate for loss in flowering overlap however these methods require significant additional labour (Dennis 2003)
The chances of achieving good flowering overlap each season are greatly increased by planting multiple polliniser cultivars with early middle and late flowering habits to ensure a good supply of pollen throughout the flowering period of the commercial cultivar and to reduce frost risk (Delaplane and Mayer 2000 Dennis 2003) Cultivars that flower profusely over an extended period of time generally make good pollinisers (Jackson 2003)
Shifts in flowering timing do not affect fruit set if similar shifts occur in both the cultivar and its pollinisers This was observed in Applethorpe in 2014 when flowering in all cultivars was consistently delayed compared with flowering in 2013
Flowering and temperature implications of a changing climate
Apple trees in Manjimup exhibited greater variability in green tip and flowering dates and a more protracted flowering period compared with trees in Applethorpe and Shepparton Delayed and uneven flowering are symptoms of inadequate chill and it seems likely that the observed patterns of
Flowering in pome fruit trees across Australia Department of Agriculture and Fisheries 2016 16
flowering in Manjimup were a response to mild autumn and winter conditions received throughout the period of this study This finding is supported by numerous studies in the literature describing irregular flowering in apples grown in warm low chill climates (Oukabli 2003 Saure 1985 Theron 2013 Erez 2000) Abnormalities in the late stages of apple flower bud development have also been reported in low chill regions (Oukabli 2003) however flower viability was not assessed in our study
The timing of flowering varied from year to year within each location with the greatest differences observed in Manjimup This variability was caused largely by differences in temperatures from season to season and Australian growers have always had to manage these seasonal shifts in the timing of dormancy-break The relative importance of cold and warm temperatures in determining the timing of flowering is likely to vary between locations and years For example in cold growing regions where plenty of winter chill is received and chilling requirements are well satisfied by the middle of winter dormancy-break will be promoted by warm temperatures in late winter and early spring (Saure 1985) In this case from around mid-winter onwards the trees are sitting in a phase of dormancy known as lsquoeco-dormancyrsquo that is the buds are ready to burst when the environmental conditions are right for growth
This response to heat is evident in cold pome fruit growing regions of the Northern Hemisphere where clear advances in flowering dates have been observed with warmer spring temperatures caused by the changing climate (Legave et al 2013)
In warmer growing locations and years the timing of dormancy-break and flowering are likely to be determined primarily by the accumulation of enough chill (Saure 1985) That is dormancy tends to be prolonged and there is little or no eco-dormancy period buds burst as soon as they have received enough chill (Theron 2013) It is likely that pome trees growing in the warmer regions of Manjimup and Applethorpe in some years do not experience any significant eco-dormancy
As the climate warms most growing regions of Australia will receive less winter chill (Darbyshire et al 2013b) The impacts that this will have on flowering over the next 10 to 20 years will vary between different parts of the country
Cooler regions such as those in Tasmania and NSW with plenty of chilling may experience advances in the timing of flowering as spring temperatures increase As chill accumulation falls below the chilling requirements of cultivars in warmer growing regions of Australia they will likely see increasing variability in green tip and flowering dates from season to season and between cultivars Delayed uneven and protracted flowering will occur in the medium to higher chill cultivars as was observed in Manjimup during this study Low chill years will be experienced more often as the climate warms
Irregular and protracted flowering presents a significant management challenge for growers Options for orchard adaptation to warming autumns and winters include the planting of lower chill cultivars management of delayed and variable flowering with the use of dormancy-breakers and adjustments to chemical and hand thinning practices to reduce variability in fruit size and maturity
It should be noted that while exposure to enough chill is essential for quality flowering in pome fruit (defined here as the uniform blossoming of viable flowers) once chilling requirements have been met the quality of flowering can be further influenced by other factors such as heat nutritional status and water stress These factors were not considered here
While this study looked at temperature and the timing and quality of flowering climate change will have other impacts on flowering and pollination Warming temperatures will potentially impact on floral initiation bee activity and fruit set (Dennis 2003 Atkinson et al 2001 Ramirez and Davenport 2013) In addition this study did not collect data on leaf area development during the green tip and full bloom period Weak leaf development is a symptom of delayed foliation (Saure 1985) caused by inadequate winter chill and reduced leaf area in the weeks after full bloom has been shown to have negative impacts on fruit set and development (Proctor and Palmer 1991 Lauri et al 1996) Further research is required to fully determine the nature of these impacts on the Australian pome fruit industry
Flowering in pome fruit trees across Australia Department of Agriculture and Fisheries 2016 17
The discussion and conclusions from this study were based primarily on the results from observations in apples While results from the pear data were generally consistent with that observed in apples further research would improve the understanding of flowering in this crop Since the vast majority of pears are grown in Victoria (89) (Australian Bureau of Statistics) there was less opportunity to collect extensive datasets from diverse climatic regions
Conclusions
Results from this research support findings from previous studies performed in other parts of the world showing that apples grown in warmer climates exhibit increased variability in flowering within the canopy between individual trees and between varieties and years (Erez 2000 Theron 2013 Cook and Jacobs 2000) Increased variability in flowering results in the reduced ability to predict timing of orchard operations more difficult pollination management challenges for thinning and crop load management and can result in increased variability of fruit maturity at harvest
The Australian apple and pear industry is aiming to increase global competitiveness in an effort to help secure new export markets Success in the global market requires consistent supply of high quality fruit from season to season at competitive prices Additional variability in the crop production system from a warming climate will challenge the Australian industryrsquos ability to achieve the desired export goals on two fronts consistency of supply and in the maintenance of uniform orchard blocks that are a prerequisite for efficient use of labour-saving technologies
Variability caused by inadequate chilling can be managed with the use of additional input of products and labour however grower capacity to respond to these challenges will vary depending on individual social and financial factors An important assessment for growers to make of their orchard businesses will be lsquoat what point will the increased cost of inputs and effort required to produce a consistently high quality crop make a block of trees unprofitablersquo Ongoing orchard observations of flowering performance and relationships with winter chill will be necessary for making meaningful predictions about future block and cultivar profitability
Key messages
- Low winter chill as observed in Manjimup was associated with an uneven (or lsquounevenrsquo) chill accumulation curve caused by short periods of warm weather throughout the autumn and winter seasons
- Green tip and full bloom dates were more variable between years cultivars and individual trees in Manjimup and trees consistently displayed a long and protracted flowering compared with Applethorpe and Shepparton
- Shepparton the site with the most winter chill showed the greatest consistency in green tip and flowering dates from year to year
- The patterns of flowering observed in Manjimup are likely the result of inadequate chill Low winter chill at this site was associated with
High variability in flowering dates between seasons cultivars and individual trees of the same cultivar
Irregular and protracted flowering across most cultivars of apple
- Large shifts in flowering dates between cultivars and seasons increases the risk of poor flowering overlap in any particular year and makes it more difficult to select appropriate pollinisers Greater predictability in the timing of green tip and full bloom has benefits for flowering and pollination management and for planning of orchard operations generally
- Irregular and protracted flowering can be difficult to manage for a number of reasons
Flowering in pome fruit trees across Australia Department of Agriculture and Fisheries 2016 18
Determining an appropriate chemical thinning program is challenging when buds are at multiple stages of green tip and flowering on individual trees
Fruitlets will vary more in size and developmental stage and careful hand thinning is required to optimise crop uniformity
Greater spread of fruit maturity at harvest requires greater effort to pick fruit at the appropriate stage of maturity
- As the climate warms low chill years will become more frequent in milder growing regions of Australia and will likely result in symptoms of inadequate chill in some cultivars Advances in the timing of flowering might be observed in cooler growing regions
- Australian growers already manage seasonal changes in flowering time and it may be the increased irregularity of flowering that presents the greater management challenge
- Options for adaptation to low chill years include planting lower chill cultivars management of delayed and variable flowering with the use of dormancy-breakers and adjustments to chemical and hand thinning practices to reduce variability in fruit size and maturity
- Risks to pollination from shifting flowering times can be reduced through planting multiple polliniser cultivars with early middle and late flowering habits to ensure a good supply of pollen throughout the flowering period Use of floral bouquets or artificial pollination methods can compensate for loss in flowering overlap
- Climate change will add significant variability into the pome fruit crop production system This will present challenges for the Australian industry in the consistency of supply and in maintenance of the uniform orchard blocks that are a prerequisite for the efficient use of mechanisation
- An important assessment for growers to make of their orchard businesses will be lsquoat what point will the increased cost of inputs and effort required to produce a consistently high quality crop make a block of trees unprofitablersquo Ongoing observations of flowering performance and its relationship with chilling will be necessary for making informed predictions about future block and cultivar profitability
Recommendations
Industry
- Warmer temperatures will mean less winter chill for most growing regions of Australia Successful adaptation by the apple and pear industry will require
Comprehensive in-orchard monitoring of flowering dates across cultivars to provide early indication of cultivars that might be impacted by warmer winters in the future changing climate as well as identification of subtle shifts in the timing of flowering between cultivars and their pollinisers
Information about chilling requirements of new and existing cultivars so that growers can make cultivar choices appropriate to their particular growing environment
Consideration of chilling requirements in apple and pear breeding programs when selecting potential new cultivars for development and release Selecting for lower chill cultivars
Good understanding of the efficacy of dormancy-breaking sprays
- Growers in warmer growing regions of Australia would benefit from preparing a strategy for managing low chill years Monitoring of winter chill accumulation and use of dormancy-
Flowering in pome fruit trees across Australia Department of Agriculture and Fisheries 2016 19
breakers in low chill years is a logical inclusion Changes to chemical and hand thinning practices may also form part of the strategy
- Where shifting full bloom dates are likely to be a problem consideration should be given to planting more than one polliniser cultivar to improve the chances of flowering overlap every year
- Models of flowering time have significantly improved in recent times with the development of the lsquoChill-overlap modelrsquo (Darbyshire et al 2016 White 2016) The use of these models will improve the ability to predict changes in the timing of flowering in cultivars of apple under future climates
- Climate analogues (Parkes and White 2016) should be used by the industry to broadly identify climate change impacts on apple and pear production systems and possible options for adaptation Growers in Manjimup are already successfully managing the impacts of inadequate chill in some years lessons can be learnt from their knowledge and experience
- In future more comprehensive data should be collected on orchards through the use of sensing and mapping technologies This data should be used to undertake more sophisticated and comprehensive analysis of flowering patterns and variability between and within locations
- Further research in Australian pears is needed to improve the understanding of flowering in cultivars of this tree crop and the likely impacts of changing climate
- In blocks where flowering is becoming increasingly irregular an important assessment for growers to make of their orchard businesses will be to determine at what point the increased cost of inputs and effort required to produce a consistently high quality crop make a block of trees unprofitable Ongoing observations of flowering performance and its relationship with chilling will be necessary for making informed predictions about future block and cultivar profitability
Scientific research needs
- Better understanding of apple and pear chilling requirements is necessary for making appropriate cultivar selections for particular growing climates This will require
Research into the genetic basis of progression through the phases of dormancy
Determination of the point when buds enter into true dormancy and become sensitive to chilling temperatures and when buds exit true dormancy prior to bud burst Genetic andor physiological markers of these phase shifts are needed
Improved chill model performance through cultivar specific parameterisation of the dynamic model
Understanding of the effectiveness of early versus late season chill in dormancy breaking
- Development of chill-overlap models for flowering time of pome fruit cultivars other than lsquoCripps Pinkrsquo This will improve the predictability of climate change impacts on flowering timing
- Determine the potential effects of warming temperatures on leaf area development floral initiation flower viability fruit set and bee activity as these are likely to have significant impacts for productivity in apple and pear
Flowering in pome fruit trees across Australia Department of Agriculture and Fisheries 2016 20
Acknowledgements
The authors would like to extend a very big thank you to the growers who kindly provided orchard blocks for research observations Celeste from C Pozzebon amp Co Ann and Mauri Lyster Newton Brothers Orchards Maurice Silverstein and Geoffrey Thompson
Thank you to Susie Murphy White Lisa Starkie and Martine Combret from Western Australia Lexie McClymont Susanna Turpin and Wendy Sessions from Victoria and Osi Tabing Peter Nimmo and Allan McWaters from Queensland for the collection of orchard phenology and temperature data And finally thank you to Rebecca Darbyshire Ian Goodwin Jenny Treeby and Penny Measham as well as all of the aforementioned names for the many discussions around the interpretation of the results that were had formally and informally throughout the four years of the project
References
Atkinson C J Taylor L and Kingswell G (2001) The importance of temperature differences directly after anthesis in determining growth and cellular development of Malus fruits Journal of Horticultural Science and Biotechnology 76(6)
Cannell M G R (1989) Chilling thermal time and date of flowering of trees in Wright C J ed Manipulation of Fruiting London Butterworths 99 - 113
Cobon D H Stone G S Carter J O Scanlan J C Toombs N R Zhang X Willcocks J and McKeon G M (2009) The climate change risk management matrix for the grazing industry of northern Australia Rangeland Journal 31(1)
Cook N C and Jacobs G (2000) Progression of apple ( Malus domestica Borkh) bud dormancy in two mild winter climates Journal of Horticultural Science and Biotechnology 75(2)
Darbyshire R (2016) Crossing the threshold adaptation tipping points for Australian fruit trees University of Melbourne
Darbyshire R Pope K and Goodwin I (2016) An evaluation of the chill overlap model to predict flowering time in apple tree Scientia Horticulturae 198 142-149
Darbyshire R Webb L Goodwin I and Barlow E W R (2013a) Evaluation of recent trends in Australian pome fruit spring phenology International Journal of Biometeorology 57(3)
Darbyshire R Webb L Goodwin I and Barlow E W R (2013b) Impact of future warming on winter chilling in Australia International Journal of Biometeorology 57(3) 355-366
Delaplane K S and Mayer D F (2000) Crop Pollination by Bees New York CABI
Dennis F G Jr (2003) Flowering pollination and fruit set and development in Ferree D C and Warrington I J eds Apples botany production and uses Cambridge CAB International 153 - 166
Erez A (2000) Bud dormancy phenomenon problems and solutions in the tropics and subtropics in Erez A ed Temperate Fruit Crops in Warm Climates Kluwer Academic Publishers 17 - 47
Erez A Fishman S Linsley-Noakes G C and Allan P (1990) The dynamic model for rest completion in peach buds Acta Horticulturae 276 165-174
Fishman S Erez A and Couvillon G A (1987) The temperature dependence of dormancy breaking in plants mathematical analysis of a two-step model involving a cooperative transition Journal of Theoretical Biology 124 473 - 483
Hennessy K J and Clayton-Greene K (1995) Greenhouse warming and vernalisation of high-chill fruit in southern Australia Climatic Change 30(3)
Flowering in pome fruit trees across Australia Department of Agriculture and Fisheries 2016 21
Jackson J E (2003) Biology of Apples and Pears Cambridge Cambridge University Press
Lauri P Eacute Teacuterouanne Eacute and Lespinasse J M (1996) Quantitative analysis of relationships between inflorescence size bearing-axis size and fruit-set - An apple tree case study Annals of Botany 77(3) 277-286
Legave J M Blanke M Christen D Giovannini D Mathieu V and Oger R (2013) A comprehensive overview of the spatial and temporal variability of apple bud dormancy release and blooming phenology in Western Europe International Journal of Biometeorology 57(2)
Luedeling E Zhang M H Luedeling V and Girvetz E H (2009) Sensitivity of winter chill models for fruit and nut trees to climatic changes expected in Californias Central Valley Agriculture Ecosystems amp Environment 133(12)
Meier U Graf H Hess M Kennel W Klose R Mappes D Seipp D Stauss R Streif J and van den Boom T (1994) Phaumlnologische Entwick-lungsstadien des Kernobstes (Malus domestica Borkh und Pyrus communis L) des Steinobstes (Prunus-Arten) der Johannisbeere (Ribes-Arten) und der Erdbeere (Fragaria x ananassa Duch) Nachrichtenbl Deut Pflanzenschutzd 46 141 - 153
Oukabli A Bartolini S and Viti R (2003) Anatomical and morphological study of apple (Malus x domestica Borkh) flower buds growing under inadequate winter chilling Journal of Horticultural Science and Biotechnology 78(4) 580-585
Parkes H A and White N (2016) Climate change impacts on flowering in Australian pome fruit trees A climate analogue approach Queensland Department of Agriculture and Fisheries
Proctor J T A and Palmer J W (1991) The role of spur and bourse leaves of three apple cultivars on fruit set and growth and calcium content HortScience 26(6) 789
Ramirez F and Davenport T L (2013) Apple pollination a review Scientia Horticulturae 162
Samish R M (1954) Dormancy in woody plants Annual Review of Plant Physiology 5 183-204
Saure M C (1985) Dormancy release in deciduous fruit trees Horticultural Reviews 7 239-300
State of the climate (2016) Australian Bureau of Meteorology amp CSIRO
Theron K (2013) Chemical thinning of apple South African perspective Acta Horticulturae 998 85 - 90
White N (2016) Approaches for modelling flowering timing in apple trees grown in mild winter climates Department of Agriculture and Fisheries Department of Agriculture and Fisheries
A climate analogue approach to understanding climate change impacts on flowering in Australian pome fruit trees
Heidi Parkes1 Neil White1 and Susie Murphy White2
November 2016
1Department of Agriculture and Fisheries Queensland 2Pomewest Western Australia
This research was presented at Greenhouse 2015 Wrest Point Conference Centre Hobart 27-30 October
This publication has been compiled by Heidi Parkes and Neil White of Horticulture and Forestry Science Department of Agriculture and Fisheries copy State of Queensland 2016 The Queensland Government supports and encourages the dissemination and exchange of its information The copyright in this publication is licensed under a Creative Commons Attribution 30 Australia (CC BY) licence Under this licence you are free without having to seek our permission to use this publication in accordance with the licence terms
You must keep intact the copyright notice and attribute the State of Queensland as the source of the publication Note Some content in this publication may have different licence terms as indicated For more information on this licence visit httpcreativecommonsorglicensesby30audeeden The information contained herein is subject to change without notice The Queensland Government shall not be liable for technical or other errors or omissions contained herein The readeruser accepts all risks and responsibility for losses damages costs and other consequences resulting directly or indirectly from using this information
Climate change impacts on flowering in pome fruit trees a climate analogue approach 2016 1
Summary
Future changes in climate are predicted to result in reduced winter chill in apple and pear growing regions of Australia Potential impacts on the pome fruit industry due to effects of reduced chill on bud dormancy release and flowering of fruit trees in these regions are not yet clear Inadequate winter chill can result in variable and protracted flowering potentially leading to impacts on fruit set and marketable yield at harvest Climate analogues are one option for investigation of potential climate change impacts on agricultural production and appropriate adaptation strategies This study investigated the potential for using the climate analogue concept together with collected datasets to predict impacts of climate change on pome fruit flowering in Australia and to identify possible methods for adaptation
The temperate tree fruit growing regions of Manjimup (WA) and Stanthorpe (QLD) were used as a case study to test this strategy Based on mean autumn and winter temperatures alone Manjimup was considered to be an appropriate climate analogue for Stanthorpe in 2030 Flowering datasets from commercial apple and pear cultivars were collected at each site in 2013 and 2014 Whole tree field assessments were made of 5 green tip first open flower and progression of flowering to full bloom using standardised methods across sites The data show an uneven and protracted pattern of flowering in Manjimup compared with Stanthorpe Average green tip dates for all cultivars were spread across 32 days in Manjimup compared with 15 days in Stanthorpe Similarly average full bloom dates were spread across 19 days in Manjimup and 9 days in Stanthorpe The duration between the first flower opening and full bloom in Manjimup was more than twice as long as in Stanthorpe (an average of 25 days compared with 10 days) when averaged across years and cultivars There were no clear differences in yield between the locations Comparison of grower orchard management practices indicated that 50 of Manjimup growers use dormancy-breaking sprays compared with zero in Stanthorpe
Results from the climate analogue approach suggested that a more variable and protracted pattern of flowering is likely to exist across many apple cultivars in Stanthorpe in 2030 The more variable flowering will not necessarily have significant impacts on productivity of apple orchards in that timeframe and Stanthorpe growers are likely to be able to manage low chill years with the use of dormancy-breaking sprays At this stage there is no apparent need to shift to lower chill cultivars (or crops) as Manjimup growers are achieving high levels of productivity with the same variety mix as is currently grown in Stanthorpe
The climate analogue approach is a valuable tool for providing broad information around potential impacts and adaptation strategies for Australian temperate tree crops and horticulture more generally There are a number of important details to consider when applying this methodology and these are outlined in this report
Climate change impacts on flowering in pome fruit trees a climate analogue approach 2016 2
Table of contents
Introduction 4
Study objectives 4
Methodology 4
Identification of an appropriate climate analogue location 5
Industry comparison 5
Comparison of flowering 5
Comparison of productivity and orchard management practice 6
Results and discussion 7
Identification of an appropriate climate analogue location for Stanthorpe 2030 7
The apple and pear industries in Manjimup and Stanthorpe 8
Apple and pear tree flowering in Manjimup and Stanthorpe 9
Apple and pear productivity in Manjimup and Stanthorpe 12
Orchard management practices in Manjimup and Stanthorpe 13
Conclusions 14
Key messages 15
Recommendations 15
Acknowledgments 16
References 16
Table of figures
Figure 1 Map of Australia showing the locations of Stanthorpe and Manjimup Manjimup was identified as an appropriate climate analogue for Stanthorpe in 2030 7
Figure 2 Box plot showing winter chill projections from four climate models for Stanthorpe in 2030 compared with current winter chill in Manjimup Orange red and blue dots show winter chill data calculated from hourly temperature data collected on-site from 2012 2013 and 2014 respectively Historical boxplot data is for the period from 1986 to 2005 8
Figure 3 Green tip first flower and full bloom dates for cultivars of apple and pear in Manjimup and Stanthorpe in 2013 and 2014 Dates are given as the lsquoday of yearrsquo day 260 is 17 September and day 300 is 27 October Data points are the average of individual tree observations CP is the total chill portions calculated up to 31 Aug 9
Figure 4 Duration of the flowering period from first flower to full bloom in cultivars of apple and pear grown in Manjimup and Stanthorpe in 2013 and 2014 Results are the average of individual tree observations 10
Figure 5 Overlap of flowering periods from first open flower to full bloom in cultivars of apple and pear in Manjimup and Stanthorpe Dates are given as the lsquoday of yearrsquo day 260 is 17 September and day 300 is 27 October Data points are the average of individual tree observations for 2013 and 2014 11
Figure 6 Uneven flowering in lsquoCripps Pinkrsquo Lysterrsquos Orchard Manjimup 2014 11
Climate change impacts on flowering in pome fruit trees a climate analogue approach 2016 3
Figure 7 Results from a survey of Manjimup growers on lsquoCripps Pinkrsquo yields and quality in 2014 The survey was undertaken at a grower roadshow event using digital audience response technology 1 October 2014 13
Table of tables
Table 1 Description of sites used for flowering data observations 5 Table 2 Description of trees used for flowering observations 6 Table 3 Characteristics1 of the apple industries in Manjimup and Stanthorpe 8
Climate change impacts on flowering in pome fruit trees a climate analogue approach 2016 4
Introduction
Future changes in climate are predicted to result in reduced winter chill in apple and pear growing regions of Australia (Darbyshire et al 2013b Hennessy and Clayton-Greene 1995) Potential impacts on the pome fruit industry in these regions are not yet clear Inadequate winter chill results in variable and protracted flowering potentially leading to impacts on fruit set and marketable yield at harvest (Theron 2013 Erez 2000 Saure 1985) Climate analogue analysis involves a detailed comparison between locations where the current climate of one location is similar to the projected future climate of the location of interest (Nyairo et al 2014) This is one option for investigation of potential climate change impacts on agricultural production and identification of appropriate adaptation strategies
Relationships between temperature and flowering in apple and pear trees are complex and poorly understood making it difficult to determine future impacts of warming climate on flowering in these crops A number of benefits of applying a climate analogue approach have been identified (Nyairo et al 2014 Veloz et al 2012) and suggest that it may be a useful approach in the investigation of this question Some of the benefits are
Ability to analyse climate change impacts without the need for understanding of complex physiological processes underlying flowering
Ability to analyse options and capacity for adaptation The question can be asked how do growers in region X respond to a climate that is similar to ours in the future Impacts and adaptation can be investigated simultaneously
Impacts of climate change on flowering are analysed within the production system as a whole
Provision of tangible practical information for growers to work with and allows for growers at the test location to learn from growers at the analogue location
Analogue location can be used as a research site for possible adaptation strategies Improved communication of climate change impacts and options for adaptation to growers
Although the concept has been around for some time most studies have focussed broadly on whole farming systems (Nyairo et al 2014) rather than investigating climate change impacts on a single cropping system or on one physiological aspect of a crop such as flowering
Study objectives
The aim of this project was to investigate potential for using a climate analogue approach together with collected data sets to predict impacts of climate change on pome fruit flowering and to identify possible methods for adaptation
Methodology
To test the potential of the climate analogue approach a case study was undertaken in Stanthorpe Queensland The following questions were posed
1 How will flowering of apple and pear trees be impacted by reduced winter chill in Stanthorpe in 2030
2 Will there be an impact on productivity 3 What can growers do to adapt 4 Is the climate analogue approach appropriate in this context and can it be applied more
broadly 5 Are there factors that should be considered when using climate analogues for informing
climate change adaptation in horticulture
There were four parts to the investigation the identification of an appropriate climate analogue location for Stanthorpe in 2030 comparison of the apple and pear industries in each location to
Climate change impacts on flowering in pome fruit trees a climate analogue approach 2016 5
ensure a meaningful comparison analysis and comparison of flowering behaviour and productivity in each location and comparison of relevant orchard management practices to investigate possible climate change adaptations
Identification of an appropriate climate analogue location
The lsquoanalogues explorerrsquo tool from the Climate change in Australia website1 was used to identify a broad pool of possible climate analogue locations for Stanthorpe in 2030
Winter chill projections for Stanthorpe in 2030 were constructed from four Global Climate Models selected from the list of models generated by the Climate Futures Tool at the Climate Change in Australia website1 for a Representative Concentration Pathway (RCP) of 45 The RCP45 emissions scenario assumes that lower greenhouse gas emissions are achieved in future due to some mitigation efforts It is a minimum to medium case climate change scenario
Historical temperature data from 1986 to 2005 for Manjimup and Stanthorpe was obtained from the SILO climate database2 Point data for the years 2012 2013 and 2014 was obtained from the weather station at Manjimup Horticultural Research Institute (Manjimup) and an on-site temperature logger in the orchard at Applethorpe Research Facility (Stanthorpe)
The Dynamic model (Erez et al 1990 Fishman et al 1987)) was used to calculate winter chill from hourly temperature data recorded in the orchard from the beginning of autumn until the end of winter (1 Mar to 31 Aug) This is the current lsquobest-practicersquo model and has been shown to perform better than other models for calculating winter chill particularly in mild winter climates such as Australia (Darbyshire et al 2013a Luedeling et al 2009)
Industry comparison
Comparison of the apple and pear industries in Manjimup and Stanthorpe was made based on information sourced from the Australian Bureau of Statistics a Shire Council report (Tancred and McGrath 2013) and personal communication with growers and local industry representatives
Comparison of flowering
The flowering datasets were from orchards in Manjimup and Stanthorpe (Table 1) collected in spring 2013 and 2014 from cultivars of apple and pear as part of the project AP12029 Understanding apple and pear production systems in a changing climate (Table 2)
Table 1 Description of sites used for flowering data observations State Location Orchard Latitude and
Longitude Cultivars
Qld Stanthorpe Department of Agriculture and Fisheries Qld Applethorpe Research Facility
2852 S 15190 E
All apples and pears
WA Manjimup Department of Agriculture and Food WA Manjimup Horticultural research Institute
3418 S 11607 E All apples
Newton Brothers Orchards
3413 S 11607 E All pears
1 httpwwwclimatechangeinaustraliagovauenclimate-projectionsclimate-analoguesanalogues-explorer 2 httpswwwlongpaddockqldgovausilo
Climate change impacts on flowering in pome fruit trees a climate analogue approach 2016 6
Table 2 Description of trees used for flowering observations Study site Tree
crop Cultivar Rootstock1 Number of trees
(for yearly observation) Net
Stanthorpe Apple Braeburn M26 5 Yes
Cripps Pink (Pink Ladytrade)
M26 MM106
5 3
Yes
Cripps Red (Sundownertrade)
M26 MM106
5 5
Yes
Fuji M26 5 Yes
Galaxy (Gala)
M26 5 Yes
Granny Smith M26 MM106
4 5
Yes
Hi Early (red delicious)
M26 5 Yes
Pear Packhamrsquos Triumph
D6 5 No
Williamsrsquo Bon Chreacutetien
D6 5 No
Manjimup Apple
Braeburn MM109 2 No
Cripps Pink (Pink Ladytrade)
MM104 M26
2 2
No
Cripps Red (Sundownertrade)
MM104 M26
3 1
No
Galaxy (Gala)
MM104 2 No
Granny Smith MM104 2 No
Hi Early (red delicious)
MM104 2 No
Red Fuji (Fuji)
MM104 2 No
Pear Packhamrsquos Triumph
D6 5 No
Williamsrsquo Bon Chreacutetien
D6 5 No
1Rootstock effects were not considered in this analysis as previous studies indicated that rootstocks did not significantly impact the timing of green tip and flowering dates in data collected for this study (Darbyshire 2016)
Green tip and flowering data was collected three times per week at the whole tree level For each tree the date of green tip first open flower and full bloom were recorded A tree was defined as being at lsquogreen tiprsquo when 5 of the buds had observable green tips corresponding to the 07 stage in the international BBCH code for pome fruit (Meier et al 1994) A tree was defined as being at lsquofull bloomrsquo when 80 of the flowers were open similar to the 65 stage in the international BBCH code for pome fruit (Meier et al 1994)
Comparison of productivity and orchard management practice
Broad yield data and information on orchard management practices was obtained from the Australian Bureau of Statistics personal communication with growers and local industry representatives and from a grower survey performed using digital audience response technology at the AP12029 project
Climate change impacts on flowering in pome fruit trees a climate analogue approach 2016 7
roadshow event held in Manjimup on 1 October 2014 Detailed yield and orchard practice data was not collected as part of this study
Results and discussion
Identification of an appropriate climate analogue location for Stanthorpe 2030
The Analogues Explorer tool was used to identify a broad pool of possible climate analogue locations for Stanthorpe in 2030 When climates were matched for annual temperature and rainfall twelve analogue locations were listed including Bega Manjimup Mount Barker Young and Albury-Wodonga
To ensure that the climate analogue selected could be used to specifically investigate the impacts of reduced chilling on flowering the Analogues Explorer tool was set-up to identify analogues matched on autumn and winter temperatures only Spring and summer temperatures were removed from the assessment along with rainfall A slightly different set of climate analogues was listed including Nuriootpa Horsham Naracoorte Manjimup Mount Barker and Sale From this list Manjimup one of Australiarsquos main apple and pear growing regions was selected as the climate analogue location for Stanthorpe in 2030 (Figure 1)
Figure 1 Map of Australia showing the locations of Stanthorpe and Manjimup Manjimup was identified as an appropriate climate analogue for Stanthorpe in 2030
It is worth noting that when the seasons are considered separately Manjimup is a reasonable analogue for 2030 in Stanthorpe for summer autumn and winter but not for the spring This is because in the current climate Stanthorpe has a warmer spring than Manjimup
Projections of winter chill using global climate models were undertaken to evaluate how well winter chill in Manjimup is likely to match chill received under a 2030 climate in Stanthorpe (Figure 2) The historical chill portion data for the period 1986 to 2005 in Manjimup is similar to the chill data for Stanthorpe over this same period (Figure 2) However 2012 2013 and 2014 were low chill years in Manjimup If the chill portion data for these years is considered separately it falls neatly within the range of the projected winter chill results for Stanthorpe in 2030 (Figure 2) Therefore Manjimup in the years 2012 to 2014 was considered to be a good climate analogue for assessing the impacts of reduced winter chill on flowering in Stanthorpe in 2030
Climate change impacts on flowering in pome fruit trees a climate analogue approach 2016 8
Figure 2 Box plot showing winter chill projections from four climate models for Stanthorpe in 2030 compared with current winter chill in Manjimup Orange red and blue dots show winter chill data calculated from hourly temperature data collected on-site from 2012 2013 and 2014 respectively Historical boxplot data is for the period from 1986 to 2005
The apple and pear industries in Manjimup and Stanthorpe
The apple and pear industries in Manjimup and Stanthorpe are comparable on most industry characteristics including gross value orchard size variety mix rootstocks and planting systems (Table 3) One significant difference is in the use of orchard netting Stanthorpe apples are grown almost entirely under hail netting while most of the apple orchards in the Manjimup district are un-netted (although this is changing rapidly)
Table 3 Characteristics1 of the apple industries in Manjimup and Stanthorpe Industry characteristic Manjimup Stanthorpe
1Gross value is the average from the 2002-2003 to 2012-2013 seasons
Climate change impacts on flowering in pome fruit trees a climate analogue approach 2016 9
Apple and pear tree flowering in Manjimup and Stanthorpe
In 2013 and 2014 Stanthorpe received 72 and 74 chill portions respectively while Manjimup received 54 chill portions in both years (well below its long-term average) (Figure 3) The low winter chill in Manjimup was associated with a greater spread of green tip and full bloom dates in both years (Figure 3) Average green tip dates for all cultivars were spread across 32 days in Manjimup compared with 15 days in Stanthorpe Similarly average full bloom dates were spread across 19 days in Manjimup compared with 9 days in Stanthorpe
Figure 3 Green tip first flower and full bloom dates for cultivars of apple and pear in Manjimup and Stanthorpe in 2013 and 2014 Dates are given as the lsquoday of yearrsquo day 260 is 17 September and day 300 is 27 October Data points are the average of individual tree observations CP is the total chill portions calculated up to 31 Aug
The duration between the first flower opening and full bloom in Manjimup was more than twice as long as in Stanthorpe (an average of 25 days compared with 10 days) when averaged across years and cultivars (Figure 4 and Figure 5) This protracted pattern of flowering was consistently observed in Manjimup over the period of the study and was largely the result of irregular and uneven bud movement within individual tree canopies (Figure 6)
A prolonged and irregular period of flowering can be difficult to manage for a number of reasons Determining an appropriate chemical thinning program is challenging when buds are at multiple stages of green tip and flowering on each tree within the block at any given time (Theron 2013) Fruitlets are likely to vary greatly in size and development stage and therefore careful attention is required at the time of hand thinning to ensure that fruitlets are thinned in a manner that optimises crop uniformity and reduces the spread of fruit maturity at harvest (Theron 2013 Erez 2000)
A long drawn out flowering season has other indirect impacts on orchard activities including a longer period for controlling flowering pests such as dimpling bug and for managing of bee hives These impacts were not assessed in this study
Overlap of flowering between a cultivar and its pollinisers is essential for good fruit set (Ramirez and Davenport 2013) Changes in the timing of flowering between seasons or across years that result in
Climate change impacts on flowering in pome fruit trees a climate analogue approach 2016 10
the loss of flowering synchronisation can therefore result in reduced yields Flowering overlap does not appear be a problem for either Manjimup or Stanthorpe in the years of study (Figure 5) however reduced marketable yields can result from the extended period of flowering overlap that is caused by irregular bud movement (Petri and Leite 2004) In this situation fruit set occurs over an extended period of time resulting in the significant spread of fruit maturity within individual trees
Figure 4 Duration of the flowering period from first flower to full bloom in cultivars of apple and pear grown in Manjimup and Stanthorpe in 2013 and 2014 Results are the average of individual tree observations
Climate change impacts on flowering in pome fruit trees a climate analogue approach 2016 11
Figure 5 Overlap of flowering periods from first open flower to full bloom in cultivars of apple and pear in Manjimup and Stanthorpe Dates are given as the lsquoday of yearrsquo day 260 is 17 September and day 300 is 27 October Data points are the average of individual tree observations for 2013 and 2014
Figure 6 Uneven flowering in lsquoCripps Pinkrsquo Lysterrsquos Orchard Manjimup 2014
Climate change impacts on flowering in pome fruit trees a climate analogue approach 2016 12
Apple and pear productivity in Manjimup and Stanthorpe
Low winter chill and irregular flowering can reduce productivity through impacts on fruit set and variability of fruit quality at harvest (Petri and Leite 2004 Erez 2000) To investigate any association between irregular and protracted flowering in Manjimup in 2013 and 2014 with productivity in those years broad assessments of yield were undertaken
Meaningful comparison of yield data between locations can be problematic as yield is impacted by the interaction of many complex factors including pests and diseases irrigation planting systems tree canopy management practices as well as climatic factors Long-term apple yield data was similar between locations with an average of 377 kg per tree in Manjimup and 382 kg in Stanthorpe (source Australian Bureau of Statistics)
There was no evidence of reduced productivity in Manjimup in the low chill year of 2014 In a survey of Manjimup growers 69 reported an above average or excellent yield in 2014 and 79 reported average or really good fruit quality in 2014 (Figure 7) These results were based on grower perceptions detailed yield data was not collected as part of this study
Climate change impacts on flowering in pome fruit trees a climate analogue approach 2016 13
Figure 7 Results from a survey of Manjimup growers on lsquoCripps Pinkrsquo yields and quality in 2014 The survey was undertaken at a grower roadshow event using digital audience response technology 1 October 2014
Orchard management practices in Manjimup and Stanthorpe
The lack of evidence for losses in marketable yield as a result of the variable and protracted flowering observed in Manjimup in 2014 could be because 1) the observed pattern of flowering had no impact on fruit set or fruit quality at harvest 2) Manjimup growers have adjusted management practices to adapt to low chill years or 3) impacts on productivity were there but were not great enough to be picked up in grower yield records
While it was not possible to distinguish between these alternative explanations with the data collected in this study it was worth considering whether Manjimup growers have implemented any changes to cultural practices and or longer term strategies to manage variable and protracted flowering In the survey of Manjimup growers 50 indicated that they were using dormancy-breaking sprays on some
Climate change impacts on flowering in pome fruit trees a climate analogue approach 2016 14
cultivars to manage the irregular flowering This is compared with zero growers in Stanthorpe for that year
It is not clear whether the use of dormancy-breaking sprays in Manjimup is the reason that there was no clear impact of the variable and protracted flowering on productivity but it is likely to have helped (Erez 1995 Saure 1985 Petri et al 2014)
A longer-term strategy for managing the effects of low chill years on flowering is to plant cultivars with lower chilling requirements The existing variety mix was similar in Stanthorpe and Manjimup and there was no apparent difference in the cultivars under consideration for new plantings (personal communication)
Conclusions
The following conclusions on the impact of reduced winter chill on Stanthorpersquos apple industry in 2030 can be drawn from the evaluation of flowering productivity and orchard management practices in Manjimup
1 How will flowering of apple and pear trees be impacted by reduced winter chill in
Stanthorpe in 2030
A more variable and protracted pattern of flowering is likely to exist across many apple cultivars in Stanthorpe in 2030
2 Will there be an impact on productivity
The more variable flowering will not necessarily have significant impacts on productivity of apple orchards in 2030
3 What can growers do to adapt
Stanthorpe growers are likely to be able to manage low chill years with the use of dormancy-breaking sprays At this stage there is no clear need to shift to lower chill cultivars (or crops) as Manjimup growers are achieving high levels of productivity with the same variety mix as is currently grown in Stanthorpe
4 Is the climate analogue approach appropriate in this context and can it be applied more
broadly
Yes the climate analogue approach provided insight into potential impacts of reduced winter chill on flowering in Stanthorpe in 2030 and is likely to be a valuable tool for broadly evaluating climate change impacts and options for adaptation in many horticultural contexts
5 Are there factors that should be considered when using climate analogues for informing
climate change adaptation in horticulture
Three important factors for consideration were identified during this case study
Selection of the climate analogue should be undertaken carefully with consideration given to differences between the analogue and target locations with respect to environment industry social factors and so on
The Analogues Explorer tool comes with the following qualifying statement
ldquoIt is important to note that other potentially important aspects of local climate are not matched when using this approach such as frost days or other local climate influences Furthermore for agricultural applications solar radiation and soils are not considered Thus we advise against the analogues being used directly in adaptation planning without considering more detailed informationrdquo
Climate change impacts on flowering in pome fruit trees a climate analogue approach 2016 15
A good example of why this is important was identified in this case study The town of Young was one of the possible climate analogues listed for Stanthorpe in 2030 when the climates were matched on annual temperature and rainfall In the current climate Young receives significantly higher winter chill than Stanthorpe but has a hotter summer Hence they might be a good match based on annual temperature but Young would not have been a useful analogue for evaluating reduced winter chill in Stanthorpe On the other hand it might be a good analogue for assessing risk associated with extreme summer heat
An intrinsic assumption of the climate analogue approach is that the only significant difference between the test site and the analogue location is the climate however locations might differ in other ways that could significantly reduce the value of the climate analogue approach For instance if comparing crop production in Australia with that of somewhere else in the world the production systems may be too different to provide meaningful impact and adaptation information
Relationships between climate and physiology are complex the details and nuances of climate change impacts may not be fully defined by the climate analogue approach
This case study concluded that the differences in flowering behaviour observed in Manjimup compared with Stanthorpe were the result of low winter chill in Manjimup in 2013 and 2014 However it is possible that the variable and protracted flowering in Manjimup was a response to the complex interaction between multiple factors other than total winter chill such as the pattern of chill accumulation heat spring temperatures and day-length factors This will only be understood through further experimentation detailed climate data and modelling
The climate analogue approach is limited to investigation of one possible climate scenario at a time while a modelling approach enables the testing of many different climate scenarios
Manjimup was used as a climate analogue for Stanthorpe in 2030 To investigate impacts of reduced winter chill in Stanthorpe in 2050 or 2090 alternative analogue locations would need to be sought as the conclusions from this case study cannot be extended beyond the intended time-frame
Key messages
- Results from the climate analogue approach suggested that more variable and protracted flowering behaviour is likely in pome fruit trees in Stanthorpe by 2030 without significant impact on productivity Adaptations will include the use of dormancy-breaking sprays to manage flowering but there is no evidence for a need to switch to low chill cultivars at this stage
- The climate analogue approach can provide broad information around potential impacts and adaptation strategies for Australian temperate tree crops and horticulture more generally however the details need to be considered cautiously
Recommendations
- Climate analogues should be used by the industry to broadly identify climate change impacts on apple and pear production systems and possible options for adaptation Growers in Manjimup are already successfully managing the impacts of inadequate chill in some years lessons can be learnt from their knowledge and experience
- This study did not capture the many potential impacts that protracted flowering can have on orchard management including a longer period for flowering pest control such as dimpling bug and for management of bee hives difficulties in the timing of chemical thinner application more labour intensive hand thinning and dealing with greater variability of fruit maturity at
Climate change impacts on flowering in pome fruit trees a climate analogue approach 2016 16
harvest A more detailed grower survey should be undertaken to better understand how growers in Manjimup are managing flowering in low chill years
- Potential impacts of low winter chill on marketable yield were not adequately addressed in this study and requires further research using a climate analogue and or modelling approach
- A global study to investigate the limits of profitable apple production with regards to winter chill would provide valuable information for the Australian industry in climate change adaptation planning Production areas with very low winter chill accumulation in South Africa and Southern Brazil rely heavily on dormancy-breakers and would be obvious target locations for this research
- The Australian Apple and Pear Industryrsquos ability to adapt to changing climate will depend not only on basic research but on its ability to observe and capture data on tree physiology climate and orchard practice and interpret it in a meaningful way Australiarsquos industry is made up of growing regions with diverse climates and much can be learnt about climate change impacts and options for adaptation by sharing of knowledge
Acknowledgments
The authors would like to extend a very big thank you to the growers Anne and Mauri Lyster and Newton Brothers Orchards who kindly provided orchard blocks for research observations
Thank you to Lisa Starkie and Martine Combret from Western Australia and Osi Tabing Peter Nimmo and Allan McWaters from Queensland for the collection of orchard phenology and temperature data Thank you also to Rebecca Darbyshire for the discussion and input around the interpretation of results
References
Darbyshire R (2016) Crossing the threshold adaptation tipping points for Australian fruit trees University of Melbourne
Darbyshire R Webb L Goodwin I and Barlow E W R (2013a) Evaluation of recent trends in
Australian pome fruit spring phenology International Journal of Biometeorology 57(3)
Darbyshire R Webb L Goodwin I and Barlow E W R (2013b) Impact of future warming on
winter chilling in Australia International Journal of Biometeorology 57(3) 355-366
Erez A (1995) Means to compensate for insufficient chilling to improve bloom and leafing Acta
Horticulturae 395 81-95
Erez A (2000) Bud dormancy phenomenon problems and solutions in the tropics and subtropics in
Erez A ed Temperate Fruit Crops in Warm Climates Kluwer Academic Publishers 17 - 47
Erez A Fishman S Linsley-Noakes G C and Allan P (1990) The dynamic model for rest
completion in peach buds Acta Horticulturae 276 165-174
Fishman S Erez A and Couvillon G A (1987) The temperature dependence of dormancy
breaking in plants mathematical analysis of a two-step model involving a cooperative transition Journal of Theoretical Biology 124 473 - 483
Climate change impacts on flowering in pome fruit trees a climate analogue approach 2016 17
Hennessy K J and Clayton-Greene K (1995) Greenhouse warming and vernalisation of high-chill
fruit in southern Australia Climatic Change 30(3)
Luedeling E Zhang M H Luedeling V and Girvetz E H (2009) Sensitivity of winter chill models
for fruit and nut trees to climatic changes expected in Californias Central Valley Agriculture Ecosystems amp Environment 133(12)
Meier U Graf H Hess M Kennel W Klose R Mappes D Seipp D Stauss R Streif J and
van den Boom T (1994) Phaumlnologische Entwick-lungsstadien des Kernobstes (Malus domestica Borkh und Pyrus communis L) des Steinobstes (Prunus-Arten) der Johannisbeere (Ribes-Arten) und der Erdbeere (Fragaria x ananassa Duch) Nachrichtenbl Deut Pflanzenschutzd 46 141 - 153
Nyairo R Onwonga R Cherogony K and Luedeling E (2014) Applicability of climate analogues
for climate change adaptation planning in Bugabira commune of Burundi Sustainable Agriculture Research 3(4) 46 - 62
Petri J L and Leite G B (2004) Consequences of insufficient winter chilling on apple tree bud-
break Acta Horticulturae 662 53-60
Petri J L Leite G B Couto M Gabardo G C and Haverroth F J (2014) Chemical induction of
budbreak New generation products to replace hydrogen cyanamide Acta Horticulturae 1042 159-166
Ramirez F and Davenport T L (2013) Apple pollination a review Scientia Horticulturae 162
Saure M C (1985) Dormancy release in deciduous fruit trees Horticultural Reviews 7 239-300
Tancred S and McGrath C (2013) Horticulture Production in Queenslands Southern Downs
Region
Theron K (2013) Chemical thinning of apple South African perspective Acta Horticulturae 998 85
- 90
Veloz S Williams J W Lorenz D Notaro M Vavrus S and Vimont D J (2012) Identifying
climatic analogs for Wisconsin under 21st-century climate-change scenarios Climatic Change 112(3-4) 1037-1058
Dormancy-breaking sprays for low winter chill in apples
Heidi Parkes Department of Agriculture and Fisheries Queensland
Susie Murphy White Pomewest Western Australia
Sally Bound University of Tasmania Tasmania
September 2016
This publication has been compiled by Heidi Parkes of Horticulture and Forestry Science Department of Agriculture and Fisheries copy State of Queensland 2016 The Queensland Government supports and encourages the dissemination and exchange of its information The copyright in this publication is licensed under a Creative Commons Attribution 30 Australia (CC BY) licence Under this licence you are free without having to seek our permission to use this publication in accordance with the licence terms
You must keep intact the copyright notice and attribute the State of Queensland as the source of the publication Note Some content in this publication may have different licence terms as indicated For more information on this licence visit httpcreativecommonsorglicensesby30audeeden The information contained herein is subject to change without notice The Queensland Government shall not be liable for technical or other errors or omissions contained herein The readeruser accepts all risks and responsibility for losses damages costs and other consequences resulting directly or indirectly from using this information
iii Dormancy-breaking sprays for low winter chill in apples
Summary
In the 2015-16 season trials were undertaken in lsquoGalarsquo apple trees at three locations
(Queensland Western Australia and Tasmania) to assess the efficacy of using dormancy-
breaking sprays under current Australian climates and the potential to use these sprays as
an orchard management adaptation to inadequate winter chill under future Australian
climates The trials compared the effect of Waikentrade Dormexreg and Ergerreg on the timing of
green tip and flowering the duration of the flowering period fruit set yield harvest time and
variability of maturity at harvest All dormancy-breaking sprays were able to advance
flowering time and compact the flowering period in lsquoGalarsquo apple with differences observed
between products and sites Fruit maturity was advanced with dormancy-breakers (again
with differences observed between products and sites) and generally reflected differences in
flowering dates There were no differences in fruit set yield or variability of apple maturity in
trees treated with dormancy-breaking sprays despite the compaction of flowering Dormexreg
had the most significant impacts on lsquoGalarsquo flowering and harvest timing in WA and QLD
when compared with Waikentrade and Ergerreg The timing of spray application relative to green
tip and winter chill accumulation impacted the bud burst and flowering response to
dormancy-breaking products and therefore flowering responses are likely to vary between
seasons and cultivars Dormancy-breaking sprays are likely to be an effective tool for
managing flowering in lsquoGalarsquo and other apple cultivars in lower chill years in Australia
Benefits from the use of dormancy-breakers would be greater in low chill years when the
potential impacts of inadequate chill on flowering are greatest Therefore benefits are likely
to increase under future warmer climate scenarios Impacts of dormancy-breaking sprays on
fruit quality and length of the harvest window remain unclear
iv Dormancy-breaking sprays for low winter chill in apples
Table of contents
Introduction 6
Project Objectives 7
Materials and methods 7
Site description 7
Experimental design 8
Spray application 8
Temperature data and calculation winter chill 10
Green tip and flowering 10
Fruit set 11
Fruit sampling and maturity assessments 11
Variability in fruit quality at harvest 11
Yield 11
Phytotoxicity 11
Results and discussion 12
Timing of spray application 12
Green tip and flowering 12
Fruit set and yield 15
Fruit maturity and quality 16
Cost-benefit analysis 18
Conclusions 20
Key messages 22
Recommendations 22
Acknowledgements 23
Appendices 23
References 23
Table of figures
Figure 1 Study sites in Huonville TAS (a) Stanthorpe QLD (b) and Manjimup WA (c) in spring 2015 8
Figure 2 Application of dormancy-breaking sprays using a hand lance in Manjimup WA 9
Figure 3 Chill Portion accumulation and dormancy-breaking spray application timing at study sites in TAS QLD and WA 2015 10
Figure 4 Green tip first flower and full bloom in Gala apples treated with and without dormancy-breaking sprays in TAS QLD and WA 13
Figure 5 Differences in stages of flowering on 18 September 2015 in QLD lsquoGalarsquo trees treated with and without dormancy-breakers 14
Figure 6 Fruit set in lsquoGalarsquo apple trees treated with dormancy-breaking sprays at study sites in TAS QLD and WA 2015 15
v Dormancy-breaking sprays for low winter chill in apples
Figure 7 Fruit at harvest on 27 January 2016 in lsquoGalarsquo trees treated with Dormexreg and Ergerreg QLD (centre tree was sprayed surrounding trees are untreated) 18
Figure 8 A schematic representation of the progression of buds through dormancy showing the point at which buds become responsive to the action of dormancy-breaking sprays (Faust et al 1997) 21
Table of tables
Table 1 Description of the orchard study sites 7
Table 2 Details of the dormancy-breaking sprays applied to lsquoGalarsquo trees in WA TAS and QLD in winter 2015 9
Table 3 Actual timing of dormancy-breaking spray application on lsquoGalarsquo trees in QLD WA and TAS 2015 10
Table 4 Effect of dormancy-breaking sprays on green tip and flowering dates and duration for lsquoGalarsquo apple strains grown in TAS QLD and WA in the 2015 - 2016 season 14
Table 5 Effect of dormancy-breaking sprays on gross yield and its components at harvest for lsquoGalarsquo apple strains grown in TAS QLD and WA in the 2015-2016 season 16
Table 6 Effect of dormancy-breaking sprays on fruit maturity and quality at harvest for lsquoGalarsquo apple strains grown in TAS QLD and WA in the 2015-2016 season 17
Table 7 Outline of cost and benefits associated with the use of dormancy-breaking sprays to manage low winter chill years in apple 19
6 Dormancy-breaking sprays for low winter chill in apples
Introduction
Dormancy is a phase of the annual cycle of apple trees that allows them to survive unfavourably cold winter conditions (Saure 1985) The minimum accumulation of winter chill needed to break bud dormancy is defined as the chilling requirement and is thought to be genetically determined (Labuschagne et al 2002 Samish 1954)
Failure to adequately satisfy the chilling requirement can result in delayed and uneven bud burst and flowering and extended duration of the flowering period (Saure 1985 Oukabli 2003) An extended flowering period reduces the effectiveness of chemical thinning (Petri and Leite 2004) and can impact on fruit set and yield (Erez 1995) It has also been shown to result in greater variability of fruit size and maturity which impacts pest and disease management and harvest efficiency (Petri and Leite 2004)
Efforts are being made to breed lower chill cultivars in some crops to enable commercial production in milder growing regions however management tools to compensate for insufficient chilling are still required in many temperate tree fruit production systems in warmer climates (Erez 1995) These tools utilise a range of strategies to manipulate bud progression through dormancy including the use of dormancy-breaking sprays to promote bud burst (Erez 1995 Allderman et al 2011 Saure 1985) The use of dormancy-breaking sprays is perhaps the most widely used and accepted method for managing low chill conditions globally (Erez 2000 Jackson and Bepete 1995 Petri et al 2014)
Winter chill is predicted to decrease in Australian growing regions under future climate change with milder districts likely to experience the impacts of inadequate chilling on a more regular basis (Darbyshire et al 2013 White 2016) The use of dormancy-breaking sprays is a potential adaptation for the apple industry to manage existing commercial cultivars in warmer years as they have been shown to stimulate earlier more homogenous bud burst and flowering in a number of crops grown in conditions with insufficient winter chill (Erez et al 2008 Petri et al 2012 Saure 1985) Additional benefits such as improved uniformity of fruit maturity and quality with the use of dormancy-breaking sprays have been reported (Petri and Leite 2004)
Different types of products have been shown to have dormancy-breaking action in a range of crops These include thidiazuron (a compound with cytokinin-like activity) (Wang et al 1986) dinitro-o-cresol (DNOC-oil) and potassium nitrate (Faust et al 1997) garlic extract and gibberellic acid (Abd El-Razek et al 2013) the emulsified vegetable oil compound Waikentrade (Bound and Miller 2006) and hydrogen cyanamide which is better known as Dormexreg (Bound and Jones 2004) Dormexreg has known risks for plant and human health and therefore alternatives to the use of this product have been sought (Petri et al 2014) More recently Ergerreg an inorganic nitrogen compound combined with calcium nitrate has been shown to cause earlier and more compact flowering in apples (Petri et al 2014 Petri et al 2010)
However with the exception of two studies (Bound and Jones 2004 Bound and Miller 2006) little work has been undertaken in Australia to investigate the efficacy of dormancy-breaking sprays to induce earlier and more uniform flowering in apple cultivars grown under local conditions and the effects on fruit quality and yield remain unclear
A survey performed at the WA National Climate Change project Roadshow event in 2014 indicated that half of the growers were currently using Waikentrade and or Dormexreg for the purposes of stimulating uniform bud burst and flowering under conditions of inadequate chill however there was considerable uncertainty around best practice issues and effectiveness Questions and discussions with growers in other growing regions also indicated an interest in these products but highlighted the need for better understanding regarding use and efficacy in low chill years under current climates and potential as an adaptation strategy for climate change
7 Dormancy-breaking sprays for low winter chill in apples
Project Objectives
The overarching research question was are dormancy-breaking sprays a feasible adaptation option for the Australian apple industry to low chill years in current and future climates
The specific research objectives were to determine
a Impact of dormancy-breaking sprays on the timing of bud burst and flowering and duration of the flowering period in lsquoGalarsquo apple grown in diverse Australian climates
b Impact of dormancy-breaking sprays on fruit set yield and variability of maturity and quality in Australian lsquoGalarsquo apple trees
c Comparative effectiveness of using Waikentrade Dormexreg and Ergerreg as dormancy-breaking sprays in apple
d Cost-benefit of using dormancy-breaking sprays
e Issues (actual and potential) associated with using dormancy-breaking sprays for management of and adaptation to inadequate winter chill under Australian conditions
f Future research needs towards improving orchard practices around the use of dormancy-breaking products
To investigate these objectives a study was undertaken in lsquoGalarsquo apple tree cultivars in the 2015 2016 season at three orchard locations around Australia (QLD WA and TAS)
Materials and methods
Site description
The study was performed at three commercial orchard sites around Australia in the 2015 to 2016
season (Table 1 and Figure 1) Sites were fully mature lsquoGalarsquo blocks and were representative of high-
density plantings in Australia Trees were trained to a dominant central leader and with the
exception of the application of dormancy-breaking sprays as part of this study were managed by the
grower using standard orchard practices
Table 1 Description of the orchard study sites
State Growing region
Latitude and longitude
lsquoGalarsquo strain Rootstock
Density treesha
Netted
Queensland (QLD)
Stanthorpe 2852 S 15190 E
Royal GalaM26 2500 Yes
Western Australia (WA)
Manjimup 3416 S 11670 E
GalaxyM26 2500 No
Tasmania (TAS)
Huonville 4301 S 14706 E
Alvina GalaM26 2500 No
8 Dormancy-breaking sprays for low winter chill in apples
Figure 1 Study sites in Huonville TAS (a) Stanthorpe QLD (b) and Manjimup WA (c) in spring 2015
Experimental design
The experiment was a randomised complete block design with two treatments (Waikentrade and Dormexreg) and an untreated control in WA and TAS and three treatments (Waikentrade Dormexreg and Ergerreg) and an untreated control in QLD Replicates were individual trees with five replicates per
treatment Guard trees were included either side of the datum trees to ensure complete coverage of
datum trees and to protect other datum trees in the row from over-spraying Sprays were applied at
one concentration and timing according to directions on the product label
Spray application
Dormancy-breaking sprays were applied to the datum trees using a hand lance (Figure 2) as
described in Table 2
a
b
c
9 Dormancy-breaking sprays for low winter chill in apples
Table 2 Details of the dormancy-breaking sprays applied to lsquoGalarsquo trees in WA TAS and QLD in winter 2015
Dormexreg Waikentrade Ergerreg
Active constituent 520gL Cyanamide 388gL Methyl esters of fatty acids
250gL Decanol alkoxylate (fertiliser adjuvant)
Product rate 3L 100L water (3 vv) 4L 100L water (4 vv) 5L 100L water (5 vv)
Additives
50ml100L Agral or 125ml100L Kendeen 20
NA 10kg100L Calcium nitrate
Application Applied as a fine spray over entire tree to the point of run-off
Application timing
35 days before expected green tip (label suggests 30 ndash 45 days)
35 before expected green tip (label suggests 35 ndash 50 days)
35 days before expected green tip (label suggests 45 days)
Determination of application date
Grower records of historical green tip dates were accessed for the study site Chill accumulation was monitored during the winter and compared with historical chill accumulation data to obtain the best estimate of expected green tip date
Figure 2 Application of dormancy-breaking sprays using a hand lance in Manjimup WA
10 Dormancy-breaking sprays for low winter chill in apples
Table 3 Actual timing of dormancy-breaking spray application on lsquoGalarsquo trees in QLD WA and TAS 2015
Location Spray Date Green tip date
Spray timing (days before
green tip)
Chill Portions at spraying
(brackets total chill)
Total chill Portions
TAS 13 Aug 8 Sep 26 95 (84) 113
QLD 30 July 5 Sep 37 60 (75) 80
WA 18 Aug 23 Sep 36 58 (75) 77
In untreated trees accumulated from 1 Jan to green tip
Figure 3 Chill Portion accumulation and dormancy-breaking spray application timing at study sites in TAS QLD and WA 2015
Temperature data and calculation winter chill
Hourly temperature data was recorded in the orchard using temperature data loggers placed inside a miniature Stevensonrsquos screen positioned approximately 15 to 2m within the tree row Winter chill was calculated in Chill Portions using the Dynamic model (Erez et al 1990 Fishman et al 1987)
Green tip and flowering
Buds were monitored three times per week (full methods described in appendix 1) from just prior to green tip until the end of flowering Only spur and terminal buds were assessed with axillary buds
11 Dormancy-breaking sprays for low winter chill in apples
and long highly vigorous shoots excluded Dates were recorded for the day on which each tree reached green tip 5 flowering and full bloom
Green tip was defined as the date when 5 of the buds of the tree had observable green tips corresponding to the 07 stage in the international BBCH code for pome fruit (beginning of bud break first green leaf tips just visible) (Meier et al 1994) Full bloom was defined as the date when 80 of the flowers were open similar to stage 65 in the international BBCH code for pome fruit (full flowering at least 50 of flowers open first petals falling) (Meier et al 1994)
Fruit set
Fruit set measurements were taken from three representative mid-canopy branches per tree The number of spur and terminal flower clusters were recorded for each limb soon after green tip when flowers were emerging The number of fruit set per cluster was recorded for each tagged limb after final fruit drop but before hand-thinning
Fruit sampling and maturity assessments
A 30 fruit sample was taken per datum tree prior but as close as possible to the growerrsquos first harvest For the purpose of standardisation between treatments fruit was sampled from the mid-section of each tree on the same side of the row To ensure the full range of variability was captured fruit were picked from along the entire length of a branch before moving on to the next branch This ensured that fruit was not biased towards selection from the outside or inside of the canopy
The following assessments were made on the 30 fruit sample
- Starch Pattern Index (SPI) was determined using the starch-iodine test for apples Each fruit was cut transversely across the equator and the cut surface of one side sprayed with a solution of 1g potassium iodide plus 025g iodine per 100ml water (01 iodine 1 potassium iodide The resulting pattern of starch hydrolysis was compared with the ENZA 0-6 scale
- Background colour (BGC) was estimated using an ENZA lsquoRoyal Galarsquo swatch - Red blush intensity (RBI) was assessed by comparing the blushred side of the fruit with the
lsquoRoyal Galarsquo ENZA 11 point colour chart - Red blush coverage (RBC) was assessed by estimating the of the fruit surface covered by
greater than or equal to an RBI of 2 (on the ENZA 11 point chart)
Variability in fruit quality at harvest
Variability of fruit maturity and quality at harvest was assessed by calculating the standard deviation of the fruit weight SPI BGC RBI RBC measurements taken from the 30 fruit sample
Yield
Yield was calculated per tree by multiplying the total fruit number (counted and recorded prior to harvest) by the average fruit weight (taken from the 30 fruit sample) Trunk cross-sectional area (TCA) was calculated from a trunk circumference measurement taken 20 cm above the graft
Phytotoxicity
As both Dormexreg (Bound and Jones 2004) and Ergerreg (Hawerroth et al 2010) can cause phytotoxicity phtotoxicity was assessed and recorded from the date of spray application to flowering using a 0-4 scale (appendix 2)
12 Dormancy-breaking sprays for low winter chill in apples
Results and discussion
Timing of spray application
The target spray timing was 35 days before green tip Historical green tip records together with in-season chill accumulation calculations were used to predict the estimated date of green tip for 2015 A best estimate of green tip date was determined by comparing the current seasonrsquos chill accumulation curve with that of the previous few seasons to determine how the season was tracking The actual spray date was further dictated by the weather with favourable conditions for spraying required Actual spray timing was 26 37 and 36 days before green tip in TAS QLD and WA respectively (Table 3)
The timing of dormancy-breaking spray application can have considerable impact on product efficacy (Faust et al 1997 Petri et al 2010) Spraying too early reduces effectiveness and spraying too close to bud burst can have undesirable effects such as delayed green tip and bud damage (Bound and Jones 2004 Bound and Miller 2006) Getting the timing right can be problematic however due to difficulties in estimating the date of green tip Dormancy-breaking sprays are commonly applied according to calendar date in other crops such as grapes (pers comm) but this is not recommended in apples as the date of green tip can vary considerably from season to season The methods described in this study estimated green tip dates successfully in WA and QLD Green tip timing was more difficult to predict in TAS primarily due to the exceptionally cold winter conditions
No bud or flower phytotoxicity was observed in this study with any of the dormancy-breaking spray treatments
Green tip and flowering
Green tip and flowering responses to dormancy-breaking sprays varied between sites (Figure 4 and Table 4)
In TAS green tip was delayed by five and six days in Dormexreg and Waikentrade sprayed trees respectively (Figure 4 and Table 4) Extended dormancy is not an uncommon response and occurs when dormancy-breaking sprays are sprayed close to bud burst (Bound and Miller 2006) These trees caught up with the untreated control trees and there were no significant differences in the date of full bloom or the duration of the flowering period A reduction in the length of flowering was observed in trees sprayed with both of the dormancy-breaking products but this was not statistically significant
The lack of flowering response to the dormancy-breaking sprays was likely due to the cold 2015 winter in which Huonville received 113 chill portions well above the long-term average of 88 Under these conditions it was likely that the lsquoGalarsquo chilling requirement was satisfied prior to application of the dormancy-breaking sprays limiting the potential impact Buds were possibly already sitting in the eco-dormant phase of dormancy waiting for favourable growing conditions The rapid onset of a warm spring resulted in a short flowering period of just two to three days in all trees
In QLD green tip was significantly advanced in trees sprayed with Dormexreg Ergerreg and Waikentrade by nine six and five days respectively when compared with untreated trees (Figure 4 and Table 4) Full bloom was advanced by 12 5 and 5 days with Dormexreg Ergerreg and Waikentrade respectively (Figure 5) and the flowering period was condensed with all dormancy-breaking sprays Green tip and flowering responses to the Dormexreg spray were significantly stronger than responses to Waikentrade and Ergerreg with no differences observed between the latter two products
In WA green tip was significantly advanced by 14 days in trees sprayed with Dormexreg and four days in trees sprayed with Waikentrade (Figure 4 and Table 4) Full bloom was advanced by nine days in Dormexreg sprayed trees while there was no difference in full bloom dates between trees sprayed with Waikentrade and the untreated trees The length of the flowering period was reduced by 19 with
13 Dormancy-breaking sprays for low winter chill in apples
Dormexreg while Waikentrade caused a significant increase in the flowering period by 39 In studies of both time and rate of application across five cultivars Bound and Miller (2006) reported that Waiken concentrated the flowering period regardless of whether the flowering period was brought forward or delayed The cause of the lengthening of flowering in this study in the Waikentrade treated trees is unclear and requires further studies to determine if this is a real response to Waikentrade or the result of other experimental factors
The differences observed in green tip and flowering responses to dormancy-breaking sprays at each site in the 2015-2016 season indicate that responses are likely to vary from season to season depending on factors including temperatures before and after spraying and timing of spraying relative to green tip Petri et al (2010) described the impact of temperature at spraying and in the days immediately following spraying on the response to dormancy-breaking sprays
In QLD and WA dormancy-breaking sprays caused large changes to full bloom timing and duration indicating that careful consideration needs to be given to the flowering time of polliniser varieties to ensure fruit set is not impacted With historical knowledge of cultivar flowering times dormancy-breaking sprays can be used to improved synchronisation of flowering between cultivars and their pollinisers (Petri et al 2012)
Figure 4 Green tip first flower and full bloom in Gala apples treated with and without dormancy-breaking sprays in TAS QLD and WA
14 Dormancy-breaking sprays for low winter chill in apples
Table 4 Effect of dormancy-breaking sprays on green tip and flowering dates and duration for lsquoGalarsquo apple strains grown in TAS QLD and WA in the 2015 - 2016 season
Site lsquoGalarsquo strain
Treatment Green tip (DoY)
First flower (DoY)
Full bloom
(DoY) Green tip to first flower (days)
First flower to full bloom (days)
Tas Alvina Untreated 251 b 275 b 278 24 a 3
Dormexreg 256 a 277 a 279 20 b 2
Waikentrade 257 a 277 a 279 20 b 2
QLD Royal Untreated 248 a 266 a 278 17 c 12 a
Dormexreg 239 c 259 c 266 20 b 7 c
Ergerreg 242 b 264 b 273 22 a 9 b
Waikentrade 243 b 264 b 273 21 ab 9 b
WA Galaxy Untreated 266 a 281 a 287 15 b 6 b
Dormexreg 252 c 273 c 278 21 a 5 c
Waikentrade 262 b 278 b 287 17 b 9 a
DoY = Day of year Within a single and site only means with different letters are significantly different P = 005 LSD test Full bloom dates did not vary between trees within each treatment and therefore no statistics could be performed
Figure 5 Differences in stages of flowering on 18 September 2015 in QLD lsquoGalarsquo trees treated with and without dormancy-breakers
Ergerreg
Untreated Waikentrade
tradereg
Dormexreg
regregregreg
15 Dormancy-breaking sprays for low winter chill in apples
Fruit set and yield
Fruit set expressed as the percentage of flower clusters that set fruit was not significantly different between treatments at any location (Figure 6) indicating that compaction of the flowering period observed most strongly in QLD did not negatively (or positively) impact the effectiveness of pollination Similarly when expressed as the number of fruit set per 100 flower clusters there was no difference between treatments (data not shown) Dormancy-breaking sprays have been shown to have a slightly negative effect on fruit set in some studies (Hawerroth et al 2010 Bound and Jones 2004) suggesting that impacts on pollination success are likely to be influenced by factors such as cultivar and season
Interestingly the number of fruit set per 100 flower clusters was significantly different between locations with TAS showing the highest fruit set followed by WA and then QLD (data not shown)
Figure 6 Fruit set in lsquoGalarsquo apple trees treated with dormancy-breaking sprays at study sites in TAS QLD and WA 2015
There were no differences in gross apple yields between treatments at any location (Table 5) In TAS fruit from Waikentrade treated trees had the highest and most marketable mean fruit weight compared with the other treatments however this was likely a crop load effect and not a result of the treatment per se (Table 5) Yield adjusted for trunk cross sectional area was significantly higher in the control trees compared with both Waikentrade and Dormexreg treated trees in TAS It is unclear whether these differences were a result of the treatment as flowering density varied widely between trees in the block and therefore it is possible that any differences in yield were a reflection of flowering density rather than an impact of the treatments
In QLD fruit numbers were significantly higher in the Dormexreg treated trees compared with those sprayed with Ergerreg and Waikentrade (Table 5) Again it is unclear whether this is the result of the treatments as there were no significant differences in the percentage of flowers setting fruit (Figure 6) In WA there were no differences in the components of yield between treatments (Table 5)
Dormexreg has been shown to significantly improve yields in other studies of apple including in lsquoGranny Smithrsquo and lsquoGolden Deliciousrsquo (Jackson and Bepete 1995) Such improvements are likely to be more substantial in very warm growing regions such as the one used in the Jackson and Bepete (1995)
16 Dormancy-breaking sprays for low winter chill in apples
study which had less than 300 chill hours where yields are generally very low to start with In most Australian growing regions significant improvements are more likely to be related to fruit quality and marketable yield rather than gross yield
Table 5 Effect of dormancy-breaking sprays on gross yield and its components at harvest for lsquoGalarsquo apple strains grown in TAS QLD and WA in the 2015-2016 season
Site lsquoGalarsquo strain
Treatment TCA1 (cm2)
Fruit no tree
Fruit no TCA
Mean fruit weight (g)
Kgtree KgTCA Tha
Tas Alvina Untreated 141 233 166 a 1332 b 308 22 a 77
Dormexreg 162 201 121 b 1248 c 241 15 b 60
Waikentrade 158 118 77 c 1573 a 187 12 b 47
QLD Royal Untreated 185 196 ab 108 a 1288 252 14 63
Dormexreg 217 241 a 111 a 1285 308 14 77
Ergerreg 212 167 b 81 b 1395 233 11 58
Waikentrade 206 187 b 93 ab 1303 242 12 60
WA Galaxy Untreated 173 162 105 1070 166 11 41
Dormexreg 180 161 102 1141 184 11 46
Waikentrade 196 212 108 1044 219 11 55
1TCA = trunk cross-sectional area Within a single and site only means with different letters are significantly different P = 005 LSD test
Fruit maturity and quality
Results of the effect of dormancy-breaking sprays on fruit maturity and quality are shown in Table 6 In TAS fruit from trees treated with Waikentrade were the most advanced according to the delta absorbance (DA) meter and background colour however the starch pattern index results indicate that fruit from untreated trees were the most mature at harvest Therefore differences in the timing of maturity with treatments are not clear but the impacts were not large
In QLD fruit was harvested on different dates due to the large differences in maturity between treatments Fruit from Dormexreg trees were more than one week ahead of untreated trees (Table 6) Fruit from Ergerreg and Waikentrade trees were also ahead by at least two days however comparison of the background colour and red blush coverage data suggested that fruit on these trees were further advanced (Figure 7) Advances in fruit maturity reflected the differences in flowering dates
In WA fruit maturity was slightly advanced in Dormexreg trees compared with control but this was not statistically significant (Table 6) The background colour was significantly higher in fruit from Waikentrade treated trees compared with Dormexreg and control trees According to the data there were no differences in red blush coverage between treatments although grower observation suggested that
17 Dormancy-breaking sprays for low winter chill in apples
the colour was more intense in the trees sprayed with Dormexreg compared with other treatments This may have been due to advanced maturity
Table 6 Effect of dormancy-breaking sprays on fruit maturity and quality at harvest for lsquoGalarsquo apple strains grown in TAS QLD and WA in the 2015-2016 season
Site lsquoGalarsquo strain
Treatment Fruit sample date
Starch pattern index
Background colour
Red blush coverage2
()
Red blush intensity2
DA index1
Tas Alvina Untreated 7316 08 a 64 b 045 b
Dormexreg 7316 03 b 62 c 051 a
Waikentrade 7316 03 b 65 a 035 c
QLD Royal Untreated 3216 24 34 c 156 b 18
Dormexreg 27116 32 41 b 356 a 29
Ergerreg 1216 35 45 a 360 a 31
Waikentrade 1216 35 43 ab 339 a 30
WA Galaxy Untreated 9216 21 34 b 709 52
Dormexreg 9216 31 34 b 682 46
Waikentrade 9216 25 41 a 726 50
1DA index was measured with the Delta Absorbance meter in Tasmania only 2Red blush coverage and intensity were not measured in Tasmania Numbers are the average of 30 fruit samples Within a single and site only means with different letters are significantly different P = 005 LSD test
18 Dormancy-breaking sprays for low winter chill in apples
Figure 7 Fruit at harvest on 27 January 2016 in lsquoGalarsquo trees treated with Dormexreg and Ergerreg QLD (centre tree was sprayed surrounding trees are untreated)
There was no measurable reduction in the variability of fruit maturity (as assessed by looking at colour starch pattern index and fruit weight) at harvest with any of the sprays (data not shown) despite the significant effect of the treatments on compaction of flowering at some sites Similar results were observed by Bound and Jones (2004) who found no consistent trends in impacts on fruit quality with the use of Dormexreg even though significant compaction of the flowering period was observed
Based on the finding that an extended flowering period increases the variability of fruit size at harvest (Petri and Leite 2004) it was hypothesised in this study that a reduction in the spread of flowering would result in a reduction in the spread of maturity potentially reducing the number of picks and increasing the percentage of fruit picked at optimum maturity
Failure to observe an improvement in variability could be the result of a number of factors Firstly the small experimental scale Up-scaling the experiment to rows or blocks of trees would provide more scope for identifying differences in fruit variability and potential for improving harvest management Secondly other influences impacting on fruit quality may have overshadowed any effects of the more uniform flowering Factors such as position in the canopy shading leaf area associated with individual fruit development and age of wood bearing the fruit have all been shown to impact on mineral content and quality (Volz et al 1994)
Cost-benefit analysis
A full cost-benefit analysis was not undertaken here as the size of the study did not enable sufficient collection of data for meaningful analysis of dollar value however the broad costs and benefits are outlined in Error Reference source not found
Dormexreg
reg
Ergerreg (centre tree only)
19 Dormancy-breaking sprays for low winter chill in apples
Table 7 Outline of cost and benefits associated with the use of dormancy-breaking sprays to manage low winter chill years in apple
Costs
Direct costs
Product purchase
Labour to apply product
Tractor and associated costs to perform one spray during the dormant period
Potential indirect costs
Inappropriate application timing could result in anything from nil benefit to significant bud damage resulting in negative impacts on pollination and fruit set
Human health impacts from inappropriate handling and use of some dormancy-breaking products
Benefits
More compact and uniform flowering resulting in improved efficiency of chemical thinning and management of flowering pests
More compact flowering potentially resulting in more uniform fruit maturity throughout the canopy and therefore shorter harvest duration (saving on labour costs) and improvements in fruit quality Also likely to be benefits for the effectiveness of pest and disease management and efficacy of plant growth regulators such as ReTainreg to manage harvest
Benefits would be greater in low chill years when the potential impacts of inadequate chill on flowering are greatest Benefits are likely to increase under future warmer climate scenarios
Earlier flowering and harvest time market-price benefits in some cases
Benefits are likely to vary with cultivar and block (for example tree structure may effect impact of dormancy-breaking sprays on fruit quality)
20 Dormancy-breaking sprays for low winter chill in apples
Conclusions
The dormancy-breaking sprays assessed in this study were able to advance flowering time and compact the flowering period in lsquoGalarsquo apple with differences observed between products and sites A more compact and uniform flowering period has a number of benefits including improved management of bee hives flowering pests and chemical thinning practices
Despite the compaction of flowering there were no clear differences observed in fruit set yield or variability of apple maturity in trees treated with dormancy-breaking sprays More work is required to test the potential of these products to improve fruit quality and reduce the length of harvest Advances in harvest timing were observed with the dormancy-breakers and generally reflected differences in flowering dates The ability to manipulate harvest timing can be useful in situations where advantage can be taken of a high-price market window
Dormexreg had the most significant impacts on lsquoGalarsquo flowering and harvest timing in WA and QLD when compared with Waikentrade and Ergerreg However Dormexreg is considerably more toxic to humans than either Waikentrade or Ergerreg and has greater capacity to cause phytotoxicity (Bound and Miller 2006) It has been noted in other studies that a significant advantage of using non-toxic dormancy-breaking products such as Waikentrade is greater flexibility with the timing of application The product can be applied later in the season (up to when some buds are showing green) without causing damage to buds (Bound and Miller 2006)
Application timing of dormancy-breaking sprays relative to green tip previous winter chill accumulation and temperatures received after spraying had considerable impact on product efficacy in this study As a consequence flowering responses are likely to vary between seasons and it is important to consider the flowering time of polliniser cultivars to ensure flowering overlap so that fruit set is not affected
The overarching research question posed at the outset of this study was are dormancy-breaking sprays a feasible adaptation option for the Australian apple industry to low chill years in current and future climates Results have indicated that dormancy-breaking sprays are likely to be an effective tool for managing flowering in lsquoGalarsquo in lower chill years in Australian growing conditions It seems reasonable to broaden this conclusion to other apple cultivars when considered in the context of results from previously published research in lsquoFujirsquo lsquoGranny Smithrsquo lsquoCripps Pinkrsquo and lsquoCripps Redrsquo (Bound and Jones 2004 Bound and Miller 2006 Petri et al 2014 Erez 2000) However significant research gaps still remain
How effective will dormancy-breaking sprays be as an adaptation for the Australian apple industry to the climate change in the longer term Or to phrase the question another way when will the winter chill received in an orchard fall too far below the chilling requirement for even the use of dormancy-breaking sprays to enable economic production Only a proportion of the chilling requirement can be compensated for by the use of dormancy-breaking sprays (Faust et al 1997) but the size of this proportion is unclear It has been suggested that up to 30 of the chilling requirement can be compensated for with dormancy-breaking sprays (Erez 1995) however compensation closer to 45 has been demonstrated in stone fruit (George et al 2002)
A global study to investigate the limits of profitable apple production with regards to winter chill would provide valuable information for the Australian industry in climate change adaptation planning Production areas with very low winter chill accumulation in South Africa and Southern Brazil rely heavily on dormancy-breakers and would be obvious target locations for this research
A more accurate method for determining dormancy-breaking spray timing is required to improve the consistency and predictability of the flowering response Difficulties in estimating the green tip date has potential to reduce the product efficacy and cause bud damage in the worst cases Faust et al
21 Dormancy-breaking sprays for low winter chill in apples
(1997) suggested that dormancy-breakers are only effective when sprayed during the lsquos-endodormancyrsquo phase of dormancy and not before (Figure 8) A biological marker is required to determine when buds are at this stage and therefore responsive to dormancy-breaking sprays Biochemical changes in water status cell membrane composition hormone production and anabolic potential have been identified in buds as they progress through the stages of dormancy (Faust et al 1997) and could potentially be used as markers of dormancy status Incidentally the use of tetrazolium staining (Carvalho et al 2010) as a simple tool to monitor the status of bud dormancy in apples was assessed as part of this study but could not reliably track the shift from dormancy to bud burst (data not shown)
The mechanism by which dormancy-breaking sprays act to promote bud burst particularly in the case of Dormexreg remains unclear Vergara et al (2012) suggested that a respiratory stress may be involved in the release of buds from dormancy and Melke (2015) concluded that oxygen starvation was involved in the dormancy breaking mechanism when applying oils Understanding the mode of action would enable the development of products with greater efficacy and safety
The Australian pistachio industry has recommended winter oil application in low chill years to advance bud burst The recommendation states that winter oil be applied if 57 Chill Portions have not been reached by 15 August (Zhang and Taylor 2011) Defined guidelines for apple varieties on the use of dormancy-breaking sprays are likely to be some way off due to a lack of understanding around cultivar chilling requirements Investigations should be undertaken however into the possibility of determining broad guidelines based on current knowledge
Figure 8 A schematic representation of the progression of buds through dormancy showing the point at which buds become responsive to the action of dormancy-breaking sprays (Faust et al 1997)
22 Dormancy-breaking sprays for low winter chill in apples
Key messages
- Dormancy-breaking sprays are likely to be an effective tool for managing flowering in lsquoGalarsquo and other apple cultivars in lower chill years in Australia
- Impacts of dormancy-breaking sprays on fruit quality and length of the harvest window remain unclear
- Benefits from the use of dormancy-breakers are likely to be greater in low chill years when the potential impacts of inadequate chill on flowering are greatest Therefore benefits are likely to increase under future warmer climate scenarios
- Dormexreg Waikentrade and Ergerreg were able to advance flowering time and compact the flowering period in lsquoGalarsquo apple with differences observed between products and sites Compact and uniform flowering period has benefits for improved management of bee hives flowering pests and chemical thinning practices
- Fruit maturity was advanced with dormancy-breakers with differences observed between products and sites and generally reflected differences in flowering dates The ability to manipulate harvest timing can be useful in situations where advantage can be taken of a high-price market window
- There were no differences in fruit set yield or variability of apple maturity in trees treated with dormancy-breaking sprays despite the compaction of flowering
- Dormexreg had the most significant impacts on lsquoGalarsquo flowering and harvest timing in WA and QLD when compared with Waikentrade and Ergerreg
- The timing of spray application relative to green tip previous winter chill accumulation and temperatures received after spraying impacts the bud burst and flowering response to dormancy-breaking products
- Flowering responses are likely to vary between seasons cultivars and blocks
- Flowering time of polliniser cultivars needs to be considered to ensure flowering overlaps so that fruit set is not affected
Recommendations
- The timing of dormancy-breaking spray application should be carefully considered as inappropriate timing could result in anything from nil benefit to significant bud damage resulting in negative impacts on pollination and fruit set
- Application timing should be determined using historical green tip and winter chill records together with monitoring of in-season chill accumulation Historical and up-to-date in-season winter chill information will be available from the Australian winter chill website (to be released in March 2017)
- Investigations should be undertaken into the possibility of determining broad guidelines around for the use of dormancy-breaking sprays to manage low chill years in cultivars of apple based on existing knowledge Such guidelines should include information on when dormancy-breaking sprays should be used and in which cultivars and regions
- Potential benefits of dormancy-breaking sprays on variability of fruit maturity and the length of the harvest window remain unclear Further research is required to investigate how these products might be used to improve fruit quality and harvest efficiency particularly in cultivars requiring multiple picks
23 Dormancy-breaking sprays for low winter chill in apples
- Investigations into alternatives to Dormexreg are required Current research suggests that this product remains the most efficacious dormancy-breaker available in Australia but its mammalian health impacts may result in de-registration in the future Research is required to determine the mode of action of Dormexreg to enable development of dormancy-breaking products with greater efficacy and safety
- In considering potential for adaptation to warmer winters Australian apple growers need to know when the winter chill received in their orchard will fall too far below the chilling requirement for dormancy-breaking sprays to enable economic production of each cultivar Further research at both the basic and applied levels would be required to provide these guidelines
- A global study to investigate the limits of profitable apple production with regards to winter chill would provide valuable information for the Australian industry in climate change adaptation planning Production areas with very low winter chill accumulation in South Africa and Southern Brazil rely heavily on dormancy-breakers and would be obvious target locations for this research
- Basic research is necessary to identify a biological marker of bud progression through dormancy to facilitate optimal timing for dormancy-breaking spray application
- Further research to develop phenology models of bud burst timing for apple cultivars is required to enable more accurate estimations of green tip date
Acknowledgements
We thank Steven and Ugo Tomasel (Qld) Maurie Ann Tim and Michelle Lyster (WA) and Scott Price (TAS) for the use of their orchards in this trial Thanks to Allan McWaters John Sutton Lisa Starkie and Steve Paterson for providing the technical support necessary to conduct this trial
Appendices
1 Phenology Data Collection Protocols 2 Bud damage scale
References
Abd El-Razek E Abd El-Migeed M M M and Abdel-Hamid N (2013) Response of le conte pear trees to garlic extract and GA3 as budbreak dormancy agents Middle East Journal of Scientific Research 14(11) 1407-1413
Allderman L A Steyn W J and Cook N C (2011) Growth regulator manipulation of apple bud
dormancy progressions under conditions of inadequate winter chilling South African Journal of Plant and Soil 28(2) 103 - 109
Bound S A and Jones K M (2004) Hydrogen cyanamide impacts on flowering crop load and fruit
quality of red Fuji apple (Malus domestica) New Zealand Journal of Crop and Horticultural Science 32(2) 227-234
Bound S A and Miller P (2006) Effects of Waikenreg on flowering and spring growth in apple Acta
Horticulturae 727 167-174
24 Dormancy-breaking sprays for low winter chill in apples
Carvalho R I N Rendoke J C Biasi L A and Zanette F (2010) Metabolic activity evaluation of
temperate tree fruit buds by using the tetrazolium test Acta Horticulturae 872 89 - 95
Darbyshire R Webb L Goodwin I and Barlow E W R (2013) Impact of future warming on winter
chilling in Australia International Journal of Biometeorology 57(3) 355-366
Erez A (1995) Means to compensate for insufficient chilling to improve bloom and leafing Acta
Horticulturae 395 81-95
Erez A (2000) Bud dormancy phenomenon problems and solutions in the tropics and subtropics in
Erez A ed Temperate Fruit Crops in Warm Climates Kluwer Academic Publishers 17 - 47
Erez A Fishman S Linsley-Noakes G C and Allan P (1990) The dynamic model for rest
completion in peach buds Acta Horticulturae 276 165-174
Erez A Yablowitz Z Aronovitz A and Hadar A (2008) Dormancy breaking chemicals Efficiency
with reduced phytotoxicity Acta Horticulturae 772 105-112
Faust M Erez A Rowland L J Wang S Y and Norman H A (1997) Bud dormancy in
perennial fruit trees Physiological basis for dormancy induction maintenance and release HortScience 32(4) 623-629
Fishman S Erez A and Couvillon G A (1987) The temperature dependence of dormancy
breaking in plants mathematical analysis of a two-step model involving a cooperative transition Journal of Theoretical Biology 124 473 - 483
George A P Broadley R H Nissen R J and Ward G (2002) Effects of new rest-breaking
chemicals on flowering shoot production and yield of subtropical tree crops Acta Horticulturae 575 835-840
Hawerroth F J Petri J L and Leite G B (2010) Erger and calcium nitrate concentration for
budbreak induction in apple trees Acta Horticulturae 872 239-244
Jackson J E and Bepete M (1995) The effect of hydrogen cyanamide (Dormex) on flowering and
cropping of different apple cultivars under tropical conditions of sub-optimal winter chilling Scientia Horticulturae 60(3-4) 293-304
Labuschagne I F Louw J H Schmidt K and Sadie A (2002) Genetic variation in chilling
requirement in apple progeny Journal of the American Society for Horticultural Science 127(4) 663-672
Meier U Graf H Hess M Kennel W Klose R Mappes D Seipp D Stauss R Streif J and
van den Boom T (1994) Phaumlnologische Entwick-lungsstadien des Kernobstes (Malus domestica Borkh und Pyrus communis L) des Steinobstes (Prunus-Arten) der Johannisbeere (Ribes-Arten) und der Erdbeere (Fragaria x ananassa Duch) Nachrichtenbl Deut Pflanzenschutzd 46 141 - 153
25 Dormancy-breaking sprays for low winter chill in apples
Oukabli A Bartolini S and Viti R (2003) Anatomical and morphological study of apple (Malus x domestica Borkh) flower buds growing under inadequate winter chilling Journal of Horticultural Science and Biotechnology 78(4) 580-585
Petri J L Hawerroth F J Leite G B Couto M and Francescatto P (2012) Apple phenology in
subtropic climate conditions in Zhang X ed Phenology and climate change Rijeka Croatia InTech 195 - 216
Petri J L and Leite G B (2004) Consequences of insufficient winter chilling on apple tree bud-
break in Jindal K K Sharma R C and Rehalia A S eds Acta Horticulturae
Petri J L Leite G B Couto M Gabardo G C and Haverroth F J (2014) Chemical induction of
budbreak New generation products to replace hydrogen cyanamide Acta Horticulturae 1042 159-166
Petri J L Leite G B and Hawerroth F J (2010) Time of Erger application for budbreak induction
in apple trees Acta Horticulturae 872 205-210
Samish R M (1954) Dormancy in woody plants Annual Review of Plant Physiology 5 183-204
Saure M C (1985) Dormancy release in deciduous fruit trees Horticultural Reviews 7 239-300
Volz R K Ferguson I B Hewett E W and Woolley D J (1994) Wood age and leaf area
influence fruit size and mineral composition of apple fruit Journal of Horticultural Science 69(2) 385-395
Wang S Y Steffens G L and Faust M (1986) Breaking bud dormancy in apple with a plant
bioregulator thidiazuron Phytochemistry 25(2) 311-317
White N (2016) Climate scenarios for pome fruit growing regions of Australia (2030 and 2050)
Queensland Australia Department of Agriculture and Fisheries
Zhang J and Taylor C (2011) The Dynamic Model Provides the Best Description of the Chill
Process on Sirora Pistachio Trees in Australia HortScience 46(3) 420-425
26 Dormancy-breaking sprays for low winter chill in apples
Appendix 1
PHENOLOGY DATA COLLECTION PROTOCOLS
11 Phenology Data
Phenology assessments will be performed to determine 5 green tip (apple) and full bloom
(80 open flowers) dates for apple varieties Regular visual assessments (Monday
Wednesday and Friday) will be made from just prior to budburst until flowering is
completed Assessments will be performed on a whole tree basis with only spur and terminal
buds and spur and terminal flower clusters assessed (axillary buds on one-year-old pome fruit
shoots are not included in the assessments)
12 Apple Phenology Collection Methods
Select five trees to monitor for each variety and rootstock (where applicable) under
investigation
Green tip
Prior to green tip count the number of buds (spur and terminal) on one of the
five selected trees and record
Compare the remaining four trees and estimate up or down the number of buds
on each tree If there is an obvious variation to the counted tree perform a full
count
Estimate green tip percentages by counting all buds at the green tip stage The
initial bud count will inform this For instance if the tree has 500 buds 25 buds
at green tip will indicate the tree is at 5
After the tree has reached 5 green tip make one more visit to ensure the
observation was correct
Flowering
Once flowering commences initially record the number of open flowers up to
50 This will be easier than calculating small percentages
Count the number of flower clusters on one tree Similarly to the bud count
estimate the number of clusters on the remaining four trees and make
adjustments up or down for differences between the trees
To estimate flowering percentage count the number of full clusters open by
estimating across clusters For instance if two clusters have halve the flowers
open that equates to one full cluster Estimate percentage open based on total
cluster number previously recorded
For very large trees (flower clusters greater than 1000) additional estimates
may need to be made to account for the size of the tree Follow the above
27 Dormancy-breaking sprays for low winter chill in apples
protocol for three representative branches (similar cluster distribution up the
branch as the tree) on each tree rather than the whole tree If the tree is less than 50 bloom counting the number of open clusters will be
easiest If more than 50 of flowers are open counting the number yet to bloom
will be easier
As a general rule round estimates to the nearest 5
13 Recording Phenology Data
An Excel based data collection pro forma has been developed to ensure data is recorded
consistently between sites Attachment A is an example of the data recording sheet
Dormancy-breaking sprays for low winter chill in apples 2016 28
Bud damage scale
Scale
0 No damage
1 Mild burning
Mild burning of bud scales but buds normally recover
2 Moderate damage
Buds likely to develop but some flowers too burnt to open some flowers undamaged
3 Severe burning
Buds do not develop usually results in bud death
Full Terms amp Conditions of access and use can be found athttpwwwtandfonlinecomactionjournalInformationjournalCode=tnzc20
Download by [The University Of Melbourne Libraries] Date 03 February 2016 At 1845
New Zealand Journal of Crop and Horticultural Science
ISSN 0114-0671 (Print) 1175-8783 (Online) Journal homepage httpwwwtandfonlinecomloitnzc20
Sun damage risk of Royal Gala apple in fruit-growing districts in Australia
R Darbyshire L McClymont amp I Goodwin
To cite this article R Darbyshire L McClymont amp I Goodwin (2015) Sun damage risk of RoyalGala apple in fruit-growing districts in Australia New Zealand Journal of Crop and HorticulturalScience 433 222-232 DOI 1010800114067120151034731
To link to this article httpdxdoiorg1010800114067120151034731
Published online 26 May 2015
Submit your article to this journal
Article views 41
View related articles
View Crossmark data
RESEARCH ARTICLE
Sun damage risk of Royal Gala apple in fruit-growing districts in Australia
R Darbyshirea L McClymontb and I Goodwinab
aFaculty of Veterinary and Agricultural Science University of Melbourne Melbourne Australia bDepartment ofEconomic Development JobsTraining and Resources Tatura Australia
(Received 17 November 2014 accepted 18 March 2015)
This study estimated minimum air temperatures for potential sun damage for sunburn browning (non-netted and netted) and sunburn necrosis (non-netted) for Royal Gala apple in Australia The approachestimated when conditions may be conducive to the development of sun damage in some fruit Theapproach provides a measure of potential damage This allows for more flexible analyses of potentialsun damage which current models are unable to produce due to data limitations The air temperaturethresholds determined were 341 and 387 degC respectively for browning and necrosis for non-nettedfruit and 379 degC for browning under netting These air temperature thresholds were applied acrosssouthern Australia from 1911ndash2013 demonstrating different risk profiles between sites inter-annualvariability and the benefit of installing netting via a reduction in potential damage days The resultscan be further extended to estimate impacts from climate change and assess the benefit of installingnetting to adapt to increasingly extreme hot weather
Keywords browning necrosis shade net sunburn sunscald
Introduction
Sun damage in apple occurs as the result ofexposure to high radiation loads (Schrader et al2003ab) and can reduce market yield by down-grading quality and increasing cullage Regionswith summers characterised by clear skies and hightemperatures such as southern Australia havehigh sun damage risk A heat wave event inJanuary 2009 in the Goulburn Valley in southeastAustralia provides an example with large yieldlosses incurred due to sun damage approximatedat 30ndash70 (Thomson et al 2014)
Sun damage can manifest in many formsSunburn necrosis (henceforth referred to as nec-rosis) appears as a dark penetrative burn and is athermal response with a fruit surface temperature(FST) of 52 plusmn 1 degC for 10 min sufficient to inducenecrosis of several apple varieties including Gala(Schrader et al 2001) Sunburn browning (hence-forth referred to as browning) is characterised by a
yellow brown bronze or dark tan spot on the sun-exposed side of the fruit (Schrader et al 2003aRacsko amp Schrader 2012) and results from a com‐bination of high FST and light exposure Forattached Gala apples fully exposed to sunlight on aclear day Schrader et al (2001) reported a thresholdFST of 478 degC for browning damage when FSTwas maintained at constant temperature for 60 min
In the context of future climate change andassociated rising summertime temperatures in‐creased risk of sunburn damage is highly likelyPredictions regarding changes to sun damage riskand evaluation of adaptation options are thereforeimportant for future planning This is particularlypertinent for Australia Currently in many ofAustraliarsquos pome fruit-growing regions extremeheat events are common with incidences of extremeheat days increasing historically (Alexander et al2007) Further it is expected that such events willcontinue to increase in both frequency and severity
Corresponding author Email rebeccadarbyshireunimelbeduau
New Zealand Journal of Crop and Horticultural Science 2015Vol 43 No 3 222ndash232 httpdxdoiorg1010800114067120151034731
copy 2015 The Royal Society of New Zealand
Dow
nloa
ded
by [
The
Uni
vers
ity O
f M
elbo
urne
Lib
rari
es]
at 1
845
03
Febr
uary
201
6
due to anthropogenically induced climate change(Alexander amp Arblaster 2009) Given the backdropof increasingly extreme climate conditions thisresearch aimed to develop potential sun damageincidences for Royal Gala apple using air temper-ature information for netted and non-netted fruit
Few studies have scaled up analyses of sundamage beyond the experimental unit due tocomplexities in determining precise climate andgrowing conditions that lead to sunburn damage onindividual fruit Schrader et al (2003b) consideredthe influence of several factors on FST includingair temperature radiation wind speed and relativehumidity Of these air temperature was found to bemost highly correlated to FST In a predictivemodel developed later Schrader (2014) addedcultivar fruit diameter and canopy density asadditional factors that influence the FST of apple
Developing a method to use air temperature as aproxy for potential sun damage provides a flexibleplatform for broader analyses both temporally andspatially Daily maximum temperatures are com-monly recorded by meteorological organisationsand are available for long historical periods andwith large spatial coverage Other climate vari-ables such as relative humidity are much lessavailable Furthermore climate projection informa-tion for temperature is more reliable and readilyavailable than for other climate variables (CSIRO2007) Restrictions in the application of an existingFST model (Schrader 2014) due to data availabilityare already apparent (Racsko amp Schrader 2012)supporting the need for a simplified but consideredapproach
The objective of this study was to identifyair temperature thresholds that have the potentialto lead to sunburn damage To determine thesethresholds two aspects must be known First theFST threshold that induces damage for this studyRoyal Gala apple was used and threshold valuesof 52 degC for necrosis and 478 degC for browningwere utilised following previous findings (Schra-der et al 2001) Second estimates of air tempera-tures required to reach FST thresholds need to bedetermined This aspect is the focus of this study
Materials and methods
Fruit surface temperature data
Two adjacent Royal Gala apple blocks one non-netted and one netted situated at Shepparton(3642degS 14546degE) in southeast Australia (Fig 1)were used for the experiment The trees wereplanted on MM106 rootstock using a central leadertrellis system with 20 times 45 m tree spacing Theexperiment was conducted in January 2013 In thisregion Royal Gala is usually harvested late Januaryto early February The nets (Grey Quad 14 NetProStanthorpe Queensland Australia) were installedat a height of 6 m above ground with open sidesThese nets provided an 18 reduction in incidentradiation and are in common use in parts ofAustralia
Ten trees in each of the non-netted and nettedblocks were selected Of these four trees in thenon-netted block and five trees (due to somesmaller tree sizes) in the netted block were usedto measure FST Thermocouple sensors (Type Tthermocouples Tranzflo NZ Palmerston NorthNew Zealand) were placed under the skin of 60fruit in both the non-netted and netted blocks (iea total of 120 sensors) The sensors were distrib-uted across the selected trees such that 20 sensorswere located in each of the upper middle and
110 120 130 140 150 160
minus50
minus45
minus40
minus35
minus30
minus25
minus20
Longitude
Latit
ude
BatlowYoung
Lenswood
Spreyton
Yarra Valley
Donnybrook
Applethorpe
Manjimup
Huonville
Shepparton
Figure 1 Spatial area investigated and sites used for ana‐lyses marks the study site for observations (Shepparton)
Sun damage risk of Royal Gala apple in fruit-growing districts in Australia 223
Dow
nloa
ded
by [
The
Uni
vers
ity O
f M
elbo
urne
Lib
rari
es]
at 1
845
03
Febr
uary
201
6
lower parts of the canopy for both the netted andnon-netted blocks Sensors were positioned to-wards the western side of the tree to increase thelikelihood of reaching FST damage thresholdsFST was logged at 1 min intervals (CR1000Campbell Scientific Logan Utah USA) Averageair temperatures were concurrently measured(HMP155 Vaisala Vantaa Finland) and loggedat 1 min intervals (Datataker DT80M ThermoFisher Scientific Yokohama Japan) in both thenon-netted and netted blocks Air temperaturesensors were shielded and positioned 15 m abovethe ground surface Both FST and air temperaturedata were logged from 8ndash29 January 2013
Observations of sun damage were conductedfor fruit on the 10 trees in the non-netted andnetted blocks Damage was classified at harvestbetween 24 January and 4 February 2013 asbrowning or necrosis following descriptions bySchrader et al (2003a)
Air temperature threshold analysis
A conservative approach was taken to determineminimum air temperature thresholds for potentialsun damage Air temperatures at FST for browning(478 degC) and necrosis (52 degC) thresholds (Schra-der et al 2001) were initially extracted for fruit inthe non-netted and netted blocks To accommodateFST that did not fall precisely on the threshold val‐ue a buffer of +02 degC was applied Specificallyair temperatures for FST between 478ndash480 degC
and 520ndash522 degC were extracted to represent brow‐ning and necrosis respectively
The 10th percentile of the air temperatures atthese FST threshold ranges was then calculatedThis value was used to represent the minimum airtemperature threshold required for fruit to reach anFST that can cause damage ie a conservativelylow air temperature threshold that can cause sundamage It was assumed that at the 10th percent-ile other conditions that moderate damage wereacting to increase the potential of damage ratherthan dampen For instance low wind conditionsThis was performed for browning and necrosisFST thresholds and for non-netted and netted data
Spatial analysis
Analysis of the total number of days in Januarywhere daily maximum temperatures crossed theminimum air temperature threshold for potentialdamage was conducted using historical spatialgridded data (005 times 005 deg) for southern Australiafrom 1911ndash2013 sourced from the Australian Bu‐reau of Meteorology These surfaces were producedthrough a combination of empirical interpolationand function fitting applied to Australiarsquos networkof quality controlled weather stations (Jones et al2009) Within the spatial data sets 10 locationssituated in important Australian pome fruit-growingdistricts were identified for individual site analyses(Fig 1 and Table 1)
Table 1 Location information January maximum temperature data (1911ndash2013) calculated using AWAP data set
LocationLatitude(degS)
Longitude(degE)
Mean January maximumtemperature (degC)
SD January maximumtemperature (degC)
Applethorpe 2862 15195 263 34Batlow 3552 14814 261 45Donnybrook 3358 11583 302 45Huonville 4301 14706 219 44Lenswood 3494 13879 254 58Manjimup 3418 11607 274 47Spreyton 4122 14635 210 26Shepparton 3633 14540 294 50Yarra Valley 3784 14568 252 55
AWAP Australian Water Availability Project SD standard deviation
224 R Darbyshire et al
Dow
nloa
ded
by [
The
Uni
vers
ity O
f M
elbo
urne
Lib
rari
es]
at 1
845
03
Febr
uary
201
6
Across the historical data set variation in thetotal number of potential sun damage days inJanuary was assessed for southern AustraliaDifferences in the number of potential damagedays between non-netted and netted results werecompared
Results
Air temperature thresholds
Prior to analysis exploration of FST data from the120 fruit was conducted Fruit were inspectedevery 2ndash3 days to ensure that the sensors were inplace In the event that a sensor had dislodged thesensor was reinstalled and the data for that sensorwas removed back to the time of the previousinspection Results from one thermocouple in thelower canopy from the non-netted block wereexcluded due to readings consistent with regularwetting from an irrigation emitter The numbers ofdata points available for analysis were 1330588and 1587606 for non-netted and netted fruitrespectively
Using these data air temperatures as related toFST for non-netted and netted fruit were consid-ered (Fig 2) A close relationship between FSTand air temperatures can be seen for cooler air
temperatures At higher FSTs greater variation inair temperatures was observed that is a wideningof the air temperature range at a particular FST
Non-netted and netted air temperatures thatrelated to necrosis (520ndash522 degC) and browning(478ndash480 degC) FST thresholds were extracted Thedistribution of air temperatures along these FSTthresholds are shown in Fig 3 No fruit recordedan FST above 52 degC under netting (Fig 2) andhence no estimates of air temperature thresholdswere evaluated for necrosis damage under netting
The 10th percentile of the extracted air tem-peratures was calculated providing a minimum airtemperature threshold at which sun damage mayoccur For browning in the non-netted and nettedblocks these values were 341 and 379 degCrespectively For non-netted necrosis damage theair temperature threshold was 387 degC
In January 2013 at Shepparton each of the airtemperature thresholds for potential damage wassurpassed several times (Table 2) Note that thefive necrosis damage days were also incorporatedin the potential browning days as the browningthreshold must be surpassed to reach the necrosisthreshold In comparing the total potential fordamage between netted and non-netted fruit therelative risk of damage under netting was 54 ofthat for the non-netted fruit
Observations of sun damage at the study siterecorded differences between non-netted and net-ted trees (Table 3) with lower levels of damagerecorded for fruit under netting (Table 3) A 50reduction of damage was found for fruit undernetting
Historical potential damage analysis
To further investigate the number of potential sundamage days historically and to provide visualisa-tion of risk across Australiarsquos pome fruit-growingregions the air temperature thresholds (Table 2)were applied to southern Australia (Fig 4) Increas-ing risk is observed from the south of the countryto the north A lowering of risk along the easternseaboard reflects the higher elevation in that part ofAustralia Notable variation across the historicaldata set was found (panels left to right in Fig 4)
Figure 2 Fruit surface temperature (degC) recordings andrelated air temperatures (degC) Necrosis and browningFST thresholds represent 52 and 478 degC respectively
Sun damage risk of Royal Gala apple in fruit-growing districts in Australia 225
Dow
nloa
ded
by [
The
Uni
vers
ity O
f M
elbo
urne
Lib
rari
es]
at 1
845
03
Febr
uary
201
6
representing the inter-annual variability in the num‐ber of potential damage days in January
The percentile levels can be taken to representdifferent risk likelihoods assuming the climatedata are sourced from a normal distribution In thisanalysis the 10th and the 90th percentiles repres-ent the low and high ends of the distribution of thedata while the 50th percentile is the median Forexample the 10th percentile value was 2 days forbrowning in the non-netted orchard at Shepparton(Table 4) This can be interpreted as a 1 in 10 yearevent that 2 or fewer damage days will be expe‐rienced Equally this indicates there is a 9 in 10
year chance of 2 or more damage days occurringUsing the upper end of the distribution the 90thpercentile indicates that receiving 12 or moredamage days is a 1 in 10 year event
Locations in cooler regions (Huonville Sprey-ton Applethorpe Batlow) rarely crossed the airtemperature thresholds required for potential sundamage The data indicate that none of these coolersites recorded a day above the air temperaturethreshold for browning under netting or necrosisfor non-netted fruit even at the 90th percentile ofthe data Batlow did record 4 days in January thatmay lead to browning in non-netted blocks at the
Browning minus Nonminusnetted
Air Temperature
Pro
babi
lity
FST = 478minus480 degCn=374
AT threshold = 341 degC
00
02
04
06
08
10
32 34 36 38 40 32 34 36 38 40
00
02
04
06
08
10
Browning minus Netted
Air Temperature
Pro
babi
lity
FST = 478minus480 degCn=36
AT threshold = 379 degC
00
02
04
06
08
10
32 34 36 38 40
Necrosis minus Nonminusnetted
Air Temperature
Pro
babi
lity
FST = 520minus522 degCn=27
AT threshold = 387 degC
Figure 3 Air temperature (AT) for FST which relates to browning in the open and under nets and for necrosis in theopen The 10th percentile of the AT data is shown by the arrow n = sample size
226 R Darbyshire et al
Dow
nloa
ded
by [
The
Uni
vers
ity O
f M
elbo
urne
Lib
rari
es]
at 1
845
03
Febr
uary
201
6
90th percentile which can be translated as a 1 in10 year event
Conversely other pome fruit-growing regionsrecorded consistent potential for sun damage Forinstance Donnybrook Shepparton and Young allrecorded potential damage days for browning innon-netted blocks for each percentile level Thiscan be interpreted for Donnybrook as a 9 in 10chance of at least 3 days in January reachingtemperatures that could lead to browning of non-netted fruit
The wide range in potential damage days atsome sites demonstrates strong inter-annual variab‐ility in the historical data For instance at Shep-parton it can be expected that 2ndash12 days (capturing80 of the historical data) in January could lead tobrowning damage for non-netted fruit
The benefit of netting in terms of reducing thetotal number of potential damage days for brown-ing is shown in Fig 5 Note this was not con‐sidered for necrosis as an air temperature thresholdfor necrosis under netting could not be defined
Again variability is present with a minimal benefitnoted in some years (10th percentile) whereas otheryears indicated great benefit (90th percentile)
The benefit of netting is clear when individualsites within Australiarsquos fruit-growing regions wereconsidered (Table 5) For sites with few instancesof potential browning these episodes werereduced to nil with netting (Batlow Huonville)For locations with greater potential for browningdamage substantial decreases in the total numberof potential damage days recorded (Young Don-nybrook Shepparton) For these sites particularlynotable gains for the more extreme of the histor-ical data (90th percentile) were found (Table 5)
Discussion
Using previously established FST thresholds forGala apple (Schrader et al 2001) air temperaturesthat relate to potential browning and necrosisdamage for non-netted and netted fruit wererecorded at a site in southeastern Australia Awide range of air temperatures were found at thespecified FST thresholds (Figs 2ndash3) This range inair temperatures for a given FST was expected andrepresents a combination of different factors Theseinclude different microclimate conditions surround-ing the fruit such as fluxes in relative humidity andwind speed variation in radiation received due tofruit positioning and leaf shading and fruit char-acteristics such as size
Appreciating this variability in air temperaturefor a given FST this study estimated minimum airtemperature thresholds for potential damage Thiswas achieved by taking the 10th percentile of airtemperatures at two FST thresholds that representbrowning and necrosis By taking this approach itwas assumed that other climate effects and fruitcharacteristics were combining to cause damageat these lower air temperatures Therefore the airtemperature thresholds determined were conser-vatively low and are indicative of when damagemay begin to occur on some fruit primarily themore vulnerable fruit The air temperature thresh-olds calculated should not be regarded as deter-ministic or a reflection of damage for a particularfruit or for all fruit in the orchard Rather the
Table 3 Percentage of fruit affected by sun damage fornon-netted and netted fruit harvest from 10 trees each
Browning () Necrosis () Total ()
Non-netted 130 30 160Netted 81 01 81
Table 2 Summary of total number of days for whichdaily maximum temperature exceeded each air temper-ature threshold for potential damage in January 2013 atShepparton
DamageAir temperaturethreshold (degC)
Number of days inJanuary 2013
Browning(non-netted)
341 13
Browning(netted)
379 7
Necrosis(non-netted)
387 5
Sun damage risk of Royal Gala apple in fruit-growing districts in Australia 227
Dow
nloa
ded
by [
The
Uni
vers
ity O
f M
elbo
urne
Lib
rari
es]
at 1
845
03
Febr
uary
201
6
thresholds are an indication of minimum airtemperatures at which sun damage may begin todevelop
Analyses of theminimumair temperature thresh‐olds were expanded across southern Australia for
1911ndash2013 to demonstrate the flexibility of theapproach Spatial patterns in the number of daysof potential damage follow a north-south gradientand vary with topography These analyses provideinsight into relative sun damage risk in opening of
110 120 130 140 150 160
minus50
minus45
minus40
minus35
minus30
minus25
minus20
10th Percentile
Longitude
Latit
ude
Browning minus Non-netted
0 5 10 15 20 25 30
110 120 130 140 150 160minus
50minus
45minus
40minus
35minus
30minus
25minus
20
50th Percentile
110 120 130 140 150 160
minus50
minus45
minus40
minus35
minus30
minus25
minus20
90th Percentile
110 120 130 140 150 160
minus50
minus45
minus40
minus35
minus30
minus25
minus20
Longitude
Latit
ude
0 5 10 15 20 25 30
110 120 130 140 150 160
minus50
minus45
minus40
minus35
minus30
minus25
minus20
Browning minus Netted
110 120 130 140 150 160
minus50
minus45
minus40
minus35
minus30
minus25
minus20
110 120 130 140 150 160
minus50
minus45
minus40
minus35
minus30
minus25
minus20
Longitude
Latit
ude
0 5 10 15 20 25 30
110 120 130 140 150 160
minus50
minus45
minus40
minus35
minus30
minus25
minus20
Necrosis minus Non-netted
110 120 130 140 150 160
minus50
minus45
minus40
minus35
minus30
minus25
minus20
Figure 4 Number of potential sun damage days in January for browning non-netted browning netted and necrosisnon-netted air temperature thresholds The 10th 50th and 90th percentiles of the data (1911ndash2013) are displayed leftto right The colour-bar legend is measured in number of days
228 R Darbyshire et al
Dow
nloa
ded
by [
The
Uni
vers
ity O
f M
elbo
urne
Lib
rari
es]
at 1
845
03
Febr
uary
201
6
new areas for production or shifts in varietal mixesat established growing regions
For selected fruit-growing regions it was foundthat some sites are more exposed to potential sundamage risk than others This was expected withcooler regions (Spreyton Huonville Applethorpe)illustrating very little risk For warmer regions(Donnybrook Shepparton Young) greater poten-tial riskmdashthat is total number of potential damagedaysmdashwas accompanied by substantial inter-annual variability Considering potential browningfor non-netted fruit at Young there is a 1 in 10 yearchance that 16 days or more in January will be
conducive to browning (90th percentile) equallythere is a 1 in 10 year chance of 1 day or less inJanuary being conducive to browning (10th per-centile) Managing this variability in potential riskis important to maintain yield and quality
These broader analyses both historically andspatially illustrate the flexibility for investigativeanalyses of sun damage using the air temperaturethresholds determined to estimate conditions thatare conducive to damage This approach over-comes the data access limitations of more detailedmodels that require greater data inputs (Thorpe1974 Evans 2004 Schrader 2014) The methods
Table 4 Distribution of potential damage days in January for sites in Australiarsquos growing regions for 10th 50th and90th percentiles of the data
Browning non-netted Browning netted Necrosis non-netted
Site 10th 50th 90th 10th 50th 90th 10th 50th 90th
Spreyton 0 0 0 0 0 0 0 0 0Huonville 0 0 1 0 0 0 0 0 0Applethorpe 0 0 2 0 0 0 0 0 0Batlow 0 0 4 0 0 0 0 0 0Yarra Valley 0 2 5 0 0 1 0 0 1Manjimup 0 3 5 0 0 2 0 0 1Lenswood 0 3 6 0 0 2 0 0 1Young 1 7 16 0 1 5 0 05 4Shepparton 2 6 12 0 1 5 0 1 4Donnybrook 3 7 11 0 1 3 0 05 2
Figure 5 Reduction in the number of potential browning damage days for January across 1911ndash2013 due to nettingThe colour-bar legend is measured in number of days
Sun damage risk of Royal Gala apple in fruit-growing districts in Australia 229
Dow
nloa
ded
by [
The
Uni
vers
ity O
f M
elbo
urne
Lib
rari
es]
at 1
845
03
Febr
uary
201
6
used here prioritised generalisation rather thanspecificity As such only general remarks aboutchanges in potential conditions for damage can bemade To interpret damage to individual fruit useof multivariate models is still required
These thresholds could be used to consider therisk of sunburn damage under future climates asonly maximum temperatures are required to estim-ate conditions that may lead to damage Assess-ments considering netted and non-netted thresholdscould be conducted to highlight any increasingprotection offered by shade netting Note this wouldonly be possible for browning damage as this studywas unable to determine a necrosis air temperaturethreshold as fruit did not reach the required FST fordamage Finally the air temperature thresholds canbe used by growers as a guide for when to useoverhead sprinklers for evaporative cooling inefforts to minimise potential damage
These results have illustrated the benefit ofshade netting in lowering sun damage risk (Table 5and Fig 5) Previous investigations have shownthat shade nets are effective in decreasing sundamage by reducing incident solar radiation (Igle-sias amp Alegre 2006 Gindaba amp Wand 2008) Inthis study a reduction in the number of days ofpotential browning was quantified across Australia(Fig 5) Using Young as an example a decrease of1ndash11 days of potential damage (for 80 of the
historical data) was found reducing the number ofpotential damage days by 68ndash100
This benefit of netting needs to be balancedagainst other possible drawbacks For instance DoAmarante et al (2011) found a reduction in redcoloration and lower firmness values of Royal Galaunder netting Changes to management practicessuch as use of reflective mulch would assist incombating some of these implications An import-ant limitation of installing netting is the expense InAustralia the initial capital cost of erecting nettinghas been estimated at AU$40000 per hectare(Lolicato 2011) For sites with minimal reductionin sun damage with the installation of netting(Applethorpe Batlow) investing in netting maynot be practical although the other benefits thatnetting provides such as a reduction in hail and birddamage should be considered in decision-makingprocesses
Assessments of sun damage rates on the experi-mental trees (Table 3) provide support for the airtemperature thresholds Using the estimated airtemperature thresholds it was determined that forJanuary 2013 there were 13 and 7 days (Table 2)with potential for damage for non-netted and nettedfruit respectively Therefore the potential for dam-age under the nets was predicted to be 46 lowerthan for non-netted fruit This was broadly sup-ported in the damage assessments with a 50reduction found in browning of fruit under netsOther effects may have influenced the observeddamage rates including temperatures experiencedduring December which were not included in theanalysis Additionally the total predicted potentialdamage days may have identified individual days asdamage days that did not lead to any observed fruitdamage As damage assessments occurred at har-vest this cannot be determined
In interpreting these results appreciation ofthe assumptions in the methodology is neededFST thresholds used in this study were determinedin North America (Schrader et al 2003b) Higherultraviolet radiation conditions are experienced inAustralia compared with the northern hemispheredue to lower ozone protection For this reason thetransferability of FST thresholds between hemi-spheres was questioned by Racsko amp Schrader
Table 5 Difference in total number of potentialbrowning days between open and netted fruit Bracketedis the percentage reduction from open values
Site10th
percentile50th
percentile90th
percentile
Spreyton 0 (NA) 0 (NA) 0 (NA)Huonville 0 (NA) 0 (NA) 1 (100)Applethorpe 0 (NA) 0 (NA) 1 (53)Batlow 0 (NA) 0 (NA) 4 (100)Yarra Valley 0 (NA) 2 (100) 4 (80)Manjimup 0 (NA) 2 (67) 4 (80)Lenswood 0 (NA) 2 (67) 5 (83)Young 1 (100) 5 (71) 11 (68)Shepparton 2 (85) 4 (67) 7 (60)Donnybrook 2 (67) 5 (71) 9 (82)
NA indicates no browning events for fruit in the open
230 R Darbyshire et al
Dow
nloa
ded
by [
The
Uni
vers
ity O
f M
elbo
urne
Lib
rari
es]
at 1
845
03
Febr
uary
201
6
(2012) Further research following Schrader et al(2003b) is required to assess if there are differ-ences in FST thresholds between the northern andsouthern hemispheres
In order to extend the results of this study theair temperature threshold values found for Shep-parton were expanded across southern AustraliaOther sites may have weather conditions thatcombine differently than those at Shepparton todetermine FST The conservative approach takenhere should act to minimise potential underesti-mates of damage rates with field observationsneeded for verification of transferability of theseair thresholds
Conclusion
This study determined theminimum air temperaturethresholds that represent potential for sun damagefor Royal Gala apple in non-netted (browning andnecrosis) and netted (browning) blocks Resultswere constructed using a conservative approachindicating when damagemay start to occur for somefruit in the orchard Application of the approachspatially and temporally was demonstrated provid-ing historical context for sunburn damage riskand assessment of relative risk between locationsSuch an analysis has not been previously possibledue to data limitations of more detailed sundamage models The protection offered by nettingwas interpreted and the relative benefits of installa-tion demonstrated Using the methods in this studyto determine air temperature thresholds furtherresearch is possible including expansion to othervarieties assessments of climate change impactsand the use of shade netting as an adaptationstrategy
Acknowledgements
We thank Joerg Klein (Geoffrey Thompson Orchards PtyLtd) for orchard access to conduct this experiment Thisstudy was supported by funding from the VictorianDepartment of Economic Development Jobs Transportand Resources Horticulture Innovation Australia Ltdand the Australian Government Department of Agricul-ture using the apple and pear industry levy and matchedfunds from the Australian government
Disclosure statementNo potential conflict of interest was reported by theauthors
References
Alexander LV Arblaster JM 2009 Assessing trends inobserved and modelled climate extremes overAustralia in relation to future projections Interna-tional Journal of Climatology 29 417ndash435
Alexander LV Hope P Collins D Trewin B Lynch ANicholls N 2007 Trends in Australiarsquos climatemeans and extremes a global context AustralianMeteorological Magazine 56 1ndash18
CSIRO 2007 Climate change in AustraliamdashTechnicalReport 2007 Melbourne CSIRO and Bureau ofMeteorology 148 p
Do Amarante CVT Steffens CA Argenta LC 2011Yield and fruit quality of lsquoGalarsquo and lsquoFujirsquo appletrees protected by white anti-hail net ScientiaHorticulturae 129 79ndash85
Evans RG 2004 Energy balance of apples underevaporative cooling Transactions of the AmericanSociety of Agricultural Engineers 47 1029ndash1037
Gindaba J Wand SJE 2008 Comparison of climateameliorating measures to control sunburn on lsquoFujirsquoapples Acta Horticulturae 772 59ndash64
Iglesias I Alegre S 2006 The effect of anti-hail nets onfruit protection radiation temperature quality andprofitability of lsquoMondial Galarsquo apples Journal ofApplied Horticulture 8 91ndash100
Jones D Wang W Fawcett R 2009 High-qualityspatial climate data-sets for Australia AustralianMeteorological and Oceanographic Journal 58233ndash248
Lolicato S 2011 Sun protection for fruit a practical man‐ual for preventing sunburn on fruitmdash2011 VictoriaDepartment of Primary Industries 43 p
Racsko J Schrader LE 2012 Sunburn of apple fruithistorical background recent advances and futureperspectives Critical Reviews in Plant Sciences31 455ndash504
Schrader L 2014 Interactive sunburn model http horttfrecwsuedupagesSunburn (accessed 6 October2014)
Schrader L Sun J Felicetti D Seo J Jedlow L Zhang J2003a Stress-induced disorders effects on applefruit quality Proceedings of the Washington TreeFruit Postharvest Conference Wenatchee WAPp 1ndash7
Schrader L Zhang J Duplaga W 2001 Two types ofsunburn in apple caused by high fruit surface (Peel)temperature Plant Health Progress doi101094PHP-2001-1004-01-RS
Sun damage risk of Royal Gala apple in fruit-growing districts in Australia 231
Dow
nloa
ded
by [
The
Uni
vers
ity O
f M
elbo
urne
Lib
rari
es]
at 1
845
03
Febr
uary
201
6
Schrader L Zhang JG Sun JS 2003b Environmentalstresses that cause sunburn of apple Acta Horti-culturae 618 397ndash405
Thomson G McCaskill M Goodwin I Kearney GLolicato S 2014 Potential impacts of rising global
temperatures on Australiarsquos pome fruit industry andadaptation strategies New Zealand Journal of Cropand Horticultural Science 42 21ndash30
Thorpe MR 1974 Radiant heating of apples Journal ofApplied Ecology 11 755
232 R Darbyshire et al
Dow
nloa
ded
by [
The
Uni
vers
ity O
f M
elbo
urne
Lib
rari
es]
at 1
845
03
Febr
uary
201
6
Agricultural and Forest Meteorology 226ndash227 (2016) 148ndash160
Contents lists available at ScienceDirect
Agricultural and Forest Meteorology
j o ur na l ho me pag e wwwelsev ier com locate agr formet
How hail netting reduces apple fruit surface temperature Amicroclimate and modelling study
Malcolm R McCaskill alowast Lexie McClymontb Ian Goodwinb Steve GreencDebra L Partingtona
a Department of Economic Development Jobs Transport and Resources Hamilton Centre Private Bag 105 Hamilton Victoria 3300 Australiab Department of Economic Development Jobs Transport and Resources Tatura Centre Private Bag 1 Tatura Victoria 3616 Australiac Plant and Food Research Tennent Drive Palmeston North New Zealand
a r t i c l e i n f o
Article historyReceived 6 October 2015Received in revised form 6 April 2016Accepted 22 May 2016
KeywordsSun damageSunburnUV-BRoyal galaNettingFruit temperature
a b s t r a c t
High fruit temperatures compromise fruit quality and cause production losses in the apple industry Insouth-eastern Australia orchardists have begun investing in netting because of empirical evidence thatit reduces these losses but the magnitude of its effect and mechanisms responsible have not yet beenquantified Models of fruit temperature based on meteorological conditions could inform the design ofnetting structures and improve tactical management to reduce sun damage through treatments such asprotective sprays and the use of overhead irrigation to cool fruit The objectives of this study were firstlyto measure the effect of netting on fruit surface temperature and secondly to test the thermodynamicSmart-Sinclair model The study was conducted near Shepparton Victoria in an orchard where therewere adjacent netted and non-netted sections During late afternoon when sun damage normally occursnetting was able to reduce the median fruit surface temperature by 15ndash20 C but there was a greaterreduction in maximum fruit surface temperature of 40 C The model required calibration to accountfor turbulence in the transfer of heat from fruit to the surrounding air The optimised model was ableto predict fruit surface temperature with a root mean square error of 2ndash4 C The mechanism for thereduction in fruit surface temperature was by reducing the intensity of the solar beam in the late afternoonby interception and scattering which more than offset the potential fruit heating effect of netting thatoccurs through a reduction in internal orchard wind speed
Crown Copyright copy 2016 Published by Elsevier BV All rights reserved
1 Introduction
Fruit exposed to high temperatures while growing on the treesuffers reduced quality particularly in apples (Malus domestica(L)) Reports from South Africa USA Australia and New Zealandsuggest that pack-house culls of 10 could be expected in typicalseasons (Bergh et al 1980 Schrader et al 2004 Wuumlnsche et al2001) but losses can be much higher as these estimates do notinclude severely damaged fruit that is not picked In Australia applegrowers estimate typical losses to vary from 6 to 30 depend-ing on season and fruit variety (Lolicato 2011) Following someyears of high losses orchardists have begun investing in netting
lowast Corresponding authorE-mail addresses malcolmmccaskillecodevvicgovau
(MR McCaskill) lexiemcclymontecodevvicgovau (L McClymont)iangoodwinecodevvicgovau (I Goodwin) stevegreenplantandfoodconz(S Green) debrapartingtonecodevvicgovau (DL Partington)
as a risk reduction strategy because of empirical evidence that itreduces these losses but the magnitude of its effect and mecha-nisms responsible have not yet been quantified
Schrader et al (2003) identified fruit surface temperaturethresholds at which two types of damage occurs At a threshold ofbetween 46 and 49 C sunburn browning occurs which consists ofdiscolouration of the sun-exposed peel that reduces the saleabilityand storage life of the fruit The threshold is cultivar-dependentand requires a combination of both high temperatures and solarradiation Protecting fruit from exposure to ultraviolet radiationgreatly reduces the occurrence of sunburn browning (Schrader2011) At a threshold of 52 C sunburn necrosis occurs in whichepidermal and subepidermal cells die leaving a necrotic spot on thesun-exposed side of the fruit This type of damage can occur in theabsence of solar radiation if the temperature threshold is reachedFruit surface temperatures are dependent not only on the air tem-perature but also solar radiation that heats the sun-exposed fruitsurface and wind that removes heat from the surface Under condi-tions of high solar radiation and low wind speeds the sun-exposed
httpdxdoiorg101016jagrformet2016050170168-1923Crown Copyright copy 2016 Published by Elsevier BV All rights reserved
MR McCaskill et al Agricultural and Forest Meteorology 226ndash227 (2016) 148ndash160 149
surface of fruit can be up to 15 C warmer than air temperature(Schrader et al 2003)
Several thermodynamic models have been developed to cal-culate temperatures in spherical fruit such as apples Internallythese models use similar parameters and equations Thorpe (1974)described a thermodynamic model of apple surface temperaturewhich included the effects of solar radiation wind and the conduc-tion of heat to the shaded side of the fruit This model developedfurther by Smart and Sinclair (1976) who presented a series ofequations that solve for the temperature of the most sun-exposedsurface of spherical fruit known as the ldquohot-spotrdquo Since exces-sive hot-spot temperatures are sufficient to downgrade the entireapple this is the most useful parameter to model Later Evans(2004) described a model that calculated the surface temperature ofapples under evaporative cooling Sauderau et al (2007) presenteda 3-dimensional model that calculated temperatures at all parts ofellipsoid fruit Cola et al (2009) described a model of grape tem-perature which was validated at several sites in Italy while Li et al(2014) built on previous models and tested it on apples in Washing-ton State USA Apart from Cola et al (2009) and Li et al (2014) thesemodels have only had limited field validation and none have beentested under netting Potential uses of a validated model includeboth tactical and strategic management Tactically fruit surfacetemperature could be calculated from numerical weather forecastsso protective sprays can be applied prior to heat events or evapora-tive cooling used when fruit surface temperature reaches a damagethreshold Strategically the value of investment in infrastructuresuch as netting or evaporative cooling systems could be investi-gated with consideration of future climate change scenarios
The objectives of this study were firstly to measure the effectof hail netting on fruit surface temperature and orchard microcli-mate secondly to test the thermodynamic Smart-Sinclair modeland thirdly to quantify the mechanisms by which netting reducessun damage
2 Material and methods
Briefly fruit surface temperatures were measured in adjacentnetted and non-netted areas of a commercial orchard Simulatedfruit surface temperature was calculated using a modified ver-sion of the thermodynamic model developed by Smart and Sinclair(1976) using either microclimate measurements taken within theorchard or surrogates derived from standard weather data mea-sured external to the orchard Table 1 summarises parameters usedin the model and symbols used in this paper
21 Field measurements
Fruit surface temperatures of Royal Gala apples were moni-tored at two sites (ldquonettedrdquo and ldquonon-nettedrdquo) within a commercialorchard located north of Shepparton Australia The majority of theorchard was covered by permanent hail netting except for five rowsin the eastern side The netting (Grey Quad 14 NetPro Pty Ltd Stan-thorpe Qld Australia) had a 10 shade rating and was installed 6 mabove the ground with open sides We refer to the product as ldquohailnettingrdquo because its primary purpose is to protect from hail andto distinguish it from shade-cloth that has shade ratings of 16ndash80(NetPro 2010) Fruit surface temperatures were monitored from 8January 2013 until the first fruit were harvested on 24 January 2013At each site 60 fruit were selected from 4 trees 20 fruit were inthe upper canopy 20 in the middle and 20 in the lower canopyMonitored fruit were selected from fruit on the western sides oftrees that would be exposed to direct radiation in the afternoonin the expectation that maximum daily fruit surface temperaturesnormally occur in the mid-afternoon between 1430 and 1645 h
(Schrader et al 2003) Copper-constantan thermocouples (Type TTranzflo NZ Ltd Palmerston North New Zealand) were insertedunder the fruit skin on the sun-exposed face Data were logged byfour data loggers (CR1000 Campbell Scientific Logan Utah USA)at each site at 1 min intervals The target of 60 monitored fruit wassometimes not achieved because of datalogger difficulties somesensors becoming dislodged from the fruit and because two log-gers were not installed until 15 January On the 2 hottest days (forwhich detailed data are reported later in the paper) 44 fruit weremonitored under netting and 38 in the non-netted orchard on 11January while the equivalent numbers were 59 and 58 respec-tively on 17 January The diameters of the monitored fruit wererecorded on 11 16 and 23 January 2013 Fruit were harvestedcounted and weighted between 24 January and 4 February 2013from 10 trees each in the netted and non-netted sites includingthe 4 trees logged for temperature Fruit harvested from the 4 treeslogged for temperature were visually assessed for sunburn damageDamage was classified as (i) minor sunburn browning (ii) majorsunburn browning (iii) necrosis or (iv) photo-oxidative sunburn(Racsko and Schrader 2012)
The microclimate was monitored at the netted and non-nettedsites and data logged (DataTaker DT80M Thermo Fisher ScientificInc Yokohama Japan) at 1 min intervals Air temperature (Tair C)and humidity (HMP155 Vaisala Oyj Vantaa Finland) were mea-sured at 15 m height with the sensor mounted in a cylindricalwhite aluminium screen Wind speed (v ms) was measured bycup anemometers (PA2 Wittich and Visser Rijswijk Netherlands)in the lower middle and upper canopy at heights of 1 2 and3 m Diffuse and total radiation (Rdf and Rs Wm2) and ultraviolet-B (UV-B Wm2 280ndash315 nm) were monitored above the canopyat 3 m height (SPN1 Delta T Devices Cambridge UK SKU430Skye Instruments Llandrindod Wales) Adjacent to the orchard theexternal environment was logged (6004C-21 STARLOG UnidataOrsquoConnor Australia) at 10 min intervals Humidity and Tair (HMP45A-T Vaisala Oyj Vantaa Finland) were measured at 15 m heightwith the sensor mounted in a cylindrical white aluminium screenA cup anemometer (Wind sensor compact Thies Clima GottingenGermany) was used to measure v at 2 m height Data from the exter-nal weather station were only available 8ndash29 January whereas datafrom the orchard weather stations were available 1ndash31 JanuaryPotential evapotranspiration (ETo mm) was calculated on a 10 mintimestep from weather data measured in the netted and non-nettedorchards by the FAO56 equations of Allen et al (1998)
At both the netted and non-netted sites trees were irrigatedby microjet sprinklers spaced midway between trees and approxi-mately 03 m above the soil surface Trees were 15 m apart trainedon a central leader system in rows 48 m apart and rows wereoriented NNW-SSE (345) Tree age variety rootstock and man-agement did not differ between the netted and non-netted siteswith the exception of increased irrigation flow rates in the non-netted area All management activities (irrigation fertilisation andweed and pest control) were undertaken by staff of the commercialorchard
22 Fruit temperature modelling
Smart and Sinclair (1976) proposed the following algebraic solu-tion to calculate the instantaneous temperature increment aboveTair on the sun-exposed surface of the fruit (Tmax C) as
Tmax = I0 (1 minus ) (ks + 4hr)(rh + ks) 4h
(1)
where I0 is incident solar radiation received by a fruit surface per-pendicular to the solar beam (Wm2) the reflectance of the fruitsurface (albedo) ks the thermal conductivity of the fruit (W(m C))h the heat transfer coefficient from the fruit surface to the atmo-
150 MR McCaskill et al Agricultural and Forest Meteorology 226ndash227 (2016) 148ndash160
Table 1Symbols used in this paper and source of the values used
Symbol Units Explanation Valuessource
Unitless fraction Reflectance of the fruit surface 04 Merzlyak et al (2003)d Days Day number (1 Jan = 1) Calculateddr Relative units Relative inverse distance between the earth and sun
(range 0967ndash1033)Calculated according to equation 23 of Allenet al (1998)
D m Fruit diameter Measuredı m Thickness of the boundary layer of still air at the fruit
surfaceEquation 5 of this paper based on Nobel (1975)
ETo mm Potential evapotranspiration Calculated according to Equation 6 of Allenet al (1998)
f Unitless factor Calibration factor FittedGsc Wm2 Solar constant 1367 Wm2 Allen et al (1998)h W(m2 C) Heat transfer coefficient Equation 5b of Smart and Sinclair (1976)I0 Wm2 Solar radiation received on a fruit surface normal to
the solar beamEquation 2 of this paper based on Smart andSinclair (1976)
ka W(m C) Thermal conductivity of air 255 W(m C) Smart and Sinclair (1976)ks W(m C) Thermal conductivity of the fruit Equation 9 of Smart and Sinclair (1976)r m Fruit radius MeasuredRa Wm2 Extraterrestrial solar radiation on a plane horizontal to
the earthrsquos surfaceCalculated by equation 28 of Allen et al (1998)
Rs Wm2 Total solar radiation measured on a plane horizontal tothe earthrsquos surface
Measured
Rdf Wm2 Indirect solar radiation measured on a plane horizontalto the earthrsquos surface
Measured
RUVB Wm2 Solar radiation in the ultraviolet-B band 280ndash315 nm MeasuredTair
C Air temperature MeasuredTfrmx
C Temperature of the hottest face of sun-exposed fruit inthe orchard
Measured
TmaxC Difference between fruit surface temperature and air
temperatureCalculated from measurements and equation 1of Smart and Sinclair (1976)
v ms Wind speed Measuredzd degrees Zenith angle of the sun (degrees from vertical) Calculated according to Jacobson (2005)zr radians Zenith angle of the sun (radians from vertical) Calculated according to Jacobson (2005)
sphere (W(m2 C)) and r the radius of the fruit (m) In our studyI0 was calculated as
Io = GscdrRs minus Rdf
Ra+ Rdf 2 (2)
where Gsc (Wm2) is the solar constant dr the inverse relative dis-tance between the earth and the sun Rs total radiation measuredabove the canopy on a horizontal plane Ra (Wm2) extra-terrestrialradiation on a horizontal plane and Rdf diffuse radiation measuredon a horizontal plane above the canopy In Eq (2) it is assumedthat the sunlit fruit face was exposed to only half the Rdf measuredon a horizontal plane (Smart and Sinclair 1976) The terms Gsc dr
and Ra were calculated according to Allen et al (1998) Reflectance(˛) was set at 04 based on data from Merzlyak et al (2003) whoreported a range from 035 for dark red fruit to 045 for pale fruitThermal conductivity of fruit (ks) is related to apple temperatureand was calculated as
ks = 0297 + 00024Tfrmx (3)
based on Lisowa et al (2002) where Tfrmx is the temperature ofthe hottest face of sun-exposed fruit in the orchard calculated in theprevious iteration (see Eq (7) below) The heat transfer coefficienth was calculated as
h = ka
ı+ 2kaD (4)
where ka is the thermal conductivity of the air 00257 W(m2 C)ı the thickness of the boundary layer of still air at the surface ofthe hot-spot of the fruit (m) and D the fruit diameter (m) ı wasestimated from v and D by an equation based on Nobel (1975)
ı = f
(028
radicD
v+ 25
v
)(5)
where f is a calibration factor Values of v were set to a minimumvalue of 05 ms to avoid division by zero D was calculated frommeasurements of fruit diameter interpolated by a linear regressionrelationship between measurement dates
D = (5784 + 02133d)100
(6)
where d is the day number (1 January = 1) Preliminary runs ofthe model indicated that without a calibration factor ı was toohigh resulting in insufficient heat transfer from the fruit surfaceto the surrounding air and simulated fruit surface temperatureswere much higher than observed The model was calibrated usinga range of values of f from 01 to 10 in increments of 005 and cal-culating the root mean square error (RMSE) of differences betweencalculated fruit surface temperatures and the maximum fruit sur-face temperature in each 10 min period The optimum value of fwas that with the lowest RMSE A similar approach was used byCola et al (2009) in calibrating aerodynamic roughness to mea-sured fruit temperature in grapevines from wind speeds measuredat a weather station external to the vineyard Separate values of fwere sought for the netted and non-netted sites with v measuredeither at 3 m height within each orchard or at the weather stationexternal to the orchard The first half of the data set from 9 to 15January 2013 was used for model calibration and the remainingdata was used for validation Since the monitored fruit were onlyexposed to the afternoon sun only data from 1400 to 1700 h wereused for calibration and validation
The temperature of the hottest face of sun-exposed fruit in theorchard (Tfrmx C) was then calculated as
Tfrmx = Tmax + Tair (7)
where Tair (C) is the measured air temperature and Tmax thesimulated difference between air temperature and fruit surfacetemperature Calculations were performed on a 10 min timestep
MR McCaskill et al Agricultural and Forest Meteorology 226ndash227 (2016) 148ndash160 151
Table 2Harvested yield fruit weight and sunburn damage from the netted and non-nettedsites in the orchard and the statistical significance of differences
Netted Non-netted Significance
Total fruit yield (tha) 346 373 0564Fruit weight (gfruit) 153 125 lt0001Minor sunburn browning ( by weight) 77 104 0014Major sunburn browning ( by weight) 04 26 0007Necrosis ( by weight) 01 30 0003Photo-oxidative sunburn ( by weight) 02 07 0135Total damage ( by weight) 83 167 0002Yield of undamaged fruit (tha) 317 311 0282
but final output was calculated as a moving average of the previous30 min to compensate for the lack of thermal mass in the equations
23 Supplementary site
To test its structure and calibration modelled Tfrmx was com-pared with measurements taken at a supplementary site east ofShepparton Measurements were made in a commercial Royal Galaorchard without netting in which trees were planted at 25 m spac-ing in rows 50 m apart and irrigated at the tree base by microjetsprinklers This site was part of a larger study of evaporative cooling(Green et al 2011) and data reported here are for 3 apples withoutcooling on the north-west side near the top of the canopy whereprotective foliage had been removed Copper-constantan thermo-couples were inserted beneath the north-west facing surface ofsun-exposed apples on 27 January 2011 and temperatures mon-itored until harvest on 10 February Temperatures were measuredat 10-s intervals and logged (CR1000 Campbell Scientific LoganUtah USA) at a 1-min frequency Fruit diameter was measuredon 25 January and 7 February In a nearby clearing surrounded byorchards an automatic weather station recorded air temperaturesolar radiation and wind speed at a 2 m height at a 15-min fre-quency Solar radiation was measured at 2 m height using a siliconphotodiode pyranometer (SK01D Carter-Scott Design BrunswickAustralia) PAR was measured at 2 m height using a silicon photo-diode quantum sensor (PAR sensor Tranzflow Palmerston NorthNew Zealand) Air temperature and humidity were measured ata 15 m height (HMP 45A-T Vaisala Vantaa Finland) mountedin a cylindrical white aluminium screen Wind speed was mea-sured using a 3-cup anemometer at 2-m height (AN2 MonitorSensors Caboolture Australia) Measurements were taken every30 s and the average calculated and stored at 15-min intervals in adata logger (DT500 Datataker Scoresby Australia) Supplementarywind measurements were also taken from the Irrigateway network(httpawsdataitcsiroau8000idstationTATR) These measure-ments were taken at a 2 m height on an exposed site at the TaturaResearch Station operated by the Department of Economic Devel-opment Jobs Transport and Resources
24 Statistical analysis
Fruit yield and sunburn damage data from each tree were com-pared by one-way analysis of variance Residuals were checked fornormality and homogeneity of variance No transformations wererequired on any of the variables Solar radiation observations inthe netted orchard were compared with the non-netted orchard bymeans and descriptive linear regression with a focus on the after-noon (1400ndash1700 h) when the risk of sun damage is greatest Datafor Tair relative humidity and v from the netted and non-nettedorchards were compared with the weather station external to theorchard using a combined linear regression with the site (netted ornon-netted) as a factor This enabled the orchard microclimate tobe estimated from weather data external to the orchard
Since the model requires some non-standard weather dataparameters relationships were sought to predict these fromstandard parameters Prediction equations of these non-standardparameters ndash Rdf in the non-netted orchard and both Rdf andRs under netting ndash were sought by linear regression from 10 minweather data collected between 1 and 15 January 2013 using rela-tionships of the form
Rdf
Rs= a + b
Rs
Ra+ c
1AM
+ d(
Rs
Ra
) (1
AM
)
Rs
Ragt e (8)
where the coefficients a b c d and e are derived from the regres-sion and AM the air mass number to account for solar angle effectsThe RsRa component of this function was based on Spitters et al(1986) who recommended a series of split line relationships to esti-mate Rdf Rs from RsRa According to these relationships underheavy cloud (low RsRa) the proportion of total radiation that isdiffuse (Rdf Rs) is not influenced by RsRa up to a break point afterwhich there is a linear relationship with RsRa The term AM is usedin astronomy and the solar power industry to describe the pathlength of the solar beam in the atmosphere relative to a direct ver-tical path and was calculated by an empirical function of Kastenand Young (1989)
AM = 1(cos zr + 0050572(607995 + 90 minus zd)minus16364 (9)
where zr and zd are the zenith angle of the sun in radians anddegrees respectively The value of AM ranges from close to 1 whenthe sun is overhead to over 10 at dawn or dusk The inverse ofAM was used in the regression analyses because the attenuationof the solar beam through scattering and absorption would beexpected to follow an inverse relationship with path length Sim-ilar effects would be expected as the solar beam passes throughnetting To determine parameters the Genstat split line regres-sion procedure was first used to estimate e independent of AMThis set a break point for the split line relationship and belowthis threshold the break point value of Rdf Rs was used Valuesof RsRain excess of e were then selected to determine the otherparameters using generalised linear regression A similar approachwas used to estimate netted RsRa from non-netted RsRa but nobreak point was required Since the intent was to develop esti-mates at times of risk of sun damage input values were constrainedto times when Ra exceeded 380 Wm2 to avoid refractive effectsthat occur close to dawn and dusk when the sun is near the hori-zon This constraint limited data to 0640ndash1800 h in mid-JanuaryAnother required constraint was to remove 10 min periods whenRs exceeded clear-sky radiation which was assumed to be 08 RaThese periods occurred when Rs included radiation reflected fromclouds and could at times predict negative values of Rdf Statisticalanalyses were conducted using Genstat (14th Edition VSN Interna-tional Hemel Hempstead UK) Model predictions were comparedwith measurements by the root mean square error (RMSE)
25 Sensitivity analysis
Sensitivity of the model to its inputs was tested by varying indi-vidual parameters by either the range reported in the literature orfor weather parameters the range measured in our study between1400 and 1700 h The range for was from 01 (Sauderau et al2007) to 06 (Evans 2004) ks from 028 to 054 W(m C) (Smartand Sinclair 1976 Donsi et al 1996 Lisowa et al 2002) v from 01to 34 ms Rs 60ndash1040 Wm2 Rdf 50ndash580 Wm2 and Tair 15ndash42 Cwhile D was varied from 0049 to 0080 m based on measurementsof individual fruit The parameters not varied were taken from thetime of maximal Tfrmx during the study which was from the non-netted orchard from 1610 to 1620 h on 17 January 2013
152 MR McCaskill et al Agricultural and Forest Meteorology 226ndash227 (2016) 148ndash160
3 Results
31 Sunburn damage and fruit yield
Fruit in the non-netted orchard had twice the rate of sunburndamage as that in the netted orchard (17 vs 8) (Table 2) The great-est differences were in the major sunburn browning and necrosiscategories Total fruit yield in the non-netted orchard was 8 higherthan with netting but the yield of undamaged fruit was 2 lowerThese differences in fruit yield were not statistically significantbecause of a relatively high coefficient of variation between indi-vidual trees of 29 Fruit harvested from the non-netted orchardwere smaller than those with netting (125 vs 153 g)
32 Fruit surface temperatures
Measured Tfrmx were up to 144 C higher than Tair with net-ting during the afternoon and up to 167 C without netting butat night the differences were small (Fig 1) The two days with thehighest Tfrmx were the 11th of January (a clear day) and the 17thof January (a partly cloudy day) As the days with the greatest riskof sun damage these were examined in greater detail The proba-bility distribution of the maximum temperature achieved in eachmonitored fruit for these days shows that with netting the mediantemperature was 15ndash23 C cooler with netting than without butthat the maximum temperature was 40 C cooler (Fig 2) On theclear day (11 January) 45 of non-netted fruit exceeded the thresh-old of 46 C at which sunburn browning occurs (Schrader 2011)compared with only 9 under netting However on the partlycloudy day (17 January) the proportions exceeding the thresholdwere much higher at 79 without netting and 32 with nettingMeasured Tfrmx on the clear day showed a broad peak in the lateafternoon whereas on the partly cloudy day there was a seriesof sharp peaks (Fig 3) These peaks coincided with short periodsof high solar radiation between clouds The upper quartile of fruitsurface temperature peaked late in the afternoon at 1600ndash1700 h
33 Netted vs non-netted microclimates
Microclimate differences between the netted and non-nettedorchards are addressed here first for the entire month of Januarythen in greater detail for the two days when the highest fruit sur-face temperatures were recorded Averaged across all afternoons inJanuary 2013 the netted orchard had 15 less total radiation thanthe non-netted orchard 32 lower UV-B and a 13 lower potentialevapotranspiration but 20 more diffuse radiation (Table 3) Forthe whole month of January 2013 potential evapotranspiration wasalso 13 lower under netting than without (159 vs 183 mmmonth)
Descriptive linear regressions of radiation parameters duringthe afternoon between the netted and non-netted orchards showeda high level of correlation with R2 values of between 0881 and0987 (Table 3) All slopes and intercepts were statistically signif-icant (P lt 0001) indicating that there were significant differencesin radiation parameters between the environments
Fig 1 Measured (blue) and simulated (red and orange) fruit surface tempera-ture of the hottest face of sun-exposed fruit (Tfrmx) and orchard air temperature(green) at (a) netted and (b) non-netted with simulated Tfrmx calculated from windspeeds measured external to the orchard Simulated temperatures are shown in redbetween 1400 and 1700 h and orange at other times Arrows show spikes in simu-lated values at times of low wind speed and high direct radiation before 1000 andafter 1700 h (For interpretation of the references to colour in this figure legend thereader is referred to the web version of this article)
In the afternoon v at the netted site was lower (22ndash24) at a 3 mmeasurement height but there were no significant differences inTair (Tables 4 and 5) At night the netted orchard was more humidthan the non-netted orchard and had lower v
Predictive relationships for Rdf and Rs under netting based on Eq(8) showed root mean square errors of between 17 and 71 Wm2
(Table 6) In each case all the slopes and intercepts were statisticallysignificant (P lt 0001) Using these relationships for a theoreticalclear day (defined as RsRa = 075) in mid-January netting reducedRs by 10 at 1230 h but by 20 at 1620 h Equivalent reductions inIo were 22 and 26 respectively
On the clear day Rs closely followed the pattern of Ra but onthe cloudy day the pattern was spikey with short periods whenRs was up to 13 greater than at the same time on the clear day
Table 3Summary of differences in afternoon radiation and ETo (1400 and 1700 h Eastern Australian Standard Time) between netted and non-netted environments 1ndash31 January 2013compared by their arithmetic mean and linear regression as y = a + bx where y is the parameter under netting a the intercept b the slope and x the parameter withoutnetting
Parameter Means Regression
Netted Non-netted Difference () Intercept Slope R2
Global radiation (Rs Wm2) 616 726 minus15 minus677 0941 0982Diffuse radiation (Rdf Wm2) 141 117 20 631 0666 0881Ultraviolet radiation-B (UV-B Wm2) 126 184 minus32 minus00734 0723 0997Reference evapotranspiration (ETo mmhr) 047 054 minus13 minus00046 0924 0987
MR McCaskill et al Agricultural and Forest Meteorology 226ndash227 (2016) 148ndash160 153
Fig 2 Cumulative probability distribution of the maximum fruit surface temperature measured in non-netted and netted sections of the orchard on (a) a clear day (11January 2013) and (b) a partly cloudy day (17 January 2013)
Fig 3 Fruit surface temperature (Tfr ) measured in the netted and non-netted sections of the orchard showing the maximum upper quartile median and minimum and thesimulated orchard maximum modelled from weather data according to Eq (7) for a clear day (11 January) and a partly cloudy day (17 January)
Table 4Summary of air temperature humidity and wind speed during afternoons (1400ndash1700 h Eastern Australian Standard Time) and nights (2000ndash0500 h) in the netted orchardnon-netted orchard and external environment 8ndash29 January 2013
Parameter Afternoon Night
Netted Non-netted External Netted Non-netted External
Air temperature (C) 317 322 301 171 173 179Relative humidity () 293 275 263 698 660 622Wind speed (ms)3 m 122 156 055 0842 m 080 074 266 030 023 1701 m 020 035 004 006
(Fig 4) On the clear day without netting about 10 of radiationwas in the diffuse form whereas under netting it was 17 Thepercentage of Rs transmitted through the net was similar on bothdays and ranged from 89 at midday to about 60 close to dawn ordusk Estimated Io reached a broad maximum around the middle ofthe day after which it declined more rapidly under netting than in
the non-netted orchard At a height of 3 m v was about 20 lowerunder netting but there was little difference in Tair (Fig 5) At bothsites there were low wind speeds in the evening and night On 17January these nearly calm conditions had started by 1725 h Differ-ences between the netted and non-netted environments close tothe time of maximum fruit surface temperature are summarised in
154 MR McCaskill et al Agricultural and Forest Meteorology 226ndash227 (2016) 148ndash160
Table 5Microclimate in the netted and non-netted sites expressed as a linear function of readings at the weather station external to the orchard where environment (netted ornon-netted) was a factor in the analysis Significance of differences between netted and non-netted in intercept or slope are shown as for P lt 0001 for P lt 001 forP lt 005 minus for P lt 01 ns for not significant
Afternoon (1400ndash1700 h) Night (2000ndash0500 h) All hours
Intercept Slope R2 Intercept Slope R2 Intercept Slope R2
Air temperature (C)Netted 109 0967 0987 minus024 0938 0962 minus133 1024 0978Non-netted 158 0968 minus124 1009 minus139 1047Difference 049 0001 minus101 0070 minus006 0022Significance of difference ndash ns ns
Relative humidity ()Netted 685 0953 0987 1050 0956 086 783 0983 0951Non-netted 482 0959 minus014 1075 344 1003Difference minus203 0005 minus1064 0119 minus439 0020Significance of difference ns
Wind speed (ms)Netted 3 m minus012 0477 0912 minus018 0468 0918 minus018 0476 0917Non-netted 3 m minus018 0627 minus016 0642 minus016 0633Difference minus005 0150 002 0174 002 0157Significance of difference ns ns ndash Netted 2 m minus024 0370 0824 minus018 0307 0832 minus021 0337 0800Non-netted 2 m minus002 0254 minus012 0220 minus012 0267Difference 023 minus0116 007 minus0088 009 minus0069Significance of difference Netted 1 m minus002 0072 0476 minus004 0049 0622 minus005 0069 0486Non-netted 1 m 008 0083 minus005 0069 minus005 0105Difference 011 0011 minus001 0019 000 0036Significance of difference ns ns
Table 6Predictive relationships calculated from the calibration period (1ndash15 January) based on Eq (8) to estimate global radiation under netting as a proportion of extraterrestrial(RsRa) diffuse radiation as a proportion of global (Rdf Rs) in netted and non-netted environments and the root mean square error (RMSE) and predictive error of therelationships in estimating Rs and Rdf between 0700 and 1800 h for the validation period (16ndash31 January 2013)
Parameter orcoefficient in Eq (7)
Global radiation as a proportion of extraterrestrial(RsRa)
Diffuse radiation as a proportion of global radiation(Rdf Rs)
Netted Netted Non-netted
Split line regressione 0396 0391Rdf Rs at breakpoint 0830 0855No of observations 1017 1017R2 0918 0932
Generalised linear modela 0049 0715 0506b 0546 minus0507 minus0391c minus0079 1088 1515d 0400 minus1684 minus217No of observations 1016 896 896R2 0982 0761 0754
Overall relationship (validation period)RMSE (Wm2) 171 506 712Predictive error (Wm2) 131 241 351
Table 7 On both days between 1610 and 1620 h netting reduced Ioby 26
34 Calibration of the model
Without calibration the model consistently over-predictedTfsmx by an average of 66 C but the calculated values were highlycorrelated with measurements (R2 = 087 data not shown) To cor-rect this over-prediction a calibration factor (f) was applied to v(wind speed) because the relationship between wind speed andheat transfer to the atmosphere was the least well-defined com-ponent of the model The model was first fitted to v measured at3 m height at each site within the orchard This achieved minimumRMSErsquos of 21 and 26 C (Fig 6a) for netted and non-netted orchardsrespectively Secondly the model was fitted to measurements of vmeasured at a height of 2 m external to the orchard which achievedslightly lower RMSErsquos (20 and 23 C respectively) and optimised
at the same calibration factor for both the netted and non-nettedorchards (Fig 6b) Since the second option fitted the data moreclosely and could be calculated from wind speeds from externalto the orchard which are more commonly measured than internalorchard wind speeds this option was used for most simulationsreported in this paper
Measured and simulated Tfrmx showed close agreement on mostdays during the afternoon between 1400 and 1700 h but before andafter these times there were short term spikes in simulated Tfrmx
that were not observed in the measured data (Fig 1) These spikesoccurred before 1000 h and after 1700 h during periods of low windspeed high direct solar radiation and a high angle of incidence ofthe sunrsquos rays (zd gt 36 from zenith before 1000 h and zd gt 76 after1700 h)
Simulated and measured Tfrmx were closely matched between1400 h and 1700 h when fruit were exposed to direct sunlight(Fig 3) However simulated temperatures exceeded measurements
MR McCaskill et al Agricultural and Forest Meteorology 226ndash227 (2016) 148ndash160 155
Fig 4 Solar radiation on a clear day (11 January 2013) and a cloudy day (17 January 2013) showing calculated extraterrestrial radiation (Ra) global radiation measured abovethe plant canopies of netted (Rsnet ) at netted and non-netted sites (Rsnnet ) and diffuse radiation (Rdfnet and Rdfnnet) (a b) Also shown is the percentage of global radiationrecorded above the plant canopy of the non-netted and netted orchards that was in the diffuse form (Rdf Rs) the percentage of global radiation that was transmitted throughthe net (RsnetRsnnet) (c d) and the estimated intensity of the solar energy received on a fruit surface perpendicular to the solar beam (I0) (e f)
in the morning and early evening when the measured fruit wereshaded
35 Model validation from standard weather data
Since in-orchard weather data are rarely available for long-termmodelling studies Tfrmx was also calculated for validation purposesfrom standard weather data using the coefficients in Tables 5 and 6to estimate Tair Rdf and Rs in the netted orchard The externalweather station was used for Tair and v but it was assumed thatglobal radiation measured above the canopy at the non-netted sitewas equivalent to that measured outside the orchard Using thesesurrogates there was only a small increase (02ndash06 C) in RMSE rel-ative to in-orchard weather data (Table 8) This applied to both thecalibration and validation periods
36 Supplementary site
The model was run using weather data from the supplemen-tary site and compared Tfrmx measured at this site between 1400and 1700 h (Fig 7a) (f = 045 optimised for the main site) Themodel tended to over-predict early in the data set followed by
under-prediction later and achieved an overall RMSE of 63 COver-prediction occurred on afternoons with low wind speed andunder-prediction on afternoons of high wind speed a relationshipthat accounted for 67 of variation (data not shown) Optimisingf to this data set reduced the RMSE to 57 C (f = 033) but therewas still a strong relationship between over-prediction or under-prediction and wind speed The closest fit between predicted andmeasured was achieved using wind speed data from Tatura whichachieved an RMSE of 38 C (f = 092) (Fig 7b)
37 Sensitivity analysis
The sensitivity analysis showed that among plant parametersTfrmx was most strongly affected by followed by much smallereffects of D and ks (Table 9) Among weather parameters Tfrmx wasmost affected by Tair followed by Rs v and Rdf The sensitivity analy-sis was also used to test the impact of the reduction in v associatedwith netting and potential offsets A 25 decrease in v increasedfruit surface temperatures by 22 C but this increase could be off-set by either a 16 reduction in total radiation or a 58 increasein the proportion of total radiation in the diffuse form (data notshown)
156 MR McCaskill et al Agricultural and Forest Meteorology 226ndash227 (2016) 148ndash160
Fig 5 Air temperature (a b) and wind speeds (c d) at the netted and non-netted sites and at a weather station external to the orchard on 11 and 17 January 2013
Table 7Summary of differences between the non-netted and netted environments and external to the orchard close to the time of maximum fruit surface temperature between1610 and 1620 on 11 and 17 January 2013 Values are the mean of 1 min readings
11 Jan (clear day) 17 Jan (cloudy day)
External Non-netted orchard Netted orchard Difference () External Non-netted orchard Netted orchard Difference ()
Extraterrestrial radiation Ra
(Wm2)883 883 883 861 861 861
Total measured solar radiationRs (Wm2)
679 572 minus16 769 652 minus15
Diffuse radiation Rdf (Wm2) 87 114 31 175 187 7Direct radiation (Wm2) 572 425 minus26 592 441 minus25Radiation perpendicular to the
sunlit face of fruit Io (Wm2)967 749 minus26 971 761 minus26
Diffuse radiation relative toglobal ()
13 20 56 23 29 26
Ultraviolet B radiation UV-B(Wm2)
146 100 minus31 158 104 minus34
Relative humidity () 10 13 15 10 14 14Wind speed at 3 m (ms) 16 11 minus28 12 13 13Wind speed at 2 m (ms) 238 09 07 minus17 291 07 09 37Wind speed at 1 m (ms) 06 03 minus56 04 02 minus39Fruit surface temperature (C) (C) (C)Simulated 496 472 minus24 516 488 minus28Measured maximum 520 467 minus53 531 479 minus52Measured upper quartile 463 447 minus17 485 460 minus26Measured median 450 437 minus13 465 444 minus22Measured lower quartile 425 418 minus07 450 427 minus23Measured minimum 399 393 minus06 415 401 minus14Air temperature (C) 387 387 384 minus03 40 407 400 minus07
4 Discussion
41 Fruit damage and yield
A higher fruit yield in the non-netted orchard was offset by amuch higher percentage of sunburn damage than in the netted
orchard (17 vs 8) leading to a 2 reduction in the yield of undam-aged fruit This difference in yield was not statistically significantand would require confirmation through studies with a larger sam-ple size The 2-fold difference in the percentage of fruit affected bysunburn was consistent with the difference in the percentage ofmonitored fruit that exceeded the sunburn browning threshold of
MR McCaskill et al Agricultural and Forest Meteorology 226ndash227 (2016) 148ndash160 157
Table 8Root mean square error (C) for fruit surface temperature calculated using the optimum value of the calibration factor (f ) for each data set for 3 combinations of weatherdata with and without netting for the calibration period (9ndash15 January) and validation period (16ndash29 January)
Source of weather data Data period
Total radiation Diffuse radiation Air temperature Wind speed f Calibration Validation
RMSE (C)Netted orchardin-orchard weather station Netted Netted Netted Netted 02 210 355in-orchard and external weather station Netted Netted Netted External 045 201 310standard weather data Externala External External External 045 224 343difference between in-orchard and standard weather data 023 033Non-netted orchardin-orchard weather station Non-netted Non-netted Non-netted Non-netted 025 260 367in-orchard and external weather station Non-netted Non-netted Non-netted External 045 227 309standard weather data Externala External External External 045 288 353difference between in-orchard and standard weather data 061 044
a The source data for total radiation (Rs) were made above the canopy in the non-netted orchard and assumed to be equivalent to that measured externally
Table 9Sensitivity analysis of predicted fruit surface temperature calculated from in-orchard weather readings based on standard weather data values between 1610 and 1620 hon 17th of January 2013
Values Change in Tfrmx (C)
Low Standard High Low High
Apple reflectance () 01 04 06 623 minus419
Apple thermal conductivity (ks) (Wm2) 028 042 054 083 minus057
Fruit diameter (D) (m) 0049 0060 0080 minus080 096
Wind speed (v) (ms) 01 12 34 952 minus692
Total radiation (Rs) (Wm2) 60 768 1040 minus1461 523
Diffuse radiation (Rdf ) (Wm2) (Rs held constant) 50 175 580 168 minus548
Air temperature (Tair ) (C) 150 407 420 minus2539 126
46 C on the hottest day of the study 17 January 2013 (79 vs 32)Monitored fruit were only on the west-facing side of the rows thatwould be exposed to the afternoon sun and were representativeof the half of the apple crop at risk of sun damage An unexpecteddifference was that fruit from the non-netted orchard were smaller(125 vs 153 g) most likely due to differences in crop load (fruit num-ber per tree) The Gala variety used in this study is intermediatein its susceptibility to sunburn relative to other cultivars (Schraderet al 2001 Schrader et al 2008) A more comprehensive samplingregime during harvest would be required to quantify the effects ofnetting on yield and sunburn damage for each cultivar
42 Model performance
The model fitted measured Tfrmx at both the netted and non-netted sites with an RMSE of sim2 C in the calibration period andsim3 C in the validation period which is similar to previouslyreported models in orchards or vineyards without netting (Evans2004 Cola et al 2009 Li et al 2014) While a physically-basedmodel would ideally require no calibration and be based on quan-tities that are directly measureable this was not the case here Themost imprecisely defined process is the transfer of heat from thefruit surface to the air through a boundary layer of still air adjacentto the fruit surface The thickness of this boundary layer (ı) hasnever been directly measured but has either been back-calculatedfrom heat transfer characteristics or estimated from measure-ments of v by semi-empirical relationships (eg Cola et al 2009 Liet al 2014) The equations used by Smart and Sinclair (1976) werebased on an experiment of Nobel (1975) in which fruit were heatedby artificial radiation under laminar air flow and ı inferred fromheat transfer characteristics at various wind speeds Under fieldconditions turbulent air flow alters these relationships and Nobel(1975) recommended empirical modifications suited to vineyardsHowever trellised apple orchards have taller rows of trees andwould be expected to have greater turbulence relative to horizon-
tal wind flow than vineyards Although wind flow in the horizontalplane was measured by anemometers within the orchard thesedata produced a poorer fit to observed fruit surface temperaturethan those measured at an exposed site adjacent to the orchardFurther resolution of the physics of heat transfer from the fruit sur-face to the air would require sensors such as sonic anemometerswhich measure air flow in 3 dimensions However for use in a semi-empirical model it appears Tfrmx was more strongly related to windmeasurements taken at the more exposed measurement site exter-nal to the orchard than those taken with cup anemometers close tothe monitored fruit Likewise at the second site a closer fit to fruittemperature measurements was achieved using wind data from anexposed site 18 km away at Tatura than a relatively sheltered siteclose to the orchard A similar calibration approach was undertakenby Cola et al (2009) in a study of vineyard temperatures in Italy Itis therefore simpler to calibrate directly between fruit temperatureand v measured by a cup anemometer at a standardised weatherstation location
The model produced short-term ldquospikesrdquo of high fruit surfacetemperature in the morning before 1000 and in the late afternoonafter 1700 h This occurred during short periods of nearly calm con-ditions when the model calculated a low value of h in Eq (2) Thesespikes occurred outside the times when sun damage would nor-mally be expected (1430ndash1645 h Schrader et al 2003) and couldcause spurious results should the model be run on long-term orautomated weather data To avoid such problems we suggest theuse of a time-based filter that only utilises Tfrmx between 1000 and1700 h for the following reasons Firstly the sun angle after 1700 h(gt60 from zenith) means most fruit are becoming fully or partiallyshaded by leaves while those fully exposed to the sunrsquos rays areunlikely to receive the direct beam of the sun long enough to causedamage According to Schrader et al (2001) sunburn browningrequires exposure to temperatures exceeding the varietal thresh-old for 30ndash60 min for its full development Secondly spikes after1700 h were over-predicted relative to measurements (eg Fig 4)
158 MR McCaskill et al Agricultural and Forest Meteorology 226ndash227 (2016) 148ndash160
Fig 6 Root mean square error of fruit surface temperature (C) during afternoons(1400ndash1700 h) between 9 and 15 January 2013 in response to the calibration factor(f) calculated from wind speed measured (a) within the orchard at a height of 3 mand (b) adjacent to the orchard at a height of 2 m Arrows show optimum values
This could be because the thermocouples were not installed on theface perpendicular to the sun at this time of day or because Eq (2)overestimates the strength of the solar beam at high solar zenithangles Thirdly UV-B levels are low and likely to cause much lessdamage at the same fruit temperature than earlier in the afternoonbecause after 1700 h UV-B levels declined to less than 25 of that atmidday Morning spikes in simulated Tfrmx were noted until 1000 hafter which wind speeds tended to increase and spikes no longeroccurred Sun damaged apples were observed on the eastern sideof the row but we were unable to determine the time this damageoccurred because our equipment was installed on the western sideof the row It is unlikely temperatures above the damage thresholdswould occur prior to 1000 h or after 1700 h without also occurringbetween these times Since predicted Tfrmx in the early morning orlate afternoon and evening is poorly validated and less likely to bedamaging we suggest that only values between 1000 and 1700 hshould be used in long term modelling
It should be noted that these times are in Eastern AustralianStandard Time and that solar noon at this site occurred at 1230 hbecause it is 474 west of the centre of the time zone Appropriateadjustments would need to be made for other sites such as outlinedby Allen et al (1998)
The sensitivity analysis showed that among plant parameters had the largest effect on Tfrmx Most previous studies that reported did not indicate how the value was measured The only sourcethat reported methods was Merzlyak et al (2003) who undertookmeasurements post-harvest Across the visible range averaged035 for dark coloured apples to 045 for pale apples Commercially-available clay sprays reduce Tfrmx by increasing particularly at
Fig 7 Supplementary site measured (blue) and simulated (red and orange) fruitsurface temperature of the hottest face of sun-exposed fruit (Tfrmx) and orchard airtemperature (green) Simulated Tfrmx calculated from wind speeds (a) in a clear-ing surrounded by orchards and f = 045 (optimised to the main site) and (b) at anexposed site at Tatura and f = 092 (optimised to this data set) Simulated temper-atures are shown in red between 1400 and 1700 h and orange at other times (Forinterpretation of the references to colour in this figure legend the reader is referredto the web version of this article)
shorter wavelengths that are more damaging to the skin (Gindabaand Wand 2005) In our study we initially used an value of 055which resulted in an optimum f value of 07 whereas using a moredefensible value of 04 resulted in an optimum f value of 045 Whilein a semi-empirical model an inappropriate value of one parameteris resolved by a compensating calibration factor there are risks thatthe model performs poorly under conditions that differ from its cal-ibration because the physical processes are not simulated correctlyTo resolve this area of uncertainty there is need to undertake morecomprehensive measurements of during fruit development andover a wider range of wavelengths
43 Effects of hail netting
Hail netting reduced the fruit temperature by 15ndash30 C acrossmost of the probability distribution but for the hottest fruit ateach site within the orchard the difference was 40 C The mech-anism for this effect of netting was by reducing the intensity ofthe solar beam by interception and scattering while allowing goodair flow to enable transfer of heat from the fruit surface to theair The netting structure at the study site represented an idealdesign for minimising sun damage because it was installed highabove the tree canopy and had open sides minimising interfer-ence to air circulation within the orchard and air exchange withthe outside Despite this design the netted orchard had internalwind speeds that averaged 22ndash24 lower than the non-netted siteaveraged across all afternoons in January 2013 (Tables 4 and 5) A
MR McCaskill et al Agricultural and Forest Meteorology 226ndash227 (2016) 148ndash160 159
wide range of designs are used commercially including temporarynets placed over the trees retractable netting installed on struc-tures above the tree canopy and fixed netting with closed or opensides (Lolicato 2011) Some designs could potentially exacerbaterather than reduce sun damage if wind is substantially reduced Thesensitivity analysis showed that if netting caused a 25 reductionin wind speeds this could without other changes to the heat bal-ance increase fruit temperatures by 22 C To maintain fruit surfacetemperatures equivalent to the non-netted orchard would requireeither a decrease in total radiation of 16 or if total radiation isunchanged the proportion in the diffuse form needs to increase by58 Until recently hail protection has been the primary rationalefor investment in netting followed by protection from fruit batsand birds Where the latter is required the sides would need to beclosed but this could reduce internal v leading to increased fruittemperatures From principles developed in this study a designthat uses a more open netting on the sides would minimise theseproblems
While the netting intercepted only 10ndash11 of Rs at solar noonthis is not the time maximum protection is required for two rea-sons Firstly the NNW-SSE row orientation and training structuremeant that a high proportion of fruit were shaded by leaves at thistime of the day Secondly air and fruit temperatures on hot daystend to peak in the late afternoon Our study showed that peakfruit surface temperatures occurred between 1600 and 1700 h atwhich time netting intercepted and scattered a greater proportionof Rs than at midday Protection from radiation at solar noon wasconsistent with its 10 shade rating but at 1620 h when the solarangle was 52 its shading effect was greater (15ndash20) and therewas an even greater reduction in radiation perpendicular to thefruit surface at the hot spot (26) Excessive shading needs to beavoided because it reduces the development of red colour in thefruit (Gindaba and Wand 2005) The main protection from sundamage is therefore required between approximately 1600 and1700 h when netting is over twice as effective in controlling thesurface heating effect of the sun than would be expected from itsshade specifications For this reason hail netting with a 10 shaderating represents a good compromise between protection from hailand sun damage while minimising its effects on fruit colour devel-opment
Our data are a comprehensive comparison of microclimate withand without netting From it we were able to develop equations topredict the netted microclimate from external measurements butthese are only directly applicable to the particular design colourand weave type at the study site Predictive equations could beobtained over a relatively short period (two weeks) through theuse of 10 min data which for radiation were based on measuredRs relative to Ra (as recommended by Spitters et al (1986)) andthe air mass number as a representation of the sun angle Thesound physical basis of these equations means the approach shouldbe applicable to developing relationships for other structures andweave types from relatively short periods of data However thephysical nature of this modelling approach is also a weaknessbecause a large amount of weather data must be assembled attime scales of at least hourly in addition to site-specific rela-tionships between wind measurement locations and fruit surfacetemperature The role of this level of modelling is in understandingprocesses and quantifying the effects of various netting structureswhich can differ in weave type colour height and the presence orabsence of side netting For many applications a simpler approachwould be more suitable For example Darbyshire et al (2015) useddata from our study to identify the external air temperature atwhich fruit surface temperature exceeded a sunburn browningthreshold in 10 of monitored fruit This was determined as 379 Cwith netting and 341 C without netting These thresholds werethen used to assess the benefits of netting in Australiarsquos apple grow-
ing regions for a range of climate change scenarios (Darbyshireet al 2015 Webb et al 2016) Their findings are however spe-cific to the netting design used in our study and the approach islimited in investigating the effects of other management optionssuch as canopy architecture row orientation leaf density and theirinteraction with netting design
Netting was associated with other changes to the agro-ecological environment including reduced ETo higher humidityand lower wind speeds Under netting ETo was 13 lower thanat the non-netted site which would lead to a reduced irrigationrequirement The combination of higher humidity and lower v isa potential disbenefit because it is associated with a longer dura-tion of leaf wetness (Kim et al 2002) which in turn leads to ahigher disease risk The most economically significant disease ofapples is apple scab (Venturia inaequalis) which is a fungus that forlight infection requires at least 12 h of continuous leaf wetness at13 C and longer periods at lower temperatures (Vaillancourt andHartman 2000) The netted environment therefore had a benefitthrough a lower irrigation requirement but there was also a dis-benefit through a greater risk of fungal diseases that may requiremore frequent control measures
5 Conclusions
This study found that netting was able to reduce the median fruitsurface temperatures by 15ndash20 C The mechanism for this effectof netting was by reducing the intensity of the solar beam by inter-ception and scattering while allowing sufficient air flow to enabletransfer of heat from the fruit surface to the air An adaptation ofa previously published thermodynamic model was able to accountfor these differences with an RMSE of 2ndash3 C in the afternoon whensun damage most commonly occurs but in the morning or earlyevening it appeared to over predict fruit temperatures during timesof low wind speed
Acknowledgements
This project was funded by the Department of Economic Devel-opment Jobs Transport and Resources (DEDJTR) the AustralianGovernment Department of Agriculture and Horticulture Innova-tion Australia Limited using the apple and pear industry levy andmatched funds from the Australian Government We thank JoergKlein (Geoffery Thompson Orchards Pty Ltd) for permitting us touse their orchard We also thank Eileen Perry and Des Whitfield(DEDJTR) for valuable discussions during the development of thispaper
References
Allen RG Pereira LS Raes D Smith M 1998 CropEvapotranspirationmdashGuidelines for Computing Crop WaterRequirementsmdashFAO Irrigation and Drainage Paper 56 Food and AgriculturalOrganisation of the United Nations Rome
Bergh O Franken J Van Zyl EJ Kloppers F Dempers A 1980 Sunburn onapples preliminary results of an investigation conducted during the 1978ndash79season Deciduous Fruit Grower 30 8ndash22
Cola G Failla OK Mariani L 2009 BerryTonemdasha simulation model for the dailycourse of grape berry temperature Agric For Meteorol 149 1215ndash1228
Darbyshire R McClymont L Goodwin I 2015 Sun damage risk of Royal Galaapple in fruit-growing districts in Australia New Zeal J Crop Hortic Sci 43 (3)222ndash232
Donsi G Ferrari G Nigro R 1996 Experimental determination of thermalconductivity of apple and potato at different moisture contents J Food Eng 30263ndash268
Evans RG 2004 Energy balance of apples under evaporative cooling Trans ASAE47 1029ndash1037
Gindaba J Wand JE 2005 Comparative effects of evaporative cooling kaolinparticle film and shade net on sunburn and fruit quality in apples HortScience40 592ndash596
Green S Goodwin I Cornwall D 2011 Over-tree sprinkler cooling to reducesunburn on fruit Aust Fruitgrow 5 (10) 12ndash14
160 MR McCaskill et al Agricultural and Forest Meteorology 226ndash227 (2016) 148ndash160
Jacobson MZ 2005 Fundamentals of Atmospheric Modeling 2nd ed CambridgeUniversity Press p 317
Kasten F Young AT 1989 Revised optical air mass tables and approximationformula Appl Opt 28 4735ndash4738
Kim KS Taylor SE Gleason ML Koehler KJ 2002 Model to enhancesite-specific estimation of leaf wetness duration Plant Dis 86 179ndash185
Li L Peters T Zhang Q Zhang J Huang D 2014 Modeling apple surfacetemperature dynamics based on weather data Sensors 14 20217ndash20234
Lisowa H Wujec M Lis T 2002 Influence of temperature and variety on thethermal properties of apples Int Agrophys 16 43ndash52
Lolicato S 2011 Sun Protection for Fruit a Practical Manual for PreventingSunburn on Fruitmdash2011 Department of Primary Industries Farm ServicesVictoria Division Melbourne Australia
Merzlyak MN Solovchenko AE Gitelson AA 2003 Reflectance spectralfeatures and non-destructive estimation of chorophyll carotenoid andanthocyanin content in apple fruit Postharvest Biol Technol 27 197ndash211
NetPro 2010 Product Data Sheet Commercial Horticultural Shade Cloth (accessed220615) httpwwwnetprocanopiescomdocuments-pdfproductsheetsDataSheets OzSmartShade CommHortRangepdf
Nobel PS 1975 Effective thickness and resistance of the air boundary layeradjacent to spherical plant parts J Exp Bot 26 120ndash130
Racsko J Schrader L 2012 Sunburn of apple fruit historical background recentadvances and future perspectives Crit Rev Plant Sci 31 455ndash504
Sauderau M Sinoquet H Santin O Marquier A Adam B Longuenesse JJGuilioni L Chelle M 2007 A 3-d model for simulating the spatial andtemporal distribution of temperature within ellipsoid fruit Agric ForMeteorol 147 1ndash15
Schrader LE 2011 Scientific basis of a unique formulation for reducing sunburnof fruits HortScience 46 6ndash11
Schrader LE Zhang J Duplaga WK 2001 Two Types of Sunburn in AppleCaused by High Fruit Surface (peel) Temperature Plant Health Progress(accessed 020616) httpswwwplantmanagementnetworkorgpubphpresearchsunburn
Schrader L Zhang J Sun J 2003 Environmental stresses that cause sunburn ofapple Acta Hortic 618 397ndash405
Schrader L Sun J Zhang J Seo J Jedlow L Felicetti D 2004 Fruit SkinDisorders Proc 100th Annu Meeting Washington State Hort Association p 4(last accessed 160212) httppostharvesttfrecwsueduPC2004Epdf
Schrader LE Sun J Zhang J Felicetti D Tian J 2008 Heat and light-inducedapple skin disorders causes and prevention Acta Hortic 772 51ndash58
Smart RE Sinclair TR 1976 Solar heating of grape berries and other sphericalfruits Agric Meteorol 17 241ndash259
Spitters CJT Toussaint HAJM Goudriaan J 1986 Separating the diffuse anddirect component of global radiation and its implications for modelling canopyphotosynthesis Part 1 Components of incoming radiation Agric ForMeteorol 38 217ndash229
Thorpe MR 1974 Radiant heating of apples J Appl Ecol 11 755ndash760Vaillancourt LJ Hartman JR 2000 Apple Scab The Plant Health Instructor The
American Phytopathological Society httpdxdoiorg101094PHI-I-2000-1005-01 (accessed 120315) httpwwwapsnetorgedcenterintropplessonsfungiascomycetesPagesAppleScabaspx
Webb L Darbyshire R Erwin T Goodwin I 2016 A robust impact assessmentthat informs actionable climate change adaptation future browning-risk inapple crops Int J Biometeorol (accepted)
Wuumlnsche JN Greer DH Palmer JW Lang A McGhie T 2001 Sunburnmdashthecost of a high light environment Acta Hortic 557 349ndash356
ORIGINAL PAPER
A robust impact assessment that informs actionable climatechange adaptation future sunburn browning risk in apple
Leanne Webb1amp Rebecca Darbyshire1 amp Tim Erwin2
amp Ian Goodwin3
Received 18 October 2015 Revised 21 October 2016 Accepted 22 October 2016 ISB 2016
Abstract Climate change impact assessments are predomi-nantly undertaken for the purpose of informing future adapta-tion decisions Often the complexity of the methodology hin-ders the actionable outcomes The approach used here illus-trates the importance of considering uncertainty in future cli-mate projections at the same time providing robust and sim-ple to interpret information for decision-makers By quantify-ing current and future exposure of Royal Gala apple to dam-aging temperature extremes across ten important pome fruit-growing locations in Australia differences in impact to ripen-ing fruit are highlighted with by the end of the twenty-firstcentury some locations maintaining no sunburn browningrisk while others potentially experiencing the risk for the ma-jority of the January ripening period Installation of over-treenetting can reduce the impact of sunburn browning The ben-efits from employing this management option varied acrossthe ten study locations The two approaches explored to assistdecision-makers assess this information (a) using sunburnbrowning risk analogues and (b) through identifying hypo-thetical sunburn browning risk thresholds resulted in varyingrecommendations for introducing over-tree netting These rec-ommendations were location and future time period depen-dent with some sites showing no benefit for sunburn protec-tion from nets even by the end of the twenty-first century andothers already deriving benefits from employing this
adaptation option Potential best and worst cases of sunburnbrowning risk and its potential reduction through introductionof over-tree nets were explored The range of results presentedhighlights the importance of addressing uncertainty in climateprojections that result from different global climate modelsand possible future emission pathways
Keywords Extreme temperature Sunburn browning
Netting Horticulture Pome fruit Climate projections
Introduction
The purpose for undertaking most climate change impactassessments should be to inform adaptation decisions orprompt action for greenhouse gas mitigation Many impactassessments however are not solution-focused nor do theyrespond to end-user perspectives (Kiem and Austin 2013) Inpresenting their results to end-users and decision-makers thescience community often focuses on exploring and explainingsubjects such as uncertainties in climate projections whichcan over-complicate the advice Here an approach is outlinedthat aimed to provide robust yet simple results to enable ac-tionable decisions while also including the uncertainty in fu-ture climate projections
An increase in the occurrence of extreme heat events hasbeen observed historically in Australia (Alexander et al 2007Trewin and Smalley 2013) The apple industry which had a2014ndash2015 gross value of $AU550 million (ABS 2016) isparticularly vulnerable to these extreme heat events as high airtemperatures and solar radiation exposure cause lsquosunburnbrowningrsquo a brown spot on the sun-exposed side of the fruitwith affected fruit unmarketable (Schrader et al 2003a bThomson et al 2014 Racsko and Schrader 2012) For examplea heat wave event in January 2009 in south-east Australia
Rebecca Darbyshirerebeccadarbyshiredpinswgovau
1 Faculty of Veterinary and Agricultural Science University ofMelbourne Parkville VIC Australia
2 CSIRO Oceans and Atmosphere PMB 1 Aspendale VIC Australia3 Department of Economic Development Jobs Transport and
Resources Tatura Australia
Int J BiometeorolDOI 101007s00484-016-1268-y
resulted in large yield losses due to sun damage approximatedat between 30 and 70 of the crop (Thomson et al 2014)Under anthropogenic climate change increases in the intensityfrequency duration and spatial extent of extreme temperaturesin Australia are expected (Alexander and Arblaster 2009CSIRO and BoM 2015 IPCC 2012) potentially increasingthe risk of sunburn damage
Given this potential risk many fruit-growing districts inAustralia will likely need to implement adaptation strategiesto minimise potential sun damage (Thomson et al 2014) Oneadaptation option is to use over-tree netting to protect fruit fromextreme conditions (Fig 1 left) In a recent study Darbyshireet al (2015) determined minimum air temperature thresholdsthat can result in sun damage of lsquoRoyal Galarsquo apple in non-netted and netted orchards Their assessment employed thermo-couple sensors under the fruit skin (Fig 1 right) in combinationwith air temperature sensors They identified air temperaturethresholds of 341 and 379 degC that correlate to minimumFST thresholds that can cause sunburn browning in nettedand non-netted orchards respectively To evaluate the use ofover-tree netting as an adaptation strategy to reduce the risk ofsun damage this climate change impact study presents a meth-od that minimised the potential number of descriptive climateprojections to produce results aimed at informing adaptive ac-tions This was evaluated considering the frequency of exceed-ance of threshold air temperatures now and in future periods fornon-netted and netted orchards Current (centred on 1995) andprojected threshold exceedance centred on 2030 and 2050aligningwith orchardistsrsquo shorter andmid-term planning frame-works respectively was evaluated In addition a period centredon 2090 was assessed to align with long-term strategicplanning
To address the demand for regionally relevant climatechange information (Kiem and Austin 2013) ten locations im-portant for pome fruit production in Australia covering a broadgeographical extent and corresponding range of underlying cli-mates were assessed One significant advantage to studyingmultiple locations in an impact assessment is that areas thatexperience similar climatic conditions but which may be sep-arated in space or time (ie with past or future climates) can beidentified ie climate analogues (Whetton et al 2013) This canbe helpful when considering adaptation strategies to a changing
climate (Hallegatte et al 2007 Webb et al 2013) a techniquethat will be demonstrated in this study
For adaptation actions to be effective comprehensive andplausible representation of the future climate is required to in-form the projection results The recently published Australianclimate change projections are based on the full body of knowl-edge of the climate system and the most up to date perspectiveon how the current climate may change under enhanced green-house gas concentrations (CSIRO and BoM 2015) These pro-jections of the future climate were informed by 40 CoupledModel Intercomparison Project 5 (CMIP5) (Meehl and Bony2011) global climate models (GCMs) simulating the climateresponse to a range of plausible scenarios of how greenhousegases and aerosols may change throughout the twenty-first cen-tury (Van Vuuren et al 2011) termed RepresentativeConcentration Pathways (RCPs)
The use of over-tree netting as a climate adaptation optionfor Royal Gala apple was used as an example to demonstrate amethod that simplifies complex climate projection informationin a manner that promotes climate adaptation uptake whileretaining scientific robustness Evaluating the potential benefitof installing netting to reduce apple sunburn risk is a useful casestudy as financial loss can be significant from extreme heatevents and netting is a clear implementable management op-tion The method used best-case and worse-case climate sce-narios for several future time periods to evaluate future sunburnbrowning risk with and without the adaptation option ofinstalling netting This was applied Australian wide to tengrowing districts to evaluate the adaptation option under futureclimates and across various site climate conditions The resultswere interpreted using several different approaches includingclimate analogues and considering different levels of growerrisk aversion
Materials and methods
Locations and regions assessed in the study
Climate data were selected from ten locations that represent themain commercial apple-growing regions in Australia Thesewere Applethorpe in Queensland Donnybrook and Manjimup
Fig 1 A netted lsquoRoyal Galarsquo apple orchard in Shepparton Victoria (left) Royal Gala apples with evidence of sunburn browning damage (centre) and athermocouple sensor placed under the fruit skin of a Royal Gala apple to measure fruit surface temperature (right)
Int J Biometeorol
in Western Australia Lenswood in South Australia Batlow andYoung in New South Wales Tatura and the Yarra Valley inVictoria and Spreyton and Huonville in Tasmania (Fig 2)These locations were in two broad regions identified in a studyby CSIRO and BoM (2015) based on their climate change re-sponse denoted as either the Central Slopes or SouthernAustralia
Recent climate projections for Australia were regionalisedaccording to logical groupings of recent-past climatic condi-tions biophysical factors and expected broad patterns of cli-mate change (CSIRO and BoM 2015) The ten study locationsare contained in two of these regions Central Slopes andSouthern Australia (Fig 2) Temperature projection resultsfrom these two regions were used to inform selection ofGCMs for this assessment
Projection methods
Analyses were conducted using daily maximum temperature(Tmax) for January when most sun damage is incurred forRoyal Gala apple following Darbyshire et al (2015) It wasimportant to set the context in this climate change impact as-sessment by including historical risk therefore allowing thechange in risk to be investigated In this study historical riskwas analysed using a 30-year baseline period centred on 1995(1981ndash2010) using gridded (005deg by 005deg) daily JanuaryTmax data obtained from the Australian Water AvailabilityProject (AWAP) (Jones et al 2009) Henceforth this 30-yearhistorical range is referred to as 1995
Future daily Tmax conditions were assessed in the studywith the aim to capture the range of climate projectionsresulting from the future range of RCPs and correspondingrange of CMIP5 GCM output To achieve this a subset ofRCPs and GCMs were identified and combined to createlsquobest-casersquo and lsquoworse-casersquo future climate scenarios The se-lection of RCPs GCMs and the method used to include day-to-day natural variability is detailed below
Emission pathways
Two RCPs (Moss et al 2010 Van Vuuren et al 2011) wereselected to include the likely future range in emissions
1 RCP45 An intermediate pathway which represents afuture where carbon dioxide (CO2) emissions peakaround 2040 and strong mitigation of emissions occursin the latter half of the century CO2 concentrations reach540 ppm by 2100 This scenario is similar to the SpecialReport on Emissions Scenarios (SRES) B1 scenario(Nakićenović and Swart 2000)
2 RCP85 A high pathway which represents a future withlittle curbing of emissions where the CO2 concentrationcontinues to rapidly rise reaching 940 ppm by 2100Current CO2 concentration analysis indicates that we aretracking along this trajectory (Peters et al 2012) Thispathway is similar to the SRES A1FI scenario (Rogeljet al 2012)
Fig 2 Australian pome fruit-growing locations (black dot) areshown in context of Australianstates (capital letters Victoriaabbreviated to Vic) The regionsdefined in CSIRO and BoM(2015) used for model selection inthis study are Southern Australia(dark grey) and Central Slopes(light grey)
Int J Biometeorol
Selecting GCMs
The 40 GCMs available from the CMIP5 were investigated toselect GCMs that best defined the projected range in Tmax forthe two regions (Fig 2) These were selected by analysingsummer (harvest season) Tmax projections for all 40 GCMsover three time periods 2030 (2016ndash2045) 2050 (2036ndash2065) and 2090 (2075ndash2104) (henceforth referred to as2030 2050 and 2090) and the two identified RCPs (40GCMs for RCP85 and 38 GCMs for RCP45) using theAustralian Climate Futures approach (Clarke et al 2011Whetton et al 2012) For each region this approachcategorised and then ranked projected increases in summerTmax GCM output using a multivariate ordering technique(Kokic et al 2002) After ranking only 26 GCMs of the 40were considered for inclusion in the assessment as the remain-ing 14 have been found to perform poorly across a number ofmetrics for Southern Australia (Moise et al 2015)
This assessment found that two GCMs CanESM2 andMIROC5 best described the range in projected summerTmax increases for both the Southern Australian and CentralSlopes regions (Table 1) Across both regions the CanESM2model was consistently warmer than the ensemble meanwhile the MIROC5 model was consistently cooler than themean While these GCMs were not always the absolute leastor most warming for each time period and RCP in the definedregions across the range of future scenarios being consideredthey represented the range well
Using these selections of RCPs and GCMs best-case andworst-case future scenarios were constructed to capture therange of climate projection uncertainty The best-case scenariowas constructed using MIROC5 forced by RCP45 and theworse-case scenario was similarly constructed usingCanESM2 and RCP85 As such reliance on using GCMnames and emission pathway terminology was removed
Representing natural variability in the projected Tmax timeseries
To create future daily Tmax time series projected averagemonthly January Tmax change values centred on 20302050 and 2090 for the best-case and worst-case scenarioswere added to the AWAP observed January daily Tmax timeseries (1981 to 2010) To capture the most reliable estimateof location-specific natural climate variability the baselineTmax time series was contrived to extend for the longestpossible period 30 years while remaining centred on1995 (CSIRO and BoM 2015) In this way the influenceof decadal shifts that may skew the lsquonormalrsquo climatologysuch as the Australian Millennium drought (Dijk et al2013) was minimised By using this approach the futurevariability in each scenario was the same as the underlyingnatural baseline temperature variability
Assessment of sunburn browning risk
For all locations the 10th 50th and 90th percentile of a 30-year time series of the number of days in January that Tmaxexceeded 341 degC (sunburn browning non-netted) and 379 degC(sunburn browning netted) (Darbyshire et al 2015) were gen-erated using the baseline (1995) period and each of the futureperiods (2030 2050 and 2090)
The entire plausible range of days exceeding the thresholdor sunburn browning risk (days) for each future time periodwas captured by incorporating results across the best-case andworst-case scenarios
The potential benefit of netting measured as a reduction inthe number of sunburn browning risk days was evaluated Tointerpret this reduction in terms of benefit of netting two riskcases were identified
1 Risk-sensitive Netting was introduced if the maximum(90th percentile) number of days in a 30-year periodexperiencing sunburn browning risk was greater than20 of days in the month (ie 6 days)
2 Risk-tolerant Netting was introduced if the median (50thpercentile) number of days in a 30-year period experienc-ing sunburn browning risk was greater than 20 of daysin the month (ie 6 days)
Use of lsquosunburn browning riskrsquo analogues
An alternative method to assist decision-makers regarding thetiming of introduction of over-tree nets is to identify a locationwhere the threshold was already exceeded ie where over-treenetting is already employed to minimise sunburn browningrisk Decision-makers will decide to introduce over-tree netsonce the climate becomes similar or analogous to the identi-fied location To assist with using this approach sunburnbrowning risk analogues were identified across the ten studylocations for 2030 2050 and 2090
To define sunburn browning risk analogues sunburn brow-ning risk was categorised and colour coded as in Table 2
Results
Historical (1981ndash2010) daily January Tmax ranges for the tenstudy locations indicated that Spreyton and Huonville werethe coolest locations with the warmest locations beingDonnybrook and Young (Fig 3 also see Fig 2 map)Exceedance of non-netted (341 degC) and netted (379 degC) sun-burn browning air thresholds for the period 1981ndash2010 oc-curred where the boxplot crossed the indicative lines
Int J Biometeorol
Current and projected sunburn browning risk
The current (1995) and future (2030 2050 and 2090) medi-an (10th and 90th percentile in brackets) sunburn browningrisk (days) for non-netted trees at the ten study locations isdescribed in Table 3 To simplify the results the range in-cluded both best-case and worse-case scenarios for eachtime period
The median number of sunburn browning risk daysfor the 1995 period varied with location from no dam-age at Spreyton through to 3 days for Lenswood 7 daysfor Donnybrook and 9 days for Young The maximumexceedance in any 1 year through this period was 16 daysrecorded at Young (in the years 1988 2003 2006 and2009)
For Tatura a key growing district median sunburn brow-ning risk of approximately 9 days was projected by 2030This could be up to 16 days in hottest years under a worst-case scenario but in coolest years and best-case scenarioonly 3 days would be expected to exceed the sunburn brow-ning threshold temperature In contrast under both best-caseand worst-case scenarios and across the natural variabilitySpreyton remained largely risk-free through to 2090(Table 3)
To compare the sunburn browning risk between locationsand for future time periods instances with similar mediansunburn browning risk were colour-coded in Table 3 Theseshadings indicate sunburn browning risk analogues For ex-ample the current sunburn browning risk at Young (medianof 9 days per month) is expected at Tatura in 2030 while the
current risk at Tatura (6 days per month) is expected atLenswoodManjimupBatlow and theYarraValley by 2090
Reduced sunburn browning risk through installationof over-tree nets
Sunburn browning risk (days) with the installation of over-tree netting was evaluated (Table 4) With nets in place atTatura the maximum exposure for 2030 was halved to ap-proximately 8 days for the hottest projected years and aworse-case projection scenario (163 days Table 3 vs84 days Table 4) By 2090 in Young where up to 249 daysof sunburn browning risk was experienced in the hottestyears and under a worst-case scenario (no nets Table 3)sunburn browning risk nearly halved to approximately14 days with over-tree nets in place (Table 4) which is sim-ilar to current risk at Young in the hottest years under aworst-case scenario for non-netted trees (Table 3)
The reduction in sunburn browning risk (days) was calcu-lated by measuring the average difference in exposure withand without over-tree nets This is illustrated spatially sepa-rately for best-case and worst-case future scenarios for 2090(Fig 4) Tasmanian locations had little benefit from the in-stallation of nets with Spreyton indicating 0-day benefitAverage exposure in Huonville was reduced by approxi-mately 1 day under the best-case future scenario and up to2 days under the worst case For Manjimup a more than 5-day (on average) improvementwas realised through applica-tion of nets (worst case) or approximately 3 to 4 days (onaverage best case) In currently hot areas such as Young
Table 1 Projected change in summer Tmax (degC) for Southern Australia and Central Slopes regions (see Fig 2) for 20-year periods centred on 20302050 and 2090 relative to the the 20-year period centred on 1995 under RCP45 and RCP85 for CanESM2 andMIROC5 CMIP5 GCMs compared tothe ensemble mean and standard deviation of 40 (RCP85) and 38 (RCP45) GCMs
Southern Australia Central Slopes
2030 2050 2090 2030 2050 2090
Both RCPs RCP45 RCP85 RCP45 RCP85 Both RCPs RCP45 RCP85 RCP45 RCP85
CanESM2 12 15 25 22 48 09 20 30 27 54
MIROC5 09 12 14 18 27 05 11 15 19 28
Mean 10 15 19 20 38 11 16 21 24 41
Standard deviation 03 04 04 05 09 05 07 07 07 09
Table 2 Sunburn browning risk (days) for the month (top) and proportion of days in the month (bottom)
le 16 days 17 to 31 days 32 to 62 days 63 to 93 days 94 to 155 days ge 156 days
le 50 51 to 100 101 to 200 201 to 300 301 to 500 ge 501
Colour shading corresponds to periods and locations having these sunburn browning risk levels
Int J Biometeorol
nets reduced sunburn browning risk by 8 to 9 days (on aver-age best to worst case)
To evaluate potential decisions to install netting the resultswere interpreted for two risk cases
1 Risk-sensitive option (eg maximum sunburn browningrisk (90th percentile) gt6 days Table 3)
2 Risk-tolerant option (eg median sunburn browning risk(50th percentile) gt6 days Table 3)
Depending on the risk case selected nets were applied at dif-ferent locations and different time periods as shown in Table 5Under the risk-sensitive case nets were applied at more locationsand earlier For example it is only under the risk-sensitive case thatnets were applied in Batlow A further example at Manjimupindicated that nets would be installed in 2030 under the risk-sensitive case and not until 2090 under a risk-tolerant caseInstallation of netting will be beneficial even for the historicalperiod under either risk case in Young Donnybrook and Tatura
Discussion
The disconnect between defendable credible and legitimate cli-mate projection information and end-user requirements can actas a barrier to actionable climate adaptation recommendations(Kiem and Austin 2013) Indeed inability to ever fully resolveuncertainty in climate projections should not restrict decision-relevant information being provided to inform end-users
Presentation of context-specific best-case and worst-caseoutcomes can remove the barrier between the science and theend-user with the decision-maker having robust informationready for decision implementation In a critical first step tosimplifying the outcomes of this study two GCMs representa-tive of the range of change were selected (Clarke et al 2011Whetton et al 2012) Further to this RCP45 and RCP85 (VanVuuren et al 2011) were used to represent the range of plausi-ble future emission scenarios While a lower option (RCP26)was available for modelling this pathway was not consideredachievable given current global emission policy settings(Meinshausen et al 2009 Peters et al 2012) and was thereforenot assessed Combining the projection information scenariosfor the best case ie least-warmingGCMlowest emissionpathway and worst case ie most-warmingGCMhighestemission pathway were identified and presented This ensuredthat the full profile of climate projections was captured in asimplified manner without reducing the credibility of the re-sults or the relevance of potential decision options In doing soa great deal of unnecessary complexity in calculation and pre-sentation of data and results was avoided (Smith and Chandler2010) and climate science terminology minimised This ap-proach could be applied to other impact analyses using tem-perature change or extended to studies where both temperatureand rainfall are important with for instance best case identi-fied as least-warming and wettest and worst case most-warming and driest future scenario
Note that results need to be interpreted across the range ofthe best-case and worse-case scenarios Employing only oneGCM or RCP in an impact assessment can inadvertently leadto potentially flawed adaptation decisions For example atApplethorpe by 2090 and under the best-case scenario a 15-day reduction to sunburn browning risk was achieved fromover-tree netting perhaps resulting in a decision not to installnets (see Fig 4) Under the worst-case scenario with nearly 6-day reduction to sunburn browning risk nets could be consid-ered useful (Fig 4) Presenting the range of best-case andworst-case projections gives end-users the opportunity to makea better-informed decision by appreciating the range of likelyoptions
In this assessment only some growing locations are at riskof sunburn browning under current and future climates Forexample for the Tasmanian locations of Huonville andSpreyton sunburn browning risk remains minimal rightthrough to the end of the century However for Young and
Young
Donnybrook
Tatura
Manjimup
Batlow
Applethorpe
Lenswood
Yarra Valley
Huonville
Spreyton
Maximum temperature (1981 - 2010) deg C
40302010
Fig 3 Boxplot showing daily January maximum temperature (degC) for1981ndash2010 for the ten locations in the study (also see Fig 2 map) Theinterquartile range (IQR) of the sample is indicated by the height of thebox the sample median (the horizontal bar) and 15 times IQR (thewhiskers) with outliers (the lsquoorsquo) Tmax thresholds (the horizontal solidlines) are given for sunburn risk (non-netted) 341 degC and sunburn risk(netted) 379 degC
Int J Biometeorol
Tatura by mid-century over a third of days in the harvestmonth could pose a sunburn browning threat
Over-tree netting is an effective option for reducing sunburnbrowning risk (Smit 2007 Smit et al 2008 Solomakhin andBlanke 2010) and was found in this study to notably reducesunburn browing risk for most growing districts Adaptationplanning to determine the time period in which nets could beintroduced to reduce sunburn browning risk was explored Thiscan be informed by using analogues of current and future expo-sure to extreme heat events (Webb et al 2013) For example theexposure to damaging heat events currently experienced inTatura is likely to be the same as that projected for Lenswoodby 2050 or Batlow by 2090 The benefit of future investment inover-tree nets for Lenswood or Batlow can be informed bylooking at current regional netting practises in Tatura
An alternative approach for informing future adaptationplanning decisions was presented using two hypothetical riskprofiles a risk-sensitive and a risk-tolerant Using this ap-proach nets would be recommended to be installed at differ-ent locations at different times through the twenty-first centu-ryWhile this example was informative individual risk assess-ment will likely change with appetite for business risk growerexperience and financial position A benefit-cost analysiswould assist with this decision-making An assessment ofthe economics of installing nets in the current climate inEurope for example showed that they were not economicallybeneficial (Iglesias and Alegre 2006) This would certainlyapply in Tasmania where the cost of netting would exceedcrop loss due to sunburn browning For other locations thebenefit-cost ratio would vary and could be estimated both
Table 3 Median (10th to 90th percentile in brackets) sunburn browning risk (days) for ten Australian pome fruit-growing locations for 30-year periodscentred on 1995 2030 2050 and 2090
Location 1995 2030 2050 2090
Spreyton 00 (00 to 00) 00 (00 to 00) 00 (00 to 00) 00 (00 to 03)
Huonville 00 (00 to 20) 10 (00 to 27) 10 (00 to 29) 15 (00 to 32)
Yarra Valley 20 (00 to 77) 43 (06 to 92) 46 (06 to 95) 56 (13 to 105)
Lenswood 30 (10 to 70) 45 (16 to 94) 51 (18 to 102) 60 (28 to 107)
Applethorpe 00 (00 to 20) 03 (00 to 46) 10 (00 to 59) 30 (00 to 97)
Batlow 10 (00 to 40) 29 (00 to 77) 41 (00 to 95) 55 (03 to 126)
Manjimup 25 (00 to 50) 39 (01 to 72) 45 (11 to 77) 61 (21 to 95)
Tatura 60 (10 to 130) 94 (33 to 163) 104 (45 to 177) 130 (65 to 210)
Donnybrook 70 (30 to 110) 89 (32 to 139) 103 (41 to 154) 128 (71 to 184)
Young 90 (12 to 160) 133 (26 to 202) 154 (38 to 227) 178 (58 to 249)
Future sunburn browning risk incorporates potential best-case and worst-case results Sunburn browning risk categories and colour coding defined in theMaterials and methods section of this publication
Table 4 As for Table 3 with over-tree nets in place
Location 1995 2030 2050 2090
Spreyton 00 (00 to 00) 00 (00 to 00) 00 (00 to 00) 00 (00 to 00)
Huonville 00 (00 to 00) 00 (00 to 05) 00 (00 to 10) 03 (00 to 13)
Yarra Valley 00 (00 to 19) 09 (00 to 35) 13 (00 to 42) 19 (00 to 61)
Lenswood 10 (00 to 29) 15 (00 to 45) 18 (03 to 52) 23 (03 to 57)
Applethorpe 00 (00 to 00) 00 (00 to 05) 00 (00 to 10) 00 (00 to 20)
Batlow 00 (00 to 00) 00 (00 to 10) 01 (00 to 25) 06 (00 to 40)
Manjimup 00 (00 to 20) 00 (00 to 25) 05 (00 to 30) 14 (00 to 43)
Tatura 20 (00 to 59) 28 (00 to 84) 36 (03 to 94) 56 (08 to 126)
Donnybrook 10 (00 to 30) 20 (00 to 50) 30 (00 to 57) 50 (10 to 82)
Young 20 (00 to 59) 39 (00 to 90) 54 (05 to 115) 78 (11 to 142)
Int J Biometeorol
under current and future climates (not in the scope of thisstudy)
In further support of over-tree netting for use as an adaptationmeasure several additional benefits to reducing sunburn brow-ning risk such as reduced hail damage irrigation requirementincidence of bitter pit and apple scab decay after cold storage andfruit fly damage have been reported (do Amarante et al 2011)
Negative effects of installing netting have been reported includ-ing poorer skin colour (pale blush and a more intense greenbackground colour) higher soluble solid concentration (SSC)and increased starch Interestingly when tasting apple slices ofundamaged and sunburned fruit sunburned fruit were consistent-ly rated higher than undamaged fruit due to their higher SSC andlower tartaric acid concentration (Racsko and Schrader 2012)
Fig 4 The average reduction ofsunburn browning risk days for2090 resulting from using over-tree netting for best-case (top) andworst-case (bottom) scenarios
Int J Biometeorol
therefore processed (eg apple chips apple pie apple juice) orsemi-processed (eg fresh cut slices) forms of apple may showfuture promise for marketing sunburnt fruit
There are also community and social barriers andor incen-tives that need to be considered when deciding to install netsFor example in some regions in Australia (eg Yarra Valley)visual amenity of nets has restricted their introduction whereasin other areas (NSW) government financial incentives exist forgrowers wishing to install netting (NSW Government 2015)
Other adaptation measures to reduce exposure to sunburninclude evaporative cooling fruit bagging or particle films(Gindaba and Wand 2006 Racsko and Schrader 2012) Over-tree evaporative cooling systems based on pulsing water appli-cations can reduce sunburn while also reducing tree transpirationand irrigation requirements (Green et al 2012) However accessto water for this purpose needs to be considered (Evans 2004)especially for drought-prone areas like Australia Many physio-logical and cultural management practises can also influence theextent of sunburn browning in apples cultivar susceptibilitydevelopmental stage of fruit tree form and training systemrow orientation in the orchard growth vigour (rootstock prun-ing) and water stress (Racsko and Schrader 2012) Acclimationby previous exposure to high temperatures within the season canalso reduce the extent of sunburn damage (Racsko and Schrader2012)
This study aimed at providing information to assist with cli-mate adaptation The approach indicated an increase in the num-ber of days potentially suitable for the formation of sunburnbrowning damage Use of a threshold assessment linearlymassing lsquopotential damage daysrsquo or sunburn browning risk wasappropriate for climate projection application and providedgrowers with clear information on potential changes in sunburnbrowning risk Building a more complex model accounting forall additional aspects (UV wind speed humidity colour etc) of
individual fruit incorporating canopy structure modelling couldgo part way to estimating damage at particular growing pointsTo our knowledge such models have not been developedFurthermore combining these sorts of fine flux models(subdaily and very small spatial component) with climate pro-jection data would be misrepresentative Climate projectionmodels are unable to accurately resolve variables such as windspeed through complex landscapes and still require work inpredicting sequences of weather such as heat waves
Apples can respond to high-temperature stress even at ad-vanced stages of maturity by synthesising heat shock proteinswhich likely play an important role in protecting cellular biochem-ical processes during periods of stress (Ritenour et al 2001)Theoretically summer pruning and leaf thinning should be per-formed on cool overcast days when the forecast is for cloudyweather in following days to allow time for heat shock proteinsto accumulate prior to exposure to direct solar radiation Howeverthe timing and duration of exposure required to encourage produc-tion of heat shock proteins are not fully understood Slow progres-sive exposure may allow their protective build-up(Ritenour et al2001 Wuumlnsche et al 2004 Zhang et al 2003 Ma and Cheng2004 Edreva 2005) Future strategies may make better practicaluse of this knowledge by preparing fruit for sun exposure(Wuumlnsche et al 2001 Ritenour et al 2001)
There are other cultivars not commercially grown in Australiathat are more susceptible to sunburn browning For instancelsquoCameorsquo and lsquoHoneycrisprsquo were found to sustain damage at46 degC (Schrader et al 2003b) lower than that for Gala (478 degCSchrader et al 2001) Royal Gala was used in this assessment asproduction in Australia is high with production in 20072008 thethird highest behind Cripps Pink and Granny Smith (AustralianBureau of Statistics 2008)
Other forms of sunburn such as sunburn necrosis a more se-vere level of damage could also be considered using the frame-work outlined in this study Identification of air threshold temper-ature for sunburn necrosis on Royal Gala apple under nets wouldneed to be evaluated prior to such an analysis and highlights atopic for further study (Darbyshire et al 2015) The nature ofextreme heat events often occurring from less than 1 day to afew days at most requires use of special modelling techniques thatare not available directly from GCM output Projections fromGCMs are commonly produced at a monthly timescale with dailyoutput unable to be directly interpreted To overcome this differenttechniques that can produce locally relevant synthetic future dailydata can be used Thesemethods include usingweather generatorsstatistical downscaling the change factor method or dynamicaldownscaling There are pros and cons of these different ap-proaches and there is no one best method (CSIRO and BoM2015Wilby et al 2009) In this analysis the change factormethodwas used to generate a synthetic future daily temperature timeseries incorporating a local representation of natural variabilityuncertainty (Wilby et al 2009) This method involved applyingGCM-derived temperature changes to a higher spatial resolution
Table 5 Decision not to install nets (X) or to install nets () for a risk-sensitive case (maximum sunburn browning risk gt6 days Table 3) (left)and a risk-tolerant case (median sunburn browning risk gt6 days Table 3)(right)
Risk-sensitive Risk-tolerant
Location 2030 2050 2090 2030 2050 2090
Spreyton X X X X X X
Huonville X X X X X X
Yarra Valley X X X
Lenswood X X
Applethorpe X X X X X
Batlow X X X
Manjimup X X
Tatura
Donnybrook
Young
Int J Biometeorol
historical (or baseline) climatology 005deg spacing of longitude andlatitude The projected climatology (with an original spatial reso-lution of approx 15deg (or 150 km) therefore also takes on this finerresolution In this way a synthetic projected temperature climatol-ogy captures local topographical and coastal climate influences
One of the limitations with the change factor method is thatalthough the resultant scenario incorporates the detail of the sta-tion records as well as the average climate change of the speci-fied GCM grid box the scaled and the baseline scenarios onlydiffer in terms of their respectivemeans maxima andminima allother properties of the data such as the range and distributionremain unchanged (Wilby et al 2004) In support of the methodchosen this should pose minimal effect given that for most ofthe Australian region mean temperature change is broadly sim-ilar in magnitude and direction to extreme temperature change(CSIRO and BoM 2015) However in the southern coastal re-gions the increases in the annual and 1-in-20-year maximumsare a little higher than for the means This seems consistent withthe effect of hot winds from the interior providing an even greatertemperature contrast to those from across the ocean under thewarmer climates as examined by Watterson et al (2008) Inviewing the future exposure for locations in Southern Australia(Lenswood and Yarra Valley) this potential underestimateshould be acknowledged It should also be noted that the changefactor method is not advised for producing future rainfall timeseries where in some regions for example changes in extremerainfall are projected to increase even if mean rainfall is projectedto decrease (CSIRO and BoM 2015)
For this case study projected changes to extreme temperatureand the efficacy of over-tree netting in diminishing adverse ef-fects were explored in some detail In a broader assessment ofclimate change impacts on theAustralian apple industry it wouldbe naiumlve to ignore changes to other climate variables given thatthese crops are affected directly and indirectly by many climaticfactors Projections for rainfall evapotranspiration drought fireand wind are all of interest to the grower and have implicationsfor future viability of orchards The importance of these shouldnot be underestimated in terms of the croprsquos vulnerability andalsowith regards to orchard operational practises eg spraying inhot conditions Finally although often overlooked for agriculturalworkers human health as impacted by exposure to extreme heatshould also be considered (Kjellstrom et al 2009)
Conclusion
A methodology was outlined to provide action-oriented climateprojection information The adaptation decision to install over-tree netting to protect apples against sunburn was used as anexample The methodology simplified climate projection infor-mation to a range between best-case and worse-case scenariosThe results were presented in several ways to assist in decision-making including colour-coded analogues and a risk profile
approach For Australia heterogeneity in the benefit of over-tree netting was found geographically and into future time pe-riods The results highlight areas with little risk and hence noadaptation response is required through to areas at considerablerisk and a significant benefit for the installation of netting Thisapproach focussed on adaptation action founded on a robustscientific method can be used as a template for a diverse rangeof impact studies to provide climate projection information that iseasily transferrable into adaptation actions
Acknowledgements We acknowledge the World Climate ResearchProgrammersquos Working Group on Coupled Modelling which is responsi-ble for CMIP and we thank the climate modelling groups for producingand making available their model output For CMIP the US Departmentof Energyrsquos Programme for Climate Model Diagnosis andIntercomparison provides coordinating support and led development ofsoftware infrastructure in partnership with the Global Organisation forEarth System Science Portals
Craig Heady and Tim Bedin for work in preparation of the thresholdexceedance database (CSIRO) and PennyWhetton (CSIRO) for her thor-ough review of the manuscript
Compliance with ethical standards
Funding Funding for this research was provided by the AustralianDepartment of Agriculture and Water Resources
References
ABS (2016) 75030 - Value of Agricultural Commodities ProducedAustralia 2014ndash15 httpwwwabsgovauAUSSTATSabsnsfLookup75030Main+Features12014-15OpenDocument
Alexander L Hope P Collins D Trewin B Lynch A Nicholls N (2007)Trends in Australiarsquos climate means and extremes a global contextAustralian Meteorological and Oceanographic Journal 561ndash18
Alexander LV Arblaster JM (2009) Assessing trends in observed andmodelled climate extremes over Australia in relation to future pro-jections Int J Climatol 29417ndash435 doi101002joc1730
Australian Bureau of Statistics (2008) Agricultural survey apples andpears Australia 2007ndash08 Australian Government Canberra
Clarke JM Whetton PH Hennessy KJ (2011) Providing application-specific climate projections datasets CSIROrsquos climate futuresframework Paper presented at the MODSIM2011 19thInternational Congress on Modelling and Simulation PerthWestern Australia December 2011
CSIRO and BoM (2015) Climate change in Australia information forAustraliarsquos natural resource management regions technical reportCSIRO and Bureau of Meteorology Melbourne pp 222
Darbyshire R McClymont L Goodwin I (2015) Sun damage risk ofRoyal Gala apple in fruit growing districts in Australia N Z JCrop Hortic Sci 43222ndash232
Dijk AI Beck H Crosbie R et al (2013) The millennium drought inSoutheast Australia (2001ndash2009) natural and human causes andimplications for water resources ecosystems economy and societyWater Resour Res 491040ndash1057
do Amarante CVT Steffens CA Argenta LC (2011) Yield and fruit qual-ity of lsquoGalarsquo and lsquoFujirsquo apple trees protected by white anti-hail netSci Hortic 129(1)79ndash85
Int J Biometeorol
Edreva A (2005) The importance of non-photosynthetic pigments andcinnamic acid derivatives in photoprotection Agric EcosystEnviron 106135ndash146
Evans RG (2004) Energy balance of apples under evaporative coolingTransactions of the ASAE 471029ndash1037
Gindaba J Wand SJ (2006) Comparison of climate ameliorating mea-sures to control sunburn on lsquoFujirsquo apples In XXVII InternationalHorticultural Congress-IHC2006 International Symposium onEnhancing Economic and Environmental 772 2006 pp 59ndash64
Green S Goodwin I Cornwall D (2012) Evaporative cooling effects ontree transpiration In VII International Symposium on Irrigation ofHorticultural Crops 1038 2012 pp 401e-406
Hallegatte S Hourcade J-C Ambrosi P (2007) Using climate analoguesfor assessing climate change economic impacts in urban areas ClimChang 8247ndash60 doi101007s10584-006-9161-z
Iglesias I Alegre S (2006) The effect of anti-hail nets on fruit protectionradiation temperature quality and profitability of lsquoMondialGalarsquoapples J Appl Hortic 891ndash100
IPCC (2012) Managing the risks of extreme events and disasters to ad-vance climate change adaptation summary for policymakers Aspecial report of working groups I and II of the intergovernmentalpanel on climate change Cambridge University Press Cambridgeand New York
Jones DA Wang W Fawcett R (2009)High-quality spatial climate data-sets for Australia Australian Meteorological and OceanographicJournal 58233
Kiem AS Austin EK (2013) Disconnect between science and end-usersas a barrier to climate change adaptation Clim Res 5829ndash41
Kjellstrom T Holmer I Lemke B (2009) Workplace heat stress healthand productivitymdashan increasing challenge for low and middle-income countries during climate change Global Health Action 2103402ghav3402i34002047PMCID PMC2799237
Kokic P Breckling J Luumlbke O (2002) A new definition of multivariateM-quantiles In Statistical data analysis based on the L1-norm andrelated methods Springer pp 15ndash24
Ma F Cheng L (2004) Exposure of the shaded side of apple fruit to fullsun leads to up-regulation of both the xanthophyll cycle and theascorbate-glutathione cycle Plant Sci 166(6)1479ndash1486
Meehl GA Bony S (2011) Introduction to CMIP5 CLIVAR Exchanges164ndash5
Meinshausen M Meinshausen N Hare W et al (2009)Greenhouse-gasemission targets for limiting global warming to 2C Nature 4581158
Moise A Wilson L Grose M et al (2015) Evaluation of CMIP3 andCMIP5 models over the Australian region to inform confidence inprojections Australian Meteorological amp Oceanographic Journal(accepted)
Moss RH Edmonds JA Hibberd KA et al (2010) The next generation ofscenarios for climate change research and assessment Nature 463747ndash756 httpwwwnaturecomnaturejournalv463n7282suppinfonature08823_S1html
NakićenovićN Swart R (eds) (2000) Special report on emissions scenar-ios A special report of working group III of the intergovernmentalpanel on climate change Cambridge University Press Cambridgeand New York
NSW Government (2015) Farm innovation fund NSW Rural AssistanceAuthority Orange NSW
Peters GP Marland G Le Queacutereacute C Boden T Canadell JG Raupach MR(2012) Rapid growth in CO2 emissions after the 2008-2009 globalfinancial crisis nature Climate Change 22ndash4
Racsko J Schrader L (2012) Sunburn of apple fruit historical back-ground recent advances and future perspectives Crit Rev PlantSci 31455ndash504
Ritenour MA Kochhar S Schrader LE (2001) Characterisation of heatshock protein expression in apple peel under field and laboratoryconditions J Am Soc Hortic Sci 126(5)564ndash570
Rogelj JMeinshausenMKnutti R (2012) Global warming under old andnew scenarios using IPCC climate sensitivity range estimatesNature Cl im Change 2248ndash253 ht tp wwwna ture comnclimatejournalv2n4absnclimate1385htmlsupplementary-information
Schrader LE Zhang J Duplaga WK (2001) Two types of sunburn inapple caused by high fruit surface (peel) temperature Plant HealthProgress 101ndash5
Schrader L Sun J Felicetti D Seo J Jedlow L Zhang J (2003a)Stress-induced disorders Effects on apple fruit quality In Proceedings ofthe Washington Tree Fruit Postharvest Conference WenatcheeWashington USA 2003 p 7
Schrader LE Zhang J Sun J (2003b) Environmental stresses that causesunburn of apple Acta Hort 618397ndash405
Smit A (2007) Apple tree and fruit responses to shade netting MScDissertation University of Stellenbosch
Smit A Steyn WJ Wand SJE (2008) Effects of shade netting on gasexchange of blushed apple cultivars Acta Horticulturae 772
Smith I Chandler E (2010) Refining rainfall projections for the MurrayDarling Basin of south-East Australia-the effect of sampling modelresults based on performance Clim Chang 102377
Solomakhin A Blanke M (2010) The microclimate under colouredhailnets affects leaf and fruit temperature leaf anatomy vegetativeand reproductive growth as well as fruit colouration in apple AnnAppl Biol 156121ndash136
Thomson G McCaskill M Goodwin I Kearney G Lolicato S (2014)Potential impacts of rising global temperatures on Australiarsquos pomefruit industry and adaptation strategies N Z J Crop Hortic Sci 4221ndash30
Trewin B Smalley R (2013) Changes in extreme temperatures inAustralia 1910 to 2011 In 19th AMOS National ConferenceMelbourne 2013 pp 11ndash13
Van Vuuren DP Edmonds J Kainuma M et al (2011) The representativeconcentration pathways an overview Clim Chang 1095ndash31
Watterson IG McGregor JL Nguyen KC (2008) Changes in extremetemperatures of Australasian summer simulated by CCAM underglobal warming and the roles of winds and land-sea contrastsAustralian Meteorological and Oceanographic Journal 57195ndash212
Webb LB Watterson IG Bhend J Whetton PH (2013) Global climateanalogues for winegrowing regions in future periods projections oftemperature and precipitation Aust J Grape Wine Res 19331ndash341
Whetton P Hennessy K Clarke J McInnes K Kent D (2012) Use ofrepresentative climate futures in impact and adaptation assessmentClim Chang 115433ndash442 doi101007s10584-012-0471-z
Whetton PH Karoly D Watterson IG Webb L Drost F Kirono DMcInnes K (2013) Australiarsquos climate in a four degree world InChristoff P (ed) Four degrees of global warming Australia in a hotworld EarthscanRoutledge London pp 17ndash32
Wilby R Charles S Zorita E Timbal B Whetton P Mearns L (2004)Guidelines for use of climate scenarios developed from statisticaldownscaling methods
Wilby RL Troni J Biot Y Tedd L Hewitson BC Smith DM Sutton RT(2009) A review of climate risk information for adaptation and de-velopment planning Int J Climatol 291193ndash1215
Wuumlnsche JN Bowen J Ferguson I Woolf A McGhie T (2004) Sunburnon applesmdashcauses and control mechanisms XXVI internationalhorticultural congress key processes in the growth amp cropping ofDeciduous Fruit amp Nut Trees (ISHS) Acta Hortic 636631ndash636
Wuumlnsche JN Greer DH Palmer JW Lang A McGhie T (2001)Sunburn-the cost of a high light environment Acta Hortic 557349ndash356
Zhang J-G Liu Y-F Kochhar S Schrader LE (2003) Acclimation of fruitto high temperatures in relation to sunburn in gala apples 36(6)731ndash734 Sci Agric Sin 36(6)731ndash734
Int J Biometeorol
Western Australian Apple Netting Demonstration Site Susie Murphy White1 Rohan Prince2 and Lisa Starkie 3 1 Pomewest Manjimup WA 2 Department of Agriculture and Food Western Australia South Perth WA and 3 Department of Agriculture and Food Western Australia Manjimup WA
Disclaimer This publication may be of assistance to you but the State of Western Australia Pomewest and its employees do not guarantee that the publication is without flaw of any kind or is wholly appropriate for your particular purposes and therefore disclaims all liability for any error loss or other consequence which may arise from you relying on any information in this publication Acknowledgments This project was conducted as part of the apple and pear industry climate variability and climate change program and funded by Horticulture Innovation Australia using the apple and pear industry levy and matched funds from the Australian Government and the Department of Agriculture and Water Resources Collaborations with project partners from Victorian Department of Economic Development Jobs Transport and Resources University of Melbourne University of Tasmania Department of Agriculture and Fisheries Queensland and Department of Agriculture and Food Western Australia have contributed to the outcomes of these projects Additional financial support was provided by Department of Agriculture and Food Western Australia and the states Royalties for Regions to install the netting and evaluate the irrigation efficiency The authors would like to thank Maurie Ann Tim and Michelle Lyster of Lyster Orchards
Introduction
Climate predictions for the future include reduced winter chilling less rainfall and more extreme
high temperature incidents across the South West of Western Australia (Sudmeyer et al 2016 and
Reid 2010) Over tree netting (hail shade or bird netting) has been identified as a potential climate
change adaptation strategy due to the moderating effect of adverse climate conditions (Lolicato
2011) Netting reduces solar radiation and therefore a reduction in the amount of sun damaged
fruit The installation of over tree netting is one adaptation to climate change that can reduce the
impact of browning on apples (Darbyshire et al 2015) Protection from hail events can be achieved
by netting pome fruit orchards enabling the protection of fruit and trees (Middleton and McWaters
2002) The Pome fruit industry is already responding with significant investment in netting
infrastructure despite remaining practical questions on the use of hail netting particularly in warm
growing regions including the effect of different types of netting on temperature fruit quality and
yield (Bosco et al 2014 and Iglesias and Alegre 2006) The effectiveness of netting as a climate
change adaptation strategy in reducing fruit surface temperature under predicted climate change is
unknown
Data collected at the Western Australian netting demonstration site was set up to expand on
existing studies on the effects of netting on air temperature relative humidity wind and solar
radiation (Middleton and McWaters 2002 and Darbyshire et al 2015) The Western Australian
netting demonstration site aims to compare the effect of different coloured net on fruit yield quality
and environmental conditions under black and white net
The Western Australian netting demonstration site at Lyster Orchards Manjimup was constructed
in 2013 to demonstrate the benefits of netting under Western Australian conditions This
demonstration site was part of two nationally funded projects Crossing the Threshold Adaptation
tipping points for Australian Fruit Trees funded by Department of Agriculture and Water Resources
and Understanding Apple and Pear production systems in a changing climate funded by Horticulture
Innovation Australia
The site was set up as demonstration site with one replication of each treatment type 025 hectares
of black net 025 hectares white net and no net (figure 1) There were 10 random trees monitored
under each treatment from 2 rows
Figure 1 Western Australian netting demonstration site at Lyster Matijari Orchard
The aim of the project was to demonstrate the value of hail bird or shade netting as a means to
improve orchard productivity in high density production systems Particular attention was given to
assessing the impact of netting on fruit quality (sunburn wind burn and colour) The effects of black
and white netting on fruit quality (particularly colour) tree growth and chill accrual in the orchard
were compared to the no net treatment
Materials and Methods
The demonstration site Lysterrsquos Matijari Orchard is located 3km south of Manjimup on the South
West Highway Western Australia (3416oS and 11607oE) Half a hectare of a 12 ha commercial
Cripps Pink apple crop has been covered with 16mm quad netting to provide full exclusion to birds
plus shade and hail protection
Construction of the netting started in August 2013 and was completed by 28th October 2013 025ha
of black net provides a 23 percent reduction of both shade and UV radiation while 025ha of white
net provides a 20 percent reduction The white and black net area was compared to no net areas
The three treatment sites have been monitored from 8th November 2013 through to 29th April 2016
The environmental conditions were monitored during this period and the fruit quality and yield for
two harvest seasons Under each treatment 10 monitoring trees were selected 5 in each row (figure
2)
A fourth site with lsquoFrustarrsquo net was expected to be constructed after harvest 2014 but was not
completed during this project
The Cripps Pink apple trees planted in 2004 on a northsouth orientation are on M26 rootstock
trained on a central axis Trees are spaced at 1m with 4m between rows giving a planting density of
2500 trees per ha The soil type includes sandy clay loam with varying gravel content over medium
clay that starts from between 50 to 70cm depth The grower undertook all management of the trees
during the demonstration period
Figure 2 Netting treatment layout at Matijari 5 trees monitored in each row 10 trees monitored in each
block
Weather stations were located in the centre of row 4 (black net) 10 (white net) and 16 (no net)
Measurements taken every minute are averaged and reported each 15 minutes Weather
observations measured include solar radiation UVB radiation mid canopy air temperature relative
humidity wind speed and rainfall
The light interception was calculated by measuring Photosynthetically Active Radiation (PAR) on a
clear sky day in March 2014 and February 2015 using a hand held ceptometer Several
measurements were taken throughout each section at morning solar noon and afternoon to
measure the extent and density of the shade created by the tree
Row 1716
Row 1110 Row 54
No net rows 14 to 19
White net rows 8 to 13
Black net rows 1 to 7
Phenology assessments were performed to determine the beginning of green tip and full bloom
timing Regular visual assessments (Monday Wednesday Friday) were made from just prior to
budburst until flowering was completed Assessments were performed on a whole tree basis on only
spur and terminal buds and spur and terminal flower clusters assessed (axillary buds on one-year-old
pome fruit shoots were not included in the assessments) for the 10 Cripps Pink monitoring trees
under black white and no net treatments
Fruit Surface Temperature (FST) was measured using thermocouples inserted into the surface of 10
Cripps Pink apples Sensors were inserted into apples evenly spaced (upper mid and lower canopy)
on 4 trees in row 4 (black) 10 (white) and 16 (no net) Fruit Surface Temperature (FST) readings
were taken every 15 minutes from end of January until early March over 3 seasons 2014 2015 and
2016
Yield assessments were undertaken in 2014 and 2015 Each of the 10 monitoring trees from the
black white and no net treatments were strip pick approximately one week prior to the growers first
pick The number of apples from each tree was recorded then graded according to the Pink LadyTM
standards then a random sample of 40 was selected During the grading process the number of bird
damage apples and sun damaged apples were recorded from each monitoring tree The grower bin
numbers have been recorded to get the commercial pick data from all Cripps Pink rows under the
black white and no net treatments
From the sample of 40 apples from each of the monitoring trees the colour was assessed using the
Pink LadyTM Europe Ctifl colour charts (Centre technique interprofessionnel des fruits et legumes
(Ctifl) Pink LadyTM Eurofru colour charts) Each apple was given a score for background colour (F1-
F7) a score for blush intensity (R1-R8) and a percentage of blush intensity when the blush was over
R3
The maturity of the apples was tested from a sample of 10 apples randomly selected from the rows
monitored from early April until harvest With the final maturity test completed from the sample of
40 apples The maturity tests included starch conversion using the 1-6 scale (Portman and Sutton
2003) total soluble sugars measured using a refractometer flesh firmness measuring the pressure
from each side of the apple using a 11mm plunger and acid titration (McAlpine et al 1995)
Results and Discussion
Environmental
A summary of the winter chill conditions during the data collection years was compiled Flowering
phenology is influenced by winter chill accumulation with low chill years due to warm winter
conditions potentially delaying flowering Conversely warmer spring conditions may advance
flowering timing
Winter temperature conditions must be converted into chill portions For this project the Dynamic
chill model was used to calculate chill conditions under each net colour This model estimates winter
chill in chill portions and is currently the most robust and reliable chill model available (Luedeling
2012 and Darbyshire et al 2016) Winter chill was calculated from 1st March through until 31st
August 2014 and 2015 from hourly temperature readings collected in the orchard
There is very little difference in chill accumulation under black net white net or no net area (figure
3) The nets do not reduce the amount of chill accumulated as there is minimal impact on the
temperatures recorded under the black or white net or no net (table 1)
Use of netting to increase winter chill is unlikely to be an effective adaptation option however these
results do show that netting established for other management outcomes does not influence
winter chill accumulation in a meaningful way
Table 1 Mean monthly temperatures (degC) from March to October and total chill portions accumulated from 1st March until 31st August under black white and no net
Treatment Season Mar Apr May Jun Jul Aug Sep Oct CP
Black 2015 179 151 12 127 115 117 13 166 66
White 2015 179 151 121 128 117 119 129 166 63
No Net 2015 179 152 12 126 111 114 126 163 66
Black 2014 185 162 139 118 111 128 132 147 55
White 2014 186 163 139 118 112 129 132 147 54
No Net 2014 187 164 14 119 112 129 132 148 52
Figure 3 Chill accumulation under the black net white net and no net at Matijari in 2014 and 2015
Bud break and flowering data was collected from 10 trees under black white and no net rows
Observations were made three times a week from 20 August to 30 October 2014 and 2015 (Parkes
et al 2016) Whole tree assessments were made to determine the dates of bud break occurrence
of first flower and full bloom and to monitor progression of flowering (table 2) There is minimal
difference in flowering progression between the netted trees to the no net trees Rootstock shows a
greater difference with the MM106 trees under no net reaching bud break a week before M26 All
trees still came into full bloom at the same time in 2014 (figure 4)
Table 2 Summary of apple bud break and flowering data for 2014 at Matijari based on whole tree assessments Average dates of bud break (5 percent of buds at green tip or beyond) first flower and full bloom (80 percent of individual flowers open) for ten randomly selected trees
Cultivar Root Stock
Bud break First Flower Full Bloom
201415
No Net Cripps Pink M26 15914 26914 171014
White Net Cripps Pink M26 12914 22914 171014
Black Net Cripps Pink M26 15914 22914 171014
No Net Cripps Pink MM106 8914 15914 171014
201516
No Net Cripps Pink M26 18915 25915 151015
White Net Cripps Pink M26 16915 25915 151015
Black Net Cripps Pink M26 11915 25915 121015
No Net Cripps Pink MM106 23915 30915 141015
Figure 4 Flowering progression at Matijari for Cripps Pink apples on M26 rootstock under black white and no
net The first symbol represents green tip the second first flower and the last full bloom
Mean daily temperatures rarely varied more than 05 to 1 degree (figure 5) The netting led to small
increases in minimum temperatures and dampening of maximum temperatures This action is
similar to a cloud cover effect which reduces radiant heat loss overnight and reflects a portion of
incoming daytime radiation reducing maximum temperatures
Figure 5 Daily maximum (upper) average (centre) and minimum (lower) air temperatures for black white and
no net treatments for summer 2016
The daily maximum air temperature for the summer autumn months (December ndash April 2014 2015
and 2016) the relationship between the white and no net (figure 6) and black and no net (figure 7)
show no effect on air temperature There is a wide range of air temperatures from 14oC to 37oC
245 250 255 260 265 270 275 280 285 290 295 300
DoY (Sept - Nov)Green tip - First Flower - Full Bloom
Flowering Progression Matijari
2014 Black net
2015 Black net
2014 White net
2015 White net
2014 No net
2015 No net
0
5
10
15
20
25
30
35
40
1 January 2016 1 February 2016 1 March 2016
Air
Te
mp
era
ture
oC
Black max Black min Black avgWhite max White min White avgNo Net max No Net min No Net avg
over a 5 month period of the growing season that demonstrating there is no effect on air
temperature Under the nets feels cooler as the solar radiation lower
Figure 6 The relationship of maximum daily air temperature under no-net (ATno-net) and white net (ATwhite) for
Summer and Autumn 2014 to 2016 The fitted linear regression (solid line) was described by ATno-net = 1004 (plusmn
0006) ATwhite - 0081 (plusmn 0155) R2 = 099 n = 438
Figure 7 The relationship of maximum daily air temperature under no-net (ATno-net) and black net (ATblack) for
summer and autumn 2014 to 2016 The fitted linear regression (solid line) was described by ATno-net = 0996 (plusmn
0006) ATblack + 0379 (plusmn 0163) R2 = 098 n = 438
20
25
30
35
40
20 25 30 35 40
ATn
o-n
et(deg
C)
ATwhite (degC)
20
25
30
35
40
20 25 30 35 40
ATn
o-n
et(deg
C)
ATblack (degC)
The humidity under the white net during summer was highest and lowest in no net block (table 3)
The effect of high humidity was seen in the pest and disease management under the nets In the
first year after the nets were constructed woolly aphids were extremely bad under the nets there
was also a high percentage of apples with bitter pit European mites attacked under the nets in late
December 2015 almost defoliating the trees With pest and disease outbreaks can be more
common under netting it is a matter of monitoring more frequently as the conditions under the nets
are favourable to outbreaks
Table 3 Maximum daily relative humidity during summer autumn 2016
Black White No Net
Average 9285 9346 9192
Max 9844 9852 9774
Min 6683 6792 6284
SE 047 040 046
Average wind speeds are highest under the black net which is on the eastern side followed by the no
net which is on the western side (table 4) The white net is the central block between the black and
no net treatments The average wind speeds measured appear to demonstrate a landscape effect
where the eastern side open to the easterly winds off the dam and the white net is protected from
the prevailing winds The no net treatment is protected from the rest of the block of Fuji and Cripps
Pink apple trees Although the maximum wind speeds come from the prevailing westerly winds
Table 4 Average 15 minute wind speed (ms) May 2015 ndash April 2016
Black White No Net
Average 112 064 089
Max 497 602 746
Min 0 0 0
SE 0005 0004 0005
The no net area received the highest global radiation (figure 7) While not exactly the same as the
specifications the white net showed a 15 percent reduction and the black net 26 percent reduction
during January and February 2014 and 2015 Specifications are only given as a guide to how the nets
will perform and in this case the black net was close to specification and the white net slightly less
A similar trend is followed each summer for global radiation
Figure 7 Global radiation measured under the black net white net and no net rows for summer 2014
Figure 8 Global radiation measured under the black net white net and no net rows for summer 2015
Figure 9 Global radiation measured under the black net white net and no net rows for summer 2016
0
5
10
15
20
25
30
35
40
0 20 40 60 80 100
Glo
bal
rad
iati
on
(M
Jm
2 d
)
Julian Day
2014 No net
White net
Black net
0
5
10
15
20
25
30
35
40
0 20 40 60 80 100
Glo
bal
rad
iati
on
(M
Jm
2d
)
Julian Day
2015 No net
White net
Black net
0
5
10
15
20
25
30
35
40
0 20 40 60 80 100
Glo
bal
rad
iati
on
(M
Jm
2d
)
Julian Day
2016 No net
White net
Black net
The effect of the black white and no nets on the interception of light was measured annually as a
percentage of total above canopy Photosynthetically Active Radiation (PAR) using a ceptometer
Figure 10 shows the black net had a greater reduction in shade compared with the white net and no
net
Figure 10 Average photosynthetic radiation interception (PAR) of sky measured at morning noon and
afternoon on March 2014 and February 2015 in the black net white net and no net rows
While measurements reflected shade specification of the net the reduction in PAR was also
influenced by tree vigour or vegetative growth
The fractional PAR is the light intercepted by the tree canopy Tree vigour was higher under the
netted areas than outside the net as seen in the under canopy readings (figure 11)
0
500
1000
1500
2000
2500
3000
830 930 1030 1130 1230 1330 1430 1530
PA
R
mo
lm
2 s
Time
No Net 15 Black 15 White 15No Net 14 Black 14 White 14
Figure 11 Average percentage of fractional photosynthetic radiation interception (fPAR) measured at
morning noon and afternoon on 12 March 2014 in the black net white net and no net rows under tree
canopy
Quality
The fruit quality was a measured through the amount of sun damaged fruit bird damaged colour
development of the background and blush of the apple and maturity of the fruit Fruit surface
temperature was used to measure the amount of sunburn browning that could be expected under
netted conditions
Fruit surface temperature (FST) was higher in the no net area particularly during extreme heat
events in late summer and a higher percentage of sunburnt fruit was observed in the no net rows
25 percent in 2014 Less than half a percent of the apples were sun damaged that came from the
black and white net areas compared to the no net area
From the 2014 and 2016 fruit surface temperature (FST) recorded it is reasonable to think that
amount of solar radiation reaching the fruit surface should influence the FST The FST was measured
over the summer 2013-14 season (figure 12) and 2015-16 season (figure 13) Average FST was lower
under the white net than the black even though greater solar radiation was recorded under white
net
0
10
20
30
40
50
60
70
80
90
100
830 930 1030 1130 1230 1330 1430 1530
Pe
rce
nta
ge f
PA
R
TimeNo Net 15 Black 15 White 15
No Net 14 Black 14 White 14
Figure 12 Fruit surface temperature (FST) and air temperature measured in the black net white net and no
net rows at Matijari for February till mid-March 2014
The FST recordings from 2015 had some computer programming errors at the weather station and
have not been presented in this report
Figure 13 Fruit surface temperature (FST) and air temperature measured in the black net white net and no
net rows at Matijari for February till mid-March 2016
In 2016 the highest FST was 5961 oC in the no net block This was just one sensor in the outside
lower canopy on the western side sun damage was observed in this apple All other sensors in the
no net treatment were only a few degrees warmer than the black and white net
The daily maximum fruit surface temperature for February 2014 and 2016 the relationship between
the white and no net (figure 14) and black and no net (figure 15) show minimal effect on fruit
surface temperature The range of FST start at 20 oC for minimum daily FST and extend through to a
maximum of 48 oC with average maximum FST of 483 oC for black net 489 oC for white net and 596
oC for the no net over the 2 seasons of recording FST
0
10
20
30
40
50
60
4022014 18022014 4032014
Tem
pe
ratu
re o
CAir Temp Black net Air Temp White net Air Temp No net
FST Row 4 Black net FST Row 10 White net FST Row 16 No net
0
10
20
30
40
50
60
29012016 12022016 26022016
Tem
pe
ratu
re o
C
White Max FST No Net Max FST Black Max FST
Black Max Air Temp White Max Air Temp No Net Max Air Temp
Figure 14 The relationship of maximum daily fruit surface temperature under no-net (FSTno-net) and white net
(FSTwhite) for February 2014 and 2016
Figure 15 The relationship of maximum daily fruit surface temperature under no-net (FSTno-net) and black net
(FSTblack) for February 2014 and 2016
Background colour blush and maturity all contribute to the marketability and grade assigned to Pink
LadyTM apples While the results are presented separately it is important to consider them together
In 2015 at the time of strip picking the majority of apples had reached the ideal background colour
(figure 16) Seventy eight percent of fruit in the no net and black net blocks were between F3 to F4
suitable for optimum for long term storage Sixty eight percent of white net apples were between
F3 to F4 (table 5)
y = 11445x - 22008
20
30
40
50
60
70
20 30 40 50 60 70
FST
No
Ne
t (o
C)
FST White Net (oC)
y = 10337x + 15665
20
30
40
50
60
70
20 30 40 50 60 70
FST
No
Ne
t (o
C)
FST Black net (oC)
Background colour greater than F4 is undesirable for long term storage as the green background
begins to move toward yellow the fruit ripens Twenty two percent of the no net fruit were beyond
the ideal background storage colour in 2015 and 67 percent in 2014 of no net and 53 percent of the
white net
Figure 16 Background and blush colour of Cripps Pink apples at time of strip picking 2842015 black net
white net and no net random sample for maturity testing
Table 5 Background colour percentage of apples with F score for background colour from Ctifl standards for
Pink LadyTM Optimum for long term storage F 3-4
F Score lt3 Immature
F Score 3 -4 Optimum for long term
storage
F Score gt4 Optimum for fresh market
to over ripe
2014
Black 6 93 1
White 5 42 53
No Net 2 31 67
2015
Black 0 78 22
White 0 68 32
No Net 0 78 22
While optimum blush is between R4 and R5 for long term storage blush greater than R4 is preferred
in all fruit The no net treatment had better blush colour development with majority of apples at
greater than R4 (table 6)
Table 6 Blush intensity percentage of apples with R score for background colour from Ctifl standards for Pink
LadyTM Optimum for long term storage F 4-5
R score lt4 Immature
R Score 4-5 Optimum for long term
storage
R Score gt5 Optimum for fresh market
2014
Black 43 29 28
White 25 38 37
No Net 26 34 40
2015
Black 68 25 7
White 56 35 9
No Net 47 42 11
Black Net White Net No Net
Colour management was required under the nets to ensure the colour and maturity meet at the
same point A reflective surface can ensure colour develops with the blush colour meeting market
standards
Maturity tests were undertaken from a sample of 10 apples from each treatment after the strip pick
(table 7) The starch conversion guide for the maturity of Pink LadyTM Apples the 1-6 scoring system
was used to assess the apples At picking starch conversion scores were at 4 optimum for only short
to medium controlled atmosphere storage (figure 17) The Total Soluble Sugar (TSS) was generally
lower than the acceptable minimum standard of 13 percent in all areas testing at 11 percent after
the first strip pick The grower did 4 picks of the fruit to harvest the apples at the optimal time of
maturity and colour meeting enabling sugar percentage to rise to the required 13 percent The flesh
firmness was measured on opposite sides of the apple averaging 82kg in 2015 and 8kg in 2014 with
ideal firmness pressure greater than 61kg required
Table 7 Average maturity testing from the strip pick of a sample of 10 apples from each of the 10 monitoring
trees
Treatment Firmness kg
TSS ()
Starch Index
Acid ml
2014
Black 73 118 40 90
White 78 120 39 105
No Net 89 114 35 117
2015
Black 82 107 41 102
White 82 114 43 87
No Net 82 110 41 89
Figure 17 Starch test on 2842015 at the time of strip picking Showing average starch index gt4 suitable for
medium to short term storage
Black Net
White Net
No Net
Yield
Both the strip picked data from the 10 monitoring trees in each treatment (table 8) and the
commercial pick data from the remaining trees in the block (table 9) have been included to
demonstrate the difference in the assessment and importance of working on a commercial property
Forty apples were assessed for size and quality from the strip picked trees
Encouragingly average fruit diameters from the strip pick were all very similar between treatments
There was a slight difference in average fruit weight which when multiplied with the difference in
average number of fruit per tree contributed to the difference in extrapolated yield per hectare
Table 8 Average fruit diameter weight fruit per tree and yield of non-damaged fruit based on strip harvest
Treatment Harvest
Date
Average fruit diameter
(mm)
Standard Deviation of
diameter
Average single fruit weight (g)
Average fruit number per
tree
Extrapolated yield (tha)
2014
Black 2014 752014 716 035 1656 1212 710
White 2014 652014 718 035 1726 1356 749
No Net 2014 3042014 716 062 1724 742 424
2015
Black 2015 2942015 717 058 1702 1557 653
White 2015 2942015 720 061 1626 1433 574
No Net 2015 152015 712 038 1610 2189 900
The data from the grower harvest (table 6) based on bins picked from the remaining 390 trees per
treatment shows a slightly different story The commercial yields are lower for black net and no net
treatment and higher under the white net This is largely due to the increased number of trees per
treatment averaging out differences in fruit numbers and the staggered picking over several weeks
allowing for colour to guide the timing of harvest This meant fruit with less blush than desired may
have increased in size and weight before being picked by the growers with some fruit left on the
trees that were already over mature or not considered marketable
Table 9 Grower yield per treatment total tonnes from each treatment 2013 yield before netting installed
Treatment 2013 Harvest Date
2014 Harvest Date
2015 2016
Black 97 2152014 63 252015 80
White 113 2152014 77 252015 103
No net 103 2152014 70 252015 97
The amount of sun damaged apples strip picked was less than 1 percent of the fruit picked from the
10 monitoring trees The black net apples in 2014 had the lowest amount (69 percent) of the fruit
marketable and had the highest (79 percent) marketable fruit in 2015 The no net was very stable
across the two harvests with the white net showing decreases in marketability in 2015 due to shape
defects and under sized fruit (table 10)
Table 10 Percentage of fruit that was marketable nonmarketable or had sun damage
Treatment Marketable Non-marketable Sunburn
2014
Black 6915 3085 0101
White 78 22 025
No net 74 26 25
2015
Black 787 213 05
White 705 295 04
No Net 730 270 10
sunburn is a subset of non-marketable fruit
In both seasons the damage from birds was minimal with no large losses from birds recorded before
harvest in the rows under the black white or no net The apples strip picked from the monitoring
trees had less than 1 percent of the fruit damaged by birds There were no hail events during the
monitoring period and so no damage from hail could be assessed Other previous studies from
Queensland have shown netting to be effective in preventing hail damage (Middleton and McWaters
2002)
Conclusions
Winter chill accumulation was monitored during the three years of the project It was found that
netting black or white had minimal impact on chill accumulation This was also reflected in the mean
monthly temperature which only varied by about half to one degree There is a linear relationship
between the air temperature of the black and white net and again when the nets are compared to
the no net treatment block The impact on chill conditions under the net was also seen in the
flowering progression which was monitored under the nets in 2014 and 2015 In both years the
black white and no net trees monitored entered into the bud break and reached full bloom on the
same day or within days of each other
The environmental conditions under the nets were very similar although some slight differences can
be seen in the weather data recorded The humidity under the white net during summer was
highest and lowest in no net block The effect of high humidity was seen in the pest and disease
management under the nets In the first year after the nets were constructed woolly aphids were
extremely bad under the nets and a high percentage of apples had bitter pit European mites
attacked under the nets in late December 2015 almost defoliating the trees With pest and disease
outbreaks more common under netting it is a matter of monitoring more frequently as the
conditions under the nets are favourable to outbreaks Although pests and diseases are treatable
they just require prompt management
Solar radiation was the highest in no net followed by white and black net The fruit surface
temperatures recorded in the apples over the late summer period were higher in the no net apples
where the solar radiation was highest The average difference between no net and the netted was
around 3 degrees with the black and white nets only varying by one degree
Measuring the amount of shade under the tree canopy it was found that tree vigour influenced the
Photosynthetically Active Radiation Outside the canopy the PAR followed the netting specifications
rating of the netting black lowest then white and no net
The fruit size was very similar in the three treatments with slight differences in fruit weight and
number of apples per tree after the strip pick The grower yields were highest under the white net
where the fruit had been allowed to stay longer on the trees This was to ensure the apples gained
more colour Initial response in the first year yield was reduced due to bitter pit woolly aphid and
colour management
Colour management is required under the nets to ensure the colour and maturity meet at the same
point A reflective surface can ensure colour develops with the blush colour meeting market
standards
The netting has proven to be successful at the Western Australia netting demonstration site in
reducing the impact of birds on the fruit
reducing the fruit surface temperature
with minimal impact on winter chill and flowering progression
Table 11 Cripps Pink responses to Black White and No Net at Western Australian Netting Demonstration Site
Black Net White Net No Net
Dormancy Chill Accumulation No Effect No Effect No Effect Flowering Progression No Effect No Effect No Effect Environmental data Air Temperature No Effect No Effect No Effect Fruit Surface Temperature Highest Humidity Highest Max Lowest Min Solar Radiation Lowest Highest Wind average speed Highest Lowest Yield and Quality Grower Yield Lowest Highest Colour Best Background Best Blush Best Overall Maturity Highest Sugar Lowest Starch
References
Bosco L Bergamaschi H Cardoso L Paula V Marodin G and Nachtigall G (2014) Apple production and quality
when cultivated under anti-hail cover in Southern Brazil International Journal of Biometeorology 59773-782
Darbyshire R McClymont L and Goodwin I (2015) Sun damage risk of Royal Gala apple in fruit growing districts
in Australia New Zealand Journal of Crop and Horticultural science
Darbyshire R Pope K and Goodwin I 2016 An evaluation of the chill model to predict flowering time in
apple tree Scientia Horticulturae Vol 198 pages 142 ndash 149
Darbyshire R Webb L Goodwin I Barlow EWR (2013) Challenges in predicting climate change impacts on
pome fruit phenology International Journal of Biometeorology1-15 doi101007s00484-013-0705-4
Darbyshire R Webb L Goodwin I Barlow S (2011) Winter chilling trends for deciduous fruit trees in Australia
Agricultural and Forest Meteorology 1511074-1085 doi101016jagrformet201103010
Luedeling E (2012) Climate change impacts on winter chill for temperate fruit and nut production A review
Scientia Horticulturae 144218-229
Iglesias I Alegre S 2006 The effect of anti-hail nets on fruit protection radiation temperature quality and
profitability of lsquoMondial Gala apples Journal of Applied Horticulture 8 91ndash100
Lolicato S 2011 Sun protection for fruit a practical manual for preventing sunburn on fruitmdash2011 Victoria
Department of Primary Industries
McAlpine G Mackay A Sutton J Godley G Price A and Melvin-Carter E (1995) Pink Lady TM and Sundowner TM
Apple specifications Bulletin 4305 Department of Agriculture Western Australia
Middleton S and McWater A (2002) Hail Netting of Apple Orchards - Australian Experience The Compact
Fruit Tree Volume 35 number 2 2002
Portman T and Sutton J (2003) Starch Conversion guide for maturity of Pink Lady TM apples Department of
Agriculture Western Australia
Parkes H Tabing L McClymont L Wilkie JD Combret M 2016 Variation in the flowering phenology of
apple and pear in Australia Acta Horticulturae 1130 (8)55-61
Reid A (2010) Horticulture and climate change A preliminary analysis of climate and crop climatic information
in the south-west of Western Australia Department of Agriculture and Food Western Australia Perth
Sudmeyer R Edward A Fazakerley V Simpkin L amp Foster I 2016 lsquoClimate change impacts and adaptation
for agriculture in Western Australiarsquo Bulletin 4870 Department of Agriculture and Food Western Australia
Perth
Appendix
Presentations
Susie Murphy White 2015 Netting the Benefits of climate change APAL Speed Updating 2015
httpapalorgauresearch-development-extensionprojectsresearch-reviews (accessed
832016)
Materials produced
Posters
Murphy White S Prince R and Starkie L 2015 Is there a difference between Black or White
netting (Manjimup Rotary 2015 Warren Districts Show 2016)
Prince R Murphy White S and Starkie L 2015 Benefits of good irrigation in netted apple
orchards
Fact Sheets
Darbyshire R 2014 Winter Chill and Fruit Trees PICCC Research Fact Sheet wwwpicccorgau
Australian Fruit Grower magazine articles
Murphy White S June 2014 Netting the Benefits of a changing climate (Volume 8 Issue 5)
Prince R and Murphy White S October 2015 Netting Trial results in Western Australia (Volume
9 Issue 9)
Murphy White S Prince R and Starkie L December 2015 Black or White netting which is best
(Vol 9 Issue 11)
Web pages
httpsagricwagovaun4863
httpwwwpicccorgauresearchproject440
httpwwwhincomauprojectswinter-chill-and-fruit-trees
httpapalorgauresearch-development-extensionprojectsapple-pear-production-changing-
climate
1
Apple yield response to climate change and netting
Lexie McClymont1 Rebecca Darbyshire2 and Ian Goodwin1
1 Victorian Department of Economic Development Jobs Transport and Resources
2 New South Wales Department of Primary Industries
Summary
The effect of increased temperature on potential yield of early-season apples in northern Victoria
was investigated using the physiological model MaluSim (Lakso and Johnson 1990) Impacts of
netting on yield were also investigated using observed data and MaluSim With a climate change
scenario of a 2 degC increase in maximum and minimum air temperatures MaluSim predicted
increased fruit weights and yields when crop loads were low However at higher crop loads yield
potential decreased due to greater source limitations resulting from decreased daily photosynthesis
in response to high temperatures later in the season Overall the effects of a 2 degC increase in air
temperatures on potential yields of Royal Gala apples in northern Victoria were small (+13 to -16
tha depending on crop load and presence or absence of netting) Yield potential was higher for
non-netted trees than netted trees but observed yields were lower for non-netted trees This
highlighted the benefits of netting in reducing crop damage and the influence of orchard
management on actual yield
Evaluation of the performance of MaluSim in predicting yield of Royal Gala apples in north Victoria
supported use of this model for preliminary investigation of climate change impacts on yield
However limitations of use of the model for this purpose were identified and are briefly discussed in
this report Additionally long-term investigation of the impact of elevated CO2 on apple yield is
required to more accurately predict climate change impacts A greater understanding of the impact
of temperature shifts on fruit maturation colour development and phenology would further
improve predictions of yield under different climate scenarios
2
1 Introduction
Mean temperatures for coastal and inland Australian apple growing regions are predicted to rise by
07-09oC and 1-12oC respectively by 2030 (Putland et al 2011) Previous research has identified a
range of potential impacts of predicted climate change on the productivity and profitability of the
Australian apple and pear industries (Putland et al 2011 Darbyshire et al 2013) Climate change has
the potential to affect potential productivity of pome fruit trees through effects of changing
environmental conditions on the orchards net carbon exchange (difference between photosynthates
produced and expended for respiration Putland et al 2011 and references within) Netting provides
a climate adaptive option particularly for severe weather events such as extreme heat or hail and is
increasingly being installed by growers Industry has made significant investment in netting
infrastructure despite remaining practical questions on the use of hail netting particularly in warm
growing regions The reduction of solar radiation under netting may influence physiological
responses to climate change
An apple physiological model (MaluSim Lakso and Johnson 1990) has been used to understand the
effects of predicted climate change on net carbon exchange of apples and the upper limit of apple
production (yield potential) The aims of this study were to
- evaluate the model MaluSim with regard to prediction of apple yield under Australian
conditions and
- predict apple yield in netted and non-netted orchards under warmer climate conditions
using MaluSim
Use of the model lsquoMaluSimrsquo (Lakso and Johnson 1990) to predict apple yield was evaluated in
201213 for Royal Gala apples grown at a site in nothern Victoria This site was selected as two
adjacent blocks were netted and non-netted This provided an opportunity to evaluate MaluSim with
and without the adaptation option of over-tree netting Data was collected from 10 trees for both
netted and non-netted trees and measurements for each of the 10 trees were treated as repeat
observations Broader evaluation of the model was conducted by the PICCC project lsquoCrossing the
threshold adaptation tipping points for Australian fruit treesrsquo and reported by Darbyshire and
McClymont (2016)
A future climate scenario of a +2 degC increase in maximum and minimum daily temperatures was
investigated for netted and non-netted orchards and compared to a current season (201213) To
create the future scenario temperature data from 201213 was increased by + 2 degC 201213 solar
radiation values were unchanged and other tree parameters were standardised based on
observations or default parameters within the model Fruit weight predictions were compared to
predictions based on 201213 weather data Calculations of cumulative tree photosynthesis
respiration and dry weight accumulation and daily photosynthesis and fruit carbon demand and
supply were examined to better understand fruit weight and yield responses suggested by the
model
3
2 Methods and materials
21 Evaluation of lsquoMaluSimrsquo
The MaluSim model is a simplified dry matter production model that relies primarily on temperature
and radiation inputs to predict carbohydrate accumulation (Lakso and Johnson 1990 Lakso 1992
Lakso et al 2001 Lakso et al 2006) The model is written in STELLA and consequently can be easily
modified by users (Zibordi 2010) It has been shown to behave realistically in a number of apple
growing regions and in response to factors such as short-term low light (Lakso et al 2001) The
model operates on a daily time step at the tree scale and balances carbohydrate supply against
demand for a lsquostandardrsquo tree Parameters associated with a lsquostandardrsquo tree (eg dates of key
phenological events number of fruit per tree tree spacing length of growing season shoot and spur
numbers) can be modified in the model Required data are summarised in Table 1
Table 1 Required datasets for MaluSim calibration
Dataset
Model inputs Site parameters Tree and row spacing
Latitude
Weather
Maximum and minimum daily air temperature Total daily solar radiation
Phenology
Date of budburst and harvest
Vegetative growth
Shoot and spur number or canopy radiation interception
Reproductive sinks Fruit number per tree (at harvest) Model outputs Average fruit fresh weight
211 Study site and collection of required datasets for model evaluation
Royal Gala apple was selected for evaluation of MaluSim as paired netted and non-netted sites were
available allowing investigation of any impact of netting on potential yield
The study orchard was a Royal Gala block located at Geoff Thompsonrsquos North Shepparton orchard
The selected block was predominantly covered by permanent netting but five rows on the eastern
side of the block were uncovered Tree age variety rootstock and most management activities did
not differ between netted and non-netted trees Data for evaluation of MaluSim were collected
during the 201213 season
Table 2 Description of the study site
Site Season Latitude Longitude Tree and Row spacing
Training System
Row Orientation
Shepparton 201213 -3633 14540 15 x 48 m Central-leader NNW-SSE
4
Weather stations were located within the netted and non-netted orchard areas to measure daily
maximum and minimum air temperature (degC HMP155 Vaisala Oyj Vantaa Finland) and daily total
solar radiation (MJm-2day-1 SPN1 Delta T Devices Ltd Cambridge UK) Data were logged (dataTaker
DT80M Thermo Fisher Scientific Inc Yokohama Japan) from 15 December 2012 at 1 minute
intervals during January and at 10 minute intervals at other times of the year Meteorological data
between budburst and 15 December 2012 were interpolated from relationships established for
radiation and temperature over the remainder of the season between a nearby weather station and
the onsite stations
Budburst day-of-year (DOY = 248) was estimated based on date of flowering at the site and date of
budburst of Gala at a nearby orchard Fruit number at harvest and canopy radiation interception
data were collected from 10 trees for both netted and non-netted sites Measurements for each of
the 10 trees were treated as repeat observations Fruit were colour picked over a two week period
in late-January and early-February Fruit number and fruit weight were recorded at each pick and
the mid-date of harvest (31 January 2013) was used as the harvest day-of-year in MaluSim Light
interception measurements at full canopy prior to harvest for each tree were taken in January
2013 A ceptometer was used to measure light interception in the morning at midday and in the
afternoon Daily light interception was calculated by averaging the morning midday and afternoon
measurements
212 Comparison of observed and predicted fruit weight 201213 season
Two parameterisations of MaluSim were run for analyses Firstly the default MaluSim values were
used (Netted-Default and NonNetted-Default) and secondly alternate values for shoot and spur
numbers were used to adjust the modelled light interception values to be similar to measured values
(Netted-Light Interception and NonNetted-Light Interception) To set the adjusted shoot and spur
numbers MaluSim was rerun for each tree with progressive adjustments to shoot and spur numbers
(maintaining the ratio of shoots to spurs to match that of the default values) until the predicted light
interception was within plusmn 2 of the observed light interception For both parameterisations the
netted and non-netted data were evaluated independently as well as combined Use of the default
maximum fruit growth rate was considered to be a reasonable assumption for an initial investigation
of model performance as Empire and Royal Gala are both early season apple varieties
22 Predictions of apple yield under a warmer climate
A future scenario of a +2 degC increase in maximum and minimum daily temperatures was investigated
for netted and non-netted orchards by inputting solar radiation data and adjusted air temperature
data (+ 2 degC) from 201213 to MaluSim with other (site phenology and tree) parameters
standardised Site and phenology inputs were unchanged from those used in the initial model
evaluation (section 21) Default shoot and spur numbers (194 and 343 respectively) were used
Crop load (fruit number per tree) was varied from 25 to 450 to ensure any lack of response to
changed climate conditions was not due to sink-limited yield restrictions
Fruit weight predictions for 201213 were compared with predictions using the +2 degC scenario
Cumulative tree photosynthesis respiration and dry weight accumulation and daily photosynthesis
and fruit carbon demand and supply were examined to better understand fruit weight (yield)
responses suggested by the model
5
3 Results
31 Evaluation of lsquoMaluSimrsquo
The results using default parameters of MaluSim tended to overestimate fruit weight compared with
observed fruit weight (Figure 1A) Combining both the netted and non-netted results RMSE was 39 g
which equates to a 28 error in estimating mean fruit weight (Table 3) Using the default
parameters the predicted fruit weights for the Netted site were more accurate than those for the
Non-Netted site RMSE 14 and 36 g (9 and 29 of mean fruit weight) respectively (Table 3)
Figure 1 MaluSim predicted and observed mean fruit weight (fresh weight in grams) for netted and non-
netted trees in 20122013 A) MaluSim fruit weight predictions using default shoot and spur number inputs B)
MaluSIm fruit weight predictions using adjusted shoot and spur numbers
100
120
140
160
180
200
100 120 140 160 180 200
Mo
del
led
Fru
it W
eigh
t (g
)
Observed Fruit Weight (g)
A
Netted-Default
NonNetted-Default
100
120
140
160
180
200
100 120 140 160 180 200
Mo
del
led
Fru
it W
eigh
t (g
)
Observed Fruit Weight (g)
B
Netted-Light Interception
NonNetted-Light Interception
6
Table 3 Statistics of MaluSim predicted and observed fruit weight at Royal Gala Netted and NonNetted sites using default shoot and spur numbers (Default) and adjusted shoot and spur numbers to align light interception values in the model with measured values
Site Coefficient p-value R2 RMSE (g)
Netted-Default 020 047 14
NonNetted-Default 005 092 36
All-Default 013 035 39
Netted-Light Interception 098 lt001 046 8
NonNetted-Light Interception -008 086 21
All-Light Interception 039 002 NA 22
linear model intercept was not significant statistics are for analysis omitting the intercept
The model predictions using parameterised adjustments of shoot and spur numbers were improved
for both the netted and non-netted trees (Figure 1 and Table 3) For the combined data RMSE was
improved to 22 g or 16 of the mean fruit weight MaluSim better predicted fruit weight for the
netted trees with RMSE of 8 g or 5 of the mean fruit weight In comparison predictions for the
non-netted trees yield RMSE of 21 g or 17 of mean fruit weight
32 Predictions of apple yield under a warmer climate
Potential fruit weight was predicted using MaluSim for two main scenarios
1 201213 Measured daily maximum and minimum air temperatures from the 201213
season with a range of crop loads for netted and non-netted Royal Gala orchards in north
Victoria
2 + 2 degC Adjusted air temperatures (201213 temperatures + 2 degC) with a range of crop loads
for netted and non-netted Royal Gala orchards in north Victoria
321 Weather inputs
Total solar radiation was 20 lower under netting than in the non-netted site Daily maximum air
temperature varied slightly between netted and non-netted sites with a tendency on hot days for
maximum air temperature under netting to be less than the non-netted site Prior analysis of
weather data showed that air temperature was similar at netted and non-netted sites (Milestone
Report 2 McClymont and Goodwin 2013 McClymont et al 2013)
Table 4 Summary of measured weather inputs at netted and non-netted sites during the 201213 season Max
AT = maximum air temperature Min AT = minimum air temperature Daily Rad = total daily solar radiation
Netted Non-netted
Max AT (degC)
Min AT (degC)
Daily Rad (MJm-2day-1)
Max AT (degC) Min AT (degC)
Daily Rad (MJm-2day-1)
Ave (plusmn st dev) 265 (plusmn 67) 95 (plusmn 45) 197 (plusmn 67) 272 (plusmn 67) 95 (plusmn 45) 244 (plusmn 82)
Max 418 213 282 428 214 349
Min 130 -03 27 135 -03 34
7
322 MaluSim calculation of photosynthesis respiration and dry matter accumulation
MaluSim calculates daily photosynthesis based on canopy interception of daily solar radiation with
adjustments to photosynthetic rate dependent on air temperature (Darbyshire and McClymont
2016) Over the period from budburst to harvest similar leaf area and canopy light interception
were generated by MaluSim for each scenario with only slight differences between netted and non-
netted sites and no differences for differing crop loads (Table 5) Leaf area development was more
rapid under the + 2 degC scenario than the 201213 scenario (data not shown)
Table 5 Leaf area and canopy light interception predicted at harvest by MaluSim under 201213 (201213
season air temperature data) and + 2 degC (201213 season temperatures + 2 degC) scenarios at netted (Net) and
non-netted (NN) sites
Scenario Leaf area (m2) Light interception () Net NN Net NN
201213 109 110 419 420 + 2 degC 110 110 421 420
Over the budburst to harvest period cumulative photosynthesis was effectively unchanged by
increased air temperatures (+ 2 degC scenario) and was approximately 10 lower at the netted site
than the non-netted site (Table 6) However daily photosynthesis during the first 70 ndash 75 days of the
season was greater under the + 2 degC scenario than the 201213 scenario (Figure 2) After this time
daily photosynthesis tended to be greater under the 201213 scenario than the + 2 degC scenario
(Figure 2)
Table 6 Photosynthesis respiration and dry matter accumulation between budburst and harvest predicted by
MaluSim under 201213 (201213 season air temperature data) and + 2 degC (201213 season temperatures + 2
degC) scenarios at netted (Net) and non-netted (NN) sites with a range of crop loads
201213 + 2 degC
Crop load (fruittree)
Photosynthesis (g CO2)
Respiration (g CO2)
Dry Matter Photosynthesis (g CO2)
Respiration (g CO2)
Dry Matter
Net NN Net NN Net NN Net NN Net NN Net NN
25
12637 13875
2220 2291 1805 1846
12758 13867
2730 2793 1804 1843 50 2256 2328 2252 2302 2774 2840 2294 2338 75 2291 2365 2693 2758 2816 2885 2756 2821 100 2325 2402 3117 3201 2858 2929 3208 3289 150 2392 2472 3928 4047 2938 3014 4023 4139 207 2462 2549 4707 4882 3020 3104 4751 4937 250 2510 2601 5162 5403 3073 3163 5111 5371 300 2557 2655 5525 5846 3126 3221 5396 5708 350 2597 2702 5775 6157 3169 3272 5562 5923 450 2659 2776 6039 6506 3237 3352 5759 6182
Average number of fruit per tree observed in 20122013
8
Figure 2 Daily photosynthesis (g CO2day) between budburst and harvest under measured 201213
temperature conditions (201213) and with a 2 degC temperature increase (+2 degC) for A) non-netted (NN) and B)
netted (Net) Royal Gala trees
MaluSim calculates daily respiration by an exponential relationship dependent on air temperature
and scaling for the size of plant parts (Darbyshire and McClymont 2016) Over the budburst to
harvest period cumulative respiration was approximately 20 greater in response to increased air
temperature (+ 2 degC scenario Table 6) Respiration was slightly lower at the netted site than the
non-netted site for 201213 (3 ndash 4 lower depending on crop load) and + 2 degC (2 ndash 3 lower)
scenarios Respiration increased with increasing crop load due to increased total respiration by
greater numbers of fruit
Dry matter accumulation is a function of demand of plant parts for photosynthate and supply
(photosynthesis - respiration) Predictably dry matter accumulation increased with increasing fruit
number as more lsquosinksrsquo were able to utilise produced photosynthates Similarly greater
photosynthate production at non-netted sites (compared to netted sites) enabled greater dry matter
production despite slightly higher respiration Response of dry matter accumulation to increased air
temperatures varied depending on crop load Dry matter production was similar or higher under the
+ 2 degC scenario when fruit number was 250 or less and lower when fruit number was 300 or more
9
323 MaluSim prediction of fruit weight and daily balance of fruit CO2 supply and demand
MaluSim partitions dry matter between plant parts (shoots fruits wood and roots) The amount of
dry matter partitioned to fruits determines fruit weight Demand by the different plant parts for
photosynthates varies through the season For example demand by shoots for photosynthates
increases rapidly from the start of season peaking after approximately one month and then
decreasing until shoot growth ceases Whereas fruit demand for photosynthates is low early in the
season and increases steadily mid-season until a peak potential growth rate is reached prior to
harvest Under excess carbon supply circumstances each growing part is allocated its full demand of
dry matter When photosynthate supply is limited the growing parts compete for resources The
ldquostrengthrdquo of each growing part to compete differs with shoots the strongest followed by fruit wood
and roots Under limited supply conditions dry matter allocated to fruit is less than the demand to
grow at maximum potential
For the 201213 and +2 degC scenarios predictions of fruit weight fell as fruit number per tree
increased (Figure 3A) but yield (fruit weight x fruit number) continued to increase (Figure 3B) over
the range of modelled crop load (25 to 450 fruit per tree) For crop loads between 25 and 100 fruit
per tree there was little change in predicted fruit weight with increasing crop load suggesting that
yield was predominantly sink-limited (ie potential supply of photosynthate to fruit was greater than
fruit demand) At higher crop loads (150 fruit per tree and greater) fruit weight began to decline
steadily indicating that at least on some days fruit growth was source-limited (ie supply of
photosynthate was not meeting fruit demand) Yield began to plateau at a crop load of
approximately 300 fruit per tree For both 201213 and +2 degC scenarios predicted fruit weights and
yields were lower for the netted site than the non-netted (Figure 3) These differences were
primarily due to decreased radiation under netting leading to decreased photosynthate production
For netted and non-netted sites MaluSim predicted a slight increase in fruit weight and yield with a
+2 degC increase in temperature at low crop loads (lt 250 fruit per tree Figure 3) However at higher
crop loads increased temperatures (+2 degC scenario) resulted in reductions in predicted fruit weights
and yields (for the given crop load Figure 3) from more respiration The largest predicted fruit
weight was 186 g (+2 degC scenario without netting and a crop load of 25 fruit per tree) The smallest
predicted fruit weight was 100 g (+2 degC scenario under netting with a crop load of 450 fruit per tree)
The highest yield predicted was 713 tha (201213 scenario without netting and a crop load of 450
fruit per tree)
10
Figure 3 Predicted A) fruit weight and B) yield under measured 201213 temperature conditions (201213)
and with a 2 degC temperature increase (+2 degC) for netted (Net) and non-netted (NN) Royal Gala trees
At low crop loads trees were able to match supply of photosynthates to fruits with demand on most
days (Figure 4) resulting in high fruit weights At higher crop loads supply of photosynthates to
fruits did not match demand on a greater number of days (due to increases in respiration) Figure 4
demonstrates how timing of availability of photosynthates and fruit growth patterns could influence
fruit growth and yield responses to warmer climate scenarios Fruit demand for photosynthates was
predicted to be higher under the +2 degC scenario than the 201213 scenario Although total
production of photosynthates was similar under the +2 degC and 201213 scenarios timing of
availability differed More photosynthate was available under the +2 degC scenario (than the 201213
scenario) early in the season coincident with low fruit demand (Figures 2 and 4) Later in the season
(when fruit demand for photosynthate was greater) the 201213 scenario tended to have more
photosynthate available (Figures 2 and 4)
11
Figure 4 Effects of increased temperatures and crop load on daily A) fruit demand for photosynthates B)
supply of photosynthates to fruit and C) the balance between supply and demand for photosynthates
12
4 Discussion and Conclusions
41 Evaluation of lsquoMaluSimrsquo
The predictive ability of MaluSim for Royal Gala was found to be adequate if adjustments to shoot
and spur numbers in line with observed light interception values are made MaluSim better
predicted fruit weight for netted compared with non-netted trees MaluSim tended towards
overestimating fruit weight for the non-netted trees (points above the line Figure 1) This is more
likely the result of management intervention than differential model performance between netted
and non-netted systems
Potential causes of the modelled overestimate for the non-netted trees may be due to tree stress
andor crop load management Considering tree stress evaporative demand and hence tree water
requirement is higher in non-netted orchards than netted orchards Non-netted trees may have
suffered transient water stress if either irrigation volume or frequency of irrigation events did not
match tree water requirements Noting that the orchard manager did supply more water to the non-
netted trees it is not clear whether this was sufficient to avoid tree stress
Regarding crop load management the non-netted site was thinned later than the netted site This
means that less carbon was available for the early-season growth of retained fruit on the non-netted
trees compared with the netted trees This could have contributed to slower fruit growth rates early
in the season in the non-netted trees than the netted and subsequent lower than predicted fruit
weight at harvest
MaluSim was designed as a model to evaluate potential yield That is expected yield assuming ideal
conditions Given the model design for potential yield not field yield it is reasonable to expect the
model will have a tendency to overestimate fruit weight in many commercial orchard situations
Furthermore evaluation of the performance of MaluSim needs to consider possible measurement
errors (ie errors in model inputs and observed parameters) use of the model outside the range of
parameters for which it was constructed and failure of observations to meet particular model
assumptions At a practical level the programing language used for MaluSim (Stella) limits use of
MaluSim for investigation of potential climate impacts Ideally such investigations would involve
modelling many iterations of simulated weather data to account for natural variability in climate and
use of multiple climate change models At present MaluSim requires the user to lsquorunrsquo each scenario
individually and manually extract data summaries making such detailed investigations impractical
These issues are discussed in greater detail by Darbyshire and McClymont (2016) who concluded
that positive validation of MaluSim under Australian conditions was not achieved based on poor
prediction of yield by MaluSim for Royal Gala and Cripps Pink at multiple sites in Australia However
performance of MaluSim in predicting fruit weight of Royal Gala trees at the North Shepparton site
with adjustment for light interception and consideration of environment and management impacts
supported use of the model for preliminary investigation of influences of climate change on
potential yield
13
42 Predictions of apple yield under a warmer climate
The following points consider the main findings of modelling potential yield under a warmer climate
and factors that could modulate yield response or improve model performance are discussed
- The predicted impact of increased temperatures (+ 2 degC) on yield was minor under the
conditions modelled in this investigation (-16 to +13 tha) dependent on crop load and
presence or absence of netting)
- Given that growers are most likely operating in the medium to high crop load range yield of
Royal Gala apples in north Victoria would be expected to remain unchanged or fall slightly
under a warmer climate This outcome is similar to that projected by Stockle et al (2010) for
apples grown in Washington State USA Although the response predicted by Stockle et al
appeared to be based on earlier harvest date Whereas yield loss in our modelling resulted
from source limitations during the fruit growth period
- Yield could be maintained by increasing crop load However at high crop loads additional
yield loss may occur due to increased downgrading or cullage of small fruit as average fruit
weight falls Avoidance of such additional losses would require either adjustment of market
expectations regarding fruit size or improved crop management to decrease variability in
fruit size
- Predicted yields were lower under netting than without netting Observed yields did not
support this finding and in the medium to long-term netting would offer greater yield
potential because of decreased occurrence of sunburn and hail damage It is noted that
netting reduced solar radiation by approximately 20 at the north Shepparton site
Modelling a greater reduction in solar radiation (30 ) lowered the crop load at which fruit
weight and yield began to fall in response to increased air temperatures (data not shown)
- The modelling undertaken in this investigation assumed no changes to budburst or harvest
date with increased temperatures Darbyshire et al (2016) reported that that most pome
fruit growing regions in Australia will have similar flowering phenology timing for 2030 whilst
progressive delays are expected for 2050 and 2090 Maturity and harvest could occur earlier
(Warrington et al 1999 Stockle et al 2010) or later (Iglesias et al 2002) under a warmer
climate with associated decreases or increases in yield potential and any shift will be
influenced by both physiological impacts of higher temperatures and market expectations
regarding fruit maturity and colour Colour development would most likely be impaired by
higher temperatures (Faragher 1983 Iglesias et al 2000 2002)
- This investigation focussed on the period from budburst to harvest Later season effects
including timing of leaf fall should be considered Accumulation of reserves during the
period from harvest to leaf fall will affect tree performance in the following season (Greer et
al 2002)
- Royal Gala is an early season variety and is picked in late January Late season varieties may
experience greater negative impacts of increased temperatures on accumulation of
photosynthates during the fruit growth period and subsequently yield
- A uniform increase in air temperature is unlikely across the season Use of a climate model
that predicts within season variation in temperatures could further emphasise disparities
between photosynthate supply and demand at particular growth stages
- The modelling undertaken in this investigation did not consider possible effects of elevated
atmospheric carbon dioxide (CO2) concentrations To include this aspect greater
14
understanding of apple tree functioning under both higher CO2 levels and higher
temperatures need to be understood Stockle et al (2010) estimated changes in apple yield
under future climate change with and without an enhancing effect of CO2 Without an
enhancing effect of CO2 apple yields were projected to fall slightly Increases in yield were
expected when increased CO2 was incorporated in modelling However notably they
commented that ldquoprojections for apples are more uncertain as tree fruit models are less
developed and previous studies are not availablerdquo
15
References
Darbyshire R and McClymont L 2016 Technical Report Assessing the potential yield model
lsquoMalusimrsquo Milestone Report 63 PICCC Project 440 Crossing the threshold adaptation tipping
points for Australian fruit trees
Darbyshire R Webb L Goodwin I and Barlow S 2013 Impact of future warming on winter chilling
in Australia International Journal of Biometeorology 57355ndash366
Faragher JD 1983 Temperature regulation of anthocyanin accumulation in apple skin J
Experimental Botany 34(10) 1291ndash1298
Greer DH Wunsche JN and Halligan EA 2002 Influence of postharvest temperatures on leaf gas
exchange carbohydrate reserves and allocations subsequent budbreak and fruit yield of Braeburn
apple (Malus domestica) trees New Zealand J Crop Hort Sci 30 175ndash186
Iglesias I Graell J Echeverria G and Vendrell M 2000 Orchard cooling with overtree sprinkler
irrigation to improve fruit color of lsquoDeliciousrsquo apples HortScience 35(7) 1207ndash1208
Iglesias I Salvia J Torguet L and Cabuacutes C 2002 Orchard cooling with overtree microsprinkler
irrigation to improve fruit colour and quality of lsquoTopred Deliciousrsquo apples Scientia Hort 93 39ndash51
Lakso AN 1992 The simplified dry matter production model for apple estimation of canopy
photosynthesis in discontinuous canopies Acta Hort 313 45ndash51
Lakso AN Greene DW and Palmer JW 2006 Improvements on an apple carbon balance
model Acta Hort 707 57ndash61
Lakso A and Johnson RS 1990 A simplified dry matter production model for apple using automatic
programming simulation software Acta Hort 276 141ndash148
Lakso AN White MD and Tustin DS 2001 Simulation modeling of the effects of short and
long-term climatic variations on carbon balance of apple trees Acta Hort 557 473ndash480
Putland D Deuter P Hayman P Hetherington S Middleton S Nidumolu U Nimmo P Thomas D
Wilkie J Williams D 2011 The apple amp pear industryrsquos response to climate change and climate
variability a desktop study Growcom Fortitude Valley QLD Australia
McClymont L and Goodwin I 2013 Understanding apple and pear production systems in a changing
climate Milestone 2 Progress report on Vic phenology data and the effects of netting on fruit
temperature AP12029
McClymont L Goodwin I and Sessions W 2013 Net benefits ndash the sun protection factor in 2050
Australian Fruitgrower July 28ndash31
Stockle CO Nelson RL Higgins S Brunner J Grove G Boydston R Whiting M and Kruger C 2010
Assessment of climate change impact on Eastern Washington agriculture Clim Change 102(1-2)
77ndash102
Warrington IJ Fulton TA Halligan EA and de Silva HN 1999 Apple fruit growth and maturity are
affected by early season temperatures J Amer Soc Hort Sci 124(5) 468ndash477
Zibordi M 2010 Crop load control in apple via shading exploring the potential of carbon
unbalances to manage fruit growth and tree performance PhD dissertation Universitaacute di
Bologna
Grower workshops ndash AP12029 Apples and pears in a changing climate 1
Understanding apples and pears in a changing climate overview
of the grower workshops
Jenny Treeby Department of Economic Development Jobs Transport and Resources
September 2016
Grower Workshops 2013
Three technical working group meetings were conducted during August (Queensland)
September (South Australia) and October (Victoria) involving 32 growers industry
representatives and service providers The purpose of the technical working groups was to
present relevant local research outcomes as well as identifying gaps in growersrsquo knowledge
around climate change that could be addressed at a later date
The technical working group locations and members were identified using input from DAFWA
DAFF QLD DEPI VIC Lenswood Co-op and APAL South Australia was suggested by APAL
Each technical working group was based on an already existing group and the meetings
scheduled to coincide with other meetings to gain maximum feedback and avoid meeting
fatigue and poor attendance
Format and information provided was tailored to the specific needs of the group based on
input from local industry development officers APAL and the research organisations involved
The Queensland working group session was structured around a presentation of the current
project as well as a questionnaire and the South Australian and Victorian sessions started
with an interactive presentation about chill and in the case of Victoria fruit temperature
followed by a 60-90 minute facilitated QampA session
Outcomes from the workshops varied depending on the location
- The Queensland workshop discussions focussed on the impact of extreme weather with
most growers agreeing that climate change and climate variability impacted on their
orchards lack of rain rain at the wrong time erratic bloom poor colour development
and hail damage all scored highly in the survey
- In South Australia the discussions centred on inconsistency in the reporting of chill
depending on the model used chill hours chill units or chill portions The lack of
conversion factors was mentioned Only the dynamic model which uses chill portions
predicted a high chill season based on local data This was consistent with the short
intensive flowering observed Post-session feedback was positive with suggestions made
to repeat the working group next year albeit to a larger audience as part of the national
workshop series
- In Victoria discussions also focussed on chilling models and temperature thresholds that
lead to heat-related fruit damage in the Goulburn Valley Again informal feedback was
Grower workshops ndash AP12029 Apples and pears in a changing climate 2
positive with the suggestion made to communicate more results as they become
available through emails or workshops
Grower workshops 2014
Three workshops for apple and pear producers were conducted in production regions in
collaboration with apple and pear growersrsquo organisations during May (Victoria) July
(Queensland) and September (Western Australia) Nearly 50 producers industry
representatives and service providers participated The purpose of the workshops was to
present an outline of the project to present relevant local research outcomes and to review
the last season to identify production trends and issues share lessons learnt and identify
future trends and issues
Nearly 50 producers industry representatives and service providers participated in this round
of workshops The purpose of these workshops was to present research outcomes from the
first three years of the project such as the modelled predictions for the regions and relevant
local climate change impacts as well as adaptation strategies and to seek feedback on the
past season perceived climate change risks and the project itself Each interactive workshop
was tailored to the individual needs of the three targeted groups through either general
presentations on climate change research intensive training in the Climate Change Risk
Management Matrix andor site specific presentations on modelled chill requirements and
heat damage projections
Additionally in order to reach a much wider pome fruit audience project outcomes were
highlighted at the 2015 National Horticulture Convention of APAL and AUSVEG where team
members across all participating research organisations were present at the Horticulture
Centre of Excellence stand to answer growersrsquo questions and get feedback on the project
Grower workshops 2015
Three workshops were held in apple and pear production regions to communicate up-to-date
research outcomes such as the model predictions from the last three years to industry in a
consistent manner as well as gathering information about the past season perceived climate
change risks and feedback on the project to 48 growers
Each workshop was held in conjunction with or as part of an industry forummeetingtour to
attract as many growers as possible and to avoid meeting fatigue
The workshops were held in Applethorpe (QLD) in conjunction with the Perth Hills Orchard
Improvement Group during their QLD study tour in July as a stand-alone Climate Change
Risk Management Matrix session with QLD growers in Applethorpe in July and a climate
change workshop in Bilpin (NSW) in September
Grower workshops ndash AP12029 Apples and pears in a changing climate 3
Seventeen growers from the Perth Hills Orchard Improvement Group visited the Applethorpe
Research Station as part of their QLD study tour As the central part of their half day tour of
the research station a climate change workshop event was held to discuss some of the
outcomes from current research and in particular some of the issues facing the growers in the
Perth Hills district This region was not part of the WA grower workshop event held in Manjimup
in 2014
During the workshop presentations were made by Heidi Parkes Peter Nimmo and Allan
McWaters about the climate change research project currently underway including the modelled
predictions management of QFF (one concern under a changed climate) and new apple
varieties better suited to different disease and climate pressures
The Climate Change Risk Management Matrix is a tool developed by DAF QLD to address
uncertainty by identifying the impacts risk and vulnerability associated with climate change
and adaptive responses Identifying and analysing risks and opportunities using this risk
management approach can help to plan responses to climate variability and climate change
and thus enable growers to be proactive and more effective in adapting to future uncertainty
This tool has been adapted to be used not only in grains and meat and wool production but
also in horticulture
As New South Wales has not been included in former National Roadshow tours and based on
interest shown from the Sydney Basin area Kevin Dodds from NSW DPI and an interested
grower in Bilpin Bill Shields were contacted and a workshop organised The interactive
workshop on a growerrsquos property with about 25 participants entailed a tailored winter chill
presentation by Rebecca Darbyshire (The University of Melbourne) introduction to climate
change impacts on pome fruit and research outcomes from the project such as the latest
dormancy breaker research from QLD by Heidi Parkes as well as modelled predictions for the
region plus a field walk The session was organised facilitated and evaluated by Kevin Dodds
(NSW DPI) and Jenny Treeby (DEDJTR VIC) In the evaluation growers pinpointed earlier
bud burst flowering and maturity as well as sunburn as their main climate change related
challenges The workshop gave them a better understanding of the complexity of factors
involved in budburst and flowering and the chill portions calculator was seen as an excellent
toolincentive to collect and utilise their own data better
In order to reach a much wider pome fruit audience project outcomes were displayed at the
Horticulture Centre of Excellence stand at the 2015 National Horticulture Convention A
poster six state specific chill fliers using the chill portions model the HIN (wwwhincomau)
project webpage and the chill calculator were used as a static display Additionally time was
made to meet the project researchers at the stand during program breaks an option which
was taken up by quite a few growers who felt that this was a great opportunity to have a
chat with a scientist
Grower workshops ndash AP12029 Apples and pears in a changing climate 4
Lessons learnt
1 Having a core team responsible for communication (Heidi Parkes DAF QLD) Susie
Murphy-White (DAFF WA) Rebecca Darbyshire (UoM) and Jenny Treeby (DEDJTR
VIC) ensured timely relevant and consistent information was being made available to
growers at the workshops and the APAL conference This also emphasised a multi-
state approach (including New South Wales) and added importance to the project
outputs and resulted in messages such as in New South Wales where the presenters
were thanked for their presentations and the effort made to come to that location
2 Presenting locally relevant data using model predictions established within the
projects by researchers resulted in the grower audience being engaged and feeling
confident to ask questions and provide feedback and lessons learnt in their orchard
3 Utilising well established grower groups such as in Queensland and New South Wales
as well as local well respected extension officers (Front Line Advisors) such as Clinton
McGrath (DAF QLD) and Kevin Dodds (NSW DPI) ensured ease of facilitation
4 Evaluation of workshops is still suffering from low return rates of around 50 of even
short evaluation forms possibly due to a lack of understanding of the importance of
this form of feedback Interactive keypad technology as employed in the last round
seems to have had a better return rate (possibly due to novelty factor) and will be
contemplated for further projects
5 Knowledge gaps identified as a result of these workshops include
varietal chill requirements for existing and new varieties
lack of understanding of the difference between chill hours units and portions
and the use of chill portions as the most accurate measure of winter chill available
adaptation strategies to heat stress
does soil temperature influence endo and or ecto dormancy
do phenology models based on meteorological data adequately represent buds
within a tree
is the current knowledge of pome fruit physiology extensive enough to be able to
accurately predict winter chill accumulation processes
there is a strong focus on the potential impact of extreme events on the industry
under future climate scenarios with less understanding about the potential
impacts of more subtle increases in temperature
need for more accurate in-season and longer term climate forecasting to enable
growers to take actions that reduce climate risk
Resources
httpwwwhincomauprojectsapple-and-pear-production-in-a-changing-climate
Grower workshops ndash AP12029 Apples and pears in a changing climate 5
httpwwwhincomauprojectswinter-chill-and-fruit-trees
regional-chill-accumulation-victoria
regional-chill-accumulation-queensland
regional-chill-accumulation-for-new-south-wales
regional-chill-accumulation-for-south-australia
regional-chill-accumulation-for-tasmania
regional-chill-accumulation-for-western-australia
Blogs
httpwwwhincomauprojectsapple-and-pear-production-in-a-changing-climateexplore-
your-regional-climate
- AP12029 cover sheet
-

AP12029
This project has been funded by Horticulture Innovation Australia Limited using the Apple and Pear Industry levy and funds from the Australian Government Additional financial support was contributed by Department of Agriculture and Fisheries (Qld) Department of Economic Development Jobs Transport and Resources (Vic) Department of Agriculture and Food Western Australia Pomewest (WA) and University of Tasmania
Hort Innovation makes no representations and expressly disclaims all warranties (to the extent permitted by law) about the accuracy completeness or currency of information in Understanding apple and pear production systems in a changing climate
Reliance on any information provided by Hort Innovation is entirely at your own risk Hort Innovation is not responsible for and will not be liable for any loss damage claim expense cost (including legal costs) or other liability arising in any way (including from Hort Innovation or any other personrsquos negligence or otherwise) from your use or non-use of Understanding apple and pear production systems in a changing climate or from reliance on information contained in the material or that Hort Innovation provides to you by any other means
ISBN 978-0-7341-4336-5
Published and distributed by Hort Innovation Level 8 1 Chifley Square Sydney NSW 2000 Tel (02) 8295 2300 Fax (02) 8295 2399 copy Copyright 2017
2
Contents
Summary 5
Keywords 6
Key personnel 6
Introduction 7
Project objectives 7
General methodology 9
Research methodology 9
Development and extension methodology 11
Outputs 13
Grower publications 13
Grower workshops 13
Websites and tools 13
Technical working group meetings 13
Industry surveys 14
Industry articles 14
Industry conferences 15
Stakeholder and grower engagement 16
Reports 17
Media items 17
Project web pages factsheets and online information 18
Scientific conferences 19
Datasets 19
Post-graduate student projects 19
Outcomes 20
Historical climate trends and future scenarios 20
Impacts of warming autumn winter and spring temperatures on flowering and options for adaptation
24
Impacts of increased frequency of extreme heat days on fruit quality and options for adaptation 32
3
Impacts of warming temperatures on yield 37
Communication development and extension 37
Evaluation and Discussion 39
Measuring project impact 39
Effectiveness of project activities in delivering project outputs and achieving intended outcomes 40
Feedback on activities and quality and usefulness of project outputs 41
Key learnings 42
Recommendations 46
Industry 46
Extension and communications 47
Scientific 47
Scientific Refereed Publications 50
Intellectual PropertyCommercialisation 51
Acknowledgements 52
Appendices 53
References 54
Table of figures
Figure 1 Research sites were located in Applethorpe (Qld) Shepparton (Vic) Manjimup (WA) and
Huonville (Tas) Orange (NSW) and Mt Barker (SA) were included in the climate data analysis 12
Figure 2 Annual anomaly in accumulation of chill portions (1 Mar to 31 Aug) Anomalies are the
difference between the yearly value and a base period of 1981 to 2010 The black line is an 11-year
moving average 21
Figure 3 Annual anomaly in average number of days where maximum temperature exceeds 35deg C
Anomalies are expressed as the difference between the yearly value and a base period of 1981 to 2010
The black line is an 11-year moving average 22
Figure 4 Chill accumulation in Shepparton Applethorpe and Manjimup in 2012 to 2015 Number in
brackets is the total chill portions received up to 31 Aug 24
Figure 5 Green tip (green) and full bloom (pink) dates for apple cultivars in Applethorpe Shepparton and
Manjimup Data is the average of observations from 2012 to 2015 with bars indicating the confidence
interval 25
Figure 6 The Chill-Overlap Model for flowering in apple Cr is minimum chill required for flowering Co is
4
the maximum additional chill that will reduce the heat requirement Hr is the heat required when Co chill
is accumulated and Ho is the maximum possible heat requirement for flowering (Redrawn from
Darbyshire et al 2016) 28
Figure 7 Variable bud burst and flowering in Cripps Pink Manjimup spring 2014 30
Figure 8 Green tip first flower and full bloom in Gala apples treated with and without dormancy
breaking sprays Dormexreg Waikenreg and Erger in Huonville Applethorpe and Manjimup in 2015 31
Figure 9 Fruit surface temperature (degC) recordings and related air temperatures (degC) Necrosis and
browning fruit surface temperature thresholds represent 52 and 478 degC respectively Figure sourced
from Darbyshire et al 2015 33
Figure 10 Western Australian netting demonstration site at the Lyster Matijari Orchard Manjimup 36
Figure 11 Fruit surface temperature (FST) and air temperature measured in the black net white net and
no net rows at the Lyster Matijari orchard (Manjimup) from February to mid-March 2014 36
Table of tables
Table 1 Average chill portions (1 Mar to 31 Aug) for 2030 and 2050 using a minimum to medium
(RCP45) and worst (RCP85) case scenario The average is of 30 years with the lowest and highest chill
portions in brackets 23
Table 2 Chilling requirements of apple cultivars and a crab apple polliniser cultivar measured in chill
portions chill units and chill hours 27
Table 3 Average date of full bloom for lsquoCripps Pinkrsquo apple in 2030 and 2050 using a minimum to medium
(RCP45) and worst case scenario (RCP85) modelling approach 29
Table 4 Distribution of potential damage days in January for sites in Australiarsquos growing regions for 10th
50th and 90th percentiles of data Table sourced from Darbyshire et al 2015 33
Table 5 Average sunburn browning risk (percentage of days in the January to February period) for lsquoRoyal
Galarsquo apples grown at sites across Australia with and without netting 35
Table 6 Barriers to communication and extension around climate change adaptation 41
5
Summary The objective of this project was to reduce the vulnerability of the Australian apple and pear industry to
climate change by investigating the potential impacts of a changing climate on winter chill flowering
fruit sunburn and yield exploring the effects of adaptation such as netting and dormancy-breaking
products and developing and extending appropriate adaptive responses to industry The project used a
broad range of research and technology transfer activities encompassing field observational data
collection controlled environment experimentation biophysical modelling website development
communication and extension
Australia has undergone a consistent warming trend since 1910 however analysis of historical climates
undertaken in this project indicated that the experience of climate change has been different in each
pome fruit growing region For example milder pome fruit growing regions of Australia have experienced
a decline in annual winter chill accumulation since 1968 while the colder regions of Huonville and Orange
have not changed In modelling studies of future climate scenarios warmer locations were projected to
experience a reduction in winter chill of more than 20 by 2050 with a decline of less than 10 to 14
projected for the coldest production areas over the same period
Flowering observations from 2012 to 2015 indicated that low winter chill in Manjimup was associated with
greater variability in flowering dates between seasons cultivars and individual trees and irregular and protracted flowering across most apple cultivars relative to Applethorpe and Shepparton The variable
pattern of flowering observed in Manjimup was likely the result of mild winter conditions and inadequate
chilling for some cultivars Use of climate analogues and modelling analyses suggest that milder winter
growing regions of Australia are likely to experience symptoms of inadequate chilling with increasing
frequency in future years
Projections from the chill-overlap model for timing of full bloom in lsquoCripps Pinkrsquo apple in 2030 and 2050
projected an earlier full bloom date on average at high chill locations in 2050 and a later full bloom date
at the milder winter locations by 2030 with flowering dates delayed by more than a week in 2050 Trials
with dormancy-breaking sprays demonstrated that they are likely to be a viable adaptation tool for some
cultivars in lower winter chill years but matching cultivars with climate is the preferred adaptation option
Results from the climate modelling showed that by 2030 all pome fruit growing regions will experience
an increase in the average number of extreme heat days during the summer growing season Netting will
reduce the risk of sunburn damage as air temperature thresholds for damage of fruit under netting were
shown to be higher than thresholds for fruit without netting Findings from the Western Australian netting
demonstration site showed little difference in air temperature conditions winter chill or flowering dates
under the white netted black netted and non-netted orchard blocks Black and white netting were
equally effective in reducing fruit surface temperatures over the late summer period compared with the
no net apples
The project highlighted the need for detailed information to enable growers to match apple and pear
cultivars with suitable growing climates including matching chilling requirements with winter chill and
heat tolerance with summer temperatures Comprehensive guidelines on orchard practices for managing
extreme heat (including tree canopy structure use of evaporative cooling netting types plant growth
regulators and stress reduction chemicals) are also recommended
It is clear from the project outcomes that climate change will add significant variability into the pome fruit
production system with respect to flowering and fruit quality Australian growers are used to dealing with
some level of climate variability and it seems likely that impacts on flowering and fruit quality will be
within the range of grower experience up to around 2030 but that by 2050 growers will be operating
outside of current experience This will present challenges for the Australian industry in the consistency of
supply and in maintenance of the uniform orchard blocks
A series of recommendations were developed along with a list of significant research gaps to assist the
Australian apple and pear industry reduce the risks associated with climate variability and climate change
6
Keywords Climate change scenarios climate change impact climate change adaptation dormancy winter chill
flowering extreme heat sunburn browning netting
Key personnel
Department of Agriculture and Fisheries Queensland
Heidi Parkes (project leader) Neil White Osi Tabing Peter Nimmo Allan McWaters John Wilkie and
Clinton McGrath
Department of Economic Development Jobs Transport and Resources Victoria
Ian Goodwin Jenny Treeby Lexie McClymont and Susanna Turpin
Pomewest Western Australia
Susie MurphyWhite
Department of Agriculture and Food Western Australia
Lisa Starkie and Martine Combret
Tasmanian Institute of Agriculture University of Tasmania
Sally Bound
University of Melbourne
Rebecca Darbyshire (leader of the Federal Department of Agriculture funded project lsquoCrossing the
threshold adaptation tipping points for Australian fruit treesrsquo and project collaborator)
7
Introduction Australiarsquos climate has warmed since 1910 and is likely to continue warming with more hot days and
fewer cold days expected in the future (State of the climate 2016) Research has broadly identified a
range of potential impacts of climate change on the productivity and profitability of the Australian apple
and pear industry including inadequate winter chilling increased fruit sunburn and changes to the upper
limit of pome fruit productivity (Darbyshire et al 2013b Putland et al 2011) However the nature and
timing of these potential impacts in different growing regions across Australia remains unclear
Understanding climate change impacts is essential for the timely implementation of appropriate
adaptation strategies (Cobon et al 2009)
Future changes in climate are predicted to result in reduced winter chilling in many apple and pear
growing regions of Australia (Darbyshire et al 2013b Hennessy et al 1995) It is not yet clear what the
impact of this will be on the timing and quality of bud dormancy release and flowering in commercial
pome fruit cultivars and therefore the potential impacts on productivity Advancement in flowering with
increased historical temperature has been observed in temperate fruit trees globally (Legave et al
2013) however effects of recent warming on flowering in Australian pome trees are less obvious
(Darbyshire et al 2013a) Options for adaptation to lower winter chill include appropriate cultivar
selection and the use of plant growth regulators however current understanding around cultivar chilling
requirements and the use of dormancy-breaking sprays to compensate for a lack of winter chill is poor
The risk of fruit sunburn damage is likely to increase under future climates and associated rising summer
temperatures Predictions regarding changes to sun damage risk and evaluation of adaptation options are
therefore important for future planning In Australia apple growers currently estimate typical losses to
vary from 6 to 30 depending on season and fruit cultivar (Lolicato 2011)
Netting has been identified as a potential climate change adaptation strategy to reduce fruit exposure to
solar radiation and hence reduce sunburn damage while also providing protection from hail events
Practical questions remain on the use of hail netting particularly in warm growing regions including the
effect of different types of netting (weave density and colour) on temperature fruit quality and yield The
effectiveness of netting as an adaptation strategy to reduce the risk of sunburn browning under predicted
climate change is also unknown
Project objectives The broad objective was to reduce the vulnerability of the Australian apple and pear industry to climate
change through 1) investigation of the overarching research question lsquoWhat are the potential impacts of
a changing climate on apple and pear production in Australia and how can the industry adapt to minimize
the risksrsquo and 2) developing and extending appropriate adaptive responses to industry
Specific objectives for the research component of the project were to
1 Develop climate change scenarios for pome fruit growing regions of Australia in 2030 and 2050
including the likely impact of climate change on winter chill and extreme heat
2 Understand how changes in autumn winter and spring temperatures might impact the timing
and quality of flowering in cultivars of apple and pear
8
3 Identify adaptations to manage any negative effects of climate change on flowering
4 Understand how changes in the frequency of extreme heat days might impact on the incidence of
sunburn in pome fruit and the effectiveness of netting as an adaptation strategy
5 Understand how different colours of netting impact on the orchard environment fruit yield and
quality
6 Understand how the changing climate might impact the yield potential of apples
The development and extension components of the project were targeted at the Australian apple and
pear industry Target groups were apple and pear growers industry consultants Apple and Pear Australia
Limited (APAL) and temperate fruit tree researchers Specific objectives of this component were to
1 Facilitate greater understanding of how the climate is likely to change by 2030 and 2050 in apple
and pear growing regions of Australia how this might impact on apple and pear production and
potential adaptation strategies to reduce the associated risks
2 Increase knowledge and skills to enable informed decision-making around climate change
adaptation and orchard investment and planning based on scientific evidence
3 Build a connected and collaborative approach between research partners funding bodies
industry and growers around managing and adapting to climate change
9
General methodology The objectives were investigated through a broad range of research and technology transfer activities
encompassing field observational data collection controlled environment experimentation biophysical
modelling website development written and oral communication and extension The project combined
research of immediate adaptive responses to current climate risks with long-term climate change impacts
and adaptation The general methodological approach and associated activities undertaken for each of
the stated project objectives are described in this section Details of specific methods are given in the
appropriate appendices as indicated in the text
Research methodology
The approach was to validate and refine models of flowering time fruit surface temperature and yield
potential and use them in conjunction with regional climate projections to model the effects of the
changing climate on apple and pear production systems and the effectiveness of specific adaptation
strategies Climate analogues were also investigated as an alternative approach to understanding climate
change impacts and adaptation
1 Develop climate change scenarios for pome fruit growing regions of Australia in 2030 and
2050 including the likely impact of climate change on winter chill and extreme heat
Future climate scenarios were constructed for two representative concentration pathways (RCPs) RCP45
(minimum to medium case scenario) and RCP85 (worst case scenario) to represent a plausible range of
future climates (Appendix 1) RCPs are greenhouse gas concentration trajectories adopted by the
Intergovernmental Panel on Climate Change in its fifth Assessment Report in 2014 (a detailed description
of these is given in Appendix 1) Scenarios were developed for 2030 and 2050 to support the mid to long-
term orchard decision-making process Trees planted in 2017 will be in their 13th leaf in 2030 the height
of production and therefore planting decisions made now will impact orchard profitability in 2030
Climate projections were not made beyond 2050 due the high degree of climate uncertainty associated
with long-term projections
Climate scenarios were expressed in terms of relevant horticultural metrics (chill portions and number of
sunburn browning risk days) rather than simply as mean temperature changes to enable better
understanding of how warming temperatures might impact pome fruit production
Winter chill was calculated in chill portions using the Dynamic Model (Erez et al 1990 Fishman et al
1987) This is the current lsquobest-practicersquo model and has been shown to perform better than other models
for calculating winter chill particularly in mild winter climates such as Australia (Luedeling et al 2011)
2 Understand how changes in winter and spring temperatures might impact the timing and
quality of flowering in cultivars of apple and pear
Detailed baseline data sets for temperature bud burst and flowering were collected from three
climatically distinct pome fruit growing regions of Australia (Applethorpe Queensland Manjimup
Western Australia Shepparton Victoria Figure 1) for apple and pear cultivars and their pollinisers from
2012 to 2015 Phenology observation and collection methodology was standardised across locations
making this dataset unique in Australia
The data set was used to assess the variation in bud burst and flowering time across locations seasons
10
and cultivars (Appendix 2) and to validate a phenology model (chill overlap model (Darbyshire et al
2016)) for prediction of flowering time in apple now and under future climates (Appendix 1)
Climate analogue analysis involves a detailed comparison between locations where the current climate of
one location is similar to the projected future climate of the location of interest This approach was
investigated using Stanthorpe as a case study to predict impacts of climate change on pome fruit
flowering in Stanthorpe and to identify possible methods for adaptation (Appendix 3)
3 Identify adaptations to manage any negative effects of climate change on flowering
Forced bud experiments using controlled environment conditions were undertaken to determine cultivar
chilling requirements for use by industry in selection of suitable cultivars for different winter chill
climates Methods for collecting bud burst and flowering records were developed for growers to use for
assessing cultivar performance in their local climate (Treeby et al 2017a)
A one-year trial was conducted in three locations (Applethorpe Queensland Manjimup Western
Australia Huonville Tasmania) to determine the efficacy of using dormancy-breaking sprays in Gala as
an adaptation to low winter chill years (Appendix 4)
Potential adaptations were also identified through the capture of grower experiences at national grower
workshops and industry conferences
4 Understand how changes in the frequency of extreme heat days might impact on the incidence
of sunburn in pome fruit and the effectiveness of netting as an adaptation strategy
Two methodological approaches were taken using weather and fruit surface temperature data collected
from two adjacent lsquoRoyal Galarsquo sites in Shepparton Victoria one netted and one non-netted site The first
approach was to determine minimum air temperature thresholds for lsquoRoyal Galarsquo apples grown with and
without net with potential to lead to sunburn damage under current climates (Appendix 5) Once
established these minimum air temperature thresholds were used to investigate the frequency of days
exceeding these threshold air temperatures in current and future climates The future sunburn risk and
the effectiveness of netting in reducing this risk was determined for growing locations around Australia
for 2030 and 2050 (Appendix 1 and 7)
The second approach was to validate the thermodynamic Smart-Sinclair model for prediction of fruit
surface temperature (Appendix 6)
5 Understand how different colours of netting impact on the orchard environment fruit yield
and quality
A netting demonstration site was established over a block of lsquoCripps Pinkrsquo trees in Manjimup Western
Australia to expand on results from existing studies on the effects of netting on air temperature relative
humidity wind and solar radiation (Darbyshire et al 2015 Middleton et al 2002) and to compare the
effects of black and white net on the orchard environment flowering fruit yield and quality (Appendix 8)
6 Understand how the changing climate might impact the yield potential of apples
An apple physiological model MaluSim (Lakso et al 1990) was used to understand the effects of
predicted climate change on net carbon exchange of apples and the upper limit of apple production (yield
11
potential) The model was evaluated for lsquoRoyal Galarsquo with regard to prediction of apple yield under
current Australian conditions in netted and non-netted orchard sites and yield was predicted under
warmer future climate conditions (Appendix 9)
Development and extension methodology
Extension and research activities were coordinated and conducted side-by-side to encourage the flow of
information between growers industry representatives extension officers and researchers throughout
the project with industry feedback continuously informing the research
The technology transfer activities undertaken as part of the extension component are outlined under each
of the following objectives
1 Facilitate greater understanding of how the climate is likely to change by 2030 and 2050 in
apple and pear growing regions of Australia how this might impact on apple and pear
production and potential adaptation strategies to reduce the associated risks
Multiple activities were undertaken to provide information to and obtain feedback from the apple and
pear industry A review of available climate change information relevant to Australian apple and pear
growers was conducted at the project start to identify information needs A grower survey was
performed to gain insight into grower attitudes and knowledge in regards to climate change and its
impacts
Communication and extension was undertaken throughout the project and included two years of national
grower workshops (Appendix 10) regular publications in industry magazines and websites presentations
at industry conferences field days and seminars dedicated project web pages (APAL and Horticulture
Industry Network (HIN)) and general media items
Climate change information specific to Australiarsquos apple and pear industry was published in a series of
three grower publications at the conclusion of the project to communicate key project findings as well as
important climate change information for the industry generally (Treeby et al 2017a Treeby et al
2017b White et al 2017)
2 Increase knowledge and skills to enable informed decision making around climate change
adaptation and orchard investment and planning based on scientific evidence
The grower publications and winter chill website were designed to provide practical information to
growers for use in every day decision making and for long-term strategic planning
3 Build a connected and collaborative approach between research partners funders industry
and growers around managing and adapting to climate change
Relationships between stakeholders were established maintained and developed through
- Regular project teleconferences and face-to-face meetings
- Close links with the University of Melbourne project lsquoCrossing the threshold adaptation
tipping points for Australian fruit treesrsquo undertaken within the Primary Industries Climate
12
Challenges Centre (PICCC)1
- Meetings with APAL staff at the head office in Melbourne at conferences or via phone hook-
up
- Informal links with other apple and pear industry research programs such as the PIPS
program as well as with researchers and industry representatives from other horticultural
industries for example cherries and almonds
- Establishment of the netting demonstration site in Western Australia
- Data collection trials conducted on grower properties which provided avenues for informal
engagement growers
- Involvement and participation in industry conferences and events
- Organisation and participation in national grower workshops
- Involvement with the Climate Change Research Strategy for Primary Industries (CCRSPI)
- Involvement of post-graduate students and work experience students in project activities
Figure 1 Research sites were located in Applethorpe (Qld) Shepparton (Vic) Manjimup
(WA) and Huonville (Tas) Orange (NSW) and Mt Barker (SA) were included in the climate
data analysis
1 httpwwwpicccorgauresearchproject440
13
Outputs
Grower publications
Treeby J Goodwin I MurphyWhite S Darbyshire R White N McClymont L Richards S
Measham P Bound S and Parkes H 2017 Winter chill and flowering ndash what is there to know
Department of Agriculture and Fisheries Queensland
Treeby J Goodwin I MurphyWhite S Darbyshire R White N McClymont L Richards S Webb
L Erwin T and Parkes H 2017 Netting for heat ndash what is there to know Department of
Agriculture and Fisheries Queensland
White N Parkes H and Treeby J 2017 Future climates in pome fruit orchards ndash what is there to
know Department of Agriculture and Fisheries Queensland
Grower workshops
Heidi Parkes Jenny Treeby and Ian Goodwin presented ldquoclimate change impacts and adaptation research
for the pome fruit industryrdquo at Fruit Grower Victoriarsquos end of season review Mooroopna Vic 12
May 2014 httpwwwhincomauassociationsfruit-growersfgv-end-of-season-review
httpwwwhincomauresourcesextreme-heat-powerpoint-may-2014
httpwwwhincomauresourcesapples-and-pears-in-a-changing-climate-powerpoint-may2014
Heidi Parkes Neil White and Clinton McGrath presented an ldquoapple climate change workshoprdquo at
Applethorpe Research Facility Qld 23 July 2014
Heidi Parkes and Susie MurphyWhite presented ldquoapples and pears in a changing climaterdquo at an orchard
walk in Manjimup WA 1 October 2014 httpwwwhincomauassociationsapples-and-
pearspit-stop-wa-for-the-national-roadshow
Heidi Parkes presented a ldquowinter chill and floweringrdquo workshop for the Perth Hills Orchard Improvement
Group at Applethorpe Research Facility Qld 31 July 2015
Clinton McGrath Heidi Parkes and Neil White presented a climate change risk management matrix
workshop in Thulimbah Qld 5 August 2015
Heidi Parkes Rebecca Darbyshire and Jenny Treeby presented a ldquowinter chilling and climate adaptation
workshoprdquo in Bilpin NSW 16 September 2015
Websites and tools
White N and Parkes H 2017 Winter chill and growing degree day website an interactive tool to
calculate and interpret local chill and growing degree day accumulation httpshort-
scienceshinyappsioChillCalculator
Technical working group meetings
Queensland technical working group meeting facilitated by Clinton McGrath Applethorpe Research
Facility Qld 20 August 2013
South Australian technical working group meeting facilitated by Jenny Treeby and Paul James (Lenswood
Co-op) Lenswood SA April 2013
14
Victorian technical working group meeting facilitated by Jenny Treeby and Michael Crisera (Fruit Growers
Victoria) Shepparton Vic October 2013
Industry surveys
A nation-wide survey of apple and pear growers was developed and coordinated by Jenny Treeby (based
on input from DEDJTRrsquos Service Innovations branch) to ascertain growersrsquo attitudes perceptions
and knowledge of climate change 2013 httpswwwsurveymonkeycomsQTG7QKH
A nation-wide survey of apple and pear growers was developed and coordinated by Heidi Parkes Jenny
Treeby and Susie MurphyWhite to gauge grower understanding and perceptions of winter chill
2015
Industry articles
Calderon M 2014 Bud burst in lsquoWilliamsrsquo Pears highly variable Australian Fruitgrower 8(8) 32
Darbyshire R and Parkes H 2014 Whatrsquos the blooming difference Australian Fruitgrower 8(10) 30
Darbyshire R and Parkes H 2015 Get in the chill zone Australian Tree Crop Winter edition pp 14
Darbyshire R Goodwin I and MurphyWhite S 2016 New understandings to better predict apple
flowering- introducing the chill overlap model Australian Fruitgrower JuneJuly edition
httpapalorgauaustralian-fruitgrower-june-july-2016
McClymont L Goodwin I and Sessions W 2013 Net benefits- the sun protection factor in 2050
Australian Fruitgrower 7(6) 28-31
McClymont L Goodwin I and Sessions W 2013 Effectiveness of netting in reducing sun damage Part
I Tree Fruit August 5-8
McClymont L Goodwin I and Sessions W 2013 Effectiveness of netting in reducing sun damage Part
II Tree Fruit September 8-11
MurphyWhite S 2014 Netting the benefits of a changing climate Australian Fruitgrower 8(5) 21
httpapalorgaunetting-benefits-changing-climate
MurphyWhite S 2014 Manjimup apple update- netting quality results for south west apples South-West
AgMemo August issue 5 httpswwwagricwagovaunewsletterssouth-west-agmemo-august-
2014-issue-5page=02C3smartpaging_toc_p3_s0_h2
MurphyWhite S 2014 Blooms affected by winter chill South-West AgMemo October issue 5
httpswwwagricwagovaunewsletterssouth-west-agmemo-october-2014-issue-
5page=02C2smartpaging_toc_p2_s0_h2
MurphyWhite S 2015 Investigating fruit surface temperature in apples South West AgMemo February
issue 1 httpswwwagricwagovaunewsletterssouth-west-agmemo-february-2015-issue-
1page=08smartpaging_toc_p8_s0_h2
MurphyWhite S Prince R and Starkie L 2016 Black or white netting Is there a difference Or just a
preferencehellip WA Grower Autumn 68 - 70 httppomewestnetauwp-
contentuploadsnewslettersWAGROWERAutumn16_POMEWESTPDF
MurphyWhite S Prince R and Starkie L 2016 Black or white netting Is there a difference Or just a
preferencehellip VegetablesWA Autumn 71 - 73 httpwwwvegetableswacomauwa-growers-
magazine
15
MurphyWhite S Prince R and Starkie L 20152016 Black or white netting which is best Australian
Fruitgrower 9(11) 22 ndash 24 httpapalorgaublack-or-white-netting-which-is-best
Parkes H 2015 Producing Apples and Pears in a changing climate Australian Tree Crop Winter edition
26
Parkes H 20152016 Sharing ideas to climate change-proof orchards Australian Fruitgrower 9(11) 12
httpapalorgausharing-ideas-to-climate-change-proof-orchards
Parkes H MurphyWhite S and Bound S 2016 Dormancy-breaking sprays for low chill years
Australian Fruitgrower AugSept httpapalorgaudormancy-breaking-sprays
Parkes H MurphyWhite S and Bound S 2016 Dormancy-breaking sprays for low chill years (Part 1
and 2) Tree Fruit AugSept httpwwwtreefruitcomauorchardcrop-growth-
managementitem712-dormancy-breaking-sprays-for-low-chill-years
httpwwwtreefruitcomauorchardcrop-growth-managementitem723-dormancy-breaking-
sprays-for-low-chill-years-part-2
Parkes H White N and Darbyshire R 2015 Winter chill how did 2014 compare with previous years
Australian Fruitgrower 9(3) 32 ndash 33 httpapalorgauwinter-chill-how-did-2014-compare-with-
previous-years
Prince R and MurphyWhite S 2015 Netting trial results in WA Australian Fruitgrower 9(9) 26 - 29
httpapalorgaunetting-trial-results-in-wa
Thomson G McClymont L Goodwin I 2014 Sunburn protection Part 1 Adapt and limit apple sunburn
during heatwaves Tree Fruit November 5ndash9
Thomson G McClymont L Goodwin I 2014 Part 2 Orchard design tree training and pruning for
apple sunburn reduction Tree Fruit December 3ndash6
Thomson G McCaskill M McClymont L Goodwin I 2015 Part 3 Fruit protection with spray-on
products shade-netting or evaporative cooling can help reduce sunburn during heatwaves Tree
Fruit January 3ndash5
Thomson G McCaskill M McClymont L Goodwin I 2015 Part 4 Fruit protection with spray-on
products shade-netting or evaporative cooling can help reduce sunburn during heatwaves Tree
Fruit February-March 3ndash4
Thomson G McCaskill M McClymont L Goodwin I 2015 Part 5 Fruit protection with spray-on
products shade-netting or evaporative cooling can help reduce sunburn during heatwaves Tree
Fruit April 3ndash4
Treeby J 2014 Apple and pears weathering the climate Australian Fruitgrower 8(2) 18
Treeby J 2014 Research Roadshows on coping with extreme weather Australian Fruitgrower 8(10) 11
Wilkie J Combret M Goodwin I McGrath C McClymont L Middleton S Nimmo P Starkie L
Tabing O and Treeby J 2013 The apple and pear climate change research program Australian
Fruitgrower 7(6) 20-23
Industry conferences
MurphyWhite S 2015 Netting the benefits of climate change APAL Speed Updating Day National
Horticulture Convention Gold Coast 25 June httpapalorgauresearch-development-
extensionprojectsresearch-reviews
16
Parkes H 2015 Towards understanding bud burst and flowering in a changing climate approaches to
research and extension APAL Speed Updating Day National Horticulture Convention Gold Coast
25 June httpapalorgauresearch-development-extensionprojectsresearch-reviews
Parkes H 2016 Reducing vulnerability to a changing climate in Australian temperate fruit tree industries
CCRSPI 2016 conference- striving for climate resilience Sydney 27-28 April
httpwwwccrspinetaureducing-vulnerabilities-temperature-extremes
Parkes H 2016 Winter chill how much is enough for profitable yields APAL Industry Updating Day
National Horticulture Convention Gold Coast 23 June httpapalorgauwp-contentuploads5-
Heidi-Parkes_APAL_Industry_Updating_2016_withnotescompressedpdf
Wilkie J 2013 Understanding apple and pear production systems in a changing climate APAL speed
updating day Apple and Pear Industry Conference Gold Coast 17 July
Stakeholder and grower engagement
Lexie McClymont 2013 Outcomes from the fruit temperature and yield modelling research Fruit Growers
Victoria Young Growerrsquos group (Goulburn Valley) Shepparton Vic 24 October
Lexie McClymont 2013 Climate change and Horticulture - Impacts and Adaptation Meeting with DEPI
Deputy Secretary James Flintoft Tatura Vic 15 November
Heidi Parkes 2013 Understanding apple and pear production systems in a changing climate DAFFQ
regional stakeholders meeting Applethorpe Qld 26 November
Ian Goodwin 2014 Apple and pear productivity Reducing weather losses Meeting with DEPI Deputy
Secretary James Flintoft Tatura Vic 7 February
Susie MurphyWhite 2014 Extreme temperatures and sunburn Netting demonstration site orchard walk
Manjimup WA 23 April
Heidi Parkes 2014 Climate change impacts and adaptations for horticultural industries EE Muirs Pty Ltd
growerrsquos evening Stanthorpe Qld 23 October
Ian Goodwin 2015 Climate change project progression DEDJTR Victoria group Rural Development and
Transition Policy Tatura Vic 3 March
Heidi Parkes 2015 Approaches and challenges to studying climate change impacts on apple production
Applethorpe Research Facility open day Applethorpe Qld 1 April
Susie MurphyWhite 2015 Dynamic chill portions for pome fruit in WA Donnybrook Apple Festival WA 4
ndash 5 April
Jenny Treeby Susie MurphyWhite Rebecca Darbyshire and Heidi Parkes 2015 Winter chill poster- A bit
chilly Climate change project stand as part of the DEDJTR booth National Horticulture
Convention Gold Coast 25 - 27 June
Heidi Parkes 2015 Current research in the area of apple production in a changing climate Applethorpe
Research Facility Qld 24 November
Heidi Parkes 2015 Current and future research into climate change impacts and adaptation for the
Horticulture industry DAF South Regional Leaders Team and the Director General Applethorpe
Research Facility Qld 25 November
17
Susie MurphyWhite 2016 Dormancy-breaking spray trial Pomewest Growers Meeting Manjimup WA
17 May
Ian Goodwin 2016 Dealing with seasonal climate risk and extreme weather events Regional Innovation
Forum Tatura Vic 18 May httpwwwhincomauassociationshorticulture-centre-of-
excellenceregional-innovation-forum
Heidi Parkes 2016 Winter chill website Stanthorpe Apple Growerrsquos meeting Applethorpe Research
Facility Qld 26 May
Reports
Darbyshire R and McClymont L 2016 Assessing the potential yield model lsquoMaluSimrsquo The University of
Melbourne and Department of Economic Development Jobs Transport and Resources 27 pp
MurphyWhite S Prince R and Starkie L 2016 Western Australian apple netting demonstration site
Pomewest 24 pp
Parkes H and White N 2016 Flowering in pome fruit trees across Australia implications of a changing
climate Department of Agriculture and Fisheries Queensland 21 pp
Parkes H and White N 2016 A climate analogue approach to understanding the impact of climate
change on flowering in Australian temperate fruit trees Department of Agriculture and Fisheries
Queensland 17 pp
Parkes H MurphyWhite S and Bound S 2016 Dormancy-breaking sprays for low winter chill in
apples Department of Agriculture and Fisheries Queensland Pomewest University of Tasmania
28 pp
Treeby J 2013 Review of current apple and pear climate change grower information Department of
Economic Development Jobs Transport and Resources 6 pp
httpwwwhincomauresourcesreview-of-current-apple-and-pear-climate-change-information-
for-growers
Treeby J 2016 Understanding apples and pears in a changing climate overview of the grower
workshops Department of Economic Development Jobs Transport and Resources 5 pp
White N 2016 Analysis of historical and future climate and the production of pome fruit Department of
Agriculture and Fisheries Queensland 29 pp
Media items
ldquoNew Development Officer to continue research into climate changerdquo was published in AgMemo South
West Agricultural Region February 2014 Issue 1 The article introduced Susie Murphy White to
the West Australian growers httpswwwagricwagovaunewsletterssouth-west-agmemo-
2014-issue-1page=02C1smartpaging_toc_p1_s0_h2
Susie MurphyWhite 14 March 2014 Interviewed by ABC Rural on the Manjimup netting trial ldquoStates first
trial tests heat impactsrdquo httpwwwabcnetaunews2014-03-17apple-netting-trial5326112
Susie MurphyWhite 25 March 2014 Interviewed by GWN7 rural news on the use of netting to reduce
sunburn
18
lsquoClimate threats studiedrsquo was published in The Border Post and Warwick Daily News Southern Downs
Qld 16 December 2014 Heidi Parkes was interviewed for the article
httpwwwruralweeklycomaunewsclimate-threats-studied2485263
lsquoA model for the futurersquo was published in the Bush Telegraph Southern Downs Qld 9 April 2015 The
article featured a summary of the presentation given by Heidi Parkes on the climate change
research program at the Applethorpe Research Facility open day
Horticulture Innovation Australia media release 13 April 2015 Reducing the vulnerability of apple and
pear production to a changing climate
Heidi Parkes 21 April 2015 Interviewed by Australian Rural Communication Network on reducing the
vulnerability of apple and pear production to a changing climate
lsquoClimate research crucial for apple and pear growers in Australiarsquo was published by The Weekly Times
Vic 8 July 2015 Heidi Parkes was interviewed for the article following the Speed Updating Day
presentation at the National Horticulture Convention
httpwwwweeklytimesnowcomauagribusinesshorticultureclimate-research-crucial-for-apple-
and-pear-growers-in-australiastory-fnker6g8-1227431799897
Susie MurphyWhite 18 August 2015 Interviewed by ABC local radio morning rural report on the progress
of winter chill in the South West of WA
Heidi Parkes 28 October 2015 Interviewed by the ABC Country hour Tasmania during the Greenhouse
2015 conference in Hobart on the potential impacts of warming climate on Australiarsquos apple and
pear industry
Heidi Parkes 23 June 2016 Interviewed live by the ABC Country hour during the 2016 National
Horticulture Convention on potential impacts of warming climate on Australiarsquos apple and pear
industry
Project web pages factsheets and online information
Horticulture Industry Network project page httpwwwhincomauprojectsapple-and-pear-production-
in-a-changing-climate
Apple and Pear Australia Limited project page httpapalorgauresearch-development-
extensionprojectsclimate-change
Regional chill factsheets httpwwwhincomauregional-chill-accumulation-victoria
httpwwwhincomauregional-chill-accumulation-queensland
httpwwwhincomauregional-chill-accumulation-for-new-south-wales
httpwwwhincomauregional-chill-accumulation-for-south-australia
httpwwwhincomauregional-chill-accumulation-for-tasmania
httpwwwhincomauregional-chill-accumulation-for-western-australia
Jenny Treeby 15 May 2015 httpwwwhincomauprojectsapple-and-pear-production-in-a-changing-
climateexplore-your-regional-climate
Heidi Parkes 4 November 2014 httpwwwhincomauprojectsapple-and-pear-production-in-a-
changing-climatewill-extreme-october-heat-impact-on-fruit-size
Heidi Parkes 6 December 2013 httpapalorgaua-discussion-on-dormancy-and-why-its-worth-
thinking-about-in-early-december
19
Scientific conferences
Parkes HA Tabing O McClymont L Combret M and Wilkie JD 2014 Variation in the Flowering
Phenology of Apple and Pear in Australia 29th International Horticulture Congress Brisbane
Convention and Exhibition Centre 17-22 August (Oral presentation)
Parkes HA White NA MurphyWhite S 2015 Understanding the impact of climate change on flowering
in Australian temperate fruit trees Greenhouse 2015 Wrest Point conference center Hobart
Tasmania 26 ndash 30 October (Oral presentation)
Datasets
Spring phenology observations for pome-fruit cultivars in Australia 2013 ndash 2015 Available at
httpsdataqldgovau
Post-graduate student projects
Marco Calderon 2014 Orcharding the future the influence of temperature on pome fruit flowering
across Australia University of Melbourne Masterrsquos Degree
20
Outcomes
Historical climate trends and future scenarios
Historical trends in average temperatures winter chill and heat days
(Appendix 1)
Australia has undergone a consistent warming trend since 1910 (State of the climate 2016) In pome
fruit growing regions across Australia this changing climate has been experienced in different ways at the
local level Changes in average minimum and maximum temperatures experienced in autumnwinter and
springsummer since 1968 differ between regions (appendix 1) The milder growing regions of
Applethorpe Manjimup and Mt Barker have experienced a decline in the number of chill portions over this
period while Shepparton has seen a small reduction in winter chill and the colder regions of Huonville
and Orange have not changed (Figure 2) Increases in the number of extreme heat days have been
experienced in Shepparton and Mt Barker while the last seven years in Manjimup have been above the
long-term average (Figure 3)
21
Applethorpe
Shepparton
Manjimup Huonville
Orange Mount Barker
Figure 2 Annual anomaly in accumulation of chill portions (1 Mar to 31 Aug) Anomalies are the difference
between the yearly value and a base period of 1981 to 2010 The black line is an 11-year moving average
22
Applethorpe
Shepparton
Manjimup
Huonville
Orange Mount Barker
Figure 3 Annual anomaly in average number of days where maximum temperature exceeds 35deg C
Anomalies are expressed as the difference between the yearly value and a base period of 1981 to 2010
The black line is an 11-year moving average
23
Climate projections for average winter chill and heat days
(Appendix 1)
Climate projections were developed for minimum to medium (RCP45) and worst case (RCP85) scenarios
for 2030 and 2050 for each of the pome fruit growing regions Winter chill accumulation declined at all
sites in 2030 and 2050 under both scenarios The greatest declines were in the milder growing regions of
Applethorpe and Manjimup (greater than 20 in 2050) and the smallest declines in Huonville and Orange
(around 5 in 2030 and less than 15 in 2050) (Table 1)
By 2050 growers will be managing orchards under a different climatic environment For example in
Applethorpe a low chill year is currently around 60 chill portions This will be a good year in 2050 and
the worst years will be outside the existing range of experience
Table 1 Average chill portions (1 Mar to 31 Aug) for 2030 and 2050 using a minimum to
medium (RCP45) and worst (RCP85) case scenario The average is of 30 years with the
lowest and highest chill portions in brackets
Average chill portions Present
2030 2050
RCP45 RCP85 RCP45 RCP85
Applethorpe 72 (62-83) 63 (48-75) 60 (44-73) 56 (41-69) 51 (36-65)
Shepparton 84 (73-93) 75 (63-85) 74 (62-86) 71 (58-81) 67 (57-79)
Manjimup 67 (55-82) 57 (43-76) 55 (42-75) 50 (36-72) 47 (33-68)
Huonville 105 (94-113) 98 (81-112) 97 (78-110) 93 (74-105) 90 (71-104)
Orange 100 (90-110) 94 (85-104) 93 (82-101) 90 (81-99) 87 (78-94)
Mount Barker 84 (67-93) 74 (55-88) 73 (53-88) 70 (53-84) 65 (47-80)
The climate projections for 2030 and 2050 show that all pome fruit regions across Australia can expect to
experience an increase in the number of extreme heat days during the growing season with the greatest
impacts likely to be in regions such as Shepparton with hot summer climates (data not shown) Impacts
on the risk of sunburn browning in apples are described in the section lsquoPotential impact of an increased
frequency in extreme heat events on the incidence of sunburn and the effectiveness of netting as an
adaptation strategyrsquo on p34
24
Impacts of warming autumn winter and spring temperatures on flowering and
options for adaptation
Understanding relationships between temperature and flowering
1 Variation in flowering of pome fruit trees across Australia
(Appendix 2)
Differences in the pattern of chill accumulation (Figure 4) were accompanied by variability in the timing
and pattern of green tip and flowering between locations and between years (Figure 5) Green tip and full
bloom dates were more variable between years cultivars and individual trees in Manjimup compared with
Applethorpe and Shepparton and trees consistently displayed a more protracted pattern of flowering
(Figure 5) Delayed and uneven flowering are symptoms of inadequate chill and it is likely that the
observed patterns of bud burst and flowering in Manjimup were in response to the mild winter conditions
experienced in that location in 2012 to 2014
Figure 4 Chill accumulation in Shepparton Applethorpe and Manjimup in 2012 to 2015
Number in brackets is the total chill portions received up to 31 Aug
25
Figure 5 Green tip (green) and full bloom (pink) dates for apple cultivars in Applethorpe
Shepparton and Manjimup Data is the average of observations from 2012 to 2015 with bars
indicating the confidence interval
Applethorpe
Shepparton
Manjimup
26
2 Chilling requirements
A collection of apple chilling requirements in chill portions chill units and chill hours were produced for
the mild climatic region of Applethorpe Queensland Australia (Table 2)
The chilling requirements measured were higher across a number of cultivars when compared with
previously published thresholds (Ghariani et al 1994 Hauagge et al 1991) For example Darbyshire et
al (2016) estimated a chilling requirement of 34 chill portions for lsquoCripps Pinkrsquo notably lower than the
chilling requirement of 73 chill portions calculated here Comparison of chilling requirements between
studies is problematic due to the use of vastly different methodologies for threshold determination
(Dennis 2003) Research to understand the genetic basis of progression through the phases of dormancy
is needed to enable accurate definition of cultivar chilling requirements (Cooke et al 2012)
Regardless of these gaps in knowledge the chilling requirements measured using the forced bud
methodology can be used to put apple cultivars into groups with low (lsquoCripps Redrsquo lsquoManchurianrsquo crab
apple) medium (lsquoRS103-110rsquo lsquoGranny Smithrsquo lsquoCripps Pinkrsquo lsquoKaleirsquo) and higher chilling requirements
(lsquoGalaxyrsquo Fujirsquo lsquoHi-Earlyrsquo) These groupings provide practical benefit to industry by enabling growers to
make more informed cultivar and pollinizer choices at planting particularly when considering projected
changes to future climate
A draft manuscript titled lsquochilling requirements of apple varieties grown in mild Australian winter
conditionsrsquo details this work and has been prepared for submission to the journal HortScience
27
Table 2 Chilling requirements of apple cultivars and a crab apple polliniser cultivar measured in chill portions chill units and chill
hours
Cultivar Year Dynamic (CP) meanplusmnsd CV() Utah (CU) meanplusmnsd CV() Chill Hours (CH) meanplusmnsd CV()
Cripps Red 2014 549 57plusmn29 51 947 976plusmn403 41 694 662plusmn445 67
2015 59
1004
631
Manchurian 2014 585 61plusmn36 59 1016 1031plusmn216 21 748 724plusmn332 46
2015 636
10465
701
RS103-110 2014 687 708plusmn29 41 1207 1186plusmn293 25 845 838plusmn106 13
2015 728
11655
830
Granny Smith 2014 729 728plusmn01 01 1312 1239plusmn1036 84 875 852plusmn318 37
2015 728
11655
830
Cripps Pink 2014 729 733plusmn06 09 1312 1242plusmn99 8 875 856plusmn276 32
2015 738
1172
836
Kalei 2014 729 755plusmn37 49 1305 1275plusmn421 33 875 883plusmn113 13
2015 781
12455
891
Galaxy 2014 795 767plusmn4 53 1429 1300plusmn1817 14 950 893plusmn806 9
2015 738
1172
836
Fuji 2014 76 77plusmn15 19 1368 1307plusmn866 66 924 908plusmn233 26
2015 781
12455
891
Hi Early 2014 76 77plusmn15 19 1368 1307plusmn866 66 924 908plusmn233 26
2015 781
12455
891
lowest coefficient of variation CV() across the three chill models
28
3 Modelling to predict the timing of flowering in apple under current climates
(Appendix 1)
The relationship between winter chill heat and flowering was described mathematically in the chill-
overlap model of flowering developed for almonds (Pope et al 2014) (Figure 6) This model assumes
that there is a minimum amount of chill and a minimum amount of heat required for flowering The more
chill that is received over and above the minimum chilling requirement the lower the amount of heat that
is needed In this way the timing of flowering is determined by the complex relationship between the
amount of chill and heat that is received during dormancy
The baseline flowering and temperature datasets collected as part of this project were used to
successfully validate the chill-overlap model for lsquoCripps Pinkrsquo apple (Darbyshire et al 2016) enabling
projections of climate change impacts on the timing of flowering to be made (Table 3)
Figure 6 The Chill-Overlap Model for flowering in apple Cr is minimum chill required for
flowering Co is the maximum additional chill that will reduce the heat requirement Hr is the
heat required when Co chill is accumulated and Ho is the maximum possible heat
requirement for flowering (Redrawn from Darbyshire et al 2016)
29
Potential impacts of warming temperatures on flowering
1 Modelling to predict changes in the timing of apple flowering under future
climates
(Appendix 1)
The chill-overlap model for lsquoCripps Pinkrsquo apple was used to predict changes in the timing of full bloom in
growing regions across Australia in 2030 and 2050 In Orange a high chill location the average date of
full bloom was advanced (earlier bloom) in 2050 by 4 to 5 days The milder winter locations showed a
delayed full bloom date in 2030 and 2050 with the greatest impact felt at Manjimup
Changes in flowering time for lsquoCripps Pinkrsquo in 2030 are likely to be within the current range of grower
experience However by 2050 flowering times are predicted to be considerably later in milder winter
regions To determine how flowering time in other apple cultivars will be impacted by climate change the
chill-overlap model would require validation with flowering data from each cultivar
Table 3 Average date of full bloom for lsquoCripps Pinkrsquo apple in 2030 and 2050 using a
minimum to medium (RCP45) and worst case scenario (RCP85) modelling approach
Average Predicted Full Bloom date Present
2030
2050
RCP45 RCP85 RCP45 RCP85 Applethorpe 4 Oct 7 Oct 9 Oct 12 Oct 16 Oct
Shepparton 30 Sep 3 Oct 3 Oct 5 Oct 6 Oct
Manjimup 16 Oct 22 Oct 25 Oct 30 Oct 2 Nov
Huonville 26 Sep 27 Sep 29 Sep 29 Sep 29 Sep
Orange 2 Oct 28 Sep 28 Sep 28 Sep 27 Sep
Mount Barker 1 Oct 5 Oct 4 Oct 6 Oct 8 Oct
2 Using climate analogues
(Appendix 3)
The climate analogue analysis using Manjimup as an analogue for Stanthorpe in 2030 indicated that
growers in the Stanthorpe region were likely to experience a more variable and protracted pattern of
flowering across many apple cultivars by 2030 (Figure 7) but without any clear negative impact on
productivity Use of dormancy-breaking sprays was identified as a possible adaptation with no obvious
requirement to shift to different cultivars or tree crop species at this stage
Results from this case study indicated that the climate analogue approach can provide valuable
information around potential climate change impacts and adaptation strategies for horticultural industries
30
This finding comes with a note of caution however Climate and plant physiology are complex systems
and the information gained from using climate analogues should be considered in a broad context with
care taken to the detail
Figure 7 Variable bud burst and flowering in Cripps Pink Manjimup spring 2014
Options for adaptation management of flowering under future climates
1 Cultivar selection mdash matching cultivars with appropriate winter climates
Ideally apple and pear cultivars should be matched with suitable growing climates which in this case
refers to selection of cultivars with chilling requirements that are comfortably below the minimum winter
chill received in a particular location (Atkinson et al 2013 Luedeling et al 2015) However there are
multiple factors that influence cultivar choice (for example market opportunities) and uncertainty around
determination of cultivar chilling requirements make this somewhat difficult
The collection of flowering time observations undertaken as part of this study indicated that more
detailed monitoring and recording of green tip and flowering dates across the orchard would enable
growers to identify cultivars that are performing well in the local climate and those that are not getting
enough chilling from season-to-season (providing early indication of cultivars that might be impacted by
warmer winters in the future changing climate) These records could also be used to identify subtle shifts
in the timing of flowering between cultivars and their pollinisers New sensing technologies will enable
simpler collection of large amounts of data in the future (Panda et al 2010)
31
2 Dormancy-breaking sprays as an adaption to inadequate winter chill
(Appendix 4)
The dormancy-breaking sprays assessed in this 2015-16 study were able to advance flowering time and
compact the flowering period in lsquoGalarsquo apple with differences observed between products and sites
(Figure 8) A more compact and uniform flowering period has been shown to have a number of benefits
including improved management of flowering pests and chemical thinning practices (Bound et al 2004
Theron 2013)
Despite the compaction of flowering there were no clear differences observed in fruit set yield or
variability of apple maturity in trees treated with dormancy-breaking sprays More work is required to test
the potential of these products to improve fruit quality and reduce the length of harvest Advances in
harvest timing were observed with the dormancy-breakers and generally reflected differences in
flowering dates The ability to manipulate harvest timing can be useful in situations where advantage can
be taken of a high-price market window
The results suggest that dormancy-breaking products are likely to be a viable adaptation tool for some
cultivars in lower winter chill years but the degree to which flowering can be managed with dormancy-
breakers as the climate continues to warm is yet to be determined
Figure 8 Green tip first flower and full bloom in Gala apples treated with and without
dormancy breaking sprays Dormexreg Waikentrade and Ergerreg in Huonville Applethorpe and
Manjimup in 2015
32
3 Changing cultural practices
(Appendices 2 and 3)
A review of the scientific literature undertaken as part of this project together with information gained
from personal communication with growers and industry suggest that irregular and protracted flowering
can be difficult to manage and will likely require changes in thinning practices (Bound et al 2004
Theron 2013) Determining an appropriate thinning program is likely to be challenging when buds are at
multiple stages of green tip and flowering on individual trees (Theron 2013) Fruitlets may vary more in
size and developmental stage and careful hand thinning will likely be required to optimise crop
uniformity (personal comm) Where uniformity cannot be achieved the greater spread of fruit maturity
at harvest may require greater effort to pick at the appropriate time (personal comm)
Impacts of increased frequency of extreme heat days on fruit quality and options for
adaptation
Understanding relationships between summer temperatures and the incidence of
sunburn under net and no net
1 Air temperature thresholds for sunburn damage
(Appendix 5)
Minimum air temperatures for potential sun damage were determined for lsquoRoyal Galarsquo apple in Australia
The air temperature thresholds were 341 and 387degC respectively for browning and necrosis for non-
netted fruit and 379degC for browning under netting (Figure 9)
When the air temperature thresholds were applied across southern Australia it was found that some
fruit-growing regions were more exposed to potential sun damage risk than others Cooler summer
regions (such as Huonville and Applethorpe) illustrated very little risk while warmer summer regions
(such as Shepparton) displayed a greater potential risk accompanied by substantial variability between
years (Table 4) Managing this variability in potential risk is important to maintain yield and quality
Air temperature thresholds can be used by growers as a guide for timing the use of overhead sprinklers
for evaporative cooling in efforts to minimize potential damage
33
Figure 9 Fruit surface temperature (degC) recordings and related air temperatures (degC)
Necrosis and browning fruit surface temperature thresholds represent 52 and 478 degC
respectively Figure sourced from Darbyshire et al 2015
Table 4 Distribution of potential damage days in January for sites in Australiarsquos growing
regions for 10th 50th and 90th percentiles of data Table sourced from Darbyshire et al
2015
Browning non-netted Browning netted Necrosis non-netted
Site 10th 50th 90th 10th 50th 90th 10th 50th 90th
Spreyton1 0 0 0 0 0 0 0 0 0
Huonville 0 0 1 0 0 0 0 0 0
Applethorpe 0 0 2 0 0 0 0 0 0
Batlow1 0 0 4 0 0 0 0 0 0
Yarra Valley1 0 2 5 0 0 1 0 0 1
Manjimup 0 3 5 0 0 2 0 0 1
Lenswood1 0 3 6 0 0 2 0 0 1
Young1 1 7 16 0 1 5 0 05 4
Shepparton 2 6 12 0 1 5 0 1 4
Donnybrook1 3 7 11 0 1 3 0 05 2 1additional locations included in this table were part of the Crossing the threshold adaptation tipping
points for Australian fruit trees project
2 Predicting fruit surface temperature from weather data using the
lsquothermodynamic Smart-Sinclairrsquo model
(Appendix 6)
The thermodynamic Smart-Sinclair model (Smart et al 1976) was tested on lsquoRoyal Galarsquo grown under
34
net and no net The optimised model produced was able to predict fruit surface temperature with a root
mean square error of 2 to 3degC The presence of netting reduced the median fruit surface temperatures by
15 to 20degC The mechanism for this netting effect was through the reduction of the intensity of the solar
beam by interception and scattering while still allowing sufficient air flow to enable transfer of heat from
the fruit surface to the air
This type of modelling can be used to understand processes and quantify the effects of various netting
structures on fruit surface temperature and sun damage risk However the thermodynamic fruit surface
temperature model cannot be used for predicting the effects of climate change due to the lack of reliable
projected solar radiation and wind speed data for future climates For applications such as assessing the
benefits of netting in Australiarsquos apple growing regions for a range of climate change scenarios the air
temperature threshold approach of Darbyshire et al 2015 described above is more appropriate
Potential impact of an increased frequency in extreme heat events on the incidence of
sunburn and the effectiveness of netting as an adaptation strategy
(Appendices 1 and 7)
Minimum air temperature thresholds for sunburn damage in lsquoRoyal Galarsquo apple grown with and without
net (Darbyshire et al 2015) were used to consider the risk of sunburn damage under future climates in
pome fruit growing regions of Australia and the effectiveness of netting to reduce this risk (Table 5)
Exposure to sunburn browning-risk was highly dependent on the geographical location Some locations
were found to maintain minimal sunburn browning-risk up to 2050 while others will potentially
experience the risk for a significant proportion of the JanuaryFebruary fruit growing period Shepparton
Mt Barker and Manjimup will be most adversely affected however the installation of over-tree netting
substantially reduced the impact of sunburn browning
Analysis of multiple locations enables the use of climate analogues (Whetton et al 2013) for impact and
adaptation assessments
35
Table 5 Average sunburn browning risk (percentage of days in the January to February
period) for lsquoRoyal Galarsquo apples grown at sites across Australia with and without netting
Sunburn browning risk classifications
5 gt 5 to 10 gt 10 to 20 gt 20 to 30 gt 30 to 50
Without Netting 2030 2050
Site Present RCP45 RCP85 RCP45 RCP85
Applethorpe 11 24 28 28 49
Shepparton 183 239 268 275 358
Manjimup 100 152 152 166 198
Huonville 24 34 38 45 42
Orange 24 38 44 37 84
Mt Barker 173 207 229 232 258
With Netting
2030 2050
Site Present RCP45 RCP85 RCP45 RCP85
Applethorpe 00 00 01 01 04
Shepparton 48 70 90 88 132
Manjimup 16 38 39 44 60
Huonville 03 06 10 12 11
Orange 01 01 01 01 07
Mt Barker 54 72 91 94 107
36
Black and white netting impacts on the orchard environment fruit yield and quality
(Appendix 8)
Observations from the Western Australian netting demonstration site (Figure 10) showed similar air
temperature conditions (including winter chill accumulation) under the netted and non-netted orchard
blocks There was a slight increase in humidity under net which was associated with a higher incidence of
pest and disease There were no differences in bud burst and full bloom dates between trees under
black white and no net
Fruit surface temperatures recorded in apples over the late summer period were higher in the non-netted
apples (Figure 11) Fruit size was similar between netted and non-netted blocks however fruit colour
management using reflective mulch was required under the nets
Figure 10 Western Australian netting demonstration site at the Lyster Matijari Orchard
Manjimup
Figure 11 Fruit surface temperature (FST) and air temperature measured in the black net
white net and no net rows at the Lyster Matijari orchard (Manjimup) from February to mid-
March 2014
37
Impacts of warming temperatures on yield
(Appendix 9)
Modelling potential yield in apple using Malusim
In a recent report Darbyshire and McClymont (2016) concluded that positive validation of MaluSim under
Australian conditions was not achieved based on poor prediction of yield by MaluSim for lsquoRoyal Galarsquo and
lsquoCripps Pinkrsquo at multiple sites in Australia However performance of MaluSim in predicting fruit weight of
lsquoRoyal Galarsquo trees at the North Shepparton site supported use of the model for preliminary investigation
of influences of climate change on potential yield as part of this project
Potential impacts of warming temperatures on yield in apple
Using Malusim the predicted impact of increased temperatures (+ 2degC) on yield in lsquoRoyal Galarsquo apples in
north Victoria was minor under the conditions modelled in this investigation However further research
into possible effects of changes in harvest timing leaf fall and elevated atmospheric carbon dioxide
concentrations is required to better understand yield responses to climate change
Communication development and extension
Assessing the status of available information around climate change in the apple and
pear industry in 2013
A review of climate change information available to the Australian apple and pear industry showed a lack
of readily accessible reliable and consistent information available to growers at the time As a result it
was concluded that a) scientific outcomes from this project need to be published in a grower friendly
format b) research should be extended in a consistent manner through national grower workshops
across the country and online blogs and c) information generated needs to be stored online for easy
access
Improving industry understanding of likely changes in climate potential impacts on
apple and pear production and options for adaptation
Outcomes from the national grower workshops (appendix 10) were overwhelmingly positive with the
specific feedback varying depending on the location A number of knowledge gaps were identified during
the workshops including the need for cultivar chilling requirements for existing and new cultivars the
role of soil temperature in dormancy breaking and the need for more accurate in-season and long-term
climate forecasting There was a strong focus on the potential impact of extreme events on the industry
under future climate scenarios with less understanding about the potential impacts of more subtle
increases in temperature
Three grower publications were put together reporting on the latest project outcomes and information
already available from either earlier research in Australia andor other pome fruit growing regions The
publications were written with input from the project researchers and APAL (as the technical working
group) on the topics of winter chill netting for heat and climate scenarios The guides will be available
online (wwwhincomau) and as hardcopies from APAL andor the participating agencies
38
Increasing knowledge and skills to enable informed decision making on climate change
adaptation
Research outcomes were interpreted and communicated with a clear focus on practical on-farm
application For example findings from the fruit surface temperature research were interpreted and
communicated as regional sunburn browning-risk with analysis of the effectiveness of netting as an
adaptation strategy to increased frequency of extreme heat days The Western Australian netting
demonstration site enabled on-site communication with growers in that state around the effectiveness of
netting and the associated practical implications Green tip and flowering data collection methods were
developed for growers to use in their personal orchard record systems to determine cultivar performance
and identify shifts in flowering time andor quality A winter chill website was developed to assist growers
and industry more broadly to access and interpret winter chill data for their local region
Building a connected and collaborative approach to climate change in the apple and
pear industry
A strong network of researchers extension officers industry development officers growers and other
industry representatives was established nationally and continued to grow until project completion The
success of this project objective is discussed in the lsquoevaluation and discussionrsquo (p39)
39
Evaluation and Discussion
Measuring project impact
The proposed project outcome was to provide Australian apple and pear growers pome fruit researchers
and industry consultants with a greater understanding of predicted climate change in their region the
potential impacts and strategies for adaptation A formal evaluation of the projectrsquos ability to deliver on
this outcome was undertaken at the mid-way point through Horticulture Innovation Australiarsquos
independent mid-term review process
Through extensive research development and extension activities this project delivered new knowledge
to industry on regional climate change scenarios potential impacts of changing climate on flowering and
fruit quality and options for adaptation
Project outputs were produced across a broad variety of print digital and oral communication mediums
(refer to p13) The list includes 3 dedicated grower publications communicating climate risk and
adaptation information for the apple and pear industry a website for provision of up-to-date winter chill
information 6 grower workshops 3 grower technical working group meetings 2 industry surveys 28
articles published in industry magazines 5 presentations at industry conferences 15 presentations at
government and industry stakeholder meetings 11 media items in-print and on radio 9 technical reports
2 dedicated project web pages 6 regional chill factsheets numerous blogs 5 scientific publications and
presentation at 2 scientific conferences
The project trial sites were located in three growing regions (Western Australia Victoria and
Queensland) however significant effort was made to extend and communicate project outcomes more
broadly across the industry Grower workshops and technical working group meetings were held in New
South Wales and South Australia Collaboration with researchers from the University of Tasmania through
the lsquoCrossing the threshold adaptation tipping points for Australian fruit treesrsquo project and the dormancy-
breaking spray trial facilitated effective communication with industry in that state In addition multiple
members of the research and extension team organized and operated a project stand in the trade hall of
the 2015 National Horticulture Convention in conjunction with the Department of Economic Development
Jobs Transport and Resources
To measure lsquogreater understandingrsquo of climate change by the apple and pear industry an extensive
surveying process before and after project completion would have been required This was not
undertaken as part of the project however the extent of project outputs delivered across the country
give a good indication of the level of engagement that this project successfully achieved
In the next few years the project impact will be measurable by assessing the level of uptake and use of
the grower publications and lsquowinter chill and growing degree dayrsquo website In addition national networks
developed over the last four years between members of the project team and industry are likely to
continue to provide ongoing benefit to Australian horticulture as its members move to reduce
vulnerability to climate change risks
40
Effectiveness of project activities in delivering project outputs and achieving intended
outcomes
Efficiency of the delivery mechanisms and appropriateness of the methodology
A mid-term project review conducted in 2014 by Professor Snow Barlow from The University of
Melbourne found the research to be lsquoscientifically rigorous and directed towards the contracted objectives
of the projectrsquo The review highlighted the good progress made by the research and extension team in
engaging with industry and in the delivery of a broad information mix incorporating immediate adaptive
strategies such as netting to reduce sunburn risk and future long-term climate change impacts
Our use of small grower-based technical working groups to receive guidance on research project direction
and outputs was sound methodology but required considerably more resources to maximize its value
The process of establishing these groups nationally running meetings compiling and disseminating
outcomes and maintaining communication with the groups throughout the project was significant
Ideally the groups need to be coordinated by a local industry representative with strong connections to
the industry in their region and good knowledge of the industry itself
Barriers to communication and extension around climate change adaptation
Effective communication between researchers and growers is particularly important in delivering
messages on climate change impact and adaptation due to the vast quantity of information and
misinformation in the public sphere A number of communication and extension barriers were identified
during the course of project engagement activities (Table 6) and these learnings were used to improve
the effectiveness of our communications
For example widespread confusion in the industry around measurement of winter chill and chilling
requirements was identified as a significant barrier to effective communication of research findings
related to climate change impacts on winter chill and flowering As a result the lsquowinter chill and growing
degree dayrsquo website was developed (as part of a project variation) to provide chill calculation tools and
supporting information for industry with the aim of improving understanding and enabling better
management of low winter chill years in orchards across Australia
41
Table 6 Barriers to communication and extension around climate change adaptation
Barriers Comments
Skepticism of climate change Communication with growers nationally
suggested that this was a minority of industry
Conflicting messages from Governments
regarding potential climate change impacts and the need for adaptation
Feeling of responsibility for climate change
without having realistic strategies to combat it
Resistance to implementing changes required for climate change adaptation
Could be for a variety of reasons including financial and family pressures
Timing of communication- needs to be considered in the context of production
stresses more broadly
Growers in the midst of battling drought are unlikely to be concentrating on understanding
chilling requirements Information provided needs
to be carefully matched with local industry needs
Large knowledge gaps in the science For example it is difficult for growers to make
cultivar choices based on climate suitability due
to the lack of basic understanding around chilling requirements and tolerance to heat
Confusion around chilling requirements and measurement of winter chill
Generated historically by the reporting of winter chill in different units and general spread of
misinformation
Confusion around the terms lsquoclimate variabilityrsquo versus lsquoclimate changersquo
Confusion over the use of different scientific
terminologies
Need to use consistent terminology in all
communications for example around winter chill and phenological stages
Feedback on activities and quality and usefulness of project outputs
Feedback on research and extension activities was obtained from a broad cross-section of apple and pear
growers and industry representatives nationally through meetings with APAL staff and discussions and
evaluations at grower workshops A formal evaluation completed by 12 growers at the Bilpin workshop in
2015 indicated that 100 of them found the workshop content useful for their orchard businesses and
that they would like to attend further events Similarly positive results were obtained elsewhere through
informal discussions
In addition feedback was sought via the project websites through Australian Fruitgrower articles and
regular discussions with growers on-site during research data collection and various grower meetings
Grower experiences of local climate change impacts were often communicated during one-on-one
conversations The APAL industry conferences were utilized as an effective medium for sharing project
outcomes A dedicated project stand and display was set up in the exhibition hall at the National
Horticulture Convention on the Gold Coast in 2015 for the purpose of sharing project outcomes
responding to targeted inquiries and obtaining feedback from industry nationally
42
The value of online project outputs can be quantified through the number lsquohitsrsquo to project website pages The project pages on the Horticulture Industry Network site have received 987 hits since they were developed in 2014 indicating the usefulness of this medium for project communication
Scientific feedback was obtained from within the project team as well as through linkages with
researchers nationally Critique of research methodology and results was sought from international
scientists through publication in peer-reviewed journals presentations at scientific conferences and
through hosting visits from international researchers
Feedback received was discussed with the project team during the monthly teleconferences and annual
face-to-face meetings and was incorporated back into the project as deemed appropriate by the group
Key learnings
Climate change will add significant variability into the pome fruit crop production system with respect to
flowering and fruit quality Most Australian growers are already used to dealing with some level of climate
variability and it seems likely that impacts on flowering and fruit quality may be within the range of
grower experience up to around 2030 but that by 2050 growers will be operating outside of current
experience This will present challenges for the Australian industry in the consistency of supply and in
maintenance of the uniform orchard blocks that are a prerequisite for the efficient use of mechanisation
Precise timeframes for impacts of warming temperatures on pome fruit production are difficult to
determine because of the amount of variability in both the climate (including microclimate) and orchard
production systems For example under the worst case scenario Manjimup is projected to receive an
average of 46 chill portions in 2050 This means that in cold years there is likely to be plenty of chill for
apple production but warm years will challenge many current commercial cultivars If the grower has
adapted by planting lower chill cultivars and adjusted their management practices they are more likely to
grow a good crop every year
The Australian apple and pear industry in Australia and globally has a strong capacity for adaptation to
the changing climate due to the availability of new technologies for crop sensing opportunities for
protected cropping a strong research history in crop physiology and availability of a broad diversity of
scion and rootstock genetics Genetic diversity in particular can be exploited to ensure commercial
cultivars are better adapted to the changing climatic conditions
Successful adaptation to the changing climate will be supported by capture and interpretation of data on
tree phenology climate and orchard practices Australiarsquos industry is made up of growing regions with
diverse climates and much can be learnt about climate change impacts and options for adaptation by
sharing of knowledge In future more comprehensive data will be collected on orchards through the use
of sensing and mapping technologies This data can be used to undertake more sophisticated and
comprehensive analysis of flowering patterns and variability between and within locations
Specific research learnings are listed under the stated project objectives
1 Develop climate change scenarios for pome fruit growing regions of Australia in 2030
and 2050 including the likely impact of climate change on winter chill and extreme
heat
- Australia has undergone a consistent warming trend since 1910 however at a local level the
experience of climate change has been different in each pome fruit growing region Changes in
average minimum and maximum temperatures and extreme heat for the period from 1968 to
43
2016 varied between locations
- Milder growing regions have experienced a decline in annual winter chill accumulation since 1968
while the colder regions of Huonville and Orange have not changed
- Increases in the number of extreme heat days have been experienced in Shepparton and Mt
Barker while the frequency of extreme heat days in Manjimup in the last seven years has been
above the long-term average
- The climate projections for 2030 and 2050 show that all pome fruit regions across Australia can
expect to experience
Declines in winter chill accumulation Warmer winter growing regions such as Manjimup and
Applethorpe were projected to experience a reduction in winter chill of 20 to 30 by 2050
A decline of between 10 and 15 chill was projected for the coldest regions (Huonville and
Orange) over the same period
An increase in the number of extreme heat days during the growing season The greatest
impacts were projected to be in regions such as Shepparton and Mt Barker with hot summer
climates
- Climate change impacts on winter chill are likely to be within grower experiences of season-to-
season variability up to approximately 2030 On-farm adaptation to this variability will reduce
longer term climate change risk to orchard profitability By 2050 it is likely that growers will be
operating under climates outside of the current range of experience for a particular region
- Expression of climate change projections in terms of meaningful horticultural climate metrics
(chill portions and sunburn browning risk days) instead of average temperatures improves their
value to industry by directly linking projected changes in climate with impacts on production
2 Understand how changes in autumn winter and spring temperatures might impact
the timing and quality of flowering in cultivars of apple and pear
- Analysis of winter chill and flowering from 2012 to 2015 in Applethorpe Shepparton and
Manjimup showed
Low winter chill as observed in Manjimup was associated with uneven chill accumulation caused by short periods of warm weather throughout the autumn and winter seasons
Low winter chill in Manjimup was associated with greater variability in flowering dates between seasons cultivars and individual trees and irregular and protracted flowering across most apple cultivars relative to the other sites
The variable pattern of flowering observed in Manjimup was likely the result of mild winter
conditions and inadequate chilling for some cultivars
- Analysis using Manjimup as a climate analogue for Stanthorpe in 2030 indicated that growers in
the Stanthorpe region were likely to experience a more variable and protracted pattern of
flowering across many apple cultivars by 2030 but without any clear negative impact on
productivity Use of dormancy-breaking sprays is an adaptation option There was with no clear
need to shift to different cultivars or species at this stage (objective 3)
- Projections from the chill-overlap model for timing of full bloom in lsquoCripps Pinkrsquo apple in 2030 and
2050 showed
An earlier full bloom date on average in some high chill locations (for example in Orange) in
44
2030 and 2050
A later full bloom date at the milder winter locations (Applethorpe Manjimup and even
Shepparton) in 2030 with average flowering dates delayed by more than a week in 2050
Changes in flowering time for lsquoCripps Pinkrsquo in 2030 are likely to be within the current range of
grower experience
- Increased frequency of low chill years in milder winter growing regions will likely result in
symptoms of inadequate chill in some cultivars Advances in the timing of flowering might be
observed in cooler winter regions Changes in the timing of flowering can result in reduced yields
in cases where the flowering period of polliniser trees no longer overlaps that of the commercial
cultivar
3 Identify adaptations to manage any negative effects of climate change on flowering
- The dormancy-breaking spray trial in lsquoGalarsquo apple in Qld WA and Tas demonstrated that
Dormexreg Waikentrade and Ergerreg were able to advance flowering time and compact the
flowering period
Fruit maturity was advanced with dormancy-breakers and generally reflected differences in
flowering dates
Dormancy-breaking sprays are likely to be an effective tool for managing flowering in lsquoGalarsquo
and other apple cultivars in lower chill years in Australia
Benefits from the use of dormancy-breakers are likely to be greater in low chill years when
the potential impacts of inadequate chill on flowering are greatest Therefore benefits are
likely to increase under future climate scenarios
- Changes to cultural practices will be required to manage symptoms of inadequate chill such as
delayed irregular and protracted flowering
Development of an appropriate chemical thinning program for managing buds at multiple
stages of green tip and flowering on individual trees
Careful hand thinning to optimise crop uniformity when fruitlets vary considerably in size and
developmental stage
Additional labour input to pick fruit at the appropriate stage of maturity when there is a
greater spread of fruit maturity at harvest
Pollination management to reduce the risk of poor flowering overlap in any particular year
caused by large shifts in flowering dates between cultivars and seasons
- The increased irregularity and unevenness of flowering is likely to be a greater management
challenge for Australian growers than managing changes in flowering time as growers are
already experienced at dealing with large shifts in flowering dates between seasons
- Using forced bud methodology to determine chilling requirements apple cultivars fell into groups
with low (lsquoCripps Redrsquo lsquoManchurianrsquo crab apple) medium (lsquoRS103-110rsquo lsquoGranny Smithrsquo lsquoCripps
Pinkrsquo lsquoKaleirsquo) and higher chilling requirements (lsquoGalaxyrsquo lsquoFujirsquo lsquoHi-Earlyrsquo) Groupings such as these
enable growers to make more informed cultivar and polliniser choices at planting based on the
winter chill climate in their region
45
4 Understand how changes in the frequency of extreme heat days might impact on the
incidence of sunburn in pome fruit and the effectiveness of netting as an adaptation
strategy
- Minimum air temperatures for potential sun damage in lsquoRoyal Galarsquo apple were established
341degC and 387degC respectively for browning and necrosis for non-netted fruit
379degC for browning under netting
- Air temperature thresholds were applied across southern Australia and potential sun damage risk
and effectiveness of netting was determined under future climates
Shepparton Mt Barker and Manjimup were the most adversely affected by projected
increases in the percentage of days with potential sunburn browning risk in January and
February
The percentage of risk days in Shepparton was projected to increase from 18 at present to
28 to 36 in 2050 with the installation of netting reducing the risk considerably to around 9
to 13
- Most growing regions are likely to notice an increased sunburn risk by 2030 (if they havenrsquot
already) By 2050 growers in regions with currently milder summers will need to have adapted
their current orchard practices to manage the impacts that an increased frequency of heat events
will have on fruit quality
- The thermodynamic Smart-Sinclair model was tested on lsquoRoyal Galarsquo grown under net and no net
and was able to predict fruit surface temperature with a root mean square error of 2 to 3degC
Netting reduced the median fruit surface temperatures by 15 to 20degC
- The thermodynamic Smart-Sinclair model can be used to understand processes and quantify the
effects of various netting structures on fruit surface temperature and sun damage risk but
cannot be used for predicting the effects of climate change due to the lack of reliable projected
solar radiation and wind speed data
5 Understand how different colours of netting impact on the orchard environment fruit
yield and quality
- Comparison of black and white netting at the Western Australian netting demonstration site
showed little difference in environmental conditions or bud burst and flowering under the black
netting white netting and non-netted orchard blocks Fruit surface temperatures were higher in
the no net apples
6 Understand how the changing climate might impact the yield potential of apples
- The Malusim model for the prediction of potential apple yield could not be positively validated
under Australian conditions as it was generally a poor predictor of yield for lsquoRoyal Galarsquo and
lsquoCripps Pinkrsquo at multiple sites in Australia
- The MaluSim model was able to predict fruit weight of lsquoRoyal Galarsquo trees at the North Shepparton
site and supported use of the model for preliminary investigation of influences of climate change
on potential yield The predicted impact of increased temperatures (+ 2degC) on yield in lsquoRoyal
Galarsquo apples in north Victoria was minor under the conditions modelled in this investigation
46
Recommendations
Industry
- The following tools and strategies are recommended for adaptation to an increased frequency of low
chill years in milder growing regions of Australia
Planting lower chill cultivars Matching cultivars to their chilling climate is the best option but
it is not always possible due to market pressures and a lack of information on chilling
requirements
Management of delayed and variable flowering with the use of dormancy-breakers
Development of a set of broad guidelines around the use of dormancy-breaking sprays based
on existing knowledge Such guidelines could include information on when dormancy-
breaking sprays should be used and in which cultivars and regions
Adjustments to chemical and hand thinning practices to reduce variability in fruit size and
maturity
Use of the lsquowinter chill and growing degree dayrsquo website for monitoring in-season chill
accumulation
Preparation of an orchard management strategy to enact in low chill years This would likely
include monitoring of winter chill accumulation and the use of dormancy-breakers
Comprehensive in-orchard monitoring of flowering dates across cultivars to provide early
indication of cultivars that might be impacted by warmer winters as well as identification of
subtle shifts in the timing of flowering between cultivars and their pollinisers
In blocks where flowering is becoming increasingly irregular growers will need to assess the
point at which the increased cost of inputs and effort required to produce a consistently high
quality crop make a block of trees unprofitable
- To reduce the risks to pollination from shifting flowering times planting of multiple polliniser cultivars
with early middle and late flowering habits to ensure a good supply of pollen throughout the
flowering period is recommended where possible Use of floral bouquets or artificial pollination
methods can be considered to compensate for loss in flowering overlap
- The following tools and strategies are recommended for adaptation by the apple and pear industry to
increased frequency of extreme heat
Continued investment in netting in locations such as Manjimup and Orange where many
orchards are currently un-netted
Use of air temperature thresholds as a guide for using overhead sprinklers for evaporative
cooling in efforts to minimize potential sunburn damage
Planting heat tolerant cultivars As for winter chill matching cultivars to their growing climate
is the best option but it is not always possible due to market pressures and a lack of
information on different heat tolerances of cultivars
Development of orchard practice guidelines for managing extreme heat (bringing together
47
aspects of tree canopy structure evaporative cooling netting types irrigation nutrition
spray-on protectants and other stress reduction products)
Development of orchard practice guidelines for optimising post-harvest fruit quality in warm
to hot summerautumn conditions (pre and post-harvest management)
- For improved tactical and strategic planning in the orchard use of the Bureau of Meteorology climate
outlook videos (httpwwwbomgovauclimateoutlooksoverviewsummary) State of the Climate
reports (httpwwwbomgovaustate-of-the-climate) and the lsquoclimate change in Australiarsquo website
(httpswwwclimatechangeinaustraliagovauen) is recommended
- It is recommended that the Australian apple and pear industry utilise and exploit the genetic diversity
available in scions and rootstocks globally to ensure that commercial cultivars can be better adapted
to the changing climatic conditions
- Climate analogues should be used to better identify the timeframes for impacts of low chill and
extreme heat on apple and pear production and the best strategies for adaptation For example
growers in Manjimup are already successfully managing the impacts of inadequate chill in some
years lessons can be learnt from their knowledge and experience
- This project focussed specifically on climate change impacts on crop physiology and it is
recommended that the industry undertake a broad economic assessment of climate change impacts
from storm events drought increased wind changes in evapotranspiration and so on
- The industry needs to consider how basic research gaps such as knowledge around relationships
between temperature and tree physiology may be filled in future years to ensure the flow of new
information and ideas into the industry does not become limited
Extension and communications
- Having an extension and research team working side-by-side from project start to end has significant
benefits for communications and industry engagement
- National collaboration was enormously beneficial to the success of this project as were linkages
between projects and across industries
- Having a core team responsible for communication ensured timely relevant and consistent
information was made available and utilising well established local grower groups and extension
officers ensured ease of facilitation
Scientific
Priority research needs
- Determination of significant biological thresholds (chilling requirements sunburn damage thresholds
pest and disease development thresholds) to enable conversion of weather and climate data into
useful horticultural metrics for everyday decision making
- Investigation of methods programs for evaluation of new and existing scions and rootstocks with
the objective of providing sufficient information to enable matching of apple and pear cultivars with
suitable growing climates including matching chilling requirements with winter chill and heat
48
tolerance with summer temperatures
- New genetics breeding programs are needed that focus on lower chill cultivars with good tolerance
for heat alongside other quality parameters
- Determination of genetic andor physiological markers of flower bud progression into dormancy and
out of dormancy prior to bud burst This would improve the definition of apple and pear chilling
requirements
- Efficacy of using dormancy-breaking sprays for long-term adaptation to warming temperatures
including the extent to which dormancy-breaking sprays can be used as an adaptation to low chill
years relationships between dormancy-breaking sprays and fruit quality particularly in cultivars and
investigations into alternatives to Dormexreg
- Methods for managing heat in the orchard for improved fruit quality
Efficient tree canopies for balancing multiple requirements including low sunburn damage
optimal fruit quality (including colour development) water-use efficiency and disease
management
Understanding relationships between orchard temperatures during the growing season and
fruit quality at harvest and after storage
Use of plant growth regulators and stress reduction chemicals
Additional research gaps
- Pest and disease management under warmer climates Codling moth are likely to increase generation
number per season fruit fly are likely to have an extended range and disease management under
netting on trellis systems will present new challenges particularly when combined with the use of
evaporative cooling
- Determination of the limits of profitable apple production with regards to winter chill Production
areas with very low winter chill accumulation in South Africa and Southern Brazil rely heavily on
dormancy-breakers and would be obvious target locations for a global investigative study
- Potential impacts of low winter chill on marketable yield
- For improved definition of apple and pear chilling requirements
Cultivar specific parameterisation of the Dynamic model for improved chill model
performance
Relationship between bud temperature and dormancy breaking
Standardisation of methods for determination of chilling requirements
Investigation of the potential role of day length in dormancy breaking in apples
Effectiveness of early versus late season chill in dormancy breaking
Role of root-zone temperature and rootstocks in bud burst
Relationship between temperatures received during autumn prior to dormancy and quality of
bud burst and flowering
Impacts of pruning and defoliation on modifying winter chill requirements
49
- Validation of the chill-overlap model with flowering data from cultivars other than lsquoCripps Pinkrsquo apple
to determine how flowering time will be impacted by climate change
- Better understanding of flowering in new and existing pear cultivars and the likely impacts of
changing climate
- Fruit surface temperature thresholds for sunburn for a wide variety of cultivars Transferability of fruit
surface temperature thresholds across cultivars and locations needs to be investigated
- Effectiveness of different types (colours weaves) of netting in reducing the risk of sunburn damage
and its effect on assimilation transpiration and fruit quality
- Impact of climate change on the duration of fruit development and maturity times for apple and pear
cultivars of interest
- Potential impacts of the extended growing season (caused by the later onset of cold temperatures in
autumn and warmer springs) on canopy management and fruit quality
- Impacts of warming spring and summer temperatures on flower bud initiation and development
- The impact of elevated CO2 temperature shifts on fruit maturation colour development and leaf fall
to improve predictions of yield under different climate scenarios
- Pollination in a changing climate Warming temperatures will impact bee behavior synchronisation of
flowering (due to changes in the timing of flowering) flower viability and floral bud initiation
- Potential for POAMA (Predictive Ocean Atmosphere Model for Australia) to make in-season and short
to medium-term climate forecasts with a level of accuracy necessary to inform decision making at
tactical and strategic levels
50
Scientific Refereed Publications Darbyshire R McClymont L Goodwin I 2015 Sun damage risk of Royal Gala apple in fruit growing
districts in Australia New Zealand Journal of Crop amp Horticultural Science 43 222 -232
McCaskill M R McClymont L Goodwin I Green S Partington DL How hail netting reduces apple
fruit surface temperature a microclimate and modelling study Agricultural and Forest
Meteorology 226ndash227 148ndash160
Parkes HA Tabing O McClymont L Combret M and Wilkie JD 2016 Variation in the flowering
phenology of apple and pear in Australia Acta Horticulturae 1130 (8) 55 - 61
Parkes H Darbyshire R and White N Chilling requirements of apple varieties grown in mild Australian
winter conditions Prepared for HortScience
Webb L Darbyshire R Erwin T and Goodwin I 2016 A robust impact assessment that informs
actionable climate change adaptation Future browning-risk in apple crops International Journal
of Biometeorology Doi101007s00484-016-1268-y
51
Intellectual PropertyCommercialisation
No commercial IP generated
52
Acknowledgements The research described in this final report is a culmination of the inputs and efforts of a great many
individuals over the course of the last four and a half years
The project team would like to thank the following people for their work in the provision of technical and
farm support and for their contribution of knowledge and ideas along the way Jeff Paten John
Finocchiaro Wendy Sessions David Cornwall Diana Fisher Rohan Prince John Sutton Penny Measham
and Steve Paterson We also thank Marco Calderon for his work analysing individual bud data for his
Masterrsquos degree from the University of Melbourne
The cooperation and collaboration of a number of growers was essential for the timely collection of
phenology fruit quality and netting data used for this research The project team would like to thank
Steven and Ugo Tomasel Celeste from C Pozzebon amp Co Anne and Mauri Lyster Maurice Silverstein
Geoffrey Thompson and Scott Price
For their support in providing us with opportunities to speak at industry events publish in the Fruitgrower
magazine and deliver information via the APAL website we would like to thank Angus Crawford Sophie
Clayton and Richelle Zealley The project team also thank Kevin Dodds Marcel Veens and Fruit Growers
Victoria for on-the-ground help with the organization and delivery of the grower workshops
And finally we acknowledge the valuable contributions of all of the industry representatives and apple
and pear growers across Australia who attended workshops and seminars answered surveys and
provided us with the comments and interesting anecdotes that kept challenging our thinking and helped
us focus our work Thank you
53
Appendices
1 White N 2016 Technical report Analysis of historical and future climate and the production of
pome fruit Department of Agriculture and Fisheries Queensland 29 pp
2 Parkes H and White N 2016 Technical report Flowering in pome fruit trees across Australia
implications of a changing climate Department of Agriculture and Fisheries Queensland 21 pp
3 Parkes H and White N 2016 Technical report A climate analogue approach to understanding
climate change impacts on flowering in Australian pome fruit trees Department of Agriculture
and Fisheries Queensland 17 pp
4 Parkes H MurphyWhite S and Bound S 2016 Technical report Dormancy-breaking sprays for
low winter chill in apples Department of Agriculture and Fisheries Queensland Pomewest
University of Tasmania 28 pp
5 Darbyshire R McClymont L Goodwin I 2015 Sun damage risk of Royal Gala apple in fruit
growing districts in Australia New Zealand Journal of Crop amp Horticultural Science 43 222 - 232
6 McCaskill M R McClymont L Goodwin I Green S Partington DL How hail netting reduces
apple fruit surface temperature a microclimate and modelling study Submitted to Agricultural
and Forest Meteorology 226-227 148 ndash 160
7 Webb L Darbyshire R Erwin T and Goodwin I 2016 A robust impact assessment that
informs actionable climate change adaptation Future browning-risk in apple crops International
Journal of Biometeorology Doi101007s00484-016-1268-y
8 MurphyWhite S Prince R and Starkie L 2016 Technical report Western Australian apple
netting demonstration site Pomewest 24 pp
9 McClymont L Darbyshire R and Goodwin I 2016 Technical report Apple yield response to
climate change and netting Department of Economic Development Jobs Transport and
Resources and University of Melbourne 15 pp
10 Treeby J 2016 Understanding apples and pears in a changing climate overview of the grower
workshops Department of Economic Development Jobs Transport and Resources 5 pp
54
References
Atkinson C J Brennan R M amp Jones H G (2013) Declining chilling and its impact on temperate perennial crops Environmental and Experimental Botany 91
Bound S A amp Jones K M (2004) Hydrogen cyanamide impacts on flowering crop load and fruit
quality of red Fuji apple (Malus domestica) [Article] New Zealand Journal of Crop and Horticultural Science 32(2) 227-234
Cobon D H Stone G S Carter J O Scanlan J C Toombs N R Zhang X et al (2009) The climate change risk management matrix for the grazing industry of northern Australia Rangeland Journal 31(1)
Cooke J E K Eriksson M E amp Junttila O (2012) The dynamic nature of bud dormancy in trees
environmental control and molecular mechanisms Plant Cell and Environment 35(10) 1707-
1728 Darbyshire R McClymont L amp Goodwin I (2015) Sun damage risk of Royal Gala apple in fruit-
growing districts in Australia New Zealand Journal of Crop and Horticultural Science 43(3) 222-232
Darbyshire R Pope K amp Goodwin I (2016) An evaluation of the chill overlap model to predict
flowering time in apple tree Scientia Horticulturae 198 142-149 Darbyshire R Webb L Goodwin I amp Barlow E W R (2013a) Evaluation of recent trends in
Australian pome fruit spring phenology International Journal of Biometeorology 57(3) Darbyshire R Webb L Goodwin I amp Barlow E W R (2013b) Impact of future warming on winter
chilling in Australia International Journal of Biometeorology 57(3) 355-366 Dennis F G Jr (2003) Problems in standardizing methods for evaluating the chilling requirements for
the breaking of dormancy in buds of woody plants HortScience 38(3)
Erez A Fishman S Linsley-Noakes G C amp Allan P (1990) The dynamic model for rest completion in peach buds Acta Horticulturae 276 165-174
Fishman S Erez A amp Couvillon G A (1987) The temperature dependence of dormancy breaking in plants mathematical analysis of a two-step model involving a cooperative transition Journal of Theoretical Biology 124 473 - 483
Ghariani K amp Stebbins R L (1994) Chilling requirements of apple and pear cultivars Fruit varieties journal 48(4) 215 - 222
Hauagge R amp Cummins J N (1991) Phenotypic variation of length of bud dormancy in apple cultivars and related Malus species Journal of the American Society for Horticultural Science 116(1) 100-
106
Hennessy K J amp Clayton-Greene K (1995) Greenhouse warming and vernalisation of high-chill fruit in southern Australia Climatic Change 30(3)
Lakso A N amp Johnson R S (1990) A simplified dry matter production model for apple using automatic programming simulation software Acta Horticulturae 276 141 - 148
Legave J M Blanke M Christen D Giovannini D Mathieu V amp Oger R (2013) A comprehensive overview of the spatial and temporal variability of apple bud dormancy release and blooming
phenology in Western Europe International Journal of Biometeorology 57(2)
Lolicato S (2011) Sun protection for fruit a practical manual for preventing sunburn on fruit - 2011 Department of Primary Industries Farm Services Victoria Division Melbourne Australia
Luedeling E Blanke M amp Gebauer J (2015) Chilling challenges in a warming world In J C Mauget amp S Godet (Eds) Acta Horticulturae (pp 901-907) Leuven Belgium International Society for
Horticultural Science (ISHS)
Luedeling E amp Brown P H (2011) A global analysis of the comparability of winter chill models for fruit and nut trees International Journal of Biometeorology 55(3)
Middleton S amp McWaters A (2002) Hail netting of apple orchards- Australian experience The Compact Fruit Tree 35(2) 51 - 55
Panda S S Hoogenboom G amp Paz J O (2010) Remote sensing and geospatial technological
55
applications for site-specific management of fruit and nut crops A review [Review] Remote Sensing 2(8) 1973-1997
Pope K S Da Silva D Brown P H amp DeJong T M (2014) A biologically based approach to
modeling spring phenology in temperate deciduous trees Agricultural and Forest Meteorology 198ndash199(0) 15-23
Putland D Deuter P Hayman P Hetherington S Middleton S Nidumolu U et al (2011) The apple and pear industrys response to climate change and climate variability a desktop study Growcom Fortitude Valley Queensland Australia
Smart R E amp Sinclair T R (1976) Solar heating of grape berries and other spherical fruits [Article] Agricultural Meteorology 17(4) 241-259
State of the climate (2016) Australian Bureau of Meteorology amp CSIRO Theron K (2013) Chemical thinning of apple South African perspective Acta Horticulturae 998 85 -
90
Treeby J Goodwin I MurphyWhite S Darbyshire R White N McClymont L et al (2017a) Winter chill and flowering- what is there to know Queensland
Treeby J Goodwin I MurphyWhite S Darbyshire R White N McClymont L et al (2017b) Netting for heat- what is there to know Queensland
Whetton P H Karoly D Watterson I G Webb L Drost F Kirono D et al (2013) Australias
climate in a four degree world In P Christoff (Ed) Four degrees of global warming Australia in a hot world (pp 17 - 32) London EarthscanRoutledge
White N Parkes H amp Treeby J (2017) Future climates in pome fruit orchards- what is there to know Queensland
TechnicalReportAnalysisofHistoricalandFutureClimateandtheProductionofPomeFruitNeilWhite
February2017
2
TableofContents
Technical Report Analysis of Historical and Future Climate and the Production of Pome Fruit1
Introduction5
Site Descriptions and Data Preparation5
Reliability of techniques used to interpolate between daily and hourly temperatures7
Models of Chill Accumulation8
What is winter chill8
Chill Hours9
Utah Chill Units9
Dynamic Model9
Trends in Temperature and Chill Accumulation11
Autumn and winter11
Winter chill13
Spring and Summer15
Extreme Heat17
Climate Scenarios for apple growing regions for 2030 and 205018
How were the scenarios chosen18
Selection of Global Climate Models20
Calculation of Climate Projections for Station Data21
Future Climate Projections and the Impact on Flowering23
Future Projections of Impact on Quality25
Discussion and Conclusions27
Take-home messages from the historical record28
Take-home messages from the future scenarios28
References29
3
ListofTablesTable1Descriptionofweatherstationsusedintheanalysis6
Table2DescriptionofGCMsusedinthisstudy21
Table3Summaryofaveragechillportions(1Marchndash31August)for2030and2050usingamoderate(RCP45)toworstcasescenario(RCP85)modellingapproachbasedonhistoricaldatafrom1985to2014Meanof30yearswithlowestandhighestinparentheses24
Table4Safewinterchillcalculationsfortheperiod1985to201424
Table5Summaryofaveragedateoffullbloom(CrippsPink)for2030and2050usingamoderate(RCP45)toworstcasescenario(RCP85)basedonhistoricaldatafrom1985to201425
Table6Summaryofmeanvaluesforbrowningrisk(percentageofdays)forJanuaryandFebruary26
ListofFigures
Figure1Australiarsquosappleandpearindustrycentres(white)andlocationsreferredtointhetext5
Figure2ExamplesoftheuseoftheinterpolationroutinetoconvertdailymaximumandminimumtemperaturestohourlyTheorangelineis21December2015andthebluelineis21June2015forApplethorpeDotsindicatethemaximum(orange)andminimum(blue)foreachdaythatwereusedtogeneratetheinterpolatedhourlydata7
Figure3MeasuredhourlytemperaturedataandhourlydatainterpolatedfromdailymaximumandminimumforApplethorpeLineshowsthe11correlation8
Figure4ComparisonofchillportionaccumulationcalculatedfromorchardhourlydatahourlydatainterpolatedfromtheorcharddailymaximaandminimaandthenearbyAWS8
Figure5Trendsintemperaturefrom1970to2015RedshowsthatthetrendintemperaturehasbeentowardshottertemperatureswhileblueshowsatrendtowardscoolertemperaturesThehighertheintensityofcolourthestrongerthetrendcopyCommonwealthofAustralia2016AustralianBureauofMeteorology11
Figure6Averageautumn-winterminimumtemperatureanomaliescomparedtoabaseperiodof1981to2010Theblacklineisan11-yearmovingaverage12
Figure7Averageautumn-wintermaximumtemperatureanomaliescomparedtoabaseperiodof1981to2010Theblacklineisan11-yearmovingaverage13
Figure8Annualanomaly(averagechange)inaccumulationofchillportions(1Marchndash31August)comparedtoabaseperiodof1981to2010Theblacklineisan11-yearmovingaverage14
Figure9Averagespring-summerminimumtemperatureanomaliescomparedtoabaseperiodof1981to2010Theblacklineisan11-yearmovingaverage15
Figure10Averagespring-summermaximum(right)temperatureanomaliescomparedtoabaseperiodof1981to2010Theblacklineisan11-yearmovingaverage16
Figure11Annualanomaly(averagechange)inaveragenumberofdayswheremaximumtemperatureexceeds35degCcomparedtoabaseperiodof1981to2010Theblacklineisan11-yearmovingaverage17
Figure12Measured(CapeGrimTasmaniaandMaunaLoaHawaii)andFutureCO2forRCP45andRCP85andmeasuredandpredictedtemperatureanomaly(TA)usingtherelationshownintheinset19
4
Figure13AccumulationofchillforhistoricalaverageconditionsatManjimupandforaprojectedclimatefor2030underRCP45andRCP85(top)Themonthlychangeinaveragetemperaturethatcausedthedifferenceinthechillaccumulationinthefutureisshowinthelowergraph20
Figure14MeanmonthlyminimumtemperaturesforApplethorpefor2030underRCP45(left)andRCP85(right)22
Figure15MeanmonthlyminimumtemperaturesforApplethorpefor2050underRCP45(left)andRCP85(right)22
Figure16TheChill-OverlapModelCristhechillrequiredforfloweringCoisthemaximumadditionalchillthatwillreducetheheatrequirementHristheheatrequiredwhenCochillisaccumulatedandHoistheheatrequiredwhenchillisanCr(RedrawnfromDarbyshireetal2016)23
5
IntroductionThisreportsetsoutourcurrentknowledgeofhowclimatechangewillaffectpomefruitgrowing
regionsinAustraliaAllthepomefruitgrowingregionsinAustraliahaveseenaconsistentwarming
trendsince1970forbothwinterandsummertemperaturesInresponsetothisgrowershavebegun
toadaptthemanagementoftheirorchardstocopewiththesechangestoremainprofitableThese
trendsarelikelytocontinuesowhatcangrowersexpectinthefuture
SiteDescriptionsandDataPreparation
Trendsintemperatureovertheperiod1968to2015havebeenpresentedastheyearlyaverage
change(anomaly)fromabaselineperiodof1981to2010(30years)foreachofthesitesshownin
Figure1
DatawereobtainedfromSILO1
(Jeffreyetal2001)arepositoryof
climatedataforAustraliaThereare
twosetsofdataavailableagridded
dailydatasetandthepatchedpoint
dataset(PPD)Dataforthesites
showninTable1wasextracted
fromthePPDwhichprovidesdaily
maximumandminimum
temperaturesfrom1889tothe
presentInterpolatedvaluesare
insertedtomaintaincontinuitywhen
dataaremissingforsomereason
egthestationwasnotoperating
duetomalfunctionInterpolationis
usuallyfromdailysurfacesbutinsomecasesmightcomefrommorelong-termandhenceless
accuratespatialdataThesitesselectedforthestudyhadagenerallylownumberofdayswhendata
wasmissing(Table1)
1httplongpaddockqldgovau
Figure1Australiarsquosappleandpearindustrycentres(white)andlocationsreferredtointhetext
6
MeteorologicalstationsinAustraliathatrecordtemperatureareasmallfractionofthetotalnumber
ofstationsStationsatlocalpostofficesthatrecordeddatabyhandhavesometimesbeenclosedin
favourofautomaticweatherstations(AWS)nearbyoftenatanairfieldThePPDresolvessomeof
theseproblemsandprovidesdataforstationsregardlessoftheirprevioushistoryHoweverthis
reducesthereliabilityofdatasetsfromstationswithalotofmissingobservationsMountBarkerand
OrangewereusedhereinpreferencetoLenswoodandBatlowrespectivelybecausethesestations
havemorereliablehistoricaltemperaturerecords
Table1Descriptionofweatherstationsusedintheanalysis
StationNumber
StationName2
(Shortname)
LongitudeLatitude
FirstObservation LastObservation
Missing()
41175 Applethorpe 15195degE2862degS
1Jan1968 Current 74
81049 TaturaInstituteforSustainableAgriculture
(Shepparton)
14539degE3643degS
2July1965 Current 32
9573 Manjimup 11614degE3425degS
2Jan1968 Current 37
63254 OrangeAgriculturalInstitute
(Orange)
14908degE3332degS
2Jan1976 Current 203
94069 Grove
(Huonville)
14708degE4298degS
1Jan1968 10Feb2010 203
23733 MountBarker 13885degE3507degS
1Jan1968 Current 19
2DataforSheppartonandHuonvillecomesfromtheTaturaInstituteforSustainableAgricultureandGroverespectively
7
ModelsforcalculatingwinterchillrelyonhourlydataHoweverhourlydataisnotgenerallyavailable
fromtheBureauofMeteorologyweatherstationsandneedstobegeneratedfromdailymaximaand
minima
DailydatawereconvertedtohourlyusingtheroutineinthechillRpackage(Luedelingetal2013)
usingtheRStatisticalLanguage(RCoreTeam2015)Thisusestheinterpolationroutinedevelopedin
Linvill(1990)AnexampleofthisinterpolationisshowninFigure2
Figure2ExamplesoftheuseoftheinterpolationroutinetoconvertdailymaximumandminimumtemperaturestohourlyTheorangelineis21December2015andthebluelineis21June2015forApplethorpeDotsindicatethemaximum(orange)andminimum(blue)foreachdaythatwereusedtogeneratetheinterpolatedhourlydata
Reliabilityoftechniquesusedtointerpolatebetweendailyandhourlytemperatures
Hourlytemperaturedatafor2013inApplethorpe(collectedfromanon-siteorchardtemperature
loggerARS1)wasusedtoassesstheaccuracyoftheinterpolationmethodThedailymaximaand
minimaweretakenfromtheorchardhourlydatasetandtheinterpolationmethodwasappliedto
recreatethehourlydataTheorchardhourlydatawasthencomparedwiththeinterpolatedhourly
dataFigure3
Thecorrelationcoefficientis097indicatingacloserelationshipbetweenthetwosetsofdata
howevertheeffectoftheinterpolationcanstillbeseenThesensitivityoftheDynamicModeltothe
discrepanciesbetweenobservedandinterpolatedhourlydataneedstobeassessedintermsofchill
accumulationandheatstress
8
Figure3MeasuredhourlytemperaturedataandhourlydatainterpolatedfromdailymaximumandminimumforApplethorpeLineshowsthe11correlation
Figure4ComparisonofchillportionaccumulationcalculatedfromorchardhourlydatahourlydatainterpolatedfromtheorcharddailymaximaandminimaandthenearbyAWS
Thechillportionscalculatedfromthethreedatasetswereincloseagreementwhichisimportantas
theSILOdataneedstobeusedtoconsiderfutureclimateprojectionsFigure4
Theimpactoftheinterpolationonthecalculationofheatthresholdsismoreproblematic
Interpolationfromdailyorcharddatatohourlyoverestimatedthenumberofhoursexceeding30degC
by36Importantlybasedonthenumberofdaysexceedingthe30degCthresholdtherewasonlya
differenceoftwodaysbetweenorcharddailyandtheautomaticweatherstation(AWS)dataThisis
acceptableandistheapproachthatisusedinourstudy
ModelsofChillAccumulationWhatiswinterchill
Thedormantwinterphaseisanevolutionaryadvantagethatprotectsfruittreesfromcoldweather
damagebypreventingthegrowthofcold-sensitiveshootsandflowersinresponsetoawinterwarm
spellFortreestoresumegrowthinspringthisdormantphasemustbebrokenPerennialfruittrees
breakdormancyaftercertainwinterconditionshavepassed-thetreehasthendeterminedthat
winterhasfinishedandwillbegintoflowerinresponsetowarmtemperaturesThewinterchill
requiredtobreakdormancythechillingrequirementdiffersbycropandvarietyandpossibly
locality
AccumulationofwinterchilltobreakdormancyislargelyatemperaturedependentprocessThe
relationshipofdifferenttemperaturesandtemperatureregimestodormancybreakingarespecies
andcultivar-specificbuttherearesomegeneralaspectsthatarethoughttobeinvolved
bull Freezingtemperaturesdonotcontributetodormancybreaking
9
bull Thereareoptimumtemperaturesfortheaccumulationofwinterchill
bull Temperatureseithersideoftheoptimumdecreasethecontributiontowinterchill
bull Hightemperaturescanundopreviouslyaccumulatedchill
bull Cyclingmoderatetemperatureswitheffectivechillingtemperaturesenhancesthe
accumulationofwinterchill
bull Itisstilllargelyunknownwhenatreebecomessensitivetothechillingtemperaturendashitcould
evenbebeforeleafdrop
TheseassumptionscanbeexpressedasasetofcalculationsthattogetherformachillmodelThe
threemostcommonmodelsareChillHoursUtahChillUnitsandtheDynamicModel
ChillHours
TheChillHoursmodel(Weinberger1950)isbyfarthesimplestmodelItaccumulatesthenumberof
thehourswherethetemperatureislessthan72degCandgreaterthan0degCThereisaformthatalso
includeshoursbelow0degCbutinthisstudywehaveusedthe0degCthreshold
UtahChillUnits
Thismodel(Richardsonetal1974)usesaslightlymorecomplicatedprocedureinwhichlowandhigh
temperaturesadverselyaffecttheaccumulationofchillThemethodofcalculationisasfollows
whereTisthetemperaturerecordedforthehourindegC
LowerLimit(TgtdegC) UpperLimit(Tlt=degC) ChillUnitsContributed
14 0
14 24 05
24 91 10
91 159 05
159 18 -05
18 -10
Hoursspentatorbelow14degCdonotcontributetochillaccumulationGreatestchillaccumulationis
between24andlessthanorequalto91degCTemperaturesabove159degCreducethechill
accumulationastheycontributenegativechillunits
DynamicModel
10
TheDynamicModel(Fishmanetal1987Erezetal1990)whichcalculateschillinChillPortionsis
themostcomplexofthechillmodelsItisthecurrentbestpracticemodelespeciallyinwarmer
climates(Erez2000Luedelingetal2011)andisthereforethemodelwehaveusedforwinterchill
calculationsInthismodelaccumulationofchillisadynamicprocesswherebytheequationsdescribe
thebuild-upofahypotheticaldormancybreakingfactor(DBF)throughatwo-stepprocess
TheaccumulationofDBFisreferredtoasChillPortionsandaChillPortionhasaccumulatedwhenthe
amountofDBFreaches1AtthispointitformspartofthestablepoolandcannotbedestroyedIf
lessthan1iscurrentlyinthelabilepoolitcanbereducedThisisseenwhenwarmtemperatures
occurandthereisnochillaccumulationHoweverthecurrentnumberofChillPortionsisnot
reducedProductionofDBFoccursbetween0degCand12degCandisoptimalbetween6degCand8degCThe
modelalsocapturesthesituationobservedinsometreecropswhereaccumulationofchillis
enhancedwheniftemperaturesintherange13degCto16degCarecycledwithlowertemperatures
11
TrendsinTemperatureandChillAccumulationTrendsintemperaturehavebeenassessedintermsofannualtemperatureandseasonalmaximum
andminimumtemperaturesforeachofthesitesTheBureauofMeteorology(BoM)maintainsaweb
pagethatallowstrendsinclimatevariablestobeassessed3ThemapsshowninFigure5show
consistentwarmingtrendsacrossthepomeandstonefruitgrowingregions
Figure5Trendsintemperaturefrom1970to2015RedshowsthatthetrendintemperaturehasbeentowardshottertemperatureswhileblueshowsatrendtowardscoolertemperaturesThehighertheintensityofcolourthestrongerthetrendcopyCommonwealthofAustralia2016AustralianBureauofMeteorology
Autumnandwinter
Autumnandwintertemperatureslargelydetermineprogressionthroughdormancyandsignificantly
impactfloweringtimingandqualityinpomefruittreesForexamplewarmweatherinautumn
causesdelaysinleafdropandslowstheentranceintodormancyMildwintersresultinginalackof
winterchillcausedelayedunevenandprotractedflowering
3httpwwwbomgovauclimatechangetabs=Trackeramptracker=timeseries
12
MinimumtemperaturesinautumnandwinterhaveincreasedinHuonvilleOrangeandMtBarker
since1968(Figures6)InHuonvilleandOrangethewarmingtrendismoreapparentinminimum
temperaturesthanmaximumsoverthisperiodwhileApplethorpeSheppartonManjimupandMt
Barkerallshowanincreaseinmaximumautumnandwintertemperatures(Figure7)
Applethorpe Shepparton
Manjimup Huonville
Orange MountBarker
Figure6Averageautumn-winterminimumtemperatureanomaliescomparedtoabaseperiodof1981to2010Theblacklineisan11-yearmovingaverage
AtApplethorpeSheppartonandMountBarkeritwasmorelikelythatafter1990maximum
temperaturesduringautumnandwinterwouldgreaterthanthelong-termaverage(Figure7)
13
Applethorpe Shepparton
Manjimup Huonville
Orange MountBarker
Figure7Averageautumn-wintermaximumtemperatureanomaliescomparedtoabaseperiodof1981to2010Theblacklineisan11-yearmovingaverage
Winterchill
ThemildergrowingregionsofApplethorpeManjimupandMtBarkerhaveexperiencedadeclinein
thenumberofchillportionsaccumulatedsince1968(Figure8)Sheppartonhasseenasmall
reductioninwinterchilloverthisperiodwhilethecolderregionsofHuonvilleandOrangehavenot
changedEightoutoftenyearsinManjimupfrom2006to2016havehadlesswinterchillthanthe
long-termaverageFigure8
14
Applethorpe Shepparton
Manjimup Huonville
Orange MountBarker
Figure8Annualanomaly(averagechange)inaccumulationofchillportions(1Marchndash31August)comparedtoabaseperiodof1981to2010Theblacklineisan11-yearmovingaverage
15
SpringandSummer
Temperaturesexperiencedinspringandsummerareanimportantdriverofflowerandfruit
developmentandsignificantlyimpactonfruitqualityinappleandpeartreesForexamplewarm
weatherinspringtendstoshortentheperiodoffloweringandheatinsummerimpactscolour
developmentthroughinhibitionofanthocyanins(Lin-Wangetal2011)Extremesummer
temperaturesinhibitfruitgrowthandcausesunburnbrowning(Flaishmanetal2015)
Applethorpe Shepparton
Manjimup Huonville
Orange MountBarker
Figure9Averagespring-summerminimumtemperatureanomaliescomparedtoabaseperiodof1981to2010Theblacklineisan11-yearmovingaverage
16
TherewereclearwarmingtrendsintheminimumspringandsummertemperaturesatOrangeand
MtBarker(Figure9)AtSheppartonOrangeandMountBarkeritwasthreetofourtimesmorelikely
thattheaverageminimumtemperaturemeasuredafter1990wasgreaterthanthelong-term
averagecomparedtothatmeasuredbefore1990Springandsummermaximumtemperatureshave
warmedinmostlocationssince1968exceptforHuonville(Figure10)Thishasimplicationsforthe
frequencyofextremeheateventsandwarmerspringtemperaturesmayhaveoffsetthereductionin
chillingobservedinmildergrowingregions
Applethorpe Shepparton
Manjimup Huonville
Orange MountBarker
Figure10Averagespring-summermaximum(right)temperatureanomaliescomparedtoabaseperiodof1981to2010Theblacklineisan11-yearmovingaverage
17
ExtremeHeat
Sheppartonhasexperiencedanincreaseinthenumberofextremeheatdays(iemaximum
temperatureexceeded35degC)receivedperyearsince1968(Figure11)Maximumtemperaturesrarely
exceedthisthresholdinApplethorpeandHuonvilleandthesesiteshavenotseenmuchchangeover
theperiodMountBarkershowedasignificanttrendinthenumberofheatdaysandthelastsixyears
inManjimuphavebeenabovethelong-termaverage
Applethorpe Shepparton
Manjimup Huonville
Orange MountBarker
Figure11Annualanomaly(averagechange)inaveragenumberofdayswheremaximumtemperatureexceeds35degCcomparedtoabaseperiodof1981to2010Theblacklineisan11-yearmovingaverage
18
ClimateScenariosforapplegrowingregionsfor2030and2050
Howwerethescenarioschosen
Futureclimateprojectionsarederivedusingsimulationsoftheearthrsquosclimatesystem(GlobalClimate
ModelorGCM)underdifferentscenariosoffuturegreenhousegasandaerosolemissionsThe
scenariosarereferredtoasrepresentativeconcentrationpathways(RCPseeinsetbelow)and
representaplausiblesetoffutureemissionsAGCMusesthisinformationthroughthecomplexset
ofequationsthatdeterminehowtheclimaterespondstochangesintheatmosphereRCPsare
classifiedbytheamountofradiativeforcing(seeinset)thatwillbeexperiencedin2100
The measured and projected levels of atmospheric CO2 are shown in Figure12 It is worth noting
that the projected level in 2100 under RCP 45 is the same as the level reached in 2050 under
RCP 85 The observed emission trends (2005-2012) are in line with the worst-case scenario
RCP85(Petersetal2012) Policy decisions made over the next decade or so will be critical in
RepresentativeConcentrationPathways(RCPs)
Radiativeforcingistheextraheatthattheloweratmospherewillretainasthe
resultofadditionalgreenhousegasesIn1979thisamountedto17Wm-2By
2014thishasrisento29Wm-2In1979theCO2concentrationwas335ppmThe
currentlevelasofFebruary2016is398ppm
RCP45andRCP85havebeenselectedtorepresenttherangeofplausiblefuture
climates
RCP45achievingloweremissionsduetosomemitigationeffortsandtheCO2
concentrationreaching540ppmby2100(risingmoderatelyrapidlyandthen
peakingearly)ndashsettingaminimumtomediumcaseclimatechangescenario
RCP85abusiness-as-usualapproachwithCO2concentrationcontinuingtorapidly
risereaching940ppmby2100ndashsettingaworst-caseclimatechangescenario
Source(ButlerandMontzka2016CSIRO2016)
19
determining the pathway that is taken Data from BoM4 of the global temperature anomaly and
yearly maximum atmospheric CO2 recorded at Mauna Loa from 1958 to 2016 were used to
derive a simple relationship between them that accounts for 82 of the variation (see inset
Figure12)
Figure12Measured(CapeGrimTasmaniaandMaunaLoaHawaii)andFutureCO2forRCP45andRCP85andmeasuredandpredictedtemperatureanomaly(TA)usingtherelationshownintheinset
Todeterminetheprojectionsoffutureclimatechangeitisfirstnecessarytoextractthemonthly
changefactorsClimatechangefactorsallowtheinformationfromcoarse-grainedGCMs(typically
100-200km)toberepresentedatalocalscaleAclimatechangefactorforJanuary2030usingthe
ACCES10modelmightbe+1degCthisisaddedtothedailyobservationsforJanuarytocreatea
possibleclimateThisprocessisrepeatedforeachmonthtimescaleandGCMThisallowsafuture
climatesettobecreatedthatincorporateshistoricalvariability
4httpwwwbomgovauclimatechangeindexshtmltabs=Trackeramptracker=global-timeseries
20
Whiletheactualchangesmaybesmallrelativetodailytemperaturevariationsthebiological
responsemaybesignificantbecauseoftheimpactofthresholdtemperaturesCalculationsofchilling
forexampleusethresholdtemperaturestodeterminethecontributionmadetodailychill
accumulationAsmallshiftintemperaturethroughoutautumnandwintercanhavealargeeffecton
theoutcomeasdemonstratedforManjimupin2030Figure13Theindividualtemperaturechange
foragivenmonthandRCPmayonlybeintheregionof05to12degCbutovertheseasonthisis
enoughtoreducetheaccumulatedchill
Figure13AccumulationofchillforhistoricalaverageconditionsatManjimupandforaprojectedclimatefor2030underRCP45andRCP85(top)Themonthlychangeinaveragetemperaturethatcausedthedifferenceinthechillaccumulationinthefutureisshowinthelowergraph
SelectionofGlobalClimateModels
GlobalClimateModels(GCM)wereselectedfromthelistofmodelsgeneratedbytheClimateFutures
ToolattheClimatechangeinAustraliawebsite5ThreeGCMs(Table2)wereselectedbasedonahigh
Mscore(Watterson1996)thatmeasurestheabilityoftheGCMtorepresenthistoricalobservations
AperfectmatchwouldhaveanMscoreof1000TheGCMsselectedandtheiraverageMscores
wereACCCES1-0(727)HadGEM2-ES(720)andMPI-ESM-LR(720)Inthiscasetheagreement
betweenmodelledandobservedclimatewasbasedontemperaturerainfallandmeansealevel
pressureforthefourseasonsoverthewholeofAustraliaThesemodelsscoredgreaterthan800for
5httpwwwclimatechangeinaustraliagovau
21
surfacetemperaturealoneForRCP45theseGCMswereinagroup(2338GCMs)thatpredicted
warmerwintermaximumandminimumtemperaturesTheprojectedchangeintemperaturewas
from05degCto15degCForRCP85HadGEM2-ESwasgroupedwiththosethatshowedawarmer
minimumtemperaturebuthottermaximumtemperatures15degCto30degC(1340GCMs)ACCESS10
andMPI-ESM-LRweregroupedwiththosethatshowedwarmerminimumandmaximum
temperaturesinwinter(2440)
Table2DescriptionofGCMsusedinthisstudy
GCM Institute AverageM
score1000
FurtherInformationandspatialresolution
(latitudexlongitude)
ACCESS1-0 CSIROand
Bureauof
Meteorology
727 httpsconfluencecsiroaudisplayACCESSHome
(125degx1875deg)
HadGEM2-
ESM
MetOffice
HadleyCentre
720 httpwwwmetofficegovukresearchmodelling-
systemsunified-modelclimate-modelshadgem2
(125degx1875deg)
MPI-ESM-LR MaxPlanck
Institutefor
Meteorology
720 httpwwwmpimetmpgdeensciencemodelsmpi-
esmhtml
(1865degx1875deg)
CalculationofClimateProjectionsforStationData
ClimatechangefactorswereobtainedfromgriddeddatasetsintheCIMP5multi-modelensemble6
(seeTayloretal2011)andappliedasmonthlyclimatechangefactorstothedailydataforeachof
thesites
Themethodusedtoperturbthepresentclimatetoafutureclimateresultsinashiftthatcanbeseen
onamonthlyscale(Figures14and15)Thisisbecausethechangefactorappliedtodaily
temperaturesisthesamewithineachmonth
Figures14and15demonstratethatuntil2030thechoiceoftheRCPhaslittleimpactbutby2050
thedifferencescausedbythehigheremissionsintheRCP85pathwaycanbeclearlyseen
6httpnrm-erddapnciorgauerddapindexhtml
22
Figure14MeanmonthlyminimumtemperaturesforApplethorpefor2030underRCP45(left)andRCP85(right)
Figure15MeanmonthlyminimumtemperaturesforApplethorpefor2050underRCP45(left)andRCP85(right)
23
FutureClimateProjectionsandtheImpactonFloweringThe relationship between chilling and flowering can been described mathematically (Popeetal
2014) such that the amount of chill that accumulates affects the flowering date because the
amount of heat required to promote
flowering is altered(Darbyshireetal
2016) found that for Cripps Pink
apples the minimum amount of chill
required is 34 Chill Portions Less
than this critical amount of chill
cannot be compensated for with
heating and there is no effective
flowering If additional chill is
accumulated then there is a lower
requirement for heat This
relationship between the
accumulation of chill and the heat
requirement is referred to as the
Chill-Overlap Model Figure16
FuturechillaccumulationasmeasuredbyChillPortions(CP)willdeclinein2030and2050under
boththeRCP45andRCP85scenariosatgrowingregionsacrossAustralia(Table3)Thehighest
declineswillbeforManjimupApplethorpeandMtBarkeralthoughallsitesshowadeclineThe
smallestdeclinesareatOrangeandHuonvillewhichdeclinebylessthan5in2030andbylessthan
15in2050undereitherRCP45orRCP85
Using the mathematical relationships embodied in the Chill-Overlap model (Figure16) it is
possible to compare how full bloom dates might change in the future and whether the
increased temperatures during spring and summer can compensate for the reduced chill
accumulation (Table5)
Figure16TheChill-OverlapModelCristhechillrequiredforfloweringCoisthemaximumadditionalchillthatwillreducetheheatrequirementHristheheatrequiredwhenCochillisaccumulatedandHoistheheatrequiredwhenchillisanCr(RedrawnfromDarbyshireetal2016)
24
Table3Summaryofaveragechillportions(1Marchndash31August)for2030and2050usingamoderate(RCP45)toworstcasescenario(RCP85)modellingapproachbasedonhistoricaldatafrom1985to2014Meanof30yearswithlowestandhighestinparentheses
Present
2030 2050
RCP45 RCP85 RCP45 RCP85
Applethorpe 72(62-83) 63(48-75) 60(44-73) 56(41-69) 51(36-65)
Shepparton 84(73-93) 75(63-85) 74(62-86) 71(58-81) 67(57-79)
Manjimup 67(55-82) 57(43-76) 55(42-75) 50(36-72) 47(33-68)
Huonville 105(94-113) 98(81-112) 97(78-110) 93(74-105) 90(71-104)
Orange 100(90-110) 94(85-104) 93(82-101) 90(81-99) 87(78-94)
MountBarker 84(67-93) 74(55-88) 73(53-88) 70(53-84) 65(47-80)
Theconceptofsafewinterchill(SWC)wasintroducedbyLuedelingetal(2009)ameasurethatcan
bethoughtofasthenumberofchillportionsthatagrowercouldexpectin90ofyears
Table4Safewinterchillcalculationsfortheperiod1985to2014
Present
2030 2050
RCP45 RCP85 RCP45 RCP85
Applethorpe 67 55 55 47 46
Shepparton 76 67 68 66 59
Manjimup 60 49 52 44 41
Huonville 99 91 94 88 86
Orange 94 87 87 85 81
MountBarker 74 62 66 60 56
ReductionsintheSWCinApplethorpeManjimupandMountBarkerweresimilarandrangedfrom
16to17in2030and18to32in2050
25
Orangealocationwithahighchillaccumulationtheaveragedateoffullbloomisadvanced(earlier
bloom)by4to5daysOtherlocationsshowedadelayedfullbloomdatewiththegreatestimpactfelt
atManjimupthelocationwiththeleastchillatpresentandintothefuture
Table5Summaryofaveragedateoffullbloom(CrippsPink)for2030and2050usingamoderate(RCP45)toworstcasescenario(RCP85)basedonhistoricaldatafrom1985to2014
Average
PredictedFull
BloomDate Present
2030
2050
RCP45 RCP85 RCP45 RCP85
Applethorpe 4Oct 7Oct 9Oct 12Oct 16Oct
Shepparton 30Sep 3Oct 3Oct 5Oct 6Oct
Manjimup 16Oct 22Oct 25Oct 30Oct 2Nov
Huonville 26Sep 27Sep 29Sep 29Sep 29Sep
Orange 2Oct 28Sep 28Sep 28Sep 27Sep
MountBarker 1Oct 5Oct 4Oct 6Oct 8Oct
Delaysinfullbloomdatearecausedwhenlesswinterchillisaccumulatedduringtheautumnand
winterperiodandconsequentlymoreheatisneededtopromotefloweringManjimupislikelyto
experiencethegreatestdelayinfullbloomdatesinfutureclimatescomparedwithotherlocations
Thisisbecausechillaccumulationabove34CPthisisCrFigure16-thechilloverlapmodelin
Manjimupdropsfrom22CPinthepresentclimateto14ndash16CPin2030and10ndash12CPin2050To
compensateforthisagreateraboutofheatneedstobeaccumulated(iemovingfromHrtowards
HoinFigure16)andthisrequiredanextra6to9daysin2030and14to17daysin2050In
comparisonatOrangethemuchcoolerwintertemperaturesandhighchillaccumulationloweredthe
requirementforheatThishelpedtoadvancethedatefullbloombecauseofhigherspring
temperatures(Figure9andFigure10)
FutureProjectionsofImpactonQualityOneofthemainrisksforproductionisextremeheatdaysasthisleadstosunburnbrowningSun
damageriskinRoyalGalawasstudiedinapplegrowingregionsinAustralia(Darbyshireetal2015)
Theydevisedabrowningriskdayfornon-nettedandnettedorchardsbasedonairtemperaturesand
26
foundthatdailymaximumtemperaturesgreaterthan341degCinnon-nettedorchardsand379degCin
nettedorchardswereassociatedwithanincreasedriskofbrowningWhilethatstudyandWebbet
al(2016)consideredJanuarytemperatureswehaveextendedtheanalysistoincludeFebruaryas
thiscoincideswiththefruitingperiodUsingthedailymaximumtemperaturesforJanuaryand
Februaryfrom1981to2010(present)andfutureclimatesin2030and2050wecalculatedthe
browningriskasthepercentageofdaysthatexceededthetemperaturethresholdswithandwithout
nettingFollowingWebbetal(2016)weclassifiedbrowningriskin5categories
pound5 gt5to10 gt10to20 gt20to30 gt30to50
Table6Summaryofmeanvaluesforbrowningrisk(percentageofdays)forJanuaryandFebruary
WithoutNetting 2030 2050
Site Present RCP45 RCP85 RCP45 RCP85
Applethorpe 11 24 28 28 49
Shepparton 183 239 268 275 358
Manjimup 100 152 152 166 198
Huonville 24 34 38 45 42
Orange 24 38 44 37 84
MtBarker 173 207 229 232 258
WithNetting 2030 2050
Site Present RCP45 RCP85 RCP45 RCP85
Applethorpe 00 00 01 01 04
Shepparton 48 70 90 88 132
Manjimup 16 38 39 44 60
Huonville 03 06 10 12 11
Orange 01 01 01 01 07
MtBarker 54 72 91 94 107
27
SheppartonMountBarkerandManjimupwillbemostadverselyaffectedwithoutnettinghowever
thiscanbelargelyoffsetwithnettingWithoutnettingManjimupmovestothesamecategoryby
2030thatSheppartonandMountBarkercurrentlyexperienceApplethorpeHuonvilleandtoalesser
extentOrangeareinlowriskcategoriesandarelikelytoremainthatwayinthefuture
DiscussionandConclusionsClimatechangerepresentsanimportantfactorforperennialtreecropswhetherthatisbecauseof
reducedchillorincreasedriskofsunburnbrowningTherehasbeenatendencytoconsiderthat
applesgenerallyhaveahighchillingrequirementyetsuccessfulcropsaregrowninSouthAfrica
(Cook2010)andManjimupwherethechillislowincomparisontotraditionalgrowingregionsLow
chillcancausearangeofproblemsincludingdelayedorerraticbudbreakbudabscissionlower
flowerandfruitqualityandreducedyield(seetableinAtkinsonetal2013)Safewinterchill
(Luedelingetal2009)underfutureclimatesisapossibleindicationofwhattoexpectApplethorpe
recordsalowerSWCin2030forthemoreoptimisticRCP45thanpresentdayManjimup(Table4)
Perennialtreecropindustriesareparticularlyvulnerabletoclimatechangebecauseofthecostand
longevityoforchardestablishmentWhilemanygrowershavebeenadaptingtothetrendsalready
evidentinahighlyvariableclimatetheimpactoffutureclimatemightbeunderestimatedbecauseof
thelanguageusedbyclimatescientistsandthemediaA1-2degCincreaseintemperaturemightseem
trivialconsideringdailyfluctuationshoweverascanbeseenfromtheanalysesthesecan
accumulateacrosstheseasonandhavelargerimpactsthroughdelayedfloweringandincreasedrisk
ofsundamage
Theimpactofchangesintemperaturesonfloweringinthefuturearecomplicatedbytheinteraction
betweenareductioninchillaccumulationduringwinterandincreasedspringandsummer
temperaturesWhilethechill-overlapmodelisusefulinunderstandingtheserelationshipsitisbased
largelyonhypotheticalprocessesGapsinourknowledgesuchasunderstandingwhenplantsstart
andstopchillaccumulationneedtobebasedonphysiologyietheunderstandingofthechemical
processes(Atkinsonetal2013)Thishasproveddifficultbecausetherearenooutwardsignsthat
canbeusedItishopedthatchemicalmarkersfortheseprocessescanbefoundsothatour
understandingwillbegreatlyadvancedThiswouldhavetheadvantageofbeingabletomakebetter
estimatesofhowthingsmightchangeinthefutureandpossiblyleadtobreakthroughsinbreeding
programsAtamorefundamentallevelourcurrentbestmodelformeasuringandpredictingchill
accumulationtheDynamicModelusesparametersthathaveonlybeenparameterisedforpeach
28
becausetheonerousexperimentalproceduresrequiredtoderivethemFurthermoreitreliesona
hypotheticalfactorthatmayormaynotexistThemodelespeciallyaspartofthechilloverlap
modelremainsthemostusefulwayofpredictingflowering
Take-homemessagesfromthehistoricalrecord
bull Allpomefruitgrowingregionshavegenerallyseenanincreasingtrendinmaximum
temperaturesinwinterandmaximumandminimumspringtemperatures
bull Thestrongestdownwardstrendinchillaccumulationhasoccurredatthemilderlocationsof
ApplethorpeManjimupandMountBarker
bull SpringandsummermaximumtemperaturesatalllocationsexceptHuonvilleshowan
upwardtrendThisisparticularlynoticeableforManjimupwhichhasrecordedahigherthan
long-termaveragemaximumsince2009
bull ExtremeheatisanemergingprobleminManjimupandgrowingregionsinNSWHeatdamage
hasbeenaprobleminVictoriaandtheincreaseobservedinManjimuphasprompteddetailed
studiesofhowandwhenbrowningoccursandatrialofnetsinthoseareas
Take-homemessagesfromthefuturescenarios
bull Smallincreasesinaveragetemperaturesmultiplytheireffectthroughtheaccumulationof
timeaboveorbelowthresholds
bull Theresponseofthepomefruittreetoreducedchillmaybepartiallyoffsetbyincreased
springandsummertemperaturesbutourcurrentbestunderstandingofthissuggeststhat
thiscannotoccurindefinitely
bull Upto2030-2040thedifferencesbetweentheclimatechangescenariosaresmallThe
childrenofthegrowerswhoarefarmingtodaymayin2050befacingaverydifferent
growingenvironmentInApplethorpewherealowchillyearis60CPnowwillfeellikeagood
yearandtheworstyearswillbelikenothingthathasbeenencounteredbefore
bull Thereisacomplexinterplaybetweenchillingandwarmingonthetimingoffloweringthatwe
areonlyjuststartingtounderstandMuchofourknowledgeofhowpomefruittreesrespond
hasbeeninconditionswherechillhasbeenmorethanadequateThechilloverlapmodelhas
beenusefulasmodelofthissituationbutthebiologicalbasisisuncertain
bull ExtremeheatwillcontinuetobeaprobleminhotsummerregionssuchasSheppartonwhere
italreadypresentschallengesforfruitqualityandisanemergingproblemforregionslike
ManjimupwhichcurrentlyhaveamildersummerclimateTheimpactonmarketablequalityis
wellknownandinvestmentinnettingseemstobethemostpracticalsolution
29
ReferencesAtkinsonCJRMBrennanandHGJones2013Decliningchillinganditsimpactontemperate
perennialcrops9148ndash62
ButlerJHandSAMontzka2016theNOAAannualgreenhousegasindex(AGGI)
httpwwwesrlnoaagovgmdaggiaggihtml
CookNC2010Appleproductionunderconditionsofsub-optimalwinterchillinginSouth
Africa199ndash204
CSIRO2016CapeGrimGreenhouseGasdataCSIROhttpwwwcsiroaugreenhouse-gases
DarbyshireRKPopeandIGoodwin2016Anevaluationofthechilloverlapmodeltopredict
floweringtimeinappletree198142ndash149
DarbyshireRLMcClymontandIGoodwin2015SundamageriskofRoyalGalaappleinfruit-
growingdistrictsinAustralia43222ndash232
ErezA2000BudDormancyPhenomenonProblemsandSolutionsintheTropicsandSubtropics
Pages17ndash48inTemperateFruitCropsinWarmClimatesSpringerNetherlandsDordrecht
ErezASFishmanGCLinsley-NoakesandPAllan1990TheDynamicModelforRestCompletion
inPeachBuds165ndash174
FishmanSAErezandGACouvillon1987Thetemperaturedependenceofdormancybreakingin
plantsMathematicalanalysisofatwo-stepmodelinvolvingacooperativetransition124473ndash483
FlaishmanMAYPelesYDahanSMilo-CochaviAFriemanandANaor2015Differential
responseofcell-cycleandcell-expansionregulatorstoheatstressinapple(Malusdomestica)
fruitletsPlantScience23382ndash94
JeffreySJJOCarterKBMoodieandARBeswick2001Usingspatialinterpolationto
constructacomprehensivearchiveofAustralianclimatedata16309ndash330
Lin-WangKUIDMichelettiJPalmerRVolzLLozanoREspleyRPHellensDChagnEgraveDD
RowanMTroggioIIglesiasandACAllan2011Hightemperaturereducesapplefruitcolourvia
modulationoftheanthocyaninregulatorycomplex341176ndash1190
LinvillDE1990CalculatingChillingHoursandChillUnitsfromDailyMaximumandMinimum
TemperatureObservations2514ndash16
30
LuedelingEAKunzandMBlanke2013Identificationofchillingandheatrequirementsofcherry
treesmdashastatisticalapproach57679ndash689
LuedelingEEHGirvetzMASemenovandPHBrown2011ClimateChangeAffectsWinter
ChillforTemperateFruitandNutTreesPLoSONE6e20155
LuedelingEMZhangandEHGirvetz2009ClimaticChangesLeadtoDecliningWinterChillfor
FruitandNutTreesinCaliforniaduring1950ndash2099PLoSONE4e6166
PetersGPRMAndrewTBodenJGCanadellPCiaisCLeQuereGMarlandMRRaupach
andCWilson2012Thechallengetokeepglobalwarmingbelow2degC34ndash6
PopeKSDDaSilvaPHBrownandTMDeJong2014Abiologicallybasedapproachto
modelingspringphenologyintemperatedeciduoustreesAgriculturalandForestMeteorology198ndash
19915ndash23
RCoreTeam2015RALanguageandEnvironmentforStatisticalComputingRFoundationfor
StatisticalComputingViennaAustria
RichardsonEASDSeeleyandRDWalker1974Amodelforestimatingthecompletionofrest
forRedHavenandElbertapeach9331ndash332
TaylorKERJStoufferandGAMeehl2011AnOverviewofCMIP5andtheExperimentDesign
93485ndash498
WattersonIG1996Non-dimensionalmeasuresofclimatemodelperformance16379ndash391
WebbLRDarbyshireTErwinandIGoodwin2016Arobustimpactassessmentthatinforms
actionableclimatechangeadaptationfuturesunburnbrowningriskinapple
WeinbergerJH1950Chillingrequirementsofpeachvarieties56122ndash128
Flowering in pome fruit trees across Australia
Implications of a changing climate
Heidi Parkes and Neil White Department of Agriculture and Fisheries Queensland
November 2016
This publication has been compiled by Heidi Parkes and Neil White of Horticulture and Forestry Science Department of Agriculture and Fisheries copy State of Queensland 2016 The Queensland Government supports and encourages the dissemination and exchange of its information The copyright in this publication is licensed under a Creative Commons Attribution 30 Australia (CC BY) licence Under this licence you are free without having to seek our permission to use this publication in accordance with the licence terms
You must keep intact the copyright notice and attribute the State of Queensland as the source of the publication Note Some content in this publication may have different licence terms as indicated For more information on this licence visit httpcreativecommonsorglicensesby30audeeden The information contained herein is subject to change without notice The Queensland Government shall not be liable for technical or other errors or omissions contained herein The readeruser accepts all risks and responsibility for losses damages costs and other consequences resulting directly or indirectly from using this information
Summary
Australia has warmed by 1degC in the last 100 years and temperatures are predicted to continue warming This will result in reduced winter chill for many apple and pear growing regions of Australia and it is not clear how this will impact on pome fruit production To better understand how climate change will impact flowering in pome fruit trees research was undertaken to evaluate the timing and quality of flowering in cultivars of apple and pear across Australia and how they relate to temperatures received in the orchard Green tip flowering and temperature data was collected in the spring of 2012 2013 2014 and 2015 for cultivars of apple and pear grown in the climatically distinct regions of Applethorpe (Queensland) Shepparton (Victoria) and Manjimup (Western Australia)
For all years of the study Shepparton received the most winter chill with 89 chill portions on average followed by Applethorpe (75 chill portions) and Manjimup (63 chill portions) Low winter chill in Manjimup was associated with greater variation in green tip and full bloom dates between years cultivars and individual trees compared with observations from Applethorpe and Shepparton Additionally trees in Manjimup displayed a long and protracted flowering period compared with the other sites The patterns of flowering observed in Manjimup are possibly the result of inadequate chill Shepparton the site with the most winter chill showed the greatest consistency in green tip and flowering dates
Results from this research support findings from previous studies performed in other parts of the world showing that apples grown in warmer climates exhibit increased variability in flowering Uneven and irregular flowering results in the reduced ability to predict timing of orchard operations more difficult pollination management challenges for thinning and crop load management and can result in increased variability of fruit maturity at harvest
As the climate warms low chill years will become more frequent in milder growing regions of Australia and will likely result in symptoms of inadequate chill in some cultivars Advances in the timing of flowering might be observed in cooler growing regions Australian growers already manage seasonal changes in flowering time and it may be the increasingly protracted and variable flowering that presents the greater management challenge
Options for adaptation to low chill years include planting lower chill cultivars management of delayed and variable flowering with the use of dormancy-breakers and adjustments to chemical and hand thinning practices to reduce variability in fruit size and maturity
Climate change will add significant variability into the pome fruit crop production system This will present challenges for the Australian industry in its ability to consistently supply high quality fruit into export markets and in maintenance of the uniform orchard blocks required to maximise the benefits of mechanisation Ongoing observations of flowering performance and its relationship with chilling will be necessary for making informed predictions about future block and cultivar profitability
Table of contents
Introduction 1
Study objectives 1
Materials and methods 1
Site description 1
Green tip and flowering data collection 3
Calculation of winter chill 5
Results and discussion 5
Winter chill and spring heat 5
Green tip and flowering 7
Green tip and flowering time 7
Variation between cultivars and locations 7
Variation between years 9
Quality of flowering 13
Variation between cultivars and locations 13
Flowering overlap and pollination 15
Flowering and temperature implications of a changing climate 15
Conclusions 17
Key messages 17
Recommendations 18
Industry 18
Scientific research needs 19
Acknowledgements 20
References 20
Table of figures
Figure 1 Site locations across Australia (large blue dot) 2
Figure 2 Mean monthly temperatures for Shepparton Applethorpe and Manjimup 3
Figure 3 Chill accumulation across sites and years Number in brackets is the total chill portions received up to 31 August 5
Figure 4 Green tip (green) and full bloom (pink) dates for apple cultivars in Applethorpe Shepparton and Manjimup Data is the average of observations from 2012 to 2015 with bars indicating the confidence interval 8
Figure 5 Green tip (green) and full bloom (pink) dates for pear cultivars in Applethorpe Shepparton and Manjimup Data is the average of observations from 2012 to 2015 with bars indicating the confidence interval 9
Figure 6 Green tip (green) and full bloom (pink) dates for apple cultivars grown in Applethorpe Shepparton and Manjimup 2013 and 2014 Data points are the average of individual tree observations 11
Figure 7 Chill accumulation in Applethorpe Shepparton and Manjimup 2012 to 2015 Number in brackets is the total chill portions received up to 31 August 12
Figure 8 First flower (orange) and full bloom (pink) dates for apple cultivars in Applethorpe Shepparton and Manjimup Data is the average of observations from 2012 to 2015 Bars indicate the confidence interval 14
Figure 9 First flower (orange) and full bloom (pink) dates for pear cultivars in Applethorpe Shepparton and Manjimup Data is the average of observations from 2012 to 2015 Bars indicate the confidence interval 15
Table of tables
Table 1 Site details 2
Table 2 Description of trees used for phenology observations 4
Flowering in pome fruit trees across Australia Department of Agriculture and Fisheries 2016 1
Introduction
Flowering timing and quality in apple and pear trees is determined by interactions between the genetics of a cultivar and the temperatures it experiences in the orchard throughout the year Cultivars require a certain amount of winter chill and a certain amount of heat for bud dormancy release and flowering and these requirements are largely genetically determined (Cannell 1989 Saure 1985 Samish 1954) Day length is not believed to have a significant role in the timing of flowering in apple (Dennis 2003)
Australia has warmed by 1degC in the last 100 years and temperatures are predicted to continue warming (State of the climate 2016) This will result in reduced winter chill for many apple and pear growing regions of Australia (Darbyshire et al 2013b Hennessy and Clayton-Greene 1995) It is not yet clear what the impact of this will be on the timing and quality of bud dormancy release and flowering in commercial pome fruit cultivars and therefore the potential impacts on productivity Advances in flowering time with increased temperatures has been observed in temperate fruit trees globally (Legave et al 2013) however effects of recent warming in Australia on pome tree flowering are not as clear (Darbyshire et al 2013a)
Changes in timing of flowering may have impacts on yield through the loss of flowering overlap between a cultivar and its pollinisers and potential for increased frost risk (Kaukoranta et al 2010) Variable and protracted patterns of flowering are likely to occur in locations where the warmer climate leads to inadequate chill (Erez 2000) Poor quality of flowering impacts production and profitability through reductions in fruit set difficulties with chemical thinning and greater variability of fruit maturity at harvest (Theron 2013 Oukabli 2003)
Understanding potential impacts of climate change is essential for the timely implementation of appropriate adaptation strategies (Cobon et al 2009) To understand how warming temperatures might impact on flowering it is necessary to first understand the existing flowering behaviour of pome fruit tree cultivars across Australia and how it relates to temperatures received in the orchard
Study objectives
The objective of this research was to evaluate the timing and quality of green tip and flowering in cultivars of apple and pear across Australia and how they relate to temperature to contribute towards understanding of how climate change will impact on pome fruit production
Materials and methods
Site description
Green tip and flowering data was collected in the spring of 2012 2013 2014 and 2015 for cultivars of apple and pear grown in commercial orchards and research facilities situated in Applethorpe (Queensland) Shepparton (Victoria) and Manjimup (Western Australia) (Figure 1 and Table 1)
Flowering in pome fruit trees across Australia Department of Agriculture and Fisheries 2016 2
Figure 1 Site locations across Australia (large blue dot)
Table 1 Site details
State Location Orchard Latitude and Longitude
Cultivars
Qld Applethorpe Department of Agriculture and Fisheries Qld Applethorpe Research Facility
2852 S 15190 E
All apples and pears (except Josephine)
C Pozzebon amp Co Orchard 2863 S 15197 E Josephine pear
Vic Shepparton Silversteinrsquos orchard Shepparton East
3642 S 14546 E All apples and pears
WA Manjimup Department of Agriculture and Food WA Manjimup Horticultural research Institute
3418 S 11607 E All apples
Newton Brothers Orchards
3413 S 11607 E All pears
The three study sites are climatically diverse with Shepparton experiencing the hottest summers and Manjimup the warmest winters Applethorpe has the highest average spring temperatures (Figure 2)
Flowering in pome fruit trees across Australia Department of Agriculture and Fisheries 2016 3
Figure 2 Mean monthly temperatures for Shepparton Applethorpe and Manjimup
Green tip and flowering data collection
Cultivars (including crab apple pollinisers) and rootstocks used for phenology data collection are described in Table 2 All observations were taken on mature productive trees
Flowering in pome fruit trees across Australia Department of Agriculture and Fisheries 2016 4
Table 2 Description of trees used for phenology observations
Study site Tree crop Cultivar Rootstock1 Number of trees (yearly observation)
Net
Applethorpe Apple Braeburn M26 5 Yes
Cripps Pink (Pink Ladytrade) M26 MM106
5 3
Yes
Cripps Red (Sundownertrade) M26 MM106
5 5
Yes
Fuji M26 5 Yes
Galaxy (Gala) M26 5 Yes
Granny Smith M26 MM106
4 5
Yes
Hi Early (Red delicious) M26 5 Yes
Jonathan M26 5 Yes
Kalei M26 MM106
5 5
Yes
Manchurian Crab apple MM102 5 Yes
Pear Josephine D6 5 Yes
Packhamrsquos Triumph D6 5 No
Williamsrsquo Bon Chreacutetien D6 5 No
Wintercole D6 5 No
Shepparton Apple Braeburn MM106 5 Yes
Cripps Pink (Pink Ladytrade) MM106 5 Yes
Cripps Red (Sundownertrade) M26 MM106
5 5
Yes
Galaxy (Gala) MM106 5 Yes
Granny Smith MM106 5 Yes
Manchurian Crab apple MM106 5 Yes
Pear Josephine D6 5 Yes
Packhamrsquos Triumph D6 5 Yes
Williamsrsquo Bon Chreacutetien D6 5 Yes
Manjimup Apple
Braeburn MM109 2 No
Cripps Pink (Pink Ladytrade) MM104 M26
2 2
No
Cripps Red (Sundownertrade) MM104 M26
3 1
No
Galaxy (Gala) MM104 2 No
Granny Smith MM104 2 No
Hi Early (Red delicious) MM104 2 No
Jonathan MM106 2 No
Golden Hornet Crab apple MM104 2 No
Red Fuji (Fuji) MM104 2 No
Pear Josephine D6 5 No
Packhamrsquos Triumph D6 5 No
Williamsrsquo Bon Chreacutetien D6 5 No 1 Rootstock effects were not considered in this analysis as previous studies indicated that rootstocks did not significantly impact the timing of green tip and flowering dates in data collected for this study (Darbyshire 2016) Green tip and flowering data was collected three times per week at the whole tree level For each tree the date of green tip first open flower and full bloom were recorded A tree was defined as being at lsquogreen tiprsquo when 5 of the buds had observable green tips corresponding to the 07 stage in the international BBCH code for pome fruit (Meier et al 1994) A tree was defined as being at lsquofull bloomrsquo when 80 of the flowers were open (BBCH code stage 65)
Flowering in pome fruit trees across Australia Department of Agriculture and Fisheries 2016 5
Assessments of flowering quality were made based on the duration between first open flower and full bloom on the assumption that a protracted period of time between these events was a reflection of variable and uneven flowering This assumption was based on our observations of flowering in Manjimup and Applethorpe
A 95 confidence interval was used to represent variability in data about the mean It indicates that 95 of the data values recorded fall within this particular interval
Ideally green tip and flowering data would have been collected from a number of orchards across each region to fully capture variation within regions caused by microclimate soils differences in tree structure nutrition and so on Time and resources required to collect such data were not available and therefore observations were taken from representative orchards in each region In future more comprehensive data will be collected on orchards through the use of sensing and mapping technologies which will enable more sophisticated and comprehensive analysis of flowering patterns and variability between and within locations
Calculation of winter chill
The Dynamic model (Erez et al 1990 Fishman et al 1987) was used to calculate winter chill from on-site hourly temperature data recorded in the orchard This is the current lsquobest-practicersquo model and has been shown to perform better than other models for calculating winter chill particularly in mild winter climates such as Australia (Darbyshire et al 2013a Luedeling et al 2009)
Note that while chill is commonly referred to as lsquowinter chillrsquo it has been calculated here from the beginning of autumn until the end of winter (1 March to 31 August) The point at which tree buds become sensitive to chilling temperatures remains to be determined
Results and discussion
Winter chill and spring heat
Figure 3 Chill accumulation across sites and years Number in brackets is the total chill portions received up to 31 August
Flowering in pome fruit trees across Australia Department of Agriculture and Fisheries 2016 6
The pattern of winter chill accumulation was different between locations and years (Figure 3) For all years of the study Shepparton was the coolest site followed by Applethorpe and Manjimup Shepparton and Applethorpe received above-average chill portions for the four year period while Manjimup received below-average chill in 2013 and 2014 Historical chill portion averages for the 1981 to 2010 period are Shepparton 78 Applethorpe 70 and Manjimup 64
Lower winter chill tended to be associated with a later start to chill accumulation (that is a warmer autumn) and a more uneven chill accumulation curve For example 2012 2013 and 2014 in Manjimup were distinguished by the irregular accumulation of chill portions caused by climatic conditions where cold autumn and winter temperatures were interspersed with spells of warm weather This resulted in somewhat lsquowobblyrsquo chill accumulation curves
In this study winter chill accumulation was calculated from 1 March to 31 August according to previously published protocols (Darbyshire et al 2016) Questions remain about when to start and stop calculating chill It is not clear that it is meaningful to start calculating chill for late season cultivars before fruit has been harvested and or before leaves have fallen or indeed to stop calculating chill before a cultivar such as lsquoHi Earlyrsquo has reached green tip It seems likely that the period of sensitivity to chill accumulation will vary between cultivars however with current gaps in understanding of the physiological processes involved in the movement through dormancy it is not possible to determine cultivar-specific chilling periods
It is also quite likely that there are differences in the impact of chilling temperatures on the dormancy-breaking process depending on the time of year For example chill received earlier in the winter may be more effective than chill received in late winter Further research is required to fully elucidate these features of dormancy-breaking in pome fruit
Table 3 Average spring temperatures1 for 2012 to 2015 in Applethorpe Shepparton and
Manjimup
Location Year Average monthly temperature
September October November
Applethorpe Long term average2 124 154 177 2012 128 152 192 2013 149 171 185 2014 125 175 218 2015 118 170 202
Shepparton Long term average2 114 142 175 2012 118 139 191 2013 133 141 168 2014 121 160 189 2015 115 186 189
Manjimup Long term average2 119 136 160 2012 129 155 163 2013 126 150 180 2014 136 154 163 2015 132 171 186
1Temperature data sourced from Australian Bureau of Meteorology website 2As determined by the Australian Bureau of Meteorology
Flowering in pome fruit trees across Australia Department of Agriculture and Fisheries 2016 7
According to the long term average Applethorpe has the warmest spring compared with Shepparton and then Manjimup (Table 3) With few exceptions spring temperatures were above-average at all sites throughout the period of the study
Green tip and flowering
Differences in chill accumulation and spring heat between locations and years were accompanied by variability in the timing and pattern of green tip and flowering of apple and pear cultivars Results were analysed to develop a picture of green tip and flowering patterns in Applethorpe Shepparton and Manjimup over the four years of the study
Green tip and flowering time
Variation between cultivars and locations
Green tip and flowering dates were later in Manjimup than in Applethorpe and Shepparton (Figure 4) Across all cultivars the average green tip date was 4 September in Applethorpe 3 September in Shepparton and 25 September in Manjimup while the average full bloom date was 1 October in Applethorpe and Shepparton and 25 October in Manjimup
Variability in green tip and full bloom dates between years and individual trees was greater in Manjimup compared with Applethorpe and Shepparton as reflected by the length of the bars in Figure 4 Variability in green tip and full bloom dates between cultivars was also greater in Manjimup compared with the other sites Average green tip dates for all cultivars were spread across 32 days in Manjimup compared with 15 days in Applethorpe and 5 days in Shepparton Similarly average full bloom dates were spread across 19 days in Manjimup compared with 9 days in Applethorpe and 7 days in Shepparton
Overall Shepparton the site with the greatest winter chill showed the most consistency in green tip and flowering time from year to year while the relatively low chill in Manjimup was associated with the greatest variability Greater consistency has benefits for flowering and pollination management including determination of appropriate polliniser plantings and planning of pollination services It also benefits tactical decision making for orchard operations generally Improvements in the ability of models to predict flowering dates would remove the uncertainty associated with variability making it easier to manage
Flowering in pome fruit trees across Australia Department of Agriculture and Fisheries 2016 8
Figure 4 Green tip (green) and full bloom (pink) dates for apple cultivars in Applethorpe Shepparton and Manjimup Data is the average of observations from 2012 to 2015 with bars indicating the confidence interval
Shepparton
Manjimup
Applethorpe
Flowering in pome fruit trees across Australia Department of Agriculture and Fisheries 2016 9
Differences in Green tip and flowering patterns between locations were less consistent for pear cultivars (Figure 5) In Manjimup full bloom dates for lsquoJosephinersquo lsquoPackhamrsquo and lsquoWilliamsrsquo were later across all years compared with the other sites Shepparton showed the least variability in full bloom dates across years trees and cultivars
Figure 5 Green tip (green) and full bloom (pink) dates for pear cultivars in Applethorpe Shepparton and Manjimup Data is the average of observations from 2012 to 2015 with bars indicating the confidence interval
Variation between years
Variability in the dates of green tip and flowering between individual years was evaluated to determine the degree to which growers are currently managing shifts in flowering timing from season to season at each location
In Applethorpe green tip and flowering were consistently later across all cultivars in 2014 compared with the other years of the study (Figure 6 shows comparison between 2013 and 2014 data for other year comparisons not shown) On average green tip was 9 days later in 2014 compared with 2013 and full bloom was 12 days later (Figure 6)
This consistent shift in timing was associated with an unusual autumn and winter chill accumulation pattern (Figure 7) Total chill accumulated up to 31 August was similar in 2013 and 2014 73 and 75 chill portions respectively However in 2014 there was a warm week in late-May to early-June that resulted in a pause in accumulation of chill which can be seen in the chill curve (Figure 7) Even though the total chill accumulated for 2014 eventually caught up with the other curves by the end of August this plateau appears to have impacted the timing of flowering (although other factors such as the role of heat cannot be ruled out in this study) There was little difference in green tip and flowering dates between the other years
In Shepparton there was little variability in green tip and flowering dates between any of the four years of the study When averaged across cultivars green tip varied by 5 days between 2013 and 2014 and full bloom dates varied by 4 days (Figure 6) Plateaus in the accumulation of chill in late-May early-June of 2013 and 2014 (Figure 7) were not associated with big shifts in flowering time as
Flowering in pome fruit trees across Australia Department of Agriculture and Fisheries 2016 10
was observed for Applethorpe perhaps due to the higher amount of overall chill received in Shepparton
In Manjimup green tip and flowering dates were highly variable between years 2013 was a lower chill year than 2014 with 55 and 59 chill portions received respectively Shifts in green tip and full bloom dates were not consistent between cultivars (Figure 6) For example in 2014 full bloom was 15 days earlier in rsquoGalaxyrsquo and 10 days later in lsquoHi Earlyrsquo compared with full bloom dates for those cultivars in 2013 while the full bloom dates for lsquoGranny Smithrsquo were similar in both years (Figure 6)
Flowering in pome fruit trees across Australia Department of Agriculture and Fisheries 2016 11
Figure 6 Green tip (green) and full bloom (pink) dates for apple cultivars grown in Applethorpe Shepparton and Manjimup 2013 and 2014 Data points are the average of individual tree observations
Shepparton
Manjimup
Applethorpe
Flowering in pome fruit trees across Australia Department of Agriculture and Fisheries 2016 12
Figure 7 Chill accumulation in Applethorpe Shepparton and Manjimup 2012 to 2015 Number in brackets is the total chill portions received up to 31 August
Shepparton
Manjimup
Applethorpe
Flowering in pome fruit trees across Australia Department of Agriculture and Fisheries 2016 13
Quality of flowering
Variation between cultivars and locations
The duration between the first flower opening and full bloom was more than twice as long in Manjimup (21 days) as it was in Applethorpe (9 days) and Shepparton (10 days) when averaged across cultivars and years (Figure 8) The protracted pattern of flowering was consistently observed in Manjimup over the period of the study and was largely the result of irregular and uneven bud movement within individual tree canopies (data not shown)
A prolonged and irregular period of flowering can be difficult to manage for a number of reasons Determining an appropriate chemical thinning program is challenging when buds are at multiple stages of green tip and flowering on each tree within the block at any given time (Theron 2013) Fruitlets are likely to vary greatly in size and development stage and therefore careful attention is required at the time of hand thinning to ensure that fruitlets are thinned in a manner that optimises crop uniformity and reduces the spread of fruit maturity at harvest (Theron 2013 Erez 2000)
Flowering in pome fruit trees across Australia Department of Agriculture and Fisheries 2016 14
Figure 8 First flower (orange) and full bloom (pink) dates for apple cultivars in Applethorpe Shepparton and Manjimup Data is the average of observations from 2012 to 2015 Bars indicate the confidence interval
Shepparton
Manjimup
Applethorpe
Flowering in pome fruit trees across Australia Department of Agriculture and Fisheries 2016 15
In cultivars of pear the duration of the period between the first flower opening and full bloom was the greatest in Manjimup (Figure 9) as was observed in apple However the patterns of flowering were less consistent within and between locations
Figure 9 First flower (orange) and full bloom (pink) dates for pear cultivars in Applethorpe Shepparton and Manjimup Data is the average of observations from 2012 to 2015 Bars indicate the confidence interval
Flowering overlap and pollination
Overlap of flowering between a cultivar and its pollinisers is essential for good fruit set (Ramirez and Davenport 2013) Changes in the timing of flowering between seasons or across years that result in the loss of flowering synchronisation can therefore result in reduced yields Large shifts in flowering dates like those observed between cultivars and years in Manjimup (Figure 8) increase the risk of poor flowering overlap in any particular season and make it more difficult to select appropriate pollinisers Use of floral bouquets or artificial pollination methods can compensate for loss in flowering overlap however these methods require significant additional labour (Dennis 2003)
The chances of achieving good flowering overlap each season are greatly increased by planting multiple polliniser cultivars with early middle and late flowering habits to ensure a good supply of pollen throughout the flowering period of the commercial cultivar and to reduce frost risk (Delaplane and Mayer 2000 Dennis 2003) Cultivars that flower profusely over an extended period of time generally make good pollinisers (Jackson 2003)
Shifts in flowering timing do not affect fruit set if similar shifts occur in both the cultivar and its pollinisers This was observed in Applethorpe in 2014 when flowering in all cultivars was consistently delayed compared with flowering in 2013
Flowering and temperature implications of a changing climate
Apple trees in Manjimup exhibited greater variability in green tip and flowering dates and a more protracted flowering period compared with trees in Applethorpe and Shepparton Delayed and uneven flowering are symptoms of inadequate chill and it seems likely that the observed patterns of
Flowering in pome fruit trees across Australia Department of Agriculture and Fisheries 2016 16
flowering in Manjimup were a response to mild autumn and winter conditions received throughout the period of this study This finding is supported by numerous studies in the literature describing irregular flowering in apples grown in warm low chill climates (Oukabli 2003 Saure 1985 Theron 2013 Erez 2000) Abnormalities in the late stages of apple flower bud development have also been reported in low chill regions (Oukabli 2003) however flower viability was not assessed in our study
The timing of flowering varied from year to year within each location with the greatest differences observed in Manjimup This variability was caused largely by differences in temperatures from season to season and Australian growers have always had to manage these seasonal shifts in the timing of dormancy-break The relative importance of cold and warm temperatures in determining the timing of flowering is likely to vary between locations and years For example in cold growing regions where plenty of winter chill is received and chilling requirements are well satisfied by the middle of winter dormancy-break will be promoted by warm temperatures in late winter and early spring (Saure 1985) In this case from around mid-winter onwards the trees are sitting in a phase of dormancy known as lsquoeco-dormancyrsquo that is the buds are ready to burst when the environmental conditions are right for growth
This response to heat is evident in cold pome fruit growing regions of the Northern Hemisphere where clear advances in flowering dates have been observed with warmer spring temperatures caused by the changing climate (Legave et al 2013)
In warmer growing locations and years the timing of dormancy-break and flowering are likely to be determined primarily by the accumulation of enough chill (Saure 1985) That is dormancy tends to be prolonged and there is little or no eco-dormancy period buds burst as soon as they have received enough chill (Theron 2013) It is likely that pome trees growing in the warmer regions of Manjimup and Applethorpe in some years do not experience any significant eco-dormancy
As the climate warms most growing regions of Australia will receive less winter chill (Darbyshire et al 2013b) The impacts that this will have on flowering over the next 10 to 20 years will vary between different parts of the country
Cooler regions such as those in Tasmania and NSW with plenty of chilling may experience advances in the timing of flowering as spring temperatures increase As chill accumulation falls below the chilling requirements of cultivars in warmer growing regions of Australia they will likely see increasing variability in green tip and flowering dates from season to season and between cultivars Delayed uneven and protracted flowering will occur in the medium to higher chill cultivars as was observed in Manjimup during this study Low chill years will be experienced more often as the climate warms
Irregular and protracted flowering presents a significant management challenge for growers Options for orchard adaptation to warming autumns and winters include the planting of lower chill cultivars management of delayed and variable flowering with the use of dormancy-breakers and adjustments to chemical and hand thinning practices to reduce variability in fruit size and maturity
It should be noted that while exposure to enough chill is essential for quality flowering in pome fruit (defined here as the uniform blossoming of viable flowers) once chilling requirements have been met the quality of flowering can be further influenced by other factors such as heat nutritional status and water stress These factors were not considered here
While this study looked at temperature and the timing and quality of flowering climate change will have other impacts on flowering and pollination Warming temperatures will potentially impact on floral initiation bee activity and fruit set (Dennis 2003 Atkinson et al 2001 Ramirez and Davenport 2013) In addition this study did not collect data on leaf area development during the green tip and full bloom period Weak leaf development is a symptom of delayed foliation (Saure 1985) caused by inadequate winter chill and reduced leaf area in the weeks after full bloom has been shown to have negative impacts on fruit set and development (Proctor and Palmer 1991 Lauri et al 1996) Further research is required to fully determine the nature of these impacts on the Australian pome fruit industry
Flowering in pome fruit trees across Australia Department of Agriculture and Fisheries 2016 17
The discussion and conclusions from this study were based primarily on the results from observations in apples While results from the pear data were generally consistent with that observed in apples further research would improve the understanding of flowering in this crop Since the vast majority of pears are grown in Victoria (89) (Australian Bureau of Statistics) there was less opportunity to collect extensive datasets from diverse climatic regions
Conclusions
Results from this research support findings from previous studies performed in other parts of the world showing that apples grown in warmer climates exhibit increased variability in flowering within the canopy between individual trees and between varieties and years (Erez 2000 Theron 2013 Cook and Jacobs 2000) Increased variability in flowering results in the reduced ability to predict timing of orchard operations more difficult pollination management challenges for thinning and crop load management and can result in increased variability of fruit maturity at harvest
The Australian apple and pear industry is aiming to increase global competitiveness in an effort to help secure new export markets Success in the global market requires consistent supply of high quality fruit from season to season at competitive prices Additional variability in the crop production system from a warming climate will challenge the Australian industryrsquos ability to achieve the desired export goals on two fronts consistency of supply and in the maintenance of uniform orchard blocks that are a prerequisite for efficient use of labour-saving technologies
Variability caused by inadequate chilling can be managed with the use of additional input of products and labour however grower capacity to respond to these challenges will vary depending on individual social and financial factors An important assessment for growers to make of their orchard businesses will be lsquoat what point will the increased cost of inputs and effort required to produce a consistently high quality crop make a block of trees unprofitablersquo Ongoing orchard observations of flowering performance and relationships with winter chill will be necessary for making meaningful predictions about future block and cultivar profitability
Key messages
- Low winter chill as observed in Manjimup was associated with an uneven (or lsquounevenrsquo) chill accumulation curve caused by short periods of warm weather throughout the autumn and winter seasons
- Green tip and full bloom dates were more variable between years cultivars and individual trees in Manjimup and trees consistently displayed a long and protracted flowering compared with Applethorpe and Shepparton
- Shepparton the site with the most winter chill showed the greatest consistency in green tip and flowering dates from year to year
- The patterns of flowering observed in Manjimup are likely the result of inadequate chill Low winter chill at this site was associated with
High variability in flowering dates between seasons cultivars and individual trees of the same cultivar
Irregular and protracted flowering across most cultivars of apple
- Large shifts in flowering dates between cultivars and seasons increases the risk of poor flowering overlap in any particular year and makes it more difficult to select appropriate pollinisers Greater predictability in the timing of green tip and full bloom has benefits for flowering and pollination management and for planning of orchard operations generally
- Irregular and protracted flowering can be difficult to manage for a number of reasons
Flowering in pome fruit trees across Australia Department of Agriculture and Fisheries 2016 18
Determining an appropriate chemical thinning program is challenging when buds are at multiple stages of green tip and flowering on individual trees
Fruitlets will vary more in size and developmental stage and careful hand thinning is required to optimise crop uniformity
Greater spread of fruit maturity at harvest requires greater effort to pick fruit at the appropriate stage of maturity
- As the climate warms low chill years will become more frequent in milder growing regions of Australia and will likely result in symptoms of inadequate chill in some cultivars Advances in the timing of flowering might be observed in cooler growing regions
- Australian growers already manage seasonal changes in flowering time and it may be the increased irregularity of flowering that presents the greater management challenge
- Options for adaptation to low chill years include planting lower chill cultivars management of delayed and variable flowering with the use of dormancy-breakers and adjustments to chemical and hand thinning practices to reduce variability in fruit size and maturity
- Risks to pollination from shifting flowering times can be reduced through planting multiple polliniser cultivars with early middle and late flowering habits to ensure a good supply of pollen throughout the flowering period Use of floral bouquets or artificial pollination methods can compensate for loss in flowering overlap
- Climate change will add significant variability into the pome fruit crop production system This will present challenges for the Australian industry in the consistency of supply and in maintenance of the uniform orchard blocks that are a prerequisite for the efficient use of mechanisation
- An important assessment for growers to make of their orchard businesses will be lsquoat what point will the increased cost of inputs and effort required to produce a consistently high quality crop make a block of trees unprofitablersquo Ongoing observations of flowering performance and its relationship with chilling will be necessary for making informed predictions about future block and cultivar profitability
Recommendations
Industry
- Warmer temperatures will mean less winter chill for most growing regions of Australia Successful adaptation by the apple and pear industry will require
Comprehensive in-orchard monitoring of flowering dates across cultivars to provide early indication of cultivars that might be impacted by warmer winters in the future changing climate as well as identification of subtle shifts in the timing of flowering between cultivars and their pollinisers
Information about chilling requirements of new and existing cultivars so that growers can make cultivar choices appropriate to their particular growing environment
Consideration of chilling requirements in apple and pear breeding programs when selecting potential new cultivars for development and release Selecting for lower chill cultivars
Good understanding of the efficacy of dormancy-breaking sprays
- Growers in warmer growing regions of Australia would benefit from preparing a strategy for managing low chill years Monitoring of winter chill accumulation and use of dormancy-
Flowering in pome fruit trees across Australia Department of Agriculture and Fisheries 2016 19
breakers in low chill years is a logical inclusion Changes to chemical and hand thinning practices may also form part of the strategy
- Where shifting full bloom dates are likely to be a problem consideration should be given to planting more than one polliniser cultivar to improve the chances of flowering overlap every year
- Models of flowering time have significantly improved in recent times with the development of the lsquoChill-overlap modelrsquo (Darbyshire et al 2016 White 2016) The use of these models will improve the ability to predict changes in the timing of flowering in cultivars of apple under future climates
- Climate analogues (Parkes and White 2016) should be used by the industry to broadly identify climate change impacts on apple and pear production systems and possible options for adaptation Growers in Manjimup are already successfully managing the impacts of inadequate chill in some years lessons can be learnt from their knowledge and experience
- In future more comprehensive data should be collected on orchards through the use of sensing and mapping technologies This data should be used to undertake more sophisticated and comprehensive analysis of flowering patterns and variability between and within locations
- Further research in Australian pears is needed to improve the understanding of flowering in cultivars of this tree crop and the likely impacts of changing climate
- In blocks where flowering is becoming increasingly irregular an important assessment for growers to make of their orchard businesses will be to determine at what point the increased cost of inputs and effort required to produce a consistently high quality crop make a block of trees unprofitable Ongoing observations of flowering performance and its relationship with chilling will be necessary for making informed predictions about future block and cultivar profitability
Scientific research needs
- Better understanding of apple and pear chilling requirements is necessary for making appropriate cultivar selections for particular growing climates This will require
Research into the genetic basis of progression through the phases of dormancy
Determination of the point when buds enter into true dormancy and become sensitive to chilling temperatures and when buds exit true dormancy prior to bud burst Genetic andor physiological markers of these phase shifts are needed
Improved chill model performance through cultivar specific parameterisation of the dynamic model
Understanding of the effectiveness of early versus late season chill in dormancy breaking
- Development of chill-overlap models for flowering time of pome fruit cultivars other than lsquoCripps Pinkrsquo This will improve the predictability of climate change impacts on flowering timing
- Determine the potential effects of warming temperatures on leaf area development floral initiation flower viability fruit set and bee activity as these are likely to have significant impacts for productivity in apple and pear
Flowering in pome fruit trees across Australia Department of Agriculture and Fisheries 2016 20
Acknowledgements
The authors would like to extend a very big thank you to the growers who kindly provided orchard blocks for research observations Celeste from C Pozzebon amp Co Ann and Mauri Lyster Newton Brothers Orchards Maurice Silverstein and Geoffrey Thompson
Thank you to Susie Murphy White Lisa Starkie and Martine Combret from Western Australia Lexie McClymont Susanna Turpin and Wendy Sessions from Victoria and Osi Tabing Peter Nimmo and Allan McWaters from Queensland for the collection of orchard phenology and temperature data And finally thank you to Rebecca Darbyshire Ian Goodwin Jenny Treeby and Penny Measham as well as all of the aforementioned names for the many discussions around the interpretation of the results that were had formally and informally throughout the four years of the project
References
Atkinson C J Taylor L and Kingswell G (2001) The importance of temperature differences directly after anthesis in determining growth and cellular development of Malus fruits Journal of Horticultural Science and Biotechnology 76(6)
Cannell M G R (1989) Chilling thermal time and date of flowering of trees in Wright C J ed Manipulation of Fruiting London Butterworths 99 - 113
Cobon D H Stone G S Carter J O Scanlan J C Toombs N R Zhang X Willcocks J and McKeon G M (2009) The climate change risk management matrix for the grazing industry of northern Australia Rangeland Journal 31(1)
Cook N C and Jacobs G (2000) Progression of apple ( Malus domestica Borkh) bud dormancy in two mild winter climates Journal of Horticultural Science and Biotechnology 75(2)
Darbyshire R (2016) Crossing the threshold adaptation tipping points for Australian fruit trees University of Melbourne
Darbyshire R Pope K and Goodwin I (2016) An evaluation of the chill overlap model to predict flowering time in apple tree Scientia Horticulturae 198 142-149
Darbyshire R Webb L Goodwin I and Barlow E W R (2013a) Evaluation of recent trends in Australian pome fruit spring phenology International Journal of Biometeorology 57(3)
Darbyshire R Webb L Goodwin I and Barlow E W R (2013b) Impact of future warming on winter chilling in Australia International Journal of Biometeorology 57(3) 355-366
Delaplane K S and Mayer D F (2000) Crop Pollination by Bees New York CABI
Dennis F G Jr (2003) Flowering pollination and fruit set and development in Ferree D C and Warrington I J eds Apples botany production and uses Cambridge CAB International 153 - 166
Erez A (2000) Bud dormancy phenomenon problems and solutions in the tropics and subtropics in Erez A ed Temperate Fruit Crops in Warm Climates Kluwer Academic Publishers 17 - 47
Erez A Fishman S Linsley-Noakes G C and Allan P (1990) The dynamic model for rest completion in peach buds Acta Horticulturae 276 165-174
Fishman S Erez A and Couvillon G A (1987) The temperature dependence of dormancy breaking in plants mathematical analysis of a two-step model involving a cooperative transition Journal of Theoretical Biology 124 473 - 483
Hennessy K J and Clayton-Greene K (1995) Greenhouse warming and vernalisation of high-chill fruit in southern Australia Climatic Change 30(3)
Flowering in pome fruit trees across Australia Department of Agriculture and Fisheries 2016 21
Jackson J E (2003) Biology of Apples and Pears Cambridge Cambridge University Press
Lauri P Eacute Teacuterouanne Eacute and Lespinasse J M (1996) Quantitative analysis of relationships between inflorescence size bearing-axis size and fruit-set - An apple tree case study Annals of Botany 77(3) 277-286
Legave J M Blanke M Christen D Giovannini D Mathieu V and Oger R (2013) A comprehensive overview of the spatial and temporal variability of apple bud dormancy release and blooming phenology in Western Europe International Journal of Biometeorology 57(2)
Luedeling E Zhang M H Luedeling V and Girvetz E H (2009) Sensitivity of winter chill models for fruit and nut trees to climatic changes expected in Californias Central Valley Agriculture Ecosystems amp Environment 133(12)
Meier U Graf H Hess M Kennel W Klose R Mappes D Seipp D Stauss R Streif J and van den Boom T (1994) Phaumlnologische Entwick-lungsstadien des Kernobstes (Malus domestica Borkh und Pyrus communis L) des Steinobstes (Prunus-Arten) der Johannisbeere (Ribes-Arten) und der Erdbeere (Fragaria x ananassa Duch) Nachrichtenbl Deut Pflanzenschutzd 46 141 - 153
Oukabli A Bartolini S and Viti R (2003) Anatomical and morphological study of apple (Malus x domestica Borkh) flower buds growing under inadequate winter chilling Journal of Horticultural Science and Biotechnology 78(4) 580-585
Parkes H A and White N (2016) Climate change impacts on flowering in Australian pome fruit trees A climate analogue approach Queensland Department of Agriculture and Fisheries
Proctor J T A and Palmer J W (1991) The role of spur and bourse leaves of three apple cultivars on fruit set and growth and calcium content HortScience 26(6) 789
Ramirez F and Davenport T L (2013) Apple pollination a review Scientia Horticulturae 162
Samish R M (1954) Dormancy in woody plants Annual Review of Plant Physiology 5 183-204
Saure M C (1985) Dormancy release in deciduous fruit trees Horticultural Reviews 7 239-300
State of the climate (2016) Australian Bureau of Meteorology amp CSIRO
Theron K (2013) Chemical thinning of apple South African perspective Acta Horticulturae 998 85 - 90
White N (2016) Approaches for modelling flowering timing in apple trees grown in mild winter climates Department of Agriculture and Fisheries Department of Agriculture and Fisheries
A climate analogue approach to understanding climate change impacts on flowering in Australian pome fruit trees
Heidi Parkes1 Neil White1 and Susie Murphy White2
November 2016
1Department of Agriculture and Fisheries Queensland 2Pomewest Western Australia
This research was presented at Greenhouse 2015 Wrest Point Conference Centre Hobart 27-30 October
This publication has been compiled by Heidi Parkes and Neil White of Horticulture and Forestry Science Department of Agriculture and Fisheries copy State of Queensland 2016 The Queensland Government supports and encourages the dissemination and exchange of its information The copyright in this publication is licensed under a Creative Commons Attribution 30 Australia (CC BY) licence Under this licence you are free without having to seek our permission to use this publication in accordance with the licence terms
You must keep intact the copyright notice and attribute the State of Queensland as the source of the publication Note Some content in this publication may have different licence terms as indicated For more information on this licence visit httpcreativecommonsorglicensesby30audeeden The information contained herein is subject to change without notice The Queensland Government shall not be liable for technical or other errors or omissions contained herein The readeruser accepts all risks and responsibility for losses damages costs and other consequences resulting directly or indirectly from using this information
Climate change impacts on flowering in pome fruit trees a climate analogue approach 2016 1
Summary
Future changes in climate are predicted to result in reduced winter chill in apple and pear growing regions of Australia Potential impacts on the pome fruit industry due to effects of reduced chill on bud dormancy release and flowering of fruit trees in these regions are not yet clear Inadequate winter chill can result in variable and protracted flowering potentially leading to impacts on fruit set and marketable yield at harvest Climate analogues are one option for investigation of potential climate change impacts on agricultural production and appropriate adaptation strategies This study investigated the potential for using the climate analogue concept together with collected datasets to predict impacts of climate change on pome fruit flowering in Australia and to identify possible methods for adaptation
The temperate tree fruit growing regions of Manjimup (WA) and Stanthorpe (QLD) were used as a case study to test this strategy Based on mean autumn and winter temperatures alone Manjimup was considered to be an appropriate climate analogue for Stanthorpe in 2030 Flowering datasets from commercial apple and pear cultivars were collected at each site in 2013 and 2014 Whole tree field assessments were made of 5 green tip first open flower and progression of flowering to full bloom using standardised methods across sites The data show an uneven and protracted pattern of flowering in Manjimup compared with Stanthorpe Average green tip dates for all cultivars were spread across 32 days in Manjimup compared with 15 days in Stanthorpe Similarly average full bloom dates were spread across 19 days in Manjimup and 9 days in Stanthorpe The duration between the first flower opening and full bloom in Manjimup was more than twice as long as in Stanthorpe (an average of 25 days compared with 10 days) when averaged across years and cultivars There were no clear differences in yield between the locations Comparison of grower orchard management practices indicated that 50 of Manjimup growers use dormancy-breaking sprays compared with zero in Stanthorpe
Results from the climate analogue approach suggested that a more variable and protracted pattern of flowering is likely to exist across many apple cultivars in Stanthorpe in 2030 The more variable flowering will not necessarily have significant impacts on productivity of apple orchards in that timeframe and Stanthorpe growers are likely to be able to manage low chill years with the use of dormancy-breaking sprays At this stage there is no apparent need to shift to lower chill cultivars (or crops) as Manjimup growers are achieving high levels of productivity with the same variety mix as is currently grown in Stanthorpe
The climate analogue approach is a valuable tool for providing broad information around potential impacts and adaptation strategies for Australian temperate tree crops and horticulture more generally There are a number of important details to consider when applying this methodology and these are outlined in this report
Climate change impacts on flowering in pome fruit trees a climate analogue approach 2016 2
Table of contents
Introduction 4
Study objectives 4
Methodology 4
Identification of an appropriate climate analogue location 5
Industry comparison 5
Comparison of flowering 5
Comparison of productivity and orchard management practice 6
Results and discussion 7
Identification of an appropriate climate analogue location for Stanthorpe 2030 7
The apple and pear industries in Manjimup and Stanthorpe 8
Apple and pear tree flowering in Manjimup and Stanthorpe 9
Apple and pear productivity in Manjimup and Stanthorpe 12
Orchard management practices in Manjimup and Stanthorpe 13
Conclusions 14
Key messages 15
Recommendations 15
Acknowledgments 16
References 16
Table of figures
Figure 1 Map of Australia showing the locations of Stanthorpe and Manjimup Manjimup was identified as an appropriate climate analogue for Stanthorpe in 2030 7
Figure 2 Box plot showing winter chill projections from four climate models for Stanthorpe in 2030 compared with current winter chill in Manjimup Orange red and blue dots show winter chill data calculated from hourly temperature data collected on-site from 2012 2013 and 2014 respectively Historical boxplot data is for the period from 1986 to 2005 8
Figure 3 Green tip first flower and full bloom dates for cultivars of apple and pear in Manjimup and Stanthorpe in 2013 and 2014 Dates are given as the lsquoday of yearrsquo day 260 is 17 September and day 300 is 27 October Data points are the average of individual tree observations CP is the total chill portions calculated up to 31 Aug 9
Figure 4 Duration of the flowering period from first flower to full bloom in cultivars of apple and pear grown in Manjimup and Stanthorpe in 2013 and 2014 Results are the average of individual tree observations 10
Figure 5 Overlap of flowering periods from first open flower to full bloom in cultivars of apple and pear in Manjimup and Stanthorpe Dates are given as the lsquoday of yearrsquo day 260 is 17 September and day 300 is 27 October Data points are the average of individual tree observations for 2013 and 2014 11
Figure 6 Uneven flowering in lsquoCripps Pinkrsquo Lysterrsquos Orchard Manjimup 2014 11
Climate change impacts on flowering in pome fruit trees a climate analogue approach 2016 3
Figure 7 Results from a survey of Manjimup growers on lsquoCripps Pinkrsquo yields and quality in 2014 The survey was undertaken at a grower roadshow event using digital audience response technology 1 October 2014 13
Table of tables
Table 1 Description of sites used for flowering data observations 5 Table 2 Description of trees used for flowering observations 6 Table 3 Characteristics1 of the apple industries in Manjimup and Stanthorpe 8
Climate change impacts on flowering in pome fruit trees a climate analogue approach 2016 4
Introduction
Future changes in climate are predicted to result in reduced winter chill in apple and pear growing regions of Australia (Darbyshire et al 2013b Hennessy and Clayton-Greene 1995) Potential impacts on the pome fruit industry in these regions are not yet clear Inadequate winter chill results in variable and protracted flowering potentially leading to impacts on fruit set and marketable yield at harvest (Theron 2013 Erez 2000 Saure 1985) Climate analogue analysis involves a detailed comparison between locations where the current climate of one location is similar to the projected future climate of the location of interest (Nyairo et al 2014) This is one option for investigation of potential climate change impacts on agricultural production and identification of appropriate adaptation strategies
Relationships between temperature and flowering in apple and pear trees are complex and poorly understood making it difficult to determine future impacts of warming climate on flowering in these crops A number of benefits of applying a climate analogue approach have been identified (Nyairo et al 2014 Veloz et al 2012) and suggest that it may be a useful approach in the investigation of this question Some of the benefits are
Ability to analyse climate change impacts without the need for understanding of complex physiological processes underlying flowering
Ability to analyse options and capacity for adaptation The question can be asked how do growers in region X respond to a climate that is similar to ours in the future Impacts and adaptation can be investigated simultaneously
Impacts of climate change on flowering are analysed within the production system as a whole
Provision of tangible practical information for growers to work with and allows for growers at the test location to learn from growers at the analogue location
Analogue location can be used as a research site for possible adaptation strategies Improved communication of climate change impacts and options for adaptation to growers
Although the concept has been around for some time most studies have focussed broadly on whole farming systems (Nyairo et al 2014) rather than investigating climate change impacts on a single cropping system or on one physiological aspect of a crop such as flowering
Study objectives
The aim of this project was to investigate potential for using a climate analogue approach together with collected data sets to predict impacts of climate change on pome fruit flowering and to identify possible methods for adaptation
Methodology
To test the potential of the climate analogue approach a case study was undertaken in Stanthorpe Queensland The following questions were posed
1 How will flowering of apple and pear trees be impacted by reduced winter chill in Stanthorpe in 2030
2 Will there be an impact on productivity 3 What can growers do to adapt 4 Is the climate analogue approach appropriate in this context and can it be applied more
broadly 5 Are there factors that should be considered when using climate analogues for informing
climate change adaptation in horticulture
There were four parts to the investigation the identification of an appropriate climate analogue location for Stanthorpe in 2030 comparison of the apple and pear industries in each location to
Climate change impacts on flowering in pome fruit trees a climate analogue approach 2016 5
ensure a meaningful comparison analysis and comparison of flowering behaviour and productivity in each location and comparison of relevant orchard management practices to investigate possible climate change adaptations
Identification of an appropriate climate analogue location
The lsquoanalogues explorerrsquo tool from the Climate change in Australia website1 was used to identify a broad pool of possible climate analogue locations for Stanthorpe in 2030
Winter chill projections for Stanthorpe in 2030 were constructed from four Global Climate Models selected from the list of models generated by the Climate Futures Tool at the Climate Change in Australia website1 for a Representative Concentration Pathway (RCP) of 45 The RCP45 emissions scenario assumes that lower greenhouse gas emissions are achieved in future due to some mitigation efforts It is a minimum to medium case climate change scenario
Historical temperature data from 1986 to 2005 for Manjimup and Stanthorpe was obtained from the SILO climate database2 Point data for the years 2012 2013 and 2014 was obtained from the weather station at Manjimup Horticultural Research Institute (Manjimup) and an on-site temperature logger in the orchard at Applethorpe Research Facility (Stanthorpe)
The Dynamic model (Erez et al 1990 Fishman et al 1987)) was used to calculate winter chill from hourly temperature data recorded in the orchard from the beginning of autumn until the end of winter (1 Mar to 31 Aug) This is the current lsquobest-practicersquo model and has been shown to perform better than other models for calculating winter chill particularly in mild winter climates such as Australia (Darbyshire et al 2013a Luedeling et al 2009)
Industry comparison
Comparison of the apple and pear industries in Manjimup and Stanthorpe was made based on information sourced from the Australian Bureau of Statistics a Shire Council report (Tancred and McGrath 2013) and personal communication with growers and local industry representatives
Comparison of flowering
The flowering datasets were from orchards in Manjimup and Stanthorpe (Table 1) collected in spring 2013 and 2014 from cultivars of apple and pear as part of the project AP12029 Understanding apple and pear production systems in a changing climate (Table 2)
Table 1 Description of sites used for flowering data observations State Location Orchard Latitude and
Longitude Cultivars
Qld Stanthorpe Department of Agriculture and Fisheries Qld Applethorpe Research Facility
2852 S 15190 E
All apples and pears
WA Manjimup Department of Agriculture and Food WA Manjimup Horticultural research Institute
3418 S 11607 E All apples
Newton Brothers Orchards
3413 S 11607 E All pears
1 httpwwwclimatechangeinaustraliagovauenclimate-projectionsclimate-analoguesanalogues-explorer 2 httpswwwlongpaddockqldgovausilo
Climate change impacts on flowering in pome fruit trees a climate analogue approach 2016 6
Table 2 Description of trees used for flowering observations Study site Tree
crop Cultivar Rootstock1 Number of trees
(for yearly observation) Net
Stanthorpe Apple Braeburn M26 5 Yes
Cripps Pink (Pink Ladytrade)
M26 MM106
5 3
Yes
Cripps Red (Sundownertrade)
M26 MM106
5 5
Yes
Fuji M26 5 Yes
Galaxy (Gala)
M26 5 Yes
Granny Smith M26 MM106
4 5
Yes
Hi Early (red delicious)
M26 5 Yes
Pear Packhamrsquos Triumph
D6 5 No
Williamsrsquo Bon Chreacutetien
D6 5 No
Manjimup Apple
Braeburn MM109 2 No
Cripps Pink (Pink Ladytrade)
MM104 M26
2 2
No
Cripps Red (Sundownertrade)
MM104 M26
3 1
No
Galaxy (Gala)
MM104 2 No
Granny Smith MM104 2 No
Hi Early (red delicious)
MM104 2 No
Red Fuji (Fuji)
MM104 2 No
Pear Packhamrsquos Triumph
D6 5 No
Williamsrsquo Bon Chreacutetien
D6 5 No
1Rootstock effects were not considered in this analysis as previous studies indicated that rootstocks did not significantly impact the timing of green tip and flowering dates in data collected for this study (Darbyshire 2016)
Green tip and flowering data was collected three times per week at the whole tree level For each tree the date of green tip first open flower and full bloom were recorded A tree was defined as being at lsquogreen tiprsquo when 5 of the buds had observable green tips corresponding to the 07 stage in the international BBCH code for pome fruit (Meier et al 1994) A tree was defined as being at lsquofull bloomrsquo when 80 of the flowers were open similar to the 65 stage in the international BBCH code for pome fruit (Meier et al 1994)
Comparison of productivity and orchard management practice
Broad yield data and information on orchard management practices was obtained from the Australian Bureau of Statistics personal communication with growers and local industry representatives and from a grower survey performed using digital audience response technology at the AP12029 project
Climate change impacts on flowering in pome fruit trees a climate analogue approach 2016 7
roadshow event held in Manjimup on 1 October 2014 Detailed yield and orchard practice data was not collected as part of this study
Results and discussion
Identification of an appropriate climate analogue location for Stanthorpe 2030
The Analogues Explorer tool was used to identify a broad pool of possible climate analogue locations for Stanthorpe in 2030 When climates were matched for annual temperature and rainfall twelve analogue locations were listed including Bega Manjimup Mount Barker Young and Albury-Wodonga
To ensure that the climate analogue selected could be used to specifically investigate the impacts of reduced chilling on flowering the Analogues Explorer tool was set-up to identify analogues matched on autumn and winter temperatures only Spring and summer temperatures were removed from the assessment along with rainfall A slightly different set of climate analogues was listed including Nuriootpa Horsham Naracoorte Manjimup Mount Barker and Sale From this list Manjimup one of Australiarsquos main apple and pear growing regions was selected as the climate analogue location for Stanthorpe in 2030 (Figure 1)
Figure 1 Map of Australia showing the locations of Stanthorpe and Manjimup Manjimup was identified as an appropriate climate analogue for Stanthorpe in 2030
It is worth noting that when the seasons are considered separately Manjimup is a reasonable analogue for 2030 in Stanthorpe for summer autumn and winter but not for the spring This is because in the current climate Stanthorpe has a warmer spring than Manjimup
Projections of winter chill using global climate models were undertaken to evaluate how well winter chill in Manjimup is likely to match chill received under a 2030 climate in Stanthorpe (Figure 2) The historical chill portion data for the period 1986 to 2005 in Manjimup is similar to the chill data for Stanthorpe over this same period (Figure 2) However 2012 2013 and 2014 were low chill years in Manjimup If the chill portion data for these years is considered separately it falls neatly within the range of the projected winter chill results for Stanthorpe in 2030 (Figure 2) Therefore Manjimup in the years 2012 to 2014 was considered to be a good climate analogue for assessing the impacts of reduced winter chill on flowering in Stanthorpe in 2030
Climate change impacts on flowering in pome fruit trees a climate analogue approach 2016 8
Figure 2 Box plot showing winter chill projections from four climate models for Stanthorpe in 2030 compared with current winter chill in Manjimup Orange red and blue dots show winter chill data calculated from hourly temperature data collected on-site from 2012 2013 and 2014 respectively Historical boxplot data is for the period from 1986 to 2005
The apple and pear industries in Manjimup and Stanthorpe
The apple and pear industries in Manjimup and Stanthorpe are comparable on most industry characteristics including gross value orchard size variety mix rootstocks and planting systems (Table 3) One significant difference is in the use of orchard netting Stanthorpe apples are grown almost entirely under hail netting while most of the apple orchards in the Manjimup district are un-netted (although this is changing rapidly)
Table 3 Characteristics1 of the apple industries in Manjimup and Stanthorpe Industry characteristic Manjimup Stanthorpe
1Gross value is the average from the 2002-2003 to 2012-2013 seasons
Climate change impacts on flowering in pome fruit trees a climate analogue approach 2016 9
Apple and pear tree flowering in Manjimup and Stanthorpe
In 2013 and 2014 Stanthorpe received 72 and 74 chill portions respectively while Manjimup received 54 chill portions in both years (well below its long-term average) (Figure 3) The low winter chill in Manjimup was associated with a greater spread of green tip and full bloom dates in both years (Figure 3) Average green tip dates for all cultivars were spread across 32 days in Manjimup compared with 15 days in Stanthorpe Similarly average full bloom dates were spread across 19 days in Manjimup compared with 9 days in Stanthorpe
Figure 3 Green tip first flower and full bloom dates for cultivars of apple and pear in Manjimup and Stanthorpe in 2013 and 2014 Dates are given as the lsquoday of yearrsquo day 260 is 17 September and day 300 is 27 October Data points are the average of individual tree observations CP is the total chill portions calculated up to 31 Aug
The duration between the first flower opening and full bloom in Manjimup was more than twice as long as in Stanthorpe (an average of 25 days compared with 10 days) when averaged across years and cultivars (Figure 4 and Figure 5) This protracted pattern of flowering was consistently observed in Manjimup over the period of the study and was largely the result of irregular and uneven bud movement within individual tree canopies (Figure 6)
A prolonged and irregular period of flowering can be difficult to manage for a number of reasons Determining an appropriate chemical thinning program is challenging when buds are at multiple stages of green tip and flowering on each tree within the block at any given time (Theron 2013) Fruitlets are likely to vary greatly in size and development stage and therefore careful attention is required at the time of hand thinning to ensure that fruitlets are thinned in a manner that optimises crop uniformity and reduces the spread of fruit maturity at harvest (Theron 2013 Erez 2000)
A long drawn out flowering season has other indirect impacts on orchard activities including a longer period for controlling flowering pests such as dimpling bug and for managing of bee hives These impacts were not assessed in this study
Overlap of flowering between a cultivar and its pollinisers is essential for good fruit set (Ramirez and Davenport 2013) Changes in the timing of flowering between seasons or across years that result in
Climate change impacts on flowering in pome fruit trees a climate analogue approach 2016 10
the loss of flowering synchronisation can therefore result in reduced yields Flowering overlap does not appear be a problem for either Manjimup or Stanthorpe in the years of study (Figure 5) however reduced marketable yields can result from the extended period of flowering overlap that is caused by irregular bud movement (Petri and Leite 2004) In this situation fruit set occurs over an extended period of time resulting in the significant spread of fruit maturity within individual trees
Figure 4 Duration of the flowering period from first flower to full bloom in cultivars of apple and pear grown in Manjimup and Stanthorpe in 2013 and 2014 Results are the average of individual tree observations
Climate change impacts on flowering in pome fruit trees a climate analogue approach 2016 11
Figure 5 Overlap of flowering periods from first open flower to full bloom in cultivars of apple and pear in Manjimup and Stanthorpe Dates are given as the lsquoday of yearrsquo day 260 is 17 September and day 300 is 27 October Data points are the average of individual tree observations for 2013 and 2014
Figure 6 Uneven flowering in lsquoCripps Pinkrsquo Lysterrsquos Orchard Manjimup 2014
Climate change impacts on flowering in pome fruit trees a climate analogue approach 2016 12
Apple and pear productivity in Manjimup and Stanthorpe
Low winter chill and irregular flowering can reduce productivity through impacts on fruit set and variability of fruit quality at harvest (Petri and Leite 2004 Erez 2000) To investigate any association between irregular and protracted flowering in Manjimup in 2013 and 2014 with productivity in those years broad assessments of yield were undertaken
Meaningful comparison of yield data between locations can be problematic as yield is impacted by the interaction of many complex factors including pests and diseases irrigation planting systems tree canopy management practices as well as climatic factors Long-term apple yield data was similar between locations with an average of 377 kg per tree in Manjimup and 382 kg in Stanthorpe (source Australian Bureau of Statistics)
There was no evidence of reduced productivity in Manjimup in the low chill year of 2014 In a survey of Manjimup growers 69 reported an above average or excellent yield in 2014 and 79 reported average or really good fruit quality in 2014 (Figure 7) These results were based on grower perceptions detailed yield data was not collected as part of this study
Climate change impacts on flowering in pome fruit trees a climate analogue approach 2016 13
Figure 7 Results from a survey of Manjimup growers on lsquoCripps Pinkrsquo yields and quality in 2014 The survey was undertaken at a grower roadshow event using digital audience response technology 1 October 2014
Orchard management practices in Manjimup and Stanthorpe
The lack of evidence for losses in marketable yield as a result of the variable and protracted flowering observed in Manjimup in 2014 could be because 1) the observed pattern of flowering had no impact on fruit set or fruit quality at harvest 2) Manjimup growers have adjusted management practices to adapt to low chill years or 3) impacts on productivity were there but were not great enough to be picked up in grower yield records
While it was not possible to distinguish between these alternative explanations with the data collected in this study it was worth considering whether Manjimup growers have implemented any changes to cultural practices and or longer term strategies to manage variable and protracted flowering In the survey of Manjimup growers 50 indicated that they were using dormancy-breaking sprays on some
Climate change impacts on flowering in pome fruit trees a climate analogue approach 2016 14
cultivars to manage the irregular flowering This is compared with zero growers in Stanthorpe for that year
It is not clear whether the use of dormancy-breaking sprays in Manjimup is the reason that there was no clear impact of the variable and protracted flowering on productivity but it is likely to have helped (Erez 1995 Saure 1985 Petri et al 2014)
A longer-term strategy for managing the effects of low chill years on flowering is to plant cultivars with lower chilling requirements The existing variety mix was similar in Stanthorpe and Manjimup and there was no apparent difference in the cultivars under consideration for new plantings (personal communication)
Conclusions
The following conclusions on the impact of reduced winter chill on Stanthorpersquos apple industry in 2030 can be drawn from the evaluation of flowering productivity and orchard management practices in Manjimup
1 How will flowering of apple and pear trees be impacted by reduced winter chill in
Stanthorpe in 2030
A more variable and protracted pattern of flowering is likely to exist across many apple cultivars in Stanthorpe in 2030
2 Will there be an impact on productivity
The more variable flowering will not necessarily have significant impacts on productivity of apple orchards in 2030
3 What can growers do to adapt
Stanthorpe growers are likely to be able to manage low chill years with the use of dormancy-breaking sprays At this stage there is no clear need to shift to lower chill cultivars (or crops) as Manjimup growers are achieving high levels of productivity with the same variety mix as is currently grown in Stanthorpe
4 Is the climate analogue approach appropriate in this context and can it be applied more
broadly
Yes the climate analogue approach provided insight into potential impacts of reduced winter chill on flowering in Stanthorpe in 2030 and is likely to be a valuable tool for broadly evaluating climate change impacts and options for adaptation in many horticultural contexts
5 Are there factors that should be considered when using climate analogues for informing
climate change adaptation in horticulture
Three important factors for consideration were identified during this case study
Selection of the climate analogue should be undertaken carefully with consideration given to differences between the analogue and target locations with respect to environment industry social factors and so on
The Analogues Explorer tool comes with the following qualifying statement
ldquoIt is important to note that other potentially important aspects of local climate are not matched when using this approach such as frost days or other local climate influences Furthermore for agricultural applications solar radiation and soils are not considered Thus we advise against the analogues being used directly in adaptation planning without considering more detailed informationrdquo
Climate change impacts on flowering in pome fruit trees a climate analogue approach 2016 15
A good example of why this is important was identified in this case study The town of Young was one of the possible climate analogues listed for Stanthorpe in 2030 when the climates were matched on annual temperature and rainfall In the current climate Young receives significantly higher winter chill than Stanthorpe but has a hotter summer Hence they might be a good match based on annual temperature but Young would not have been a useful analogue for evaluating reduced winter chill in Stanthorpe On the other hand it might be a good analogue for assessing risk associated with extreme summer heat
An intrinsic assumption of the climate analogue approach is that the only significant difference between the test site and the analogue location is the climate however locations might differ in other ways that could significantly reduce the value of the climate analogue approach For instance if comparing crop production in Australia with that of somewhere else in the world the production systems may be too different to provide meaningful impact and adaptation information
Relationships between climate and physiology are complex the details and nuances of climate change impacts may not be fully defined by the climate analogue approach
This case study concluded that the differences in flowering behaviour observed in Manjimup compared with Stanthorpe were the result of low winter chill in Manjimup in 2013 and 2014 However it is possible that the variable and protracted flowering in Manjimup was a response to the complex interaction between multiple factors other than total winter chill such as the pattern of chill accumulation heat spring temperatures and day-length factors This will only be understood through further experimentation detailed climate data and modelling
The climate analogue approach is limited to investigation of one possible climate scenario at a time while a modelling approach enables the testing of many different climate scenarios
Manjimup was used as a climate analogue for Stanthorpe in 2030 To investigate impacts of reduced winter chill in Stanthorpe in 2050 or 2090 alternative analogue locations would need to be sought as the conclusions from this case study cannot be extended beyond the intended time-frame
Key messages
- Results from the climate analogue approach suggested that more variable and protracted flowering behaviour is likely in pome fruit trees in Stanthorpe by 2030 without significant impact on productivity Adaptations will include the use of dormancy-breaking sprays to manage flowering but there is no evidence for a need to switch to low chill cultivars at this stage
- The climate analogue approach can provide broad information around potential impacts and adaptation strategies for Australian temperate tree crops and horticulture more generally however the details need to be considered cautiously
Recommendations
- Climate analogues should be used by the industry to broadly identify climate change impacts on apple and pear production systems and possible options for adaptation Growers in Manjimup are already successfully managing the impacts of inadequate chill in some years lessons can be learnt from their knowledge and experience
- This study did not capture the many potential impacts that protracted flowering can have on orchard management including a longer period for flowering pest control such as dimpling bug and for management of bee hives difficulties in the timing of chemical thinner application more labour intensive hand thinning and dealing with greater variability of fruit maturity at
Climate change impacts on flowering in pome fruit trees a climate analogue approach 2016 16
harvest A more detailed grower survey should be undertaken to better understand how growers in Manjimup are managing flowering in low chill years
- Potential impacts of low winter chill on marketable yield were not adequately addressed in this study and requires further research using a climate analogue and or modelling approach
- A global study to investigate the limits of profitable apple production with regards to winter chill would provide valuable information for the Australian industry in climate change adaptation planning Production areas with very low winter chill accumulation in South Africa and Southern Brazil rely heavily on dormancy-breakers and would be obvious target locations for this research
- The Australian Apple and Pear Industryrsquos ability to adapt to changing climate will depend not only on basic research but on its ability to observe and capture data on tree physiology climate and orchard practice and interpret it in a meaningful way Australiarsquos industry is made up of growing regions with diverse climates and much can be learnt about climate change impacts and options for adaptation by sharing of knowledge
Acknowledgments
The authors would like to extend a very big thank you to the growers Anne and Mauri Lyster and Newton Brothers Orchards who kindly provided orchard blocks for research observations
Thank you to Lisa Starkie and Martine Combret from Western Australia and Osi Tabing Peter Nimmo and Allan McWaters from Queensland for the collection of orchard phenology and temperature data Thank you also to Rebecca Darbyshire for the discussion and input around the interpretation of results
References
Darbyshire R (2016) Crossing the threshold adaptation tipping points for Australian fruit trees University of Melbourne
Darbyshire R Webb L Goodwin I and Barlow E W R (2013a) Evaluation of recent trends in
Australian pome fruit spring phenology International Journal of Biometeorology 57(3)
Darbyshire R Webb L Goodwin I and Barlow E W R (2013b) Impact of future warming on
winter chilling in Australia International Journal of Biometeorology 57(3) 355-366
Erez A (1995) Means to compensate for insufficient chilling to improve bloom and leafing Acta
Horticulturae 395 81-95
Erez A (2000) Bud dormancy phenomenon problems and solutions in the tropics and subtropics in
Erez A ed Temperate Fruit Crops in Warm Climates Kluwer Academic Publishers 17 - 47
Erez A Fishman S Linsley-Noakes G C and Allan P (1990) The dynamic model for rest
completion in peach buds Acta Horticulturae 276 165-174
Fishman S Erez A and Couvillon G A (1987) The temperature dependence of dormancy
breaking in plants mathematical analysis of a two-step model involving a cooperative transition Journal of Theoretical Biology 124 473 - 483
Climate change impacts on flowering in pome fruit trees a climate analogue approach 2016 17
Hennessy K J and Clayton-Greene K (1995) Greenhouse warming and vernalisation of high-chill
fruit in southern Australia Climatic Change 30(3)
Luedeling E Zhang M H Luedeling V and Girvetz E H (2009) Sensitivity of winter chill models
for fruit and nut trees to climatic changes expected in Californias Central Valley Agriculture Ecosystems amp Environment 133(12)
Meier U Graf H Hess M Kennel W Klose R Mappes D Seipp D Stauss R Streif J and
van den Boom T (1994) Phaumlnologische Entwick-lungsstadien des Kernobstes (Malus domestica Borkh und Pyrus communis L) des Steinobstes (Prunus-Arten) der Johannisbeere (Ribes-Arten) und der Erdbeere (Fragaria x ananassa Duch) Nachrichtenbl Deut Pflanzenschutzd 46 141 - 153
Nyairo R Onwonga R Cherogony K and Luedeling E (2014) Applicability of climate analogues
for climate change adaptation planning in Bugabira commune of Burundi Sustainable Agriculture Research 3(4) 46 - 62
Petri J L and Leite G B (2004) Consequences of insufficient winter chilling on apple tree bud-
break Acta Horticulturae 662 53-60
Petri J L Leite G B Couto M Gabardo G C and Haverroth F J (2014) Chemical induction of
budbreak New generation products to replace hydrogen cyanamide Acta Horticulturae 1042 159-166
Ramirez F and Davenport T L (2013) Apple pollination a review Scientia Horticulturae 162
Saure M C (1985) Dormancy release in deciduous fruit trees Horticultural Reviews 7 239-300
Tancred S and McGrath C (2013) Horticulture Production in Queenslands Southern Downs
Region
Theron K (2013) Chemical thinning of apple South African perspective Acta Horticulturae 998 85
- 90
Veloz S Williams J W Lorenz D Notaro M Vavrus S and Vimont D J (2012) Identifying
climatic analogs for Wisconsin under 21st-century climate-change scenarios Climatic Change 112(3-4) 1037-1058
Dormancy-breaking sprays for low winter chill in apples
Heidi Parkes Department of Agriculture and Fisheries Queensland
Susie Murphy White Pomewest Western Australia
Sally Bound University of Tasmania Tasmania
September 2016
This publication has been compiled by Heidi Parkes of Horticulture and Forestry Science Department of Agriculture and Fisheries copy State of Queensland 2016 The Queensland Government supports and encourages the dissemination and exchange of its information The copyright in this publication is licensed under a Creative Commons Attribution 30 Australia (CC BY) licence Under this licence you are free without having to seek our permission to use this publication in accordance with the licence terms
You must keep intact the copyright notice and attribute the State of Queensland as the source of the publication Note Some content in this publication may have different licence terms as indicated For more information on this licence visit httpcreativecommonsorglicensesby30audeeden The information contained herein is subject to change without notice The Queensland Government shall not be liable for technical or other errors or omissions contained herein The readeruser accepts all risks and responsibility for losses damages costs and other consequences resulting directly or indirectly from using this information
iii Dormancy-breaking sprays for low winter chill in apples
Summary
In the 2015-16 season trials were undertaken in lsquoGalarsquo apple trees at three locations
(Queensland Western Australia and Tasmania) to assess the efficacy of using dormancy-
breaking sprays under current Australian climates and the potential to use these sprays as
an orchard management adaptation to inadequate winter chill under future Australian
climates The trials compared the effect of Waikentrade Dormexreg and Ergerreg on the timing of
green tip and flowering the duration of the flowering period fruit set yield harvest time and
variability of maturity at harvest All dormancy-breaking sprays were able to advance
flowering time and compact the flowering period in lsquoGalarsquo apple with differences observed
between products and sites Fruit maturity was advanced with dormancy-breakers (again
with differences observed between products and sites) and generally reflected differences in
flowering dates There were no differences in fruit set yield or variability of apple maturity in
trees treated with dormancy-breaking sprays despite the compaction of flowering Dormexreg
had the most significant impacts on lsquoGalarsquo flowering and harvest timing in WA and QLD
when compared with Waikentrade and Ergerreg The timing of spray application relative to green
tip and winter chill accumulation impacted the bud burst and flowering response to
dormancy-breaking products and therefore flowering responses are likely to vary between
seasons and cultivars Dormancy-breaking sprays are likely to be an effective tool for
managing flowering in lsquoGalarsquo and other apple cultivars in lower chill years in Australia
Benefits from the use of dormancy-breakers would be greater in low chill years when the
potential impacts of inadequate chill on flowering are greatest Therefore benefits are likely
to increase under future warmer climate scenarios Impacts of dormancy-breaking sprays on
fruit quality and length of the harvest window remain unclear
iv Dormancy-breaking sprays for low winter chill in apples
Table of contents
Introduction 6
Project Objectives 7
Materials and methods 7
Site description 7
Experimental design 8
Spray application 8
Temperature data and calculation winter chill 10
Green tip and flowering 10
Fruit set 11
Fruit sampling and maturity assessments 11
Variability in fruit quality at harvest 11
Yield 11
Phytotoxicity 11
Results and discussion 12
Timing of spray application 12
Green tip and flowering 12
Fruit set and yield 15
Fruit maturity and quality 16
Cost-benefit analysis 18
Conclusions 20
Key messages 22
Recommendations 22
Acknowledgements 23
Appendices 23
References 23
Table of figures
Figure 1 Study sites in Huonville TAS (a) Stanthorpe QLD (b) and Manjimup WA (c) in spring 2015 8
Figure 2 Application of dormancy-breaking sprays using a hand lance in Manjimup WA 9
Figure 3 Chill Portion accumulation and dormancy-breaking spray application timing at study sites in TAS QLD and WA 2015 10
Figure 4 Green tip first flower and full bloom in Gala apples treated with and without dormancy-breaking sprays in TAS QLD and WA 13
Figure 5 Differences in stages of flowering on 18 September 2015 in QLD lsquoGalarsquo trees treated with and without dormancy-breakers 14
Figure 6 Fruit set in lsquoGalarsquo apple trees treated with dormancy-breaking sprays at study sites in TAS QLD and WA 2015 15
v Dormancy-breaking sprays for low winter chill in apples
Figure 7 Fruit at harvest on 27 January 2016 in lsquoGalarsquo trees treated with Dormexreg and Ergerreg QLD (centre tree was sprayed surrounding trees are untreated) 18
Figure 8 A schematic representation of the progression of buds through dormancy showing the point at which buds become responsive to the action of dormancy-breaking sprays (Faust et al 1997) 21
Table of tables
Table 1 Description of the orchard study sites 7
Table 2 Details of the dormancy-breaking sprays applied to lsquoGalarsquo trees in WA TAS and QLD in winter 2015 9
Table 3 Actual timing of dormancy-breaking spray application on lsquoGalarsquo trees in QLD WA and TAS 2015 10
Table 4 Effect of dormancy-breaking sprays on green tip and flowering dates and duration for lsquoGalarsquo apple strains grown in TAS QLD and WA in the 2015 - 2016 season 14
Table 5 Effect of dormancy-breaking sprays on gross yield and its components at harvest for lsquoGalarsquo apple strains grown in TAS QLD and WA in the 2015-2016 season 16
Table 6 Effect of dormancy-breaking sprays on fruit maturity and quality at harvest for lsquoGalarsquo apple strains grown in TAS QLD and WA in the 2015-2016 season 17
Table 7 Outline of cost and benefits associated with the use of dormancy-breaking sprays to manage low winter chill years in apple 19
6 Dormancy-breaking sprays for low winter chill in apples
Introduction
Dormancy is a phase of the annual cycle of apple trees that allows them to survive unfavourably cold winter conditions (Saure 1985) The minimum accumulation of winter chill needed to break bud dormancy is defined as the chilling requirement and is thought to be genetically determined (Labuschagne et al 2002 Samish 1954)
Failure to adequately satisfy the chilling requirement can result in delayed and uneven bud burst and flowering and extended duration of the flowering period (Saure 1985 Oukabli 2003) An extended flowering period reduces the effectiveness of chemical thinning (Petri and Leite 2004) and can impact on fruit set and yield (Erez 1995) It has also been shown to result in greater variability of fruit size and maturity which impacts pest and disease management and harvest efficiency (Petri and Leite 2004)
Efforts are being made to breed lower chill cultivars in some crops to enable commercial production in milder growing regions however management tools to compensate for insufficient chilling are still required in many temperate tree fruit production systems in warmer climates (Erez 1995) These tools utilise a range of strategies to manipulate bud progression through dormancy including the use of dormancy-breaking sprays to promote bud burst (Erez 1995 Allderman et al 2011 Saure 1985) The use of dormancy-breaking sprays is perhaps the most widely used and accepted method for managing low chill conditions globally (Erez 2000 Jackson and Bepete 1995 Petri et al 2014)
Winter chill is predicted to decrease in Australian growing regions under future climate change with milder districts likely to experience the impacts of inadequate chilling on a more regular basis (Darbyshire et al 2013 White 2016) The use of dormancy-breaking sprays is a potential adaptation for the apple industry to manage existing commercial cultivars in warmer years as they have been shown to stimulate earlier more homogenous bud burst and flowering in a number of crops grown in conditions with insufficient winter chill (Erez et al 2008 Petri et al 2012 Saure 1985) Additional benefits such as improved uniformity of fruit maturity and quality with the use of dormancy-breaking sprays have been reported (Petri and Leite 2004)
Different types of products have been shown to have dormancy-breaking action in a range of crops These include thidiazuron (a compound with cytokinin-like activity) (Wang et al 1986) dinitro-o-cresol (DNOC-oil) and potassium nitrate (Faust et al 1997) garlic extract and gibberellic acid (Abd El-Razek et al 2013) the emulsified vegetable oil compound Waikentrade (Bound and Miller 2006) and hydrogen cyanamide which is better known as Dormexreg (Bound and Jones 2004) Dormexreg has known risks for plant and human health and therefore alternatives to the use of this product have been sought (Petri et al 2014) More recently Ergerreg an inorganic nitrogen compound combined with calcium nitrate has been shown to cause earlier and more compact flowering in apples (Petri et al 2014 Petri et al 2010)
However with the exception of two studies (Bound and Jones 2004 Bound and Miller 2006) little work has been undertaken in Australia to investigate the efficacy of dormancy-breaking sprays to induce earlier and more uniform flowering in apple cultivars grown under local conditions and the effects on fruit quality and yield remain unclear
A survey performed at the WA National Climate Change project Roadshow event in 2014 indicated that half of the growers were currently using Waikentrade and or Dormexreg for the purposes of stimulating uniform bud burst and flowering under conditions of inadequate chill however there was considerable uncertainty around best practice issues and effectiveness Questions and discussions with growers in other growing regions also indicated an interest in these products but highlighted the need for better understanding regarding use and efficacy in low chill years under current climates and potential as an adaptation strategy for climate change
7 Dormancy-breaking sprays for low winter chill in apples
Project Objectives
The overarching research question was are dormancy-breaking sprays a feasible adaptation option for the Australian apple industry to low chill years in current and future climates
The specific research objectives were to determine
a Impact of dormancy-breaking sprays on the timing of bud burst and flowering and duration of the flowering period in lsquoGalarsquo apple grown in diverse Australian climates
b Impact of dormancy-breaking sprays on fruit set yield and variability of maturity and quality in Australian lsquoGalarsquo apple trees
c Comparative effectiveness of using Waikentrade Dormexreg and Ergerreg as dormancy-breaking sprays in apple
d Cost-benefit of using dormancy-breaking sprays
e Issues (actual and potential) associated with using dormancy-breaking sprays for management of and adaptation to inadequate winter chill under Australian conditions
f Future research needs towards improving orchard practices around the use of dormancy-breaking products
To investigate these objectives a study was undertaken in lsquoGalarsquo apple tree cultivars in the 2015 2016 season at three orchard locations around Australia (QLD WA and TAS)
Materials and methods
Site description
The study was performed at three commercial orchard sites around Australia in the 2015 to 2016
season (Table 1 and Figure 1) Sites were fully mature lsquoGalarsquo blocks and were representative of high-
density plantings in Australia Trees were trained to a dominant central leader and with the
exception of the application of dormancy-breaking sprays as part of this study were managed by the
grower using standard orchard practices
Table 1 Description of the orchard study sites
State Growing region
Latitude and longitude
lsquoGalarsquo strain Rootstock
Density treesha
Netted
Queensland (QLD)
Stanthorpe 2852 S 15190 E
Royal GalaM26 2500 Yes
Western Australia (WA)
Manjimup 3416 S 11670 E
GalaxyM26 2500 No
Tasmania (TAS)
Huonville 4301 S 14706 E
Alvina GalaM26 2500 No
8 Dormancy-breaking sprays for low winter chill in apples
Figure 1 Study sites in Huonville TAS (a) Stanthorpe QLD (b) and Manjimup WA (c) in spring 2015
Experimental design
The experiment was a randomised complete block design with two treatments (Waikentrade and Dormexreg) and an untreated control in WA and TAS and three treatments (Waikentrade Dormexreg and Ergerreg) and an untreated control in QLD Replicates were individual trees with five replicates per
treatment Guard trees were included either side of the datum trees to ensure complete coverage of
datum trees and to protect other datum trees in the row from over-spraying Sprays were applied at
one concentration and timing according to directions on the product label
Spray application
Dormancy-breaking sprays were applied to the datum trees using a hand lance (Figure 2) as
described in Table 2
a
b
c
9 Dormancy-breaking sprays for low winter chill in apples
Table 2 Details of the dormancy-breaking sprays applied to lsquoGalarsquo trees in WA TAS and QLD in winter 2015
Dormexreg Waikentrade Ergerreg
Active constituent 520gL Cyanamide 388gL Methyl esters of fatty acids
250gL Decanol alkoxylate (fertiliser adjuvant)
Product rate 3L 100L water (3 vv) 4L 100L water (4 vv) 5L 100L water (5 vv)
Additives
50ml100L Agral or 125ml100L Kendeen 20
NA 10kg100L Calcium nitrate
Application Applied as a fine spray over entire tree to the point of run-off
Application timing
35 days before expected green tip (label suggests 30 ndash 45 days)
35 before expected green tip (label suggests 35 ndash 50 days)
35 days before expected green tip (label suggests 45 days)
Determination of application date
Grower records of historical green tip dates were accessed for the study site Chill accumulation was monitored during the winter and compared with historical chill accumulation data to obtain the best estimate of expected green tip date
Figure 2 Application of dormancy-breaking sprays using a hand lance in Manjimup WA
10 Dormancy-breaking sprays for low winter chill in apples
Table 3 Actual timing of dormancy-breaking spray application on lsquoGalarsquo trees in QLD WA and TAS 2015
Location Spray Date Green tip date
Spray timing (days before
green tip)
Chill Portions at spraying
(brackets total chill)
Total chill Portions
TAS 13 Aug 8 Sep 26 95 (84) 113
QLD 30 July 5 Sep 37 60 (75) 80
WA 18 Aug 23 Sep 36 58 (75) 77
In untreated trees accumulated from 1 Jan to green tip
Figure 3 Chill Portion accumulation and dormancy-breaking spray application timing at study sites in TAS QLD and WA 2015
Temperature data and calculation winter chill
Hourly temperature data was recorded in the orchard using temperature data loggers placed inside a miniature Stevensonrsquos screen positioned approximately 15 to 2m within the tree row Winter chill was calculated in Chill Portions using the Dynamic model (Erez et al 1990 Fishman et al 1987)
Green tip and flowering
Buds were monitored three times per week (full methods described in appendix 1) from just prior to green tip until the end of flowering Only spur and terminal buds were assessed with axillary buds
11 Dormancy-breaking sprays for low winter chill in apples
and long highly vigorous shoots excluded Dates were recorded for the day on which each tree reached green tip 5 flowering and full bloom
Green tip was defined as the date when 5 of the buds of the tree had observable green tips corresponding to the 07 stage in the international BBCH code for pome fruit (beginning of bud break first green leaf tips just visible) (Meier et al 1994) Full bloom was defined as the date when 80 of the flowers were open similar to stage 65 in the international BBCH code for pome fruit (full flowering at least 50 of flowers open first petals falling) (Meier et al 1994)
Fruit set
Fruit set measurements were taken from three representative mid-canopy branches per tree The number of spur and terminal flower clusters were recorded for each limb soon after green tip when flowers were emerging The number of fruit set per cluster was recorded for each tagged limb after final fruit drop but before hand-thinning
Fruit sampling and maturity assessments
A 30 fruit sample was taken per datum tree prior but as close as possible to the growerrsquos first harvest For the purpose of standardisation between treatments fruit was sampled from the mid-section of each tree on the same side of the row To ensure the full range of variability was captured fruit were picked from along the entire length of a branch before moving on to the next branch This ensured that fruit was not biased towards selection from the outside or inside of the canopy
The following assessments were made on the 30 fruit sample
- Starch Pattern Index (SPI) was determined using the starch-iodine test for apples Each fruit was cut transversely across the equator and the cut surface of one side sprayed with a solution of 1g potassium iodide plus 025g iodine per 100ml water (01 iodine 1 potassium iodide The resulting pattern of starch hydrolysis was compared with the ENZA 0-6 scale
- Background colour (BGC) was estimated using an ENZA lsquoRoyal Galarsquo swatch - Red blush intensity (RBI) was assessed by comparing the blushred side of the fruit with the
lsquoRoyal Galarsquo ENZA 11 point colour chart - Red blush coverage (RBC) was assessed by estimating the of the fruit surface covered by
greater than or equal to an RBI of 2 (on the ENZA 11 point chart)
Variability in fruit quality at harvest
Variability of fruit maturity and quality at harvest was assessed by calculating the standard deviation of the fruit weight SPI BGC RBI RBC measurements taken from the 30 fruit sample
Yield
Yield was calculated per tree by multiplying the total fruit number (counted and recorded prior to harvest) by the average fruit weight (taken from the 30 fruit sample) Trunk cross-sectional area (TCA) was calculated from a trunk circumference measurement taken 20 cm above the graft
Phytotoxicity
As both Dormexreg (Bound and Jones 2004) and Ergerreg (Hawerroth et al 2010) can cause phytotoxicity phtotoxicity was assessed and recorded from the date of spray application to flowering using a 0-4 scale (appendix 2)
12 Dormancy-breaking sprays for low winter chill in apples
Results and discussion
Timing of spray application
The target spray timing was 35 days before green tip Historical green tip records together with in-season chill accumulation calculations were used to predict the estimated date of green tip for 2015 A best estimate of green tip date was determined by comparing the current seasonrsquos chill accumulation curve with that of the previous few seasons to determine how the season was tracking The actual spray date was further dictated by the weather with favourable conditions for spraying required Actual spray timing was 26 37 and 36 days before green tip in TAS QLD and WA respectively (Table 3)
The timing of dormancy-breaking spray application can have considerable impact on product efficacy (Faust et al 1997 Petri et al 2010) Spraying too early reduces effectiveness and spraying too close to bud burst can have undesirable effects such as delayed green tip and bud damage (Bound and Jones 2004 Bound and Miller 2006) Getting the timing right can be problematic however due to difficulties in estimating the date of green tip Dormancy-breaking sprays are commonly applied according to calendar date in other crops such as grapes (pers comm) but this is not recommended in apples as the date of green tip can vary considerably from season to season The methods described in this study estimated green tip dates successfully in WA and QLD Green tip timing was more difficult to predict in TAS primarily due to the exceptionally cold winter conditions
No bud or flower phytotoxicity was observed in this study with any of the dormancy-breaking spray treatments
Green tip and flowering
Green tip and flowering responses to dormancy-breaking sprays varied between sites (Figure 4 and Table 4)
In TAS green tip was delayed by five and six days in Dormexreg and Waikentrade sprayed trees respectively (Figure 4 and Table 4) Extended dormancy is not an uncommon response and occurs when dormancy-breaking sprays are sprayed close to bud burst (Bound and Miller 2006) These trees caught up with the untreated control trees and there were no significant differences in the date of full bloom or the duration of the flowering period A reduction in the length of flowering was observed in trees sprayed with both of the dormancy-breaking products but this was not statistically significant
The lack of flowering response to the dormancy-breaking sprays was likely due to the cold 2015 winter in which Huonville received 113 chill portions well above the long-term average of 88 Under these conditions it was likely that the lsquoGalarsquo chilling requirement was satisfied prior to application of the dormancy-breaking sprays limiting the potential impact Buds were possibly already sitting in the eco-dormant phase of dormancy waiting for favourable growing conditions The rapid onset of a warm spring resulted in a short flowering period of just two to three days in all trees
In QLD green tip was significantly advanced in trees sprayed with Dormexreg Ergerreg and Waikentrade by nine six and five days respectively when compared with untreated trees (Figure 4 and Table 4) Full bloom was advanced by 12 5 and 5 days with Dormexreg Ergerreg and Waikentrade respectively (Figure 5) and the flowering period was condensed with all dormancy-breaking sprays Green tip and flowering responses to the Dormexreg spray were significantly stronger than responses to Waikentrade and Ergerreg with no differences observed between the latter two products
In WA green tip was significantly advanced by 14 days in trees sprayed with Dormexreg and four days in trees sprayed with Waikentrade (Figure 4 and Table 4) Full bloom was advanced by nine days in Dormexreg sprayed trees while there was no difference in full bloom dates between trees sprayed with Waikentrade and the untreated trees The length of the flowering period was reduced by 19 with
13 Dormancy-breaking sprays for low winter chill in apples
Dormexreg while Waikentrade caused a significant increase in the flowering period by 39 In studies of both time and rate of application across five cultivars Bound and Miller (2006) reported that Waiken concentrated the flowering period regardless of whether the flowering period was brought forward or delayed The cause of the lengthening of flowering in this study in the Waikentrade treated trees is unclear and requires further studies to determine if this is a real response to Waikentrade or the result of other experimental factors
The differences observed in green tip and flowering responses to dormancy-breaking sprays at each site in the 2015-2016 season indicate that responses are likely to vary from season to season depending on factors including temperatures before and after spraying and timing of spraying relative to green tip Petri et al (2010) described the impact of temperature at spraying and in the days immediately following spraying on the response to dormancy-breaking sprays
In QLD and WA dormancy-breaking sprays caused large changes to full bloom timing and duration indicating that careful consideration needs to be given to the flowering time of polliniser varieties to ensure fruit set is not impacted With historical knowledge of cultivar flowering times dormancy-breaking sprays can be used to improved synchronisation of flowering between cultivars and their pollinisers (Petri et al 2012)
Figure 4 Green tip first flower and full bloom in Gala apples treated with and without dormancy-breaking sprays in TAS QLD and WA
14 Dormancy-breaking sprays for low winter chill in apples
Table 4 Effect of dormancy-breaking sprays on green tip and flowering dates and duration for lsquoGalarsquo apple strains grown in TAS QLD and WA in the 2015 - 2016 season
Site lsquoGalarsquo strain
Treatment Green tip (DoY)
First flower (DoY)
Full bloom
(DoY) Green tip to first flower (days)
First flower to full bloom (days)
Tas Alvina Untreated 251 b 275 b 278 24 a 3
Dormexreg 256 a 277 a 279 20 b 2
Waikentrade 257 a 277 a 279 20 b 2
QLD Royal Untreated 248 a 266 a 278 17 c 12 a
Dormexreg 239 c 259 c 266 20 b 7 c
Ergerreg 242 b 264 b 273 22 a 9 b
Waikentrade 243 b 264 b 273 21 ab 9 b
WA Galaxy Untreated 266 a 281 a 287 15 b 6 b
Dormexreg 252 c 273 c 278 21 a 5 c
Waikentrade 262 b 278 b 287 17 b 9 a
DoY = Day of year Within a single and site only means with different letters are significantly different P = 005 LSD test Full bloom dates did not vary between trees within each treatment and therefore no statistics could be performed
Figure 5 Differences in stages of flowering on 18 September 2015 in QLD lsquoGalarsquo trees treated with and without dormancy-breakers
Ergerreg
Untreated Waikentrade
tradereg
Dormexreg
regregregreg
15 Dormancy-breaking sprays for low winter chill in apples
Fruit set and yield
Fruit set expressed as the percentage of flower clusters that set fruit was not significantly different between treatments at any location (Figure 6) indicating that compaction of the flowering period observed most strongly in QLD did not negatively (or positively) impact the effectiveness of pollination Similarly when expressed as the number of fruit set per 100 flower clusters there was no difference between treatments (data not shown) Dormancy-breaking sprays have been shown to have a slightly negative effect on fruit set in some studies (Hawerroth et al 2010 Bound and Jones 2004) suggesting that impacts on pollination success are likely to be influenced by factors such as cultivar and season
Interestingly the number of fruit set per 100 flower clusters was significantly different between locations with TAS showing the highest fruit set followed by WA and then QLD (data not shown)
Figure 6 Fruit set in lsquoGalarsquo apple trees treated with dormancy-breaking sprays at study sites in TAS QLD and WA 2015
There were no differences in gross apple yields between treatments at any location (Table 5) In TAS fruit from Waikentrade treated trees had the highest and most marketable mean fruit weight compared with the other treatments however this was likely a crop load effect and not a result of the treatment per se (Table 5) Yield adjusted for trunk cross sectional area was significantly higher in the control trees compared with both Waikentrade and Dormexreg treated trees in TAS It is unclear whether these differences were a result of the treatment as flowering density varied widely between trees in the block and therefore it is possible that any differences in yield were a reflection of flowering density rather than an impact of the treatments
In QLD fruit numbers were significantly higher in the Dormexreg treated trees compared with those sprayed with Ergerreg and Waikentrade (Table 5) Again it is unclear whether this is the result of the treatments as there were no significant differences in the percentage of flowers setting fruit (Figure 6) In WA there were no differences in the components of yield between treatments (Table 5)
Dormexreg has been shown to significantly improve yields in other studies of apple including in lsquoGranny Smithrsquo and lsquoGolden Deliciousrsquo (Jackson and Bepete 1995) Such improvements are likely to be more substantial in very warm growing regions such as the one used in the Jackson and Bepete (1995)
16 Dormancy-breaking sprays for low winter chill in apples
study which had less than 300 chill hours where yields are generally very low to start with In most Australian growing regions significant improvements are more likely to be related to fruit quality and marketable yield rather than gross yield
Table 5 Effect of dormancy-breaking sprays on gross yield and its components at harvest for lsquoGalarsquo apple strains grown in TAS QLD and WA in the 2015-2016 season
Site lsquoGalarsquo strain
Treatment TCA1 (cm2)
Fruit no tree
Fruit no TCA
Mean fruit weight (g)
Kgtree KgTCA Tha
Tas Alvina Untreated 141 233 166 a 1332 b 308 22 a 77
Dormexreg 162 201 121 b 1248 c 241 15 b 60
Waikentrade 158 118 77 c 1573 a 187 12 b 47
QLD Royal Untreated 185 196 ab 108 a 1288 252 14 63
Dormexreg 217 241 a 111 a 1285 308 14 77
Ergerreg 212 167 b 81 b 1395 233 11 58
Waikentrade 206 187 b 93 ab 1303 242 12 60
WA Galaxy Untreated 173 162 105 1070 166 11 41
Dormexreg 180 161 102 1141 184 11 46
Waikentrade 196 212 108 1044 219 11 55
1TCA = trunk cross-sectional area Within a single and site only means with different letters are significantly different P = 005 LSD test
Fruit maturity and quality
Results of the effect of dormancy-breaking sprays on fruit maturity and quality are shown in Table 6 In TAS fruit from trees treated with Waikentrade were the most advanced according to the delta absorbance (DA) meter and background colour however the starch pattern index results indicate that fruit from untreated trees were the most mature at harvest Therefore differences in the timing of maturity with treatments are not clear but the impacts were not large
In QLD fruit was harvested on different dates due to the large differences in maturity between treatments Fruit from Dormexreg trees were more than one week ahead of untreated trees (Table 6) Fruit from Ergerreg and Waikentrade trees were also ahead by at least two days however comparison of the background colour and red blush coverage data suggested that fruit on these trees were further advanced (Figure 7) Advances in fruit maturity reflected the differences in flowering dates
In WA fruit maturity was slightly advanced in Dormexreg trees compared with control but this was not statistically significant (Table 6) The background colour was significantly higher in fruit from Waikentrade treated trees compared with Dormexreg and control trees According to the data there were no differences in red blush coverage between treatments although grower observation suggested that
17 Dormancy-breaking sprays for low winter chill in apples
the colour was more intense in the trees sprayed with Dormexreg compared with other treatments This may have been due to advanced maturity
Table 6 Effect of dormancy-breaking sprays on fruit maturity and quality at harvest for lsquoGalarsquo apple strains grown in TAS QLD and WA in the 2015-2016 season
Site lsquoGalarsquo strain
Treatment Fruit sample date
Starch pattern index
Background colour
Red blush coverage2
()
Red blush intensity2
DA index1
Tas Alvina Untreated 7316 08 a 64 b 045 b
Dormexreg 7316 03 b 62 c 051 a
Waikentrade 7316 03 b 65 a 035 c
QLD Royal Untreated 3216 24 34 c 156 b 18
Dormexreg 27116 32 41 b 356 a 29
Ergerreg 1216 35 45 a 360 a 31
Waikentrade 1216 35 43 ab 339 a 30
WA Galaxy Untreated 9216 21 34 b 709 52
Dormexreg 9216 31 34 b 682 46
Waikentrade 9216 25 41 a 726 50
1DA index was measured with the Delta Absorbance meter in Tasmania only 2Red blush coverage and intensity were not measured in Tasmania Numbers are the average of 30 fruit samples Within a single and site only means with different letters are significantly different P = 005 LSD test
18 Dormancy-breaking sprays for low winter chill in apples
Figure 7 Fruit at harvest on 27 January 2016 in lsquoGalarsquo trees treated with Dormexreg and Ergerreg QLD (centre tree was sprayed surrounding trees are untreated)
There was no measurable reduction in the variability of fruit maturity (as assessed by looking at colour starch pattern index and fruit weight) at harvest with any of the sprays (data not shown) despite the significant effect of the treatments on compaction of flowering at some sites Similar results were observed by Bound and Jones (2004) who found no consistent trends in impacts on fruit quality with the use of Dormexreg even though significant compaction of the flowering period was observed
Based on the finding that an extended flowering period increases the variability of fruit size at harvest (Petri and Leite 2004) it was hypothesised in this study that a reduction in the spread of flowering would result in a reduction in the spread of maturity potentially reducing the number of picks and increasing the percentage of fruit picked at optimum maturity
Failure to observe an improvement in variability could be the result of a number of factors Firstly the small experimental scale Up-scaling the experiment to rows or blocks of trees would provide more scope for identifying differences in fruit variability and potential for improving harvest management Secondly other influences impacting on fruit quality may have overshadowed any effects of the more uniform flowering Factors such as position in the canopy shading leaf area associated with individual fruit development and age of wood bearing the fruit have all been shown to impact on mineral content and quality (Volz et al 1994)
Cost-benefit analysis
A full cost-benefit analysis was not undertaken here as the size of the study did not enable sufficient collection of data for meaningful analysis of dollar value however the broad costs and benefits are outlined in Error Reference source not found
Dormexreg
reg
Ergerreg (centre tree only)
19 Dormancy-breaking sprays for low winter chill in apples
Table 7 Outline of cost and benefits associated with the use of dormancy-breaking sprays to manage low winter chill years in apple
Costs
Direct costs
Product purchase
Labour to apply product
Tractor and associated costs to perform one spray during the dormant period
Potential indirect costs
Inappropriate application timing could result in anything from nil benefit to significant bud damage resulting in negative impacts on pollination and fruit set
Human health impacts from inappropriate handling and use of some dormancy-breaking products
Benefits
More compact and uniform flowering resulting in improved efficiency of chemical thinning and management of flowering pests
More compact flowering potentially resulting in more uniform fruit maturity throughout the canopy and therefore shorter harvest duration (saving on labour costs) and improvements in fruit quality Also likely to be benefits for the effectiveness of pest and disease management and efficacy of plant growth regulators such as ReTainreg to manage harvest
Benefits would be greater in low chill years when the potential impacts of inadequate chill on flowering are greatest Benefits are likely to increase under future warmer climate scenarios
Earlier flowering and harvest time market-price benefits in some cases
Benefits are likely to vary with cultivar and block (for example tree structure may effect impact of dormancy-breaking sprays on fruit quality)
20 Dormancy-breaking sprays for low winter chill in apples
Conclusions
The dormancy-breaking sprays assessed in this study were able to advance flowering time and compact the flowering period in lsquoGalarsquo apple with differences observed between products and sites A more compact and uniform flowering period has a number of benefits including improved management of bee hives flowering pests and chemical thinning practices
Despite the compaction of flowering there were no clear differences observed in fruit set yield or variability of apple maturity in trees treated with dormancy-breaking sprays More work is required to test the potential of these products to improve fruit quality and reduce the length of harvest Advances in harvest timing were observed with the dormancy-breakers and generally reflected differences in flowering dates The ability to manipulate harvest timing can be useful in situations where advantage can be taken of a high-price market window
Dormexreg had the most significant impacts on lsquoGalarsquo flowering and harvest timing in WA and QLD when compared with Waikentrade and Ergerreg However Dormexreg is considerably more toxic to humans than either Waikentrade or Ergerreg and has greater capacity to cause phytotoxicity (Bound and Miller 2006) It has been noted in other studies that a significant advantage of using non-toxic dormancy-breaking products such as Waikentrade is greater flexibility with the timing of application The product can be applied later in the season (up to when some buds are showing green) without causing damage to buds (Bound and Miller 2006)
Application timing of dormancy-breaking sprays relative to green tip previous winter chill accumulation and temperatures received after spraying had considerable impact on product efficacy in this study As a consequence flowering responses are likely to vary between seasons and it is important to consider the flowering time of polliniser cultivars to ensure flowering overlap so that fruit set is not affected
The overarching research question posed at the outset of this study was are dormancy-breaking sprays a feasible adaptation option for the Australian apple industry to low chill years in current and future climates Results have indicated that dormancy-breaking sprays are likely to be an effective tool for managing flowering in lsquoGalarsquo in lower chill years in Australian growing conditions It seems reasonable to broaden this conclusion to other apple cultivars when considered in the context of results from previously published research in lsquoFujirsquo lsquoGranny Smithrsquo lsquoCripps Pinkrsquo and lsquoCripps Redrsquo (Bound and Jones 2004 Bound and Miller 2006 Petri et al 2014 Erez 2000) However significant research gaps still remain
How effective will dormancy-breaking sprays be as an adaptation for the Australian apple industry to the climate change in the longer term Or to phrase the question another way when will the winter chill received in an orchard fall too far below the chilling requirement for even the use of dormancy-breaking sprays to enable economic production Only a proportion of the chilling requirement can be compensated for by the use of dormancy-breaking sprays (Faust et al 1997) but the size of this proportion is unclear It has been suggested that up to 30 of the chilling requirement can be compensated for with dormancy-breaking sprays (Erez 1995) however compensation closer to 45 has been demonstrated in stone fruit (George et al 2002)
A global study to investigate the limits of profitable apple production with regards to winter chill would provide valuable information for the Australian industry in climate change adaptation planning Production areas with very low winter chill accumulation in South Africa and Southern Brazil rely heavily on dormancy-breakers and would be obvious target locations for this research
A more accurate method for determining dormancy-breaking spray timing is required to improve the consistency and predictability of the flowering response Difficulties in estimating the green tip date has potential to reduce the product efficacy and cause bud damage in the worst cases Faust et al
21 Dormancy-breaking sprays for low winter chill in apples
(1997) suggested that dormancy-breakers are only effective when sprayed during the lsquos-endodormancyrsquo phase of dormancy and not before (Figure 8) A biological marker is required to determine when buds are at this stage and therefore responsive to dormancy-breaking sprays Biochemical changes in water status cell membrane composition hormone production and anabolic potential have been identified in buds as they progress through the stages of dormancy (Faust et al 1997) and could potentially be used as markers of dormancy status Incidentally the use of tetrazolium staining (Carvalho et al 2010) as a simple tool to monitor the status of bud dormancy in apples was assessed as part of this study but could not reliably track the shift from dormancy to bud burst (data not shown)
The mechanism by which dormancy-breaking sprays act to promote bud burst particularly in the case of Dormexreg remains unclear Vergara et al (2012) suggested that a respiratory stress may be involved in the release of buds from dormancy and Melke (2015) concluded that oxygen starvation was involved in the dormancy breaking mechanism when applying oils Understanding the mode of action would enable the development of products with greater efficacy and safety
The Australian pistachio industry has recommended winter oil application in low chill years to advance bud burst The recommendation states that winter oil be applied if 57 Chill Portions have not been reached by 15 August (Zhang and Taylor 2011) Defined guidelines for apple varieties on the use of dormancy-breaking sprays are likely to be some way off due to a lack of understanding around cultivar chilling requirements Investigations should be undertaken however into the possibility of determining broad guidelines based on current knowledge
Figure 8 A schematic representation of the progression of buds through dormancy showing the point at which buds become responsive to the action of dormancy-breaking sprays (Faust et al 1997)
22 Dormancy-breaking sprays for low winter chill in apples
Key messages
- Dormancy-breaking sprays are likely to be an effective tool for managing flowering in lsquoGalarsquo and other apple cultivars in lower chill years in Australia
- Impacts of dormancy-breaking sprays on fruit quality and length of the harvest window remain unclear
- Benefits from the use of dormancy-breakers are likely to be greater in low chill years when the potential impacts of inadequate chill on flowering are greatest Therefore benefits are likely to increase under future warmer climate scenarios
- Dormexreg Waikentrade and Ergerreg were able to advance flowering time and compact the flowering period in lsquoGalarsquo apple with differences observed between products and sites Compact and uniform flowering period has benefits for improved management of bee hives flowering pests and chemical thinning practices
- Fruit maturity was advanced with dormancy-breakers with differences observed between products and sites and generally reflected differences in flowering dates The ability to manipulate harvest timing can be useful in situations where advantage can be taken of a high-price market window
- There were no differences in fruit set yield or variability of apple maturity in trees treated with dormancy-breaking sprays despite the compaction of flowering
- Dormexreg had the most significant impacts on lsquoGalarsquo flowering and harvest timing in WA and QLD when compared with Waikentrade and Ergerreg
- The timing of spray application relative to green tip previous winter chill accumulation and temperatures received after spraying impacts the bud burst and flowering response to dormancy-breaking products
- Flowering responses are likely to vary between seasons cultivars and blocks
- Flowering time of polliniser cultivars needs to be considered to ensure flowering overlaps so that fruit set is not affected
Recommendations
- The timing of dormancy-breaking spray application should be carefully considered as inappropriate timing could result in anything from nil benefit to significant bud damage resulting in negative impacts on pollination and fruit set
- Application timing should be determined using historical green tip and winter chill records together with monitoring of in-season chill accumulation Historical and up-to-date in-season winter chill information will be available from the Australian winter chill website (to be released in March 2017)
- Investigations should be undertaken into the possibility of determining broad guidelines around for the use of dormancy-breaking sprays to manage low chill years in cultivars of apple based on existing knowledge Such guidelines should include information on when dormancy-breaking sprays should be used and in which cultivars and regions
- Potential benefits of dormancy-breaking sprays on variability of fruit maturity and the length of the harvest window remain unclear Further research is required to investigate how these products might be used to improve fruit quality and harvest efficiency particularly in cultivars requiring multiple picks
23 Dormancy-breaking sprays for low winter chill in apples
- Investigations into alternatives to Dormexreg are required Current research suggests that this product remains the most efficacious dormancy-breaker available in Australia but its mammalian health impacts may result in de-registration in the future Research is required to determine the mode of action of Dormexreg to enable development of dormancy-breaking products with greater efficacy and safety
- In considering potential for adaptation to warmer winters Australian apple growers need to know when the winter chill received in their orchard will fall too far below the chilling requirement for dormancy-breaking sprays to enable economic production of each cultivar Further research at both the basic and applied levels would be required to provide these guidelines
- A global study to investigate the limits of profitable apple production with regards to winter chill would provide valuable information for the Australian industry in climate change adaptation planning Production areas with very low winter chill accumulation in South Africa and Southern Brazil rely heavily on dormancy-breakers and would be obvious target locations for this research
- Basic research is necessary to identify a biological marker of bud progression through dormancy to facilitate optimal timing for dormancy-breaking spray application
- Further research to develop phenology models of bud burst timing for apple cultivars is required to enable more accurate estimations of green tip date
Acknowledgements
We thank Steven and Ugo Tomasel (Qld) Maurie Ann Tim and Michelle Lyster (WA) and Scott Price (TAS) for the use of their orchards in this trial Thanks to Allan McWaters John Sutton Lisa Starkie and Steve Paterson for providing the technical support necessary to conduct this trial
Appendices
1 Phenology Data Collection Protocols 2 Bud damage scale
References
Abd El-Razek E Abd El-Migeed M M M and Abdel-Hamid N (2013) Response of le conte pear trees to garlic extract and GA3 as budbreak dormancy agents Middle East Journal of Scientific Research 14(11) 1407-1413
Allderman L A Steyn W J and Cook N C (2011) Growth regulator manipulation of apple bud
dormancy progressions under conditions of inadequate winter chilling South African Journal of Plant and Soil 28(2) 103 - 109
Bound S A and Jones K M (2004) Hydrogen cyanamide impacts on flowering crop load and fruit
quality of red Fuji apple (Malus domestica) New Zealand Journal of Crop and Horticultural Science 32(2) 227-234
Bound S A and Miller P (2006) Effects of Waikenreg on flowering and spring growth in apple Acta
Horticulturae 727 167-174
24 Dormancy-breaking sprays for low winter chill in apples
Carvalho R I N Rendoke J C Biasi L A and Zanette F (2010) Metabolic activity evaluation of
temperate tree fruit buds by using the tetrazolium test Acta Horticulturae 872 89 - 95
Darbyshire R Webb L Goodwin I and Barlow E W R (2013) Impact of future warming on winter
chilling in Australia International Journal of Biometeorology 57(3) 355-366
Erez A (1995) Means to compensate for insufficient chilling to improve bloom and leafing Acta
Horticulturae 395 81-95
Erez A (2000) Bud dormancy phenomenon problems and solutions in the tropics and subtropics in
Erez A ed Temperate Fruit Crops in Warm Climates Kluwer Academic Publishers 17 - 47
Erez A Fishman S Linsley-Noakes G C and Allan P (1990) The dynamic model for rest
completion in peach buds Acta Horticulturae 276 165-174
Erez A Yablowitz Z Aronovitz A and Hadar A (2008) Dormancy breaking chemicals Efficiency
with reduced phytotoxicity Acta Horticulturae 772 105-112
Faust M Erez A Rowland L J Wang S Y and Norman H A (1997) Bud dormancy in
perennial fruit trees Physiological basis for dormancy induction maintenance and release HortScience 32(4) 623-629
Fishman S Erez A and Couvillon G A (1987) The temperature dependence of dormancy
breaking in plants mathematical analysis of a two-step model involving a cooperative transition Journal of Theoretical Biology 124 473 - 483
George A P Broadley R H Nissen R J and Ward G (2002) Effects of new rest-breaking
chemicals on flowering shoot production and yield of subtropical tree crops Acta Horticulturae 575 835-840
Hawerroth F J Petri J L and Leite G B (2010) Erger and calcium nitrate concentration for
budbreak induction in apple trees Acta Horticulturae 872 239-244
Jackson J E and Bepete M (1995) The effect of hydrogen cyanamide (Dormex) on flowering and
cropping of different apple cultivars under tropical conditions of sub-optimal winter chilling Scientia Horticulturae 60(3-4) 293-304
Labuschagne I F Louw J H Schmidt K and Sadie A (2002) Genetic variation in chilling
requirement in apple progeny Journal of the American Society for Horticultural Science 127(4) 663-672
Meier U Graf H Hess M Kennel W Klose R Mappes D Seipp D Stauss R Streif J and
van den Boom T (1994) Phaumlnologische Entwick-lungsstadien des Kernobstes (Malus domestica Borkh und Pyrus communis L) des Steinobstes (Prunus-Arten) der Johannisbeere (Ribes-Arten) und der Erdbeere (Fragaria x ananassa Duch) Nachrichtenbl Deut Pflanzenschutzd 46 141 - 153
25 Dormancy-breaking sprays for low winter chill in apples
Oukabli A Bartolini S and Viti R (2003) Anatomical and morphological study of apple (Malus x domestica Borkh) flower buds growing under inadequate winter chilling Journal of Horticultural Science and Biotechnology 78(4) 580-585
Petri J L Hawerroth F J Leite G B Couto M and Francescatto P (2012) Apple phenology in
subtropic climate conditions in Zhang X ed Phenology and climate change Rijeka Croatia InTech 195 - 216
Petri J L and Leite G B (2004) Consequences of insufficient winter chilling on apple tree bud-
break in Jindal K K Sharma R C and Rehalia A S eds Acta Horticulturae
Petri J L Leite G B Couto M Gabardo G C and Haverroth F J (2014) Chemical induction of
budbreak New generation products to replace hydrogen cyanamide Acta Horticulturae 1042 159-166
Petri J L Leite G B and Hawerroth F J (2010) Time of Erger application for budbreak induction
in apple trees Acta Horticulturae 872 205-210
Samish R M (1954) Dormancy in woody plants Annual Review of Plant Physiology 5 183-204
Saure M C (1985) Dormancy release in deciduous fruit trees Horticultural Reviews 7 239-300
Volz R K Ferguson I B Hewett E W and Woolley D J (1994) Wood age and leaf area
influence fruit size and mineral composition of apple fruit Journal of Horticultural Science 69(2) 385-395
Wang S Y Steffens G L and Faust M (1986) Breaking bud dormancy in apple with a plant
bioregulator thidiazuron Phytochemistry 25(2) 311-317
White N (2016) Climate scenarios for pome fruit growing regions of Australia (2030 and 2050)
Queensland Australia Department of Agriculture and Fisheries
Zhang J and Taylor C (2011) The Dynamic Model Provides the Best Description of the Chill
Process on Sirora Pistachio Trees in Australia HortScience 46(3) 420-425
26 Dormancy-breaking sprays for low winter chill in apples
Appendix 1
PHENOLOGY DATA COLLECTION PROTOCOLS
11 Phenology Data
Phenology assessments will be performed to determine 5 green tip (apple) and full bloom
(80 open flowers) dates for apple varieties Regular visual assessments (Monday
Wednesday and Friday) will be made from just prior to budburst until flowering is
completed Assessments will be performed on a whole tree basis with only spur and terminal
buds and spur and terminal flower clusters assessed (axillary buds on one-year-old pome fruit
shoots are not included in the assessments)
12 Apple Phenology Collection Methods
Select five trees to monitor for each variety and rootstock (where applicable) under
investigation
Green tip
Prior to green tip count the number of buds (spur and terminal) on one of the
five selected trees and record
Compare the remaining four trees and estimate up or down the number of buds
on each tree If there is an obvious variation to the counted tree perform a full
count
Estimate green tip percentages by counting all buds at the green tip stage The
initial bud count will inform this For instance if the tree has 500 buds 25 buds
at green tip will indicate the tree is at 5
After the tree has reached 5 green tip make one more visit to ensure the
observation was correct
Flowering
Once flowering commences initially record the number of open flowers up to
50 This will be easier than calculating small percentages
Count the number of flower clusters on one tree Similarly to the bud count
estimate the number of clusters on the remaining four trees and make
adjustments up or down for differences between the trees
To estimate flowering percentage count the number of full clusters open by
estimating across clusters For instance if two clusters have halve the flowers
open that equates to one full cluster Estimate percentage open based on total
cluster number previously recorded
For very large trees (flower clusters greater than 1000) additional estimates
may need to be made to account for the size of the tree Follow the above
27 Dormancy-breaking sprays for low winter chill in apples
protocol for three representative branches (similar cluster distribution up the
branch as the tree) on each tree rather than the whole tree If the tree is less than 50 bloom counting the number of open clusters will be
easiest If more than 50 of flowers are open counting the number yet to bloom
will be easier
As a general rule round estimates to the nearest 5
13 Recording Phenology Data
An Excel based data collection pro forma has been developed to ensure data is recorded
consistently between sites Attachment A is an example of the data recording sheet
Dormancy-breaking sprays for low winter chill in apples 2016 28
Bud damage scale
Scale
0 No damage
1 Mild burning
Mild burning of bud scales but buds normally recover
2 Moderate damage
Buds likely to develop but some flowers too burnt to open some flowers undamaged
3 Severe burning
Buds do not develop usually results in bud death
Full Terms amp Conditions of access and use can be found athttpwwwtandfonlinecomactionjournalInformationjournalCode=tnzc20
Download by [The University Of Melbourne Libraries] Date 03 February 2016 At 1845
New Zealand Journal of Crop and Horticultural Science
ISSN 0114-0671 (Print) 1175-8783 (Online) Journal homepage httpwwwtandfonlinecomloitnzc20
Sun damage risk of Royal Gala apple in fruit-growing districts in Australia
R Darbyshire L McClymont amp I Goodwin
To cite this article R Darbyshire L McClymont amp I Goodwin (2015) Sun damage risk of RoyalGala apple in fruit-growing districts in Australia New Zealand Journal of Crop and HorticulturalScience 433 222-232 DOI 1010800114067120151034731
To link to this article httpdxdoiorg1010800114067120151034731
Published online 26 May 2015
Submit your article to this journal
Article views 41
View related articles
View Crossmark data
RESEARCH ARTICLE
Sun damage risk of Royal Gala apple in fruit-growing districts in Australia
R Darbyshirea L McClymontb and I Goodwinab
aFaculty of Veterinary and Agricultural Science University of Melbourne Melbourne Australia bDepartment ofEconomic Development JobsTraining and Resources Tatura Australia
(Received 17 November 2014 accepted 18 March 2015)
This study estimated minimum air temperatures for potential sun damage for sunburn browning (non-netted and netted) and sunburn necrosis (non-netted) for Royal Gala apple in Australia The approachestimated when conditions may be conducive to the development of sun damage in some fruit Theapproach provides a measure of potential damage This allows for more flexible analyses of potentialsun damage which current models are unable to produce due to data limitations The air temperaturethresholds determined were 341 and 387 degC respectively for browning and necrosis for non-nettedfruit and 379 degC for browning under netting These air temperature thresholds were applied acrosssouthern Australia from 1911ndash2013 demonstrating different risk profiles between sites inter-annualvariability and the benefit of installing netting via a reduction in potential damage days The resultscan be further extended to estimate impacts from climate change and assess the benefit of installingnetting to adapt to increasingly extreme hot weather
Keywords browning necrosis shade net sunburn sunscald
Introduction
Sun damage in apple occurs as the result ofexposure to high radiation loads (Schrader et al2003ab) and can reduce market yield by down-grading quality and increasing cullage Regionswith summers characterised by clear skies and hightemperatures such as southern Australia havehigh sun damage risk A heat wave event inJanuary 2009 in the Goulburn Valley in southeastAustralia provides an example with large yieldlosses incurred due to sun damage approximatedat 30ndash70 (Thomson et al 2014)
Sun damage can manifest in many formsSunburn necrosis (henceforth referred to as nec-rosis) appears as a dark penetrative burn and is athermal response with a fruit surface temperature(FST) of 52 plusmn 1 degC for 10 min sufficient to inducenecrosis of several apple varieties including Gala(Schrader et al 2001) Sunburn browning (hence-forth referred to as browning) is characterised by a
yellow brown bronze or dark tan spot on the sun-exposed side of the fruit (Schrader et al 2003aRacsko amp Schrader 2012) and results from a com‐bination of high FST and light exposure Forattached Gala apples fully exposed to sunlight on aclear day Schrader et al (2001) reported a thresholdFST of 478 degC for browning damage when FSTwas maintained at constant temperature for 60 min
In the context of future climate change andassociated rising summertime temperatures in‐creased risk of sunburn damage is highly likelyPredictions regarding changes to sun damage riskand evaluation of adaptation options are thereforeimportant for future planning This is particularlypertinent for Australia Currently in many ofAustraliarsquos pome fruit-growing regions extremeheat events are common with incidences of extremeheat days increasing historically (Alexander et al2007) Further it is expected that such events willcontinue to increase in both frequency and severity
Corresponding author Email rebeccadarbyshireunimelbeduau
New Zealand Journal of Crop and Horticultural Science 2015Vol 43 No 3 222ndash232 httpdxdoiorg1010800114067120151034731
copy 2015 The Royal Society of New Zealand
Dow
nloa
ded
by [
The
Uni
vers
ity O
f M
elbo
urne
Lib
rari
es]
at 1
845
03
Febr
uary
201
6
due to anthropogenically induced climate change(Alexander amp Arblaster 2009) Given the backdropof increasingly extreme climate conditions thisresearch aimed to develop potential sun damageincidences for Royal Gala apple using air temper-ature information for netted and non-netted fruit
Few studies have scaled up analyses of sundamage beyond the experimental unit due tocomplexities in determining precise climate andgrowing conditions that lead to sunburn damage onindividual fruit Schrader et al (2003b) consideredthe influence of several factors on FST includingair temperature radiation wind speed and relativehumidity Of these air temperature was found to bemost highly correlated to FST In a predictivemodel developed later Schrader (2014) addedcultivar fruit diameter and canopy density asadditional factors that influence the FST of apple
Developing a method to use air temperature as aproxy for potential sun damage provides a flexibleplatform for broader analyses both temporally andspatially Daily maximum temperatures are com-monly recorded by meteorological organisationsand are available for long historical periods andwith large spatial coverage Other climate vari-ables such as relative humidity are much lessavailable Furthermore climate projection informa-tion for temperature is more reliable and readilyavailable than for other climate variables (CSIRO2007) Restrictions in the application of an existingFST model (Schrader 2014) due to data availabilityare already apparent (Racsko amp Schrader 2012)supporting the need for a simplified but consideredapproach
The objective of this study was to identifyair temperature thresholds that have the potentialto lead to sunburn damage To determine thesethresholds two aspects must be known First theFST threshold that induces damage for this studyRoyal Gala apple was used and threshold valuesof 52 degC for necrosis and 478 degC for browningwere utilised following previous findings (Schra-der et al 2001) Second estimates of air tempera-tures required to reach FST thresholds need to bedetermined This aspect is the focus of this study
Materials and methods
Fruit surface temperature data
Two adjacent Royal Gala apple blocks one non-netted and one netted situated at Shepparton(3642degS 14546degE) in southeast Australia (Fig 1)were used for the experiment The trees wereplanted on MM106 rootstock using a central leadertrellis system with 20 times 45 m tree spacing Theexperiment was conducted in January 2013 In thisregion Royal Gala is usually harvested late Januaryto early February The nets (Grey Quad 14 NetProStanthorpe Queensland Australia) were installedat a height of 6 m above ground with open sidesThese nets provided an 18 reduction in incidentradiation and are in common use in parts ofAustralia
Ten trees in each of the non-netted and nettedblocks were selected Of these four trees in thenon-netted block and five trees (due to somesmaller tree sizes) in the netted block were usedto measure FST Thermocouple sensors (Type Tthermocouples Tranzflo NZ Palmerston NorthNew Zealand) were placed under the skin of 60fruit in both the non-netted and netted blocks (iea total of 120 sensors) The sensors were distrib-uted across the selected trees such that 20 sensorswere located in each of the upper middle and
110 120 130 140 150 160
minus50
minus45
minus40
minus35
minus30
minus25
minus20
Longitude
Latit
ude
BatlowYoung
Lenswood
Spreyton
Yarra Valley
Donnybrook
Applethorpe
Manjimup
Huonville
Shepparton
Figure 1 Spatial area investigated and sites used for ana‐lyses marks the study site for observations (Shepparton)
Sun damage risk of Royal Gala apple in fruit-growing districts in Australia 223
Dow
nloa
ded
by [
The
Uni
vers
ity O
f M
elbo
urne
Lib
rari
es]
at 1
845
03
Febr
uary
201
6
lower parts of the canopy for both the netted andnon-netted blocks Sensors were positioned to-wards the western side of the tree to increase thelikelihood of reaching FST damage thresholdsFST was logged at 1 min intervals (CR1000Campbell Scientific Logan Utah USA) Averageair temperatures were concurrently measured(HMP155 Vaisala Vantaa Finland) and loggedat 1 min intervals (Datataker DT80M ThermoFisher Scientific Yokohama Japan) in both thenon-netted and netted blocks Air temperaturesensors were shielded and positioned 15 m abovethe ground surface Both FST and air temperaturedata were logged from 8ndash29 January 2013
Observations of sun damage were conductedfor fruit on the 10 trees in the non-netted andnetted blocks Damage was classified at harvestbetween 24 January and 4 February 2013 asbrowning or necrosis following descriptions bySchrader et al (2003a)
Air temperature threshold analysis
A conservative approach was taken to determineminimum air temperature thresholds for potentialsun damage Air temperatures at FST for browning(478 degC) and necrosis (52 degC) thresholds (Schra-der et al 2001) were initially extracted for fruit inthe non-netted and netted blocks To accommodateFST that did not fall precisely on the threshold val‐ue a buffer of +02 degC was applied Specificallyair temperatures for FST between 478ndash480 degC
and 520ndash522 degC were extracted to represent brow‐ning and necrosis respectively
The 10th percentile of the air temperatures atthese FST threshold ranges was then calculatedThis value was used to represent the minimum airtemperature threshold required for fruit to reach anFST that can cause damage ie a conservativelylow air temperature threshold that can cause sundamage It was assumed that at the 10th percent-ile other conditions that moderate damage wereacting to increase the potential of damage ratherthan dampen For instance low wind conditionsThis was performed for browning and necrosisFST thresholds and for non-netted and netted data
Spatial analysis
Analysis of the total number of days in Januarywhere daily maximum temperatures crossed theminimum air temperature threshold for potentialdamage was conducted using historical spatialgridded data (005 times 005 deg) for southern Australiafrom 1911ndash2013 sourced from the Australian Bu‐reau of Meteorology These surfaces were producedthrough a combination of empirical interpolationand function fitting applied to Australiarsquos networkof quality controlled weather stations (Jones et al2009) Within the spatial data sets 10 locationssituated in important Australian pome fruit-growingdistricts were identified for individual site analyses(Fig 1 and Table 1)
Table 1 Location information January maximum temperature data (1911ndash2013) calculated using AWAP data set
LocationLatitude(degS)
Longitude(degE)
Mean January maximumtemperature (degC)
SD January maximumtemperature (degC)
Applethorpe 2862 15195 263 34Batlow 3552 14814 261 45Donnybrook 3358 11583 302 45Huonville 4301 14706 219 44Lenswood 3494 13879 254 58Manjimup 3418 11607 274 47Spreyton 4122 14635 210 26Shepparton 3633 14540 294 50Yarra Valley 3784 14568 252 55
AWAP Australian Water Availability Project SD standard deviation
224 R Darbyshire et al
Dow
nloa
ded
by [
The
Uni
vers
ity O
f M
elbo
urne
Lib
rari
es]
at 1
845
03
Febr
uary
201
6
Across the historical data set variation in thetotal number of potential sun damage days inJanuary was assessed for southern AustraliaDifferences in the number of potential damagedays between non-netted and netted results werecompared
Results
Air temperature thresholds
Prior to analysis exploration of FST data from the120 fruit was conducted Fruit were inspectedevery 2ndash3 days to ensure that the sensors were inplace In the event that a sensor had dislodged thesensor was reinstalled and the data for that sensorwas removed back to the time of the previousinspection Results from one thermocouple in thelower canopy from the non-netted block wereexcluded due to readings consistent with regularwetting from an irrigation emitter The numbers ofdata points available for analysis were 1330588and 1587606 for non-netted and netted fruitrespectively
Using these data air temperatures as related toFST for non-netted and netted fruit were consid-ered (Fig 2) A close relationship between FSTand air temperatures can be seen for cooler air
temperatures At higher FSTs greater variation inair temperatures was observed that is a wideningof the air temperature range at a particular FST
Non-netted and netted air temperatures thatrelated to necrosis (520ndash522 degC) and browning(478ndash480 degC) FST thresholds were extracted Thedistribution of air temperatures along these FSTthresholds are shown in Fig 3 No fruit recordedan FST above 52 degC under netting (Fig 2) andhence no estimates of air temperature thresholdswere evaluated for necrosis damage under netting
The 10th percentile of the extracted air tem-peratures was calculated providing a minimum airtemperature threshold at which sun damage mayoccur For browning in the non-netted and nettedblocks these values were 341 and 379 degCrespectively For non-netted necrosis damage theair temperature threshold was 387 degC
In January 2013 at Shepparton each of the airtemperature thresholds for potential damage wassurpassed several times (Table 2) Note that thefive necrosis damage days were also incorporatedin the potential browning days as the browningthreshold must be surpassed to reach the necrosisthreshold In comparing the total potential fordamage between netted and non-netted fruit therelative risk of damage under netting was 54 ofthat for the non-netted fruit
Observations of sun damage at the study siterecorded differences between non-netted and net-ted trees (Table 3) with lower levels of damagerecorded for fruit under netting (Table 3) A 50reduction of damage was found for fruit undernetting
Historical potential damage analysis
To further investigate the number of potential sundamage days historically and to provide visualisa-tion of risk across Australiarsquos pome fruit-growingregions the air temperature thresholds (Table 2)were applied to southern Australia (Fig 4) Increas-ing risk is observed from the south of the countryto the north A lowering of risk along the easternseaboard reflects the higher elevation in that part ofAustralia Notable variation across the historicaldata set was found (panels left to right in Fig 4)
Figure 2 Fruit surface temperature (degC) recordings andrelated air temperatures (degC) Necrosis and browningFST thresholds represent 52 and 478 degC respectively
Sun damage risk of Royal Gala apple in fruit-growing districts in Australia 225
Dow
nloa
ded
by [
The
Uni
vers
ity O
f M
elbo
urne
Lib
rari
es]
at 1
845
03
Febr
uary
201
6
representing the inter-annual variability in the num‐ber of potential damage days in January
The percentile levels can be taken to representdifferent risk likelihoods assuming the climatedata are sourced from a normal distribution In thisanalysis the 10th and the 90th percentiles repres-ent the low and high ends of the distribution of thedata while the 50th percentile is the median Forexample the 10th percentile value was 2 days forbrowning in the non-netted orchard at Shepparton(Table 4) This can be interpreted as a 1 in 10 yearevent that 2 or fewer damage days will be expe‐rienced Equally this indicates there is a 9 in 10
year chance of 2 or more damage days occurringUsing the upper end of the distribution the 90thpercentile indicates that receiving 12 or moredamage days is a 1 in 10 year event
Locations in cooler regions (Huonville Sprey-ton Applethorpe Batlow) rarely crossed the airtemperature thresholds required for potential sundamage The data indicate that none of these coolersites recorded a day above the air temperaturethreshold for browning under netting or necrosisfor non-netted fruit even at the 90th percentile ofthe data Batlow did record 4 days in January thatmay lead to browning in non-netted blocks at the
Browning minus Nonminusnetted
Air Temperature
Pro
babi
lity
FST = 478minus480 degCn=374
AT threshold = 341 degC
00
02
04
06
08
10
32 34 36 38 40 32 34 36 38 40
00
02
04
06
08
10
Browning minus Netted
Air Temperature
Pro
babi
lity
FST = 478minus480 degCn=36
AT threshold = 379 degC
00
02
04
06
08
10
32 34 36 38 40
Necrosis minus Nonminusnetted
Air Temperature
Pro
babi
lity
FST = 520minus522 degCn=27
AT threshold = 387 degC
Figure 3 Air temperature (AT) for FST which relates to browning in the open and under nets and for necrosis in theopen The 10th percentile of the AT data is shown by the arrow n = sample size
226 R Darbyshire et al
Dow
nloa
ded
by [
The
Uni
vers
ity O
f M
elbo
urne
Lib
rari
es]
at 1
845
03
Febr
uary
201
6
90th percentile which can be translated as a 1 in10 year event
Conversely other pome fruit-growing regionsrecorded consistent potential for sun damage Forinstance Donnybrook Shepparton and Young allrecorded potential damage days for browning innon-netted blocks for each percentile level Thiscan be interpreted for Donnybrook as a 9 in 10chance of at least 3 days in January reachingtemperatures that could lead to browning of non-netted fruit
The wide range in potential damage days atsome sites demonstrates strong inter-annual variab‐ility in the historical data For instance at Shep-parton it can be expected that 2ndash12 days (capturing80 of the historical data) in January could lead tobrowning damage for non-netted fruit
The benefit of netting in terms of reducing thetotal number of potential damage days for brown-ing is shown in Fig 5 Note this was not con‐sidered for necrosis as an air temperature thresholdfor necrosis under netting could not be defined
Again variability is present with a minimal benefitnoted in some years (10th percentile) whereas otheryears indicated great benefit (90th percentile)
The benefit of netting is clear when individualsites within Australiarsquos fruit-growing regions wereconsidered (Table 5) For sites with few instancesof potential browning these episodes werereduced to nil with netting (Batlow Huonville)For locations with greater potential for browningdamage substantial decreases in the total numberof potential damage days recorded (Young Don-nybrook Shepparton) For these sites particularlynotable gains for the more extreme of the histor-ical data (90th percentile) were found (Table 5)
Discussion
Using previously established FST thresholds forGala apple (Schrader et al 2001) air temperaturesthat relate to potential browning and necrosisdamage for non-netted and netted fruit wererecorded at a site in southeastern Australia Awide range of air temperatures were found at thespecified FST thresholds (Figs 2ndash3) This range inair temperatures for a given FST was expected andrepresents a combination of different factors Theseinclude different microclimate conditions surround-ing the fruit such as fluxes in relative humidity andwind speed variation in radiation received due tofruit positioning and leaf shading and fruit char-acteristics such as size
Appreciating this variability in air temperaturefor a given FST this study estimated minimum airtemperature thresholds for potential damage Thiswas achieved by taking the 10th percentile of airtemperatures at two FST thresholds that representbrowning and necrosis By taking this approach itwas assumed that other climate effects and fruitcharacteristics were combining to cause damageat these lower air temperatures Therefore the airtemperature thresholds determined were conser-vatively low and are indicative of when damagemay begin to occur on some fruit primarily themore vulnerable fruit The air temperature thresh-olds calculated should not be regarded as deter-ministic or a reflection of damage for a particularfruit or for all fruit in the orchard Rather the
Table 3 Percentage of fruit affected by sun damage fornon-netted and netted fruit harvest from 10 trees each
Browning () Necrosis () Total ()
Non-netted 130 30 160Netted 81 01 81
Table 2 Summary of total number of days for whichdaily maximum temperature exceeded each air temper-ature threshold for potential damage in January 2013 atShepparton
DamageAir temperaturethreshold (degC)
Number of days inJanuary 2013
Browning(non-netted)
341 13
Browning(netted)
379 7
Necrosis(non-netted)
387 5
Sun damage risk of Royal Gala apple in fruit-growing districts in Australia 227
Dow
nloa
ded
by [
The
Uni
vers
ity O
f M
elbo
urne
Lib
rari
es]
at 1
845
03
Febr
uary
201
6
thresholds are an indication of minimum airtemperatures at which sun damage may begin todevelop
Analyses of theminimumair temperature thresh‐olds were expanded across southern Australia for
1911ndash2013 to demonstrate the flexibility of theapproach Spatial patterns in the number of daysof potential damage follow a north-south gradientand vary with topography These analyses provideinsight into relative sun damage risk in opening of
110 120 130 140 150 160
minus50
minus45
minus40
minus35
minus30
minus25
minus20
10th Percentile
Longitude
Latit
ude
Browning minus Non-netted
0 5 10 15 20 25 30
110 120 130 140 150 160minus
50minus
45minus
40minus
35minus
30minus
25minus
20
50th Percentile
110 120 130 140 150 160
minus50
minus45
minus40
minus35
minus30
minus25
minus20
90th Percentile
110 120 130 140 150 160
minus50
minus45
minus40
minus35
minus30
minus25
minus20
Longitude
Latit
ude
0 5 10 15 20 25 30
110 120 130 140 150 160
minus50
minus45
minus40
minus35
minus30
minus25
minus20
Browning minus Netted
110 120 130 140 150 160
minus50
minus45
minus40
minus35
minus30
minus25
minus20
110 120 130 140 150 160
minus50
minus45
minus40
minus35
minus30
minus25
minus20
Longitude
Latit
ude
0 5 10 15 20 25 30
110 120 130 140 150 160
minus50
minus45
minus40
minus35
minus30
minus25
minus20
Necrosis minus Non-netted
110 120 130 140 150 160
minus50
minus45
minus40
minus35
minus30
minus25
minus20
Figure 4 Number of potential sun damage days in January for browning non-netted browning netted and necrosisnon-netted air temperature thresholds The 10th 50th and 90th percentiles of the data (1911ndash2013) are displayed leftto right The colour-bar legend is measured in number of days
228 R Darbyshire et al
Dow
nloa
ded
by [
The
Uni
vers
ity O
f M
elbo
urne
Lib
rari
es]
at 1
845
03
Febr
uary
201
6
new areas for production or shifts in varietal mixesat established growing regions
For selected fruit-growing regions it was foundthat some sites are more exposed to potential sundamage risk than others This was expected withcooler regions (Spreyton Huonville Applethorpe)illustrating very little risk For warmer regions(Donnybrook Shepparton Young) greater poten-tial riskmdashthat is total number of potential damagedaysmdashwas accompanied by substantial inter-annual variability Considering potential browningfor non-netted fruit at Young there is a 1 in 10 yearchance that 16 days or more in January will be
conducive to browning (90th percentile) equallythere is a 1 in 10 year chance of 1 day or less inJanuary being conducive to browning (10th per-centile) Managing this variability in potential riskis important to maintain yield and quality
These broader analyses both historically andspatially illustrate the flexibility for investigativeanalyses of sun damage using the air temperaturethresholds determined to estimate conditions thatare conducive to damage This approach over-comes the data access limitations of more detailedmodels that require greater data inputs (Thorpe1974 Evans 2004 Schrader 2014) The methods
Table 4 Distribution of potential damage days in January for sites in Australiarsquos growing regions for 10th 50th and90th percentiles of the data
Browning non-netted Browning netted Necrosis non-netted
Site 10th 50th 90th 10th 50th 90th 10th 50th 90th
Spreyton 0 0 0 0 0 0 0 0 0Huonville 0 0 1 0 0 0 0 0 0Applethorpe 0 0 2 0 0 0 0 0 0Batlow 0 0 4 0 0 0 0 0 0Yarra Valley 0 2 5 0 0 1 0 0 1Manjimup 0 3 5 0 0 2 0 0 1Lenswood 0 3 6 0 0 2 0 0 1Young 1 7 16 0 1 5 0 05 4Shepparton 2 6 12 0 1 5 0 1 4Donnybrook 3 7 11 0 1 3 0 05 2
Figure 5 Reduction in the number of potential browning damage days for January across 1911ndash2013 due to nettingThe colour-bar legend is measured in number of days
Sun damage risk of Royal Gala apple in fruit-growing districts in Australia 229
Dow
nloa
ded
by [
The
Uni
vers
ity O
f M
elbo
urne
Lib
rari
es]
at 1
845
03
Febr
uary
201
6
used here prioritised generalisation rather thanspecificity As such only general remarks aboutchanges in potential conditions for damage can bemade To interpret damage to individual fruit useof multivariate models is still required
These thresholds could be used to consider therisk of sunburn damage under future climates asonly maximum temperatures are required to estim-ate conditions that may lead to damage Assess-ments considering netted and non-netted thresholdscould be conducted to highlight any increasingprotection offered by shade netting Note this wouldonly be possible for browning damage as this studywas unable to determine a necrosis air temperaturethreshold as fruit did not reach the required FST fordamage Finally the air temperature thresholds canbe used by growers as a guide for when to useoverhead sprinklers for evaporative cooling inefforts to minimise potential damage
These results have illustrated the benefit ofshade netting in lowering sun damage risk (Table 5and Fig 5) Previous investigations have shownthat shade nets are effective in decreasing sundamage by reducing incident solar radiation (Igle-sias amp Alegre 2006 Gindaba amp Wand 2008) Inthis study a reduction in the number of days ofpotential browning was quantified across Australia(Fig 5) Using Young as an example a decrease of1ndash11 days of potential damage (for 80 of the
historical data) was found reducing the number ofpotential damage days by 68ndash100
This benefit of netting needs to be balancedagainst other possible drawbacks For instance DoAmarante et al (2011) found a reduction in redcoloration and lower firmness values of Royal Galaunder netting Changes to management practicessuch as use of reflective mulch would assist incombating some of these implications An import-ant limitation of installing netting is the expense InAustralia the initial capital cost of erecting nettinghas been estimated at AU$40000 per hectare(Lolicato 2011) For sites with minimal reductionin sun damage with the installation of netting(Applethorpe Batlow) investing in netting maynot be practical although the other benefits thatnetting provides such as a reduction in hail and birddamage should be considered in decision-makingprocesses
Assessments of sun damage rates on the experi-mental trees (Table 3) provide support for the airtemperature thresholds Using the estimated airtemperature thresholds it was determined that forJanuary 2013 there were 13 and 7 days (Table 2)with potential for damage for non-netted and nettedfruit respectively Therefore the potential for dam-age under the nets was predicted to be 46 lowerthan for non-netted fruit This was broadly sup-ported in the damage assessments with a 50reduction found in browning of fruit under netsOther effects may have influenced the observeddamage rates including temperatures experiencedduring December which were not included in theanalysis Additionally the total predicted potentialdamage days may have identified individual days asdamage days that did not lead to any observed fruitdamage As damage assessments occurred at har-vest this cannot be determined
In interpreting these results appreciation ofthe assumptions in the methodology is neededFST thresholds used in this study were determinedin North America (Schrader et al 2003b) Higherultraviolet radiation conditions are experienced inAustralia compared with the northern hemispheredue to lower ozone protection For this reason thetransferability of FST thresholds between hemi-spheres was questioned by Racsko amp Schrader
Table 5 Difference in total number of potentialbrowning days between open and netted fruit Bracketedis the percentage reduction from open values
Site10th
percentile50th
percentile90th
percentile
Spreyton 0 (NA) 0 (NA) 0 (NA)Huonville 0 (NA) 0 (NA) 1 (100)Applethorpe 0 (NA) 0 (NA) 1 (53)Batlow 0 (NA) 0 (NA) 4 (100)Yarra Valley 0 (NA) 2 (100) 4 (80)Manjimup 0 (NA) 2 (67) 4 (80)Lenswood 0 (NA) 2 (67) 5 (83)Young 1 (100) 5 (71) 11 (68)Shepparton 2 (85) 4 (67) 7 (60)Donnybrook 2 (67) 5 (71) 9 (82)
NA indicates no browning events for fruit in the open
230 R Darbyshire et al
Dow
nloa
ded
by [
The
Uni
vers
ity O
f M
elbo
urne
Lib
rari
es]
at 1
845
03
Febr
uary
201
6
(2012) Further research following Schrader et al(2003b) is required to assess if there are differ-ences in FST thresholds between the northern andsouthern hemispheres
In order to extend the results of this study theair temperature threshold values found for Shep-parton were expanded across southern AustraliaOther sites may have weather conditions thatcombine differently than those at Shepparton todetermine FST The conservative approach takenhere should act to minimise potential underesti-mates of damage rates with field observationsneeded for verification of transferability of theseair thresholds
Conclusion
This study determined theminimum air temperaturethresholds that represent potential for sun damagefor Royal Gala apple in non-netted (browning andnecrosis) and netted (browning) blocks Resultswere constructed using a conservative approachindicating when damagemay start to occur for somefruit in the orchard Application of the approachspatially and temporally was demonstrated provid-ing historical context for sunburn damage riskand assessment of relative risk between locationsSuch an analysis has not been previously possibledue to data limitations of more detailed sundamage models The protection offered by nettingwas interpreted and the relative benefits of installa-tion demonstrated Using the methods in this studyto determine air temperature thresholds furtherresearch is possible including expansion to othervarieties assessments of climate change impactsand the use of shade netting as an adaptationstrategy
Acknowledgements
We thank Joerg Klein (Geoffrey Thompson Orchards PtyLtd) for orchard access to conduct this experiment Thisstudy was supported by funding from the VictorianDepartment of Economic Development Jobs Transportand Resources Horticulture Innovation Australia Ltdand the Australian Government Department of Agricul-ture using the apple and pear industry levy and matchedfunds from the Australian government
Disclosure statementNo potential conflict of interest was reported by theauthors
References
Alexander LV Arblaster JM 2009 Assessing trends inobserved and modelled climate extremes overAustralia in relation to future projections Interna-tional Journal of Climatology 29 417ndash435
Alexander LV Hope P Collins D Trewin B Lynch ANicholls N 2007 Trends in Australiarsquos climatemeans and extremes a global context AustralianMeteorological Magazine 56 1ndash18
CSIRO 2007 Climate change in AustraliamdashTechnicalReport 2007 Melbourne CSIRO and Bureau ofMeteorology 148 p
Do Amarante CVT Steffens CA Argenta LC 2011Yield and fruit quality of lsquoGalarsquo and lsquoFujirsquo appletrees protected by white anti-hail net ScientiaHorticulturae 129 79ndash85
Evans RG 2004 Energy balance of apples underevaporative cooling Transactions of the AmericanSociety of Agricultural Engineers 47 1029ndash1037
Gindaba J Wand SJE 2008 Comparison of climateameliorating measures to control sunburn on lsquoFujirsquoapples Acta Horticulturae 772 59ndash64
Iglesias I Alegre S 2006 The effect of anti-hail nets onfruit protection radiation temperature quality andprofitability of lsquoMondial Galarsquo apples Journal ofApplied Horticulture 8 91ndash100
Jones D Wang W Fawcett R 2009 High-qualityspatial climate data-sets for Australia AustralianMeteorological and Oceanographic Journal 58233ndash248
Lolicato S 2011 Sun protection for fruit a practical man‐ual for preventing sunburn on fruitmdash2011 VictoriaDepartment of Primary Industries 43 p
Racsko J Schrader LE 2012 Sunburn of apple fruithistorical background recent advances and futureperspectives Critical Reviews in Plant Sciences31 455ndash504
Schrader L 2014 Interactive sunburn model http horttfrecwsuedupagesSunburn (accessed 6 October2014)
Schrader L Sun J Felicetti D Seo J Jedlow L Zhang J2003a Stress-induced disorders effects on applefruit quality Proceedings of the Washington TreeFruit Postharvest Conference Wenatchee WAPp 1ndash7
Schrader L Zhang J Duplaga W 2001 Two types ofsunburn in apple caused by high fruit surface (Peel)temperature Plant Health Progress doi101094PHP-2001-1004-01-RS
Sun damage risk of Royal Gala apple in fruit-growing districts in Australia 231
Dow
nloa
ded
by [
The
Uni
vers
ity O
f M
elbo
urne
Lib
rari
es]
at 1
845
03
Febr
uary
201
6
Schrader L Zhang JG Sun JS 2003b Environmentalstresses that cause sunburn of apple Acta Horti-culturae 618 397ndash405
Thomson G McCaskill M Goodwin I Kearney GLolicato S 2014 Potential impacts of rising global
temperatures on Australiarsquos pome fruit industry andadaptation strategies New Zealand Journal of Cropand Horticultural Science 42 21ndash30
Thorpe MR 1974 Radiant heating of apples Journal ofApplied Ecology 11 755
232 R Darbyshire et al
Dow
nloa
ded
by [
The
Uni
vers
ity O
f M
elbo
urne
Lib
rari
es]
at 1
845
03
Febr
uary
201
6
Agricultural and Forest Meteorology 226ndash227 (2016) 148ndash160
Contents lists available at ScienceDirect
Agricultural and Forest Meteorology
j o ur na l ho me pag e wwwelsev ier com locate agr formet
How hail netting reduces apple fruit surface temperature Amicroclimate and modelling study
Malcolm R McCaskill alowast Lexie McClymontb Ian Goodwinb Steve GreencDebra L Partingtona
a Department of Economic Development Jobs Transport and Resources Hamilton Centre Private Bag 105 Hamilton Victoria 3300 Australiab Department of Economic Development Jobs Transport and Resources Tatura Centre Private Bag 1 Tatura Victoria 3616 Australiac Plant and Food Research Tennent Drive Palmeston North New Zealand
a r t i c l e i n f o
Article historyReceived 6 October 2015Received in revised form 6 April 2016Accepted 22 May 2016
KeywordsSun damageSunburnUV-BRoyal galaNettingFruit temperature
a b s t r a c t
High fruit temperatures compromise fruit quality and cause production losses in the apple industry Insouth-eastern Australia orchardists have begun investing in netting because of empirical evidence thatit reduces these losses but the magnitude of its effect and mechanisms responsible have not yet beenquantified Models of fruit temperature based on meteorological conditions could inform the design ofnetting structures and improve tactical management to reduce sun damage through treatments such asprotective sprays and the use of overhead irrigation to cool fruit The objectives of this study were firstlyto measure the effect of netting on fruit surface temperature and secondly to test the thermodynamicSmart-Sinclair model The study was conducted near Shepparton Victoria in an orchard where therewere adjacent netted and non-netted sections During late afternoon when sun damage normally occursnetting was able to reduce the median fruit surface temperature by 15ndash20 C but there was a greaterreduction in maximum fruit surface temperature of 40 C The model required calibration to accountfor turbulence in the transfer of heat from fruit to the surrounding air The optimised model was ableto predict fruit surface temperature with a root mean square error of 2ndash4 C The mechanism for thereduction in fruit surface temperature was by reducing the intensity of the solar beam in the late afternoonby interception and scattering which more than offset the potential fruit heating effect of netting thatoccurs through a reduction in internal orchard wind speed
Crown Copyright copy 2016 Published by Elsevier BV All rights reserved
1 Introduction
Fruit exposed to high temperatures while growing on the treesuffers reduced quality particularly in apples (Malus domestica(L)) Reports from South Africa USA Australia and New Zealandsuggest that pack-house culls of 10 could be expected in typicalseasons (Bergh et al 1980 Schrader et al 2004 Wuumlnsche et al2001) but losses can be much higher as these estimates do notinclude severely damaged fruit that is not picked In Australia applegrowers estimate typical losses to vary from 6 to 30 depend-ing on season and fruit variety (Lolicato 2011) Following someyears of high losses orchardists have begun investing in netting
lowast Corresponding authorE-mail addresses malcolmmccaskillecodevvicgovau
(MR McCaskill) lexiemcclymontecodevvicgovau (L McClymont)iangoodwinecodevvicgovau (I Goodwin) stevegreenplantandfoodconz(S Green) debrapartingtonecodevvicgovau (DL Partington)
as a risk reduction strategy because of empirical evidence that itreduces these losses but the magnitude of its effect and mecha-nisms responsible have not yet been quantified
Schrader et al (2003) identified fruit surface temperaturethresholds at which two types of damage occurs At a threshold ofbetween 46 and 49 C sunburn browning occurs which consists ofdiscolouration of the sun-exposed peel that reduces the saleabilityand storage life of the fruit The threshold is cultivar-dependentand requires a combination of both high temperatures and solarradiation Protecting fruit from exposure to ultraviolet radiationgreatly reduces the occurrence of sunburn browning (Schrader2011) At a threshold of 52 C sunburn necrosis occurs in whichepidermal and subepidermal cells die leaving a necrotic spot on thesun-exposed side of the fruit This type of damage can occur in theabsence of solar radiation if the temperature threshold is reachedFruit surface temperatures are dependent not only on the air tem-perature but also solar radiation that heats the sun-exposed fruitsurface and wind that removes heat from the surface Under condi-tions of high solar radiation and low wind speeds the sun-exposed
httpdxdoiorg101016jagrformet2016050170168-1923Crown Copyright copy 2016 Published by Elsevier BV All rights reserved
MR McCaskill et al Agricultural and Forest Meteorology 226ndash227 (2016) 148ndash160 149
surface of fruit can be up to 15 C warmer than air temperature(Schrader et al 2003)
Several thermodynamic models have been developed to cal-culate temperatures in spherical fruit such as apples Internallythese models use similar parameters and equations Thorpe (1974)described a thermodynamic model of apple surface temperaturewhich included the effects of solar radiation wind and the conduc-tion of heat to the shaded side of the fruit This model developedfurther by Smart and Sinclair (1976) who presented a series ofequations that solve for the temperature of the most sun-exposedsurface of spherical fruit known as the ldquohot-spotrdquo Since exces-sive hot-spot temperatures are sufficient to downgrade the entireapple this is the most useful parameter to model Later Evans(2004) described a model that calculated the surface temperature ofapples under evaporative cooling Sauderau et al (2007) presenteda 3-dimensional model that calculated temperatures at all parts ofellipsoid fruit Cola et al (2009) described a model of grape tem-perature which was validated at several sites in Italy while Li et al(2014) built on previous models and tested it on apples in Washing-ton State USA Apart from Cola et al (2009) and Li et al (2014) thesemodels have only had limited field validation and none have beentested under netting Potential uses of a validated model includeboth tactical and strategic management Tactically fruit surfacetemperature could be calculated from numerical weather forecastsso protective sprays can be applied prior to heat events or evapora-tive cooling used when fruit surface temperature reaches a damagethreshold Strategically the value of investment in infrastructuresuch as netting or evaporative cooling systems could be investi-gated with consideration of future climate change scenarios
The objectives of this study were firstly to measure the effectof hail netting on fruit surface temperature and orchard microcli-mate secondly to test the thermodynamic Smart-Sinclair modeland thirdly to quantify the mechanisms by which netting reducessun damage
2 Material and methods
Briefly fruit surface temperatures were measured in adjacentnetted and non-netted areas of a commercial orchard Simulatedfruit surface temperature was calculated using a modified ver-sion of the thermodynamic model developed by Smart and Sinclair(1976) using either microclimate measurements taken within theorchard or surrogates derived from standard weather data mea-sured external to the orchard Table 1 summarises parameters usedin the model and symbols used in this paper
21 Field measurements
Fruit surface temperatures of Royal Gala apples were moni-tored at two sites (ldquonettedrdquo and ldquonon-nettedrdquo) within a commercialorchard located north of Shepparton Australia The majority of theorchard was covered by permanent hail netting except for five rowsin the eastern side The netting (Grey Quad 14 NetPro Pty Ltd Stan-thorpe Qld Australia) had a 10 shade rating and was installed 6 mabove the ground with open sides We refer to the product as ldquohailnettingrdquo because its primary purpose is to protect from hail andto distinguish it from shade-cloth that has shade ratings of 16ndash80(NetPro 2010) Fruit surface temperatures were monitored from 8January 2013 until the first fruit were harvested on 24 January 2013At each site 60 fruit were selected from 4 trees 20 fruit were inthe upper canopy 20 in the middle and 20 in the lower canopyMonitored fruit were selected from fruit on the western sides oftrees that would be exposed to direct radiation in the afternoonin the expectation that maximum daily fruit surface temperaturesnormally occur in the mid-afternoon between 1430 and 1645 h
(Schrader et al 2003) Copper-constantan thermocouples (Type TTranzflo NZ Ltd Palmerston North New Zealand) were insertedunder the fruit skin on the sun-exposed face Data were logged byfour data loggers (CR1000 Campbell Scientific Logan Utah USA)at each site at 1 min intervals The target of 60 monitored fruit wassometimes not achieved because of datalogger difficulties somesensors becoming dislodged from the fruit and because two log-gers were not installed until 15 January On the 2 hottest days (forwhich detailed data are reported later in the paper) 44 fruit weremonitored under netting and 38 in the non-netted orchard on 11January while the equivalent numbers were 59 and 58 respec-tively on 17 January The diameters of the monitored fruit wererecorded on 11 16 and 23 January 2013 Fruit were harvestedcounted and weighted between 24 January and 4 February 2013from 10 trees each in the netted and non-netted sites includingthe 4 trees logged for temperature Fruit harvested from the 4 treeslogged for temperature were visually assessed for sunburn damageDamage was classified as (i) minor sunburn browning (ii) majorsunburn browning (iii) necrosis or (iv) photo-oxidative sunburn(Racsko and Schrader 2012)
The microclimate was monitored at the netted and non-nettedsites and data logged (DataTaker DT80M Thermo Fisher ScientificInc Yokohama Japan) at 1 min intervals Air temperature (Tair C)and humidity (HMP155 Vaisala Oyj Vantaa Finland) were mea-sured at 15 m height with the sensor mounted in a cylindricalwhite aluminium screen Wind speed (v ms) was measured bycup anemometers (PA2 Wittich and Visser Rijswijk Netherlands)in the lower middle and upper canopy at heights of 1 2 and3 m Diffuse and total radiation (Rdf and Rs Wm2) and ultraviolet-B (UV-B Wm2 280ndash315 nm) were monitored above the canopyat 3 m height (SPN1 Delta T Devices Cambridge UK SKU430Skye Instruments Llandrindod Wales) Adjacent to the orchard theexternal environment was logged (6004C-21 STARLOG UnidataOrsquoConnor Australia) at 10 min intervals Humidity and Tair (HMP45A-T Vaisala Oyj Vantaa Finland) were measured at 15 m heightwith the sensor mounted in a cylindrical white aluminium screenA cup anemometer (Wind sensor compact Thies Clima GottingenGermany) was used to measure v at 2 m height Data from the exter-nal weather station were only available 8ndash29 January whereas datafrom the orchard weather stations were available 1ndash31 JanuaryPotential evapotranspiration (ETo mm) was calculated on a 10 mintimestep from weather data measured in the netted and non-nettedorchards by the FAO56 equations of Allen et al (1998)
At both the netted and non-netted sites trees were irrigatedby microjet sprinklers spaced midway between trees and approxi-mately 03 m above the soil surface Trees were 15 m apart trainedon a central leader system in rows 48 m apart and rows wereoriented NNW-SSE (345) Tree age variety rootstock and man-agement did not differ between the netted and non-netted siteswith the exception of increased irrigation flow rates in the non-netted area All management activities (irrigation fertilisation andweed and pest control) were undertaken by staff of the commercialorchard
22 Fruit temperature modelling
Smart and Sinclair (1976) proposed the following algebraic solu-tion to calculate the instantaneous temperature increment aboveTair on the sun-exposed surface of the fruit (Tmax C) as
Tmax = I0 (1 minus ) (ks + 4hr)(rh + ks) 4h
(1)
where I0 is incident solar radiation received by a fruit surface per-pendicular to the solar beam (Wm2) the reflectance of the fruitsurface (albedo) ks the thermal conductivity of the fruit (W(m C))h the heat transfer coefficient from the fruit surface to the atmo-
150 MR McCaskill et al Agricultural and Forest Meteorology 226ndash227 (2016) 148ndash160
Table 1Symbols used in this paper and source of the values used
Symbol Units Explanation Valuessource
Unitless fraction Reflectance of the fruit surface 04 Merzlyak et al (2003)d Days Day number (1 Jan = 1) Calculateddr Relative units Relative inverse distance between the earth and sun
(range 0967ndash1033)Calculated according to equation 23 of Allenet al (1998)
D m Fruit diameter Measuredı m Thickness of the boundary layer of still air at the fruit
surfaceEquation 5 of this paper based on Nobel (1975)
ETo mm Potential evapotranspiration Calculated according to Equation 6 of Allenet al (1998)
f Unitless factor Calibration factor FittedGsc Wm2 Solar constant 1367 Wm2 Allen et al (1998)h W(m2 C) Heat transfer coefficient Equation 5b of Smart and Sinclair (1976)I0 Wm2 Solar radiation received on a fruit surface normal to
the solar beamEquation 2 of this paper based on Smart andSinclair (1976)
ka W(m C) Thermal conductivity of air 255 W(m C) Smart and Sinclair (1976)ks W(m C) Thermal conductivity of the fruit Equation 9 of Smart and Sinclair (1976)r m Fruit radius MeasuredRa Wm2 Extraterrestrial solar radiation on a plane horizontal to
the earthrsquos surfaceCalculated by equation 28 of Allen et al (1998)
Rs Wm2 Total solar radiation measured on a plane horizontal tothe earthrsquos surface
Measured
Rdf Wm2 Indirect solar radiation measured on a plane horizontalto the earthrsquos surface
Measured
RUVB Wm2 Solar radiation in the ultraviolet-B band 280ndash315 nm MeasuredTair
C Air temperature MeasuredTfrmx
C Temperature of the hottest face of sun-exposed fruit inthe orchard
Measured
TmaxC Difference between fruit surface temperature and air
temperatureCalculated from measurements and equation 1of Smart and Sinclair (1976)
v ms Wind speed Measuredzd degrees Zenith angle of the sun (degrees from vertical) Calculated according to Jacobson (2005)zr radians Zenith angle of the sun (radians from vertical) Calculated according to Jacobson (2005)
sphere (W(m2 C)) and r the radius of the fruit (m) In our studyI0 was calculated as
Io = GscdrRs minus Rdf
Ra+ Rdf 2 (2)
where Gsc (Wm2) is the solar constant dr the inverse relative dis-tance between the earth and the sun Rs total radiation measuredabove the canopy on a horizontal plane Ra (Wm2) extra-terrestrialradiation on a horizontal plane and Rdf diffuse radiation measuredon a horizontal plane above the canopy In Eq (2) it is assumedthat the sunlit fruit face was exposed to only half the Rdf measuredon a horizontal plane (Smart and Sinclair 1976) The terms Gsc dr
and Ra were calculated according to Allen et al (1998) Reflectance(˛) was set at 04 based on data from Merzlyak et al (2003) whoreported a range from 035 for dark red fruit to 045 for pale fruitThermal conductivity of fruit (ks) is related to apple temperatureand was calculated as
ks = 0297 + 00024Tfrmx (3)
based on Lisowa et al (2002) where Tfrmx is the temperature ofthe hottest face of sun-exposed fruit in the orchard calculated in theprevious iteration (see Eq (7) below) The heat transfer coefficienth was calculated as
h = ka
ı+ 2kaD (4)
where ka is the thermal conductivity of the air 00257 W(m2 C)ı the thickness of the boundary layer of still air at the surface ofthe hot-spot of the fruit (m) and D the fruit diameter (m) ı wasestimated from v and D by an equation based on Nobel (1975)
ı = f
(028
radicD
v+ 25
v
)(5)
where f is a calibration factor Values of v were set to a minimumvalue of 05 ms to avoid division by zero D was calculated frommeasurements of fruit diameter interpolated by a linear regressionrelationship between measurement dates
D = (5784 + 02133d)100
(6)
where d is the day number (1 January = 1) Preliminary runs ofthe model indicated that without a calibration factor ı was toohigh resulting in insufficient heat transfer from the fruit surfaceto the surrounding air and simulated fruit surface temperatureswere much higher than observed The model was calibrated usinga range of values of f from 01 to 10 in increments of 005 and cal-culating the root mean square error (RMSE) of differences betweencalculated fruit surface temperatures and the maximum fruit sur-face temperature in each 10 min period The optimum value of fwas that with the lowest RMSE A similar approach was used byCola et al (2009) in calibrating aerodynamic roughness to mea-sured fruit temperature in grapevines from wind speeds measuredat a weather station external to the vineyard Separate values of fwere sought for the netted and non-netted sites with v measuredeither at 3 m height within each orchard or at the weather stationexternal to the orchard The first half of the data set from 9 to 15January 2013 was used for model calibration and the remainingdata was used for validation Since the monitored fruit were onlyexposed to the afternoon sun only data from 1400 to 1700 h wereused for calibration and validation
The temperature of the hottest face of sun-exposed fruit in theorchard (Tfrmx C) was then calculated as
Tfrmx = Tmax + Tair (7)
where Tair (C) is the measured air temperature and Tmax thesimulated difference between air temperature and fruit surfacetemperature Calculations were performed on a 10 min timestep
MR McCaskill et al Agricultural and Forest Meteorology 226ndash227 (2016) 148ndash160 151
Table 2Harvested yield fruit weight and sunburn damage from the netted and non-nettedsites in the orchard and the statistical significance of differences
Netted Non-netted Significance
Total fruit yield (tha) 346 373 0564Fruit weight (gfruit) 153 125 lt0001Minor sunburn browning ( by weight) 77 104 0014Major sunburn browning ( by weight) 04 26 0007Necrosis ( by weight) 01 30 0003Photo-oxidative sunburn ( by weight) 02 07 0135Total damage ( by weight) 83 167 0002Yield of undamaged fruit (tha) 317 311 0282
but final output was calculated as a moving average of the previous30 min to compensate for the lack of thermal mass in the equations
23 Supplementary site
To test its structure and calibration modelled Tfrmx was com-pared with measurements taken at a supplementary site east ofShepparton Measurements were made in a commercial Royal Galaorchard without netting in which trees were planted at 25 m spac-ing in rows 50 m apart and irrigated at the tree base by microjetsprinklers This site was part of a larger study of evaporative cooling(Green et al 2011) and data reported here are for 3 apples withoutcooling on the north-west side near the top of the canopy whereprotective foliage had been removed Copper-constantan thermo-couples were inserted beneath the north-west facing surface ofsun-exposed apples on 27 January 2011 and temperatures mon-itored until harvest on 10 February Temperatures were measuredat 10-s intervals and logged (CR1000 Campbell Scientific LoganUtah USA) at a 1-min frequency Fruit diameter was measuredon 25 January and 7 February In a nearby clearing surrounded byorchards an automatic weather station recorded air temperaturesolar radiation and wind speed at a 2 m height at a 15-min fre-quency Solar radiation was measured at 2 m height using a siliconphotodiode pyranometer (SK01D Carter-Scott Design BrunswickAustralia) PAR was measured at 2 m height using a silicon photo-diode quantum sensor (PAR sensor Tranzflow Palmerston NorthNew Zealand) Air temperature and humidity were measured ata 15 m height (HMP 45A-T Vaisala Vantaa Finland) mountedin a cylindrical white aluminium screen Wind speed was mea-sured using a 3-cup anemometer at 2-m height (AN2 MonitorSensors Caboolture Australia) Measurements were taken every30 s and the average calculated and stored at 15-min intervals in adata logger (DT500 Datataker Scoresby Australia) Supplementarywind measurements were also taken from the Irrigateway network(httpawsdataitcsiroau8000idstationTATR) These measure-ments were taken at a 2 m height on an exposed site at the TaturaResearch Station operated by the Department of Economic Devel-opment Jobs Transport and Resources
24 Statistical analysis
Fruit yield and sunburn damage data from each tree were com-pared by one-way analysis of variance Residuals were checked fornormality and homogeneity of variance No transformations wererequired on any of the variables Solar radiation observations inthe netted orchard were compared with the non-netted orchard bymeans and descriptive linear regression with a focus on the after-noon (1400ndash1700 h) when the risk of sun damage is greatest Datafor Tair relative humidity and v from the netted and non-nettedorchards were compared with the weather station external to theorchard using a combined linear regression with the site (netted ornon-netted) as a factor This enabled the orchard microclimate tobe estimated from weather data external to the orchard
Since the model requires some non-standard weather dataparameters relationships were sought to predict these fromstandard parameters Prediction equations of these non-standardparameters ndash Rdf in the non-netted orchard and both Rdf andRs under netting ndash were sought by linear regression from 10 minweather data collected between 1 and 15 January 2013 using rela-tionships of the form
Rdf
Rs= a + b
Rs
Ra+ c
1AM
+ d(
Rs
Ra
) (1
AM
)
Rs
Ragt e (8)
where the coefficients a b c d and e are derived from the regres-sion and AM the air mass number to account for solar angle effectsThe RsRa component of this function was based on Spitters et al(1986) who recommended a series of split line relationships to esti-mate Rdf Rs from RsRa According to these relationships underheavy cloud (low RsRa) the proportion of total radiation that isdiffuse (Rdf Rs) is not influenced by RsRa up to a break point afterwhich there is a linear relationship with RsRa The term AM is usedin astronomy and the solar power industry to describe the pathlength of the solar beam in the atmosphere relative to a direct ver-tical path and was calculated by an empirical function of Kastenand Young (1989)
AM = 1(cos zr + 0050572(607995 + 90 minus zd)minus16364 (9)
where zr and zd are the zenith angle of the sun in radians anddegrees respectively The value of AM ranges from close to 1 whenthe sun is overhead to over 10 at dawn or dusk The inverse ofAM was used in the regression analyses because the attenuationof the solar beam through scattering and absorption would beexpected to follow an inverse relationship with path length Sim-ilar effects would be expected as the solar beam passes throughnetting To determine parameters the Genstat split line regres-sion procedure was first used to estimate e independent of AMThis set a break point for the split line relationship and belowthis threshold the break point value of Rdf Rs was used Valuesof RsRain excess of e were then selected to determine the otherparameters using generalised linear regression A similar approachwas used to estimate netted RsRa from non-netted RsRa but nobreak point was required Since the intent was to develop esti-mates at times of risk of sun damage input values were constrainedto times when Ra exceeded 380 Wm2 to avoid refractive effectsthat occur close to dawn and dusk when the sun is near the hori-zon This constraint limited data to 0640ndash1800 h in mid-JanuaryAnother required constraint was to remove 10 min periods whenRs exceeded clear-sky radiation which was assumed to be 08 RaThese periods occurred when Rs included radiation reflected fromclouds and could at times predict negative values of Rdf Statisticalanalyses were conducted using Genstat (14th Edition VSN Interna-tional Hemel Hempstead UK) Model predictions were comparedwith measurements by the root mean square error (RMSE)
25 Sensitivity analysis
Sensitivity of the model to its inputs was tested by varying indi-vidual parameters by either the range reported in the literature orfor weather parameters the range measured in our study between1400 and 1700 h The range for was from 01 (Sauderau et al2007) to 06 (Evans 2004) ks from 028 to 054 W(m C) (Smartand Sinclair 1976 Donsi et al 1996 Lisowa et al 2002) v from 01to 34 ms Rs 60ndash1040 Wm2 Rdf 50ndash580 Wm2 and Tair 15ndash42 Cwhile D was varied from 0049 to 0080 m based on measurementsof individual fruit The parameters not varied were taken from thetime of maximal Tfrmx during the study which was from the non-netted orchard from 1610 to 1620 h on 17 January 2013
152 MR McCaskill et al Agricultural and Forest Meteorology 226ndash227 (2016) 148ndash160
3 Results
31 Sunburn damage and fruit yield
Fruit in the non-netted orchard had twice the rate of sunburndamage as that in the netted orchard (17 vs 8) (Table 2) The great-est differences were in the major sunburn browning and necrosiscategories Total fruit yield in the non-netted orchard was 8 higherthan with netting but the yield of undamaged fruit was 2 lowerThese differences in fruit yield were not statistically significantbecause of a relatively high coefficient of variation between indi-vidual trees of 29 Fruit harvested from the non-netted orchardwere smaller than those with netting (125 vs 153 g)
32 Fruit surface temperatures
Measured Tfrmx were up to 144 C higher than Tair with net-ting during the afternoon and up to 167 C without netting butat night the differences were small (Fig 1) The two days with thehighest Tfrmx were the 11th of January (a clear day) and the 17thof January (a partly cloudy day) As the days with the greatest riskof sun damage these were examined in greater detail The proba-bility distribution of the maximum temperature achieved in eachmonitored fruit for these days shows that with netting the mediantemperature was 15ndash23 C cooler with netting than without butthat the maximum temperature was 40 C cooler (Fig 2) On theclear day (11 January) 45 of non-netted fruit exceeded the thresh-old of 46 C at which sunburn browning occurs (Schrader 2011)compared with only 9 under netting However on the partlycloudy day (17 January) the proportions exceeding the thresholdwere much higher at 79 without netting and 32 with nettingMeasured Tfrmx on the clear day showed a broad peak in the lateafternoon whereas on the partly cloudy day there was a seriesof sharp peaks (Fig 3) These peaks coincided with short periodsof high solar radiation between clouds The upper quartile of fruitsurface temperature peaked late in the afternoon at 1600ndash1700 h
33 Netted vs non-netted microclimates
Microclimate differences between the netted and non-nettedorchards are addressed here first for the entire month of Januarythen in greater detail for the two days when the highest fruit sur-face temperatures were recorded Averaged across all afternoons inJanuary 2013 the netted orchard had 15 less total radiation thanthe non-netted orchard 32 lower UV-B and a 13 lower potentialevapotranspiration but 20 more diffuse radiation (Table 3) Forthe whole month of January 2013 potential evapotranspiration wasalso 13 lower under netting than without (159 vs 183 mmmonth)
Descriptive linear regressions of radiation parameters duringthe afternoon between the netted and non-netted orchards showeda high level of correlation with R2 values of between 0881 and0987 (Table 3) All slopes and intercepts were statistically signif-icant (P lt 0001) indicating that there were significant differencesin radiation parameters between the environments
Fig 1 Measured (blue) and simulated (red and orange) fruit surface tempera-ture of the hottest face of sun-exposed fruit (Tfrmx) and orchard air temperature(green) at (a) netted and (b) non-netted with simulated Tfrmx calculated from windspeeds measured external to the orchard Simulated temperatures are shown in redbetween 1400 and 1700 h and orange at other times Arrows show spikes in simu-lated values at times of low wind speed and high direct radiation before 1000 andafter 1700 h (For interpretation of the references to colour in this figure legend thereader is referred to the web version of this article)
In the afternoon v at the netted site was lower (22ndash24) at a 3 mmeasurement height but there were no significant differences inTair (Tables 4 and 5) At night the netted orchard was more humidthan the non-netted orchard and had lower v
Predictive relationships for Rdf and Rs under netting based on Eq(8) showed root mean square errors of between 17 and 71 Wm2
(Table 6) In each case all the slopes and intercepts were statisticallysignificant (P lt 0001) Using these relationships for a theoreticalclear day (defined as RsRa = 075) in mid-January netting reducedRs by 10 at 1230 h but by 20 at 1620 h Equivalent reductions inIo were 22 and 26 respectively
On the clear day Rs closely followed the pattern of Ra but onthe cloudy day the pattern was spikey with short periods whenRs was up to 13 greater than at the same time on the clear day
Table 3Summary of differences in afternoon radiation and ETo (1400 and 1700 h Eastern Australian Standard Time) between netted and non-netted environments 1ndash31 January 2013compared by their arithmetic mean and linear regression as y = a + bx where y is the parameter under netting a the intercept b the slope and x the parameter withoutnetting
Parameter Means Regression
Netted Non-netted Difference () Intercept Slope R2
Global radiation (Rs Wm2) 616 726 minus15 minus677 0941 0982Diffuse radiation (Rdf Wm2) 141 117 20 631 0666 0881Ultraviolet radiation-B (UV-B Wm2) 126 184 minus32 minus00734 0723 0997Reference evapotranspiration (ETo mmhr) 047 054 minus13 minus00046 0924 0987
MR McCaskill et al Agricultural and Forest Meteorology 226ndash227 (2016) 148ndash160 153
Fig 2 Cumulative probability distribution of the maximum fruit surface temperature measured in non-netted and netted sections of the orchard on (a) a clear day (11January 2013) and (b) a partly cloudy day (17 January 2013)
Fig 3 Fruit surface temperature (Tfr ) measured in the netted and non-netted sections of the orchard showing the maximum upper quartile median and minimum and thesimulated orchard maximum modelled from weather data according to Eq (7) for a clear day (11 January) and a partly cloudy day (17 January)
Table 4Summary of air temperature humidity and wind speed during afternoons (1400ndash1700 h Eastern Australian Standard Time) and nights (2000ndash0500 h) in the netted orchardnon-netted orchard and external environment 8ndash29 January 2013
Parameter Afternoon Night
Netted Non-netted External Netted Non-netted External
Air temperature (C) 317 322 301 171 173 179Relative humidity () 293 275 263 698 660 622Wind speed (ms)3 m 122 156 055 0842 m 080 074 266 030 023 1701 m 020 035 004 006
(Fig 4) On the clear day without netting about 10 of radiationwas in the diffuse form whereas under netting it was 17 Thepercentage of Rs transmitted through the net was similar on bothdays and ranged from 89 at midday to about 60 close to dawn ordusk Estimated Io reached a broad maximum around the middle ofthe day after which it declined more rapidly under netting than in
the non-netted orchard At a height of 3 m v was about 20 lowerunder netting but there was little difference in Tair (Fig 5) At bothsites there were low wind speeds in the evening and night On 17January these nearly calm conditions had started by 1725 h Differ-ences between the netted and non-netted environments close tothe time of maximum fruit surface temperature are summarised in
154 MR McCaskill et al Agricultural and Forest Meteorology 226ndash227 (2016) 148ndash160
Table 5Microclimate in the netted and non-netted sites expressed as a linear function of readings at the weather station external to the orchard where environment (netted ornon-netted) was a factor in the analysis Significance of differences between netted and non-netted in intercept or slope are shown as for P lt 0001 for P lt 001 forP lt 005 minus for P lt 01 ns for not significant
Afternoon (1400ndash1700 h) Night (2000ndash0500 h) All hours
Intercept Slope R2 Intercept Slope R2 Intercept Slope R2
Air temperature (C)Netted 109 0967 0987 minus024 0938 0962 minus133 1024 0978Non-netted 158 0968 minus124 1009 minus139 1047Difference 049 0001 minus101 0070 minus006 0022Significance of difference ndash ns ns
Relative humidity ()Netted 685 0953 0987 1050 0956 086 783 0983 0951Non-netted 482 0959 minus014 1075 344 1003Difference minus203 0005 minus1064 0119 minus439 0020Significance of difference ns
Wind speed (ms)Netted 3 m minus012 0477 0912 minus018 0468 0918 minus018 0476 0917Non-netted 3 m minus018 0627 minus016 0642 minus016 0633Difference minus005 0150 002 0174 002 0157Significance of difference ns ns ndash Netted 2 m minus024 0370 0824 minus018 0307 0832 minus021 0337 0800Non-netted 2 m minus002 0254 minus012 0220 minus012 0267Difference 023 minus0116 007 minus0088 009 minus0069Significance of difference Netted 1 m minus002 0072 0476 minus004 0049 0622 minus005 0069 0486Non-netted 1 m 008 0083 minus005 0069 minus005 0105Difference 011 0011 minus001 0019 000 0036Significance of difference ns ns
Table 6Predictive relationships calculated from the calibration period (1ndash15 January) based on Eq (8) to estimate global radiation under netting as a proportion of extraterrestrial(RsRa) diffuse radiation as a proportion of global (Rdf Rs) in netted and non-netted environments and the root mean square error (RMSE) and predictive error of therelationships in estimating Rs and Rdf between 0700 and 1800 h for the validation period (16ndash31 January 2013)
Parameter orcoefficient in Eq (7)
Global radiation as a proportion of extraterrestrial(RsRa)
Diffuse radiation as a proportion of global radiation(Rdf Rs)
Netted Netted Non-netted
Split line regressione 0396 0391Rdf Rs at breakpoint 0830 0855No of observations 1017 1017R2 0918 0932
Generalised linear modela 0049 0715 0506b 0546 minus0507 minus0391c minus0079 1088 1515d 0400 minus1684 minus217No of observations 1016 896 896R2 0982 0761 0754
Overall relationship (validation period)RMSE (Wm2) 171 506 712Predictive error (Wm2) 131 241 351
Table 7 On both days between 1610 and 1620 h netting reduced Ioby 26
34 Calibration of the model
Without calibration the model consistently over-predictedTfsmx by an average of 66 C but the calculated values were highlycorrelated with measurements (R2 = 087 data not shown) To cor-rect this over-prediction a calibration factor (f) was applied to v(wind speed) because the relationship between wind speed andheat transfer to the atmosphere was the least well-defined com-ponent of the model The model was first fitted to v measured at3 m height at each site within the orchard This achieved minimumRMSErsquos of 21 and 26 C (Fig 6a) for netted and non-netted orchardsrespectively Secondly the model was fitted to measurements of vmeasured at a height of 2 m external to the orchard which achievedslightly lower RMSErsquos (20 and 23 C respectively) and optimised
at the same calibration factor for both the netted and non-nettedorchards (Fig 6b) Since the second option fitted the data moreclosely and could be calculated from wind speeds from externalto the orchard which are more commonly measured than internalorchard wind speeds this option was used for most simulationsreported in this paper
Measured and simulated Tfrmx showed close agreement on mostdays during the afternoon between 1400 and 1700 h but before andafter these times there were short term spikes in simulated Tfrmx
that were not observed in the measured data (Fig 1) These spikesoccurred before 1000 h and after 1700 h during periods of low windspeed high direct solar radiation and a high angle of incidence ofthe sunrsquos rays (zd gt 36 from zenith before 1000 h and zd gt 76 after1700 h)
Simulated and measured Tfrmx were closely matched between1400 h and 1700 h when fruit were exposed to direct sunlight(Fig 3) However simulated temperatures exceeded measurements
MR McCaskill et al Agricultural and Forest Meteorology 226ndash227 (2016) 148ndash160 155
Fig 4 Solar radiation on a clear day (11 January 2013) and a cloudy day (17 January 2013) showing calculated extraterrestrial radiation (Ra) global radiation measured abovethe plant canopies of netted (Rsnet ) at netted and non-netted sites (Rsnnet ) and diffuse radiation (Rdfnet and Rdfnnet) (a b) Also shown is the percentage of global radiationrecorded above the plant canopy of the non-netted and netted orchards that was in the diffuse form (Rdf Rs) the percentage of global radiation that was transmitted throughthe net (RsnetRsnnet) (c d) and the estimated intensity of the solar energy received on a fruit surface perpendicular to the solar beam (I0) (e f)
in the morning and early evening when the measured fruit wereshaded
35 Model validation from standard weather data
Since in-orchard weather data are rarely available for long-termmodelling studies Tfrmx was also calculated for validation purposesfrom standard weather data using the coefficients in Tables 5 and 6to estimate Tair Rdf and Rs in the netted orchard The externalweather station was used for Tair and v but it was assumed thatglobal radiation measured above the canopy at the non-netted sitewas equivalent to that measured outside the orchard Using thesesurrogates there was only a small increase (02ndash06 C) in RMSE rel-ative to in-orchard weather data (Table 8) This applied to both thecalibration and validation periods
36 Supplementary site
The model was run using weather data from the supplemen-tary site and compared Tfrmx measured at this site between 1400and 1700 h (Fig 7a) (f = 045 optimised for the main site) Themodel tended to over-predict early in the data set followed by
under-prediction later and achieved an overall RMSE of 63 COver-prediction occurred on afternoons with low wind speed andunder-prediction on afternoons of high wind speed a relationshipthat accounted for 67 of variation (data not shown) Optimisingf to this data set reduced the RMSE to 57 C (f = 033) but therewas still a strong relationship between over-prediction or under-prediction and wind speed The closest fit between predicted andmeasured was achieved using wind speed data from Tatura whichachieved an RMSE of 38 C (f = 092) (Fig 7b)
37 Sensitivity analysis
The sensitivity analysis showed that among plant parametersTfrmx was most strongly affected by followed by much smallereffects of D and ks (Table 9) Among weather parameters Tfrmx wasmost affected by Tair followed by Rs v and Rdf The sensitivity analy-sis was also used to test the impact of the reduction in v associatedwith netting and potential offsets A 25 decrease in v increasedfruit surface temperatures by 22 C but this increase could be off-set by either a 16 reduction in total radiation or a 58 increasein the proportion of total radiation in the diffuse form (data notshown)
156 MR McCaskill et al Agricultural and Forest Meteorology 226ndash227 (2016) 148ndash160
Fig 5 Air temperature (a b) and wind speeds (c d) at the netted and non-netted sites and at a weather station external to the orchard on 11 and 17 January 2013
Table 7Summary of differences between the non-netted and netted environments and external to the orchard close to the time of maximum fruit surface temperature between1610 and 1620 on 11 and 17 January 2013 Values are the mean of 1 min readings
11 Jan (clear day) 17 Jan (cloudy day)
External Non-netted orchard Netted orchard Difference () External Non-netted orchard Netted orchard Difference ()
Extraterrestrial radiation Ra
(Wm2)883 883 883 861 861 861
Total measured solar radiationRs (Wm2)
679 572 minus16 769 652 minus15
Diffuse radiation Rdf (Wm2) 87 114 31 175 187 7Direct radiation (Wm2) 572 425 minus26 592 441 minus25Radiation perpendicular to the
sunlit face of fruit Io (Wm2)967 749 minus26 971 761 minus26
Diffuse radiation relative toglobal ()
13 20 56 23 29 26
Ultraviolet B radiation UV-B(Wm2)
146 100 minus31 158 104 minus34
Relative humidity () 10 13 15 10 14 14Wind speed at 3 m (ms) 16 11 minus28 12 13 13Wind speed at 2 m (ms) 238 09 07 minus17 291 07 09 37Wind speed at 1 m (ms) 06 03 minus56 04 02 minus39Fruit surface temperature (C) (C) (C)Simulated 496 472 minus24 516 488 minus28Measured maximum 520 467 minus53 531 479 minus52Measured upper quartile 463 447 minus17 485 460 minus26Measured median 450 437 minus13 465 444 minus22Measured lower quartile 425 418 minus07 450 427 minus23Measured minimum 399 393 minus06 415 401 minus14Air temperature (C) 387 387 384 minus03 40 407 400 minus07
4 Discussion
41 Fruit damage and yield
A higher fruit yield in the non-netted orchard was offset by amuch higher percentage of sunburn damage than in the netted
orchard (17 vs 8) leading to a 2 reduction in the yield of undam-aged fruit This difference in yield was not statistically significantand would require confirmation through studies with a larger sam-ple size The 2-fold difference in the percentage of fruit affected bysunburn was consistent with the difference in the percentage ofmonitored fruit that exceeded the sunburn browning threshold of
MR McCaskill et al Agricultural and Forest Meteorology 226ndash227 (2016) 148ndash160 157
Table 8Root mean square error (C) for fruit surface temperature calculated using the optimum value of the calibration factor (f ) for each data set for 3 combinations of weatherdata with and without netting for the calibration period (9ndash15 January) and validation period (16ndash29 January)
Source of weather data Data period
Total radiation Diffuse radiation Air temperature Wind speed f Calibration Validation
RMSE (C)Netted orchardin-orchard weather station Netted Netted Netted Netted 02 210 355in-orchard and external weather station Netted Netted Netted External 045 201 310standard weather data Externala External External External 045 224 343difference between in-orchard and standard weather data 023 033Non-netted orchardin-orchard weather station Non-netted Non-netted Non-netted Non-netted 025 260 367in-orchard and external weather station Non-netted Non-netted Non-netted External 045 227 309standard weather data Externala External External External 045 288 353difference between in-orchard and standard weather data 061 044
a The source data for total radiation (Rs) were made above the canopy in the non-netted orchard and assumed to be equivalent to that measured externally
Table 9Sensitivity analysis of predicted fruit surface temperature calculated from in-orchard weather readings based on standard weather data values between 1610 and 1620 hon 17th of January 2013
Values Change in Tfrmx (C)
Low Standard High Low High
Apple reflectance () 01 04 06 623 minus419
Apple thermal conductivity (ks) (Wm2) 028 042 054 083 minus057
Fruit diameter (D) (m) 0049 0060 0080 minus080 096
Wind speed (v) (ms) 01 12 34 952 minus692
Total radiation (Rs) (Wm2) 60 768 1040 minus1461 523
Diffuse radiation (Rdf ) (Wm2) (Rs held constant) 50 175 580 168 minus548
Air temperature (Tair ) (C) 150 407 420 minus2539 126
46 C on the hottest day of the study 17 January 2013 (79 vs 32)Monitored fruit were only on the west-facing side of the rows thatwould be exposed to the afternoon sun and were representativeof the half of the apple crop at risk of sun damage An unexpecteddifference was that fruit from the non-netted orchard were smaller(125 vs 153 g) most likely due to differences in crop load (fruit num-ber per tree) The Gala variety used in this study is intermediatein its susceptibility to sunburn relative to other cultivars (Schraderet al 2001 Schrader et al 2008) A more comprehensive samplingregime during harvest would be required to quantify the effects ofnetting on yield and sunburn damage for each cultivar
42 Model performance
The model fitted measured Tfrmx at both the netted and non-netted sites with an RMSE of sim2 C in the calibration period andsim3 C in the validation period which is similar to previouslyreported models in orchards or vineyards without netting (Evans2004 Cola et al 2009 Li et al 2014) While a physically-basedmodel would ideally require no calibration and be based on quan-tities that are directly measureable this was not the case here Themost imprecisely defined process is the transfer of heat from thefruit surface to the air through a boundary layer of still air adjacentto the fruit surface The thickness of this boundary layer (ı) hasnever been directly measured but has either been back-calculatedfrom heat transfer characteristics or estimated from measure-ments of v by semi-empirical relationships (eg Cola et al 2009 Liet al 2014) The equations used by Smart and Sinclair (1976) werebased on an experiment of Nobel (1975) in which fruit were heatedby artificial radiation under laminar air flow and ı inferred fromheat transfer characteristics at various wind speeds Under fieldconditions turbulent air flow alters these relationships and Nobel(1975) recommended empirical modifications suited to vineyardsHowever trellised apple orchards have taller rows of trees andwould be expected to have greater turbulence relative to horizon-
tal wind flow than vineyards Although wind flow in the horizontalplane was measured by anemometers within the orchard thesedata produced a poorer fit to observed fruit surface temperaturethan those measured at an exposed site adjacent to the orchardFurther resolution of the physics of heat transfer from the fruit sur-face to the air would require sensors such as sonic anemometerswhich measure air flow in 3 dimensions However for use in a semi-empirical model it appears Tfrmx was more strongly related to windmeasurements taken at the more exposed measurement site exter-nal to the orchard than those taken with cup anemometers close tothe monitored fruit Likewise at the second site a closer fit to fruittemperature measurements was achieved using wind data from anexposed site 18 km away at Tatura than a relatively sheltered siteclose to the orchard A similar calibration approach was undertakenby Cola et al (2009) in a study of vineyard temperatures in Italy Itis therefore simpler to calibrate directly between fruit temperatureand v measured by a cup anemometer at a standardised weatherstation location
The model produced short-term ldquospikesrdquo of high fruit surfacetemperature in the morning before 1000 and in the late afternoonafter 1700 h This occurred during short periods of nearly calm con-ditions when the model calculated a low value of h in Eq (2) Thesespikes occurred outside the times when sun damage would nor-mally be expected (1430ndash1645 h Schrader et al 2003) and couldcause spurious results should the model be run on long-term orautomated weather data To avoid such problems we suggest theuse of a time-based filter that only utilises Tfrmx between 1000 and1700 h for the following reasons Firstly the sun angle after 1700 h(gt60 from zenith) means most fruit are becoming fully or partiallyshaded by leaves while those fully exposed to the sunrsquos rays areunlikely to receive the direct beam of the sun long enough to causedamage According to Schrader et al (2001) sunburn browningrequires exposure to temperatures exceeding the varietal thresh-old for 30ndash60 min for its full development Secondly spikes after1700 h were over-predicted relative to measurements (eg Fig 4)
158 MR McCaskill et al Agricultural and Forest Meteorology 226ndash227 (2016) 148ndash160
Fig 6 Root mean square error of fruit surface temperature (C) during afternoons(1400ndash1700 h) between 9 and 15 January 2013 in response to the calibration factor(f) calculated from wind speed measured (a) within the orchard at a height of 3 mand (b) adjacent to the orchard at a height of 2 m Arrows show optimum values
This could be because the thermocouples were not installed on theface perpendicular to the sun at this time of day or because Eq (2)overestimates the strength of the solar beam at high solar zenithangles Thirdly UV-B levels are low and likely to cause much lessdamage at the same fruit temperature than earlier in the afternoonbecause after 1700 h UV-B levels declined to less than 25 of that atmidday Morning spikes in simulated Tfrmx were noted until 1000 hafter which wind speeds tended to increase and spikes no longeroccurred Sun damaged apples were observed on the eastern sideof the row but we were unable to determine the time this damageoccurred because our equipment was installed on the western sideof the row It is unlikely temperatures above the damage thresholdswould occur prior to 1000 h or after 1700 h without also occurringbetween these times Since predicted Tfrmx in the early morning orlate afternoon and evening is poorly validated and less likely to bedamaging we suggest that only values between 1000 and 1700 hshould be used in long term modelling
It should be noted that these times are in Eastern AustralianStandard Time and that solar noon at this site occurred at 1230 hbecause it is 474 west of the centre of the time zone Appropriateadjustments would need to be made for other sites such as outlinedby Allen et al (1998)
The sensitivity analysis showed that among plant parameters had the largest effect on Tfrmx Most previous studies that reported did not indicate how the value was measured The only sourcethat reported methods was Merzlyak et al (2003) who undertookmeasurements post-harvest Across the visible range averaged035 for dark coloured apples to 045 for pale apples Commercially-available clay sprays reduce Tfrmx by increasing particularly at
Fig 7 Supplementary site measured (blue) and simulated (red and orange) fruitsurface temperature of the hottest face of sun-exposed fruit (Tfrmx) and orchard airtemperature (green) Simulated Tfrmx calculated from wind speeds (a) in a clear-ing surrounded by orchards and f = 045 (optimised to the main site) and (b) at anexposed site at Tatura and f = 092 (optimised to this data set) Simulated temper-atures are shown in red between 1400 and 1700 h and orange at other times (Forinterpretation of the references to colour in this figure legend the reader is referredto the web version of this article)
shorter wavelengths that are more damaging to the skin (Gindabaand Wand 2005) In our study we initially used an value of 055which resulted in an optimum f value of 07 whereas using a moredefensible value of 04 resulted in an optimum f value of 045 Whilein a semi-empirical model an inappropriate value of one parameteris resolved by a compensating calibration factor there are risks thatthe model performs poorly under conditions that differ from its cal-ibration because the physical processes are not simulated correctlyTo resolve this area of uncertainty there is need to undertake morecomprehensive measurements of during fruit development andover a wider range of wavelengths
43 Effects of hail netting
Hail netting reduced the fruit temperature by 15ndash30 C acrossmost of the probability distribution but for the hottest fruit ateach site within the orchard the difference was 40 C The mech-anism for this effect of netting was by reducing the intensity ofthe solar beam by interception and scattering while allowing goodair flow to enable transfer of heat from the fruit surface to theair The netting structure at the study site represented an idealdesign for minimising sun damage because it was installed highabove the tree canopy and had open sides minimising interfer-ence to air circulation within the orchard and air exchange withthe outside Despite this design the netted orchard had internalwind speeds that averaged 22ndash24 lower than the non-netted siteaveraged across all afternoons in January 2013 (Tables 4 and 5) A
MR McCaskill et al Agricultural and Forest Meteorology 226ndash227 (2016) 148ndash160 159
wide range of designs are used commercially including temporarynets placed over the trees retractable netting installed on struc-tures above the tree canopy and fixed netting with closed or opensides (Lolicato 2011) Some designs could potentially exacerbaterather than reduce sun damage if wind is substantially reduced Thesensitivity analysis showed that if netting caused a 25 reductionin wind speeds this could without other changes to the heat bal-ance increase fruit temperatures by 22 C To maintain fruit surfacetemperatures equivalent to the non-netted orchard would requireeither a decrease in total radiation of 16 or if total radiation isunchanged the proportion in the diffuse form needs to increase by58 Until recently hail protection has been the primary rationalefor investment in netting followed by protection from fruit batsand birds Where the latter is required the sides would need to beclosed but this could reduce internal v leading to increased fruittemperatures From principles developed in this study a designthat uses a more open netting on the sides would minimise theseproblems
While the netting intercepted only 10ndash11 of Rs at solar noonthis is not the time maximum protection is required for two rea-sons Firstly the NNW-SSE row orientation and training structuremeant that a high proportion of fruit were shaded by leaves at thistime of the day Secondly air and fruit temperatures on hot daystend to peak in the late afternoon Our study showed that peakfruit surface temperatures occurred between 1600 and 1700 h atwhich time netting intercepted and scattered a greater proportionof Rs than at midday Protection from radiation at solar noon wasconsistent with its 10 shade rating but at 1620 h when the solarangle was 52 its shading effect was greater (15ndash20) and therewas an even greater reduction in radiation perpendicular to thefruit surface at the hot spot (26) Excessive shading needs to beavoided because it reduces the development of red colour in thefruit (Gindaba and Wand 2005) The main protection from sundamage is therefore required between approximately 1600 and1700 h when netting is over twice as effective in controlling thesurface heating effect of the sun than would be expected from itsshade specifications For this reason hail netting with a 10 shaderating represents a good compromise between protection from hailand sun damage while minimising its effects on fruit colour devel-opment
Our data are a comprehensive comparison of microclimate withand without netting From it we were able to develop equations topredict the netted microclimate from external measurements butthese are only directly applicable to the particular design colourand weave type at the study site Predictive equations could beobtained over a relatively short period (two weeks) through theuse of 10 min data which for radiation were based on measuredRs relative to Ra (as recommended by Spitters et al (1986)) andthe air mass number as a representation of the sun angle Thesound physical basis of these equations means the approach shouldbe applicable to developing relationships for other structures andweave types from relatively short periods of data However thephysical nature of this modelling approach is also a weaknessbecause a large amount of weather data must be assembled attime scales of at least hourly in addition to site-specific rela-tionships between wind measurement locations and fruit surfacetemperature The role of this level of modelling is in understandingprocesses and quantifying the effects of various netting structureswhich can differ in weave type colour height and the presence orabsence of side netting For many applications a simpler approachwould be more suitable For example Darbyshire et al (2015) useddata from our study to identify the external air temperature atwhich fruit surface temperature exceeded a sunburn browningthreshold in 10 of monitored fruit This was determined as 379 Cwith netting and 341 C without netting These thresholds werethen used to assess the benefits of netting in Australiarsquos apple grow-
ing regions for a range of climate change scenarios (Darbyshireet al 2015 Webb et al 2016) Their findings are however spe-cific to the netting design used in our study and the approach islimited in investigating the effects of other management optionssuch as canopy architecture row orientation leaf density and theirinteraction with netting design
Netting was associated with other changes to the agro-ecological environment including reduced ETo higher humidityand lower wind speeds Under netting ETo was 13 lower thanat the non-netted site which would lead to a reduced irrigationrequirement The combination of higher humidity and lower v isa potential disbenefit because it is associated with a longer dura-tion of leaf wetness (Kim et al 2002) which in turn leads to ahigher disease risk The most economically significant disease ofapples is apple scab (Venturia inaequalis) which is a fungus that forlight infection requires at least 12 h of continuous leaf wetness at13 C and longer periods at lower temperatures (Vaillancourt andHartman 2000) The netted environment therefore had a benefitthrough a lower irrigation requirement but there was also a dis-benefit through a greater risk of fungal diseases that may requiremore frequent control measures
5 Conclusions
This study found that netting was able to reduce the median fruitsurface temperatures by 15ndash20 C The mechanism for this effectof netting was by reducing the intensity of the solar beam by inter-ception and scattering while allowing sufficient air flow to enabletransfer of heat from the fruit surface to the air An adaptation ofa previously published thermodynamic model was able to accountfor these differences with an RMSE of 2ndash3 C in the afternoon whensun damage most commonly occurs but in the morning or earlyevening it appeared to over predict fruit temperatures during timesof low wind speed
Acknowledgements
This project was funded by the Department of Economic Devel-opment Jobs Transport and Resources (DEDJTR) the AustralianGovernment Department of Agriculture and Horticulture Innova-tion Australia Limited using the apple and pear industry levy andmatched funds from the Australian Government We thank JoergKlein (Geoffery Thompson Orchards Pty Ltd) for permitting us touse their orchard We also thank Eileen Perry and Des Whitfield(DEDJTR) for valuable discussions during the development of thispaper
References
Allen RG Pereira LS Raes D Smith M 1998 CropEvapotranspirationmdashGuidelines for Computing Crop WaterRequirementsmdashFAO Irrigation and Drainage Paper 56 Food and AgriculturalOrganisation of the United Nations Rome
Bergh O Franken J Van Zyl EJ Kloppers F Dempers A 1980 Sunburn onapples preliminary results of an investigation conducted during the 1978ndash79season Deciduous Fruit Grower 30 8ndash22
Cola G Failla OK Mariani L 2009 BerryTonemdasha simulation model for the dailycourse of grape berry temperature Agric For Meteorol 149 1215ndash1228
Darbyshire R McClymont L Goodwin I 2015 Sun damage risk of Royal Galaapple in fruit-growing districts in Australia New Zeal J Crop Hortic Sci 43 (3)222ndash232
Donsi G Ferrari G Nigro R 1996 Experimental determination of thermalconductivity of apple and potato at different moisture contents J Food Eng 30263ndash268
Evans RG 2004 Energy balance of apples under evaporative cooling Trans ASAE47 1029ndash1037
Gindaba J Wand JE 2005 Comparative effects of evaporative cooling kaolinparticle film and shade net on sunburn and fruit quality in apples HortScience40 592ndash596
Green S Goodwin I Cornwall D 2011 Over-tree sprinkler cooling to reducesunburn on fruit Aust Fruitgrow 5 (10) 12ndash14
160 MR McCaskill et al Agricultural and Forest Meteorology 226ndash227 (2016) 148ndash160
Jacobson MZ 2005 Fundamentals of Atmospheric Modeling 2nd ed CambridgeUniversity Press p 317
Kasten F Young AT 1989 Revised optical air mass tables and approximationformula Appl Opt 28 4735ndash4738
Kim KS Taylor SE Gleason ML Koehler KJ 2002 Model to enhancesite-specific estimation of leaf wetness duration Plant Dis 86 179ndash185
Li L Peters T Zhang Q Zhang J Huang D 2014 Modeling apple surfacetemperature dynamics based on weather data Sensors 14 20217ndash20234
Lisowa H Wujec M Lis T 2002 Influence of temperature and variety on thethermal properties of apples Int Agrophys 16 43ndash52
Lolicato S 2011 Sun Protection for Fruit a Practical Manual for PreventingSunburn on Fruitmdash2011 Department of Primary Industries Farm ServicesVictoria Division Melbourne Australia
Merzlyak MN Solovchenko AE Gitelson AA 2003 Reflectance spectralfeatures and non-destructive estimation of chorophyll carotenoid andanthocyanin content in apple fruit Postharvest Biol Technol 27 197ndash211
NetPro 2010 Product Data Sheet Commercial Horticultural Shade Cloth (accessed220615) httpwwwnetprocanopiescomdocuments-pdfproductsheetsDataSheets OzSmartShade CommHortRangepdf
Nobel PS 1975 Effective thickness and resistance of the air boundary layeradjacent to spherical plant parts J Exp Bot 26 120ndash130
Racsko J Schrader L 2012 Sunburn of apple fruit historical background recentadvances and future perspectives Crit Rev Plant Sci 31 455ndash504
Sauderau M Sinoquet H Santin O Marquier A Adam B Longuenesse JJGuilioni L Chelle M 2007 A 3-d model for simulating the spatial andtemporal distribution of temperature within ellipsoid fruit Agric ForMeteorol 147 1ndash15
Schrader LE 2011 Scientific basis of a unique formulation for reducing sunburnof fruits HortScience 46 6ndash11
Schrader LE Zhang J Duplaga WK 2001 Two Types of Sunburn in AppleCaused by High Fruit Surface (peel) Temperature Plant Health Progress(accessed 020616) httpswwwplantmanagementnetworkorgpubphpresearchsunburn
Schrader L Zhang J Sun J 2003 Environmental stresses that cause sunburn ofapple Acta Hortic 618 397ndash405
Schrader L Sun J Zhang J Seo J Jedlow L Felicetti D 2004 Fruit SkinDisorders Proc 100th Annu Meeting Washington State Hort Association p 4(last accessed 160212) httppostharvesttfrecwsueduPC2004Epdf
Schrader LE Sun J Zhang J Felicetti D Tian J 2008 Heat and light-inducedapple skin disorders causes and prevention Acta Hortic 772 51ndash58
Smart RE Sinclair TR 1976 Solar heating of grape berries and other sphericalfruits Agric Meteorol 17 241ndash259
Spitters CJT Toussaint HAJM Goudriaan J 1986 Separating the diffuse anddirect component of global radiation and its implications for modelling canopyphotosynthesis Part 1 Components of incoming radiation Agric ForMeteorol 38 217ndash229
Thorpe MR 1974 Radiant heating of apples J Appl Ecol 11 755ndash760Vaillancourt LJ Hartman JR 2000 Apple Scab The Plant Health Instructor The
American Phytopathological Society httpdxdoiorg101094PHI-I-2000-1005-01 (accessed 120315) httpwwwapsnetorgedcenterintropplessonsfungiascomycetesPagesAppleScabaspx
Webb L Darbyshire R Erwin T Goodwin I 2016 A robust impact assessmentthat informs actionable climate change adaptation future browning-risk inapple crops Int J Biometeorol (accepted)
Wuumlnsche JN Greer DH Palmer JW Lang A McGhie T 2001 Sunburnmdashthecost of a high light environment Acta Hortic 557 349ndash356
ORIGINAL PAPER
A robust impact assessment that informs actionable climatechange adaptation future sunburn browning risk in apple
Leanne Webb1amp Rebecca Darbyshire1 amp Tim Erwin2
amp Ian Goodwin3
Received 18 October 2015 Revised 21 October 2016 Accepted 22 October 2016 ISB 2016
Abstract Climate change impact assessments are predomi-nantly undertaken for the purpose of informing future adapta-tion decisions Often the complexity of the methodology hin-ders the actionable outcomes The approach used here illus-trates the importance of considering uncertainty in future cli-mate projections at the same time providing robust and sim-ple to interpret information for decision-makers By quantify-ing current and future exposure of Royal Gala apple to dam-aging temperature extremes across ten important pome fruit-growing locations in Australia differences in impact to ripen-ing fruit are highlighted with by the end of the twenty-firstcentury some locations maintaining no sunburn browningrisk while others potentially experiencing the risk for the ma-jority of the January ripening period Installation of over-treenetting can reduce the impact of sunburn browning The ben-efits from employing this management option varied acrossthe ten study locations The two approaches explored to assistdecision-makers assess this information (a) using sunburnbrowning risk analogues and (b) through identifying hypo-thetical sunburn browning risk thresholds resulted in varyingrecommendations for introducing over-tree netting These rec-ommendations were location and future time period depen-dent with some sites showing no benefit for sunburn protec-tion from nets even by the end of the twenty-first century andothers already deriving benefits from employing this
adaptation option Potential best and worst cases of sunburnbrowning risk and its potential reduction through introductionof over-tree nets were explored The range of results presentedhighlights the importance of addressing uncertainty in climateprojections that result from different global climate modelsand possible future emission pathways
Keywords Extreme temperature Sunburn browning
Netting Horticulture Pome fruit Climate projections
Introduction
The purpose for undertaking most climate change impactassessments should be to inform adaptation decisions orprompt action for greenhouse gas mitigation Many impactassessments however are not solution-focused nor do theyrespond to end-user perspectives (Kiem and Austin 2013) Inpresenting their results to end-users and decision-makers thescience community often focuses on exploring and explainingsubjects such as uncertainties in climate projections whichcan over-complicate the advice Here an approach is outlinedthat aimed to provide robust yet simple results to enable ac-tionable decisions while also including the uncertainty in fu-ture climate projections
An increase in the occurrence of extreme heat events hasbeen observed historically in Australia (Alexander et al 2007Trewin and Smalley 2013) The apple industry which had a2014ndash2015 gross value of $AU550 million (ABS 2016) isparticularly vulnerable to these extreme heat events as high airtemperatures and solar radiation exposure cause lsquosunburnbrowningrsquo a brown spot on the sun-exposed side of the fruitwith affected fruit unmarketable (Schrader et al 2003a bThomson et al 2014 Racsko and Schrader 2012) For examplea heat wave event in January 2009 in south-east Australia
Rebecca Darbyshirerebeccadarbyshiredpinswgovau
1 Faculty of Veterinary and Agricultural Science University ofMelbourne Parkville VIC Australia
2 CSIRO Oceans and Atmosphere PMB 1 Aspendale VIC Australia3 Department of Economic Development Jobs Transport and
Resources Tatura Australia
Int J BiometeorolDOI 101007s00484-016-1268-y
resulted in large yield losses due to sun damage approximatedat between 30 and 70 of the crop (Thomson et al 2014)Under anthropogenic climate change increases in the intensityfrequency duration and spatial extent of extreme temperaturesin Australia are expected (Alexander and Arblaster 2009CSIRO and BoM 2015 IPCC 2012) potentially increasingthe risk of sunburn damage
Given this potential risk many fruit-growing districts inAustralia will likely need to implement adaptation strategiesto minimise potential sun damage (Thomson et al 2014) Oneadaptation option is to use over-tree netting to protect fruit fromextreme conditions (Fig 1 left) In a recent study Darbyshireet al (2015) determined minimum air temperature thresholdsthat can result in sun damage of lsquoRoyal Galarsquo apple in non-netted and netted orchards Their assessment employed thermo-couple sensors under the fruit skin (Fig 1 right) in combinationwith air temperature sensors They identified air temperaturethresholds of 341 and 379 degC that correlate to minimumFST thresholds that can cause sunburn browning in nettedand non-netted orchards respectively To evaluate the use ofover-tree netting as an adaptation strategy to reduce the risk ofsun damage this climate change impact study presents a meth-od that minimised the potential number of descriptive climateprojections to produce results aimed at informing adaptive ac-tions This was evaluated considering the frequency of exceed-ance of threshold air temperatures now and in future periods fornon-netted and netted orchards Current (centred on 1995) andprojected threshold exceedance centred on 2030 and 2050aligningwith orchardistsrsquo shorter andmid-term planning frame-works respectively was evaluated In addition a period centredon 2090 was assessed to align with long-term strategicplanning
To address the demand for regionally relevant climatechange information (Kiem and Austin 2013) ten locations im-portant for pome fruit production in Australia covering a broadgeographical extent and corresponding range of underlying cli-mates were assessed One significant advantage to studyingmultiple locations in an impact assessment is that areas thatexperience similar climatic conditions but which may be sep-arated in space or time (ie with past or future climates) can beidentified ie climate analogues (Whetton et al 2013) This canbe helpful when considering adaptation strategies to a changing
climate (Hallegatte et al 2007 Webb et al 2013) a techniquethat will be demonstrated in this study
For adaptation actions to be effective comprehensive andplausible representation of the future climate is required to in-form the projection results The recently published Australianclimate change projections are based on the full body of knowl-edge of the climate system and the most up to date perspectiveon how the current climate may change under enhanced green-house gas concentrations (CSIRO and BoM 2015) These pro-jections of the future climate were informed by 40 CoupledModel Intercomparison Project 5 (CMIP5) (Meehl and Bony2011) global climate models (GCMs) simulating the climateresponse to a range of plausible scenarios of how greenhousegases and aerosols may change throughout the twenty-first cen-tury (Van Vuuren et al 2011) termed RepresentativeConcentration Pathways (RCPs)
The use of over-tree netting as a climate adaptation optionfor Royal Gala apple was used as an example to demonstrate amethod that simplifies complex climate projection informationin a manner that promotes climate adaptation uptake whileretaining scientific robustness Evaluating the potential benefitof installing netting to reduce apple sunburn risk is a useful casestudy as financial loss can be significant from extreme heatevents and netting is a clear implementable management op-tion The method used best-case and worse-case climate sce-narios for several future time periods to evaluate future sunburnbrowning risk with and without the adaptation option ofinstalling netting This was applied Australian wide to tengrowing districts to evaluate the adaptation option under futureclimates and across various site climate conditions The resultswere interpreted using several different approaches includingclimate analogues and considering different levels of growerrisk aversion
Materials and methods
Locations and regions assessed in the study
Climate data were selected from ten locations that represent themain commercial apple-growing regions in Australia Thesewere Applethorpe in Queensland Donnybrook and Manjimup
Fig 1 A netted lsquoRoyal Galarsquo apple orchard in Shepparton Victoria (left) Royal Gala apples with evidence of sunburn browning damage (centre) and athermocouple sensor placed under the fruit skin of a Royal Gala apple to measure fruit surface temperature (right)
Int J Biometeorol
in Western Australia Lenswood in South Australia Batlow andYoung in New South Wales Tatura and the Yarra Valley inVictoria and Spreyton and Huonville in Tasmania (Fig 2)These locations were in two broad regions identified in a studyby CSIRO and BoM (2015) based on their climate change re-sponse denoted as either the Central Slopes or SouthernAustralia
Recent climate projections for Australia were regionalisedaccording to logical groupings of recent-past climatic condi-tions biophysical factors and expected broad patterns of cli-mate change (CSIRO and BoM 2015) The ten study locationsare contained in two of these regions Central Slopes andSouthern Australia (Fig 2) Temperature projection resultsfrom these two regions were used to inform selection ofGCMs for this assessment
Projection methods
Analyses were conducted using daily maximum temperature(Tmax) for January when most sun damage is incurred forRoyal Gala apple following Darbyshire et al (2015) It wasimportant to set the context in this climate change impact as-sessment by including historical risk therefore allowing thechange in risk to be investigated In this study historical riskwas analysed using a 30-year baseline period centred on 1995(1981ndash2010) using gridded (005deg by 005deg) daily JanuaryTmax data obtained from the Australian Water AvailabilityProject (AWAP) (Jones et al 2009) Henceforth this 30-yearhistorical range is referred to as 1995
Future daily Tmax conditions were assessed in the studywith the aim to capture the range of climate projectionsresulting from the future range of RCPs and correspondingrange of CMIP5 GCM output To achieve this a subset ofRCPs and GCMs were identified and combined to createlsquobest-casersquo and lsquoworse-casersquo future climate scenarios The se-lection of RCPs GCMs and the method used to include day-to-day natural variability is detailed below
Emission pathways
Two RCPs (Moss et al 2010 Van Vuuren et al 2011) wereselected to include the likely future range in emissions
1 RCP45 An intermediate pathway which represents afuture where carbon dioxide (CO2) emissions peakaround 2040 and strong mitigation of emissions occursin the latter half of the century CO2 concentrations reach540 ppm by 2100 This scenario is similar to the SpecialReport on Emissions Scenarios (SRES) B1 scenario(Nakićenović and Swart 2000)
2 RCP85 A high pathway which represents a future withlittle curbing of emissions where the CO2 concentrationcontinues to rapidly rise reaching 940 ppm by 2100Current CO2 concentration analysis indicates that we aretracking along this trajectory (Peters et al 2012) Thispathway is similar to the SRES A1FI scenario (Rogeljet al 2012)
Fig 2 Australian pome fruit-growing locations (black dot) areshown in context of Australianstates (capital letters Victoriaabbreviated to Vic) The regionsdefined in CSIRO and BoM(2015) used for model selection inthis study are Southern Australia(dark grey) and Central Slopes(light grey)
Int J Biometeorol
Selecting GCMs
The 40 GCMs available from the CMIP5 were investigated toselect GCMs that best defined the projected range in Tmax forthe two regions (Fig 2) These were selected by analysingsummer (harvest season) Tmax projections for all 40 GCMsover three time periods 2030 (2016ndash2045) 2050 (2036ndash2065) and 2090 (2075ndash2104) (henceforth referred to as2030 2050 and 2090) and the two identified RCPs (40GCMs for RCP85 and 38 GCMs for RCP45) using theAustralian Climate Futures approach (Clarke et al 2011Whetton et al 2012) For each region this approachcategorised and then ranked projected increases in summerTmax GCM output using a multivariate ordering technique(Kokic et al 2002) After ranking only 26 GCMs of the 40were considered for inclusion in the assessment as the remain-ing 14 have been found to perform poorly across a number ofmetrics for Southern Australia (Moise et al 2015)
This assessment found that two GCMs CanESM2 andMIROC5 best described the range in projected summerTmax increases for both the Southern Australian and CentralSlopes regions (Table 1) Across both regions the CanESM2model was consistently warmer than the ensemble meanwhile the MIROC5 model was consistently cooler than themean While these GCMs were not always the absolute leastor most warming for each time period and RCP in the definedregions across the range of future scenarios being consideredthey represented the range well
Using these selections of RCPs and GCMs best-case andworst-case future scenarios were constructed to capture therange of climate projection uncertainty The best-case scenariowas constructed using MIROC5 forced by RCP45 and theworse-case scenario was similarly constructed usingCanESM2 and RCP85 As such reliance on using GCMnames and emission pathway terminology was removed
Representing natural variability in the projected Tmax timeseries
To create future daily Tmax time series projected averagemonthly January Tmax change values centred on 20302050 and 2090 for the best-case and worst-case scenarioswere added to the AWAP observed January daily Tmax timeseries (1981 to 2010) To capture the most reliable estimateof location-specific natural climate variability the baselineTmax time series was contrived to extend for the longestpossible period 30 years while remaining centred on1995 (CSIRO and BoM 2015) In this way the influenceof decadal shifts that may skew the lsquonormalrsquo climatologysuch as the Australian Millennium drought (Dijk et al2013) was minimised By using this approach the futurevariability in each scenario was the same as the underlyingnatural baseline temperature variability
Assessment of sunburn browning risk
For all locations the 10th 50th and 90th percentile of a 30-year time series of the number of days in January that Tmaxexceeded 341 degC (sunburn browning non-netted) and 379 degC(sunburn browning netted) (Darbyshire et al 2015) were gen-erated using the baseline (1995) period and each of the futureperiods (2030 2050 and 2090)
The entire plausible range of days exceeding the thresholdor sunburn browning risk (days) for each future time periodwas captured by incorporating results across the best-case andworst-case scenarios
The potential benefit of netting measured as a reduction inthe number of sunburn browning risk days was evaluated Tointerpret this reduction in terms of benefit of netting two riskcases were identified
1 Risk-sensitive Netting was introduced if the maximum(90th percentile) number of days in a 30-year periodexperiencing sunburn browning risk was greater than20 of days in the month (ie 6 days)
2 Risk-tolerant Netting was introduced if the median (50thpercentile) number of days in a 30-year period experienc-ing sunburn browning risk was greater than 20 of daysin the month (ie 6 days)
Use of lsquosunburn browning riskrsquo analogues
An alternative method to assist decision-makers regarding thetiming of introduction of over-tree nets is to identify a locationwhere the threshold was already exceeded ie where over-treenetting is already employed to minimise sunburn browningrisk Decision-makers will decide to introduce over-tree netsonce the climate becomes similar or analogous to the identi-fied location To assist with using this approach sunburnbrowning risk analogues were identified across the ten studylocations for 2030 2050 and 2090
To define sunburn browning risk analogues sunburn brow-ning risk was categorised and colour coded as in Table 2
Results
Historical (1981ndash2010) daily January Tmax ranges for the tenstudy locations indicated that Spreyton and Huonville werethe coolest locations with the warmest locations beingDonnybrook and Young (Fig 3 also see Fig 2 map)Exceedance of non-netted (341 degC) and netted (379 degC) sun-burn browning air thresholds for the period 1981ndash2010 oc-curred where the boxplot crossed the indicative lines
Int J Biometeorol
Current and projected sunburn browning risk
The current (1995) and future (2030 2050 and 2090) medi-an (10th and 90th percentile in brackets) sunburn browningrisk (days) for non-netted trees at the ten study locations isdescribed in Table 3 To simplify the results the range in-cluded both best-case and worse-case scenarios for eachtime period
The median number of sunburn browning risk daysfor the 1995 period varied with location from no dam-age at Spreyton through to 3 days for Lenswood 7 daysfor Donnybrook and 9 days for Young The maximumexceedance in any 1 year through this period was 16 daysrecorded at Young (in the years 1988 2003 2006 and2009)
For Tatura a key growing district median sunburn brow-ning risk of approximately 9 days was projected by 2030This could be up to 16 days in hottest years under a worst-case scenario but in coolest years and best-case scenarioonly 3 days would be expected to exceed the sunburn brow-ning threshold temperature In contrast under both best-caseand worst-case scenarios and across the natural variabilitySpreyton remained largely risk-free through to 2090(Table 3)
To compare the sunburn browning risk between locationsand for future time periods instances with similar mediansunburn browning risk were colour-coded in Table 3 Theseshadings indicate sunburn browning risk analogues For ex-ample the current sunburn browning risk at Young (medianof 9 days per month) is expected at Tatura in 2030 while the
current risk at Tatura (6 days per month) is expected atLenswoodManjimupBatlow and theYarraValley by 2090
Reduced sunburn browning risk through installationof over-tree nets
Sunburn browning risk (days) with the installation of over-tree netting was evaluated (Table 4) With nets in place atTatura the maximum exposure for 2030 was halved to ap-proximately 8 days for the hottest projected years and aworse-case projection scenario (163 days Table 3 vs84 days Table 4) By 2090 in Young where up to 249 daysof sunburn browning risk was experienced in the hottestyears and under a worst-case scenario (no nets Table 3)sunburn browning risk nearly halved to approximately14 days with over-tree nets in place (Table 4) which is sim-ilar to current risk at Young in the hottest years under aworst-case scenario for non-netted trees (Table 3)
The reduction in sunburn browning risk (days) was calcu-lated by measuring the average difference in exposure withand without over-tree nets This is illustrated spatially sepa-rately for best-case and worst-case future scenarios for 2090(Fig 4) Tasmanian locations had little benefit from the in-stallation of nets with Spreyton indicating 0-day benefitAverage exposure in Huonville was reduced by approxi-mately 1 day under the best-case future scenario and up to2 days under the worst case For Manjimup a more than 5-day (on average) improvementwas realised through applica-tion of nets (worst case) or approximately 3 to 4 days (onaverage best case) In currently hot areas such as Young
Table 1 Projected change in summer Tmax (degC) for Southern Australia and Central Slopes regions (see Fig 2) for 20-year periods centred on 20302050 and 2090 relative to the the 20-year period centred on 1995 under RCP45 and RCP85 for CanESM2 andMIROC5 CMIP5 GCMs compared tothe ensemble mean and standard deviation of 40 (RCP85) and 38 (RCP45) GCMs
Southern Australia Central Slopes
2030 2050 2090 2030 2050 2090
Both RCPs RCP45 RCP85 RCP45 RCP85 Both RCPs RCP45 RCP85 RCP45 RCP85
CanESM2 12 15 25 22 48 09 20 30 27 54
MIROC5 09 12 14 18 27 05 11 15 19 28
Mean 10 15 19 20 38 11 16 21 24 41
Standard deviation 03 04 04 05 09 05 07 07 07 09
Table 2 Sunburn browning risk (days) for the month (top) and proportion of days in the month (bottom)
le 16 days 17 to 31 days 32 to 62 days 63 to 93 days 94 to 155 days ge 156 days
le 50 51 to 100 101 to 200 201 to 300 301 to 500 ge 501
Colour shading corresponds to periods and locations having these sunburn browning risk levels
Int J Biometeorol
nets reduced sunburn browning risk by 8 to 9 days (on aver-age best to worst case)
To evaluate potential decisions to install netting the resultswere interpreted for two risk cases
1 Risk-sensitive option (eg maximum sunburn browningrisk (90th percentile) gt6 days Table 3)
2 Risk-tolerant option (eg median sunburn browning risk(50th percentile) gt6 days Table 3)
Depending on the risk case selected nets were applied at dif-ferent locations and different time periods as shown in Table 5Under the risk-sensitive case nets were applied at more locationsand earlier For example it is only under the risk-sensitive case thatnets were applied in Batlow A further example at Manjimupindicated that nets would be installed in 2030 under the risk-sensitive case and not until 2090 under a risk-tolerant caseInstallation of netting will be beneficial even for the historicalperiod under either risk case in Young Donnybrook and Tatura
Discussion
The disconnect between defendable credible and legitimate cli-mate projection information and end-user requirements can actas a barrier to actionable climate adaptation recommendations(Kiem and Austin 2013) Indeed inability to ever fully resolveuncertainty in climate projections should not restrict decision-relevant information being provided to inform end-users
Presentation of context-specific best-case and worst-caseoutcomes can remove the barrier between the science and theend-user with the decision-maker having robust informationready for decision implementation In a critical first step tosimplifying the outcomes of this study two GCMs representa-tive of the range of change were selected (Clarke et al 2011Whetton et al 2012) Further to this RCP45 and RCP85 (VanVuuren et al 2011) were used to represent the range of plausi-ble future emission scenarios While a lower option (RCP26)was available for modelling this pathway was not consideredachievable given current global emission policy settings(Meinshausen et al 2009 Peters et al 2012) and was thereforenot assessed Combining the projection information scenariosfor the best case ie least-warmingGCMlowest emissionpathway and worst case ie most-warmingGCMhighestemission pathway were identified and presented This ensuredthat the full profile of climate projections was captured in asimplified manner without reducing the credibility of the re-sults or the relevance of potential decision options In doing soa great deal of unnecessary complexity in calculation and pre-sentation of data and results was avoided (Smith and Chandler2010) and climate science terminology minimised This ap-proach could be applied to other impact analyses using tem-perature change or extended to studies where both temperatureand rainfall are important with for instance best case identi-fied as least-warming and wettest and worst case most-warming and driest future scenario
Note that results need to be interpreted across the range ofthe best-case and worse-case scenarios Employing only oneGCM or RCP in an impact assessment can inadvertently leadto potentially flawed adaptation decisions For example atApplethorpe by 2090 and under the best-case scenario a 15-day reduction to sunburn browning risk was achieved fromover-tree netting perhaps resulting in a decision not to installnets (see Fig 4) Under the worst-case scenario with nearly 6-day reduction to sunburn browning risk nets could be consid-ered useful (Fig 4) Presenting the range of best-case andworst-case projections gives end-users the opportunity to makea better-informed decision by appreciating the range of likelyoptions
In this assessment only some growing locations are at riskof sunburn browning under current and future climates Forexample for the Tasmanian locations of Huonville andSpreyton sunburn browning risk remains minimal rightthrough to the end of the century However for Young and
Young
Donnybrook
Tatura
Manjimup
Batlow
Applethorpe
Lenswood
Yarra Valley
Huonville
Spreyton
Maximum temperature (1981 - 2010) deg C
40302010
Fig 3 Boxplot showing daily January maximum temperature (degC) for1981ndash2010 for the ten locations in the study (also see Fig 2 map) Theinterquartile range (IQR) of the sample is indicated by the height of thebox the sample median (the horizontal bar) and 15 times IQR (thewhiskers) with outliers (the lsquoorsquo) Tmax thresholds (the horizontal solidlines) are given for sunburn risk (non-netted) 341 degC and sunburn risk(netted) 379 degC
Int J Biometeorol
Tatura by mid-century over a third of days in the harvestmonth could pose a sunburn browning threat
Over-tree netting is an effective option for reducing sunburnbrowning risk (Smit 2007 Smit et al 2008 Solomakhin andBlanke 2010) and was found in this study to notably reducesunburn browing risk for most growing districts Adaptationplanning to determine the time period in which nets could beintroduced to reduce sunburn browning risk was explored Thiscan be informed by using analogues of current and future expo-sure to extreme heat events (Webb et al 2013) For example theexposure to damaging heat events currently experienced inTatura is likely to be the same as that projected for Lenswoodby 2050 or Batlow by 2090 The benefit of future investment inover-tree nets for Lenswood or Batlow can be informed bylooking at current regional netting practises in Tatura
An alternative approach for informing future adaptationplanning decisions was presented using two hypothetical riskprofiles a risk-sensitive and a risk-tolerant Using this ap-proach nets would be recommended to be installed at differ-ent locations at different times through the twenty-first centu-ryWhile this example was informative individual risk assess-ment will likely change with appetite for business risk growerexperience and financial position A benefit-cost analysiswould assist with this decision-making An assessment ofthe economics of installing nets in the current climate inEurope for example showed that they were not economicallybeneficial (Iglesias and Alegre 2006) This would certainlyapply in Tasmania where the cost of netting would exceedcrop loss due to sunburn browning For other locations thebenefit-cost ratio would vary and could be estimated both
Table 3 Median (10th to 90th percentile in brackets) sunburn browning risk (days) for ten Australian pome fruit-growing locations for 30-year periodscentred on 1995 2030 2050 and 2090
Location 1995 2030 2050 2090
Spreyton 00 (00 to 00) 00 (00 to 00) 00 (00 to 00) 00 (00 to 03)
Huonville 00 (00 to 20) 10 (00 to 27) 10 (00 to 29) 15 (00 to 32)
Yarra Valley 20 (00 to 77) 43 (06 to 92) 46 (06 to 95) 56 (13 to 105)
Lenswood 30 (10 to 70) 45 (16 to 94) 51 (18 to 102) 60 (28 to 107)
Applethorpe 00 (00 to 20) 03 (00 to 46) 10 (00 to 59) 30 (00 to 97)
Batlow 10 (00 to 40) 29 (00 to 77) 41 (00 to 95) 55 (03 to 126)
Manjimup 25 (00 to 50) 39 (01 to 72) 45 (11 to 77) 61 (21 to 95)
Tatura 60 (10 to 130) 94 (33 to 163) 104 (45 to 177) 130 (65 to 210)
Donnybrook 70 (30 to 110) 89 (32 to 139) 103 (41 to 154) 128 (71 to 184)
Young 90 (12 to 160) 133 (26 to 202) 154 (38 to 227) 178 (58 to 249)
Future sunburn browning risk incorporates potential best-case and worst-case results Sunburn browning risk categories and colour coding defined in theMaterials and methods section of this publication
Table 4 As for Table 3 with over-tree nets in place
Location 1995 2030 2050 2090
Spreyton 00 (00 to 00) 00 (00 to 00) 00 (00 to 00) 00 (00 to 00)
Huonville 00 (00 to 00) 00 (00 to 05) 00 (00 to 10) 03 (00 to 13)
Yarra Valley 00 (00 to 19) 09 (00 to 35) 13 (00 to 42) 19 (00 to 61)
Lenswood 10 (00 to 29) 15 (00 to 45) 18 (03 to 52) 23 (03 to 57)
Applethorpe 00 (00 to 00) 00 (00 to 05) 00 (00 to 10) 00 (00 to 20)
Batlow 00 (00 to 00) 00 (00 to 10) 01 (00 to 25) 06 (00 to 40)
Manjimup 00 (00 to 20) 00 (00 to 25) 05 (00 to 30) 14 (00 to 43)
Tatura 20 (00 to 59) 28 (00 to 84) 36 (03 to 94) 56 (08 to 126)
Donnybrook 10 (00 to 30) 20 (00 to 50) 30 (00 to 57) 50 (10 to 82)
Young 20 (00 to 59) 39 (00 to 90) 54 (05 to 115) 78 (11 to 142)
Int J Biometeorol
under current and future climates (not in the scope of thisstudy)
In further support of over-tree netting for use as an adaptationmeasure several additional benefits to reducing sunburn brow-ning risk such as reduced hail damage irrigation requirementincidence of bitter pit and apple scab decay after cold storage andfruit fly damage have been reported (do Amarante et al 2011)
Negative effects of installing netting have been reported includ-ing poorer skin colour (pale blush and a more intense greenbackground colour) higher soluble solid concentration (SSC)and increased starch Interestingly when tasting apple slices ofundamaged and sunburned fruit sunburned fruit were consistent-ly rated higher than undamaged fruit due to their higher SSC andlower tartaric acid concentration (Racsko and Schrader 2012)
Fig 4 The average reduction ofsunburn browning risk days for2090 resulting from using over-tree netting for best-case (top) andworst-case (bottom) scenarios
Int J Biometeorol
therefore processed (eg apple chips apple pie apple juice) orsemi-processed (eg fresh cut slices) forms of apple may showfuture promise for marketing sunburnt fruit
There are also community and social barriers andor incen-tives that need to be considered when deciding to install netsFor example in some regions in Australia (eg Yarra Valley)visual amenity of nets has restricted their introduction whereasin other areas (NSW) government financial incentives exist forgrowers wishing to install netting (NSW Government 2015)
Other adaptation measures to reduce exposure to sunburninclude evaporative cooling fruit bagging or particle films(Gindaba and Wand 2006 Racsko and Schrader 2012) Over-tree evaporative cooling systems based on pulsing water appli-cations can reduce sunburn while also reducing tree transpirationand irrigation requirements (Green et al 2012) However accessto water for this purpose needs to be considered (Evans 2004)especially for drought-prone areas like Australia Many physio-logical and cultural management practises can also influence theextent of sunburn browning in apples cultivar susceptibilitydevelopmental stage of fruit tree form and training systemrow orientation in the orchard growth vigour (rootstock prun-ing) and water stress (Racsko and Schrader 2012) Acclimationby previous exposure to high temperatures within the season canalso reduce the extent of sunburn damage (Racsko and Schrader2012)
This study aimed at providing information to assist with cli-mate adaptation The approach indicated an increase in the num-ber of days potentially suitable for the formation of sunburnbrowning damage Use of a threshold assessment linearlymassing lsquopotential damage daysrsquo or sunburn browning risk wasappropriate for climate projection application and providedgrowers with clear information on potential changes in sunburnbrowning risk Building a more complex model accounting forall additional aspects (UV wind speed humidity colour etc) of
individual fruit incorporating canopy structure modelling couldgo part way to estimating damage at particular growing pointsTo our knowledge such models have not been developedFurthermore combining these sorts of fine flux models(subdaily and very small spatial component) with climate pro-jection data would be misrepresentative Climate projectionmodels are unable to accurately resolve variables such as windspeed through complex landscapes and still require work inpredicting sequences of weather such as heat waves
Apples can respond to high-temperature stress even at ad-vanced stages of maturity by synthesising heat shock proteinswhich likely play an important role in protecting cellular biochem-ical processes during periods of stress (Ritenour et al 2001)Theoretically summer pruning and leaf thinning should be per-formed on cool overcast days when the forecast is for cloudyweather in following days to allow time for heat shock proteinsto accumulate prior to exposure to direct solar radiation Howeverthe timing and duration of exposure required to encourage produc-tion of heat shock proteins are not fully understood Slow progres-sive exposure may allow their protective build-up(Ritenour et al2001 Wuumlnsche et al 2004 Zhang et al 2003 Ma and Cheng2004 Edreva 2005) Future strategies may make better practicaluse of this knowledge by preparing fruit for sun exposure(Wuumlnsche et al 2001 Ritenour et al 2001)
There are other cultivars not commercially grown in Australiathat are more susceptible to sunburn browning For instancelsquoCameorsquo and lsquoHoneycrisprsquo were found to sustain damage at46 degC (Schrader et al 2003b) lower than that for Gala (478 degCSchrader et al 2001) Royal Gala was used in this assessment asproduction in Australia is high with production in 20072008 thethird highest behind Cripps Pink and Granny Smith (AustralianBureau of Statistics 2008)
Other forms of sunburn such as sunburn necrosis a more se-vere level of damage could also be considered using the frame-work outlined in this study Identification of air threshold temper-ature for sunburn necrosis on Royal Gala apple under nets wouldneed to be evaluated prior to such an analysis and highlights atopic for further study (Darbyshire et al 2015) The nature ofextreme heat events often occurring from less than 1 day to afew days at most requires use of special modelling techniques thatare not available directly from GCM output Projections fromGCMs are commonly produced at a monthly timescale with dailyoutput unable to be directly interpreted To overcome this differenttechniques that can produce locally relevant synthetic future dailydata can be used Thesemethods include usingweather generatorsstatistical downscaling the change factor method or dynamicaldownscaling There are pros and cons of these different ap-proaches and there is no one best method (CSIRO and BoM2015Wilby et al 2009) In this analysis the change factormethodwas used to generate a synthetic future daily temperature timeseries incorporating a local representation of natural variabilityuncertainty (Wilby et al 2009) This method involved applyingGCM-derived temperature changes to a higher spatial resolution
Table 5 Decision not to install nets (X) or to install nets () for a risk-sensitive case (maximum sunburn browning risk gt6 days Table 3) (left)and a risk-tolerant case (median sunburn browning risk gt6 days Table 3)(right)
Risk-sensitive Risk-tolerant
Location 2030 2050 2090 2030 2050 2090
Spreyton X X X X X X
Huonville X X X X X X
Yarra Valley X X X
Lenswood X X
Applethorpe X X X X X
Batlow X X X
Manjimup X X
Tatura
Donnybrook
Young
Int J Biometeorol
historical (or baseline) climatology 005deg spacing of longitude andlatitude The projected climatology (with an original spatial reso-lution of approx 15deg (or 150 km) therefore also takes on this finerresolution In this way a synthetic projected temperature climatol-ogy captures local topographical and coastal climate influences
One of the limitations with the change factor method is thatalthough the resultant scenario incorporates the detail of the sta-tion records as well as the average climate change of the speci-fied GCM grid box the scaled and the baseline scenarios onlydiffer in terms of their respectivemeans maxima andminima allother properties of the data such as the range and distributionremain unchanged (Wilby et al 2004) In support of the methodchosen this should pose minimal effect given that for most ofthe Australian region mean temperature change is broadly sim-ilar in magnitude and direction to extreme temperature change(CSIRO and BoM 2015) However in the southern coastal re-gions the increases in the annual and 1-in-20-year maximumsare a little higher than for the means This seems consistent withthe effect of hot winds from the interior providing an even greatertemperature contrast to those from across the ocean under thewarmer climates as examined by Watterson et al (2008) Inviewing the future exposure for locations in Southern Australia(Lenswood and Yarra Valley) this potential underestimateshould be acknowledged It should also be noted that the changefactor method is not advised for producing future rainfall timeseries where in some regions for example changes in extremerainfall are projected to increase even if mean rainfall is projectedto decrease (CSIRO and BoM 2015)
For this case study projected changes to extreme temperatureand the efficacy of over-tree netting in diminishing adverse ef-fects were explored in some detail In a broader assessment ofclimate change impacts on theAustralian apple industry it wouldbe naiumlve to ignore changes to other climate variables given thatthese crops are affected directly and indirectly by many climaticfactors Projections for rainfall evapotranspiration drought fireand wind are all of interest to the grower and have implicationsfor future viability of orchards The importance of these shouldnot be underestimated in terms of the croprsquos vulnerability andalsowith regards to orchard operational practises eg spraying inhot conditions Finally although often overlooked for agriculturalworkers human health as impacted by exposure to extreme heatshould also be considered (Kjellstrom et al 2009)
Conclusion
A methodology was outlined to provide action-oriented climateprojection information The adaptation decision to install over-tree netting to protect apples against sunburn was used as anexample The methodology simplified climate projection infor-mation to a range between best-case and worse-case scenariosThe results were presented in several ways to assist in decision-making including colour-coded analogues and a risk profile
approach For Australia heterogeneity in the benefit of over-tree netting was found geographically and into future time pe-riods The results highlight areas with little risk and hence noadaptation response is required through to areas at considerablerisk and a significant benefit for the installation of netting Thisapproach focussed on adaptation action founded on a robustscientific method can be used as a template for a diverse rangeof impact studies to provide climate projection information that iseasily transferrable into adaptation actions
Acknowledgements We acknowledge the World Climate ResearchProgrammersquos Working Group on Coupled Modelling which is responsi-ble for CMIP and we thank the climate modelling groups for producingand making available their model output For CMIP the US Departmentof Energyrsquos Programme for Climate Model Diagnosis andIntercomparison provides coordinating support and led development ofsoftware infrastructure in partnership with the Global Organisation forEarth System Science Portals
Craig Heady and Tim Bedin for work in preparation of the thresholdexceedance database (CSIRO) and PennyWhetton (CSIRO) for her thor-ough review of the manuscript
Compliance with ethical standards
Funding Funding for this research was provided by the AustralianDepartment of Agriculture and Water Resources
References
ABS (2016) 75030 - Value of Agricultural Commodities ProducedAustralia 2014ndash15 httpwwwabsgovauAUSSTATSabsnsfLookup75030Main+Features12014-15OpenDocument
Alexander L Hope P Collins D Trewin B Lynch A Nicholls N (2007)Trends in Australiarsquos climate means and extremes a global contextAustralian Meteorological and Oceanographic Journal 561ndash18
Alexander LV Arblaster JM (2009) Assessing trends in observed andmodelled climate extremes over Australia in relation to future pro-jections Int J Climatol 29417ndash435 doi101002joc1730
Australian Bureau of Statistics (2008) Agricultural survey apples andpears Australia 2007ndash08 Australian Government Canberra
Clarke JM Whetton PH Hennessy KJ (2011) Providing application-specific climate projections datasets CSIROrsquos climate futuresframework Paper presented at the MODSIM2011 19thInternational Congress on Modelling and Simulation PerthWestern Australia December 2011
CSIRO and BoM (2015) Climate change in Australia information forAustraliarsquos natural resource management regions technical reportCSIRO and Bureau of Meteorology Melbourne pp 222
Darbyshire R McClymont L Goodwin I (2015) Sun damage risk ofRoyal Gala apple in fruit growing districts in Australia N Z JCrop Hortic Sci 43222ndash232
Dijk AI Beck H Crosbie R et al (2013) The millennium drought inSoutheast Australia (2001ndash2009) natural and human causes andimplications for water resources ecosystems economy and societyWater Resour Res 491040ndash1057
do Amarante CVT Steffens CA Argenta LC (2011) Yield and fruit qual-ity of lsquoGalarsquo and lsquoFujirsquo apple trees protected by white anti-hail netSci Hortic 129(1)79ndash85
Int J Biometeorol
Edreva A (2005) The importance of non-photosynthetic pigments andcinnamic acid derivatives in photoprotection Agric EcosystEnviron 106135ndash146
Evans RG (2004) Energy balance of apples under evaporative coolingTransactions of the ASAE 471029ndash1037
Gindaba J Wand SJ (2006) Comparison of climate ameliorating mea-sures to control sunburn on lsquoFujirsquo apples In XXVII InternationalHorticultural Congress-IHC2006 International Symposium onEnhancing Economic and Environmental 772 2006 pp 59ndash64
Green S Goodwin I Cornwall D (2012) Evaporative cooling effects ontree transpiration In VII International Symposium on Irrigation ofHorticultural Crops 1038 2012 pp 401e-406
Hallegatte S Hourcade J-C Ambrosi P (2007) Using climate analoguesfor assessing climate change economic impacts in urban areas ClimChang 8247ndash60 doi101007s10584-006-9161-z
Iglesias I Alegre S (2006) The effect of anti-hail nets on fruit protectionradiation temperature quality and profitability of lsquoMondialGalarsquoapples J Appl Hortic 891ndash100
IPCC (2012) Managing the risks of extreme events and disasters to ad-vance climate change adaptation summary for policymakers Aspecial report of working groups I and II of the intergovernmentalpanel on climate change Cambridge University Press Cambridgeand New York
Jones DA Wang W Fawcett R (2009)High-quality spatial climate data-sets for Australia Australian Meteorological and OceanographicJournal 58233
Kiem AS Austin EK (2013) Disconnect between science and end-usersas a barrier to climate change adaptation Clim Res 5829ndash41
Kjellstrom T Holmer I Lemke B (2009) Workplace heat stress healthand productivitymdashan increasing challenge for low and middle-income countries during climate change Global Health Action 2103402ghav3402i34002047PMCID PMC2799237
Kokic P Breckling J Luumlbke O (2002) A new definition of multivariateM-quantiles In Statistical data analysis based on the L1-norm andrelated methods Springer pp 15ndash24
Ma F Cheng L (2004) Exposure of the shaded side of apple fruit to fullsun leads to up-regulation of both the xanthophyll cycle and theascorbate-glutathione cycle Plant Sci 166(6)1479ndash1486
Meehl GA Bony S (2011) Introduction to CMIP5 CLIVAR Exchanges164ndash5
Meinshausen M Meinshausen N Hare W et al (2009)Greenhouse-gasemission targets for limiting global warming to 2C Nature 4581158
Moise A Wilson L Grose M et al (2015) Evaluation of CMIP3 andCMIP5 models over the Australian region to inform confidence inprojections Australian Meteorological amp Oceanographic Journal(accepted)
Moss RH Edmonds JA Hibberd KA et al (2010) The next generation ofscenarios for climate change research and assessment Nature 463747ndash756 httpwwwnaturecomnaturejournalv463n7282suppinfonature08823_S1html
NakićenovićN Swart R (eds) (2000) Special report on emissions scenar-ios A special report of working group III of the intergovernmentalpanel on climate change Cambridge University Press Cambridgeand New York
NSW Government (2015) Farm innovation fund NSW Rural AssistanceAuthority Orange NSW
Peters GP Marland G Le Queacutereacute C Boden T Canadell JG Raupach MR(2012) Rapid growth in CO2 emissions after the 2008-2009 globalfinancial crisis nature Climate Change 22ndash4
Racsko J Schrader L (2012) Sunburn of apple fruit historical back-ground recent advances and future perspectives Crit Rev PlantSci 31455ndash504
Ritenour MA Kochhar S Schrader LE (2001) Characterisation of heatshock protein expression in apple peel under field and laboratoryconditions J Am Soc Hortic Sci 126(5)564ndash570
Rogelj JMeinshausenMKnutti R (2012) Global warming under old andnew scenarios using IPCC climate sensitivity range estimatesNature Cl im Change 2248ndash253 ht tp wwwna ture comnclimatejournalv2n4absnclimate1385htmlsupplementary-information
Schrader LE Zhang J Duplaga WK (2001) Two types of sunburn inapple caused by high fruit surface (peel) temperature Plant HealthProgress 101ndash5
Schrader L Sun J Felicetti D Seo J Jedlow L Zhang J (2003a)Stress-induced disorders Effects on apple fruit quality In Proceedings ofthe Washington Tree Fruit Postharvest Conference WenatcheeWashington USA 2003 p 7
Schrader LE Zhang J Sun J (2003b) Environmental stresses that causesunburn of apple Acta Hort 618397ndash405
Smit A (2007) Apple tree and fruit responses to shade netting MScDissertation University of Stellenbosch
Smit A Steyn WJ Wand SJE (2008) Effects of shade netting on gasexchange of blushed apple cultivars Acta Horticulturae 772
Smith I Chandler E (2010) Refining rainfall projections for the MurrayDarling Basin of south-East Australia-the effect of sampling modelresults based on performance Clim Chang 102377
Solomakhin A Blanke M (2010) The microclimate under colouredhailnets affects leaf and fruit temperature leaf anatomy vegetativeand reproductive growth as well as fruit colouration in apple AnnAppl Biol 156121ndash136
Thomson G McCaskill M Goodwin I Kearney G Lolicato S (2014)Potential impacts of rising global temperatures on Australiarsquos pomefruit industry and adaptation strategies N Z J Crop Hortic Sci 4221ndash30
Trewin B Smalley R (2013) Changes in extreme temperatures inAustralia 1910 to 2011 In 19th AMOS National ConferenceMelbourne 2013 pp 11ndash13
Van Vuuren DP Edmonds J Kainuma M et al (2011) The representativeconcentration pathways an overview Clim Chang 1095ndash31
Watterson IG McGregor JL Nguyen KC (2008) Changes in extremetemperatures of Australasian summer simulated by CCAM underglobal warming and the roles of winds and land-sea contrastsAustralian Meteorological and Oceanographic Journal 57195ndash212
Webb LB Watterson IG Bhend J Whetton PH (2013) Global climateanalogues for winegrowing regions in future periods projections oftemperature and precipitation Aust J Grape Wine Res 19331ndash341
Whetton P Hennessy K Clarke J McInnes K Kent D (2012) Use ofrepresentative climate futures in impact and adaptation assessmentClim Chang 115433ndash442 doi101007s10584-012-0471-z
Whetton PH Karoly D Watterson IG Webb L Drost F Kirono DMcInnes K (2013) Australiarsquos climate in a four degree world InChristoff P (ed) Four degrees of global warming Australia in a hotworld EarthscanRoutledge London pp 17ndash32
Wilby R Charles S Zorita E Timbal B Whetton P Mearns L (2004)Guidelines for use of climate scenarios developed from statisticaldownscaling methods
Wilby RL Troni J Biot Y Tedd L Hewitson BC Smith DM Sutton RT(2009) A review of climate risk information for adaptation and de-velopment planning Int J Climatol 291193ndash1215
Wuumlnsche JN Bowen J Ferguson I Woolf A McGhie T (2004) Sunburnon applesmdashcauses and control mechanisms XXVI internationalhorticultural congress key processes in the growth amp cropping ofDeciduous Fruit amp Nut Trees (ISHS) Acta Hortic 636631ndash636
Wuumlnsche JN Greer DH Palmer JW Lang A McGhie T (2001)Sunburn-the cost of a high light environment Acta Hortic 557349ndash356
Zhang J-G Liu Y-F Kochhar S Schrader LE (2003) Acclimation of fruitto high temperatures in relation to sunburn in gala apples 36(6)731ndash734 Sci Agric Sin 36(6)731ndash734
Int J Biometeorol
Western Australian Apple Netting Demonstration Site Susie Murphy White1 Rohan Prince2 and Lisa Starkie 3 1 Pomewest Manjimup WA 2 Department of Agriculture and Food Western Australia South Perth WA and 3 Department of Agriculture and Food Western Australia Manjimup WA
Disclaimer This publication may be of assistance to you but the State of Western Australia Pomewest and its employees do not guarantee that the publication is without flaw of any kind or is wholly appropriate for your particular purposes and therefore disclaims all liability for any error loss or other consequence which may arise from you relying on any information in this publication Acknowledgments This project was conducted as part of the apple and pear industry climate variability and climate change program and funded by Horticulture Innovation Australia using the apple and pear industry levy and matched funds from the Australian Government and the Department of Agriculture and Water Resources Collaborations with project partners from Victorian Department of Economic Development Jobs Transport and Resources University of Melbourne University of Tasmania Department of Agriculture and Fisheries Queensland and Department of Agriculture and Food Western Australia have contributed to the outcomes of these projects Additional financial support was provided by Department of Agriculture and Food Western Australia and the states Royalties for Regions to install the netting and evaluate the irrigation efficiency The authors would like to thank Maurie Ann Tim and Michelle Lyster of Lyster Orchards
Introduction
Climate predictions for the future include reduced winter chilling less rainfall and more extreme
high temperature incidents across the South West of Western Australia (Sudmeyer et al 2016 and
Reid 2010) Over tree netting (hail shade or bird netting) has been identified as a potential climate
change adaptation strategy due to the moderating effect of adverse climate conditions (Lolicato
2011) Netting reduces solar radiation and therefore a reduction in the amount of sun damaged
fruit The installation of over tree netting is one adaptation to climate change that can reduce the
impact of browning on apples (Darbyshire et al 2015) Protection from hail events can be achieved
by netting pome fruit orchards enabling the protection of fruit and trees (Middleton and McWaters
2002) The Pome fruit industry is already responding with significant investment in netting
infrastructure despite remaining practical questions on the use of hail netting particularly in warm
growing regions including the effect of different types of netting on temperature fruit quality and
yield (Bosco et al 2014 and Iglesias and Alegre 2006) The effectiveness of netting as a climate
change adaptation strategy in reducing fruit surface temperature under predicted climate change is
unknown
Data collected at the Western Australian netting demonstration site was set up to expand on
existing studies on the effects of netting on air temperature relative humidity wind and solar
radiation (Middleton and McWaters 2002 and Darbyshire et al 2015) The Western Australian
netting demonstration site aims to compare the effect of different coloured net on fruit yield quality
and environmental conditions under black and white net
The Western Australian netting demonstration site at Lyster Orchards Manjimup was constructed
in 2013 to demonstrate the benefits of netting under Western Australian conditions This
demonstration site was part of two nationally funded projects Crossing the Threshold Adaptation
tipping points for Australian Fruit Trees funded by Department of Agriculture and Water Resources
and Understanding Apple and Pear production systems in a changing climate funded by Horticulture
Innovation Australia
The site was set up as demonstration site with one replication of each treatment type 025 hectares
of black net 025 hectares white net and no net (figure 1) There were 10 random trees monitored
under each treatment from 2 rows
Figure 1 Western Australian netting demonstration site at Lyster Matijari Orchard
The aim of the project was to demonstrate the value of hail bird or shade netting as a means to
improve orchard productivity in high density production systems Particular attention was given to
assessing the impact of netting on fruit quality (sunburn wind burn and colour) The effects of black
and white netting on fruit quality (particularly colour) tree growth and chill accrual in the orchard
were compared to the no net treatment
Materials and Methods
The demonstration site Lysterrsquos Matijari Orchard is located 3km south of Manjimup on the South
West Highway Western Australia (3416oS and 11607oE) Half a hectare of a 12 ha commercial
Cripps Pink apple crop has been covered with 16mm quad netting to provide full exclusion to birds
plus shade and hail protection
Construction of the netting started in August 2013 and was completed by 28th October 2013 025ha
of black net provides a 23 percent reduction of both shade and UV radiation while 025ha of white
net provides a 20 percent reduction The white and black net area was compared to no net areas
The three treatment sites have been monitored from 8th November 2013 through to 29th April 2016
The environmental conditions were monitored during this period and the fruit quality and yield for
two harvest seasons Under each treatment 10 monitoring trees were selected 5 in each row (figure
2)
A fourth site with lsquoFrustarrsquo net was expected to be constructed after harvest 2014 but was not
completed during this project
The Cripps Pink apple trees planted in 2004 on a northsouth orientation are on M26 rootstock
trained on a central axis Trees are spaced at 1m with 4m between rows giving a planting density of
2500 trees per ha The soil type includes sandy clay loam with varying gravel content over medium
clay that starts from between 50 to 70cm depth The grower undertook all management of the trees
during the demonstration period
Figure 2 Netting treatment layout at Matijari 5 trees monitored in each row 10 trees monitored in each
block
Weather stations were located in the centre of row 4 (black net) 10 (white net) and 16 (no net)
Measurements taken every minute are averaged and reported each 15 minutes Weather
observations measured include solar radiation UVB radiation mid canopy air temperature relative
humidity wind speed and rainfall
The light interception was calculated by measuring Photosynthetically Active Radiation (PAR) on a
clear sky day in March 2014 and February 2015 using a hand held ceptometer Several
measurements were taken throughout each section at morning solar noon and afternoon to
measure the extent and density of the shade created by the tree
Row 1716
Row 1110 Row 54
No net rows 14 to 19
White net rows 8 to 13
Black net rows 1 to 7
Phenology assessments were performed to determine the beginning of green tip and full bloom
timing Regular visual assessments (Monday Wednesday Friday) were made from just prior to
budburst until flowering was completed Assessments were performed on a whole tree basis on only
spur and terminal buds and spur and terminal flower clusters assessed (axillary buds on one-year-old
pome fruit shoots were not included in the assessments) for the 10 Cripps Pink monitoring trees
under black white and no net treatments
Fruit Surface Temperature (FST) was measured using thermocouples inserted into the surface of 10
Cripps Pink apples Sensors were inserted into apples evenly spaced (upper mid and lower canopy)
on 4 trees in row 4 (black) 10 (white) and 16 (no net) Fruit Surface Temperature (FST) readings
were taken every 15 minutes from end of January until early March over 3 seasons 2014 2015 and
2016
Yield assessments were undertaken in 2014 and 2015 Each of the 10 monitoring trees from the
black white and no net treatments were strip pick approximately one week prior to the growers first
pick The number of apples from each tree was recorded then graded according to the Pink LadyTM
standards then a random sample of 40 was selected During the grading process the number of bird
damage apples and sun damaged apples were recorded from each monitoring tree The grower bin
numbers have been recorded to get the commercial pick data from all Cripps Pink rows under the
black white and no net treatments
From the sample of 40 apples from each of the monitoring trees the colour was assessed using the
Pink LadyTM Europe Ctifl colour charts (Centre technique interprofessionnel des fruits et legumes
(Ctifl) Pink LadyTM Eurofru colour charts) Each apple was given a score for background colour (F1-
F7) a score for blush intensity (R1-R8) and a percentage of blush intensity when the blush was over
R3
The maturity of the apples was tested from a sample of 10 apples randomly selected from the rows
monitored from early April until harvest With the final maturity test completed from the sample of
40 apples The maturity tests included starch conversion using the 1-6 scale (Portman and Sutton
2003) total soluble sugars measured using a refractometer flesh firmness measuring the pressure
from each side of the apple using a 11mm plunger and acid titration (McAlpine et al 1995)
Results and Discussion
Environmental
A summary of the winter chill conditions during the data collection years was compiled Flowering
phenology is influenced by winter chill accumulation with low chill years due to warm winter
conditions potentially delaying flowering Conversely warmer spring conditions may advance
flowering timing
Winter temperature conditions must be converted into chill portions For this project the Dynamic
chill model was used to calculate chill conditions under each net colour This model estimates winter
chill in chill portions and is currently the most robust and reliable chill model available (Luedeling
2012 and Darbyshire et al 2016) Winter chill was calculated from 1st March through until 31st
August 2014 and 2015 from hourly temperature readings collected in the orchard
There is very little difference in chill accumulation under black net white net or no net area (figure
3) The nets do not reduce the amount of chill accumulated as there is minimal impact on the
temperatures recorded under the black or white net or no net (table 1)
Use of netting to increase winter chill is unlikely to be an effective adaptation option however these
results do show that netting established for other management outcomes does not influence
winter chill accumulation in a meaningful way
Table 1 Mean monthly temperatures (degC) from March to October and total chill portions accumulated from 1st March until 31st August under black white and no net
Treatment Season Mar Apr May Jun Jul Aug Sep Oct CP
Black 2015 179 151 12 127 115 117 13 166 66
White 2015 179 151 121 128 117 119 129 166 63
No Net 2015 179 152 12 126 111 114 126 163 66
Black 2014 185 162 139 118 111 128 132 147 55
White 2014 186 163 139 118 112 129 132 147 54
No Net 2014 187 164 14 119 112 129 132 148 52
Figure 3 Chill accumulation under the black net white net and no net at Matijari in 2014 and 2015
Bud break and flowering data was collected from 10 trees under black white and no net rows
Observations were made three times a week from 20 August to 30 October 2014 and 2015 (Parkes
et al 2016) Whole tree assessments were made to determine the dates of bud break occurrence
of first flower and full bloom and to monitor progression of flowering (table 2) There is minimal
difference in flowering progression between the netted trees to the no net trees Rootstock shows a
greater difference with the MM106 trees under no net reaching bud break a week before M26 All
trees still came into full bloom at the same time in 2014 (figure 4)
Table 2 Summary of apple bud break and flowering data for 2014 at Matijari based on whole tree assessments Average dates of bud break (5 percent of buds at green tip or beyond) first flower and full bloom (80 percent of individual flowers open) for ten randomly selected trees
Cultivar Root Stock
Bud break First Flower Full Bloom
201415
No Net Cripps Pink M26 15914 26914 171014
White Net Cripps Pink M26 12914 22914 171014
Black Net Cripps Pink M26 15914 22914 171014
No Net Cripps Pink MM106 8914 15914 171014
201516
No Net Cripps Pink M26 18915 25915 151015
White Net Cripps Pink M26 16915 25915 151015
Black Net Cripps Pink M26 11915 25915 121015
No Net Cripps Pink MM106 23915 30915 141015
Figure 4 Flowering progression at Matijari for Cripps Pink apples on M26 rootstock under black white and no
net The first symbol represents green tip the second first flower and the last full bloom
Mean daily temperatures rarely varied more than 05 to 1 degree (figure 5) The netting led to small
increases in minimum temperatures and dampening of maximum temperatures This action is
similar to a cloud cover effect which reduces radiant heat loss overnight and reflects a portion of
incoming daytime radiation reducing maximum temperatures
Figure 5 Daily maximum (upper) average (centre) and minimum (lower) air temperatures for black white and
no net treatments for summer 2016
The daily maximum air temperature for the summer autumn months (December ndash April 2014 2015
and 2016) the relationship between the white and no net (figure 6) and black and no net (figure 7)
show no effect on air temperature There is a wide range of air temperatures from 14oC to 37oC
245 250 255 260 265 270 275 280 285 290 295 300
DoY (Sept - Nov)Green tip - First Flower - Full Bloom
Flowering Progression Matijari
2014 Black net
2015 Black net
2014 White net
2015 White net
2014 No net
2015 No net
0
5
10
15
20
25
30
35
40
1 January 2016 1 February 2016 1 March 2016
Air
Te
mp
era
ture
oC
Black max Black min Black avgWhite max White min White avgNo Net max No Net min No Net avg
over a 5 month period of the growing season that demonstrating there is no effect on air
temperature Under the nets feels cooler as the solar radiation lower
Figure 6 The relationship of maximum daily air temperature under no-net (ATno-net) and white net (ATwhite) for
Summer and Autumn 2014 to 2016 The fitted linear regression (solid line) was described by ATno-net = 1004 (plusmn
0006) ATwhite - 0081 (plusmn 0155) R2 = 099 n = 438
Figure 7 The relationship of maximum daily air temperature under no-net (ATno-net) and black net (ATblack) for
summer and autumn 2014 to 2016 The fitted linear regression (solid line) was described by ATno-net = 0996 (plusmn
0006) ATblack + 0379 (plusmn 0163) R2 = 098 n = 438
20
25
30
35
40
20 25 30 35 40
ATn
o-n
et(deg
C)
ATwhite (degC)
20
25
30
35
40
20 25 30 35 40
ATn
o-n
et(deg
C)
ATblack (degC)
The humidity under the white net during summer was highest and lowest in no net block (table 3)
The effect of high humidity was seen in the pest and disease management under the nets In the
first year after the nets were constructed woolly aphids were extremely bad under the nets there
was also a high percentage of apples with bitter pit European mites attacked under the nets in late
December 2015 almost defoliating the trees With pest and disease outbreaks can be more
common under netting it is a matter of monitoring more frequently as the conditions under the nets
are favourable to outbreaks
Table 3 Maximum daily relative humidity during summer autumn 2016
Black White No Net
Average 9285 9346 9192
Max 9844 9852 9774
Min 6683 6792 6284
SE 047 040 046
Average wind speeds are highest under the black net which is on the eastern side followed by the no
net which is on the western side (table 4) The white net is the central block between the black and
no net treatments The average wind speeds measured appear to demonstrate a landscape effect
where the eastern side open to the easterly winds off the dam and the white net is protected from
the prevailing winds The no net treatment is protected from the rest of the block of Fuji and Cripps
Pink apple trees Although the maximum wind speeds come from the prevailing westerly winds
Table 4 Average 15 minute wind speed (ms) May 2015 ndash April 2016
Black White No Net
Average 112 064 089
Max 497 602 746
Min 0 0 0
SE 0005 0004 0005
The no net area received the highest global radiation (figure 7) While not exactly the same as the
specifications the white net showed a 15 percent reduction and the black net 26 percent reduction
during January and February 2014 and 2015 Specifications are only given as a guide to how the nets
will perform and in this case the black net was close to specification and the white net slightly less
A similar trend is followed each summer for global radiation
Figure 7 Global radiation measured under the black net white net and no net rows for summer 2014
Figure 8 Global radiation measured under the black net white net and no net rows for summer 2015
Figure 9 Global radiation measured under the black net white net and no net rows for summer 2016
0
5
10
15
20
25
30
35
40
0 20 40 60 80 100
Glo
bal
rad
iati
on
(M
Jm
2 d
)
Julian Day
2014 No net
White net
Black net
0
5
10
15
20
25
30
35
40
0 20 40 60 80 100
Glo
bal
rad
iati
on
(M
Jm
2d
)
Julian Day
2015 No net
White net
Black net
0
5
10
15
20
25
30
35
40
0 20 40 60 80 100
Glo
bal
rad
iati
on
(M
Jm
2d
)
Julian Day
2016 No net
White net
Black net
The effect of the black white and no nets on the interception of light was measured annually as a
percentage of total above canopy Photosynthetically Active Radiation (PAR) using a ceptometer
Figure 10 shows the black net had a greater reduction in shade compared with the white net and no
net
Figure 10 Average photosynthetic radiation interception (PAR) of sky measured at morning noon and
afternoon on March 2014 and February 2015 in the black net white net and no net rows
While measurements reflected shade specification of the net the reduction in PAR was also
influenced by tree vigour or vegetative growth
The fractional PAR is the light intercepted by the tree canopy Tree vigour was higher under the
netted areas than outside the net as seen in the under canopy readings (figure 11)
0
500
1000
1500
2000
2500
3000
830 930 1030 1130 1230 1330 1430 1530
PA
R
mo
lm
2 s
Time
No Net 15 Black 15 White 15No Net 14 Black 14 White 14
Figure 11 Average percentage of fractional photosynthetic radiation interception (fPAR) measured at
morning noon and afternoon on 12 March 2014 in the black net white net and no net rows under tree
canopy
Quality
The fruit quality was a measured through the amount of sun damaged fruit bird damaged colour
development of the background and blush of the apple and maturity of the fruit Fruit surface
temperature was used to measure the amount of sunburn browning that could be expected under
netted conditions
Fruit surface temperature (FST) was higher in the no net area particularly during extreme heat
events in late summer and a higher percentage of sunburnt fruit was observed in the no net rows
25 percent in 2014 Less than half a percent of the apples were sun damaged that came from the
black and white net areas compared to the no net area
From the 2014 and 2016 fruit surface temperature (FST) recorded it is reasonable to think that
amount of solar radiation reaching the fruit surface should influence the FST The FST was measured
over the summer 2013-14 season (figure 12) and 2015-16 season (figure 13) Average FST was lower
under the white net than the black even though greater solar radiation was recorded under white
net
0
10
20
30
40
50
60
70
80
90
100
830 930 1030 1130 1230 1330 1430 1530
Pe
rce
nta
ge f
PA
R
TimeNo Net 15 Black 15 White 15
No Net 14 Black 14 White 14
Figure 12 Fruit surface temperature (FST) and air temperature measured in the black net white net and no
net rows at Matijari for February till mid-March 2014
The FST recordings from 2015 had some computer programming errors at the weather station and
have not been presented in this report
Figure 13 Fruit surface temperature (FST) and air temperature measured in the black net white net and no
net rows at Matijari for February till mid-March 2016
In 2016 the highest FST was 5961 oC in the no net block This was just one sensor in the outside
lower canopy on the western side sun damage was observed in this apple All other sensors in the
no net treatment were only a few degrees warmer than the black and white net
The daily maximum fruit surface temperature for February 2014 and 2016 the relationship between
the white and no net (figure 14) and black and no net (figure 15) show minimal effect on fruit
surface temperature The range of FST start at 20 oC for minimum daily FST and extend through to a
maximum of 48 oC with average maximum FST of 483 oC for black net 489 oC for white net and 596
oC for the no net over the 2 seasons of recording FST
0
10
20
30
40
50
60
4022014 18022014 4032014
Tem
pe
ratu
re o
CAir Temp Black net Air Temp White net Air Temp No net
FST Row 4 Black net FST Row 10 White net FST Row 16 No net
0
10
20
30
40
50
60
29012016 12022016 26022016
Tem
pe
ratu
re o
C
White Max FST No Net Max FST Black Max FST
Black Max Air Temp White Max Air Temp No Net Max Air Temp
Figure 14 The relationship of maximum daily fruit surface temperature under no-net (FSTno-net) and white net
(FSTwhite) for February 2014 and 2016
Figure 15 The relationship of maximum daily fruit surface temperature under no-net (FSTno-net) and black net
(FSTblack) for February 2014 and 2016
Background colour blush and maturity all contribute to the marketability and grade assigned to Pink
LadyTM apples While the results are presented separately it is important to consider them together
In 2015 at the time of strip picking the majority of apples had reached the ideal background colour
(figure 16) Seventy eight percent of fruit in the no net and black net blocks were between F3 to F4
suitable for optimum for long term storage Sixty eight percent of white net apples were between
F3 to F4 (table 5)
y = 11445x - 22008
20
30
40
50
60
70
20 30 40 50 60 70
FST
No
Ne
t (o
C)
FST White Net (oC)
y = 10337x + 15665
20
30
40
50
60
70
20 30 40 50 60 70
FST
No
Ne
t (o
C)
FST Black net (oC)
Background colour greater than F4 is undesirable for long term storage as the green background
begins to move toward yellow the fruit ripens Twenty two percent of the no net fruit were beyond
the ideal background storage colour in 2015 and 67 percent in 2014 of no net and 53 percent of the
white net
Figure 16 Background and blush colour of Cripps Pink apples at time of strip picking 2842015 black net
white net and no net random sample for maturity testing
Table 5 Background colour percentage of apples with F score for background colour from Ctifl standards for
Pink LadyTM Optimum for long term storage F 3-4
F Score lt3 Immature
F Score 3 -4 Optimum for long term
storage
F Score gt4 Optimum for fresh market
to over ripe
2014
Black 6 93 1
White 5 42 53
No Net 2 31 67
2015
Black 0 78 22
White 0 68 32
No Net 0 78 22
While optimum blush is between R4 and R5 for long term storage blush greater than R4 is preferred
in all fruit The no net treatment had better blush colour development with majority of apples at
greater than R4 (table 6)
Table 6 Blush intensity percentage of apples with R score for background colour from Ctifl standards for Pink
LadyTM Optimum for long term storage F 4-5
R score lt4 Immature
R Score 4-5 Optimum for long term
storage
R Score gt5 Optimum for fresh market
2014
Black 43 29 28
White 25 38 37
No Net 26 34 40
2015
Black 68 25 7
White 56 35 9
No Net 47 42 11
Black Net White Net No Net
Colour management was required under the nets to ensure the colour and maturity meet at the
same point A reflective surface can ensure colour develops with the blush colour meeting market
standards
Maturity tests were undertaken from a sample of 10 apples from each treatment after the strip pick
(table 7) The starch conversion guide for the maturity of Pink LadyTM Apples the 1-6 scoring system
was used to assess the apples At picking starch conversion scores were at 4 optimum for only short
to medium controlled atmosphere storage (figure 17) The Total Soluble Sugar (TSS) was generally
lower than the acceptable minimum standard of 13 percent in all areas testing at 11 percent after
the first strip pick The grower did 4 picks of the fruit to harvest the apples at the optimal time of
maturity and colour meeting enabling sugar percentage to rise to the required 13 percent The flesh
firmness was measured on opposite sides of the apple averaging 82kg in 2015 and 8kg in 2014 with
ideal firmness pressure greater than 61kg required
Table 7 Average maturity testing from the strip pick of a sample of 10 apples from each of the 10 monitoring
trees
Treatment Firmness kg
TSS ()
Starch Index
Acid ml
2014
Black 73 118 40 90
White 78 120 39 105
No Net 89 114 35 117
2015
Black 82 107 41 102
White 82 114 43 87
No Net 82 110 41 89
Figure 17 Starch test on 2842015 at the time of strip picking Showing average starch index gt4 suitable for
medium to short term storage
Black Net
White Net
No Net
Yield
Both the strip picked data from the 10 monitoring trees in each treatment (table 8) and the
commercial pick data from the remaining trees in the block (table 9) have been included to
demonstrate the difference in the assessment and importance of working on a commercial property
Forty apples were assessed for size and quality from the strip picked trees
Encouragingly average fruit diameters from the strip pick were all very similar between treatments
There was a slight difference in average fruit weight which when multiplied with the difference in
average number of fruit per tree contributed to the difference in extrapolated yield per hectare
Table 8 Average fruit diameter weight fruit per tree and yield of non-damaged fruit based on strip harvest
Treatment Harvest
Date
Average fruit diameter
(mm)
Standard Deviation of
diameter
Average single fruit weight (g)
Average fruit number per
tree
Extrapolated yield (tha)
2014
Black 2014 752014 716 035 1656 1212 710
White 2014 652014 718 035 1726 1356 749
No Net 2014 3042014 716 062 1724 742 424
2015
Black 2015 2942015 717 058 1702 1557 653
White 2015 2942015 720 061 1626 1433 574
No Net 2015 152015 712 038 1610 2189 900
The data from the grower harvest (table 6) based on bins picked from the remaining 390 trees per
treatment shows a slightly different story The commercial yields are lower for black net and no net
treatment and higher under the white net This is largely due to the increased number of trees per
treatment averaging out differences in fruit numbers and the staggered picking over several weeks
allowing for colour to guide the timing of harvest This meant fruit with less blush than desired may
have increased in size and weight before being picked by the growers with some fruit left on the
trees that were already over mature or not considered marketable
Table 9 Grower yield per treatment total tonnes from each treatment 2013 yield before netting installed
Treatment 2013 Harvest Date
2014 Harvest Date
2015 2016
Black 97 2152014 63 252015 80
White 113 2152014 77 252015 103
No net 103 2152014 70 252015 97
The amount of sun damaged apples strip picked was less than 1 percent of the fruit picked from the
10 monitoring trees The black net apples in 2014 had the lowest amount (69 percent) of the fruit
marketable and had the highest (79 percent) marketable fruit in 2015 The no net was very stable
across the two harvests with the white net showing decreases in marketability in 2015 due to shape
defects and under sized fruit (table 10)
Table 10 Percentage of fruit that was marketable nonmarketable or had sun damage
Treatment Marketable Non-marketable Sunburn
2014
Black 6915 3085 0101
White 78 22 025
No net 74 26 25
2015
Black 787 213 05
White 705 295 04
No Net 730 270 10
sunburn is a subset of non-marketable fruit
In both seasons the damage from birds was minimal with no large losses from birds recorded before
harvest in the rows under the black white or no net The apples strip picked from the monitoring
trees had less than 1 percent of the fruit damaged by birds There were no hail events during the
monitoring period and so no damage from hail could be assessed Other previous studies from
Queensland have shown netting to be effective in preventing hail damage (Middleton and McWaters
2002)
Conclusions
Winter chill accumulation was monitored during the three years of the project It was found that
netting black or white had minimal impact on chill accumulation This was also reflected in the mean
monthly temperature which only varied by about half to one degree There is a linear relationship
between the air temperature of the black and white net and again when the nets are compared to
the no net treatment block The impact on chill conditions under the net was also seen in the
flowering progression which was monitored under the nets in 2014 and 2015 In both years the
black white and no net trees monitored entered into the bud break and reached full bloom on the
same day or within days of each other
The environmental conditions under the nets were very similar although some slight differences can
be seen in the weather data recorded The humidity under the white net during summer was
highest and lowest in no net block The effect of high humidity was seen in the pest and disease
management under the nets In the first year after the nets were constructed woolly aphids were
extremely bad under the nets and a high percentage of apples had bitter pit European mites
attacked under the nets in late December 2015 almost defoliating the trees With pest and disease
outbreaks more common under netting it is a matter of monitoring more frequently as the
conditions under the nets are favourable to outbreaks Although pests and diseases are treatable
they just require prompt management
Solar radiation was the highest in no net followed by white and black net The fruit surface
temperatures recorded in the apples over the late summer period were higher in the no net apples
where the solar radiation was highest The average difference between no net and the netted was
around 3 degrees with the black and white nets only varying by one degree
Measuring the amount of shade under the tree canopy it was found that tree vigour influenced the
Photosynthetically Active Radiation Outside the canopy the PAR followed the netting specifications
rating of the netting black lowest then white and no net
The fruit size was very similar in the three treatments with slight differences in fruit weight and
number of apples per tree after the strip pick The grower yields were highest under the white net
where the fruit had been allowed to stay longer on the trees This was to ensure the apples gained
more colour Initial response in the first year yield was reduced due to bitter pit woolly aphid and
colour management
Colour management is required under the nets to ensure the colour and maturity meet at the same
point A reflective surface can ensure colour develops with the blush colour meeting market
standards
The netting has proven to be successful at the Western Australia netting demonstration site in
reducing the impact of birds on the fruit
reducing the fruit surface temperature
with minimal impact on winter chill and flowering progression
Table 11 Cripps Pink responses to Black White and No Net at Western Australian Netting Demonstration Site
Black Net White Net No Net
Dormancy Chill Accumulation No Effect No Effect No Effect Flowering Progression No Effect No Effect No Effect Environmental data Air Temperature No Effect No Effect No Effect Fruit Surface Temperature Highest Humidity Highest Max Lowest Min Solar Radiation Lowest Highest Wind average speed Highest Lowest Yield and Quality Grower Yield Lowest Highest Colour Best Background Best Blush Best Overall Maturity Highest Sugar Lowest Starch
References
Bosco L Bergamaschi H Cardoso L Paula V Marodin G and Nachtigall G (2014) Apple production and quality
when cultivated under anti-hail cover in Southern Brazil International Journal of Biometeorology 59773-782
Darbyshire R McClymont L and Goodwin I (2015) Sun damage risk of Royal Gala apple in fruit growing districts
in Australia New Zealand Journal of Crop and Horticultural science
Darbyshire R Pope K and Goodwin I 2016 An evaluation of the chill model to predict flowering time in
apple tree Scientia Horticulturae Vol 198 pages 142 ndash 149
Darbyshire R Webb L Goodwin I Barlow EWR (2013) Challenges in predicting climate change impacts on
pome fruit phenology International Journal of Biometeorology1-15 doi101007s00484-013-0705-4
Darbyshire R Webb L Goodwin I Barlow S (2011) Winter chilling trends for deciduous fruit trees in Australia
Agricultural and Forest Meteorology 1511074-1085 doi101016jagrformet201103010
Luedeling E (2012) Climate change impacts on winter chill for temperate fruit and nut production A review
Scientia Horticulturae 144218-229
Iglesias I Alegre S 2006 The effect of anti-hail nets on fruit protection radiation temperature quality and
profitability of lsquoMondial Gala apples Journal of Applied Horticulture 8 91ndash100
Lolicato S 2011 Sun protection for fruit a practical manual for preventing sunburn on fruitmdash2011 Victoria
Department of Primary Industries
McAlpine G Mackay A Sutton J Godley G Price A and Melvin-Carter E (1995) Pink Lady TM and Sundowner TM
Apple specifications Bulletin 4305 Department of Agriculture Western Australia
Middleton S and McWater A (2002) Hail Netting of Apple Orchards - Australian Experience The Compact
Fruit Tree Volume 35 number 2 2002
Portman T and Sutton J (2003) Starch Conversion guide for maturity of Pink Lady TM apples Department of
Agriculture Western Australia
Parkes H Tabing L McClymont L Wilkie JD Combret M 2016 Variation in the flowering phenology of
apple and pear in Australia Acta Horticulturae 1130 (8)55-61
Reid A (2010) Horticulture and climate change A preliminary analysis of climate and crop climatic information
in the south-west of Western Australia Department of Agriculture and Food Western Australia Perth
Sudmeyer R Edward A Fazakerley V Simpkin L amp Foster I 2016 lsquoClimate change impacts and adaptation
for agriculture in Western Australiarsquo Bulletin 4870 Department of Agriculture and Food Western Australia
Perth
Appendix
Presentations
Susie Murphy White 2015 Netting the Benefits of climate change APAL Speed Updating 2015
httpapalorgauresearch-development-extensionprojectsresearch-reviews (accessed
832016)
Materials produced
Posters
Murphy White S Prince R and Starkie L 2015 Is there a difference between Black or White
netting (Manjimup Rotary 2015 Warren Districts Show 2016)
Prince R Murphy White S and Starkie L 2015 Benefits of good irrigation in netted apple
orchards
Fact Sheets
Darbyshire R 2014 Winter Chill and Fruit Trees PICCC Research Fact Sheet wwwpicccorgau
Australian Fruit Grower magazine articles
Murphy White S June 2014 Netting the Benefits of a changing climate (Volume 8 Issue 5)
Prince R and Murphy White S October 2015 Netting Trial results in Western Australia (Volume
9 Issue 9)
Murphy White S Prince R and Starkie L December 2015 Black or White netting which is best
(Vol 9 Issue 11)
Web pages
httpsagricwagovaun4863
httpwwwpicccorgauresearchproject440
httpwwwhincomauprojectswinter-chill-and-fruit-trees
httpapalorgauresearch-development-extensionprojectsapple-pear-production-changing-
climate
1
Apple yield response to climate change and netting
Lexie McClymont1 Rebecca Darbyshire2 and Ian Goodwin1
1 Victorian Department of Economic Development Jobs Transport and Resources
2 New South Wales Department of Primary Industries
Summary
The effect of increased temperature on potential yield of early-season apples in northern Victoria
was investigated using the physiological model MaluSim (Lakso and Johnson 1990) Impacts of
netting on yield were also investigated using observed data and MaluSim With a climate change
scenario of a 2 degC increase in maximum and minimum air temperatures MaluSim predicted
increased fruit weights and yields when crop loads were low However at higher crop loads yield
potential decreased due to greater source limitations resulting from decreased daily photosynthesis
in response to high temperatures later in the season Overall the effects of a 2 degC increase in air
temperatures on potential yields of Royal Gala apples in northern Victoria were small (+13 to -16
tha depending on crop load and presence or absence of netting) Yield potential was higher for
non-netted trees than netted trees but observed yields were lower for non-netted trees This
highlighted the benefits of netting in reducing crop damage and the influence of orchard
management on actual yield
Evaluation of the performance of MaluSim in predicting yield of Royal Gala apples in north Victoria
supported use of this model for preliminary investigation of climate change impacts on yield
However limitations of use of the model for this purpose were identified and are briefly discussed in
this report Additionally long-term investigation of the impact of elevated CO2 on apple yield is
required to more accurately predict climate change impacts A greater understanding of the impact
of temperature shifts on fruit maturation colour development and phenology would further
improve predictions of yield under different climate scenarios
2
1 Introduction
Mean temperatures for coastal and inland Australian apple growing regions are predicted to rise by
07-09oC and 1-12oC respectively by 2030 (Putland et al 2011) Previous research has identified a
range of potential impacts of predicted climate change on the productivity and profitability of the
Australian apple and pear industries (Putland et al 2011 Darbyshire et al 2013) Climate change has
the potential to affect potential productivity of pome fruit trees through effects of changing
environmental conditions on the orchards net carbon exchange (difference between photosynthates
produced and expended for respiration Putland et al 2011 and references within) Netting provides
a climate adaptive option particularly for severe weather events such as extreme heat or hail and is
increasingly being installed by growers Industry has made significant investment in netting
infrastructure despite remaining practical questions on the use of hail netting particularly in warm
growing regions The reduction of solar radiation under netting may influence physiological
responses to climate change
An apple physiological model (MaluSim Lakso and Johnson 1990) has been used to understand the
effects of predicted climate change on net carbon exchange of apples and the upper limit of apple
production (yield potential) The aims of this study were to
- evaluate the model MaluSim with regard to prediction of apple yield under Australian
conditions and
- predict apple yield in netted and non-netted orchards under warmer climate conditions
using MaluSim
Use of the model lsquoMaluSimrsquo (Lakso and Johnson 1990) to predict apple yield was evaluated in
201213 for Royal Gala apples grown at a site in nothern Victoria This site was selected as two
adjacent blocks were netted and non-netted This provided an opportunity to evaluate MaluSim with
and without the adaptation option of over-tree netting Data was collected from 10 trees for both
netted and non-netted trees and measurements for each of the 10 trees were treated as repeat
observations Broader evaluation of the model was conducted by the PICCC project lsquoCrossing the
threshold adaptation tipping points for Australian fruit treesrsquo and reported by Darbyshire and
McClymont (2016)
A future climate scenario of a +2 degC increase in maximum and minimum daily temperatures was
investigated for netted and non-netted orchards and compared to a current season (201213) To
create the future scenario temperature data from 201213 was increased by + 2 degC 201213 solar
radiation values were unchanged and other tree parameters were standardised based on
observations or default parameters within the model Fruit weight predictions were compared to
predictions based on 201213 weather data Calculations of cumulative tree photosynthesis
respiration and dry weight accumulation and daily photosynthesis and fruit carbon demand and
supply were examined to better understand fruit weight and yield responses suggested by the
model
3
2 Methods and materials
21 Evaluation of lsquoMaluSimrsquo
The MaluSim model is a simplified dry matter production model that relies primarily on temperature
and radiation inputs to predict carbohydrate accumulation (Lakso and Johnson 1990 Lakso 1992
Lakso et al 2001 Lakso et al 2006) The model is written in STELLA and consequently can be easily
modified by users (Zibordi 2010) It has been shown to behave realistically in a number of apple
growing regions and in response to factors such as short-term low light (Lakso et al 2001) The
model operates on a daily time step at the tree scale and balances carbohydrate supply against
demand for a lsquostandardrsquo tree Parameters associated with a lsquostandardrsquo tree (eg dates of key
phenological events number of fruit per tree tree spacing length of growing season shoot and spur
numbers) can be modified in the model Required data are summarised in Table 1
Table 1 Required datasets for MaluSim calibration
Dataset
Model inputs Site parameters Tree and row spacing
Latitude
Weather
Maximum and minimum daily air temperature Total daily solar radiation
Phenology
Date of budburst and harvest
Vegetative growth
Shoot and spur number or canopy radiation interception
Reproductive sinks Fruit number per tree (at harvest) Model outputs Average fruit fresh weight
211 Study site and collection of required datasets for model evaluation
Royal Gala apple was selected for evaluation of MaluSim as paired netted and non-netted sites were
available allowing investigation of any impact of netting on potential yield
The study orchard was a Royal Gala block located at Geoff Thompsonrsquos North Shepparton orchard
The selected block was predominantly covered by permanent netting but five rows on the eastern
side of the block were uncovered Tree age variety rootstock and most management activities did
not differ between netted and non-netted trees Data for evaluation of MaluSim were collected
during the 201213 season
Table 2 Description of the study site
Site Season Latitude Longitude Tree and Row spacing
Training System
Row Orientation
Shepparton 201213 -3633 14540 15 x 48 m Central-leader NNW-SSE
4
Weather stations were located within the netted and non-netted orchard areas to measure daily
maximum and minimum air temperature (degC HMP155 Vaisala Oyj Vantaa Finland) and daily total
solar radiation (MJm-2day-1 SPN1 Delta T Devices Ltd Cambridge UK) Data were logged (dataTaker
DT80M Thermo Fisher Scientific Inc Yokohama Japan) from 15 December 2012 at 1 minute
intervals during January and at 10 minute intervals at other times of the year Meteorological data
between budburst and 15 December 2012 were interpolated from relationships established for
radiation and temperature over the remainder of the season between a nearby weather station and
the onsite stations
Budburst day-of-year (DOY = 248) was estimated based on date of flowering at the site and date of
budburst of Gala at a nearby orchard Fruit number at harvest and canopy radiation interception
data were collected from 10 trees for both netted and non-netted sites Measurements for each of
the 10 trees were treated as repeat observations Fruit were colour picked over a two week period
in late-January and early-February Fruit number and fruit weight were recorded at each pick and
the mid-date of harvest (31 January 2013) was used as the harvest day-of-year in MaluSim Light
interception measurements at full canopy prior to harvest for each tree were taken in January
2013 A ceptometer was used to measure light interception in the morning at midday and in the
afternoon Daily light interception was calculated by averaging the morning midday and afternoon
measurements
212 Comparison of observed and predicted fruit weight 201213 season
Two parameterisations of MaluSim were run for analyses Firstly the default MaluSim values were
used (Netted-Default and NonNetted-Default) and secondly alternate values for shoot and spur
numbers were used to adjust the modelled light interception values to be similar to measured values
(Netted-Light Interception and NonNetted-Light Interception) To set the adjusted shoot and spur
numbers MaluSim was rerun for each tree with progressive adjustments to shoot and spur numbers
(maintaining the ratio of shoots to spurs to match that of the default values) until the predicted light
interception was within plusmn 2 of the observed light interception For both parameterisations the
netted and non-netted data were evaluated independently as well as combined Use of the default
maximum fruit growth rate was considered to be a reasonable assumption for an initial investigation
of model performance as Empire and Royal Gala are both early season apple varieties
22 Predictions of apple yield under a warmer climate
A future scenario of a +2 degC increase in maximum and minimum daily temperatures was investigated
for netted and non-netted orchards by inputting solar radiation data and adjusted air temperature
data (+ 2 degC) from 201213 to MaluSim with other (site phenology and tree) parameters
standardised Site and phenology inputs were unchanged from those used in the initial model
evaluation (section 21) Default shoot and spur numbers (194 and 343 respectively) were used
Crop load (fruit number per tree) was varied from 25 to 450 to ensure any lack of response to
changed climate conditions was not due to sink-limited yield restrictions
Fruit weight predictions for 201213 were compared with predictions using the +2 degC scenario
Cumulative tree photosynthesis respiration and dry weight accumulation and daily photosynthesis
and fruit carbon demand and supply were examined to better understand fruit weight (yield)
responses suggested by the model
5
3 Results
31 Evaluation of lsquoMaluSimrsquo
The results using default parameters of MaluSim tended to overestimate fruit weight compared with
observed fruit weight (Figure 1A) Combining both the netted and non-netted results RMSE was 39 g
which equates to a 28 error in estimating mean fruit weight (Table 3) Using the default
parameters the predicted fruit weights for the Netted site were more accurate than those for the
Non-Netted site RMSE 14 and 36 g (9 and 29 of mean fruit weight) respectively (Table 3)
Figure 1 MaluSim predicted and observed mean fruit weight (fresh weight in grams) for netted and non-
netted trees in 20122013 A) MaluSim fruit weight predictions using default shoot and spur number inputs B)
MaluSIm fruit weight predictions using adjusted shoot and spur numbers
100
120
140
160
180
200
100 120 140 160 180 200
Mo
del
led
Fru
it W
eigh
t (g
)
Observed Fruit Weight (g)
A
Netted-Default
NonNetted-Default
100
120
140
160
180
200
100 120 140 160 180 200
Mo
del
led
Fru
it W
eigh
t (g
)
Observed Fruit Weight (g)
B
Netted-Light Interception
NonNetted-Light Interception
6
Table 3 Statistics of MaluSim predicted and observed fruit weight at Royal Gala Netted and NonNetted sites using default shoot and spur numbers (Default) and adjusted shoot and spur numbers to align light interception values in the model with measured values
Site Coefficient p-value R2 RMSE (g)
Netted-Default 020 047 14
NonNetted-Default 005 092 36
All-Default 013 035 39
Netted-Light Interception 098 lt001 046 8
NonNetted-Light Interception -008 086 21
All-Light Interception 039 002 NA 22
linear model intercept was not significant statistics are for analysis omitting the intercept
The model predictions using parameterised adjustments of shoot and spur numbers were improved
for both the netted and non-netted trees (Figure 1 and Table 3) For the combined data RMSE was
improved to 22 g or 16 of the mean fruit weight MaluSim better predicted fruit weight for the
netted trees with RMSE of 8 g or 5 of the mean fruit weight In comparison predictions for the
non-netted trees yield RMSE of 21 g or 17 of mean fruit weight
32 Predictions of apple yield under a warmer climate
Potential fruit weight was predicted using MaluSim for two main scenarios
1 201213 Measured daily maximum and minimum air temperatures from the 201213
season with a range of crop loads for netted and non-netted Royal Gala orchards in north
Victoria
2 + 2 degC Adjusted air temperatures (201213 temperatures + 2 degC) with a range of crop loads
for netted and non-netted Royal Gala orchards in north Victoria
321 Weather inputs
Total solar radiation was 20 lower under netting than in the non-netted site Daily maximum air
temperature varied slightly between netted and non-netted sites with a tendency on hot days for
maximum air temperature under netting to be less than the non-netted site Prior analysis of
weather data showed that air temperature was similar at netted and non-netted sites (Milestone
Report 2 McClymont and Goodwin 2013 McClymont et al 2013)
Table 4 Summary of measured weather inputs at netted and non-netted sites during the 201213 season Max
AT = maximum air temperature Min AT = minimum air temperature Daily Rad = total daily solar radiation
Netted Non-netted
Max AT (degC)
Min AT (degC)
Daily Rad (MJm-2day-1)
Max AT (degC) Min AT (degC)
Daily Rad (MJm-2day-1)
Ave (plusmn st dev) 265 (plusmn 67) 95 (plusmn 45) 197 (plusmn 67) 272 (plusmn 67) 95 (plusmn 45) 244 (plusmn 82)
Max 418 213 282 428 214 349
Min 130 -03 27 135 -03 34
7
322 MaluSim calculation of photosynthesis respiration and dry matter accumulation
MaluSim calculates daily photosynthesis based on canopy interception of daily solar radiation with
adjustments to photosynthetic rate dependent on air temperature (Darbyshire and McClymont
2016) Over the period from budburst to harvest similar leaf area and canopy light interception
were generated by MaluSim for each scenario with only slight differences between netted and non-
netted sites and no differences for differing crop loads (Table 5) Leaf area development was more
rapid under the + 2 degC scenario than the 201213 scenario (data not shown)
Table 5 Leaf area and canopy light interception predicted at harvest by MaluSim under 201213 (201213
season air temperature data) and + 2 degC (201213 season temperatures + 2 degC) scenarios at netted (Net) and
non-netted (NN) sites
Scenario Leaf area (m2) Light interception () Net NN Net NN
201213 109 110 419 420 + 2 degC 110 110 421 420
Over the budburst to harvest period cumulative photosynthesis was effectively unchanged by
increased air temperatures (+ 2 degC scenario) and was approximately 10 lower at the netted site
than the non-netted site (Table 6) However daily photosynthesis during the first 70 ndash 75 days of the
season was greater under the + 2 degC scenario than the 201213 scenario (Figure 2) After this time
daily photosynthesis tended to be greater under the 201213 scenario than the + 2 degC scenario
(Figure 2)
Table 6 Photosynthesis respiration and dry matter accumulation between budburst and harvest predicted by
MaluSim under 201213 (201213 season air temperature data) and + 2 degC (201213 season temperatures + 2
degC) scenarios at netted (Net) and non-netted (NN) sites with a range of crop loads
201213 + 2 degC
Crop load (fruittree)
Photosynthesis (g CO2)
Respiration (g CO2)
Dry Matter Photosynthesis (g CO2)
Respiration (g CO2)
Dry Matter
Net NN Net NN Net NN Net NN Net NN Net NN
25
12637 13875
2220 2291 1805 1846
12758 13867
2730 2793 1804 1843 50 2256 2328 2252 2302 2774 2840 2294 2338 75 2291 2365 2693 2758 2816 2885 2756 2821 100 2325 2402 3117 3201 2858 2929 3208 3289 150 2392 2472 3928 4047 2938 3014 4023 4139 207 2462 2549 4707 4882 3020 3104 4751 4937 250 2510 2601 5162 5403 3073 3163 5111 5371 300 2557 2655 5525 5846 3126 3221 5396 5708 350 2597 2702 5775 6157 3169 3272 5562 5923 450 2659 2776 6039 6506 3237 3352 5759 6182
Average number of fruit per tree observed in 20122013
8
Figure 2 Daily photosynthesis (g CO2day) between budburst and harvest under measured 201213
temperature conditions (201213) and with a 2 degC temperature increase (+2 degC) for A) non-netted (NN) and B)
netted (Net) Royal Gala trees
MaluSim calculates daily respiration by an exponential relationship dependent on air temperature
and scaling for the size of plant parts (Darbyshire and McClymont 2016) Over the budburst to
harvest period cumulative respiration was approximately 20 greater in response to increased air
temperature (+ 2 degC scenario Table 6) Respiration was slightly lower at the netted site than the
non-netted site for 201213 (3 ndash 4 lower depending on crop load) and + 2 degC (2 ndash 3 lower)
scenarios Respiration increased with increasing crop load due to increased total respiration by
greater numbers of fruit
Dry matter accumulation is a function of demand of plant parts for photosynthate and supply
(photosynthesis - respiration) Predictably dry matter accumulation increased with increasing fruit
number as more lsquosinksrsquo were able to utilise produced photosynthates Similarly greater
photosynthate production at non-netted sites (compared to netted sites) enabled greater dry matter
production despite slightly higher respiration Response of dry matter accumulation to increased air
temperatures varied depending on crop load Dry matter production was similar or higher under the
+ 2 degC scenario when fruit number was 250 or less and lower when fruit number was 300 or more
9
323 MaluSim prediction of fruit weight and daily balance of fruit CO2 supply and demand
MaluSim partitions dry matter between plant parts (shoots fruits wood and roots) The amount of
dry matter partitioned to fruits determines fruit weight Demand by the different plant parts for
photosynthates varies through the season For example demand by shoots for photosynthates
increases rapidly from the start of season peaking after approximately one month and then
decreasing until shoot growth ceases Whereas fruit demand for photosynthates is low early in the
season and increases steadily mid-season until a peak potential growth rate is reached prior to
harvest Under excess carbon supply circumstances each growing part is allocated its full demand of
dry matter When photosynthate supply is limited the growing parts compete for resources The
ldquostrengthrdquo of each growing part to compete differs with shoots the strongest followed by fruit wood
and roots Under limited supply conditions dry matter allocated to fruit is less than the demand to
grow at maximum potential
For the 201213 and +2 degC scenarios predictions of fruit weight fell as fruit number per tree
increased (Figure 3A) but yield (fruit weight x fruit number) continued to increase (Figure 3B) over
the range of modelled crop load (25 to 450 fruit per tree) For crop loads between 25 and 100 fruit
per tree there was little change in predicted fruit weight with increasing crop load suggesting that
yield was predominantly sink-limited (ie potential supply of photosynthate to fruit was greater than
fruit demand) At higher crop loads (150 fruit per tree and greater) fruit weight began to decline
steadily indicating that at least on some days fruit growth was source-limited (ie supply of
photosynthate was not meeting fruit demand) Yield began to plateau at a crop load of
approximately 300 fruit per tree For both 201213 and +2 degC scenarios predicted fruit weights and
yields were lower for the netted site than the non-netted (Figure 3) These differences were
primarily due to decreased radiation under netting leading to decreased photosynthate production
For netted and non-netted sites MaluSim predicted a slight increase in fruit weight and yield with a
+2 degC increase in temperature at low crop loads (lt 250 fruit per tree Figure 3) However at higher
crop loads increased temperatures (+2 degC scenario) resulted in reductions in predicted fruit weights
and yields (for the given crop load Figure 3) from more respiration The largest predicted fruit
weight was 186 g (+2 degC scenario without netting and a crop load of 25 fruit per tree) The smallest
predicted fruit weight was 100 g (+2 degC scenario under netting with a crop load of 450 fruit per tree)
The highest yield predicted was 713 tha (201213 scenario without netting and a crop load of 450
fruit per tree)
10
Figure 3 Predicted A) fruit weight and B) yield under measured 201213 temperature conditions (201213)
and with a 2 degC temperature increase (+2 degC) for netted (Net) and non-netted (NN) Royal Gala trees
At low crop loads trees were able to match supply of photosynthates to fruits with demand on most
days (Figure 4) resulting in high fruit weights At higher crop loads supply of photosynthates to
fruits did not match demand on a greater number of days (due to increases in respiration) Figure 4
demonstrates how timing of availability of photosynthates and fruit growth patterns could influence
fruit growth and yield responses to warmer climate scenarios Fruit demand for photosynthates was
predicted to be higher under the +2 degC scenario than the 201213 scenario Although total
production of photosynthates was similar under the +2 degC and 201213 scenarios timing of
availability differed More photosynthate was available under the +2 degC scenario (than the 201213
scenario) early in the season coincident with low fruit demand (Figures 2 and 4) Later in the season
(when fruit demand for photosynthate was greater) the 201213 scenario tended to have more
photosynthate available (Figures 2 and 4)
11
Figure 4 Effects of increased temperatures and crop load on daily A) fruit demand for photosynthates B)
supply of photosynthates to fruit and C) the balance between supply and demand for photosynthates
12
4 Discussion and Conclusions
41 Evaluation of lsquoMaluSimrsquo
The predictive ability of MaluSim for Royal Gala was found to be adequate if adjustments to shoot
and spur numbers in line with observed light interception values are made MaluSim better
predicted fruit weight for netted compared with non-netted trees MaluSim tended towards
overestimating fruit weight for the non-netted trees (points above the line Figure 1) This is more
likely the result of management intervention than differential model performance between netted
and non-netted systems
Potential causes of the modelled overestimate for the non-netted trees may be due to tree stress
andor crop load management Considering tree stress evaporative demand and hence tree water
requirement is higher in non-netted orchards than netted orchards Non-netted trees may have
suffered transient water stress if either irrigation volume or frequency of irrigation events did not
match tree water requirements Noting that the orchard manager did supply more water to the non-
netted trees it is not clear whether this was sufficient to avoid tree stress
Regarding crop load management the non-netted site was thinned later than the netted site This
means that less carbon was available for the early-season growth of retained fruit on the non-netted
trees compared with the netted trees This could have contributed to slower fruit growth rates early
in the season in the non-netted trees than the netted and subsequent lower than predicted fruit
weight at harvest
MaluSim was designed as a model to evaluate potential yield That is expected yield assuming ideal
conditions Given the model design for potential yield not field yield it is reasonable to expect the
model will have a tendency to overestimate fruit weight in many commercial orchard situations
Furthermore evaluation of the performance of MaluSim needs to consider possible measurement
errors (ie errors in model inputs and observed parameters) use of the model outside the range of
parameters for which it was constructed and failure of observations to meet particular model
assumptions At a practical level the programing language used for MaluSim (Stella) limits use of
MaluSim for investigation of potential climate impacts Ideally such investigations would involve
modelling many iterations of simulated weather data to account for natural variability in climate and
use of multiple climate change models At present MaluSim requires the user to lsquorunrsquo each scenario
individually and manually extract data summaries making such detailed investigations impractical
These issues are discussed in greater detail by Darbyshire and McClymont (2016) who concluded
that positive validation of MaluSim under Australian conditions was not achieved based on poor
prediction of yield by MaluSim for Royal Gala and Cripps Pink at multiple sites in Australia However
performance of MaluSim in predicting fruit weight of Royal Gala trees at the North Shepparton site
with adjustment for light interception and consideration of environment and management impacts
supported use of the model for preliminary investigation of influences of climate change on
potential yield
13
42 Predictions of apple yield under a warmer climate
The following points consider the main findings of modelling potential yield under a warmer climate
and factors that could modulate yield response or improve model performance are discussed
- The predicted impact of increased temperatures (+ 2 degC) on yield was minor under the
conditions modelled in this investigation (-16 to +13 tha) dependent on crop load and
presence or absence of netting)
- Given that growers are most likely operating in the medium to high crop load range yield of
Royal Gala apples in north Victoria would be expected to remain unchanged or fall slightly
under a warmer climate This outcome is similar to that projected by Stockle et al (2010) for
apples grown in Washington State USA Although the response predicted by Stockle et al
appeared to be based on earlier harvest date Whereas yield loss in our modelling resulted
from source limitations during the fruit growth period
- Yield could be maintained by increasing crop load However at high crop loads additional
yield loss may occur due to increased downgrading or cullage of small fruit as average fruit
weight falls Avoidance of such additional losses would require either adjustment of market
expectations regarding fruit size or improved crop management to decrease variability in
fruit size
- Predicted yields were lower under netting than without netting Observed yields did not
support this finding and in the medium to long-term netting would offer greater yield
potential because of decreased occurrence of sunburn and hail damage It is noted that
netting reduced solar radiation by approximately 20 at the north Shepparton site
Modelling a greater reduction in solar radiation (30 ) lowered the crop load at which fruit
weight and yield began to fall in response to increased air temperatures (data not shown)
- The modelling undertaken in this investigation assumed no changes to budburst or harvest
date with increased temperatures Darbyshire et al (2016) reported that that most pome
fruit growing regions in Australia will have similar flowering phenology timing for 2030 whilst
progressive delays are expected for 2050 and 2090 Maturity and harvest could occur earlier
(Warrington et al 1999 Stockle et al 2010) or later (Iglesias et al 2002) under a warmer
climate with associated decreases or increases in yield potential and any shift will be
influenced by both physiological impacts of higher temperatures and market expectations
regarding fruit maturity and colour Colour development would most likely be impaired by
higher temperatures (Faragher 1983 Iglesias et al 2000 2002)
- This investigation focussed on the period from budburst to harvest Later season effects
including timing of leaf fall should be considered Accumulation of reserves during the
period from harvest to leaf fall will affect tree performance in the following season (Greer et
al 2002)
- Royal Gala is an early season variety and is picked in late January Late season varieties may
experience greater negative impacts of increased temperatures on accumulation of
photosynthates during the fruit growth period and subsequently yield
- A uniform increase in air temperature is unlikely across the season Use of a climate model
that predicts within season variation in temperatures could further emphasise disparities
between photosynthate supply and demand at particular growth stages
- The modelling undertaken in this investigation did not consider possible effects of elevated
atmospheric carbon dioxide (CO2) concentrations To include this aspect greater
14
understanding of apple tree functioning under both higher CO2 levels and higher
temperatures need to be understood Stockle et al (2010) estimated changes in apple yield
under future climate change with and without an enhancing effect of CO2 Without an
enhancing effect of CO2 apple yields were projected to fall slightly Increases in yield were
expected when increased CO2 was incorporated in modelling However notably they
commented that ldquoprojections for apples are more uncertain as tree fruit models are less
developed and previous studies are not availablerdquo
15
References
Darbyshire R and McClymont L 2016 Technical Report Assessing the potential yield model
lsquoMalusimrsquo Milestone Report 63 PICCC Project 440 Crossing the threshold adaptation tipping
points for Australian fruit trees
Darbyshire R Webb L Goodwin I and Barlow S 2013 Impact of future warming on winter chilling
in Australia International Journal of Biometeorology 57355ndash366
Faragher JD 1983 Temperature regulation of anthocyanin accumulation in apple skin J
Experimental Botany 34(10) 1291ndash1298
Greer DH Wunsche JN and Halligan EA 2002 Influence of postharvest temperatures on leaf gas
exchange carbohydrate reserves and allocations subsequent budbreak and fruit yield of Braeburn
apple (Malus domestica) trees New Zealand J Crop Hort Sci 30 175ndash186
Iglesias I Graell J Echeverria G and Vendrell M 2000 Orchard cooling with overtree sprinkler
irrigation to improve fruit color of lsquoDeliciousrsquo apples HortScience 35(7) 1207ndash1208
Iglesias I Salvia J Torguet L and Cabuacutes C 2002 Orchard cooling with overtree microsprinkler
irrigation to improve fruit colour and quality of lsquoTopred Deliciousrsquo apples Scientia Hort 93 39ndash51
Lakso AN 1992 The simplified dry matter production model for apple estimation of canopy
photosynthesis in discontinuous canopies Acta Hort 313 45ndash51
Lakso AN Greene DW and Palmer JW 2006 Improvements on an apple carbon balance
model Acta Hort 707 57ndash61
Lakso A and Johnson RS 1990 A simplified dry matter production model for apple using automatic
programming simulation software Acta Hort 276 141ndash148
Lakso AN White MD and Tustin DS 2001 Simulation modeling of the effects of short and
long-term climatic variations on carbon balance of apple trees Acta Hort 557 473ndash480
Putland D Deuter P Hayman P Hetherington S Middleton S Nidumolu U Nimmo P Thomas D
Wilkie J Williams D 2011 The apple amp pear industryrsquos response to climate change and climate
variability a desktop study Growcom Fortitude Valley QLD Australia
McClymont L and Goodwin I 2013 Understanding apple and pear production systems in a changing
climate Milestone 2 Progress report on Vic phenology data and the effects of netting on fruit
temperature AP12029
McClymont L Goodwin I and Sessions W 2013 Net benefits ndash the sun protection factor in 2050
Australian Fruitgrower July 28ndash31
Stockle CO Nelson RL Higgins S Brunner J Grove G Boydston R Whiting M and Kruger C 2010
Assessment of climate change impact on Eastern Washington agriculture Clim Change 102(1-2)
77ndash102
Warrington IJ Fulton TA Halligan EA and de Silva HN 1999 Apple fruit growth and maturity are
affected by early season temperatures J Amer Soc Hort Sci 124(5) 468ndash477
Zibordi M 2010 Crop load control in apple via shading exploring the potential of carbon
unbalances to manage fruit growth and tree performance PhD dissertation Universitaacute di
Bologna
Grower workshops ndash AP12029 Apples and pears in a changing climate 1
Understanding apples and pears in a changing climate overview
of the grower workshops
Jenny Treeby Department of Economic Development Jobs Transport and Resources
September 2016
Grower Workshops 2013
Three technical working group meetings were conducted during August (Queensland)
September (South Australia) and October (Victoria) involving 32 growers industry
representatives and service providers The purpose of the technical working groups was to
present relevant local research outcomes as well as identifying gaps in growersrsquo knowledge
around climate change that could be addressed at a later date
The technical working group locations and members were identified using input from DAFWA
DAFF QLD DEPI VIC Lenswood Co-op and APAL South Australia was suggested by APAL
Each technical working group was based on an already existing group and the meetings
scheduled to coincide with other meetings to gain maximum feedback and avoid meeting
fatigue and poor attendance
Format and information provided was tailored to the specific needs of the group based on
input from local industry development officers APAL and the research organisations involved
The Queensland working group session was structured around a presentation of the current
project as well as a questionnaire and the South Australian and Victorian sessions started
with an interactive presentation about chill and in the case of Victoria fruit temperature
followed by a 60-90 minute facilitated QampA session
Outcomes from the workshops varied depending on the location
- The Queensland workshop discussions focussed on the impact of extreme weather with
most growers agreeing that climate change and climate variability impacted on their
orchards lack of rain rain at the wrong time erratic bloom poor colour development
and hail damage all scored highly in the survey
- In South Australia the discussions centred on inconsistency in the reporting of chill
depending on the model used chill hours chill units or chill portions The lack of
conversion factors was mentioned Only the dynamic model which uses chill portions
predicted a high chill season based on local data This was consistent with the short
intensive flowering observed Post-session feedback was positive with suggestions made
to repeat the working group next year albeit to a larger audience as part of the national
workshop series
- In Victoria discussions also focussed on chilling models and temperature thresholds that
lead to heat-related fruit damage in the Goulburn Valley Again informal feedback was
Grower workshops ndash AP12029 Apples and pears in a changing climate 2
positive with the suggestion made to communicate more results as they become
available through emails or workshops
Grower workshops 2014
Three workshops for apple and pear producers were conducted in production regions in
collaboration with apple and pear growersrsquo organisations during May (Victoria) July
(Queensland) and September (Western Australia) Nearly 50 producers industry
representatives and service providers participated The purpose of the workshops was to
present an outline of the project to present relevant local research outcomes and to review
the last season to identify production trends and issues share lessons learnt and identify
future trends and issues
Nearly 50 producers industry representatives and service providers participated in this round
of workshops The purpose of these workshops was to present research outcomes from the
first three years of the project such as the modelled predictions for the regions and relevant
local climate change impacts as well as adaptation strategies and to seek feedback on the
past season perceived climate change risks and the project itself Each interactive workshop
was tailored to the individual needs of the three targeted groups through either general
presentations on climate change research intensive training in the Climate Change Risk
Management Matrix andor site specific presentations on modelled chill requirements and
heat damage projections
Additionally in order to reach a much wider pome fruit audience project outcomes were
highlighted at the 2015 National Horticulture Convention of APAL and AUSVEG where team
members across all participating research organisations were present at the Horticulture
Centre of Excellence stand to answer growersrsquo questions and get feedback on the project
Grower workshops 2015
Three workshops were held in apple and pear production regions to communicate up-to-date
research outcomes such as the model predictions from the last three years to industry in a
consistent manner as well as gathering information about the past season perceived climate
change risks and feedback on the project to 48 growers
Each workshop was held in conjunction with or as part of an industry forummeetingtour to
attract as many growers as possible and to avoid meeting fatigue
The workshops were held in Applethorpe (QLD) in conjunction with the Perth Hills Orchard
Improvement Group during their QLD study tour in July as a stand-alone Climate Change
Risk Management Matrix session with QLD growers in Applethorpe in July and a climate
change workshop in Bilpin (NSW) in September
Grower workshops ndash AP12029 Apples and pears in a changing climate 3
Seventeen growers from the Perth Hills Orchard Improvement Group visited the Applethorpe
Research Station as part of their QLD study tour As the central part of their half day tour of
the research station a climate change workshop event was held to discuss some of the
outcomes from current research and in particular some of the issues facing the growers in the
Perth Hills district This region was not part of the WA grower workshop event held in Manjimup
in 2014
During the workshop presentations were made by Heidi Parkes Peter Nimmo and Allan
McWaters about the climate change research project currently underway including the modelled
predictions management of QFF (one concern under a changed climate) and new apple
varieties better suited to different disease and climate pressures
The Climate Change Risk Management Matrix is a tool developed by DAF QLD to address
uncertainty by identifying the impacts risk and vulnerability associated with climate change
and adaptive responses Identifying and analysing risks and opportunities using this risk
management approach can help to plan responses to climate variability and climate change
and thus enable growers to be proactive and more effective in adapting to future uncertainty
This tool has been adapted to be used not only in grains and meat and wool production but
also in horticulture
As New South Wales has not been included in former National Roadshow tours and based on
interest shown from the Sydney Basin area Kevin Dodds from NSW DPI and an interested
grower in Bilpin Bill Shields were contacted and a workshop organised The interactive
workshop on a growerrsquos property with about 25 participants entailed a tailored winter chill
presentation by Rebecca Darbyshire (The University of Melbourne) introduction to climate
change impacts on pome fruit and research outcomes from the project such as the latest
dormancy breaker research from QLD by Heidi Parkes as well as modelled predictions for the
region plus a field walk The session was organised facilitated and evaluated by Kevin Dodds
(NSW DPI) and Jenny Treeby (DEDJTR VIC) In the evaluation growers pinpointed earlier
bud burst flowering and maturity as well as sunburn as their main climate change related
challenges The workshop gave them a better understanding of the complexity of factors
involved in budburst and flowering and the chill portions calculator was seen as an excellent
toolincentive to collect and utilise their own data better
In order to reach a much wider pome fruit audience project outcomes were displayed at the
Horticulture Centre of Excellence stand at the 2015 National Horticulture Convention A
poster six state specific chill fliers using the chill portions model the HIN (wwwhincomau)
project webpage and the chill calculator were used as a static display Additionally time was
made to meet the project researchers at the stand during program breaks an option which
was taken up by quite a few growers who felt that this was a great opportunity to have a
chat with a scientist
Grower workshops ndash AP12029 Apples and pears in a changing climate 4
Lessons learnt
1 Having a core team responsible for communication (Heidi Parkes DAF QLD) Susie
Murphy-White (DAFF WA) Rebecca Darbyshire (UoM) and Jenny Treeby (DEDJTR
VIC) ensured timely relevant and consistent information was being made available to
growers at the workshops and the APAL conference This also emphasised a multi-
state approach (including New South Wales) and added importance to the project
outputs and resulted in messages such as in New South Wales where the presenters
were thanked for their presentations and the effort made to come to that location
2 Presenting locally relevant data using model predictions established within the
projects by researchers resulted in the grower audience being engaged and feeling
confident to ask questions and provide feedback and lessons learnt in their orchard
3 Utilising well established grower groups such as in Queensland and New South Wales
as well as local well respected extension officers (Front Line Advisors) such as Clinton
McGrath (DAF QLD) and Kevin Dodds (NSW DPI) ensured ease of facilitation
4 Evaluation of workshops is still suffering from low return rates of around 50 of even
short evaluation forms possibly due to a lack of understanding of the importance of
this form of feedback Interactive keypad technology as employed in the last round
seems to have had a better return rate (possibly due to novelty factor) and will be
contemplated for further projects
5 Knowledge gaps identified as a result of these workshops include
varietal chill requirements for existing and new varieties
lack of understanding of the difference between chill hours units and portions
and the use of chill portions as the most accurate measure of winter chill available
adaptation strategies to heat stress
does soil temperature influence endo and or ecto dormancy
do phenology models based on meteorological data adequately represent buds
within a tree
is the current knowledge of pome fruit physiology extensive enough to be able to
accurately predict winter chill accumulation processes
there is a strong focus on the potential impact of extreme events on the industry
under future climate scenarios with less understanding about the potential
impacts of more subtle increases in temperature
need for more accurate in-season and longer term climate forecasting to enable
growers to take actions that reduce climate risk
Resources
httpwwwhincomauprojectsapple-and-pear-production-in-a-changing-climate
Grower workshops ndash AP12029 Apples and pears in a changing climate 5
httpwwwhincomauprojectswinter-chill-and-fruit-trees
regional-chill-accumulation-victoria
regional-chill-accumulation-queensland
regional-chill-accumulation-for-new-south-wales
regional-chill-accumulation-for-south-australia
regional-chill-accumulation-for-tasmania
regional-chill-accumulation-for-western-australia
Blogs
httpwwwhincomauprojectsapple-and-pear-production-in-a-changing-climateexplore-
your-regional-climate
- AP12029 cover sheet
-

2
Contents
Summary 5
Keywords 6
Key personnel 6
Introduction 7
Project objectives 7
General methodology 9
Research methodology 9
Development and extension methodology 11
Outputs 13
Grower publications 13
Grower workshops 13
Websites and tools 13
Technical working group meetings 13
Industry surveys 14
Industry articles 14
Industry conferences 15
Stakeholder and grower engagement 16
Reports 17
Media items 17
Project web pages factsheets and online information 18
Scientific conferences 19
Datasets 19
Post-graduate student projects 19
Outcomes 20
Historical climate trends and future scenarios 20
Impacts of warming autumn winter and spring temperatures on flowering and options for adaptation
24
Impacts of increased frequency of extreme heat days on fruit quality and options for adaptation 32
3
Impacts of warming temperatures on yield 37
Communication development and extension 37
Evaluation and Discussion 39
Measuring project impact 39
Effectiveness of project activities in delivering project outputs and achieving intended outcomes 40
Feedback on activities and quality and usefulness of project outputs 41
Key learnings 42
Recommendations 46
Industry 46
Extension and communications 47
Scientific 47
Scientific Refereed Publications 50
Intellectual PropertyCommercialisation 51
Acknowledgements 52
Appendices 53
References 54
Table of figures
Figure 1 Research sites were located in Applethorpe (Qld) Shepparton (Vic) Manjimup (WA) and
Huonville (Tas) Orange (NSW) and Mt Barker (SA) were included in the climate data analysis 12
Figure 2 Annual anomaly in accumulation of chill portions (1 Mar to 31 Aug) Anomalies are the
difference between the yearly value and a base period of 1981 to 2010 The black line is an 11-year
moving average 21
Figure 3 Annual anomaly in average number of days where maximum temperature exceeds 35deg C
Anomalies are expressed as the difference between the yearly value and a base period of 1981 to 2010
The black line is an 11-year moving average 22
Figure 4 Chill accumulation in Shepparton Applethorpe and Manjimup in 2012 to 2015 Number in
brackets is the total chill portions received up to 31 Aug 24
Figure 5 Green tip (green) and full bloom (pink) dates for apple cultivars in Applethorpe Shepparton and
Manjimup Data is the average of observations from 2012 to 2015 with bars indicating the confidence
interval 25
Figure 6 The Chill-Overlap Model for flowering in apple Cr is minimum chill required for flowering Co is
4
the maximum additional chill that will reduce the heat requirement Hr is the heat required when Co chill
is accumulated and Ho is the maximum possible heat requirement for flowering (Redrawn from
Darbyshire et al 2016) 28
Figure 7 Variable bud burst and flowering in Cripps Pink Manjimup spring 2014 30
Figure 8 Green tip first flower and full bloom in Gala apples treated with and without dormancy
breaking sprays Dormexreg Waikenreg and Erger in Huonville Applethorpe and Manjimup in 2015 31
Figure 9 Fruit surface temperature (degC) recordings and related air temperatures (degC) Necrosis and
browning fruit surface temperature thresholds represent 52 and 478 degC respectively Figure sourced
from Darbyshire et al 2015 33
Figure 10 Western Australian netting demonstration site at the Lyster Matijari Orchard Manjimup 36
Figure 11 Fruit surface temperature (FST) and air temperature measured in the black net white net and
no net rows at the Lyster Matijari orchard (Manjimup) from February to mid-March 2014 36
Table of tables
Table 1 Average chill portions (1 Mar to 31 Aug) for 2030 and 2050 using a minimum to medium
(RCP45) and worst (RCP85) case scenario The average is of 30 years with the lowest and highest chill
portions in brackets 23
Table 2 Chilling requirements of apple cultivars and a crab apple polliniser cultivar measured in chill
portions chill units and chill hours 27
Table 3 Average date of full bloom for lsquoCripps Pinkrsquo apple in 2030 and 2050 using a minimum to medium
(RCP45) and worst case scenario (RCP85) modelling approach 29
Table 4 Distribution of potential damage days in January for sites in Australiarsquos growing regions for 10th
50th and 90th percentiles of data Table sourced from Darbyshire et al 2015 33
Table 5 Average sunburn browning risk (percentage of days in the January to February period) for lsquoRoyal
Galarsquo apples grown at sites across Australia with and without netting 35
Table 6 Barriers to communication and extension around climate change adaptation 41
5
Summary The objective of this project was to reduce the vulnerability of the Australian apple and pear industry to
climate change by investigating the potential impacts of a changing climate on winter chill flowering
fruit sunburn and yield exploring the effects of adaptation such as netting and dormancy-breaking
products and developing and extending appropriate adaptive responses to industry The project used a
broad range of research and technology transfer activities encompassing field observational data
collection controlled environment experimentation biophysical modelling website development
communication and extension
Australia has undergone a consistent warming trend since 1910 however analysis of historical climates
undertaken in this project indicated that the experience of climate change has been different in each
pome fruit growing region For example milder pome fruit growing regions of Australia have experienced
a decline in annual winter chill accumulation since 1968 while the colder regions of Huonville and Orange
have not changed In modelling studies of future climate scenarios warmer locations were projected to
experience a reduction in winter chill of more than 20 by 2050 with a decline of less than 10 to 14
projected for the coldest production areas over the same period
Flowering observations from 2012 to 2015 indicated that low winter chill in Manjimup was associated with
greater variability in flowering dates between seasons cultivars and individual trees and irregular and protracted flowering across most apple cultivars relative to Applethorpe and Shepparton The variable
pattern of flowering observed in Manjimup was likely the result of mild winter conditions and inadequate
chilling for some cultivars Use of climate analogues and modelling analyses suggest that milder winter
growing regions of Australia are likely to experience symptoms of inadequate chilling with increasing
frequency in future years
Projections from the chill-overlap model for timing of full bloom in lsquoCripps Pinkrsquo apple in 2030 and 2050
projected an earlier full bloom date on average at high chill locations in 2050 and a later full bloom date
at the milder winter locations by 2030 with flowering dates delayed by more than a week in 2050 Trials
with dormancy-breaking sprays demonstrated that they are likely to be a viable adaptation tool for some
cultivars in lower winter chill years but matching cultivars with climate is the preferred adaptation option
Results from the climate modelling showed that by 2030 all pome fruit growing regions will experience
an increase in the average number of extreme heat days during the summer growing season Netting will
reduce the risk of sunburn damage as air temperature thresholds for damage of fruit under netting were
shown to be higher than thresholds for fruit without netting Findings from the Western Australian netting
demonstration site showed little difference in air temperature conditions winter chill or flowering dates
under the white netted black netted and non-netted orchard blocks Black and white netting were
equally effective in reducing fruit surface temperatures over the late summer period compared with the
no net apples
The project highlighted the need for detailed information to enable growers to match apple and pear
cultivars with suitable growing climates including matching chilling requirements with winter chill and
heat tolerance with summer temperatures Comprehensive guidelines on orchard practices for managing
extreme heat (including tree canopy structure use of evaporative cooling netting types plant growth
regulators and stress reduction chemicals) are also recommended
It is clear from the project outcomes that climate change will add significant variability into the pome fruit
production system with respect to flowering and fruit quality Australian growers are used to dealing with
some level of climate variability and it seems likely that impacts on flowering and fruit quality will be
within the range of grower experience up to around 2030 but that by 2050 growers will be operating
outside of current experience This will present challenges for the Australian industry in the consistency of
supply and in maintenance of the uniform orchard blocks
A series of recommendations were developed along with a list of significant research gaps to assist the
Australian apple and pear industry reduce the risks associated with climate variability and climate change
6
Keywords Climate change scenarios climate change impact climate change adaptation dormancy winter chill
flowering extreme heat sunburn browning netting
Key personnel
Department of Agriculture and Fisheries Queensland
Heidi Parkes (project leader) Neil White Osi Tabing Peter Nimmo Allan McWaters John Wilkie and
Clinton McGrath
Department of Economic Development Jobs Transport and Resources Victoria
Ian Goodwin Jenny Treeby Lexie McClymont and Susanna Turpin
Pomewest Western Australia
Susie MurphyWhite
Department of Agriculture and Food Western Australia
Lisa Starkie and Martine Combret
Tasmanian Institute of Agriculture University of Tasmania
Sally Bound
University of Melbourne
Rebecca Darbyshire (leader of the Federal Department of Agriculture funded project lsquoCrossing the
threshold adaptation tipping points for Australian fruit treesrsquo and project collaborator)
7
Introduction Australiarsquos climate has warmed since 1910 and is likely to continue warming with more hot days and
fewer cold days expected in the future (State of the climate 2016) Research has broadly identified a
range of potential impacts of climate change on the productivity and profitability of the Australian apple
and pear industry including inadequate winter chilling increased fruit sunburn and changes to the upper
limit of pome fruit productivity (Darbyshire et al 2013b Putland et al 2011) However the nature and
timing of these potential impacts in different growing regions across Australia remains unclear
Understanding climate change impacts is essential for the timely implementation of appropriate
adaptation strategies (Cobon et al 2009)
Future changes in climate are predicted to result in reduced winter chilling in many apple and pear
growing regions of Australia (Darbyshire et al 2013b Hennessy et al 1995) It is not yet clear what the
impact of this will be on the timing and quality of bud dormancy release and flowering in commercial
pome fruit cultivars and therefore the potential impacts on productivity Advancement in flowering with
increased historical temperature has been observed in temperate fruit trees globally (Legave et al
2013) however effects of recent warming on flowering in Australian pome trees are less obvious
(Darbyshire et al 2013a) Options for adaptation to lower winter chill include appropriate cultivar
selection and the use of plant growth regulators however current understanding around cultivar chilling
requirements and the use of dormancy-breaking sprays to compensate for a lack of winter chill is poor
The risk of fruit sunburn damage is likely to increase under future climates and associated rising summer
temperatures Predictions regarding changes to sun damage risk and evaluation of adaptation options are
therefore important for future planning In Australia apple growers currently estimate typical losses to
vary from 6 to 30 depending on season and fruit cultivar (Lolicato 2011)
Netting has been identified as a potential climate change adaptation strategy to reduce fruit exposure to
solar radiation and hence reduce sunburn damage while also providing protection from hail events
Practical questions remain on the use of hail netting particularly in warm growing regions including the
effect of different types of netting (weave density and colour) on temperature fruit quality and yield The
effectiveness of netting as an adaptation strategy to reduce the risk of sunburn browning under predicted
climate change is also unknown
Project objectives The broad objective was to reduce the vulnerability of the Australian apple and pear industry to climate
change through 1) investigation of the overarching research question lsquoWhat are the potential impacts of
a changing climate on apple and pear production in Australia and how can the industry adapt to minimize
the risksrsquo and 2) developing and extending appropriate adaptive responses to industry
Specific objectives for the research component of the project were to
1 Develop climate change scenarios for pome fruit growing regions of Australia in 2030 and 2050
including the likely impact of climate change on winter chill and extreme heat
2 Understand how changes in autumn winter and spring temperatures might impact the timing
and quality of flowering in cultivars of apple and pear
8
3 Identify adaptations to manage any negative effects of climate change on flowering
4 Understand how changes in the frequency of extreme heat days might impact on the incidence of
sunburn in pome fruit and the effectiveness of netting as an adaptation strategy
5 Understand how different colours of netting impact on the orchard environment fruit yield and
quality
6 Understand how the changing climate might impact the yield potential of apples
The development and extension components of the project were targeted at the Australian apple and
pear industry Target groups were apple and pear growers industry consultants Apple and Pear Australia
Limited (APAL) and temperate fruit tree researchers Specific objectives of this component were to
1 Facilitate greater understanding of how the climate is likely to change by 2030 and 2050 in apple
and pear growing regions of Australia how this might impact on apple and pear production and
potential adaptation strategies to reduce the associated risks
2 Increase knowledge and skills to enable informed decision-making around climate change
adaptation and orchard investment and planning based on scientific evidence
3 Build a connected and collaborative approach between research partners funding bodies
industry and growers around managing and adapting to climate change
9
General methodology The objectives were investigated through a broad range of research and technology transfer activities
encompassing field observational data collection controlled environment experimentation biophysical
modelling website development written and oral communication and extension The project combined
research of immediate adaptive responses to current climate risks with long-term climate change impacts
and adaptation The general methodological approach and associated activities undertaken for each of
the stated project objectives are described in this section Details of specific methods are given in the
appropriate appendices as indicated in the text
Research methodology
The approach was to validate and refine models of flowering time fruit surface temperature and yield
potential and use them in conjunction with regional climate projections to model the effects of the
changing climate on apple and pear production systems and the effectiveness of specific adaptation
strategies Climate analogues were also investigated as an alternative approach to understanding climate
change impacts and adaptation
1 Develop climate change scenarios for pome fruit growing regions of Australia in 2030 and
2050 including the likely impact of climate change on winter chill and extreme heat
Future climate scenarios were constructed for two representative concentration pathways (RCPs) RCP45
(minimum to medium case scenario) and RCP85 (worst case scenario) to represent a plausible range of
future climates (Appendix 1) RCPs are greenhouse gas concentration trajectories adopted by the
Intergovernmental Panel on Climate Change in its fifth Assessment Report in 2014 (a detailed description
of these is given in Appendix 1) Scenarios were developed for 2030 and 2050 to support the mid to long-
term orchard decision-making process Trees planted in 2017 will be in their 13th leaf in 2030 the height
of production and therefore planting decisions made now will impact orchard profitability in 2030
Climate projections were not made beyond 2050 due the high degree of climate uncertainty associated
with long-term projections
Climate scenarios were expressed in terms of relevant horticultural metrics (chill portions and number of
sunburn browning risk days) rather than simply as mean temperature changes to enable better
understanding of how warming temperatures might impact pome fruit production
Winter chill was calculated in chill portions using the Dynamic Model (Erez et al 1990 Fishman et al
1987) This is the current lsquobest-practicersquo model and has been shown to perform better than other models
for calculating winter chill particularly in mild winter climates such as Australia (Luedeling et al 2011)
2 Understand how changes in winter and spring temperatures might impact the timing and
quality of flowering in cultivars of apple and pear
Detailed baseline data sets for temperature bud burst and flowering were collected from three
climatically distinct pome fruit growing regions of Australia (Applethorpe Queensland Manjimup
Western Australia Shepparton Victoria Figure 1) for apple and pear cultivars and their pollinisers from
2012 to 2015 Phenology observation and collection methodology was standardised across locations
making this dataset unique in Australia
The data set was used to assess the variation in bud burst and flowering time across locations seasons
10
and cultivars (Appendix 2) and to validate a phenology model (chill overlap model (Darbyshire et al
2016)) for prediction of flowering time in apple now and under future climates (Appendix 1)
Climate analogue analysis involves a detailed comparison between locations where the current climate of
one location is similar to the projected future climate of the location of interest This approach was
investigated using Stanthorpe as a case study to predict impacts of climate change on pome fruit
flowering in Stanthorpe and to identify possible methods for adaptation (Appendix 3)
3 Identify adaptations to manage any negative effects of climate change on flowering
Forced bud experiments using controlled environment conditions were undertaken to determine cultivar
chilling requirements for use by industry in selection of suitable cultivars for different winter chill
climates Methods for collecting bud burst and flowering records were developed for growers to use for
assessing cultivar performance in their local climate (Treeby et al 2017a)
A one-year trial was conducted in three locations (Applethorpe Queensland Manjimup Western
Australia Huonville Tasmania) to determine the efficacy of using dormancy-breaking sprays in Gala as
an adaptation to low winter chill years (Appendix 4)
Potential adaptations were also identified through the capture of grower experiences at national grower
workshops and industry conferences
4 Understand how changes in the frequency of extreme heat days might impact on the incidence
of sunburn in pome fruit and the effectiveness of netting as an adaptation strategy
Two methodological approaches were taken using weather and fruit surface temperature data collected
from two adjacent lsquoRoyal Galarsquo sites in Shepparton Victoria one netted and one non-netted site The first
approach was to determine minimum air temperature thresholds for lsquoRoyal Galarsquo apples grown with and
without net with potential to lead to sunburn damage under current climates (Appendix 5) Once
established these minimum air temperature thresholds were used to investigate the frequency of days
exceeding these threshold air temperatures in current and future climates The future sunburn risk and
the effectiveness of netting in reducing this risk was determined for growing locations around Australia
for 2030 and 2050 (Appendix 1 and 7)
The second approach was to validate the thermodynamic Smart-Sinclair model for prediction of fruit
surface temperature (Appendix 6)
5 Understand how different colours of netting impact on the orchard environment fruit yield
and quality
A netting demonstration site was established over a block of lsquoCripps Pinkrsquo trees in Manjimup Western
Australia to expand on results from existing studies on the effects of netting on air temperature relative
humidity wind and solar radiation (Darbyshire et al 2015 Middleton et al 2002) and to compare the
effects of black and white net on the orchard environment flowering fruit yield and quality (Appendix 8)
6 Understand how the changing climate might impact the yield potential of apples
An apple physiological model MaluSim (Lakso et al 1990) was used to understand the effects of
predicted climate change on net carbon exchange of apples and the upper limit of apple production (yield
11
potential) The model was evaluated for lsquoRoyal Galarsquo with regard to prediction of apple yield under
current Australian conditions in netted and non-netted orchard sites and yield was predicted under
warmer future climate conditions (Appendix 9)
Development and extension methodology
Extension and research activities were coordinated and conducted side-by-side to encourage the flow of
information between growers industry representatives extension officers and researchers throughout
the project with industry feedback continuously informing the research
The technology transfer activities undertaken as part of the extension component are outlined under each
of the following objectives
1 Facilitate greater understanding of how the climate is likely to change by 2030 and 2050 in
apple and pear growing regions of Australia how this might impact on apple and pear
production and potential adaptation strategies to reduce the associated risks
Multiple activities were undertaken to provide information to and obtain feedback from the apple and
pear industry A review of available climate change information relevant to Australian apple and pear
growers was conducted at the project start to identify information needs A grower survey was
performed to gain insight into grower attitudes and knowledge in regards to climate change and its
impacts
Communication and extension was undertaken throughout the project and included two years of national
grower workshops (Appendix 10) regular publications in industry magazines and websites presentations
at industry conferences field days and seminars dedicated project web pages (APAL and Horticulture
Industry Network (HIN)) and general media items
Climate change information specific to Australiarsquos apple and pear industry was published in a series of
three grower publications at the conclusion of the project to communicate key project findings as well as
important climate change information for the industry generally (Treeby et al 2017a Treeby et al
2017b White et al 2017)
2 Increase knowledge and skills to enable informed decision making around climate change
adaptation and orchard investment and planning based on scientific evidence
The grower publications and winter chill website were designed to provide practical information to
growers for use in every day decision making and for long-term strategic planning
3 Build a connected and collaborative approach between research partners funders industry
and growers around managing and adapting to climate change
Relationships between stakeholders were established maintained and developed through
- Regular project teleconferences and face-to-face meetings
- Close links with the University of Melbourne project lsquoCrossing the threshold adaptation
tipping points for Australian fruit treesrsquo undertaken within the Primary Industries Climate
12
Challenges Centre (PICCC)1
- Meetings with APAL staff at the head office in Melbourne at conferences or via phone hook-
up
- Informal links with other apple and pear industry research programs such as the PIPS
program as well as with researchers and industry representatives from other horticultural
industries for example cherries and almonds
- Establishment of the netting demonstration site in Western Australia
- Data collection trials conducted on grower properties which provided avenues for informal
engagement growers
- Involvement and participation in industry conferences and events
- Organisation and participation in national grower workshops
- Involvement with the Climate Change Research Strategy for Primary Industries (CCRSPI)
- Involvement of post-graduate students and work experience students in project activities
Figure 1 Research sites were located in Applethorpe (Qld) Shepparton (Vic) Manjimup
(WA) and Huonville (Tas) Orange (NSW) and Mt Barker (SA) were included in the climate
data analysis
1 httpwwwpicccorgauresearchproject440
13
Outputs
Grower publications
Treeby J Goodwin I MurphyWhite S Darbyshire R White N McClymont L Richards S
Measham P Bound S and Parkes H 2017 Winter chill and flowering ndash what is there to know
Department of Agriculture and Fisheries Queensland
Treeby J Goodwin I MurphyWhite S Darbyshire R White N McClymont L Richards S Webb
L Erwin T and Parkes H 2017 Netting for heat ndash what is there to know Department of
Agriculture and Fisheries Queensland
White N Parkes H and Treeby J 2017 Future climates in pome fruit orchards ndash what is there to
know Department of Agriculture and Fisheries Queensland
Grower workshops
Heidi Parkes Jenny Treeby and Ian Goodwin presented ldquoclimate change impacts and adaptation research
for the pome fruit industryrdquo at Fruit Grower Victoriarsquos end of season review Mooroopna Vic 12
May 2014 httpwwwhincomauassociationsfruit-growersfgv-end-of-season-review
httpwwwhincomauresourcesextreme-heat-powerpoint-may-2014
httpwwwhincomauresourcesapples-and-pears-in-a-changing-climate-powerpoint-may2014
Heidi Parkes Neil White and Clinton McGrath presented an ldquoapple climate change workshoprdquo at
Applethorpe Research Facility Qld 23 July 2014
Heidi Parkes and Susie MurphyWhite presented ldquoapples and pears in a changing climaterdquo at an orchard
walk in Manjimup WA 1 October 2014 httpwwwhincomauassociationsapples-and-
pearspit-stop-wa-for-the-national-roadshow
Heidi Parkes presented a ldquowinter chill and floweringrdquo workshop for the Perth Hills Orchard Improvement
Group at Applethorpe Research Facility Qld 31 July 2015
Clinton McGrath Heidi Parkes and Neil White presented a climate change risk management matrix
workshop in Thulimbah Qld 5 August 2015
Heidi Parkes Rebecca Darbyshire and Jenny Treeby presented a ldquowinter chilling and climate adaptation
workshoprdquo in Bilpin NSW 16 September 2015
Websites and tools
White N and Parkes H 2017 Winter chill and growing degree day website an interactive tool to
calculate and interpret local chill and growing degree day accumulation httpshort-
scienceshinyappsioChillCalculator
Technical working group meetings
Queensland technical working group meeting facilitated by Clinton McGrath Applethorpe Research
Facility Qld 20 August 2013
South Australian technical working group meeting facilitated by Jenny Treeby and Paul James (Lenswood
Co-op) Lenswood SA April 2013
14
Victorian technical working group meeting facilitated by Jenny Treeby and Michael Crisera (Fruit Growers
Victoria) Shepparton Vic October 2013
Industry surveys
A nation-wide survey of apple and pear growers was developed and coordinated by Jenny Treeby (based
on input from DEDJTRrsquos Service Innovations branch) to ascertain growersrsquo attitudes perceptions
and knowledge of climate change 2013 httpswwwsurveymonkeycomsQTG7QKH
A nation-wide survey of apple and pear growers was developed and coordinated by Heidi Parkes Jenny
Treeby and Susie MurphyWhite to gauge grower understanding and perceptions of winter chill
2015
Industry articles
Calderon M 2014 Bud burst in lsquoWilliamsrsquo Pears highly variable Australian Fruitgrower 8(8) 32
Darbyshire R and Parkes H 2014 Whatrsquos the blooming difference Australian Fruitgrower 8(10) 30
Darbyshire R and Parkes H 2015 Get in the chill zone Australian Tree Crop Winter edition pp 14
Darbyshire R Goodwin I and MurphyWhite S 2016 New understandings to better predict apple
flowering- introducing the chill overlap model Australian Fruitgrower JuneJuly edition
httpapalorgauaustralian-fruitgrower-june-july-2016
McClymont L Goodwin I and Sessions W 2013 Net benefits- the sun protection factor in 2050
Australian Fruitgrower 7(6) 28-31
McClymont L Goodwin I and Sessions W 2013 Effectiveness of netting in reducing sun damage Part
I Tree Fruit August 5-8
McClymont L Goodwin I and Sessions W 2013 Effectiveness of netting in reducing sun damage Part
II Tree Fruit September 8-11
MurphyWhite S 2014 Netting the benefits of a changing climate Australian Fruitgrower 8(5) 21
httpapalorgaunetting-benefits-changing-climate
MurphyWhite S 2014 Manjimup apple update- netting quality results for south west apples South-West
AgMemo August issue 5 httpswwwagricwagovaunewsletterssouth-west-agmemo-august-
2014-issue-5page=02C3smartpaging_toc_p3_s0_h2
MurphyWhite S 2014 Blooms affected by winter chill South-West AgMemo October issue 5
httpswwwagricwagovaunewsletterssouth-west-agmemo-october-2014-issue-
5page=02C2smartpaging_toc_p2_s0_h2
MurphyWhite S 2015 Investigating fruit surface temperature in apples South West AgMemo February
issue 1 httpswwwagricwagovaunewsletterssouth-west-agmemo-february-2015-issue-
1page=08smartpaging_toc_p8_s0_h2
MurphyWhite S Prince R and Starkie L 2016 Black or white netting Is there a difference Or just a
preferencehellip WA Grower Autumn 68 - 70 httppomewestnetauwp-
contentuploadsnewslettersWAGROWERAutumn16_POMEWESTPDF
MurphyWhite S Prince R and Starkie L 2016 Black or white netting Is there a difference Or just a
preferencehellip VegetablesWA Autumn 71 - 73 httpwwwvegetableswacomauwa-growers-
magazine
15
MurphyWhite S Prince R and Starkie L 20152016 Black or white netting which is best Australian
Fruitgrower 9(11) 22 ndash 24 httpapalorgaublack-or-white-netting-which-is-best
Parkes H 2015 Producing Apples and Pears in a changing climate Australian Tree Crop Winter edition
26
Parkes H 20152016 Sharing ideas to climate change-proof orchards Australian Fruitgrower 9(11) 12
httpapalorgausharing-ideas-to-climate-change-proof-orchards
Parkes H MurphyWhite S and Bound S 2016 Dormancy-breaking sprays for low chill years
Australian Fruitgrower AugSept httpapalorgaudormancy-breaking-sprays
Parkes H MurphyWhite S and Bound S 2016 Dormancy-breaking sprays for low chill years (Part 1
and 2) Tree Fruit AugSept httpwwwtreefruitcomauorchardcrop-growth-
managementitem712-dormancy-breaking-sprays-for-low-chill-years
httpwwwtreefruitcomauorchardcrop-growth-managementitem723-dormancy-breaking-
sprays-for-low-chill-years-part-2
Parkes H White N and Darbyshire R 2015 Winter chill how did 2014 compare with previous years
Australian Fruitgrower 9(3) 32 ndash 33 httpapalorgauwinter-chill-how-did-2014-compare-with-
previous-years
Prince R and MurphyWhite S 2015 Netting trial results in WA Australian Fruitgrower 9(9) 26 - 29
httpapalorgaunetting-trial-results-in-wa
Thomson G McClymont L Goodwin I 2014 Sunburn protection Part 1 Adapt and limit apple sunburn
during heatwaves Tree Fruit November 5ndash9
Thomson G McClymont L Goodwin I 2014 Part 2 Orchard design tree training and pruning for
apple sunburn reduction Tree Fruit December 3ndash6
Thomson G McCaskill M McClymont L Goodwin I 2015 Part 3 Fruit protection with spray-on
products shade-netting or evaporative cooling can help reduce sunburn during heatwaves Tree
Fruit January 3ndash5
Thomson G McCaskill M McClymont L Goodwin I 2015 Part 4 Fruit protection with spray-on
products shade-netting or evaporative cooling can help reduce sunburn during heatwaves Tree
Fruit February-March 3ndash4
Thomson G McCaskill M McClymont L Goodwin I 2015 Part 5 Fruit protection with spray-on
products shade-netting or evaporative cooling can help reduce sunburn during heatwaves Tree
Fruit April 3ndash4
Treeby J 2014 Apple and pears weathering the climate Australian Fruitgrower 8(2) 18
Treeby J 2014 Research Roadshows on coping with extreme weather Australian Fruitgrower 8(10) 11
Wilkie J Combret M Goodwin I McGrath C McClymont L Middleton S Nimmo P Starkie L
Tabing O and Treeby J 2013 The apple and pear climate change research program Australian
Fruitgrower 7(6) 20-23
Industry conferences
MurphyWhite S 2015 Netting the benefits of climate change APAL Speed Updating Day National
Horticulture Convention Gold Coast 25 June httpapalorgauresearch-development-
extensionprojectsresearch-reviews
16
Parkes H 2015 Towards understanding bud burst and flowering in a changing climate approaches to
research and extension APAL Speed Updating Day National Horticulture Convention Gold Coast
25 June httpapalorgauresearch-development-extensionprojectsresearch-reviews
Parkes H 2016 Reducing vulnerability to a changing climate in Australian temperate fruit tree industries
CCRSPI 2016 conference- striving for climate resilience Sydney 27-28 April
httpwwwccrspinetaureducing-vulnerabilities-temperature-extremes
Parkes H 2016 Winter chill how much is enough for profitable yields APAL Industry Updating Day
National Horticulture Convention Gold Coast 23 June httpapalorgauwp-contentuploads5-
Heidi-Parkes_APAL_Industry_Updating_2016_withnotescompressedpdf
Wilkie J 2013 Understanding apple and pear production systems in a changing climate APAL speed
updating day Apple and Pear Industry Conference Gold Coast 17 July
Stakeholder and grower engagement
Lexie McClymont 2013 Outcomes from the fruit temperature and yield modelling research Fruit Growers
Victoria Young Growerrsquos group (Goulburn Valley) Shepparton Vic 24 October
Lexie McClymont 2013 Climate change and Horticulture - Impacts and Adaptation Meeting with DEPI
Deputy Secretary James Flintoft Tatura Vic 15 November
Heidi Parkes 2013 Understanding apple and pear production systems in a changing climate DAFFQ
regional stakeholders meeting Applethorpe Qld 26 November
Ian Goodwin 2014 Apple and pear productivity Reducing weather losses Meeting with DEPI Deputy
Secretary James Flintoft Tatura Vic 7 February
Susie MurphyWhite 2014 Extreme temperatures and sunburn Netting demonstration site orchard walk
Manjimup WA 23 April
Heidi Parkes 2014 Climate change impacts and adaptations for horticultural industries EE Muirs Pty Ltd
growerrsquos evening Stanthorpe Qld 23 October
Ian Goodwin 2015 Climate change project progression DEDJTR Victoria group Rural Development and
Transition Policy Tatura Vic 3 March
Heidi Parkes 2015 Approaches and challenges to studying climate change impacts on apple production
Applethorpe Research Facility open day Applethorpe Qld 1 April
Susie MurphyWhite 2015 Dynamic chill portions for pome fruit in WA Donnybrook Apple Festival WA 4
ndash 5 April
Jenny Treeby Susie MurphyWhite Rebecca Darbyshire and Heidi Parkes 2015 Winter chill poster- A bit
chilly Climate change project stand as part of the DEDJTR booth National Horticulture
Convention Gold Coast 25 - 27 June
Heidi Parkes 2015 Current research in the area of apple production in a changing climate Applethorpe
Research Facility Qld 24 November
Heidi Parkes 2015 Current and future research into climate change impacts and adaptation for the
Horticulture industry DAF South Regional Leaders Team and the Director General Applethorpe
Research Facility Qld 25 November
17
Susie MurphyWhite 2016 Dormancy-breaking spray trial Pomewest Growers Meeting Manjimup WA
17 May
Ian Goodwin 2016 Dealing with seasonal climate risk and extreme weather events Regional Innovation
Forum Tatura Vic 18 May httpwwwhincomauassociationshorticulture-centre-of-
excellenceregional-innovation-forum
Heidi Parkes 2016 Winter chill website Stanthorpe Apple Growerrsquos meeting Applethorpe Research
Facility Qld 26 May
Reports
Darbyshire R and McClymont L 2016 Assessing the potential yield model lsquoMaluSimrsquo The University of
Melbourne and Department of Economic Development Jobs Transport and Resources 27 pp
MurphyWhite S Prince R and Starkie L 2016 Western Australian apple netting demonstration site
Pomewest 24 pp
Parkes H and White N 2016 Flowering in pome fruit trees across Australia implications of a changing
climate Department of Agriculture and Fisheries Queensland 21 pp
Parkes H and White N 2016 A climate analogue approach to understanding the impact of climate
change on flowering in Australian temperate fruit trees Department of Agriculture and Fisheries
Queensland 17 pp
Parkes H MurphyWhite S and Bound S 2016 Dormancy-breaking sprays for low winter chill in
apples Department of Agriculture and Fisheries Queensland Pomewest University of Tasmania
28 pp
Treeby J 2013 Review of current apple and pear climate change grower information Department of
Economic Development Jobs Transport and Resources 6 pp
httpwwwhincomauresourcesreview-of-current-apple-and-pear-climate-change-information-
for-growers
Treeby J 2016 Understanding apples and pears in a changing climate overview of the grower
workshops Department of Economic Development Jobs Transport and Resources 5 pp
White N 2016 Analysis of historical and future climate and the production of pome fruit Department of
Agriculture and Fisheries Queensland 29 pp
Media items
ldquoNew Development Officer to continue research into climate changerdquo was published in AgMemo South
West Agricultural Region February 2014 Issue 1 The article introduced Susie Murphy White to
the West Australian growers httpswwwagricwagovaunewsletterssouth-west-agmemo-
2014-issue-1page=02C1smartpaging_toc_p1_s0_h2
Susie MurphyWhite 14 March 2014 Interviewed by ABC Rural on the Manjimup netting trial ldquoStates first
trial tests heat impactsrdquo httpwwwabcnetaunews2014-03-17apple-netting-trial5326112
Susie MurphyWhite 25 March 2014 Interviewed by GWN7 rural news on the use of netting to reduce
sunburn
18
lsquoClimate threats studiedrsquo was published in The Border Post and Warwick Daily News Southern Downs
Qld 16 December 2014 Heidi Parkes was interviewed for the article
httpwwwruralweeklycomaunewsclimate-threats-studied2485263
lsquoA model for the futurersquo was published in the Bush Telegraph Southern Downs Qld 9 April 2015 The
article featured a summary of the presentation given by Heidi Parkes on the climate change
research program at the Applethorpe Research Facility open day
Horticulture Innovation Australia media release 13 April 2015 Reducing the vulnerability of apple and
pear production to a changing climate
Heidi Parkes 21 April 2015 Interviewed by Australian Rural Communication Network on reducing the
vulnerability of apple and pear production to a changing climate
lsquoClimate research crucial for apple and pear growers in Australiarsquo was published by The Weekly Times
Vic 8 July 2015 Heidi Parkes was interviewed for the article following the Speed Updating Day
presentation at the National Horticulture Convention
httpwwwweeklytimesnowcomauagribusinesshorticultureclimate-research-crucial-for-apple-
and-pear-growers-in-australiastory-fnker6g8-1227431799897
Susie MurphyWhite 18 August 2015 Interviewed by ABC local radio morning rural report on the progress
of winter chill in the South West of WA
Heidi Parkes 28 October 2015 Interviewed by the ABC Country hour Tasmania during the Greenhouse
2015 conference in Hobart on the potential impacts of warming climate on Australiarsquos apple and
pear industry
Heidi Parkes 23 June 2016 Interviewed live by the ABC Country hour during the 2016 National
Horticulture Convention on potential impacts of warming climate on Australiarsquos apple and pear
industry
Project web pages factsheets and online information
Horticulture Industry Network project page httpwwwhincomauprojectsapple-and-pear-production-
in-a-changing-climate
Apple and Pear Australia Limited project page httpapalorgauresearch-development-
extensionprojectsclimate-change
Regional chill factsheets httpwwwhincomauregional-chill-accumulation-victoria
httpwwwhincomauregional-chill-accumulation-queensland
httpwwwhincomauregional-chill-accumulation-for-new-south-wales
httpwwwhincomauregional-chill-accumulation-for-south-australia
httpwwwhincomauregional-chill-accumulation-for-tasmania
httpwwwhincomauregional-chill-accumulation-for-western-australia
Jenny Treeby 15 May 2015 httpwwwhincomauprojectsapple-and-pear-production-in-a-changing-
climateexplore-your-regional-climate
Heidi Parkes 4 November 2014 httpwwwhincomauprojectsapple-and-pear-production-in-a-
changing-climatewill-extreme-october-heat-impact-on-fruit-size
Heidi Parkes 6 December 2013 httpapalorgaua-discussion-on-dormancy-and-why-its-worth-
thinking-about-in-early-december
19
Scientific conferences
Parkes HA Tabing O McClymont L Combret M and Wilkie JD 2014 Variation in the Flowering
Phenology of Apple and Pear in Australia 29th International Horticulture Congress Brisbane
Convention and Exhibition Centre 17-22 August (Oral presentation)
Parkes HA White NA MurphyWhite S 2015 Understanding the impact of climate change on flowering
in Australian temperate fruit trees Greenhouse 2015 Wrest Point conference center Hobart
Tasmania 26 ndash 30 October (Oral presentation)
Datasets
Spring phenology observations for pome-fruit cultivars in Australia 2013 ndash 2015 Available at
httpsdataqldgovau
Post-graduate student projects
Marco Calderon 2014 Orcharding the future the influence of temperature on pome fruit flowering
across Australia University of Melbourne Masterrsquos Degree
20
Outcomes
Historical climate trends and future scenarios
Historical trends in average temperatures winter chill and heat days
(Appendix 1)
Australia has undergone a consistent warming trend since 1910 (State of the climate 2016) In pome
fruit growing regions across Australia this changing climate has been experienced in different ways at the
local level Changes in average minimum and maximum temperatures experienced in autumnwinter and
springsummer since 1968 differ between regions (appendix 1) The milder growing regions of
Applethorpe Manjimup and Mt Barker have experienced a decline in the number of chill portions over this
period while Shepparton has seen a small reduction in winter chill and the colder regions of Huonville
and Orange have not changed (Figure 2) Increases in the number of extreme heat days have been
experienced in Shepparton and Mt Barker while the last seven years in Manjimup have been above the
long-term average (Figure 3)
21
Applethorpe
Shepparton
Manjimup Huonville
Orange Mount Barker
Figure 2 Annual anomaly in accumulation of chill portions (1 Mar to 31 Aug) Anomalies are the difference
between the yearly value and a base period of 1981 to 2010 The black line is an 11-year moving average
22
Applethorpe
Shepparton
Manjimup
Huonville
Orange Mount Barker
Figure 3 Annual anomaly in average number of days where maximum temperature exceeds 35deg C
Anomalies are expressed as the difference between the yearly value and a base period of 1981 to 2010
The black line is an 11-year moving average
23
Climate projections for average winter chill and heat days
(Appendix 1)
Climate projections were developed for minimum to medium (RCP45) and worst case (RCP85) scenarios
for 2030 and 2050 for each of the pome fruit growing regions Winter chill accumulation declined at all
sites in 2030 and 2050 under both scenarios The greatest declines were in the milder growing regions of
Applethorpe and Manjimup (greater than 20 in 2050) and the smallest declines in Huonville and Orange
(around 5 in 2030 and less than 15 in 2050) (Table 1)
By 2050 growers will be managing orchards under a different climatic environment For example in
Applethorpe a low chill year is currently around 60 chill portions This will be a good year in 2050 and
the worst years will be outside the existing range of experience
Table 1 Average chill portions (1 Mar to 31 Aug) for 2030 and 2050 using a minimum to
medium (RCP45) and worst (RCP85) case scenario The average is of 30 years with the
lowest and highest chill portions in brackets
Average chill portions Present
2030 2050
RCP45 RCP85 RCP45 RCP85
Applethorpe 72 (62-83) 63 (48-75) 60 (44-73) 56 (41-69) 51 (36-65)
Shepparton 84 (73-93) 75 (63-85) 74 (62-86) 71 (58-81) 67 (57-79)
Manjimup 67 (55-82) 57 (43-76) 55 (42-75) 50 (36-72) 47 (33-68)
Huonville 105 (94-113) 98 (81-112) 97 (78-110) 93 (74-105) 90 (71-104)
Orange 100 (90-110) 94 (85-104) 93 (82-101) 90 (81-99) 87 (78-94)
Mount Barker 84 (67-93) 74 (55-88) 73 (53-88) 70 (53-84) 65 (47-80)
The climate projections for 2030 and 2050 show that all pome fruit regions across Australia can expect to
experience an increase in the number of extreme heat days during the growing season with the greatest
impacts likely to be in regions such as Shepparton with hot summer climates (data not shown) Impacts
on the risk of sunburn browning in apples are described in the section lsquoPotential impact of an increased
frequency in extreme heat events on the incidence of sunburn and the effectiveness of netting as an
adaptation strategyrsquo on p34
24
Impacts of warming autumn winter and spring temperatures on flowering and
options for adaptation
Understanding relationships between temperature and flowering
1 Variation in flowering of pome fruit trees across Australia
(Appendix 2)
Differences in the pattern of chill accumulation (Figure 4) were accompanied by variability in the timing
and pattern of green tip and flowering between locations and between years (Figure 5) Green tip and full
bloom dates were more variable between years cultivars and individual trees in Manjimup compared with
Applethorpe and Shepparton and trees consistently displayed a more protracted pattern of flowering
(Figure 5) Delayed and uneven flowering are symptoms of inadequate chill and it is likely that the
observed patterns of bud burst and flowering in Manjimup were in response to the mild winter conditions
experienced in that location in 2012 to 2014
Figure 4 Chill accumulation in Shepparton Applethorpe and Manjimup in 2012 to 2015
Number in brackets is the total chill portions received up to 31 Aug
25
Figure 5 Green tip (green) and full bloom (pink) dates for apple cultivars in Applethorpe
Shepparton and Manjimup Data is the average of observations from 2012 to 2015 with bars
indicating the confidence interval
Applethorpe
Shepparton
Manjimup
26
2 Chilling requirements
A collection of apple chilling requirements in chill portions chill units and chill hours were produced for
the mild climatic region of Applethorpe Queensland Australia (Table 2)
The chilling requirements measured were higher across a number of cultivars when compared with
previously published thresholds (Ghariani et al 1994 Hauagge et al 1991) For example Darbyshire et
al (2016) estimated a chilling requirement of 34 chill portions for lsquoCripps Pinkrsquo notably lower than the
chilling requirement of 73 chill portions calculated here Comparison of chilling requirements between
studies is problematic due to the use of vastly different methodologies for threshold determination
(Dennis 2003) Research to understand the genetic basis of progression through the phases of dormancy
is needed to enable accurate definition of cultivar chilling requirements (Cooke et al 2012)
Regardless of these gaps in knowledge the chilling requirements measured using the forced bud
methodology can be used to put apple cultivars into groups with low (lsquoCripps Redrsquo lsquoManchurianrsquo crab
apple) medium (lsquoRS103-110rsquo lsquoGranny Smithrsquo lsquoCripps Pinkrsquo lsquoKaleirsquo) and higher chilling requirements
(lsquoGalaxyrsquo Fujirsquo lsquoHi-Earlyrsquo) These groupings provide practical benefit to industry by enabling growers to
make more informed cultivar and pollinizer choices at planting particularly when considering projected
changes to future climate
A draft manuscript titled lsquochilling requirements of apple varieties grown in mild Australian winter
conditionsrsquo details this work and has been prepared for submission to the journal HortScience
27
Table 2 Chilling requirements of apple cultivars and a crab apple polliniser cultivar measured in chill portions chill units and chill
hours
Cultivar Year Dynamic (CP) meanplusmnsd CV() Utah (CU) meanplusmnsd CV() Chill Hours (CH) meanplusmnsd CV()
Cripps Red 2014 549 57plusmn29 51 947 976plusmn403 41 694 662plusmn445 67
2015 59
1004
631
Manchurian 2014 585 61plusmn36 59 1016 1031plusmn216 21 748 724plusmn332 46
2015 636
10465
701
RS103-110 2014 687 708plusmn29 41 1207 1186plusmn293 25 845 838plusmn106 13
2015 728
11655
830
Granny Smith 2014 729 728plusmn01 01 1312 1239plusmn1036 84 875 852plusmn318 37
2015 728
11655
830
Cripps Pink 2014 729 733plusmn06 09 1312 1242plusmn99 8 875 856plusmn276 32
2015 738
1172
836
Kalei 2014 729 755plusmn37 49 1305 1275plusmn421 33 875 883plusmn113 13
2015 781
12455
891
Galaxy 2014 795 767plusmn4 53 1429 1300plusmn1817 14 950 893plusmn806 9
2015 738
1172
836
Fuji 2014 76 77plusmn15 19 1368 1307plusmn866 66 924 908plusmn233 26
2015 781
12455
891
Hi Early 2014 76 77plusmn15 19 1368 1307plusmn866 66 924 908plusmn233 26
2015 781
12455
891
lowest coefficient of variation CV() across the three chill models
28
3 Modelling to predict the timing of flowering in apple under current climates
(Appendix 1)
The relationship between winter chill heat and flowering was described mathematically in the chill-
overlap model of flowering developed for almonds (Pope et al 2014) (Figure 6) This model assumes
that there is a minimum amount of chill and a minimum amount of heat required for flowering The more
chill that is received over and above the minimum chilling requirement the lower the amount of heat that
is needed In this way the timing of flowering is determined by the complex relationship between the
amount of chill and heat that is received during dormancy
The baseline flowering and temperature datasets collected as part of this project were used to
successfully validate the chill-overlap model for lsquoCripps Pinkrsquo apple (Darbyshire et al 2016) enabling
projections of climate change impacts on the timing of flowering to be made (Table 3)
Figure 6 The Chill-Overlap Model for flowering in apple Cr is minimum chill required for
flowering Co is the maximum additional chill that will reduce the heat requirement Hr is the
heat required when Co chill is accumulated and Ho is the maximum possible heat
requirement for flowering (Redrawn from Darbyshire et al 2016)
29
Potential impacts of warming temperatures on flowering
1 Modelling to predict changes in the timing of apple flowering under future
climates
(Appendix 1)
The chill-overlap model for lsquoCripps Pinkrsquo apple was used to predict changes in the timing of full bloom in
growing regions across Australia in 2030 and 2050 In Orange a high chill location the average date of
full bloom was advanced (earlier bloom) in 2050 by 4 to 5 days The milder winter locations showed a
delayed full bloom date in 2030 and 2050 with the greatest impact felt at Manjimup
Changes in flowering time for lsquoCripps Pinkrsquo in 2030 are likely to be within the current range of grower
experience However by 2050 flowering times are predicted to be considerably later in milder winter
regions To determine how flowering time in other apple cultivars will be impacted by climate change the
chill-overlap model would require validation with flowering data from each cultivar
Table 3 Average date of full bloom for lsquoCripps Pinkrsquo apple in 2030 and 2050 using a
minimum to medium (RCP45) and worst case scenario (RCP85) modelling approach
Average Predicted Full Bloom date Present
2030
2050
RCP45 RCP85 RCP45 RCP85 Applethorpe 4 Oct 7 Oct 9 Oct 12 Oct 16 Oct
Shepparton 30 Sep 3 Oct 3 Oct 5 Oct 6 Oct
Manjimup 16 Oct 22 Oct 25 Oct 30 Oct 2 Nov
Huonville 26 Sep 27 Sep 29 Sep 29 Sep 29 Sep
Orange 2 Oct 28 Sep 28 Sep 28 Sep 27 Sep
Mount Barker 1 Oct 5 Oct 4 Oct 6 Oct 8 Oct
2 Using climate analogues
(Appendix 3)
The climate analogue analysis using Manjimup as an analogue for Stanthorpe in 2030 indicated that
growers in the Stanthorpe region were likely to experience a more variable and protracted pattern of
flowering across many apple cultivars by 2030 (Figure 7) but without any clear negative impact on
productivity Use of dormancy-breaking sprays was identified as a possible adaptation with no obvious
requirement to shift to different cultivars or tree crop species at this stage
Results from this case study indicated that the climate analogue approach can provide valuable
information around potential climate change impacts and adaptation strategies for horticultural industries
30
This finding comes with a note of caution however Climate and plant physiology are complex systems
and the information gained from using climate analogues should be considered in a broad context with
care taken to the detail
Figure 7 Variable bud burst and flowering in Cripps Pink Manjimup spring 2014
Options for adaptation management of flowering under future climates
1 Cultivar selection mdash matching cultivars with appropriate winter climates
Ideally apple and pear cultivars should be matched with suitable growing climates which in this case
refers to selection of cultivars with chilling requirements that are comfortably below the minimum winter
chill received in a particular location (Atkinson et al 2013 Luedeling et al 2015) However there are
multiple factors that influence cultivar choice (for example market opportunities) and uncertainty around
determination of cultivar chilling requirements make this somewhat difficult
The collection of flowering time observations undertaken as part of this study indicated that more
detailed monitoring and recording of green tip and flowering dates across the orchard would enable
growers to identify cultivars that are performing well in the local climate and those that are not getting
enough chilling from season-to-season (providing early indication of cultivars that might be impacted by
warmer winters in the future changing climate) These records could also be used to identify subtle shifts
in the timing of flowering between cultivars and their pollinisers New sensing technologies will enable
simpler collection of large amounts of data in the future (Panda et al 2010)
31
2 Dormancy-breaking sprays as an adaption to inadequate winter chill
(Appendix 4)
The dormancy-breaking sprays assessed in this 2015-16 study were able to advance flowering time and
compact the flowering period in lsquoGalarsquo apple with differences observed between products and sites
(Figure 8) A more compact and uniform flowering period has been shown to have a number of benefits
including improved management of flowering pests and chemical thinning practices (Bound et al 2004
Theron 2013)
Despite the compaction of flowering there were no clear differences observed in fruit set yield or
variability of apple maturity in trees treated with dormancy-breaking sprays More work is required to test
the potential of these products to improve fruit quality and reduce the length of harvest Advances in
harvest timing were observed with the dormancy-breakers and generally reflected differences in
flowering dates The ability to manipulate harvest timing can be useful in situations where advantage can
be taken of a high-price market window
The results suggest that dormancy-breaking products are likely to be a viable adaptation tool for some
cultivars in lower winter chill years but the degree to which flowering can be managed with dormancy-
breakers as the climate continues to warm is yet to be determined
Figure 8 Green tip first flower and full bloom in Gala apples treated with and without
dormancy breaking sprays Dormexreg Waikentrade and Ergerreg in Huonville Applethorpe and
Manjimup in 2015
32
3 Changing cultural practices
(Appendices 2 and 3)
A review of the scientific literature undertaken as part of this project together with information gained
from personal communication with growers and industry suggest that irregular and protracted flowering
can be difficult to manage and will likely require changes in thinning practices (Bound et al 2004
Theron 2013) Determining an appropriate thinning program is likely to be challenging when buds are at
multiple stages of green tip and flowering on individual trees (Theron 2013) Fruitlets may vary more in
size and developmental stage and careful hand thinning will likely be required to optimise crop
uniformity (personal comm) Where uniformity cannot be achieved the greater spread of fruit maturity
at harvest may require greater effort to pick at the appropriate time (personal comm)
Impacts of increased frequency of extreme heat days on fruit quality and options for
adaptation
Understanding relationships between summer temperatures and the incidence of
sunburn under net and no net
1 Air temperature thresholds for sunburn damage
(Appendix 5)
Minimum air temperatures for potential sun damage were determined for lsquoRoyal Galarsquo apple in Australia
The air temperature thresholds were 341 and 387degC respectively for browning and necrosis for non-
netted fruit and 379degC for browning under netting (Figure 9)
When the air temperature thresholds were applied across southern Australia it was found that some
fruit-growing regions were more exposed to potential sun damage risk than others Cooler summer
regions (such as Huonville and Applethorpe) illustrated very little risk while warmer summer regions
(such as Shepparton) displayed a greater potential risk accompanied by substantial variability between
years (Table 4) Managing this variability in potential risk is important to maintain yield and quality
Air temperature thresholds can be used by growers as a guide for timing the use of overhead sprinklers
for evaporative cooling in efforts to minimize potential damage
33
Figure 9 Fruit surface temperature (degC) recordings and related air temperatures (degC)
Necrosis and browning fruit surface temperature thresholds represent 52 and 478 degC
respectively Figure sourced from Darbyshire et al 2015
Table 4 Distribution of potential damage days in January for sites in Australiarsquos growing
regions for 10th 50th and 90th percentiles of data Table sourced from Darbyshire et al
2015
Browning non-netted Browning netted Necrosis non-netted
Site 10th 50th 90th 10th 50th 90th 10th 50th 90th
Spreyton1 0 0 0 0 0 0 0 0 0
Huonville 0 0 1 0 0 0 0 0 0
Applethorpe 0 0 2 0 0 0 0 0 0
Batlow1 0 0 4 0 0 0 0 0 0
Yarra Valley1 0 2 5 0 0 1 0 0 1
Manjimup 0 3 5 0 0 2 0 0 1
Lenswood1 0 3 6 0 0 2 0 0 1
Young1 1 7 16 0 1 5 0 05 4
Shepparton 2 6 12 0 1 5 0 1 4
Donnybrook1 3 7 11 0 1 3 0 05 2 1additional locations included in this table were part of the Crossing the threshold adaptation tipping
points for Australian fruit trees project
2 Predicting fruit surface temperature from weather data using the
lsquothermodynamic Smart-Sinclairrsquo model
(Appendix 6)
The thermodynamic Smart-Sinclair model (Smart et al 1976) was tested on lsquoRoyal Galarsquo grown under
34
net and no net The optimised model produced was able to predict fruit surface temperature with a root
mean square error of 2 to 3degC The presence of netting reduced the median fruit surface temperatures by
15 to 20degC The mechanism for this netting effect was through the reduction of the intensity of the solar
beam by interception and scattering while still allowing sufficient air flow to enable transfer of heat from
the fruit surface to the air
This type of modelling can be used to understand processes and quantify the effects of various netting
structures on fruit surface temperature and sun damage risk However the thermodynamic fruit surface
temperature model cannot be used for predicting the effects of climate change due to the lack of reliable
projected solar radiation and wind speed data for future climates For applications such as assessing the
benefits of netting in Australiarsquos apple growing regions for a range of climate change scenarios the air
temperature threshold approach of Darbyshire et al 2015 described above is more appropriate
Potential impact of an increased frequency in extreme heat events on the incidence of
sunburn and the effectiveness of netting as an adaptation strategy
(Appendices 1 and 7)
Minimum air temperature thresholds for sunburn damage in lsquoRoyal Galarsquo apple grown with and without
net (Darbyshire et al 2015) were used to consider the risk of sunburn damage under future climates in
pome fruit growing regions of Australia and the effectiveness of netting to reduce this risk (Table 5)
Exposure to sunburn browning-risk was highly dependent on the geographical location Some locations
were found to maintain minimal sunburn browning-risk up to 2050 while others will potentially
experience the risk for a significant proportion of the JanuaryFebruary fruit growing period Shepparton
Mt Barker and Manjimup will be most adversely affected however the installation of over-tree netting
substantially reduced the impact of sunburn browning
Analysis of multiple locations enables the use of climate analogues (Whetton et al 2013) for impact and
adaptation assessments
35
Table 5 Average sunburn browning risk (percentage of days in the January to February
period) for lsquoRoyal Galarsquo apples grown at sites across Australia with and without netting
Sunburn browning risk classifications
5 gt 5 to 10 gt 10 to 20 gt 20 to 30 gt 30 to 50
Without Netting 2030 2050
Site Present RCP45 RCP85 RCP45 RCP85
Applethorpe 11 24 28 28 49
Shepparton 183 239 268 275 358
Manjimup 100 152 152 166 198
Huonville 24 34 38 45 42
Orange 24 38 44 37 84
Mt Barker 173 207 229 232 258
With Netting
2030 2050
Site Present RCP45 RCP85 RCP45 RCP85
Applethorpe 00 00 01 01 04
Shepparton 48 70 90 88 132
Manjimup 16 38 39 44 60
Huonville 03 06 10 12 11
Orange 01 01 01 01 07
Mt Barker 54 72 91 94 107
36
Black and white netting impacts on the orchard environment fruit yield and quality
(Appendix 8)
Observations from the Western Australian netting demonstration site (Figure 10) showed similar air
temperature conditions (including winter chill accumulation) under the netted and non-netted orchard
blocks There was a slight increase in humidity under net which was associated with a higher incidence of
pest and disease There were no differences in bud burst and full bloom dates between trees under
black white and no net
Fruit surface temperatures recorded in apples over the late summer period were higher in the non-netted
apples (Figure 11) Fruit size was similar between netted and non-netted blocks however fruit colour
management using reflective mulch was required under the nets
Figure 10 Western Australian netting demonstration site at the Lyster Matijari Orchard
Manjimup
Figure 11 Fruit surface temperature (FST) and air temperature measured in the black net
white net and no net rows at the Lyster Matijari orchard (Manjimup) from February to mid-
March 2014
37
Impacts of warming temperatures on yield
(Appendix 9)
Modelling potential yield in apple using Malusim
In a recent report Darbyshire and McClymont (2016) concluded that positive validation of MaluSim under
Australian conditions was not achieved based on poor prediction of yield by MaluSim for lsquoRoyal Galarsquo and
lsquoCripps Pinkrsquo at multiple sites in Australia However performance of MaluSim in predicting fruit weight of
lsquoRoyal Galarsquo trees at the North Shepparton site supported use of the model for preliminary investigation
of influences of climate change on potential yield as part of this project
Potential impacts of warming temperatures on yield in apple
Using Malusim the predicted impact of increased temperatures (+ 2degC) on yield in lsquoRoyal Galarsquo apples in
north Victoria was minor under the conditions modelled in this investigation However further research
into possible effects of changes in harvest timing leaf fall and elevated atmospheric carbon dioxide
concentrations is required to better understand yield responses to climate change
Communication development and extension
Assessing the status of available information around climate change in the apple and
pear industry in 2013
A review of climate change information available to the Australian apple and pear industry showed a lack
of readily accessible reliable and consistent information available to growers at the time As a result it
was concluded that a) scientific outcomes from this project need to be published in a grower friendly
format b) research should be extended in a consistent manner through national grower workshops
across the country and online blogs and c) information generated needs to be stored online for easy
access
Improving industry understanding of likely changes in climate potential impacts on
apple and pear production and options for adaptation
Outcomes from the national grower workshops (appendix 10) were overwhelmingly positive with the
specific feedback varying depending on the location A number of knowledge gaps were identified during
the workshops including the need for cultivar chilling requirements for existing and new cultivars the
role of soil temperature in dormancy breaking and the need for more accurate in-season and long-term
climate forecasting There was a strong focus on the potential impact of extreme events on the industry
under future climate scenarios with less understanding about the potential impacts of more subtle
increases in temperature
Three grower publications were put together reporting on the latest project outcomes and information
already available from either earlier research in Australia andor other pome fruit growing regions The
publications were written with input from the project researchers and APAL (as the technical working
group) on the topics of winter chill netting for heat and climate scenarios The guides will be available
online (wwwhincomau) and as hardcopies from APAL andor the participating agencies
38
Increasing knowledge and skills to enable informed decision making on climate change
adaptation
Research outcomes were interpreted and communicated with a clear focus on practical on-farm
application For example findings from the fruit surface temperature research were interpreted and
communicated as regional sunburn browning-risk with analysis of the effectiveness of netting as an
adaptation strategy to increased frequency of extreme heat days The Western Australian netting
demonstration site enabled on-site communication with growers in that state around the effectiveness of
netting and the associated practical implications Green tip and flowering data collection methods were
developed for growers to use in their personal orchard record systems to determine cultivar performance
and identify shifts in flowering time andor quality A winter chill website was developed to assist growers
and industry more broadly to access and interpret winter chill data for their local region
Building a connected and collaborative approach to climate change in the apple and
pear industry
A strong network of researchers extension officers industry development officers growers and other
industry representatives was established nationally and continued to grow until project completion The
success of this project objective is discussed in the lsquoevaluation and discussionrsquo (p39)
39
Evaluation and Discussion
Measuring project impact
The proposed project outcome was to provide Australian apple and pear growers pome fruit researchers
and industry consultants with a greater understanding of predicted climate change in their region the
potential impacts and strategies for adaptation A formal evaluation of the projectrsquos ability to deliver on
this outcome was undertaken at the mid-way point through Horticulture Innovation Australiarsquos
independent mid-term review process
Through extensive research development and extension activities this project delivered new knowledge
to industry on regional climate change scenarios potential impacts of changing climate on flowering and
fruit quality and options for adaptation
Project outputs were produced across a broad variety of print digital and oral communication mediums
(refer to p13) The list includes 3 dedicated grower publications communicating climate risk and
adaptation information for the apple and pear industry a website for provision of up-to-date winter chill
information 6 grower workshops 3 grower technical working group meetings 2 industry surveys 28
articles published in industry magazines 5 presentations at industry conferences 15 presentations at
government and industry stakeholder meetings 11 media items in-print and on radio 9 technical reports
2 dedicated project web pages 6 regional chill factsheets numerous blogs 5 scientific publications and
presentation at 2 scientific conferences
The project trial sites were located in three growing regions (Western Australia Victoria and
Queensland) however significant effort was made to extend and communicate project outcomes more
broadly across the industry Grower workshops and technical working group meetings were held in New
South Wales and South Australia Collaboration with researchers from the University of Tasmania through
the lsquoCrossing the threshold adaptation tipping points for Australian fruit treesrsquo project and the dormancy-
breaking spray trial facilitated effective communication with industry in that state In addition multiple
members of the research and extension team organized and operated a project stand in the trade hall of
the 2015 National Horticulture Convention in conjunction with the Department of Economic Development
Jobs Transport and Resources
To measure lsquogreater understandingrsquo of climate change by the apple and pear industry an extensive
surveying process before and after project completion would have been required This was not
undertaken as part of the project however the extent of project outputs delivered across the country
give a good indication of the level of engagement that this project successfully achieved
In the next few years the project impact will be measurable by assessing the level of uptake and use of
the grower publications and lsquowinter chill and growing degree dayrsquo website In addition national networks
developed over the last four years between members of the project team and industry are likely to
continue to provide ongoing benefit to Australian horticulture as its members move to reduce
vulnerability to climate change risks
40
Effectiveness of project activities in delivering project outputs and achieving intended
outcomes
Efficiency of the delivery mechanisms and appropriateness of the methodology
A mid-term project review conducted in 2014 by Professor Snow Barlow from The University of
Melbourne found the research to be lsquoscientifically rigorous and directed towards the contracted objectives
of the projectrsquo The review highlighted the good progress made by the research and extension team in
engaging with industry and in the delivery of a broad information mix incorporating immediate adaptive
strategies such as netting to reduce sunburn risk and future long-term climate change impacts
Our use of small grower-based technical working groups to receive guidance on research project direction
and outputs was sound methodology but required considerably more resources to maximize its value
The process of establishing these groups nationally running meetings compiling and disseminating
outcomes and maintaining communication with the groups throughout the project was significant
Ideally the groups need to be coordinated by a local industry representative with strong connections to
the industry in their region and good knowledge of the industry itself
Barriers to communication and extension around climate change adaptation
Effective communication between researchers and growers is particularly important in delivering
messages on climate change impact and adaptation due to the vast quantity of information and
misinformation in the public sphere A number of communication and extension barriers were identified
during the course of project engagement activities (Table 6) and these learnings were used to improve
the effectiveness of our communications
For example widespread confusion in the industry around measurement of winter chill and chilling
requirements was identified as a significant barrier to effective communication of research findings
related to climate change impacts on winter chill and flowering As a result the lsquowinter chill and growing
degree dayrsquo website was developed (as part of a project variation) to provide chill calculation tools and
supporting information for industry with the aim of improving understanding and enabling better
management of low winter chill years in orchards across Australia
41
Table 6 Barriers to communication and extension around climate change adaptation
Barriers Comments
Skepticism of climate change Communication with growers nationally
suggested that this was a minority of industry
Conflicting messages from Governments
regarding potential climate change impacts and the need for adaptation
Feeling of responsibility for climate change
without having realistic strategies to combat it
Resistance to implementing changes required for climate change adaptation
Could be for a variety of reasons including financial and family pressures
Timing of communication- needs to be considered in the context of production
stresses more broadly
Growers in the midst of battling drought are unlikely to be concentrating on understanding
chilling requirements Information provided needs
to be carefully matched with local industry needs
Large knowledge gaps in the science For example it is difficult for growers to make
cultivar choices based on climate suitability due
to the lack of basic understanding around chilling requirements and tolerance to heat
Confusion around chilling requirements and measurement of winter chill
Generated historically by the reporting of winter chill in different units and general spread of
misinformation
Confusion around the terms lsquoclimate variabilityrsquo versus lsquoclimate changersquo
Confusion over the use of different scientific
terminologies
Need to use consistent terminology in all
communications for example around winter chill and phenological stages
Feedback on activities and quality and usefulness of project outputs
Feedback on research and extension activities was obtained from a broad cross-section of apple and pear
growers and industry representatives nationally through meetings with APAL staff and discussions and
evaluations at grower workshops A formal evaluation completed by 12 growers at the Bilpin workshop in
2015 indicated that 100 of them found the workshop content useful for their orchard businesses and
that they would like to attend further events Similarly positive results were obtained elsewhere through
informal discussions
In addition feedback was sought via the project websites through Australian Fruitgrower articles and
regular discussions with growers on-site during research data collection and various grower meetings
Grower experiences of local climate change impacts were often communicated during one-on-one
conversations The APAL industry conferences were utilized as an effective medium for sharing project
outcomes A dedicated project stand and display was set up in the exhibition hall at the National
Horticulture Convention on the Gold Coast in 2015 for the purpose of sharing project outcomes
responding to targeted inquiries and obtaining feedback from industry nationally
42
The value of online project outputs can be quantified through the number lsquohitsrsquo to project website pages The project pages on the Horticulture Industry Network site have received 987 hits since they were developed in 2014 indicating the usefulness of this medium for project communication
Scientific feedback was obtained from within the project team as well as through linkages with
researchers nationally Critique of research methodology and results was sought from international
scientists through publication in peer-reviewed journals presentations at scientific conferences and
through hosting visits from international researchers
Feedback received was discussed with the project team during the monthly teleconferences and annual
face-to-face meetings and was incorporated back into the project as deemed appropriate by the group
Key learnings
Climate change will add significant variability into the pome fruit crop production system with respect to
flowering and fruit quality Most Australian growers are already used to dealing with some level of climate
variability and it seems likely that impacts on flowering and fruit quality may be within the range of
grower experience up to around 2030 but that by 2050 growers will be operating outside of current
experience This will present challenges for the Australian industry in the consistency of supply and in
maintenance of the uniform orchard blocks that are a prerequisite for the efficient use of mechanisation
Precise timeframes for impacts of warming temperatures on pome fruit production are difficult to
determine because of the amount of variability in both the climate (including microclimate) and orchard
production systems For example under the worst case scenario Manjimup is projected to receive an
average of 46 chill portions in 2050 This means that in cold years there is likely to be plenty of chill for
apple production but warm years will challenge many current commercial cultivars If the grower has
adapted by planting lower chill cultivars and adjusted their management practices they are more likely to
grow a good crop every year
The Australian apple and pear industry in Australia and globally has a strong capacity for adaptation to
the changing climate due to the availability of new technologies for crop sensing opportunities for
protected cropping a strong research history in crop physiology and availability of a broad diversity of
scion and rootstock genetics Genetic diversity in particular can be exploited to ensure commercial
cultivars are better adapted to the changing climatic conditions
Successful adaptation to the changing climate will be supported by capture and interpretation of data on
tree phenology climate and orchard practices Australiarsquos industry is made up of growing regions with
diverse climates and much can be learnt about climate change impacts and options for adaptation by
sharing of knowledge In future more comprehensive data will be collected on orchards through the use
of sensing and mapping technologies This data can be used to undertake more sophisticated and
comprehensive analysis of flowering patterns and variability between and within locations
Specific research learnings are listed under the stated project objectives
1 Develop climate change scenarios for pome fruit growing regions of Australia in 2030
and 2050 including the likely impact of climate change on winter chill and extreme
heat
- Australia has undergone a consistent warming trend since 1910 however at a local level the
experience of climate change has been different in each pome fruit growing region Changes in
average minimum and maximum temperatures and extreme heat for the period from 1968 to
43
2016 varied between locations
- Milder growing regions have experienced a decline in annual winter chill accumulation since 1968
while the colder regions of Huonville and Orange have not changed
- Increases in the number of extreme heat days have been experienced in Shepparton and Mt
Barker while the frequency of extreme heat days in Manjimup in the last seven years has been
above the long-term average
- The climate projections for 2030 and 2050 show that all pome fruit regions across Australia can
expect to experience
Declines in winter chill accumulation Warmer winter growing regions such as Manjimup and
Applethorpe were projected to experience a reduction in winter chill of 20 to 30 by 2050
A decline of between 10 and 15 chill was projected for the coldest regions (Huonville and
Orange) over the same period
An increase in the number of extreme heat days during the growing season The greatest
impacts were projected to be in regions such as Shepparton and Mt Barker with hot summer
climates
- Climate change impacts on winter chill are likely to be within grower experiences of season-to-
season variability up to approximately 2030 On-farm adaptation to this variability will reduce
longer term climate change risk to orchard profitability By 2050 it is likely that growers will be
operating under climates outside of the current range of experience for a particular region
- Expression of climate change projections in terms of meaningful horticultural climate metrics
(chill portions and sunburn browning risk days) instead of average temperatures improves their
value to industry by directly linking projected changes in climate with impacts on production
2 Understand how changes in autumn winter and spring temperatures might impact
the timing and quality of flowering in cultivars of apple and pear
- Analysis of winter chill and flowering from 2012 to 2015 in Applethorpe Shepparton and
Manjimup showed
Low winter chill as observed in Manjimup was associated with uneven chill accumulation caused by short periods of warm weather throughout the autumn and winter seasons
Low winter chill in Manjimup was associated with greater variability in flowering dates between seasons cultivars and individual trees and irregular and protracted flowering across most apple cultivars relative to the other sites
The variable pattern of flowering observed in Manjimup was likely the result of mild winter
conditions and inadequate chilling for some cultivars
- Analysis using Manjimup as a climate analogue for Stanthorpe in 2030 indicated that growers in
the Stanthorpe region were likely to experience a more variable and protracted pattern of
flowering across many apple cultivars by 2030 but without any clear negative impact on
productivity Use of dormancy-breaking sprays is an adaptation option There was with no clear
need to shift to different cultivars or species at this stage (objective 3)
- Projections from the chill-overlap model for timing of full bloom in lsquoCripps Pinkrsquo apple in 2030 and
2050 showed
An earlier full bloom date on average in some high chill locations (for example in Orange) in
44
2030 and 2050
A later full bloom date at the milder winter locations (Applethorpe Manjimup and even
Shepparton) in 2030 with average flowering dates delayed by more than a week in 2050
Changes in flowering time for lsquoCripps Pinkrsquo in 2030 are likely to be within the current range of
grower experience
- Increased frequency of low chill years in milder winter growing regions will likely result in
symptoms of inadequate chill in some cultivars Advances in the timing of flowering might be
observed in cooler winter regions Changes in the timing of flowering can result in reduced yields
in cases where the flowering period of polliniser trees no longer overlaps that of the commercial
cultivar
3 Identify adaptations to manage any negative effects of climate change on flowering
- The dormancy-breaking spray trial in lsquoGalarsquo apple in Qld WA and Tas demonstrated that
Dormexreg Waikentrade and Ergerreg were able to advance flowering time and compact the
flowering period
Fruit maturity was advanced with dormancy-breakers and generally reflected differences in
flowering dates
Dormancy-breaking sprays are likely to be an effective tool for managing flowering in lsquoGalarsquo
and other apple cultivars in lower chill years in Australia
Benefits from the use of dormancy-breakers are likely to be greater in low chill years when
the potential impacts of inadequate chill on flowering are greatest Therefore benefits are
likely to increase under future climate scenarios
- Changes to cultural practices will be required to manage symptoms of inadequate chill such as
delayed irregular and protracted flowering
Development of an appropriate chemical thinning program for managing buds at multiple
stages of green tip and flowering on individual trees
Careful hand thinning to optimise crop uniformity when fruitlets vary considerably in size and
developmental stage
Additional labour input to pick fruit at the appropriate stage of maturity when there is a
greater spread of fruit maturity at harvest
Pollination management to reduce the risk of poor flowering overlap in any particular year
caused by large shifts in flowering dates between cultivars and seasons
- The increased irregularity and unevenness of flowering is likely to be a greater management
challenge for Australian growers than managing changes in flowering time as growers are
already experienced at dealing with large shifts in flowering dates between seasons
- Using forced bud methodology to determine chilling requirements apple cultivars fell into groups
with low (lsquoCripps Redrsquo lsquoManchurianrsquo crab apple) medium (lsquoRS103-110rsquo lsquoGranny Smithrsquo lsquoCripps
Pinkrsquo lsquoKaleirsquo) and higher chilling requirements (lsquoGalaxyrsquo lsquoFujirsquo lsquoHi-Earlyrsquo) Groupings such as these
enable growers to make more informed cultivar and polliniser choices at planting based on the
winter chill climate in their region
45
4 Understand how changes in the frequency of extreme heat days might impact on the
incidence of sunburn in pome fruit and the effectiveness of netting as an adaptation
strategy
- Minimum air temperatures for potential sun damage in lsquoRoyal Galarsquo apple were established
341degC and 387degC respectively for browning and necrosis for non-netted fruit
379degC for browning under netting
- Air temperature thresholds were applied across southern Australia and potential sun damage risk
and effectiveness of netting was determined under future climates
Shepparton Mt Barker and Manjimup were the most adversely affected by projected
increases in the percentage of days with potential sunburn browning risk in January and
February
The percentage of risk days in Shepparton was projected to increase from 18 at present to
28 to 36 in 2050 with the installation of netting reducing the risk considerably to around 9
to 13
- Most growing regions are likely to notice an increased sunburn risk by 2030 (if they havenrsquot
already) By 2050 growers in regions with currently milder summers will need to have adapted
their current orchard practices to manage the impacts that an increased frequency of heat events
will have on fruit quality
- The thermodynamic Smart-Sinclair model was tested on lsquoRoyal Galarsquo grown under net and no net
and was able to predict fruit surface temperature with a root mean square error of 2 to 3degC
Netting reduced the median fruit surface temperatures by 15 to 20degC
- The thermodynamic Smart-Sinclair model can be used to understand processes and quantify the
effects of various netting structures on fruit surface temperature and sun damage risk but
cannot be used for predicting the effects of climate change due to the lack of reliable projected
solar radiation and wind speed data
5 Understand how different colours of netting impact on the orchard environment fruit
yield and quality
- Comparison of black and white netting at the Western Australian netting demonstration site
showed little difference in environmental conditions or bud burst and flowering under the black
netting white netting and non-netted orchard blocks Fruit surface temperatures were higher in
the no net apples
6 Understand how the changing climate might impact the yield potential of apples
- The Malusim model for the prediction of potential apple yield could not be positively validated
under Australian conditions as it was generally a poor predictor of yield for lsquoRoyal Galarsquo and
lsquoCripps Pinkrsquo at multiple sites in Australia
- The MaluSim model was able to predict fruit weight of lsquoRoyal Galarsquo trees at the North Shepparton
site and supported use of the model for preliminary investigation of influences of climate change
on potential yield The predicted impact of increased temperatures (+ 2degC) on yield in lsquoRoyal
Galarsquo apples in north Victoria was minor under the conditions modelled in this investigation
46
Recommendations
Industry
- The following tools and strategies are recommended for adaptation to an increased frequency of low
chill years in milder growing regions of Australia
Planting lower chill cultivars Matching cultivars to their chilling climate is the best option but
it is not always possible due to market pressures and a lack of information on chilling
requirements
Management of delayed and variable flowering with the use of dormancy-breakers
Development of a set of broad guidelines around the use of dormancy-breaking sprays based
on existing knowledge Such guidelines could include information on when dormancy-
breaking sprays should be used and in which cultivars and regions
Adjustments to chemical and hand thinning practices to reduce variability in fruit size and
maturity
Use of the lsquowinter chill and growing degree dayrsquo website for monitoring in-season chill
accumulation
Preparation of an orchard management strategy to enact in low chill years This would likely
include monitoring of winter chill accumulation and the use of dormancy-breakers
Comprehensive in-orchard monitoring of flowering dates across cultivars to provide early
indication of cultivars that might be impacted by warmer winters as well as identification of
subtle shifts in the timing of flowering between cultivars and their pollinisers
In blocks where flowering is becoming increasingly irregular growers will need to assess the
point at which the increased cost of inputs and effort required to produce a consistently high
quality crop make a block of trees unprofitable
- To reduce the risks to pollination from shifting flowering times planting of multiple polliniser cultivars
with early middle and late flowering habits to ensure a good supply of pollen throughout the
flowering period is recommended where possible Use of floral bouquets or artificial pollination
methods can be considered to compensate for loss in flowering overlap
- The following tools and strategies are recommended for adaptation by the apple and pear industry to
increased frequency of extreme heat
Continued investment in netting in locations such as Manjimup and Orange where many
orchards are currently un-netted
Use of air temperature thresholds as a guide for using overhead sprinklers for evaporative
cooling in efforts to minimize potential sunburn damage
Planting heat tolerant cultivars As for winter chill matching cultivars to their growing climate
is the best option but it is not always possible due to market pressures and a lack of
information on different heat tolerances of cultivars
Development of orchard practice guidelines for managing extreme heat (bringing together
47
aspects of tree canopy structure evaporative cooling netting types irrigation nutrition
spray-on protectants and other stress reduction products)
Development of orchard practice guidelines for optimising post-harvest fruit quality in warm
to hot summerautumn conditions (pre and post-harvest management)
- For improved tactical and strategic planning in the orchard use of the Bureau of Meteorology climate
outlook videos (httpwwwbomgovauclimateoutlooksoverviewsummary) State of the Climate
reports (httpwwwbomgovaustate-of-the-climate) and the lsquoclimate change in Australiarsquo website
(httpswwwclimatechangeinaustraliagovauen) is recommended
- It is recommended that the Australian apple and pear industry utilise and exploit the genetic diversity
available in scions and rootstocks globally to ensure that commercial cultivars can be better adapted
to the changing climatic conditions
- Climate analogues should be used to better identify the timeframes for impacts of low chill and
extreme heat on apple and pear production and the best strategies for adaptation For example
growers in Manjimup are already successfully managing the impacts of inadequate chill in some
years lessons can be learnt from their knowledge and experience
- This project focussed specifically on climate change impacts on crop physiology and it is
recommended that the industry undertake a broad economic assessment of climate change impacts
from storm events drought increased wind changes in evapotranspiration and so on
- The industry needs to consider how basic research gaps such as knowledge around relationships
between temperature and tree physiology may be filled in future years to ensure the flow of new
information and ideas into the industry does not become limited
Extension and communications
- Having an extension and research team working side-by-side from project start to end has significant
benefits for communications and industry engagement
- National collaboration was enormously beneficial to the success of this project as were linkages
between projects and across industries
- Having a core team responsible for communication ensured timely relevant and consistent
information was made available and utilising well established local grower groups and extension
officers ensured ease of facilitation
Scientific
Priority research needs
- Determination of significant biological thresholds (chilling requirements sunburn damage thresholds
pest and disease development thresholds) to enable conversion of weather and climate data into
useful horticultural metrics for everyday decision making
- Investigation of methods programs for evaluation of new and existing scions and rootstocks with
the objective of providing sufficient information to enable matching of apple and pear cultivars with
suitable growing climates including matching chilling requirements with winter chill and heat
48
tolerance with summer temperatures
- New genetics breeding programs are needed that focus on lower chill cultivars with good tolerance
for heat alongside other quality parameters
- Determination of genetic andor physiological markers of flower bud progression into dormancy and
out of dormancy prior to bud burst This would improve the definition of apple and pear chilling
requirements
- Efficacy of using dormancy-breaking sprays for long-term adaptation to warming temperatures
including the extent to which dormancy-breaking sprays can be used as an adaptation to low chill
years relationships between dormancy-breaking sprays and fruit quality particularly in cultivars and
investigations into alternatives to Dormexreg
- Methods for managing heat in the orchard for improved fruit quality
Efficient tree canopies for balancing multiple requirements including low sunburn damage
optimal fruit quality (including colour development) water-use efficiency and disease
management
Understanding relationships between orchard temperatures during the growing season and
fruit quality at harvest and after storage
Use of plant growth regulators and stress reduction chemicals
Additional research gaps
- Pest and disease management under warmer climates Codling moth are likely to increase generation
number per season fruit fly are likely to have an extended range and disease management under
netting on trellis systems will present new challenges particularly when combined with the use of
evaporative cooling
- Determination of the limits of profitable apple production with regards to winter chill Production
areas with very low winter chill accumulation in South Africa and Southern Brazil rely heavily on
dormancy-breakers and would be obvious target locations for a global investigative study
- Potential impacts of low winter chill on marketable yield
- For improved definition of apple and pear chilling requirements
Cultivar specific parameterisation of the Dynamic model for improved chill model
performance
Relationship between bud temperature and dormancy breaking
Standardisation of methods for determination of chilling requirements
Investigation of the potential role of day length in dormancy breaking in apples
Effectiveness of early versus late season chill in dormancy breaking
Role of root-zone temperature and rootstocks in bud burst
Relationship between temperatures received during autumn prior to dormancy and quality of
bud burst and flowering
Impacts of pruning and defoliation on modifying winter chill requirements
49
- Validation of the chill-overlap model with flowering data from cultivars other than lsquoCripps Pinkrsquo apple
to determine how flowering time will be impacted by climate change
- Better understanding of flowering in new and existing pear cultivars and the likely impacts of
changing climate
- Fruit surface temperature thresholds for sunburn for a wide variety of cultivars Transferability of fruit
surface temperature thresholds across cultivars and locations needs to be investigated
- Effectiveness of different types (colours weaves) of netting in reducing the risk of sunburn damage
and its effect on assimilation transpiration and fruit quality
- Impact of climate change on the duration of fruit development and maturity times for apple and pear
cultivars of interest
- Potential impacts of the extended growing season (caused by the later onset of cold temperatures in
autumn and warmer springs) on canopy management and fruit quality
- Impacts of warming spring and summer temperatures on flower bud initiation and development
- The impact of elevated CO2 temperature shifts on fruit maturation colour development and leaf fall
to improve predictions of yield under different climate scenarios
- Pollination in a changing climate Warming temperatures will impact bee behavior synchronisation of
flowering (due to changes in the timing of flowering) flower viability and floral bud initiation
- Potential for POAMA (Predictive Ocean Atmosphere Model for Australia) to make in-season and short
to medium-term climate forecasts with a level of accuracy necessary to inform decision making at
tactical and strategic levels
50
Scientific Refereed Publications Darbyshire R McClymont L Goodwin I 2015 Sun damage risk of Royal Gala apple in fruit growing
districts in Australia New Zealand Journal of Crop amp Horticultural Science 43 222 -232
McCaskill M R McClymont L Goodwin I Green S Partington DL How hail netting reduces apple
fruit surface temperature a microclimate and modelling study Agricultural and Forest
Meteorology 226ndash227 148ndash160
Parkes HA Tabing O McClymont L Combret M and Wilkie JD 2016 Variation in the flowering
phenology of apple and pear in Australia Acta Horticulturae 1130 (8) 55 - 61
Parkes H Darbyshire R and White N Chilling requirements of apple varieties grown in mild Australian
winter conditions Prepared for HortScience
Webb L Darbyshire R Erwin T and Goodwin I 2016 A robust impact assessment that informs
actionable climate change adaptation Future browning-risk in apple crops International Journal
of Biometeorology Doi101007s00484-016-1268-y
51
Intellectual PropertyCommercialisation
No commercial IP generated
52
Acknowledgements The research described in this final report is a culmination of the inputs and efforts of a great many
individuals over the course of the last four and a half years
The project team would like to thank the following people for their work in the provision of technical and
farm support and for their contribution of knowledge and ideas along the way Jeff Paten John
Finocchiaro Wendy Sessions David Cornwall Diana Fisher Rohan Prince John Sutton Penny Measham
and Steve Paterson We also thank Marco Calderon for his work analysing individual bud data for his
Masterrsquos degree from the University of Melbourne
The cooperation and collaboration of a number of growers was essential for the timely collection of
phenology fruit quality and netting data used for this research The project team would like to thank
Steven and Ugo Tomasel Celeste from C Pozzebon amp Co Anne and Mauri Lyster Maurice Silverstein
Geoffrey Thompson and Scott Price
For their support in providing us with opportunities to speak at industry events publish in the Fruitgrower
magazine and deliver information via the APAL website we would like to thank Angus Crawford Sophie
Clayton and Richelle Zealley The project team also thank Kevin Dodds Marcel Veens and Fruit Growers
Victoria for on-the-ground help with the organization and delivery of the grower workshops
And finally we acknowledge the valuable contributions of all of the industry representatives and apple
and pear growers across Australia who attended workshops and seminars answered surveys and
provided us with the comments and interesting anecdotes that kept challenging our thinking and helped
us focus our work Thank you
53
Appendices
1 White N 2016 Technical report Analysis of historical and future climate and the production of
pome fruit Department of Agriculture and Fisheries Queensland 29 pp
2 Parkes H and White N 2016 Technical report Flowering in pome fruit trees across Australia
implications of a changing climate Department of Agriculture and Fisheries Queensland 21 pp
3 Parkes H and White N 2016 Technical report A climate analogue approach to understanding
climate change impacts on flowering in Australian pome fruit trees Department of Agriculture
and Fisheries Queensland 17 pp
4 Parkes H MurphyWhite S and Bound S 2016 Technical report Dormancy-breaking sprays for
low winter chill in apples Department of Agriculture and Fisheries Queensland Pomewest
University of Tasmania 28 pp
5 Darbyshire R McClymont L Goodwin I 2015 Sun damage risk of Royal Gala apple in fruit
growing districts in Australia New Zealand Journal of Crop amp Horticultural Science 43 222 - 232
6 McCaskill M R McClymont L Goodwin I Green S Partington DL How hail netting reduces
apple fruit surface temperature a microclimate and modelling study Submitted to Agricultural
and Forest Meteorology 226-227 148 ndash 160
7 Webb L Darbyshire R Erwin T and Goodwin I 2016 A robust impact assessment that
informs actionable climate change adaptation Future browning-risk in apple crops International
Journal of Biometeorology Doi101007s00484-016-1268-y
8 MurphyWhite S Prince R and Starkie L 2016 Technical report Western Australian apple
netting demonstration site Pomewest 24 pp
9 McClymont L Darbyshire R and Goodwin I 2016 Technical report Apple yield response to
climate change and netting Department of Economic Development Jobs Transport and
Resources and University of Melbourne 15 pp
10 Treeby J 2016 Understanding apples and pears in a changing climate overview of the grower
workshops Department of Economic Development Jobs Transport and Resources 5 pp
54
References
Atkinson C J Brennan R M amp Jones H G (2013) Declining chilling and its impact on temperate perennial crops Environmental and Experimental Botany 91
Bound S A amp Jones K M (2004) Hydrogen cyanamide impacts on flowering crop load and fruit
quality of red Fuji apple (Malus domestica) [Article] New Zealand Journal of Crop and Horticultural Science 32(2) 227-234
Cobon D H Stone G S Carter J O Scanlan J C Toombs N R Zhang X et al (2009) The climate change risk management matrix for the grazing industry of northern Australia Rangeland Journal 31(1)
Cooke J E K Eriksson M E amp Junttila O (2012) The dynamic nature of bud dormancy in trees
environmental control and molecular mechanisms Plant Cell and Environment 35(10) 1707-
1728 Darbyshire R McClymont L amp Goodwin I (2015) Sun damage risk of Royal Gala apple in fruit-
growing districts in Australia New Zealand Journal of Crop and Horticultural Science 43(3) 222-232
Darbyshire R Pope K amp Goodwin I (2016) An evaluation of the chill overlap model to predict
flowering time in apple tree Scientia Horticulturae 198 142-149 Darbyshire R Webb L Goodwin I amp Barlow E W R (2013a) Evaluation of recent trends in
Australian pome fruit spring phenology International Journal of Biometeorology 57(3) Darbyshire R Webb L Goodwin I amp Barlow E W R (2013b) Impact of future warming on winter
chilling in Australia International Journal of Biometeorology 57(3) 355-366 Dennis F G Jr (2003) Problems in standardizing methods for evaluating the chilling requirements for
the breaking of dormancy in buds of woody plants HortScience 38(3)
Erez A Fishman S Linsley-Noakes G C amp Allan P (1990) The dynamic model for rest completion in peach buds Acta Horticulturae 276 165-174
Fishman S Erez A amp Couvillon G A (1987) The temperature dependence of dormancy breaking in plants mathematical analysis of a two-step model involving a cooperative transition Journal of Theoretical Biology 124 473 - 483
Ghariani K amp Stebbins R L (1994) Chilling requirements of apple and pear cultivars Fruit varieties journal 48(4) 215 - 222
Hauagge R amp Cummins J N (1991) Phenotypic variation of length of bud dormancy in apple cultivars and related Malus species Journal of the American Society for Horticultural Science 116(1) 100-
106
Hennessy K J amp Clayton-Greene K (1995) Greenhouse warming and vernalisation of high-chill fruit in southern Australia Climatic Change 30(3)
Lakso A N amp Johnson R S (1990) A simplified dry matter production model for apple using automatic programming simulation software Acta Horticulturae 276 141 - 148
Legave J M Blanke M Christen D Giovannini D Mathieu V amp Oger R (2013) A comprehensive overview of the spatial and temporal variability of apple bud dormancy release and blooming
phenology in Western Europe International Journal of Biometeorology 57(2)
Lolicato S (2011) Sun protection for fruit a practical manual for preventing sunburn on fruit - 2011 Department of Primary Industries Farm Services Victoria Division Melbourne Australia
Luedeling E Blanke M amp Gebauer J (2015) Chilling challenges in a warming world In J C Mauget amp S Godet (Eds) Acta Horticulturae (pp 901-907) Leuven Belgium International Society for
Horticultural Science (ISHS)
Luedeling E amp Brown P H (2011) A global analysis of the comparability of winter chill models for fruit and nut trees International Journal of Biometeorology 55(3)
Middleton S amp McWaters A (2002) Hail netting of apple orchards- Australian experience The Compact Fruit Tree 35(2) 51 - 55
Panda S S Hoogenboom G amp Paz J O (2010) Remote sensing and geospatial technological
55
applications for site-specific management of fruit and nut crops A review [Review] Remote Sensing 2(8) 1973-1997
Pope K S Da Silva D Brown P H amp DeJong T M (2014) A biologically based approach to
modeling spring phenology in temperate deciduous trees Agricultural and Forest Meteorology 198ndash199(0) 15-23
Putland D Deuter P Hayman P Hetherington S Middleton S Nidumolu U et al (2011) The apple and pear industrys response to climate change and climate variability a desktop study Growcom Fortitude Valley Queensland Australia
Smart R E amp Sinclair T R (1976) Solar heating of grape berries and other spherical fruits [Article] Agricultural Meteorology 17(4) 241-259
State of the climate (2016) Australian Bureau of Meteorology amp CSIRO Theron K (2013) Chemical thinning of apple South African perspective Acta Horticulturae 998 85 -
90
Treeby J Goodwin I MurphyWhite S Darbyshire R White N McClymont L et al (2017a) Winter chill and flowering- what is there to know Queensland
Treeby J Goodwin I MurphyWhite S Darbyshire R White N McClymont L et al (2017b) Netting for heat- what is there to know Queensland
Whetton P H Karoly D Watterson I G Webb L Drost F Kirono D et al (2013) Australias
climate in a four degree world In P Christoff (Ed) Four degrees of global warming Australia in a hot world (pp 17 - 32) London EarthscanRoutledge
White N Parkes H amp Treeby J (2017) Future climates in pome fruit orchards- what is there to know Queensland
TechnicalReportAnalysisofHistoricalandFutureClimateandtheProductionofPomeFruitNeilWhite
February2017
2
TableofContents
Technical Report Analysis of Historical and Future Climate and the Production of Pome Fruit1
Introduction5
Site Descriptions and Data Preparation5
Reliability of techniques used to interpolate between daily and hourly temperatures7
Models of Chill Accumulation8
What is winter chill8
Chill Hours9
Utah Chill Units9
Dynamic Model9
Trends in Temperature and Chill Accumulation11
Autumn and winter11
Winter chill13
Spring and Summer15
Extreme Heat17
Climate Scenarios for apple growing regions for 2030 and 205018
How were the scenarios chosen18
Selection of Global Climate Models20
Calculation of Climate Projections for Station Data21
Future Climate Projections and the Impact on Flowering23
Future Projections of Impact on Quality25
Discussion and Conclusions27
Take-home messages from the historical record28
Take-home messages from the future scenarios28
References29
3
ListofTablesTable1Descriptionofweatherstationsusedintheanalysis6
Table2DescriptionofGCMsusedinthisstudy21
Table3Summaryofaveragechillportions(1Marchndash31August)for2030and2050usingamoderate(RCP45)toworstcasescenario(RCP85)modellingapproachbasedonhistoricaldatafrom1985to2014Meanof30yearswithlowestandhighestinparentheses24
Table4Safewinterchillcalculationsfortheperiod1985to201424
Table5Summaryofaveragedateoffullbloom(CrippsPink)for2030and2050usingamoderate(RCP45)toworstcasescenario(RCP85)basedonhistoricaldatafrom1985to201425
Table6Summaryofmeanvaluesforbrowningrisk(percentageofdays)forJanuaryandFebruary26
ListofFigures
Figure1Australiarsquosappleandpearindustrycentres(white)andlocationsreferredtointhetext5
Figure2ExamplesoftheuseoftheinterpolationroutinetoconvertdailymaximumandminimumtemperaturestohourlyTheorangelineis21December2015andthebluelineis21June2015forApplethorpeDotsindicatethemaximum(orange)andminimum(blue)foreachdaythatwereusedtogeneratetheinterpolatedhourlydata7
Figure3MeasuredhourlytemperaturedataandhourlydatainterpolatedfromdailymaximumandminimumforApplethorpeLineshowsthe11correlation8
Figure4ComparisonofchillportionaccumulationcalculatedfromorchardhourlydatahourlydatainterpolatedfromtheorcharddailymaximaandminimaandthenearbyAWS8
Figure5Trendsintemperaturefrom1970to2015RedshowsthatthetrendintemperaturehasbeentowardshottertemperatureswhileblueshowsatrendtowardscoolertemperaturesThehighertheintensityofcolourthestrongerthetrendcopyCommonwealthofAustralia2016AustralianBureauofMeteorology11
Figure6Averageautumn-winterminimumtemperatureanomaliescomparedtoabaseperiodof1981to2010Theblacklineisan11-yearmovingaverage12
Figure7Averageautumn-wintermaximumtemperatureanomaliescomparedtoabaseperiodof1981to2010Theblacklineisan11-yearmovingaverage13
Figure8Annualanomaly(averagechange)inaccumulationofchillportions(1Marchndash31August)comparedtoabaseperiodof1981to2010Theblacklineisan11-yearmovingaverage14
Figure9Averagespring-summerminimumtemperatureanomaliescomparedtoabaseperiodof1981to2010Theblacklineisan11-yearmovingaverage15
Figure10Averagespring-summermaximum(right)temperatureanomaliescomparedtoabaseperiodof1981to2010Theblacklineisan11-yearmovingaverage16
Figure11Annualanomaly(averagechange)inaveragenumberofdayswheremaximumtemperatureexceeds35degCcomparedtoabaseperiodof1981to2010Theblacklineisan11-yearmovingaverage17
Figure12Measured(CapeGrimTasmaniaandMaunaLoaHawaii)andFutureCO2forRCP45andRCP85andmeasuredandpredictedtemperatureanomaly(TA)usingtherelationshownintheinset19
4
Figure13AccumulationofchillforhistoricalaverageconditionsatManjimupandforaprojectedclimatefor2030underRCP45andRCP85(top)Themonthlychangeinaveragetemperaturethatcausedthedifferenceinthechillaccumulationinthefutureisshowinthelowergraph20
Figure14MeanmonthlyminimumtemperaturesforApplethorpefor2030underRCP45(left)andRCP85(right)22
Figure15MeanmonthlyminimumtemperaturesforApplethorpefor2050underRCP45(left)andRCP85(right)22
Figure16TheChill-OverlapModelCristhechillrequiredforfloweringCoisthemaximumadditionalchillthatwillreducetheheatrequirementHristheheatrequiredwhenCochillisaccumulatedandHoistheheatrequiredwhenchillisanCr(RedrawnfromDarbyshireetal2016)23
5
IntroductionThisreportsetsoutourcurrentknowledgeofhowclimatechangewillaffectpomefruitgrowing
regionsinAustraliaAllthepomefruitgrowingregionsinAustraliahaveseenaconsistentwarming
trendsince1970forbothwinterandsummertemperaturesInresponsetothisgrowershavebegun
toadaptthemanagementoftheirorchardstocopewiththesechangestoremainprofitableThese
trendsarelikelytocontinuesowhatcangrowersexpectinthefuture
SiteDescriptionsandDataPreparation
Trendsintemperatureovertheperiod1968to2015havebeenpresentedastheyearlyaverage
change(anomaly)fromabaselineperiodof1981to2010(30years)foreachofthesitesshownin
Figure1
DatawereobtainedfromSILO1
(Jeffreyetal2001)arepositoryof
climatedataforAustraliaThereare
twosetsofdataavailableagridded
dailydatasetandthepatchedpoint
dataset(PPD)Dataforthesites
showninTable1wasextracted
fromthePPDwhichprovidesdaily
maximumandminimum
temperaturesfrom1889tothe
presentInterpolatedvaluesare
insertedtomaintaincontinuitywhen
dataaremissingforsomereason
egthestationwasnotoperating
duetomalfunctionInterpolationis
usuallyfromdailysurfacesbutinsomecasesmightcomefrommorelong-termandhenceless
accuratespatialdataThesitesselectedforthestudyhadagenerallylownumberofdayswhendata
wasmissing(Table1)
1httplongpaddockqldgovau
Figure1Australiarsquosappleandpearindustrycentres(white)andlocationsreferredtointhetext
6
MeteorologicalstationsinAustraliathatrecordtemperatureareasmallfractionofthetotalnumber
ofstationsStationsatlocalpostofficesthatrecordeddatabyhandhavesometimesbeenclosedin
favourofautomaticweatherstations(AWS)nearbyoftenatanairfieldThePPDresolvessomeof
theseproblemsandprovidesdataforstationsregardlessoftheirprevioushistoryHoweverthis
reducesthereliabilityofdatasetsfromstationswithalotofmissingobservationsMountBarkerand
OrangewereusedhereinpreferencetoLenswoodandBatlowrespectivelybecausethesestations
havemorereliablehistoricaltemperaturerecords
Table1Descriptionofweatherstationsusedintheanalysis
StationNumber
StationName2
(Shortname)
LongitudeLatitude
FirstObservation LastObservation
Missing()
41175 Applethorpe 15195degE2862degS
1Jan1968 Current 74
81049 TaturaInstituteforSustainableAgriculture
(Shepparton)
14539degE3643degS
2July1965 Current 32
9573 Manjimup 11614degE3425degS
2Jan1968 Current 37
63254 OrangeAgriculturalInstitute
(Orange)
14908degE3332degS
2Jan1976 Current 203
94069 Grove
(Huonville)
14708degE4298degS
1Jan1968 10Feb2010 203
23733 MountBarker 13885degE3507degS
1Jan1968 Current 19
2DataforSheppartonandHuonvillecomesfromtheTaturaInstituteforSustainableAgricultureandGroverespectively
7
ModelsforcalculatingwinterchillrelyonhourlydataHoweverhourlydataisnotgenerallyavailable
fromtheBureauofMeteorologyweatherstationsandneedstobegeneratedfromdailymaximaand
minima
DailydatawereconvertedtohourlyusingtheroutineinthechillRpackage(Luedelingetal2013)
usingtheRStatisticalLanguage(RCoreTeam2015)Thisusestheinterpolationroutinedevelopedin
Linvill(1990)AnexampleofthisinterpolationisshowninFigure2
Figure2ExamplesoftheuseoftheinterpolationroutinetoconvertdailymaximumandminimumtemperaturestohourlyTheorangelineis21December2015andthebluelineis21June2015forApplethorpeDotsindicatethemaximum(orange)andminimum(blue)foreachdaythatwereusedtogeneratetheinterpolatedhourlydata
Reliabilityoftechniquesusedtointerpolatebetweendailyandhourlytemperatures
Hourlytemperaturedatafor2013inApplethorpe(collectedfromanon-siteorchardtemperature
loggerARS1)wasusedtoassesstheaccuracyoftheinterpolationmethodThedailymaximaand
minimaweretakenfromtheorchardhourlydatasetandtheinterpolationmethodwasappliedto
recreatethehourlydataTheorchardhourlydatawasthencomparedwiththeinterpolatedhourly
dataFigure3
Thecorrelationcoefficientis097indicatingacloserelationshipbetweenthetwosetsofdata
howevertheeffectoftheinterpolationcanstillbeseenThesensitivityoftheDynamicModeltothe
discrepanciesbetweenobservedandinterpolatedhourlydataneedstobeassessedintermsofchill
accumulationandheatstress
8
Figure3MeasuredhourlytemperaturedataandhourlydatainterpolatedfromdailymaximumandminimumforApplethorpeLineshowsthe11correlation
Figure4ComparisonofchillportionaccumulationcalculatedfromorchardhourlydatahourlydatainterpolatedfromtheorcharddailymaximaandminimaandthenearbyAWS
Thechillportionscalculatedfromthethreedatasetswereincloseagreementwhichisimportantas
theSILOdataneedstobeusedtoconsiderfutureclimateprojectionsFigure4
Theimpactoftheinterpolationonthecalculationofheatthresholdsismoreproblematic
Interpolationfromdailyorcharddatatohourlyoverestimatedthenumberofhoursexceeding30degC
by36Importantlybasedonthenumberofdaysexceedingthe30degCthresholdtherewasonlya
differenceoftwodaysbetweenorcharddailyandtheautomaticweatherstation(AWS)dataThisis
acceptableandistheapproachthatisusedinourstudy
ModelsofChillAccumulationWhatiswinterchill
Thedormantwinterphaseisanevolutionaryadvantagethatprotectsfruittreesfromcoldweather
damagebypreventingthegrowthofcold-sensitiveshootsandflowersinresponsetoawinterwarm
spellFortreestoresumegrowthinspringthisdormantphasemustbebrokenPerennialfruittrees
breakdormancyaftercertainwinterconditionshavepassed-thetreehasthendeterminedthat
winterhasfinishedandwillbegintoflowerinresponsetowarmtemperaturesThewinterchill
requiredtobreakdormancythechillingrequirementdiffersbycropandvarietyandpossibly
locality
AccumulationofwinterchilltobreakdormancyislargelyatemperaturedependentprocessThe
relationshipofdifferenttemperaturesandtemperatureregimestodormancybreakingarespecies
andcultivar-specificbuttherearesomegeneralaspectsthatarethoughttobeinvolved
bull Freezingtemperaturesdonotcontributetodormancybreaking
9
bull Thereareoptimumtemperaturesfortheaccumulationofwinterchill
bull Temperatureseithersideoftheoptimumdecreasethecontributiontowinterchill
bull Hightemperaturescanundopreviouslyaccumulatedchill
bull Cyclingmoderatetemperatureswitheffectivechillingtemperaturesenhancesthe
accumulationofwinterchill
bull Itisstilllargelyunknownwhenatreebecomessensitivetothechillingtemperaturendashitcould
evenbebeforeleafdrop
TheseassumptionscanbeexpressedasasetofcalculationsthattogetherformachillmodelThe
threemostcommonmodelsareChillHoursUtahChillUnitsandtheDynamicModel
ChillHours
TheChillHoursmodel(Weinberger1950)isbyfarthesimplestmodelItaccumulatesthenumberof
thehourswherethetemperatureislessthan72degCandgreaterthan0degCThereisaformthatalso
includeshoursbelow0degCbutinthisstudywehaveusedthe0degCthreshold
UtahChillUnits
Thismodel(Richardsonetal1974)usesaslightlymorecomplicatedprocedureinwhichlowandhigh
temperaturesadverselyaffecttheaccumulationofchillThemethodofcalculationisasfollows
whereTisthetemperaturerecordedforthehourindegC
LowerLimit(TgtdegC) UpperLimit(Tlt=degC) ChillUnitsContributed
14 0
14 24 05
24 91 10
91 159 05
159 18 -05
18 -10
Hoursspentatorbelow14degCdonotcontributetochillaccumulationGreatestchillaccumulationis
between24andlessthanorequalto91degCTemperaturesabove159degCreducethechill
accumulationastheycontributenegativechillunits
DynamicModel
10
TheDynamicModel(Fishmanetal1987Erezetal1990)whichcalculateschillinChillPortionsis
themostcomplexofthechillmodelsItisthecurrentbestpracticemodelespeciallyinwarmer
climates(Erez2000Luedelingetal2011)andisthereforethemodelwehaveusedforwinterchill
calculationsInthismodelaccumulationofchillisadynamicprocesswherebytheequationsdescribe
thebuild-upofahypotheticaldormancybreakingfactor(DBF)throughatwo-stepprocess
TheaccumulationofDBFisreferredtoasChillPortionsandaChillPortionhasaccumulatedwhenthe
amountofDBFreaches1AtthispointitformspartofthestablepoolandcannotbedestroyedIf
lessthan1iscurrentlyinthelabilepoolitcanbereducedThisisseenwhenwarmtemperatures
occurandthereisnochillaccumulationHoweverthecurrentnumberofChillPortionsisnot
reducedProductionofDBFoccursbetween0degCand12degCandisoptimalbetween6degCand8degCThe
modelalsocapturesthesituationobservedinsometreecropswhereaccumulationofchillis
enhancedwheniftemperaturesintherange13degCto16degCarecycledwithlowertemperatures
11
TrendsinTemperatureandChillAccumulationTrendsintemperaturehavebeenassessedintermsofannualtemperatureandseasonalmaximum
andminimumtemperaturesforeachofthesitesTheBureauofMeteorology(BoM)maintainsaweb
pagethatallowstrendsinclimatevariablestobeassessed3ThemapsshowninFigure5show
consistentwarmingtrendsacrossthepomeandstonefruitgrowingregions
Figure5Trendsintemperaturefrom1970to2015RedshowsthatthetrendintemperaturehasbeentowardshottertemperatureswhileblueshowsatrendtowardscoolertemperaturesThehighertheintensityofcolourthestrongerthetrendcopyCommonwealthofAustralia2016AustralianBureauofMeteorology
Autumnandwinter
Autumnandwintertemperatureslargelydetermineprogressionthroughdormancyandsignificantly
impactfloweringtimingandqualityinpomefruittreesForexamplewarmweatherinautumn
causesdelaysinleafdropandslowstheentranceintodormancyMildwintersresultinginalackof
winterchillcausedelayedunevenandprotractedflowering
3httpwwwbomgovauclimatechangetabs=Trackeramptracker=timeseries
12
MinimumtemperaturesinautumnandwinterhaveincreasedinHuonvilleOrangeandMtBarker
since1968(Figures6)InHuonvilleandOrangethewarmingtrendismoreapparentinminimum
temperaturesthanmaximumsoverthisperiodwhileApplethorpeSheppartonManjimupandMt
Barkerallshowanincreaseinmaximumautumnandwintertemperatures(Figure7)
Applethorpe Shepparton
Manjimup Huonville
Orange MountBarker
Figure6Averageautumn-winterminimumtemperatureanomaliescomparedtoabaseperiodof1981to2010Theblacklineisan11-yearmovingaverage
AtApplethorpeSheppartonandMountBarkeritwasmorelikelythatafter1990maximum
temperaturesduringautumnandwinterwouldgreaterthanthelong-termaverage(Figure7)
13
Applethorpe Shepparton
Manjimup Huonville
Orange MountBarker
Figure7Averageautumn-wintermaximumtemperatureanomaliescomparedtoabaseperiodof1981to2010Theblacklineisan11-yearmovingaverage
Winterchill
ThemildergrowingregionsofApplethorpeManjimupandMtBarkerhaveexperiencedadeclinein
thenumberofchillportionsaccumulatedsince1968(Figure8)Sheppartonhasseenasmall
reductioninwinterchilloverthisperiodwhilethecolderregionsofHuonvilleandOrangehavenot
changedEightoutoftenyearsinManjimupfrom2006to2016havehadlesswinterchillthanthe
long-termaverageFigure8
14
Applethorpe Shepparton
Manjimup Huonville
Orange MountBarker
Figure8Annualanomaly(averagechange)inaccumulationofchillportions(1Marchndash31August)comparedtoabaseperiodof1981to2010Theblacklineisan11-yearmovingaverage
15
SpringandSummer
Temperaturesexperiencedinspringandsummerareanimportantdriverofflowerandfruit
developmentandsignificantlyimpactonfruitqualityinappleandpeartreesForexamplewarm
weatherinspringtendstoshortentheperiodoffloweringandheatinsummerimpactscolour
developmentthroughinhibitionofanthocyanins(Lin-Wangetal2011)Extremesummer
temperaturesinhibitfruitgrowthandcausesunburnbrowning(Flaishmanetal2015)
Applethorpe Shepparton
Manjimup Huonville
Orange MountBarker
Figure9Averagespring-summerminimumtemperatureanomaliescomparedtoabaseperiodof1981to2010Theblacklineisan11-yearmovingaverage
16
TherewereclearwarmingtrendsintheminimumspringandsummertemperaturesatOrangeand
MtBarker(Figure9)AtSheppartonOrangeandMountBarkeritwasthreetofourtimesmorelikely
thattheaverageminimumtemperaturemeasuredafter1990wasgreaterthanthelong-term
averagecomparedtothatmeasuredbefore1990Springandsummermaximumtemperatureshave
warmedinmostlocationssince1968exceptforHuonville(Figure10)Thishasimplicationsforthe
frequencyofextremeheateventsandwarmerspringtemperaturesmayhaveoffsetthereductionin
chillingobservedinmildergrowingregions
Applethorpe Shepparton
Manjimup Huonville
Orange MountBarker
Figure10Averagespring-summermaximum(right)temperatureanomaliescomparedtoabaseperiodof1981to2010Theblacklineisan11-yearmovingaverage
17
ExtremeHeat
Sheppartonhasexperiencedanincreaseinthenumberofextremeheatdays(iemaximum
temperatureexceeded35degC)receivedperyearsince1968(Figure11)Maximumtemperaturesrarely
exceedthisthresholdinApplethorpeandHuonvilleandthesesiteshavenotseenmuchchangeover
theperiodMountBarkershowedasignificanttrendinthenumberofheatdaysandthelastsixyears
inManjimuphavebeenabovethelong-termaverage
Applethorpe Shepparton
Manjimup Huonville
Orange MountBarker
Figure11Annualanomaly(averagechange)inaveragenumberofdayswheremaximumtemperatureexceeds35degCcomparedtoabaseperiodof1981to2010Theblacklineisan11-yearmovingaverage
18
ClimateScenariosforapplegrowingregionsfor2030and2050
Howwerethescenarioschosen
Futureclimateprojectionsarederivedusingsimulationsoftheearthrsquosclimatesystem(GlobalClimate
ModelorGCM)underdifferentscenariosoffuturegreenhousegasandaerosolemissionsThe
scenariosarereferredtoasrepresentativeconcentrationpathways(RCPseeinsetbelow)and
representaplausiblesetoffutureemissionsAGCMusesthisinformationthroughthecomplexset
ofequationsthatdeterminehowtheclimaterespondstochangesintheatmosphereRCPsare
classifiedbytheamountofradiativeforcing(seeinset)thatwillbeexperiencedin2100
The measured and projected levels of atmospheric CO2 are shown in Figure12 It is worth noting
that the projected level in 2100 under RCP 45 is the same as the level reached in 2050 under
RCP 85 The observed emission trends (2005-2012) are in line with the worst-case scenario
RCP85(Petersetal2012) Policy decisions made over the next decade or so will be critical in
RepresentativeConcentrationPathways(RCPs)
Radiativeforcingistheextraheatthattheloweratmospherewillretainasthe
resultofadditionalgreenhousegasesIn1979thisamountedto17Wm-2By
2014thishasrisento29Wm-2In1979theCO2concentrationwas335ppmThe
currentlevelasofFebruary2016is398ppm
RCP45andRCP85havebeenselectedtorepresenttherangeofplausiblefuture
climates
RCP45achievingloweremissionsduetosomemitigationeffortsandtheCO2
concentrationreaching540ppmby2100(risingmoderatelyrapidlyandthen
peakingearly)ndashsettingaminimumtomediumcaseclimatechangescenario
RCP85abusiness-as-usualapproachwithCO2concentrationcontinuingtorapidly
risereaching940ppmby2100ndashsettingaworst-caseclimatechangescenario
Source(ButlerandMontzka2016CSIRO2016)
19
determining the pathway that is taken Data from BoM4 of the global temperature anomaly and
yearly maximum atmospheric CO2 recorded at Mauna Loa from 1958 to 2016 were used to
derive a simple relationship between them that accounts for 82 of the variation (see inset
Figure12)
Figure12Measured(CapeGrimTasmaniaandMaunaLoaHawaii)andFutureCO2forRCP45andRCP85andmeasuredandpredictedtemperatureanomaly(TA)usingtherelationshownintheinset
Todeterminetheprojectionsoffutureclimatechangeitisfirstnecessarytoextractthemonthly
changefactorsClimatechangefactorsallowtheinformationfromcoarse-grainedGCMs(typically
100-200km)toberepresentedatalocalscaleAclimatechangefactorforJanuary2030usingthe
ACCES10modelmightbe+1degCthisisaddedtothedailyobservationsforJanuarytocreatea
possibleclimateThisprocessisrepeatedforeachmonthtimescaleandGCMThisallowsafuture
climatesettobecreatedthatincorporateshistoricalvariability
4httpwwwbomgovauclimatechangeindexshtmltabs=Trackeramptracker=global-timeseries
20
Whiletheactualchangesmaybesmallrelativetodailytemperaturevariationsthebiological
responsemaybesignificantbecauseoftheimpactofthresholdtemperaturesCalculationsofchilling
forexampleusethresholdtemperaturestodeterminethecontributionmadetodailychill
accumulationAsmallshiftintemperaturethroughoutautumnandwintercanhavealargeeffecton
theoutcomeasdemonstratedforManjimupin2030Figure13Theindividualtemperaturechange
foragivenmonthandRCPmayonlybeintheregionof05to12degCbutovertheseasonthisis
enoughtoreducetheaccumulatedchill
Figure13AccumulationofchillforhistoricalaverageconditionsatManjimupandforaprojectedclimatefor2030underRCP45andRCP85(top)Themonthlychangeinaveragetemperaturethatcausedthedifferenceinthechillaccumulationinthefutureisshowinthelowergraph
SelectionofGlobalClimateModels
GlobalClimateModels(GCM)wereselectedfromthelistofmodelsgeneratedbytheClimateFutures
ToolattheClimatechangeinAustraliawebsite5ThreeGCMs(Table2)wereselectedbasedonahigh
Mscore(Watterson1996)thatmeasurestheabilityoftheGCMtorepresenthistoricalobservations
AperfectmatchwouldhaveanMscoreof1000TheGCMsselectedandtheiraverageMscores
wereACCCES1-0(727)HadGEM2-ES(720)andMPI-ESM-LR(720)Inthiscasetheagreement
betweenmodelledandobservedclimatewasbasedontemperaturerainfallandmeansealevel
pressureforthefourseasonsoverthewholeofAustraliaThesemodelsscoredgreaterthan800for
5httpwwwclimatechangeinaustraliagovau
21
surfacetemperaturealoneForRCP45theseGCMswereinagroup(2338GCMs)thatpredicted
warmerwintermaximumandminimumtemperaturesTheprojectedchangeintemperaturewas
from05degCto15degCForRCP85HadGEM2-ESwasgroupedwiththosethatshowedawarmer
minimumtemperaturebuthottermaximumtemperatures15degCto30degC(1340GCMs)ACCESS10
andMPI-ESM-LRweregroupedwiththosethatshowedwarmerminimumandmaximum
temperaturesinwinter(2440)
Table2DescriptionofGCMsusedinthisstudy
GCM Institute AverageM
score1000
FurtherInformationandspatialresolution
(latitudexlongitude)
ACCESS1-0 CSIROand
Bureauof
Meteorology
727 httpsconfluencecsiroaudisplayACCESSHome
(125degx1875deg)
HadGEM2-
ESM
MetOffice
HadleyCentre
720 httpwwwmetofficegovukresearchmodelling-
systemsunified-modelclimate-modelshadgem2
(125degx1875deg)
MPI-ESM-LR MaxPlanck
Institutefor
Meteorology
720 httpwwwmpimetmpgdeensciencemodelsmpi-
esmhtml
(1865degx1875deg)
CalculationofClimateProjectionsforStationData
ClimatechangefactorswereobtainedfromgriddeddatasetsintheCIMP5multi-modelensemble6
(seeTayloretal2011)andappliedasmonthlyclimatechangefactorstothedailydataforeachof
thesites
Themethodusedtoperturbthepresentclimatetoafutureclimateresultsinashiftthatcanbeseen
onamonthlyscale(Figures14and15)Thisisbecausethechangefactorappliedtodaily
temperaturesisthesamewithineachmonth
Figures14and15demonstratethatuntil2030thechoiceoftheRCPhaslittleimpactbutby2050
thedifferencescausedbythehigheremissionsintheRCP85pathwaycanbeclearlyseen
6httpnrm-erddapnciorgauerddapindexhtml
22
Figure14MeanmonthlyminimumtemperaturesforApplethorpefor2030underRCP45(left)andRCP85(right)
Figure15MeanmonthlyminimumtemperaturesforApplethorpefor2050underRCP45(left)andRCP85(right)
23
FutureClimateProjectionsandtheImpactonFloweringThe relationship between chilling and flowering can been described mathematically (Popeetal
2014) such that the amount of chill that accumulates affects the flowering date because the
amount of heat required to promote
flowering is altered(Darbyshireetal
2016) found that for Cripps Pink
apples the minimum amount of chill
required is 34 Chill Portions Less
than this critical amount of chill
cannot be compensated for with
heating and there is no effective
flowering If additional chill is
accumulated then there is a lower
requirement for heat This
relationship between the
accumulation of chill and the heat
requirement is referred to as the
Chill-Overlap Model Figure16
FuturechillaccumulationasmeasuredbyChillPortions(CP)willdeclinein2030and2050under
boththeRCP45andRCP85scenariosatgrowingregionsacrossAustralia(Table3)Thehighest
declineswillbeforManjimupApplethorpeandMtBarkeralthoughallsitesshowadeclineThe
smallestdeclinesareatOrangeandHuonvillewhichdeclinebylessthan5in2030andbylessthan
15in2050undereitherRCP45orRCP85
Using the mathematical relationships embodied in the Chill-Overlap model (Figure16) it is
possible to compare how full bloom dates might change in the future and whether the
increased temperatures during spring and summer can compensate for the reduced chill
accumulation (Table5)
Figure16TheChill-OverlapModelCristhechillrequiredforfloweringCoisthemaximumadditionalchillthatwillreducetheheatrequirementHristheheatrequiredwhenCochillisaccumulatedandHoistheheatrequiredwhenchillisanCr(RedrawnfromDarbyshireetal2016)
24
Table3Summaryofaveragechillportions(1Marchndash31August)for2030and2050usingamoderate(RCP45)toworstcasescenario(RCP85)modellingapproachbasedonhistoricaldatafrom1985to2014Meanof30yearswithlowestandhighestinparentheses
Present
2030 2050
RCP45 RCP85 RCP45 RCP85
Applethorpe 72(62-83) 63(48-75) 60(44-73) 56(41-69) 51(36-65)
Shepparton 84(73-93) 75(63-85) 74(62-86) 71(58-81) 67(57-79)
Manjimup 67(55-82) 57(43-76) 55(42-75) 50(36-72) 47(33-68)
Huonville 105(94-113) 98(81-112) 97(78-110) 93(74-105) 90(71-104)
Orange 100(90-110) 94(85-104) 93(82-101) 90(81-99) 87(78-94)
MountBarker 84(67-93) 74(55-88) 73(53-88) 70(53-84) 65(47-80)
Theconceptofsafewinterchill(SWC)wasintroducedbyLuedelingetal(2009)ameasurethatcan
bethoughtofasthenumberofchillportionsthatagrowercouldexpectin90ofyears
Table4Safewinterchillcalculationsfortheperiod1985to2014
Present
2030 2050
RCP45 RCP85 RCP45 RCP85
Applethorpe 67 55 55 47 46
Shepparton 76 67 68 66 59
Manjimup 60 49 52 44 41
Huonville 99 91 94 88 86
Orange 94 87 87 85 81
MountBarker 74 62 66 60 56
ReductionsintheSWCinApplethorpeManjimupandMountBarkerweresimilarandrangedfrom
16to17in2030and18to32in2050
25
Orangealocationwithahighchillaccumulationtheaveragedateoffullbloomisadvanced(earlier
bloom)by4to5daysOtherlocationsshowedadelayedfullbloomdatewiththegreatestimpactfelt
atManjimupthelocationwiththeleastchillatpresentandintothefuture
Table5Summaryofaveragedateoffullbloom(CrippsPink)for2030and2050usingamoderate(RCP45)toworstcasescenario(RCP85)basedonhistoricaldatafrom1985to2014
Average
PredictedFull
BloomDate Present
2030
2050
RCP45 RCP85 RCP45 RCP85
Applethorpe 4Oct 7Oct 9Oct 12Oct 16Oct
Shepparton 30Sep 3Oct 3Oct 5Oct 6Oct
Manjimup 16Oct 22Oct 25Oct 30Oct 2Nov
Huonville 26Sep 27Sep 29Sep 29Sep 29Sep
Orange 2Oct 28Sep 28Sep 28Sep 27Sep
MountBarker 1Oct 5Oct 4Oct 6Oct 8Oct
Delaysinfullbloomdatearecausedwhenlesswinterchillisaccumulatedduringtheautumnand
winterperiodandconsequentlymoreheatisneededtopromotefloweringManjimupislikelyto
experiencethegreatestdelayinfullbloomdatesinfutureclimatescomparedwithotherlocations
Thisisbecausechillaccumulationabove34CPthisisCrFigure16-thechilloverlapmodelin
Manjimupdropsfrom22CPinthepresentclimateto14ndash16CPin2030and10ndash12CPin2050To
compensateforthisagreateraboutofheatneedstobeaccumulated(iemovingfromHrtowards
HoinFigure16)andthisrequiredanextra6to9daysin2030and14to17daysin2050In
comparisonatOrangethemuchcoolerwintertemperaturesandhighchillaccumulationloweredthe
requirementforheatThishelpedtoadvancethedatefullbloombecauseofhigherspring
temperatures(Figure9andFigure10)
FutureProjectionsofImpactonQualityOneofthemainrisksforproductionisextremeheatdaysasthisleadstosunburnbrowningSun
damageriskinRoyalGalawasstudiedinapplegrowingregionsinAustralia(Darbyshireetal2015)
Theydevisedabrowningriskdayfornon-nettedandnettedorchardsbasedonairtemperaturesand
26
foundthatdailymaximumtemperaturesgreaterthan341degCinnon-nettedorchardsand379degCin
nettedorchardswereassociatedwithanincreasedriskofbrowningWhilethatstudyandWebbet
al(2016)consideredJanuarytemperatureswehaveextendedtheanalysistoincludeFebruaryas
thiscoincideswiththefruitingperiodUsingthedailymaximumtemperaturesforJanuaryand
Februaryfrom1981to2010(present)andfutureclimatesin2030and2050wecalculatedthe
browningriskasthepercentageofdaysthatexceededthetemperaturethresholdswithandwithout
nettingFollowingWebbetal(2016)weclassifiedbrowningriskin5categories
pound5 gt5to10 gt10to20 gt20to30 gt30to50
Table6Summaryofmeanvaluesforbrowningrisk(percentageofdays)forJanuaryandFebruary
WithoutNetting 2030 2050
Site Present RCP45 RCP85 RCP45 RCP85
Applethorpe 11 24 28 28 49
Shepparton 183 239 268 275 358
Manjimup 100 152 152 166 198
Huonville 24 34 38 45 42
Orange 24 38 44 37 84
MtBarker 173 207 229 232 258
WithNetting 2030 2050
Site Present RCP45 RCP85 RCP45 RCP85
Applethorpe 00 00 01 01 04
Shepparton 48 70 90 88 132
Manjimup 16 38 39 44 60
Huonville 03 06 10 12 11
Orange 01 01 01 01 07
MtBarker 54 72 91 94 107
27
SheppartonMountBarkerandManjimupwillbemostadverselyaffectedwithoutnettinghowever
thiscanbelargelyoffsetwithnettingWithoutnettingManjimupmovestothesamecategoryby
2030thatSheppartonandMountBarkercurrentlyexperienceApplethorpeHuonvilleandtoalesser
extentOrangeareinlowriskcategoriesandarelikelytoremainthatwayinthefuture
DiscussionandConclusionsClimatechangerepresentsanimportantfactorforperennialtreecropswhetherthatisbecauseof
reducedchillorincreasedriskofsunburnbrowningTherehasbeenatendencytoconsiderthat
applesgenerallyhaveahighchillingrequirementyetsuccessfulcropsaregrowninSouthAfrica
(Cook2010)andManjimupwherethechillislowincomparisontotraditionalgrowingregionsLow
chillcancausearangeofproblemsincludingdelayedorerraticbudbreakbudabscissionlower
flowerandfruitqualityandreducedyield(seetableinAtkinsonetal2013)Safewinterchill
(Luedelingetal2009)underfutureclimatesisapossibleindicationofwhattoexpectApplethorpe
recordsalowerSWCin2030forthemoreoptimisticRCP45thanpresentdayManjimup(Table4)
Perennialtreecropindustriesareparticularlyvulnerabletoclimatechangebecauseofthecostand
longevityoforchardestablishmentWhilemanygrowershavebeenadaptingtothetrendsalready
evidentinahighlyvariableclimatetheimpactoffutureclimatemightbeunderestimatedbecauseof
thelanguageusedbyclimatescientistsandthemediaA1-2degCincreaseintemperaturemightseem
trivialconsideringdailyfluctuationshoweverascanbeseenfromtheanalysesthesecan
accumulateacrosstheseasonandhavelargerimpactsthroughdelayedfloweringandincreasedrisk
ofsundamage
Theimpactofchangesintemperaturesonfloweringinthefuturearecomplicatedbytheinteraction
betweenareductioninchillaccumulationduringwinterandincreasedspringandsummer
temperaturesWhilethechill-overlapmodelisusefulinunderstandingtheserelationshipsitisbased
largelyonhypotheticalprocessesGapsinourknowledgesuchasunderstandingwhenplantsstart
andstopchillaccumulationneedtobebasedonphysiologyietheunderstandingofthechemical
processes(Atkinsonetal2013)Thishasproveddifficultbecausetherearenooutwardsignsthat
canbeusedItishopedthatchemicalmarkersfortheseprocessescanbefoundsothatour
understandingwillbegreatlyadvancedThiswouldhavetheadvantageofbeingabletomakebetter
estimatesofhowthingsmightchangeinthefutureandpossiblyleadtobreakthroughsinbreeding
programsAtamorefundamentallevelourcurrentbestmodelformeasuringandpredictingchill
accumulationtheDynamicModelusesparametersthathaveonlybeenparameterisedforpeach
28
becausetheonerousexperimentalproceduresrequiredtoderivethemFurthermoreitreliesona
hypotheticalfactorthatmayormaynotexistThemodelespeciallyaspartofthechilloverlap
modelremainsthemostusefulwayofpredictingflowering
Take-homemessagesfromthehistoricalrecord
bull Allpomefruitgrowingregionshavegenerallyseenanincreasingtrendinmaximum
temperaturesinwinterandmaximumandminimumspringtemperatures
bull Thestrongestdownwardstrendinchillaccumulationhasoccurredatthemilderlocationsof
ApplethorpeManjimupandMountBarker
bull SpringandsummermaximumtemperaturesatalllocationsexceptHuonvilleshowan
upwardtrendThisisparticularlynoticeableforManjimupwhichhasrecordedahigherthan
long-termaveragemaximumsince2009
bull ExtremeheatisanemergingprobleminManjimupandgrowingregionsinNSWHeatdamage
hasbeenaprobleminVictoriaandtheincreaseobservedinManjimuphasprompteddetailed
studiesofhowandwhenbrowningoccursandatrialofnetsinthoseareas
Take-homemessagesfromthefuturescenarios
bull Smallincreasesinaveragetemperaturesmultiplytheireffectthroughtheaccumulationof
timeaboveorbelowthresholds
bull Theresponseofthepomefruittreetoreducedchillmaybepartiallyoffsetbyincreased
springandsummertemperaturesbutourcurrentbestunderstandingofthissuggeststhat
thiscannotoccurindefinitely
bull Upto2030-2040thedifferencesbetweentheclimatechangescenariosaresmallThe
childrenofthegrowerswhoarefarmingtodaymayin2050befacingaverydifferent
growingenvironmentInApplethorpewherealowchillyearis60CPnowwillfeellikeagood
yearandtheworstyearswillbelikenothingthathasbeenencounteredbefore
bull Thereisacomplexinterplaybetweenchillingandwarmingonthetimingoffloweringthatwe
areonlyjuststartingtounderstandMuchofourknowledgeofhowpomefruittreesrespond
hasbeeninconditionswherechillhasbeenmorethanadequateThechilloverlapmodelhas
beenusefulasmodelofthissituationbutthebiologicalbasisisuncertain
bull ExtremeheatwillcontinuetobeaprobleminhotsummerregionssuchasSheppartonwhere
italreadypresentschallengesforfruitqualityandisanemergingproblemforregionslike
ManjimupwhichcurrentlyhaveamildersummerclimateTheimpactonmarketablequalityis
wellknownandinvestmentinnettingseemstobethemostpracticalsolution
29
ReferencesAtkinsonCJRMBrennanandHGJones2013Decliningchillinganditsimpactontemperate
perennialcrops9148ndash62
ButlerJHandSAMontzka2016theNOAAannualgreenhousegasindex(AGGI)
httpwwwesrlnoaagovgmdaggiaggihtml
CookNC2010Appleproductionunderconditionsofsub-optimalwinterchillinginSouth
Africa199ndash204
CSIRO2016CapeGrimGreenhouseGasdataCSIROhttpwwwcsiroaugreenhouse-gases
DarbyshireRKPopeandIGoodwin2016Anevaluationofthechilloverlapmodeltopredict
floweringtimeinappletree198142ndash149
DarbyshireRLMcClymontandIGoodwin2015SundamageriskofRoyalGalaappleinfruit-
growingdistrictsinAustralia43222ndash232
ErezA2000BudDormancyPhenomenonProblemsandSolutionsintheTropicsandSubtropics
Pages17ndash48inTemperateFruitCropsinWarmClimatesSpringerNetherlandsDordrecht
ErezASFishmanGCLinsley-NoakesandPAllan1990TheDynamicModelforRestCompletion
inPeachBuds165ndash174
FishmanSAErezandGACouvillon1987Thetemperaturedependenceofdormancybreakingin
plantsMathematicalanalysisofatwo-stepmodelinvolvingacooperativetransition124473ndash483
FlaishmanMAYPelesYDahanSMilo-CochaviAFriemanandANaor2015Differential
responseofcell-cycleandcell-expansionregulatorstoheatstressinapple(Malusdomestica)
fruitletsPlantScience23382ndash94
JeffreySJJOCarterKBMoodieandARBeswick2001Usingspatialinterpolationto
constructacomprehensivearchiveofAustralianclimatedata16309ndash330
Lin-WangKUIDMichelettiJPalmerRVolzLLozanoREspleyRPHellensDChagnEgraveDD
RowanMTroggioIIglesiasandACAllan2011Hightemperaturereducesapplefruitcolourvia
modulationoftheanthocyaninregulatorycomplex341176ndash1190
LinvillDE1990CalculatingChillingHoursandChillUnitsfromDailyMaximumandMinimum
TemperatureObservations2514ndash16
30
LuedelingEAKunzandMBlanke2013Identificationofchillingandheatrequirementsofcherry
treesmdashastatisticalapproach57679ndash689
LuedelingEEHGirvetzMASemenovandPHBrown2011ClimateChangeAffectsWinter
ChillforTemperateFruitandNutTreesPLoSONE6e20155
LuedelingEMZhangandEHGirvetz2009ClimaticChangesLeadtoDecliningWinterChillfor
FruitandNutTreesinCaliforniaduring1950ndash2099PLoSONE4e6166
PetersGPRMAndrewTBodenJGCanadellPCiaisCLeQuereGMarlandMRRaupach
andCWilson2012Thechallengetokeepglobalwarmingbelow2degC34ndash6
PopeKSDDaSilvaPHBrownandTMDeJong2014Abiologicallybasedapproachto
modelingspringphenologyintemperatedeciduoustreesAgriculturalandForestMeteorology198ndash
19915ndash23
RCoreTeam2015RALanguageandEnvironmentforStatisticalComputingRFoundationfor
StatisticalComputingViennaAustria
RichardsonEASDSeeleyandRDWalker1974Amodelforestimatingthecompletionofrest
forRedHavenandElbertapeach9331ndash332
TaylorKERJStoufferandGAMeehl2011AnOverviewofCMIP5andtheExperimentDesign
93485ndash498
WattersonIG1996Non-dimensionalmeasuresofclimatemodelperformance16379ndash391
WebbLRDarbyshireTErwinandIGoodwin2016Arobustimpactassessmentthatinforms
actionableclimatechangeadaptationfuturesunburnbrowningriskinapple
WeinbergerJH1950Chillingrequirementsofpeachvarieties56122ndash128
Flowering in pome fruit trees across Australia
Implications of a changing climate
Heidi Parkes and Neil White Department of Agriculture and Fisheries Queensland
November 2016
This publication has been compiled by Heidi Parkes and Neil White of Horticulture and Forestry Science Department of Agriculture and Fisheries copy State of Queensland 2016 The Queensland Government supports and encourages the dissemination and exchange of its information The copyright in this publication is licensed under a Creative Commons Attribution 30 Australia (CC BY) licence Under this licence you are free without having to seek our permission to use this publication in accordance with the licence terms
You must keep intact the copyright notice and attribute the State of Queensland as the source of the publication Note Some content in this publication may have different licence terms as indicated For more information on this licence visit httpcreativecommonsorglicensesby30audeeden The information contained herein is subject to change without notice The Queensland Government shall not be liable for technical or other errors or omissions contained herein The readeruser accepts all risks and responsibility for losses damages costs and other consequences resulting directly or indirectly from using this information
Summary
Australia has warmed by 1degC in the last 100 years and temperatures are predicted to continue warming This will result in reduced winter chill for many apple and pear growing regions of Australia and it is not clear how this will impact on pome fruit production To better understand how climate change will impact flowering in pome fruit trees research was undertaken to evaluate the timing and quality of flowering in cultivars of apple and pear across Australia and how they relate to temperatures received in the orchard Green tip flowering and temperature data was collected in the spring of 2012 2013 2014 and 2015 for cultivars of apple and pear grown in the climatically distinct regions of Applethorpe (Queensland) Shepparton (Victoria) and Manjimup (Western Australia)
For all years of the study Shepparton received the most winter chill with 89 chill portions on average followed by Applethorpe (75 chill portions) and Manjimup (63 chill portions) Low winter chill in Manjimup was associated with greater variation in green tip and full bloom dates between years cultivars and individual trees compared with observations from Applethorpe and Shepparton Additionally trees in Manjimup displayed a long and protracted flowering period compared with the other sites The patterns of flowering observed in Manjimup are possibly the result of inadequate chill Shepparton the site with the most winter chill showed the greatest consistency in green tip and flowering dates
Results from this research support findings from previous studies performed in other parts of the world showing that apples grown in warmer climates exhibit increased variability in flowering Uneven and irregular flowering results in the reduced ability to predict timing of orchard operations more difficult pollination management challenges for thinning and crop load management and can result in increased variability of fruit maturity at harvest
As the climate warms low chill years will become more frequent in milder growing regions of Australia and will likely result in symptoms of inadequate chill in some cultivars Advances in the timing of flowering might be observed in cooler growing regions Australian growers already manage seasonal changes in flowering time and it may be the increasingly protracted and variable flowering that presents the greater management challenge
Options for adaptation to low chill years include planting lower chill cultivars management of delayed and variable flowering with the use of dormancy-breakers and adjustments to chemical and hand thinning practices to reduce variability in fruit size and maturity
Climate change will add significant variability into the pome fruit crop production system This will present challenges for the Australian industry in its ability to consistently supply high quality fruit into export markets and in maintenance of the uniform orchard blocks required to maximise the benefits of mechanisation Ongoing observations of flowering performance and its relationship with chilling will be necessary for making informed predictions about future block and cultivar profitability
Table of contents
Introduction 1
Study objectives 1
Materials and methods 1
Site description 1
Green tip and flowering data collection 3
Calculation of winter chill 5
Results and discussion 5
Winter chill and spring heat 5
Green tip and flowering 7
Green tip and flowering time 7
Variation between cultivars and locations 7
Variation between years 9
Quality of flowering 13
Variation between cultivars and locations 13
Flowering overlap and pollination 15
Flowering and temperature implications of a changing climate 15
Conclusions 17
Key messages 17
Recommendations 18
Industry 18
Scientific research needs 19
Acknowledgements 20
References 20
Table of figures
Figure 1 Site locations across Australia (large blue dot) 2
Figure 2 Mean monthly temperatures for Shepparton Applethorpe and Manjimup 3
Figure 3 Chill accumulation across sites and years Number in brackets is the total chill portions received up to 31 August 5
Figure 4 Green tip (green) and full bloom (pink) dates for apple cultivars in Applethorpe Shepparton and Manjimup Data is the average of observations from 2012 to 2015 with bars indicating the confidence interval 8
Figure 5 Green tip (green) and full bloom (pink) dates for pear cultivars in Applethorpe Shepparton and Manjimup Data is the average of observations from 2012 to 2015 with bars indicating the confidence interval 9
Figure 6 Green tip (green) and full bloom (pink) dates for apple cultivars grown in Applethorpe Shepparton and Manjimup 2013 and 2014 Data points are the average of individual tree observations 11
Figure 7 Chill accumulation in Applethorpe Shepparton and Manjimup 2012 to 2015 Number in brackets is the total chill portions received up to 31 August 12
Figure 8 First flower (orange) and full bloom (pink) dates for apple cultivars in Applethorpe Shepparton and Manjimup Data is the average of observations from 2012 to 2015 Bars indicate the confidence interval 14
Figure 9 First flower (orange) and full bloom (pink) dates for pear cultivars in Applethorpe Shepparton and Manjimup Data is the average of observations from 2012 to 2015 Bars indicate the confidence interval 15
Table of tables
Table 1 Site details 2
Table 2 Description of trees used for phenology observations 4
Flowering in pome fruit trees across Australia Department of Agriculture and Fisheries 2016 1
Introduction
Flowering timing and quality in apple and pear trees is determined by interactions between the genetics of a cultivar and the temperatures it experiences in the orchard throughout the year Cultivars require a certain amount of winter chill and a certain amount of heat for bud dormancy release and flowering and these requirements are largely genetically determined (Cannell 1989 Saure 1985 Samish 1954) Day length is not believed to have a significant role in the timing of flowering in apple (Dennis 2003)
Australia has warmed by 1degC in the last 100 years and temperatures are predicted to continue warming (State of the climate 2016) This will result in reduced winter chill for many apple and pear growing regions of Australia (Darbyshire et al 2013b Hennessy and Clayton-Greene 1995) It is not yet clear what the impact of this will be on the timing and quality of bud dormancy release and flowering in commercial pome fruit cultivars and therefore the potential impacts on productivity Advances in flowering time with increased temperatures has been observed in temperate fruit trees globally (Legave et al 2013) however effects of recent warming in Australia on pome tree flowering are not as clear (Darbyshire et al 2013a)
Changes in timing of flowering may have impacts on yield through the loss of flowering overlap between a cultivar and its pollinisers and potential for increased frost risk (Kaukoranta et al 2010) Variable and protracted patterns of flowering are likely to occur in locations where the warmer climate leads to inadequate chill (Erez 2000) Poor quality of flowering impacts production and profitability through reductions in fruit set difficulties with chemical thinning and greater variability of fruit maturity at harvest (Theron 2013 Oukabli 2003)
Understanding potential impacts of climate change is essential for the timely implementation of appropriate adaptation strategies (Cobon et al 2009) To understand how warming temperatures might impact on flowering it is necessary to first understand the existing flowering behaviour of pome fruit tree cultivars across Australia and how it relates to temperatures received in the orchard
Study objectives
The objective of this research was to evaluate the timing and quality of green tip and flowering in cultivars of apple and pear across Australia and how they relate to temperature to contribute towards understanding of how climate change will impact on pome fruit production
Materials and methods
Site description
Green tip and flowering data was collected in the spring of 2012 2013 2014 and 2015 for cultivars of apple and pear grown in commercial orchards and research facilities situated in Applethorpe (Queensland) Shepparton (Victoria) and Manjimup (Western Australia) (Figure 1 and Table 1)
Flowering in pome fruit trees across Australia Department of Agriculture and Fisheries 2016 2
Figure 1 Site locations across Australia (large blue dot)
Table 1 Site details
State Location Orchard Latitude and Longitude
Cultivars
Qld Applethorpe Department of Agriculture and Fisheries Qld Applethorpe Research Facility
2852 S 15190 E
All apples and pears (except Josephine)
C Pozzebon amp Co Orchard 2863 S 15197 E Josephine pear
Vic Shepparton Silversteinrsquos orchard Shepparton East
3642 S 14546 E All apples and pears
WA Manjimup Department of Agriculture and Food WA Manjimup Horticultural research Institute
3418 S 11607 E All apples
Newton Brothers Orchards
3413 S 11607 E All pears
The three study sites are climatically diverse with Shepparton experiencing the hottest summers and Manjimup the warmest winters Applethorpe has the highest average spring temperatures (Figure 2)
Flowering in pome fruit trees across Australia Department of Agriculture and Fisheries 2016 3
Figure 2 Mean monthly temperatures for Shepparton Applethorpe and Manjimup
Green tip and flowering data collection
Cultivars (including crab apple pollinisers) and rootstocks used for phenology data collection are described in Table 2 All observations were taken on mature productive trees
Flowering in pome fruit trees across Australia Department of Agriculture and Fisheries 2016 4
Table 2 Description of trees used for phenology observations
Study site Tree crop Cultivar Rootstock1 Number of trees (yearly observation)
Net
Applethorpe Apple Braeburn M26 5 Yes
Cripps Pink (Pink Ladytrade) M26 MM106
5 3
Yes
Cripps Red (Sundownertrade) M26 MM106
5 5
Yes
Fuji M26 5 Yes
Galaxy (Gala) M26 5 Yes
Granny Smith M26 MM106
4 5
Yes
Hi Early (Red delicious) M26 5 Yes
Jonathan M26 5 Yes
Kalei M26 MM106
5 5
Yes
Manchurian Crab apple MM102 5 Yes
Pear Josephine D6 5 Yes
Packhamrsquos Triumph D6 5 No
Williamsrsquo Bon Chreacutetien D6 5 No
Wintercole D6 5 No
Shepparton Apple Braeburn MM106 5 Yes
Cripps Pink (Pink Ladytrade) MM106 5 Yes
Cripps Red (Sundownertrade) M26 MM106
5 5
Yes
Galaxy (Gala) MM106 5 Yes
Granny Smith MM106 5 Yes
Manchurian Crab apple MM106 5 Yes
Pear Josephine D6 5 Yes
Packhamrsquos Triumph D6 5 Yes
Williamsrsquo Bon Chreacutetien D6 5 Yes
Manjimup Apple
Braeburn MM109 2 No
Cripps Pink (Pink Ladytrade) MM104 M26
2 2
No
Cripps Red (Sundownertrade) MM104 M26
3 1
No
Galaxy (Gala) MM104 2 No
Granny Smith MM104 2 No
Hi Early (Red delicious) MM104 2 No
Jonathan MM106 2 No
Golden Hornet Crab apple MM104 2 No
Red Fuji (Fuji) MM104 2 No
Pear Josephine D6 5 No
Packhamrsquos Triumph D6 5 No
Williamsrsquo Bon Chreacutetien D6 5 No 1 Rootstock effects were not considered in this analysis as previous studies indicated that rootstocks did not significantly impact the timing of green tip and flowering dates in data collected for this study (Darbyshire 2016) Green tip and flowering data was collected three times per week at the whole tree level For each tree the date of green tip first open flower and full bloom were recorded A tree was defined as being at lsquogreen tiprsquo when 5 of the buds had observable green tips corresponding to the 07 stage in the international BBCH code for pome fruit (Meier et al 1994) A tree was defined as being at lsquofull bloomrsquo when 80 of the flowers were open (BBCH code stage 65)
Flowering in pome fruit trees across Australia Department of Agriculture and Fisheries 2016 5
Assessments of flowering quality were made based on the duration between first open flower and full bloom on the assumption that a protracted period of time between these events was a reflection of variable and uneven flowering This assumption was based on our observations of flowering in Manjimup and Applethorpe
A 95 confidence interval was used to represent variability in data about the mean It indicates that 95 of the data values recorded fall within this particular interval
Ideally green tip and flowering data would have been collected from a number of orchards across each region to fully capture variation within regions caused by microclimate soils differences in tree structure nutrition and so on Time and resources required to collect such data were not available and therefore observations were taken from representative orchards in each region In future more comprehensive data will be collected on orchards through the use of sensing and mapping technologies which will enable more sophisticated and comprehensive analysis of flowering patterns and variability between and within locations
Calculation of winter chill
The Dynamic model (Erez et al 1990 Fishman et al 1987) was used to calculate winter chill from on-site hourly temperature data recorded in the orchard This is the current lsquobest-practicersquo model and has been shown to perform better than other models for calculating winter chill particularly in mild winter climates such as Australia (Darbyshire et al 2013a Luedeling et al 2009)
Note that while chill is commonly referred to as lsquowinter chillrsquo it has been calculated here from the beginning of autumn until the end of winter (1 March to 31 August) The point at which tree buds become sensitive to chilling temperatures remains to be determined
Results and discussion
Winter chill and spring heat
Figure 3 Chill accumulation across sites and years Number in brackets is the total chill portions received up to 31 August
Flowering in pome fruit trees across Australia Department of Agriculture and Fisheries 2016 6
The pattern of winter chill accumulation was different between locations and years (Figure 3) For all years of the study Shepparton was the coolest site followed by Applethorpe and Manjimup Shepparton and Applethorpe received above-average chill portions for the four year period while Manjimup received below-average chill in 2013 and 2014 Historical chill portion averages for the 1981 to 2010 period are Shepparton 78 Applethorpe 70 and Manjimup 64
Lower winter chill tended to be associated with a later start to chill accumulation (that is a warmer autumn) and a more uneven chill accumulation curve For example 2012 2013 and 2014 in Manjimup were distinguished by the irregular accumulation of chill portions caused by climatic conditions where cold autumn and winter temperatures were interspersed with spells of warm weather This resulted in somewhat lsquowobblyrsquo chill accumulation curves
In this study winter chill accumulation was calculated from 1 March to 31 August according to previously published protocols (Darbyshire et al 2016) Questions remain about when to start and stop calculating chill It is not clear that it is meaningful to start calculating chill for late season cultivars before fruit has been harvested and or before leaves have fallen or indeed to stop calculating chill before a cultivar such as lsquoHi Earlyrsquo has reached green tip It seems likely that the period of sensitivity to chill accumulation will vary between cultivars however with current gaps in understanding of the physiological processes involved in the movement through dormancy it is not possible to determine cultivar-specific chilling periods
It is also quite likely that there are differences in the impact of chilling temperatures on the dormancy-breaking process depending on the time of year For example chill received earlier in the winter may be more effective than chill received in late winter Further research is required to fully elucidate these features of dormancy-breaking in pome fruit
Table 3 Average spring temperatures1 for 2012 to 2015 in Applethorpe Shepparton and
Manjimup
Location Year Average monthly temperature
September October November
Applethorpe Long term average2 124 154 177 2012 128 152 192 2013 149 171 185 2014 125 175 218 2015 118 170 202
Shepparton Long term average2 114 142 175 2012 118 139 191 2013 133 141 168 2014 121 160 189 2015 115 186 189
Manjimup Long term average2 119 136 160 2012 129 155 163 2013 126 150 180 2014 136 154 163 2015 132 171 186
1Temperature data sourced from Australian Bureau of Meteorology website 2As determined by the Australian Bureau of Meteorology
Flowering in pome fruit trees across Australia Department of Agriculture and Fisheries 2016 7
According to the long term average Applethorpe has the warmest spring compared with Shepparton and then Manjimup (Table 3) With few exceptions spring temperatures were above-average at all sites throughout the period of the study
Green tip and flowering
Differences in chill accumulation and spring heat between locations and years were accompanied by variability in the timing and pattern of green tip and flowering of apple and pear cultivars Results were analysed to develop a picture of green tip and flowering patterns in Applethorpe Shepparton and Manjimup over the four years of the study
Green tip and flowering time
Variation between cultivars and locations
Green tip and flowering dates were later in Manjimup than in Applethorpe and Shepparton (Figure 4) Across all cultivars the average green tip date was 4 September in Applethorpe 3 September in Shepparton and 25 September in Manjimup while the average full bloom date was 1 October in Applethorpe and Shepparton and 25 October in Manjimup
Variability in green tip and full bloom dates between years and individual trees was greater in Manjimup compared with Applethorpe and Shepparton as reflected by the length of the bars in Figure 4 Variability in green tip and full bloom dates between cultivars was also greater in Manjimup compared with the other sites Average green tip dates for all cultivars were spread across 32 days in Manjimup compared with 15 days in Applethorpe and 5 days in Shepparton Similarly average full bloom dates were spread across 19 days in Manjimup compared with 9 days in Applethorpe and 7 days in Shepparton
Overall Shepparton the site with the greatest winter chill showed the most consistency in green tip and flowering time from year to year while the relatively low chill in Manjimup was associated with the greatest variability Greater consistency has benefits for flowering and pollination management including determination of appropriate polliniser plantings and planning of pollination services It also benefits tactical decision making for orchard operations generally Improvements in the ability of models to predict flowering dates would remove the uncertainty associated with variability making it easier to manage
Flowering in pome fruit trees across Australia Department of Agriculture and Fisheries 2016 8
Figure 4 Green tip (green) and full bloom (pink) dates for apple cultivars in Applethorpe Shepparton and Manjimup Data is the average of observations from 2012 to 2015 with bars indicating the confidence interval
Shepparton
Manjimup
Applethorpe
Flowering in pome fruit trees across Australia Department of Agriculture and Fisheries 2016 9
Differences in Green tip and flowering patterns between locations were less consistent for pear cultivars (Figure 5) In Manjimup full bloom dates for lsquoJosephinersquo lsquoPackhamrsquo and lsquoWilliamsrsquo were later across all years compared with the other sites Shepparton showed the least variability in full bloom dates across years trees and cultivars
Figure 5 Green tip (green) and full bloom (pink) dates for pear cultivars in Applethorpe Shepparton and Manjimup Data is the average of observations from 2012 to 2015 with bars indicating the confidence interval
Variation between years
Variability in the dates of green tip and flowering between individual years was evaluated to determine the degree to which growers are currently managing shifts in flowering timing from season to season at each location
In Applethorpe green tip and flowering were consistently later across all cultivars in 2014 compared with the other years of the study (Figure 6 shows comparison between 2013 and 2014 data for other year comparisons not shown) On average green tip was 9 days later in 2014 compared with 2013 and full bloom was 12 days later (Figure 6)
This consistent shift in timing was associated with an unusual autumn and winter chill accumulation pattern (Figure 7) Total chill accumulated up to 31 August was similar in 2013 and 2014 73 and 75 chill portions respectively However in 2014 there was a warm week in late-May to early-June that resulted in a pause in accumulation of chill which can be seen in the chill curve (Figure 7) Even though the total chill accumulated for 2014 eventually caught up with the other curves by the end of August this plateau appears to have impacted the timing of flowering (although other factors such as the role of heat cannot be ruled out in this study) There was little difference in green tip and flowering dates between the other years
In Shepparton there was little variability in green tip and flowering dates between any of the four years of the study When averaged across cultivars green tip varied by 5 days between 2013 and 2014 and full bloom dates varied by 4 days (Figure 6) Plateaus in the accumulation of chill in late-May early-June of 2013 and 2014 (Figure 7) were not associated with big shifts in flowering time as
Flowering in pome fruit trees across Australia Department of Agriculture and Fisheries 2016 10
was observed for Applethorpe perhaps due to the higher amount of overall chill received in Shepparton
In Manjimup green tip and flowering dates were highly variable between years 2013 was a lower chill year than 2014 with 55 and 59 chill portions received respectively Shifts in green tip and full bloom dates were not consistent between cultivars (Figure 6) For example in 2014 full bloom was 15 days earlier in rsquoGalaxyrsquo and 10 days later in lsquoHi Earlyrsquo compared with full bloom dates for those cultivars in 2013 while the full bloom dates for lsquoGranny Smithrsquo were similar in both years (Figure 6)
Flowering in pome fruit trees across Australia Department of Agriculture and Fisheries 2016 11
Figure 6 Green tip (green) and full bloom (pink) dates for apple cultivars grown in Applethorpe Shepparton and Manjimup 2013 and 2014 Data points are the average of individual tree observations
Shepparton
Manjimup
Applethorpe
Flowering in pome fruit trees across Australia Department of Agriculture and Fisheries 2016 12
Figure 7 Chill accumulation in Applethorpe Shepparton and Manjimup 2012 to 2015 Number in brackets is the total chill portions received up to 31 August
Shepparton
Manjimup
Applethorpe
Flowering in pome fruit trees across Australia Department of Agriculture and Fisheries 2016 13
Quality of flowering
Variation between cultivars and locations
The duration between the first flower opening and full bloom was more than twice as long in Manjimup (21 days) as it was in Applethorpe (9 days) and Shepparton (10 days) when averaged across cultivars and years (Figure 8) The protracted pattern of flowering was consistently observed in Manjimup over the period of the study and was largely the result of irregular and uneven bud movement within individual tree canopies (data not shown)
A prolonged and irregular period of flowering can be difficult to manage for a number of reasons Determining an appropriate chemical thinning program is challenging when buds are at multiple stages of green tip and flowering on each tree within the block at any given time (Theron 2013) Fruitlets are likely to vary greatly in size and development stage and therefore careful attention is required at the time of hand thinning to ensure that fruitlets are thinned in a manner that optimises crop uniformity and reduces the spread of fruit maturity at harvest (Theron 2013 Erez 2000)
Flowering in pome fruit trees across Australia Department of Agriculture and Fisheries 2016 14
Figure 8 First flower (orange) and full bloom (pink) dates for apple cultivars in Applethorpe Shepparton and Manjimup Data is the average of observations from 2012 to 2015 Bars indicate the confidence interval
Shepparton
Manjimup
Applethorpe
Flowering in pome fruit trees across Australia Department of Agriculture and Fisheries 2016 15
In cultivars of pear the duration of the period between the first flower opening and full bloom was the greatest in Manjimup (Figure 9) as was observed in apple However the patterns of flowering were less consistent within and between locations
Figure 9 First flower (orange) and full bloom (pink) dates for pear cultivars in Applethorpe Shepparton and Manjimup Data is the average of observations from 2012 to 2015 Bars indicate the confidence interval
Flowering overlap and pollination
Overlap of flowering between a cultivar and its pollinisers is essential for good fruit set (Ramirez and Davenport 2013) Changes in the timing of flowering between seasons or across years that result in the loss of flowering synchronisation can therefore result in reduced yields Large shifts in flowering dates like those observed between cultivars and years in Manjimup (Figure 8) increase the risk of poor flowering overlap in any particular season and make it more difficult to select appropriate pollinisers Use of floral bouquets or artificial pollination methods can compensate for loss in flowering overlap however these methods require significant additional labour (Dennis 2003)
The chances of achieving good flowering overlap each season are greatly increased by planting multiple polliniser cultivars with early middle and late flowering habits to ensure a good supply of pollen throughout the flowering period of the commercial cultivar and to reduce frost risk (Delaplane and Mayer 2000 Dennis 2003) Cultivars that flower profusely over an extended period of time generally make good pollinisers (Jackson 2003)
Shifts in flowering timing do not affect fruit set if similar shifts occur in both the cultivar and its pollinisers This was observed in Applethorpe in 2014 when flowering in all cultivars was consistently delayed compared with flowering in 2013
Flowering and temperature implications of a changing climate
Apple trees in Manjimup exhibited greater variability in green tip and flowering dates and a more protracted flowering period compared with trees in Applethorpe and Shepparton Delayed and uneven flowering are symptoms of inadequate chill and it seems likely that the observed patterns of
Flowering in pome fruit trees across Australia Department of Agriculture and Fisheries 2016 16
flowering in Manjimup were a response to mild autumn and winter conditions received throughout the period of this study This finding is supported by numerous studies in the literature describing irregular flowering in apples grown in warm low chill climates (Oukabli 2003 Saure 1985 Theron 2013 Erez 2000) Abnormalities in the late stages of apple flower bud development have also been reported in low chill regions (Oukabli 2003) however flower viability was not assessed in our study
The timing of flowering varied from year to year within each location with the greatest differences observed in Manjimup This variability was caused largely by differences in temperatures from season to season and Australian growers have always had to manage these seasonal shifts in the timing of dormancy-break The relative importance of cold and warm temperatures in determining the timing of flowering is likely to vary between locations and years For example in cold growing regions where plenty of winter chill is received and chilling requirements are well satisfied by the middle of winter dormancy-break will be promoted by warm temperatures in late winter and early spring (Saure 1985) In this case from around mid-winter onwards the trees are sitting in a phase of dormancy known as lsquoeco-dormancyrsquo that is the buds are ready to burst when the environmental conditions are right for growth
This response to heat is evident in cold pome fruit growing regions of the Northern Hemisphere where clear advances in flowering dates have been observed with warmer spring temperatures caused by the changing climate (Legave et al 2013)
In warmer growing locations and years the timing of dormancy-break and flowering are likely to be determined primarily by the accumulation of enough chill (Saure 1985) That is dormancy tends to be prolonged and there is little or no eco-dormancy period buds burst as soon as they have received enough chill (Theron 2013) It is likely that pome trees growing in the warmer regions of Manjimup and Applethorpe in some years do not experience any significant eco-dormancy
As the climate warms most growing regions of Australia will receive less winter chill (Darbyshire et al 2013b) The impacts that this will have on flowering over the next 10 to 20 years will vary between different parts of the country
Cooler regions such as those in Tasmania and NSW with plenty of chilling may experience advances in the timing of flowering as spring temperatures increase As chill accumulation falls below the chilling requirements of cultivars in warmer growing regions of Australia they will likely see increasing variability in green tip and flowering dates from season to season and between cultivars Delayed uneven and protracted flowering will occur in the medium to higher chill cultivars as was observed in Manjimup during this study Low chill years will be experienced more often as the climate warms
Irregular and protracted flowering presents a significant management challenge for growers Options for orchard adaptation to warming autumns and winters include the planting of lower chill cultivars management of delayed and variable flowering with the use of dormancy-breakers and adjustments to chemical and hand thinning practices to reduce variability in fruit size and maturity
It should be noted that while exposure to enough chill is essential for quality flowering in pome fruit (defined here as the uniform blossoming of viable flowers) once chilling requirements have been met the quality of flowering can be further influenced by other factors such as heat nutritional status and water stress These factors were not considered here
While this study looked at temperature and the timing and quality of flowering climate change will have other impacts on flowering and pollination Warming temperatures will potentially impact on floral initiation bee activity and fruit set (Dennis 2003 Atkinson et al 2001 Ramirez and Davenport 2013) In addition this study did not collect data on leaf area development during the green tip and full bloom period Weak leaf development is a symptom of delayed foliation (Saure 1985) caused by inadequate winter chill and reduced leaf area in the weeks after full bloom has been shown to have negative impacts on fruit set and development (Proctor and Palmer 1991 Lauri et al 1996) Further research is required to fully determine the nature of these impacts on the Australian pome fruit industry
Flowering in pome fruit trees across Australia Department of Agriculture and Fisheries 2016 17
The discussion and conclusions from this study were based primarily on the results from observations in apples While results from the pear data were generally consistent with that observed in apples further research would improve the understanding of flowering in this crop Since the vast majority of pears are grown in Victoria (89) (Australian Bureau of Statistics) there was less opportunity to collect extensive datasets from diverse climatic regions
Conclusions
Results from this research support findings from previous studies performed in other parts of the world showing that apples grown in warmer climates exhibit increased variability in flowering within the canopy between individual trees and between varieties and years (Erez 2000 Theron 2013 Cook and Jacobs 2000) Increased variability in flowering results in the reduced ability to predict timing of orchard operations more difficult pollination management challenges for thinning and crop load management and can result in increased variability of fruit maturity at harvest
The Australian apple and pear industry is aiming to increase global competitiveness in an effort to help secure new export markets Success in the global market requires consistent supply of high quality fruit from season to season at competitive prices Additional variability in the crop production system from a warming climate will challenge the Australian industryrsquos ability to achieve the desired export goals on two fronts consistency of supply and in the maintenance of uniform orchard blocks that are a prerequisite for efficient use of labour-saving technologies
Variability caused by inadequate chilling can be managed with the use of additional input of products and labour however grower capacity to respond to these challenges will vary depending on individual social and financial factors An important assessment for growers to make of their orchard businesses will be lsquoat what point will the increased cost of inputs and effort required to produce a consistently high quality crop make a block of trees unprofitablersquo Ongoing orchard observations of flowering performance and relationships with winter chill will be necessary for making meaningful predictions about future block and cultivar profitability
Key messages
- Low winter chill as observed in Manjimup was associated with an uneven (or lsquounevenrsquo) chill accumulation curve caused by short periods of warm weather throughout the autumn and winter seasons
- Green tip and full bloom dates were more variable between years cultivars and individual trees in Manjimup and trees consistently displayed a long and protracted flowering compared with Applethorpe and Shepparton
- Shepparton the site with the most winter chill showed the greatest consistency in green tip and flowering dates from year to year
- The patterns of flowering observed in Manjimup are likely the result of inadequate chill Low winter chill at this site was associated with
High variability in flowering dates between seasons cultivars and individual trees of the same cultivar
Irregular and protracted flowering across most cultivars of apple
- Large shifts in flowering dates between cultivars and seasons increases the risk of poor flowering overlap in any particular year and makes it more difficult to select appropriate pollinisers Greater predictability in the timing of green tip and full bloom has benefits for flowering and pollination management and for planning of orchard operations generally
- Irregular and protracted flowering can be difficult to manage for a number of reasons
Flowering in pome fruit trees across Australia Department of Agriculture and Fisheries 2016 18
Determining an appropriate chemical thinning program is challenging when buds are at multiple stages of green tip and flowering on individual trees
Fruitlets will vary more in size and developmental stage and careful hand thinning is required to optimise crop uniformity
Greater spread of fruit maturity at harvest requires greater effort to pick fruit at the appropriate stage of maturity
- As the climate warms low chill years will become more frequent in milder growing regions of Australia and will likely result in symptoms of inadequate chill in some cultivars Advances in the timing of flowering might be observed in cooler growing regions
- Australian growers already manage seasonal changes in flowering time and it may be the increased irregularity of flowering that presents the greater management challenge
- Options for adaptation to low chill years include planting lower chill cultivars management of delayed and variable flowering with the use of dormancy-breakers and adjustments to chemical and hand thinning practices to reduce variability in fruit size and maturity
- Risks to pollination from shifting flowering times can be reduced through planting multiple polliniser cultivars with early middle and late flowering habits to ensure a good supply of pollen throughout the flowering period Use of floral bouquets or artificial pollination methods can compensate for loss in flowering overlap
- Climate change will add significant variability into the pome fruit crop production system This will present challenges for the Australian industry in the consistency of supply and in maintenance of the uniform orchard blocks that are a prerequisite for the efficient use of mechanisation
- An important assessment for growers to make of their orchard businesses will be lsquoat what point will the increased cost of inputs and effort required to produce a consistently high quality crop make a block of trees unprofitablersquo Ongoing observations of flowering performance and its relationship with chilling will be necessary for making informed predictions about future block and cultivar profitability
Recommendations
Industry
- Warmer temperatures will mean less winter chill for most growing regions of Australia Successful adaptation by the apple and pear industry will require
Comprehensive in-orchard monitoring of flowering dates across cultivars to provide early indication of cultivars that might be impacted by warmer winters in the future changing climate as well as identification of subtle shifts in the timing of flowering between cultivars and their pollinisers
Information about chilling requirements of new and existing cultivars so that growers can make cultivar choices appropriate to their particular growing environment
Consideration of chilling requirements in apple and pear breeding programs when selecting potential new cultivars for development and release Selecting for lower chill cultivars
Good understanding of the efficacy of dormancy-breaking sprays
- Growers in warmer growing regions of Australia would benefit from preparing a strategy for managing low chill years Monitoring of winter chill accumulation and use of dormancy-
Flowering in pome fruit trees across Australia Department of Agriculture and Fisheries 2016 19
breakers in low chill years is a logical inclusion Changes to chemical and hand thinning practices may also form part of the strategy
- Where shifting full bloom dates are likely to be a problem consideration should be given to planting more than one polliniser cultivar to improve the chances of flowering overlap every year
- Models of flowering time have significantly improved in recent times with the development of the lsquoChill-overlap modelrsquo (Darbyshire et al 2016 White 2016) The use of these models will improve the ability to predict changes in the timing of flowering in cultivars of apple under future climates
- Climate analogues (Parkes and White 2016) should be used by the industry to broadly identify climate change impacts on apple and pear production systems and possible options for adaptation Growers in Manjimup are already successfully managing the impacts of inadequate chill in some years lessons can be learnt from their knowledge and experience
- In future more comprehensive data should be collected on orchards through the use of sensing and mapping technologies This data should be used to undertake more sophisticated and comprehensive analysis of flowering patterns and variability between and within locations
- Further research in Australian pears is needed to improve the understanding of flowering in cultivars of this tree crop and the likely impacts of changing climate
- In blocks where flowering is becoming increasingly irregular an important assessment for growers to make of their orchard businesses will be to determine at what point the increased cost of inputs and effort required to produce a consistently high quality crop make a block of trees unprofitable Ongoing observations of flowering performance and its relationship with chilling will be necessary for making informed predictions about future block and cultivar profitability
Scientific research needs
- Better understanding of apple and pear chilling requirements is necessary for making appropriate cultivar selections for particular growing climates This will require
Research into the genetic basis of progression through the phases of dormancy
Determination of the point when buds enter into true dormancy and become sensitive to chilling temperatures and when buds exit true dormancy prior to bud burst Genetic andor physiological markers of these phase shifts are needed
Improved chill model performance through cultivar specific parameterisation of the dynamic model
Understanding of the effectiveness of early versus late season chill in dormancy breaking
- Development of chill-overlap models for flowering time of pome fruit cultivars other than lsquoCripps Pinkrsquo This will improve the predictability of climate change impacts on flowering timing
- Determine the potential effects of warming temperatures on leaf area development floral initiation flower viability fruit set and bee activity as these are likely to have significant impacts for productivity in apple and pear
Flowering in pome fruit trees across Australia Department of Agriculture and Fisheries 2016 20
Acknowledgements
The authors would like to extend a very big thank you to the growers who kindly provided orchard blocks for research observations Celeste from C Pozzebon amp Co Ann and Mauri Lyster Newton Brothers Orchards Maurice Silverstein and Geoffrey Thompson
Thank you to Susie Murphy White Lisa Starkie and Martine Combret from Western Australia Lexie McClymont Susanna Turpin and Wendy Sessions from Victoria and Osi Tabing Peter Nimmo and Allan McWaters from Queensland for the collection of orchard phenology and temperature data And finally thank you to Rebecca Darbyshire Ian Goodwin Jenny Treeby and Penny Measham as well as all of the aforementioned names for the many discussions around the interpretation of the results that were had formally and informally throughout the four years of the project
References
Atkinson C J Taylor L and Kingswell G (2001) The importance of temperature differences directly after anthesis in determining growth and cellular development of Malus fruits Journal of Horticultural Science and Biotechnology 76(6)
Cannell M G R (1989) Chilling thermal time and date of flowering of trees in Wright C J ed Manipulation of Fruiting London Butterworths 99 - 113
Cobon D H Stone G S Carter J O Scanlan J C Toombs N R Zhang X Willcocks J and McKeon G M (2009) The climate change risk management matrix for the grazing industry of northern Australia Rangeland Journal 31(1)
Cook N C and Jacobs G (2000) Progression of apple ( Malus domestica Borkh) bud dormancy in two mild winter climates Journal of Horticultural Science and Biotechnology 75(2)
Darbyshire R (2016) Crossing the threshold adaptation tipping points for Australian fruit trees University of Melbourne
Darbyshire R Pope K and Goodwin I (2016) An evaluation of the chill overlap model to predict flowering time in apple tree Scientia Horticulturae 198 142-149
Darbyshire R Webb L Goodwin I and Barlow E W R (2013a) Evaluation of recent trends in Australian pome fruit spring phenology International Journal of Biometeorology 57(3)
Darbyshire R Webb L Goodwin I and Barlow E W R (2013b) Impact of future warming on winter chilling in Australia International Journal of Biometeorology 57(3) 355-366
Delaplane K S and Mayer D F (2000) Crop Pollination by Bees New York CABI
Dennis F G Jr (2003) Flowering pollination and fruit set and development in Ferree D C and Warrington I J eds Apples botany production and uses Cambridge CAB International 153 - 166
Erez A (2000) Bud dormancy phenomenon problems and solutions in the tropics and subtropics in Erez A ed Temperate Fruit Crops in Warm Climates Kluwer Academic Publishers 17 - 47
Erez A Fishman S Linsley-Noakes G C and Allan P (1990) The dynamic model for rest completion in peach buds Acta Horticulturae 276 165-174
Fishman S Erez A and Couvillon G A (1987) The temperature dependence of dormancy breaking in plants mathematical analysis of a two-step model involving a cooperative transition Journal of Theoretical Biology 124 473 - 483
Hennessy K J and Clayton-Greene K (1995) Greenhouse warming and vernalisation of high-chill fruit in southern Australia Climatic Change 30(3)
Flowering in pome fruit trees across Australia Department of Agriculture and Fisheries 2016 21
Jackson J E (2003) Biology of Apples and Pears Cambridge Cambridge University Press
Lauri P Eacute Teacuterouanne Eacute and Lespinasse J M (1996) Quantitative analysis of relationships between inflorescence size bearing-axis size and fruit-set - An apple tree case study Annals of Botany 77(3) 277-286
Legave J M Blanke M Christen D Giovannini D Mathieu V and Oger R (2013) A comprehensive overview of the spatial and temporal variability of apple bud dormancy release and blooming phenology in Western Europe International Journal of Biometeorology 57(2)
Luedeling E Zhang M H Luedeling V and Girvetz E H (2009) Sensitivity of winter chill models for fruit and nut trees to climatic changes expected in Californias Central Valley Agriculture Ecosystems amp Environment 133(12)
Meier U Graf H Hess M Kennel W Klose R Mappes D Seipp D Stauss R Streif J and van den Boom T (1994) Phaumlnologische Entwick-lungsstadien des Kernobstes (Malus domestica Borkh und Pyrus communis L) des Steinobstes (Prunus-Arten) der Johannisbeere (Ribes-Arten) und der Erdbeere (Fragaria x ananassa Duch) Nachrichtenbl Deut Pflanzenschutzd 46 141 - 153
Oukabli A Bartolini S and Viti R (2003) Anatomical and morphological study of apple (Malus x domestica Borkh) flower buds growing under inadequate winter chilling Journal of Horticultural Science and Biotechnology 78(4) 580-585
Parkes H A and White N (2016) Climate change impacts on flowering in Australian pome fruit trees A climate analogue approach Queensland Department of Agriculture and Fisheries
Proctor J T A and Palmer J W (1991) The role of spur and bourse leaves of three apple cultivars on fruit set and growth and calcium content HortScience 26(6) 789
Ramirez F and Davenport T L (2013) Apple pollination a review Scientia Horticulturae 162
Samish R M (1954) Dormancy in woody plants Annual Review of Plant Physiology 5 183-204
Saure M C (1985) Dormancy release in deciduous fruit trees Horticultural Reviews 7 239-300
State of the climate (2016) Australian Bureau of Meteorology amp CSIRO
Theron K (2013) Chemical thinning of apple South African perspective Acta Horticulturae 998 85 - 90
White N (2016) Approaches for modelling flowering timing in apple trees grown in mild winter climates Department of Agriculture and Fisheries Department of Agriculture and Fisheries
A climate analogue approach to understanding climate change impacts on flowering in Australian pome fruit trees
Heidi Parkes1 Neil White1 and Susie Murphy White2
November 2016
1Department of Agriculture and Fisheries Queensland 2Pomewest Western Australia
This research was presented at Greenhouse 2015 Wrest Point Conference Centre Hobart 27-30 October
This publication has been compiled by Heidi Parkes and Neil White of Horticulture and Forestry Science Department of Agriculture and Fisheries copy State of Queensland 2016 The Queensland Government supports and encourages the dissemination and exchange of its information The copyright in this publication is licensed under a Creative Commons Attribution 30 Australia (CC BY) licence Under this licence you are free without having to seek our permission to use this publication in accordance with the licence terms
You must keep intact the copyright notice and attribute the State of Queensland as the source of the publication Note Some content in this publication may have different licence terms as indicated For more information on this licence visit httpcreativecommonsorglicensesby30audeeden The information contained herein is subject to change without notice The Queensland Government shall not be liable for technical or other errors or omissions contained herein The readeruser accepts all risks and responsibility for losses damages costs and other consequences resulting directly or indirectly from using this information
Climate change impacts on flowering in pome fruit trees a climate analogue approach 2016 1
Summary
Future changes in climate are predicted to result in reduced winter chill in apple and pear growing regions of Australia Potential impacts on the pome fruit industry due to effects of reduced chill on bud dormancy release and flowering of fruit trees in these regions are not yet clear Inadequate winter chill can result in variable and protracted flowering potentially leading to impacts on fruit set and marketable yield at harvest Climate analogues are one option for investigation of potential climate change impacts on agricultural production and appropriate adaptation strategies This study investigated the potential for using the climate analogue concept together with collected datasets to predict impacts of climate change on pome fruit flowering in Australia and to identify possible methods for adaptation
The temperate tree fruit growing regions of Manjimup (WA) and Stanthorpe (QLD) were used as a case study to test this strategy Based on mean autumn and winter temperatures alone Manjimup was considered to be an appropriate climate analogue for Stanthorpe in 2030 Flowering datasets from commercial apple and pear cultivars were collected at each site in 2013 and 2014 Whole tree field assessments were made of 5 green tip first open flower and progression of flowering to full bloom using standardised methods across sites The data show an uneven and protracted pattern of flowering in Manjimup compared with Stanthorpe Average green tip dates for all cultivars were spread across 32 days in Manjimup compared with 15 days in Stanthorpe Similarly average full bloom dates were spread across 19 days in Manjimup and 9 days in Stanthorpe The duration between the first flower opening and full bloom in Manjimup was more than twice as long as in Stanthorpe (an average of 25 days compared with 10 days) when averaged across years and cultivars There were no clear differences in yield between the locations Comparison of grower orchard management practices indicated that 50 of Manjimup growers use dormancy-breaking sprays compared with zero in Stanthorpe
Results from the climate analogue approach suggested that a more variable and protracted pattern of flowering is likely to exist across many apple cultivars in Stanthorpe in 2030 The more variable flowering will not necessarily have significant impacts on productivity of apple orchards in that timeframe and Stanthorpe growers are likely to be able to manage low chill years with the use of dormancy-breaking sprays At this stage there is no apparent need to shift to lower chill cultivars (or crops) as Manjimup growers are achieving high levels of productivity with the same variety mix as is currently grown in Stanthorpe
The climate analogue approach is a valuable tool for providing broad information around potential impacts and adaptation strategies for Australian temperate tree crops and horticulture more generally There are a number of important details to consider when applying this methodology and these are outlined in this report
Climate change impacts on flowering in pome fruit trees a climate analogue approach 2016 2
Table of contents
Introduction 4
Study objectives 4
Methodology 4
Identification of an appropriate climate analogue location 5
Industry comparison 5
Comparison of flowering 5
Comparison of productivity and orchard management practice 6
Results and discussion 7
Identification of an appropriate climate analogue location for Stanthorpe 2030 7
The apple and pear industries in Manjimup and Stanthorpe 8
Apple and pear tree flowering in Manjimup and Stanthorpe 9
Apple and pear productivity in Manjimup and Stanthorpe 12
Orchard management practices in Manjimup and Stanthorpe 13
Conclusions 14
Key messages 15
Recommendations 15
Acknowledgments 16
References 16
Table of figures
Figure 1 Map of Australia showing the locations of Stanthorpe and Manjimup Manjimup was identified as an appropriate climate analogue for Stanthorpe in 2030 7
Figure 2 Box plot showing winter chill projections from four climate models for Stanthorpe in 2030 compared with current winter chill in Manjimup Orange red and blue dots show winter chill data calculated from hourly temperature data collected on-site from 2012 2013 and 2014 respectively Historical boxplot data is for the period from 1986 to 2005 8
Figure 3 Green tip first flower and full bloom dates for cultivars of apple and pear in Manjimup and Stanthorpe in 2013 and 2014 Dates are given as the lsquoday of yearrsquo day 260 is 17 September and day 300 is 27 October Data points are the average of individual tree observations CP is the total chill portions calculated up to 31 Aug 9
Figure 4 Duration of the flowering period from first flower to full bloom in cultivars of apple and pear grown in Manjimup and Stanthorpe in 2013 and 2014 Results are the average of individual tree observations 10
Figure 5 Overlap of flowering periods from first open flower to full bloom in cultivars of apple and pear in Manjimup and Stanthorpe Dates are given as the lsquoday of yearrsquo day 260 is 17 September and day 300 is 27 October Data points are the average of individual tree observations for 2013 and 2014 11
Figure 6 Uneven flowering in lsquoCripps Pinkrsquo Lysterrsquos Orchard Manjimup 2014 11
Climate change impacts on flowering in pome fruit trees a climate analogue approach 2016 3
Figure 7 Results from a survey of Manjimup growers on lsquoCripps Pinkrsquo yields and quality in 2014 The survey was undertaken at a grower roadshow event using digital audience response technology 1 October 2014 13
Table of tables
Table 1 Description of sites used for flowering data observations 5 Table 2 Description of trees used for flowering observations 6 Table 3 Characteristics1 of the apple industries in Manjimup and Stanthorpe 8
Climate change impacts on flowering in pome fruit trees a climate analogue approach 2016 4
Introduction
Future changes in climate are predicted to result in reduced winter chill in apple and pear growing regions of Australia (Darbyshire et al 2013b Hennessy and Clayton-Greene 1995) Potential impacts on the pome fruit industry in these regions are not yet clear Inadequate winter chill results in variable and protracted flowering potentially leading to impacts on fruit set and marketable yield at harvest (Theron 2013 Erez 2000 Saure 1985) Climate analogue analysis involves a detailed comparison between locations where the current climate of one location is similar to the projected future climate of the location of interest (Nyairo et al 2014) This is one option for investigation of potential climate change impacts on agricultural production and identification of appropriate adaptation strategies
Relationships between temperature and flowering in apple and pear trees are complex and poorly understood making it difficult to determine future impacts of warming climate on flowering in these crops A number of benefits of applying a climate analogue approach have been identified (Nyairo et al 2014 Veloz et al 2012) and suggest that it may be a useful approach in the investigation of this question Some of the benefits are
Ability to analyse climate change impacts without the need for understanding of complex physiological processes underlying flowering
Ability to analyse options and capacity for adaptation The question can be asked how do growers in region X respond to a climate that is similar to ours in the future Impacts and adaptation can be investigated simultaneously
Impacts of climate change on flowering are analysed within the production system as a whole
Provision of tangible practical information for growers to work with and allows for growers at the test location to learn from growers at the analogue location
Analogue location can be used as a research site for possible adaptation strategies Improved communication of climate change impacts and options for adaptation to growers
Although the concept has been around for some time most studies have focussed broadly on whole farming systems (Nyairo et al 2014) rather than investigating climate change impacts on a single cropping system or on one physiological aspect of a crop such as flowering
Study objectives
The aim of this project was to investigate potential for using a climate analogue approach together with collected data sets to predict impacts of climate change on pome fruit flowering and to identify possible methods for adaptation
Methodology
To test the potential of the climate analogue approach a case study was undertaken in Stanthorpe Queensland The following questions were posed
1 How will flowering of apple and pear trees be impacted by reduced winter chill in Stanthorpe in 2030
2 Will there be an impact on productivity 3 What can growers do to adapt 4 Is the climate analogue approach appropriate in this context and can it be applied more
broadly 5 Are there factors that should be considered when using climate analogues for informing
climate change adaptation in horticulture
There were four parts to the investigation the identification of an appropriate climate analogue location for Stanthorpe in 2030 comparison of the apple and pear industries in each location to
Climate change impacts on flowering in pome fruit trees a climate analogue approach 2016 5
ensure a meaningful comparison analysis and comparison of flowering behaviour and productivity in each location and comparison of relevant orchard management practices to investigate possible climate change adaptations
Identification of an appropriate climate analogue location
The lsquoanalogues explorerrsquo tool from the Climate change in Australia website1 was used to identify a broad pool of possible climate analogue locations for Stanthorpe in 2030
Winter chill projections for Stanthorpe in 2030 were constructed from four Global Climate Models selected from the list of models generated by the Climate Futures Tool at the Climate Change in Australia website1 for a Representative Concentration Pathway (RCP) of 45 The RCP45 emissions scenario assumes that lower greenhouse gas emissions are achieved in future due to some mitigation efforts It is a minimum to medium case climate change scenario
Historical temperature data from 1986 to 2005 for Manjimup and Stanthorpe was obtained from the SILO climate database2 Point data for the years 2012 2013 and 2014 was obtained from the weather station at Manjimup Horticultural Research Institute (Manjimup) and an on-site temperature logger in the orchard at Applethorpe Research Facility (Stanthorpe)
The Dynamic model (Erez et al 1990 Fishman et al 1987)) was used to calculate winter chill from hourly temperature data recorded in the orchard from the beginning of autumn until the end of winter (1 Mar to 31 Aug) This is the current lsquobest-practicersquo model and has been shown to perform better than other models for calculating winter chill particularly in mild winter climates such as Australia (Darbyshire et al 2013a Luedeling et al 2009)
Industry comparison
Comparison of the apple and pear industries in Manjimup and Stanthorpe was made based on information sourced from the Australian Bureau of Statistics a Shire Council report (Tancred and McGrath 2013) and personal communication with growers and local industry representatives
Comparison of flowering
The flowering datasets were from orchards in Manjimup and Stanthorpe (Table 1) collected in spring 2013 and 2014 from cultivars of apple and pear as part of the project AP12029 Understanding apple and pear production systems in a changing climate (Table 2)
Table 1 Description of sites used for flowering data observations State Location Orchard Latitude and
Longitude Cultivars
Qld Stanthorpe Department of Agriculture and Fisheries Qld Applethorpe Research Facility
2852 S 15190 E
All apples and pears
WA Manjimup Department of Agriculture and Food WA Manjimup Horticultural research Institute
3418 S 11607 E All apples
Newton Brothers Orchards
3413 S 11607 E All pears
1 httpwwwclimatechangeinaustraliagovauenclimate-projectionsclimate-analoguesanalogues-explorer 2 httpswwwlongpaddockqldgovausilo
Climate change impacts on flowering in pome fruit trees a climate analogue approach 2016 6
Table 2 Description of trees used for flowering observations Study site Tree
crop Cultivar Rootstock1 Number of trees
(for yearly observation) Net
Stanthorpe Apple Braeburn M26 5 Yes
Cripps Pink (Pink Ladytrade)
M26 MM106
5 3
Yes
Cripps Red (Sundownertrade)
M26 MM106
5 5
Yes
Fuji M26 5 Yes
Galaxy (Gala)
M26 5 Yes
Granny Smith M26 MM106
4 5
Yes
Hi Early (red delicious)
M26 5 Yes
Pear Packhamrsquos Triumph
D6 5 No
Williamsrsquo Bon Chreacutetien
D6 5 No
Manjimup Apple
Braeburn MM109 2 No
Cripps Pink (Pink Ladytrade)
MM104 M26
2 2
No
Cripps Red (Sundownertrade)
MM104 M26
3 1
No
Galaxy (Gala)
MM104 2 No
Granny Smith MM104 2 No
Hi Early (red delicious)
MM104 2 No
Red Fuji (Fuji)
MM104 2 No
Pear Packhamrsquos Triumph
D6 5 No
Williamsrsquo Bon Chreacutetien
D6 5 No
1Rootstock effects were not considered in this analysis as previous studies indicated that rootstocks did not significantly impact the timing of green tip and flowering dates in data collected for this study (Darbyshire 2016)
Green tip and flowering data was collected three times per week at the whole tree level For each tree the date of green tip first open flower and full bloom were recorded A tree was defined as being at lsquogreen tiprsquo when 5 of the buds had observable green tips corresponding to the 07 stage in the international BBCH code for pome fruit (Meier et al 1994) A tree was defined as being at lsquofull bloomrsquo when 80 of the flowers were open similar to the 65 stage in the international BBCH code for pome fruit (Meier et al 1994)
Comparison of productivity and orchard management practice
Broad yield data and information on orchard management practices was obtained from the Australian Bureau of Statistics personal communication with growers and local industry representatives and from a grower survey performed using digital audience response technology at the AP12029 project
Climate change impacts on flowering in pome fruit trees a climate analogue approach 2016 7
roadshow event held in Manjimup on 1 October 2014 Detailed yield and orchard practice data was not collected as part of this study
Results and discussion
Identification of an appropriate climate analogue location for Stanthorpe 2030
The Analogues Explorer tool was used to identify a broad pool of possible climate analogue locations for Stanthorpe in 2030 When climates were matched for annual temperature and rainfall twelve analogue locations were listed including Bega Manjimup Mount Barker Young and Albury-Wodonga
To ensure that the climate analogue selected could be used to specifically investigate the impacts of reduced chilling on flowering the Analogues Explorer tool was set-up to identify analogues matched on autumn and winter temperatures only Spring and summer temperatures were removed from the assessment along with rainfall A slightly different set of climate analogues was listed including Nuriootpa Horsham Naracoorte Manjimup Mount Barker and Sale From this list Manjimup one of Australiarsquos main apple and pear growing regions was selected as the climate analogue location for Stanthorpe in 2030 (Figure 1)
Figure 1 Map of Australia showing the locations of Stanthorpe and Manjimup Manjimup was identified as an appropriate climate analogue for Stanthorpe in 2030
It is worth noting that when the seasons are considered separately Manjimup is a reasonable analogue for 2030 in Stanthorpe for summer autumn and winter but not for the spring This is because in the current climate Stanthorpe has a warmer spring than Manjimup
Projections of winter chill using global climate models were undertaken to evaluate how well winter chill in Manjimup is likely to match chill received under a 2030 climate in Stanthorpe (Figure 2) The historical chill portion data for the period 1986 to 2005 in Manjimup is similar to the chill data for Stanthorpe over this same period (Figure 2) However 2012 2013 and 2014 were low chill years in Manjimup If the chill portion data for these years is considered separately it falls neatly within the range of the projected winter chill results for Stanthorpe in 2030 (Figure 2) Therefore Manjimup in the years 2012 to 2014 was considered to be a good climate analogue for assessing the impacts of reduced winter chill on flowering in Stanthorpe in 2030
Climate change impacts on flowering in pome fruit trees a climate analogue approach 2016 8
Figure 2 Box plot showing winter chill projections from four climate models for Stanthorpe in 2030 compared with current winter chill in Manjimup Orange red and blue dots show winter chill data calculated from hourly temperature data collected on-site from 2012 2013 and 2014 respectively Historical boxplot data is for the period from 1986 to 2005
The apple and pear industries in Manjimup and Stanthorpe
The apple and pear industries in Manjimup and Stanthorpe are comparable on most industry characteristics including gross value orchard size variety mix rootstocks and planting systems (Table 3) One significant difference is in the use of orchard netting Stanthorpe apples are grown almost entirely under hail netting while most of the apple orchards in the Manjimup district are un-netted (although this is changing rapidly)
Table 3 Characteristics1 of the apple industries in Manjimup and Stanthorpe Industry characteristic Manjimup Stanthorpe
1Gross value is the average from the 2002-2003 to 2012-2013 seasons
Climate change impacts on flowering in pome fruit trees a climate analogue approach 2016 9
Apple and pear tree flowering in Manjimup and Stanthorpe
In 2013 and 2014 Stanthorpe received 72 and 74 chill portions respectively while Manjimup received 54 chill portions in both years (well below its long-term average) (Figure 3) The low winter chill in Manjimup was associated with a greater spread of green tip and full bloom dates in both years (Figure 3) Average green tip dates for all cultivars were spread across 32 days in Manjimup compared with 15 days in Stanthorpe Similarly average full bloom dates were spread across 19 days in Manjimup compared with 9 days in Stanthorpe
Figure 3 Green tip first flower and full bloom dates for cultivars of apple and pear in Manjimup and Stanthorpe in 2013 and 2014 Dates are given as the lsquoday of yearrsquo day 260 is 17 September and day 300 is 27 October Data points are the average of individual tree observations CP is the total chill portions calculated up to 31 Aug
The duration between the first flower opening and full bloom in Manjimup was more than twice as long as in Stanthorpe (an average of 25 days compared with 10 days) when averaged across years and cultivars (Figure 4 and Figure 5) This protracted pattern of flowering was consistently observed in Manjimup over the period of the study and was largely the result of irregular and uneven bud movement within individual tree canopies (Figure 6)
A prolonged and irregular period of flowering can be difficult to manage for a number of reasons Determining an appropriate chemical thinning program is challenging when buds are at multiple stages of green tip and flowering on each tree within the block at any given time (Theron 2013) Fruitlets are likely to vary greatly in size and development stage and therefore careful attention is required at the time of hand thinning to ensure that fruitlets are thinned in a manner that optimises crop uniformity and reduces the spread of fruit maturity at harvest (Theron 2013 Erez 2000)
A long drawn out flowering season has other indirect impacts on orchard activities including a longer period for controlling flowering pests such as dimpling bug and for managing of bee hives These impacts were not assessed in this study
Overlap of flowering between a cultivar and its pollinisers is essential for good fruit set (Ramirez and Davenport 2013) Changes in the timing of flowering between seasons or across years that result in
Climate change impacts on flowering in pome fruit trees a climate analogue approach 2016 10
the loss of flowering synchronisation can therefore result in reduced yields Flowering overlap does not appear be a problem for either Manjimup or Stanthorpe in the years of study (Figure 5) however reduced marketable yields can result from the extended period of flowering overlap that is caused by irregular bud movement (Petri and Leite 2004) In this situation fruit set occurs over an extended period of time resulting in the significant spread of fruit maturity within individual trees
Figure 4 Duration of the flowering period from first flower to full bloom in cultivars of apple and pear grown in Manjimup and Stanthorpe in 2013 and 2014 Results are the average of individual tree observations
Climate change impacts on flowering in pome fruit trees a climate analogue approach 2016 11
Figure 5 Overlap of flowering periods from first open flower to full bloom in cultivars of apple and pear in Manjimup and Stanthorpe Dates are given as the lsquoday of yearrsquo day 260 is 17 September and day 300 is 27 October Data points are the average of individual tree observations for 2013 and 2014
Figure 6 Uneven flowering in lsquoCripps Pinkrsquo Lysterrsquos Orchard Manjimup 2014
Climate change impacts on flowering in pome fruit trees a climate analogue approach 2016 12
Apple and pear productivity in Manjimup and Stanthorpe
Low winter chill and irregular flowering can reduce productivity through impacts on fruit set and variability of fruit quality at harvest (Petri and Leite 2004 Erez 2000) To investigate any association between irregular and protracted flowering in Manjimup in 2013 and 2014 with productivity in those years broad assessments of yield were undertaken
Meaningful comparison of yield data between locations can be problematic as yield is impacted by the interaction of many complex factors including pests and diseases irrigation planting systems tree canopy management practices as well as climatic factors Long-term apple yield data was similar between locations with an average of 377 kg per tree in Manjimup and 382 kg in Stanthorpe (source Australian Bureau of Statistics)
There was no evidence of reduced productivity in Manjimup in the low chill year of 2014 In a survey of Manjimup growers 69 reported an above average or excellent yield in 2014 and 79 reported average or really good fruit quality in 2014 (Figure 7) These results were based on grower perceptions detailed yield data was not collected as part of this study
Climate change impacts on flowering in pome fruit trees a climate analogue approach 2016 13
Figure 7 Results from a survey of Manjimup growers on lsquoCripps Pinkrsquo yields and quality in 2014 The survey was undertaken at a grower roadshow event using digital audience response technology 1 October 2014
Orchard management practices in Manjimup and Stanthorpe
The lack of evidence for losses in marketable yield as a result of the variable and protracted flowering observed in Manjimup in 2014 could be because 1) the observed pattern of flowering had no impact on fruit set or fruit quality at harvest 2) Manjimup growers have adjusted management practices to adapt to low chill years or 3) impacts on productivity were there but were not great enough to be picked up in grower yield records
While it was not possible to distinguish between these alternative explanations with the data collected in this study it was worth considering whether Manjimup growers have implemented any changes to cultural practices and or longer term strategies to manage variable and protracted flowering In the survey of Manjimup growers 50 indicated that they were using dormancy-breaking sprays on some
Climate change impacts on flowering in pome fruit trees a climate analogue approach 2016 14
cultivars to manage the irregular flowering This is compared with zero growers in Stanthorpe for that year
It is not clear whether the use of dormancy-breaking sprays in Manjimup is the reason that there was no clear impact of the variable and protracted flowering on productivity but it is likely to have helped (Erez 1995 Saure 1985 Petri et al 2014)
A longer-term strategy for managing the effects of low chill years on flowering is to plant cultivars with lower chilling requirements The existing variety mix was similar in Stanthorpe and Manjimup and there was no apparent difference in the cultivars under consideration for new plantings (personal communication)
Conclusions
The following conclusions on the impact of reduced winter chill on Stanthorpersquos apple industry in 2030 can be drawn from the evaluation of flowering productivity and orchard management practices in Manjimup
1 How will flowering of apple and pear trees be impacted by reduced winter chill in
Stanthorpe in 2030
A more variable and protracted pattern of flowering is likely to exist across many apple cultivars in Stanthorpe in 2030
2 Will there be an impact on productivity
The more variable flowering will not necessarily have significant impacts on productivity of apple orchards in 2030
3 What can growers do to adapt
Stanthorpe growers are likely to be able to manage low chill years with the use of dormancy-breaking sprays At this stage there is no clear need to shift to lower chill cultivars (or crops) as Manjimup growers are achieving high levels of productivity with the same variety mix as is currently grown in Stanthorpe
4 Is the climate analogue approach appropriate in this context and can it be applied more
broadly
Yes the climate analogue approach provided insight into potential impacts of reduced winter chill on flowering in Stanthorpe in 2030 and is likely to be a valuable tool for broadly evaluating climate change impacts and options for adaptation in many horticultural contexts
5 Are there factors that should be considered when using climate analogues for informing
climate change adaptation in horticulture
Three important factors for consideration were identified during this case study
Selection of the climate analogue should be undertaken carefully with consideration given to differences between the analogue and target locations with respect to environment industry social factors and so on
The Analogues Explorer tool comes with the following qualifying statement
ldquoIt is important to note that other potentially important aspects of local climate are not matched when using this approach such as frost days or other local climate influences Furthermore for agricultural applications solar radiation and soils are not considered Thus we advise against the analogues being used directly in adaptation planning without considering more detailed informationrdquo
Climate change impacts on flowering in pome fruit trees a climate analogue approach 2016 15
A good example of why this is important was identified in this case study The town of Young was one of the possible climate analogues listed for Stanthorpe in 2030 when the climates were matched on annual temperature and rainfall In the current climate Young receives significantly higher winter chill than Stanthorpe but has a hotter summer Hence they might be a good match based on annual temperature but Young would not have been a useful analogue for evaluating reduced winter chill in Stanthorpe On the other hand it might be a good analogue for assessing risk associated with extreme summer heat
An intrinsic assumption of the climate analogue approach is that the only significant difference between the test site and the analogue location is the climate however locations might differ in other ways that could significantly reduce the value of the climate analogue approach For instance if comparing crop production in Australia with that of somewhere else in the world the production systems may be too different to provide meaningful impact and adaptation information
Relationships between climate and physiology are complex the details and nuances of climate change impacts may not be fully defined by the climate analogue approach
This case study concluded that the differences in flowering behaviour observed in Manjimup compared with Stanthorpe were the result of low winter chill in Manjimup in 2013 and 2014 However it is possible that the variable and protracted flowering in Manjimup was a response to the complex interaction between multiple factors other than total winter chill such as the pattern of chill accumulation heat spring temperatures and day-length factors This will only be understood through further experimentation detailed climate data and modelling
The climate analogue approach is limited to investigation of one possible climate scenario at a time while a modelling approach enables the testing of many different climate scenarios
Manjimup was used as a climate analogue for Stanthorpe in 2030 To investigate impacts of reduced winter chill in Stanthorpe in 2050 or 2090 alternative analogue locations would need to be sought as the conclusions from this case study cannot be extended beyond the intended time-frame
Key messages
- Results from the climate analogue approach suggested that more variable and protracted flowering behaviour is likely in pome fruit trees in Stanthorpe by 2030 without significant impact on productivity Adaptations will include the use of dormancy-breaking sprays to manage flowering but there is no evidence for a need to switch to low chill cultivars at this stage
- The climate analogue approach can provide broad information around potential impacts and adaptation strategies for Australian temperate tree crops and horticulture more generally however the details need to be considered cautiously
Recommendations
- Climate analogues should be used by the industry to broadly identify climate change impacts on apple and pear production systems and possible options for adaptation Growers in Manjimup are already successfully managing the impacts of inadequate chill in some years lessons can be learnt from their knowledge and experience
- This study did not capture the many potential impacts that protracted flowering can have on orchard management including a longer period for flowering pest control such as dimpling bug and for management of bee hives difficulties in the timing of chemical thinner application more labour intensive hand thinning and dealing with greater variability of fruit maturity at
Climate change impacts on flowering in pome fruit trees a climate analogue approach 2016 16
harvest A more detailed grower survey should be undertaken to better understand how growers in Manjimup are managing flowering in low chill years
- Potential impacts of low winter chill on marketable yield were not adequately addressed in this study and requires further research using a climate analogue and or modelling approach
- A global study to investigate the limits of profitable apple production with regards to winter chill would provide valuable information for the Australian industry in climate change adaptation planning Production areas with very low winter chill accumulation in South Africa and Southern Brazil rely heavily on dormancy-breakers and would be obvious target locations for this research
- The Australian Apple and Pear Industryrsquos ability to adapt to changing climate will depend not only on basic research but on its ability to observe and capture data on tree physiology climate and orchard practice and interpret it in a meaningful way Australiarsquos industry is made up of growing regions with diverse climates and much can be learnt about climate change impacts and options for adaptation by sharing of knowledge
Acknowledgments
The authors would like to extend a very big thank you to the growers Anne and Mauri Lyster and Newton Brothers Orchards who kindly provided orchard blocks for research observations
Thank you to Lisa Starkie and Martine Combret from Western Australia and Osi Tabing Peter Nimmo and Allan McWaters from Queensland for the collection of orchard phenology and temperature data Thank you also to Rebecca Darbyshire for the discussion and input around the interpretation of results
References
Darbyshire R (2016) Crossing the threshold adaptation tipping points for Australian fruit trees University of Melbourne
Darbyshire R Webb L Goodwin I and Barlow E W R (2013a) Evaluation of recent trends in
Australian pome fruit spring phenology International Journal of Biometeorology 57(3)
Darbyshire R Webb L Goodwin I and Barlow E W R (2013b) Impact of future warming on
winter chilling in Australia International Journal of Biometeorology 57(3) 355-366
Erez A (1995) Means to compensate for insufficient chilling to improve bloom and leafing Acta
Horticulturae 395 81-95
Erez A (2000) Bud dormancy phenomenon problems and solutions in the tropics and subtropics in
Erez A ed Temperate Fruit Crops in Warm Climates Kluwer Academic Publishers 17 - 47
Erez A Fishman S Linsley-Noakes G C and Allan P (1990) The dynamic model for rest
completion in peach buds Acta Horticulturae 276 165-174
Fishman S Erez A and Couvillon G A (1987) The temperature dependence of dormancy
breaking in plants mathematical analysis of a two-step model involving a cooperative transition Journal of Theoretical Biology 124 473 - 483
Climate change impacts on flowering in pome fruit trees a climate analogue approach 2016 17
Hennessy K J and Clayton-Greene K (1995) Greenhouse warming and vernalisation of high-chill
fruit in southern Australia Climatic Change 30(3)
Luedeling E Zhang M H Luedeling V and Girvetz E H (2009) Sensitivity of winter chill models
for fruit and nut trees to climatic changes expected in Californias Central Valley Agriculture Ecosystems amp Environment 133(12)
Meier U Graf H Hess M Kennel W Klose R Mappes D Seipp D Stauss R Streif J and
van den Boom T (1994) Phaumlnologische Entwick-lungsstadien des Kernobstes (Malus domestica Borkh und Pyrus communis L) des Steinobstes (Prunus-Arten) der Johannisbeere (Ribes-Arten) und der Erdbeere (Fragaria x ananassa Duch) Nachrichtenbl Deut Pflanzenschutzd 46 141 - 153
Nyairo R Onwonga R Cherogony K and Luedeling E (2014) Applicability of climate analogues
for climate change adaptation planning in Bugabira commune of Burundi Sustainable Agriculture Research 3(4) 46 - 62
Petri J L and Leite G B (2004) Consequences of insufficient winter chilling on apple tree bud-
break Acta Horticulturae 662 53-60
Petri J L Leite G B Couto M Gabardo G C and Haverroth F J (2014) Chemical induction of
budbreak New generation products to replace hydrogen cyanamide Acta Horticulturae 1042 159-166
Ramirez F and Davenport T L (2013) Apple pollination a review Scientia Horticulturae 162
Saure M C (1985) Dormancy release in deciduous fruit trees Horticultural Reviews 7 239-300
Tancred S and McGrath C (2013) Horticulture Production in Queenslands Southern Downs
Region
Theron K (2013) Chemical thinning of apple South African perspective Acta Horticulturae 998 85
- 90
Veloz S Williams J W Lorenz D Notaro M Vavrus S and Vimont D J (2012) Identifying
climatic analogs for Wisconsin under 21st-century climate-change scenarios Climatic Change 112(3-4) 1037-1058
Dormancy-breaking sprays for low winter chill in apples
Heidi Parkes Department of Agriculture and Fisheries Queensland
Susie Murphy White Pomewest Western Australia
Sally Bound University of Tasmania Tasmania
September 2016
This publication has been compiled by Heidi Parkes of Horticulture and Forestry Science Department of Agriculture and Fisheries copy State of Queensland 2016 The Queensland Government supports and encourages the dissemination and exchange of its information The copyright in this publication is licensed under a Creative Commons Attribution 30 Australia (CC BY) licence Under this licence you are free without having to seek our permission to use this publication in accordance with the licence terms
You must keep intact the copyright notice and attribute the State of Queensland as the source of the publication Note Some content in this publication may have different licence terms as indicated For more information on this licence visit httpcreativecommonsorglicensesby30audeeden The information contained herein is subject to change without notice The Queensland Government shall not be liable for technical or other errors or omissions contained herein The readeruser accepts all risks and responsibility for losses damages costs and other consequences resulting directly or indirectly from using this information
iii Dormancy-breaking sprays for low winter chill in apples
Summary
In the 2015-16 season trials were undertaken in lsquoGalarsquo apple trees at three locations
(Queensland Western Australia and Tasmania) to assess the efficacy of using dormancy-
breaking sprays under current Australian climates and the potential to use these sprays as
an orchard management adaptation to inadequate winter chill under future Australian
climates The trials compared the effect of Waikentrade Dormexreg and Ergerreg on the timing of
green tip and flowering the duration of the flowering period fruit set yield harvest time and
variability of maturity at harvest All dormancy-breaking sprays were able to advance
flowering time and compact the flowering period in lsquoGalarsquo apple with differences observed
between products and sites Fruit maturity was advanced with dormancy-breakers (again
with differences observed between products and sites) and generally reflected differences in
flowering dates There were no differences in fruit set yield or variability of apple maturity in
trees treated with dormancy-breaking sprays despite the compaction of flowering Dormexreg
had the most significant impacts on lsquoGalarsquo flowering and harvest timing in WA and QLD
when compared with Waikentrade and Ergerreg The timing of spray application relative to green
tip and winter chill accumulation impacted the bud burst and flowering response to
dormancy-breaking products and therefore flowering responses are likely to vary between
seasons and cultivars Dormancy-breaking sprays are likely to be an effective tool for
managing flowering in lsquoGalarsquo and other apple cultivars in lower chill years in Australia
Benefits from the use of dormancy-breakers would be greater in low chill years when the
potential impacts of inadequate chill on flowering are greatest Therefore benefits are likely
to increase under future warmer climate scenarios Impacts of dormancy-breaking sprays on
fruit quality and length of the harvest window remain unclear
iv Dormancy-breaking sprays for low winter chill in apples
Table of contents
Introduction 6
Project Objectives 7
Materials and methods 7
Site description 7
Experimental design 8
Spray application 8
Temperature data and calculation winter chill 10
Green tip and flowering 10
Fruit set 11
Fruit sampling and maturity assessments 11
Variability in fruit quality at harvest 11
Yield 11
Phytotoxicity 11
Results and discussion 12
Timing of spray application 12
Green tip and flowering 12
Fruit set and yield 15
Fruit maturity and quality 16
Cost-benefit analysis 18
Conclusions 20
Key messages 22
Recommendations 22
Acknowledgements 23
Appendices 23
References 23
Table of figures
Figure 1 Study sites in Huonville TAS (a) Stanthorpe QLD (b) and Manjimup WA (c) in spring 2015 8
Figure 2 Application of dormancy-breaking sprays using a hand lance in Manjimup WA 9
Figure 3 Chill Portion accumulation and dormancy-breaking spray application timing at study sites in TAS QLD and WA 2015 10
Figure 4 Green tip first flower and full bloom in Gala apples treated with and without dormancy-breaking sprays in TAS QLD and WA 13
Figure 5 Differences in stages of flowering on 18 September 2015 in QLD lsquoGalarsquo trees treated with and without dormancy-breakers 14
Figure 6 Fruit set in lsquoGalarsquo apple trees treated with dormancy-breaking sprays at study sites in TAS QLD and WA 2015 15
v Dormancy-breaking sprays for low winter chill in apples
Figure 7 Fruit at harvest on 27 January 2016 in lsquoGalarsquo trees treated with Dormexreg and Ergerreg QLD (centre tree was sprayed surrounding trees are untreated) 18
Figure 8 A schematic representation of the progression of buds through dormancy showing the point at which buds become responsive to the action of dormancy-breaking sprays (Faust et al 1997) 21
Table of tables
Table 1 Description of the orchard study sites 7
Table 2 Details of the dormancy-breaking sprays applied to lsquoGalarsquo trees in WA TAS and QLD in winter 2015 9
Table 3 Actual timing of dormancy-breaking spray application on lsquoGalarsquo trees in QLD WA and TAS 2015 10
Table 4 Effect of dormancy-breaking sprays on green tip and flowering dates and duration for lsquoGalarsquo apple strains grown in TAS QLD and WA in the 2015 - 2016 season 14
Table 5 Effect of dormancy-breaking sprays on gross yield and its components at harvest for lsquoGalarsquo apple strains grown in TAS QLD and WA in the 2015-2016 season 16
Table 6 Effect of dormancy-breaking sprays on fruit maturity and quality at harvest for lsquoGalarsquo apple strains grown in TAS QLD and WA in the 2015-2016 season 17
Table 7 Outline of cost and benefits associated with the use of dormancy-breaking sprays to manage low winter chill years in apple 19
6 Dormancy-breaking sprays for low winter chill in apples
Introduction
Dormancy is a phase of the annual cycle of apple trees that allows them to survive unfavourably cold winter conditions (Saure 1985) The minimum accumulation of winter chill needed to break bud dormancy is defined as the chilling requirement and is thought to be genetically determined (Labuschagne et al 2002 Samish 1954)
Failure to adequately satisfy the chilling requirement can result in delayed and uneven bud burst and flowering and extended duration of the flowering period (Saure 1985 Oukabli 2003) An extended flowering period reduces the effectiveness of chemical thinning (Petri and Leite 2004) and can impact on fruit set and yield (Erez 1995) It has also been shown to result in greater variability of fruit size and maturity which impacts pest and disease management and harvest efficiency (Petri and Leite 2004)
Efforts are being made to breed lower chill cultivars in some crops to enable commercial production in milder growing regions however management tools to compensate for insufficient chilling are still required in many temperate tree fruit production systems in warmer climates (Erez 1995) These tools utilise a range of strategies to manipulate bud progression through dormancy including the use of dormancy-breaking sprays to promote bud burst (Erez 1995 Allderman et al 2011 Saure 1985) The use of dormancy-breaking sprays is perhaps the most widely used and accepted method for managing low chill conditions globally (Erez 2000 Jackson and Bepete 1995 Petri et al 2014)
Winter chill is predicted to decrease in Australian growing regions under future climate change with milder districts likely to experience the impacts of inadequate chilling on a more regular basis (Darbyshire et al 2013 White 2016) The use of dormancy-breaking sprays is a potential adaptation for the apple industry to manage existing commercial cultivars in warmer years as they have been shown to stimulate earlier more homogenous bud burst and flowering in a number of crops grown in conditions with insufficient winter chill (Erez et al 2008 Petri et al 2012 Saure 1985) Additional benefits such as improved uniformity of fruit maturity and quality with the use of dormancy-breaking sprays have been reported (Petri and Leite 2004)
Different types of products have been shown to have dormancy-breaking action in a range of crops These include thidiazuron (a compound with cytokinin-like activity) (Wang et al 1986) dinitro-o-cresol (DNOC-oil) and potassium nitrate (Faust et al 1997) garlic extract and gibberellic acid (Abd El-Razek et al 2013) the emulsified vegetable oil compound Waikentrade (Bound and Miller 2006) and hydrogen cyanamide which is better known as Dormexreg (Bound and Jones 2004) Dormexreg has known risks for plant and human health and therefore alternatives to the use of this product have been sought (Petri et al 2014) More recently Ergerreg an inorganic nitrogen compound combined with calcium nitrate has been shown to cause earlier and more compact flowering in apples (Petri et al 2014 Petri et al 2010)
However with the exception of two studies (Bound and Jones 2004 Bound and Miller 2006) little work has been undertaken in Australia to investigate the efficacy of dormancy-breaking sprays to induce earlier and more uniform flowering in apple cultivars grown under local conditions and the effects on fruit quality and yield remain unclear
A survey performed at the WA National Climate Change project Roadshow event in 2014 indicated that half of the growers were currently using Waikentrade and or Dormexreg for the purposes of stimulating uniform bud burst and flowering under conditions of inadequate chill however there was considerable uncertainty around best practice issues and effectiveness Questions and discussions with growers in other growing regions also indicated an interest in these products but highlighted the need for better understanding regarding use and efficacy in low chill years under current climates and potential as an adaptation strategy for climate change
7 Dormancy-breaking sprays for low winter chill in apples
Project Objectives
The overarching research question was are dormancy-breaking sprays a feasible adaptation option for the Australian apple industry to low chill years in current and future climates
The specific research objectives were to determine
a Impact of dormancy-breaking sprays on the timing of bud burst and flowering and duration of the flowering period in lsquoGalarsquo apple grown in diverse Australian climates
b Impact of dormancy-breaking sprays on fruit set yield and variability of maturity and quality in Australian lsquoGalarsquo apple trees
c Comparative effectiveness of using Waikentrade Dormexreg and Ergerreg as dormancy-breaking sprays in apple
d Cost-benefit of using dormancy-breaking sprays
e Issues (actual and potential) associated with using dormancy-breaking sprays for management of and adaptation to inadequate winter chill under Australian conditions
f Future research needs towards improving orchard practices around the use of dormancy-breaking products
To investigate these objectives a study was undertaken in lsquoGalarsquo apple tree cultivars in the 2015 2016 season at three orchard locations around Australia (QLD WA and TAS)
Materials and methods
Site description
The study was performed at three commercial orchard sites around Australia in the 2015 to 2016
season (Table 1 and Figure 1) Sites were fully mature lsquoGalarsquo blocks and were representative of high-
density plantings in Australia Trees were trained to a dominant central leader and with the
exception of the application of dormancy-breaking sprays as part of this study were managed by the
grower using standard orchard practices
Table 1 Description of the orchard study sites
State Growing region
Latitude and longitude
lsquoGalarsquo strain Rootstock
Density treesha
Netted
Queensland (QLD)
Stanthorpe 2852 S 15190 E
Royal GalaM26 2500 Yes
Western Australia (WA)
Manjimup 3416 S 11670 E
GalaxyM26 2500 No
Tasmania (TAS)
Huonville 4301 S 14706 E
Alvina GalaM26 2500 No
8 Dormancy-breaking sprays for low winter chill in apples
Figure 1 Study sites in Huonville TAS (a) Stanthorpe QLD (b) and Manjimup WA (c) in spring 2015
Experimental design
The experiment was a randomised complete block design with two treatments (Waikentrade and Dormexreg) and an untreated control in WA and TAS and three treatments (Waikentrade Dormexreg and Ergerreg) and an untreated control in QLD Replicates were individual trees with five replicates per
treatment Guard trees were included either side of the datum trees to ensure complete coverage of
datum trees and to protect other datum trees in the row from over-spraying Sprays were applied at
one concentration and timing according to directions on the product label
Spray application
Dormancy-breaking sprays were applied to the datum trees using a hand lance (Figure 2) as
described in Table 2
a
b
c
9 Dormancy-breaking sprays for low winter chill in apples
Table 2 Details of the dormancy-breaking sprays applied to lsquoGalarsquo trees in WA TAS and QLD in winter 2015
Dormexreg Waikentrade Ergerreg
Active constituent 520gL Cyanamide 388gL Methyl esters of fatty acids
250gL Decanol alkoxylate (fertiliser adjuvant)
Product rate 3L 100L water (3 vv) 4L 100L water (4 vv) 5L 100L water (5 vv)
Additives
50ml100L Agral or 125ml100L Kendeen 20
NA 10kg100L Calcium nitrate
Application Applied as a fine spray over entire tree to the point of run-off
Application timing
35 days before expected green tip (label suggests 30 ndash 45 days)
35 before expected green tip (label suggests 35 ndash 50 days)
35 days before expected green tip (label suggests 45 days)
Determination of application date
Grower records of historical green tip dates were accessed for the study site Chill accumulation was monitored during the winter and compared with historical chill accumulation data to obtain the best estimate of expected green tip date
Figure 2 Application of dormancy-breaking sprays using a hand lance in Manjimup WA
10 Dormancy-breaking sprays for low winter chill in apples
Table 3 Actual timing of dormancy-breaking spray application on lsquoGalarsquo trees in QLD WA and TAS 2015
Location Spray Date Green tip date
Spray timing (days before
green tip)
Chill Portions at spraying
(brackets total chill)
Total chill Portions
TAS 13 Aug 8 Sep 26 95 (84) 113
QLD 30 July 5 Sep 37 60 (75) 80
WA 18 Aug 23 Sep 36 58 (75) 77
In untreated trees accumulated from 1 Jan to green tip
Figure 3 Chill Portion accumulation and dormancy-breaking spray application timing at study sites in TAS QLD and WA 2015
Temperature data and calculation winter chill
Hourly temperature data was recorded in the orchard using temperature data loggers placed inside a miniature Stevensonrsquos screen positioned approximately 15 to 2m within the tree row Winter chill was calculated in Chill Portions using the Dynamic model (Erez et al 1990 Fishman et al 1987)
Green tip and flowering
Buds were monitored three times per week (full methods described in appendix 1) from just prior to green tip until the end of flowering Only spur and terminal buds were assessed with axillary buds
11 Dormancy-breaking sprays for low winter chill in apples
and long highly vigorous shoots excluded Dates were recorded for the day on which each tree reached green tip 5 flowering and full bloom
Green tip was defined as the date when 5 of the buds of the tree had observable green tips corresponding to the 07 stage in the international BBCH code for pome fruit (beginning of bud break first green leaf tips just visible) (Meier et al 1994) Full bloom was defined as the date when 80 of the flowers were open similar to stage 65 in the international BBCH code for pome fruit (full flowering at least 50 of flowers open first petals falling) (Meier et al 1994)
Fruit set
Fruit set measurements were taken from three representative mid-canopy branches per tree The number of spur and terminal flower clusters were recorded for each limb soon after green tip when flowers were emerging The number of fruit set per cluster was recorded for each tagged limb after final fruit drop but before hand-thinning
Fruit sampling and maturity assessments
A 30 fruit sample was taken per datum tree prior but as close as possible to the growerrsquos first harvest For the purpose of standardisation between treatments fruit was sampled from the mid-section of each tree on the same side of the row To ensure the full range of variability was captured fruit were picked from along the entire length of a branch before moving on to the next branch This ensured that fruit was not biased towards selection from the outside or inside of the canopy
The following assessments were made on the 30 fruit sample
- Starch Pattern Index (SPI) was determined using the starch-iodine test for apples Each fruit was cut transversely across the equator and the cut surface of one side sprayed with a solution of 1g potassium iodide plus 025g iodine per 100ml water (01 iodine 1 potassium iodide The resulting pattern of starch hydrolysis was compared with the ENZA 0-6 scale
- Background colour (BGC) was estimated using an ENZA lsquoRoyal Galarsquo swatch - Red blush intensity (RBI) was assessed by comparing the blushred side of the fruit with the
lsquoRoyal Galarsquo ENZA 11 point colour chart - Red blush coverage (RBC) was assessed by estimating the of the fruit surface covered by
greater than or equal to an RBI of 2 (on the ENZA 11 point chart)
Variability in fruit quality at harvest
Variability of fruit maturity and quality at harvest was assessed by calculating the standard deviation of the fruit weight SPI BGC RBI RBC measurements taken from the 30 fruit sample
Yield
Yield was calculated per tree by multiplying the total fruit number (counted and recorded prior to harvest) by the average fruit weight (taken from the 30 fruit sample) Trunk cross-sectional area (TCA) was calculated from a trunk circumference measurement taken 20 cm above the graft
Phytotoxicity
As both Dormexreg (Bound and Jones 2004) and Ergerreg (Hawerroth et al 2010) can cause phytotoxicity phtotoxicity was assessed and recorded from the date of spray application to flowering using a 0-4 scale (appendix 2)
12 Dormancy-breaking sprays for low winter chill in apples
Results and discussion
Timing of spray application
The target spray timing was 35 days before green tip Historical green tip records together with in-season chill accumulation calculations were used to predict the estimated date of green tip for 2015 A best estimate of green tip date was determined by comparing the current seasonrsquos chill accumulation curve with that of the previous few seasons to determine how the season was tracking The actual spray date was further dictated by the weather with favourable conditions for spraying required Actual spray timing was 26 37 and 36 days before green tip in TAS QLD and WA respectively (Table 3)
The timing of dormancy-breaking spray application can have considerable impact on product efficacy (Faust et al 1997 Petri et al 2010) Spraying too early reduces effectiveness and spraying too close to bud burst can have undesirable effects such as delayed green tip and bud damage (Bound and Jones 2004 Bound and Miller 2006) Getting the timing right can be problematic however due to difficulties in estimating the date of green tip Dormancy-breaking sprays are commonly applied according to calendar date in other crops such as grapes (pers comm) but this is not recommended in apples as the date of green tip can vary considerably from season to season The methods described in this study estimated green tip dates successfully in WA and QLD Green tip timing was more difficult to predict in TAS primarily due to the exceptionally cold winter conditions
No bud or flower phytotoxicity was observed in this study with any of the dormancy-breaking spray treatments
Green tip and flowering
Green tip and flowering responses to dormancy-breaking sprays varied between sites (Figure 4 and Table 4)
In TAS green tip was delayed by five and six days in Dormexreg and Waikentrade sprayed trees respectively (Figure 4 and Table 4) Extended dormancy is not an uncommon response and occurs when dormancy-breaking sprays are sprayed close to bud burst (Bound and Miller 2006) These trees caught up with the untreated control trees and there were no significant differences in the date of full bloom or the duration of the flowering period A reduction in the length of flowering was observed in trees sprayed with both of the dormancy-breaking products but this was not statistically significant
The lack of flowering response to the dormancy-breaking sprays was likely due to the cold 2015 winter in which Huonville received 113 chill portions well above the long-term average of 88 Under these conditions it was likely that the lsquoGalarsquo chilling requirement was satisfied prior to application of the dormancy-breaking sprays limiting the potential impact Buds were possibly already sitting in the eco-dormant phase of dormancy waiting for favourable growing conditions The rapid onset of a warm spring resulted in a short flowering period of just two to three days in all trees
In QLD green tip was significantly advanced in trees sprayed with Dormexreg Ergerreg and Waikentrade by nine six and five days respectively when compared with untreated trees (Figure 4 and Table 4) Full bloom was advanced by 12 5 and 5 days with Dormexreg Ergerreg and Waikentrade respectively (Figure 5) and the flowering period was condensed with all dormancy-breaking sprays Green tip and flowering responses to the Dormexreg spray were significantly stronger than responses to Waikentrade and Ergerreg with no differences observed between the latter two products
In WA green tip was significantly advanced by 14 days in trees sprayed with Dormexreg and four days in trees sprayed with Waikentrade (Figure 4 and Table 4) Full bloom was advanced by nine days in Dormexreg sprayed trees while there was no difference in full bloom dates between trees sprayed with Waikentrade and the untreated trees The length of the flowering period was reduced by 19 with
13 Dormancy-breaking sprays for low winter chill in apples
Dormexreg while Waikentrade caused a significant increase in the flowering period by 39 In studies of both time and rate of application across five cultivars Bound and Miller (2006) reported that Waiken concentrated the flowering period regardless of whether the flowering period was brought forward or delayed The cause of the lengthening of flowering in this study in the Waikentrade treated trees is unclear and requires further studies to determine if this is a real response to Waikentrade or the result of other experimental factors
The differences observed in green tip and flowering responses to dormancy-breaking sprays at each site in the 2015-2016 season indicate that responses are likely to vary from season to season depending on factors including temperatures before and after spraying and timing of spraying relative to green tip Petri et al (2010) described the impact of temperature at spraying and in the days immediately following spraying on the response to dormancy-breaking sprays
In QLD and WA dormancy-breaking sprays caused large changes to full bloom timing and duration indicating that careful consideration needs to be given to the flowering time of polliniser varieties to ensure fruit set is not impacted With historical knowledge of cultivar flowering times dormancy-breaking sprays can be used to improved synchronisation of flowering between cultivars and their pollinisers (Petri et al 2012)
Figure 4 Green tip first flower and full bloom in Gala apples treated with and without dormancy-breaking sprays in TAS QLD and WA
14 Dormancy-breaking sprays for low winter chill in apples
Table 4 Effect of dormancy-breaking sprays on green tip and flowering dates and duration for lsquoGalarsquo apple strains grown in TAS QLD and WA in the 2015 - 2016 season
Site lsquoGalarsquo strain
Treatment Green tip (DoY)
First flower (DoY)
Full bloom
(DoY) Green tip to first flower (days)
First flower to full bloom (days)
Tas Alvina Untreated 251 b 275 b 278 24 a 3
Dormexreg 256 a 277 a 279 20 b 2
Waikentrade 257 a 277 a 279 20 b 2
QLD Royal Untreated 248 a 266 a 278 17 c 12 a
Dormexreg 239 c 259 c 266 20 b 7 c
Ergerreg 242 b 264 b 273 22 a 9 b
Waikentrade 243 b 264 b 273 21 ab 9 b
WA Galaxy Untreated 266 a 281 a 287 15 b 6 b
Dormexreg 252 c 273 c 278 21 a 5 c
Waikentrade 262 b 278 b 287 17 b 9 a
DoY = Day of year Within a single and site only means with different letters are significantly different P = 005 LSD test Full bloom dates did not vary between trees within each treatment and therefore no statistics could be performed
Figure 5 Differences in stages of flowering on 18 September 2015 in QLD lsquoGalarsquo trees treated with and without dormancy-breakers
Ergerreg
Untreated Waikentrade
tradereg
Dormexreg
regregregreg
15 Dormancy-breaking sprays for low winter chill in apples
Fruit set and yield
Fruit set expressed as the percentage of flower clusters that set fruit was not significantly different between treatments at any location (Figure 6) indicating that compaction of the flowering period observed most strongly in QLD did not negatively (or positively) impact the effectiveness of pollination Similarly when expressed as the number of fruit set per 100 flower clusters there was no difference between treatments (data not shown) Dormancy-breaking sprays have been shown to have a slightly negative effect on fruit set in some studies (Hawerroth et al 2010 Bound and Jones 2004) suggesting that impacts on pollination success are likely to be influenced by factors such as cultivar and season
Interestingly the number of fruit set per 100 flower clusters was significantly different between locations with TAS showing the highest fruit set followed by WA and then QLD (data not shown)
Figure 6 Fruit set in lsquoGalarsquo apple trees treated with dormancy-breaking sprays at study sites in TAS QLD and WA 2015
There were no differences in gross apple yields between treatments at any location (Table 5) In TAS fruit from Waikentrade treated trees had the highest and most marketable mean fruit weight compared with the other treatments however this was likely a crop load effect and not a result of the treatment per se (Table 5) Yield adjusted for trunk cross sectional area was significantly higher in the control trees compared with both Waikentrade and Dormexreg treated trees in TAS It is unclear whether these differences were a result of the treatment as flowering density varied widely between trees in the block and therefore it is possible that any differences in yield were a reflection of flowering density rather than an impact of the treatments
In QLD fruit numbers were significantly higher in the Dormexreg treated trees compared with those sprayed with Ergerreg and Waikentrade (Table 5) Again it is unclear whether this is the result of the treatments as there were no significant differences in the percentage of flowers setting fruit (Figure 6) In WA there were no differences in the components of yield between treatments (Table 5)
Dormexreg has been shown to significantly improve yields in other studies of apple including in lsquoGranny Smithrsquo and lsquoGolden Deliciousrsquo (Jackson and Bepete 1995) Such improvements are likely to be more substantial in very warm growing regions such as the one used in the Jackson and Bepete (1995)
16 Dormancy-breaking sprays for low winter chill in apples
study which had less than 300 chill hours where yields are generally very low to start with In most Australian growing regions significant improvements are more likely to be related to fruit quality and marketable yield rather than gross yield
Table 5 Effect of dormancy-breaking sprays on gross yield and its components at harvest for lsquoGalarsquo apple strains grown in TAS QLD and WA in the 2015-2016 season
Site lsquoGalarsquo strain
Treatment TCA1 (cm2)
Fruit no tree
Fruit no TCA
Mean fruit weight (g)
Kgtree KgTCA Tha
Tas Alvina Untreated 141 233 166 a 1332 b 308 22 a 77
Dormexreg 162 201 121 b 1248 c 241 15 b 60
Waikentrade 158 118 77 c 1573 a 187 12 b 47
QLD Royal Untreated 185 196 ab 108 a 1288 252 14 63
Dormexreg 217 241 a 111 a 1285 308 14 77
Ergerreg 212 167 b 81 b 1395 233 11 58
Waikentrade 206 187 b 93 ab 1303 242 12 60
WA Galaxy Untreated 173 162 105 1070 166 11 41
Dormexreg 180 161 102 1141 184 11 46
Waikentrade 196 212 108 1044 219 11 55
1TCA = trunk cross-sectional area Within a single and site only means with different letters are significantly different P = 005 LSD test
Fruit maturity and quality
Results of the effect of dormancy-breaking sprays on fruit maturity and quality are shown in Table 6 In TAS fruit from trees treated with Waikentrade were the most advanced according to the delta absorbance (DA) meter and background colour however the starch pattern index results indicate that fruit from untreated trees were the most mature at harvest Therefore differences in the timing of maturity with treatments are not clear but the impacts were not large
In QLD fruit was harvested on different dates due to the large differences in maturity between treatments Fruit from Dormexreg trees were more than one week ahead of untreated trees (Table 6) Fruit from Ergerreg and Waikentrade trees were also ahead by at least two days however comparison of the background colour and red blush coverage data suggested that fruit on these trees were further advanced (Figure 7) Advances in fruit maturity reflected the differences in flowering dates
In WA fruit maturity was slightly advanced in Dormexreg trees compared with control but this was not statistically significant (Table 6) The background colour was significantly higher in fruit from Waikentrade treated trees compared with Dormexreg and control trees According to the data there were no differences in red blush coverage between treatments although grower observation suggested that
17 Dormancy-breaking sprays for low winter chill in apples
the colour was more intense in the trees sprayed with Dormexreg compared with other treatments This may have been due to advanced maturity
Table 6 Effect of dormancy-breaking sprays on fruit maturity and quality at harvest for lsquoGalarsquo apple strains grown in TAS QLD and WA in the 2015-2016 season
Site lsquoGalarsquo strain
Treatment Fruit sample date
Starch pattern index
Background colour
Red blush coverage2
()
Red blush intensity2
DA index1
Tas Alvina Untreated 7316 08 a 64 b 045 b
Dormexreg 7316 03 b 62 c 051 a
Waikentrade 7316 03 b 65 a 035 c
QLD Royal Untreated 3216 24 34 c 156 b 18
Dormexreg 27116 32 41 b 356 a 29
Ergerreg 1216 35 45 a 360 a 31
Waikentrade 1216 35 43 ab 339 a 30
WA Galaxy Untreated 9216 21 34 b 709 52
Dormexreg 9216 31 34 b 682 46
Waikentrade 9216 25 41 a 726 50
1DA index was measured with the Delta Absorbance meter in Tasmania only 2Red blush coverage and intensity were not measured in Tasmania Numbers are the average of 30 fruit samples Within a single and site only means with different letters are significantly different P = 005 LSD test
18 Dormancy-breaking sprays for low winter chill in apples
Figure 7 Fruit at harvest on 27 January 2016 in lsquoGalarsquo trees treated with Dormexreg and Ergerreg QLD (centre tree was sprayed surrounding trees are untreated)
There was no measurable reduction in the variability of fruit maturity (as assessed by looking at colour starch pattern index and fruit weight) at harvest with any of the sprays (data not shown) despite the significant effect of the treatments on compaction of flowering at some sites Similar results were observed by Bound and Jones (2004) who found no consistent trends in impacts on fruit quality with the use of Dormexreg even though significant compaction of the flowering period was observed
Based on the finding that an extended flowering period increases the variability of fruit size at harvest (Petri and Leite 2004) it was hypothesised in this study that a reduction in the spread of flowering would result in a reduction in the spread of maturity potentially reducing the number of picks and increasing the percentage of fruit picked at optimum maturity
Failure to observe an improvement in variability could be the result of a number of factors Firstly the small experimental scale Up-scaling the experiment to rows or blocks of trees would provide more scope for identifying differences in fruit variability and potential for improving harvest management Secondly other influences impacting on fruit quality may have overshadowed any effects of the more uniform flowering Factors such as position in the canopy shading leaf area associated with individual fruit development and age of wood bearing the fruit have all been shown to impact on mineral content and quality (Volz et al 1994)
Cost-benefit analysis
A full cost-benefit analysis was not undertaken here as the size of the study did not enable sufficient collection of data for meaningful analysis of dollar value however the broad costs and benefits are outlined in Error Reference source not found
Dormexreg
reg
Ergerreg (centre tree only)
19 Dormancy-breaking sprays for low winter chill in apples
Table 7 Outline of cost and benefits associated with the use of dormancy-breaking sprays to manage low winter chill years in apple
Costs
Direct costs
Product purchase
Labour to apply product
Tractor and associated costs to perform one spray during the dormant period
Potential indirect costs
Inappropriate application timing could result in anything from nil benefit to significant bud damage resulting in negative impacts on pollination and fruit set
Human health impacts from inappropriate handling and use of some dormancy-breaking products
Benefits
More compact and uniform flowering resulting in improved efficiency of chemical thinning and management of flowering pests
More compact flowering potentially resulting in more uniform fruit maturity throughout the canopy and therefore shorter harvest duration (saving on labour costs) and improvements in fruit quality Also likely to be benefits for the effectiveness of pest and disease management and efficacy of plant growth regulators such as ReTainreg to manage harvest
Benefits would be greater in low chill years when the potential impacts of inadequate chill on flowering are greatest Benefits are likely to increase under future warmer climate scenarios
Earlier flowering and harvest time market-price benefits in some cases
Benefits are likely to vary with cultivar and block (for example tree structure may effect impact of dormancy-breaking sprays on fruit quality)
20 Dormancy-breaking sprays for low winter chill in apples
Conclusions
The dormancy-breaking sprays assessed in this study were able to advance flowering time and compact the flowering period in lsquoGalarsquo apple with differences observed between products and sites A more compact and uniform flowering period has a number of benefits including improved management of bee hives flowering pests and chemical thinning practices
Despite the compaction of flowering there were no clear differences observed in fruit set yield or variability of apple maturity in trees treated with dormancy-breaking sprays More work is required to test the potential of these products to improve fruit quality and reduce the length of harvest Advances in harvest timing were observed with the dormancy-breakers and generally reflected differences in flowering dates The ability to manipulate harvest timing can be useful in situations where advantage can be taken of a high-price market window
Dormexreg had the most significant impacts on lsquoGalarsquo flowering and harvest timing in WA and QLD when compared with Waikentrade and Ergerreg However Dormexreg is considerably more toxic to humans than either Waikentrade or Ergerreg and has greater capacity to cause phytotoxicity (Bound and Miller 2006) It has been noted in other studies that a significant advantage of using non-toxic dormancy-breaking products such as Waikentrade is greater flexibility with the timing of application The product can be applied later in the season (up to when some buds are showing green) without causing damage to buds (Bound and Miller 2006)
Application timing of dormancy-breaking sprays relative to green tip previous winter chill accumulation and temperatures received after spraying had considerable impact on product efficacy in this study As a consequence flowering responses are likely to vary between seasons and it is important to consider the flowering time of polliniser cultivars to ensure flowering overlap so that fruit set is not affected
The overarching research question posed at the outset of this study was are dormancy-breaking sprays a feasible adaptation option for the Australian apple industry to low chill years in current and future climates Results have indicated that dormancy-breaking sprays are likely to be an effective tool for managing flowering in lsquoGalarsquo in lower chill years in Australian growing conditions It seems reasonable to broaden this conclusion to other apple cultivars when considered in the context of results from previously published research in lsquoFujirsquo lsquoGranny Smithrsquo lsquoCripps Pinkrsquo and lsquoCripps Redrsquo (Bound and Jones 2004 Bound and Miller 2006 Petri et al 2014 Erez 2000) However significant research gaps still remain
How effective will dormancy-breaking sprays be as an adaptation for the Australian apple industry to the climate change in the longer term Or to phrase the question another way when will the winter chill received in an orchard fall too far below the chilling requirement for even the use of dormancy-breaking sprays to enable economic production Only a proportion of the chilling requirement can be compensated for by the use of dormancy-breaking sprays (Faust et al 1997) but the size of this proportion is unclear It has been suggested that up to 30 of the chilling requirement can be compensated for with dormancy-breaking sprays (Erez 1995) however compensation closer to 45 has been demonstrated in stone fruit (George et al 2002)
A global study to investigate the limits of profitable apple production with regards to winter chill would provide valuable information for the Australian industry in climate change adaptation planning Production areas with very low winter chill accumulation in South Africa and Southern Brazil rely heavily on dormancy-breakers and would be obvious target locations for this research
A more accurate method for determining dormancy-breaking spray timing is required to improve the consistency and predictability of the flowering response Difficulties in estimating the green tip date has potential to reduce the product efficacy and cause bud damage in the worst cases Faust et al
21 Dormancy-breaking sprays for low winter chill in apples
(1997) suggested that dormancy-breakers are only effective when sprayed during the lsquos-endodormancyrsquo phase of dormancy and not before (Figure 8) A biological marker is required to determine when buds are at this stage and therefore responsive to dormancy-breaking sprays Biochemical changes in water status cell membrane composition hormone production and anabolic potential have been identified in buds as they progress through the stages of dormancy (Faust et al 1997) and could potentially be used as markers of dormancy status Incidentally the use of tetrazolium staining (Carvalho et al 2010) as a simple tool to monitor the status of bud dormancy in apples was assessed as part of this study but could not reliably track the shift from dormancy to bud burst (data not shown)
The mechanism by which dormancy-breaking sprays act to promote bud burst particularly in the case of Dormexreg remains unclear Vergara et al (2012) suggested that a respiratory stress may be involved in the release of buds from dormancy and Melke (2015) concluded that oxygen starvation was involved in the dormancy breaking mechanism when applying oils Understanding the mode of action would enable the development of products with greater efficacy and safety
The Australian pistachio industry has recommended winter oil application in low chill years to advance bud burst The recommendation states that winter oil be applied if 57 Chill Portions have not been reached by 15 August (Zhang and Taylor 2011) Defined guidelines for apple varieties on the use of dormancy-breaking sprays are likely to be some way off due to a lack of understanding around cultivar chilling requirements Investigations should be undertaken however into the possibility of determining broad guidelines based on current knowledge
Figure 8 A schematic representation of the progression of buds through dormancy showing the point at which buds become responsive to the action of dormancy-breaking sprays (Faust et al 1997)
22 Dormancy-breaking sprays for low winter chill in apples
Key messages
- Dormancy-breaking sprays are likely to be an effective tool for managing flowering in lsquoGalarsquo and other apple cultivars in lower chill years in Australia
- Impacts of dormancy-breaking sprays on fruit quality and length of the harvest window remain unclear
- Benefits from the use of dormancy-breakers are likely to be greater in low chill years when the potential impacts of inadequate chill on flowering are greatest Therefore benefits are likely to increase under future warmer climate scenarios
- Dormexreg Waikentrade and Ergerreg were able to advance flowering time and compact the flowering period in lsquoGalarsquo apple with differences observed between products and sites Compact and uniform flowering period has benefits for improved management of bee hives flowering pests and chemical thinning practices
- Fruit maturity was advanced with dormancy-breakers with differences observed between products and sites and generally reflected differences in flowering dates The ability to manipulate harvest timing can be useful in situations where advantage can be taken of a high-price market window
- There were no differences in fruit set yield or variability of apple maturity in trees treated with dormancy-breaking sprays despite the compaction of flowering
- Dormexreg had the most significant impacts on lsquoGalarsquo flowering and harvest timing in WA and QLD when compared with Waikentrade and Ergerreg
- The timing of spray application relative to green tip previous winter chill accumulation and temperatures received after spraying impacts the bud burst and flowering response to dormancy-breaking products
- Flowering responses are likely to vary between seasons cultivars and blocks
- Flowering time of polliniser cultivars needs to be considered to ensure flowering overlaps so that fruit set is not affected
Recommendations
- The timing of dormancy-breaking spray application should be carefully considered as inappropriate timing could result in anything from nil benefit to significant bud damage resulting in negative impacts on pollination and fruit set
- Application timing should be determined using historical green tip and winter chill records together with monitoring of in-season chill accumulation Historical and up-to-date in-season winter chill information will be available from the Australian winter chill website (to be released in March 2017)
- Investigations should be undertaken into the possibility of determining broad guidelines around for the use of dormancy-breaking sprays to manage low chill years in cultivars of apple based on existing knowledge Such guidelines should include information on when dormancy-breaking sprays should be used and in which cultivars and regions
- Potential benefits of dormancy-breaking sprays on variability of fruit maturity and the length of the harvest window remain unclear Further research is required to investigate how these products might be used to improve fruit quality and harvest efficiency particularly in cultivars requiring multiple picks
23 Dormancy-breaking sprays for low winter chill in apples
- Investigations into alternatives to Dormexreg are required Current research suggests that this product remains the most efficacious dormancy-breaker available in Australia but its mammalian health impacts may result in de-registration in the future Research is required to determine the mode of action of Dormexreg to enable development of dormancy-breaking products with greater efficacy and safety
- In considering potential for adaptation to warmer winters Australian apple growers need to know when the winter chill received in their orchard will fall too far below the chilling requirement for dormancy-breaking sprays to enable economic production of each cultivar Further research at both the basic and applied levels would be required to provide these guidelines
- A global study to investigate the limits of profitable apple production with regards to winter chill would provide valuable information for the Australian industry in climate change adaptation planning Production areas with very low winter chill accumulation in South Africa and Southern Brazil rely heavily on dormancy-breakers and would be obvious target locations for this research
- Basic research is necessary to identify a biological marker of bud progression through dormancy to facilitate optimal timing for dormancy-breaking spray application
- Further research to develop phenology models of bud burst timing for apple cultivars is required to enable more accurate estimations of green tip date
Acknowledgements
We thank Steven and Ugo Tomasel (Qld) Maurie Ann Tim and Michelle Lyster (WA) and Scott Price (TAS) for the use of their orchards in this trial Thanks to Allan McWaters John Sutton Lisa Starkie and Steve Paterson for providing the technical support necessary to conduct this trial
Appendices
1 Phenology Data Collection Protocols 2 Bud damage scale
References
Abd El-Razek E Abd El-Migeed M M M and Abdel-Hamid N (2013) Response of le conte pear trees to garlic extract and GA3 as budbreak dormancy agents Middle East Journal of Scientific Research 14(11) 1407-1413
Allderman L A Steyn W J and Cook N C (2011) Growth regulator manipulation of apple bud
dormancy progressions under conditions of inadequate winter chilling South African Journal of Plant and Soil 28(2) 103 - 109
Bound S A and Jones K M (2004) Hydrogen cyanamide impacts on flowering crop load and fruit
quality of red Fuji apple (Malus domestica) New Zealand Journal of Crop and Horticultural Science 32(2) 227-234
Bound S A and Miller P (2006) Effects of Waikenreg on flowering and spring growth in apple Acta
Horticulturae 727 167-174
24 Dormancy-breaking sprays for low winter chill in apples
Carvalho R I N Rendoke J C Biasi L A and Zanette F (2010) Metabolic activity evaluation of
temperate tree fruit buds by using the tetrazolium test Acta Horticulturae 872 89 - 95
Darbyshire R Webb L Goodwin I and Barlow E W R (2013) Impact of future warming on winter
chilling in Australia International Journal of Biometeorology 57(3) 355-366
Erez A (1995) Means to compensate for insufficient chilling to improve bloom and leafing Acta
Horticulturae 395 81-95
Erez A (2000) Bud dormancy phenomenon problems and solutions in the tropics and subtropics in
Erez A ed Temperate Fruit Crops in Warm Climates Kluwer Academic Publishers 17 - 47
Erez A Fishman S Linsley-Noakes G C and Allan P (1990) The dynamic model for rest
completion in peach buds Acta Horticulturae 276 165-174
Erez A Yablowitz Z Aronovitz A and Hadar A (2008) Dormancy breaking chemicals Efficiency
with reduced phytotoxicity Acta Horticulturae 772 105-112
Faust M Erez A Rowland L J Wang S Y and Norman H A (1997) Bud dormancy in
perennial fruit trees Physiological basis for dormancy induction maintenance and release HortScience 32(4) 623-629
Fishman S Erez A and Couvillon G A (1987) The temperature dependence of dormancy
breaking in plants mathematical analysis of a two-step model involving a cooperative transition Journal of Theoretical Biology 124 473 - 483
George A P Broadley R H Nissen R J and Ward G (2002) Effects of new rest-breaking
chemicals on flowering shoot production and yield of subtropical tree crops Acta Horticulturae 575 835-840
Hawerroth F J Petri J L and Leite G B (2010) Erger and calcium nitrate concentration for
budbreak induction in apple trees Acta Horticulturae 872 239-244
Jackson J E and Bepete M (1995) The effect of hydrogen cyanamide (Dormex) on flowering and
cropping of different apple cultivars under tropical conditions of sub-optimal winter chilling Scientia Horticulturae 60(3-4) 293-304
Labuschagne I F Louw J H Schmidt K and Sadie A (2002) Genetic variation in chilling
requirement in apple progeny Journal of the American Society for Horticultural Science 127(4) 663-672
Meier U Graf H Hess M Kennel W Klose R Mappes D Seipp D Stauss R Streif J and
van den Boom T (1994) Phaumlnologische Entwick-lungsstadien des Kernobstes (Malus domestica Borkh und Pyrus communis L) des Steinobstes (Prunus-Arten) der Johannisbeere (Ribes-Arten) und der Erdbeere (Fragaria x ananassa Duch) Nachrichtenbl Deut Pflanzenschutzd 46 141 - 153
25 Dormancy-breaking sprays for low winter chill in apples
Oukabli A Bartolini S and Viti R (2003) Anatomical and morphological study of apple (Malus x domestica Borkh) flower buds growing under inadequate winter chilling Journal of Horticultural Science and Biotechnology 78(4) 580-585
Petri J L Hawerroth F J Leite G B Couto M and Francescatto P (2012) Apple phenology in
subtropic climate conditions in Zhang X ed Phenology and climate change Rijeka Croatia InTech 195 - 216
Petri J L and Leite G B (2004) Consequences of insufficient winter chilling on apple tree bud-
break in Jindal K K Sharma R C and Rehalia A S eds Acta Horticulturae
Petri J L Leite G B Couto M Gabardo G C and Haverroth F J (2014) Chemical induction of
budbreak New generation products to replace hydrogen cyanamide Acta Horticulturae 1042 159-166
Petri J L Leite G B and Hawerroth F J (2010) Time of Erger application for budbreak induction
in apple trees Acta Horticulturae 872 205-210
Samish R M (1954) Dormancy in woody plants Annual Review of Plant Physiology 5 183-204
Saure M C (1985) Dormancy release in deciduous fruit trees Horticultural Reviews 7 239-300
Volz R K Ferguson I B Hewett E W and Woolley D J (1994) Wood age and leaf area
influence fruit size and mineral composition of apple fruit Journal of Horticultural Science 69(2) 385-395
Wang S Y Steffens G L and Faust M (1986) Breaking bud dormancy in apple with a plant
bioregulator thidiazuron Phytochemistry 25(2) 311-317
White N (2016) Climate scenarios for pome fruit growing regions of Australia (2030 and 2050)
Queensland Australia Department of Agriculture and Fisheries
Zhang J and Taylor C (2011) The Dynamic Model Provides the Best Description of the Chill
Process on Sirora Pistachio Trees in Australia HortScience 46(3) 420-425
26 Dormancy-breaking sprays for low winter chill in apples
Appendix 1
PHENOLOGY DATA COLLECTION PROTOCOLS
11 Phenology Data
Phenology assessments will be performed to determine 5 green tip (apple) and full bloom
(80 open flowers) dates for apple varieties Regular visual assessments (Monday
Wednesday and Friday) will be made from just prior to budburst until flowering is
completed Assessments will be performed on a whole tree basis with only spur and terminal
buds and spur and terminal flower clusters assessed (axillary buds on one-year-old pome fruit
shoots are not included in the assessments)
12 Apple Phenology Collection Methods
Select five trees to monitor for each variety and rootstock (where applicable) under
investigation
Green tip
Prior to green tip count the number of buds (spur and terminal) on one of the
five selected trees and record
Compare the remaining four trees and estimate up or down the number of buds
on each tree If there is an obvious variation to the counted tree perform a full
count
Estimate green tip percentages by counting all buds at the green tip stage The
initial bud count will inform this For instance if the tree has 500 buds 25 buds
at green tip will indicate the tree is at 5
After the tree has reached 5 green tip make one more visit to ensure the
observation was correct
Flowering
Once flowering commences initially record the number of open flowers up to
50 This will be easier than calculating small percentages
Count the number of flower clusters on one tree Similarly to the bud count
estimate the number of clusters on the remaining four trees and make
adjustments up or down for differences between the trees
To estimate flowering percentage count the number of full clusters open by
estimating across clusters For instance if two clusters have halve the flowers
open that equates to one full cluster Estimate percentage open based on total
cluster number previously recorded
For very large trees (flower clusters greater than 1000) additional estimates
may need to be made to account for the size of the tree Follow the above
27 Dormancy-breaking sprays for low winter chill in apples
protocol for three representative branches (similar cluster distribution up the
branch as the tree) on each tree rather than the whole tree If the tree is less than 50 bloom counting the number of open clusters will be
easiest If more than 50 of flowers are open counting the number yet to bloom
will be easier
As a general rule round estimates to the nearest 5
13 Recording Phenology Data
An Excel based data collection pro forma has been developed to ensure data is recorded
consistently between sites Attachment A is an example of the data recording sheet
Dormancy-breaking sprays for low winter chill in apples 2016 28
Bud damage scale
Scale
0 No damage
1 Mild burning
Mild burning of bud scales but buds normally recover
2 Moderate damage
Buds likely to develop but some flowers too burnt to open some flowers undamaged
3 Severe burning
Buds do not develop usually results in bud death
Full Terms amp Conditions of access and use can be found athttpwwwtandfonlinecomactionjournalInformationjournalCode=tnzc20
Download by [The University Of Melbourne Libraries] Date 03 February 2016 At 1845
New Zealand Journal of Crop and Horticultural Science
ISSN 0114-0671 (Print) 1175-8783 (Online) Journal homepage httpwwwtandfonlinecomloitnzc20
Sun damage risk of Royal Gala apple in fruit-growing districts in Australia
R Darbyshire L McClymont amp I Goodwin
To cite this article R Darbyshire L McClymont amp I Goodwin (2015) Sun damage risk of RoyalGala apple in fruit-growing districts in Australia New Zealand Journal of Crop and HorticulturalScience 433 222-232 DOI 1010800114067120151034731
To link to this article httpdxdoiorg1010800114067120151034731
Published online 26 May 2015
Submit your article to this journal
Article views 41
View related articles
View Crossmark data
RESEARCH ARTICLE
Sun damage risk of Royal Gala apple in fruit-growing districts in Australia
R Darbyshirea L McClymontb and I Goodwinab
aFaculty of Veterinary and Agricultural Science University of Melbourne Melbourne Australia bDepartment ofEconomic Development JobsTraining and Resources Tatura Australia
(Received 17 November 2014 accepted 18 March 2015)
This study estimated minimum air temperatures for potential sun damage for sunburn browning (non-netted and netted) and sunburn necrosis (non-netted) for Royal Gala apple in Australia The approachestimated when conditions may be conducive to the development of sun damage in some fruit Theapproach provides a measure of potential damage This allows for more flexible analyses of potentialsun damage which current models are unable to produce due to data limitations The air temperaturethresholds determined were 341 and 387 degC respectively for browning and necrosis for non-nettedfruit and 379 degC for browning under netting These air temperature thresholds were applied acrosssouthern Australia from 1911ndash2013 demonstrating different risk profiles between sites inter-annualvariability and the benefit of installing netting via a reduction in potential damage days The resultscan be further extended to estimate impacts from climate change and assess the benefit of installingnetting to adapt to increasingly extreme hot weather
Keywords browning necrosis shade net sunburn sunscald
Introduction
Sun damage in apple occurs as the result ofexposure to high radiation loads (Schrader et al2003ab) and can reduce market yield by down-grading quality and increasing cullage Regionswith summers characterised by clear skies and hightemperatures such as southern Australia havehigh sun damage risk A heat wave event inJanuary 2009 in the Goulburn Valley in southeastAustralia provides an example with large yieldlosses incurred due to sun damage approximatedat 30ndash70 (Thomson et al 2014)
Sun damage can manifest in many formsSunburn necrosis (henceforth referred to as nec-rosis) appears as a dark penetrative burn and is athermal response with a fruit surface temperature(FST) of 52 plusmn 1 degC for 10 min sufficient to inducenecrosis of several apple varieties including Gala(Schrader et al 2001) Sunburn browning (hence-forth referred to as browning) is characterised by a
yellow brown bronze or dark tan spot on the sun-exposed side of the fruit (Schrader et al 2003aRacsko amp Schrader 2012) and results from a com‐bination of high FST and light exposure Forattached Gala apples fully exposed to sunlight on aclear day Schrader et al (2001) reported a thresholdFST of 478 degC for browning damage when FSTwas maintained at constant temperature for 60 min
In the context of future climate change andassociated rising summertime temperatures in‐creased risk of sunburn damage is highly likelyPredictions regarding changes to sun damage riskand evaluation of adaptation options are thereforeimportant for future planning This is particularlypertinent for Australia Currently in many ofAustraliarsquos pome fruit-growing regions extremeheat events are common with incidences of extremeheat days increasing historically (Alexander et al2007) Further it is expected that such events willcontinue to increase in both frequency and severity
Corresponding author Email rebeccadarbyshireunimelbeduau
New Zealand Journal of Crop and Horticultural Science 2015Vol 43 No 3 222ndash232 httpdxdoiorg1010800114067120151034731
copy 2015 The Royal Society of New Zealand
Dow
nloa
ded
by [
The
Uni
vers
ity O
f M
elbo
urne
Lib
rari
es]
at 1
845
03
Febr
uary
201
6
due to anthropogenically induced climate change(Alexander amp Arblaster 2009) Given the backdropof increasingly extreme climate conditions thisresearch aimed to develop potential sun damageincidences for Royal Gala apple using air temper-ature information for netted and non-netted fruit
Few studies have scaled up analyses of sundamage beyond the experimental unit due tocomplexities in determining precise climate andgrowing conditions that lead to sunburn damage onindividual fruit Schrader et al (2003b) consideredthe influence of several factors on FST includingair temperature radiation wind speed and relativehumidity Of these air temperature was found to bemost highly correlated to FST In a predictivemodel developed later Schrader (2014) addedcultivar fruit diameter and canopy density asadditional factors that influence the FST of apple
Developing a method to use air temperature as aproxy for potential sun damage provides a flexibleplatform for broader analyses both temporally andspatially Daily maximum temperatures are com-monly recorded by meteorological organisationsand are available for long historical periods andwith large spatial coverage Other climate vari-ables such as relative humidity are much lessavailable Furthermore climate projection informa-tion for temperature is more reliable and readilyavailable than for other climate variables (CSIRO2007) Restrictions in the application of an existingFST model (Schrader 2014) due to data availabilityare already apparent (Racsko amp Schrader 2012)supporting the need for a simplified but consideredapproach
The objective of this study was to identifyair temperature thresholds that have the potentialto lead to sunburn damage To determine thesethresholds two aspects must be known First theFST threshold that induces damage for this studyRoyal Gala apple was used and threshold valuesof 52 degC for necrosis and 478 degC for browningwere utilised following previous findings (Schra-der et al 2001) Second estimates of air tempera-tures required to reach FST thresholds need to bedetermined This aspect is the focus of this study
Materials and methods
Fruit surface temperature data
Two adjacent Royal Gala apple blocks one non-netted and one netted situated at Shepparton(3642degS 14546degE) in southeast Australia (Fig 1)were used for the experiment The trees wereplanted on MM106 rootstock using a central leadertrellis system with 20 times 45 m tree spacing Theexperiment was conducted in January 2013 In thisregion Royal Gala is usually harvested late Januaryto early February The nets (Grey Quad 14 NetProStanthorpe Queensland Australia) were installedat a height of 6 m above ground with open sidesThese nets provided an 18 reduction in incidentradiation and are in common use in parts ofAustralia
Ten trees in each of the non-netted and nettedblocks were selected Of these four trees in thenon-netted block and five trees (due to somesmaller tree sizes) in the netted block were usedto measure FST Thermocouple sensors (Type Tthermocouples Tranzflo NZ Palmerston NorthNew Zealand) were placed under the skin of 60fruit in both the non-netted and netted blocks (iea total of 120 sensors) The sensors were distrib-uted across the selected trees such that 20 sensorswere located in each of the upper middle and
110 120 130 140 150 160
minus50
minus45
minus40
minus35
minus30
minus25
minus20
Longitude
Latit
ude
BatlowYoung
Lenswood
Spreyton
Yarra Valley
Donnybrook
Applethorpe
Manjimup
Huonville
Shepparton
Figure 1 Spatial area investigated and sites used for ana‐lyses marks the study site for observations (Shepparton)
Sun damage risk of Royal Gala apple in fruit-growing districts in Australia 223
Dow
nloa
ded
by [
The
Uni
vers
ity O
f M
elbo
urne
Lib
rari
es]
at 1
845
03
Febr
uary
201
6
lower parts of the canopy for both the netted andnon-netted blocks Sensors were positioned to-wards the western side of the tree to increase thelikelihood of reaching FST damage thresholdsFST was logged at 1 min intervals (CR1000Campbell Scientific Logan Utah USA) Averageair temperatures were concurrently measured(HMP155 Vaisala Vantaa Finland) and loggedat 1 min intervals (Datataker DT80M ThermoFisher Scientific Yokohama Japan) in both thenon-netted and netted blocks Air temperaturesensors were shielded and positioned 15 m abovethe ground surface Both FST and air temperaturedata were logged from 8ndash29 January 2013
Observations of sun damage were conductedfor fruit on the 10 trees in the non-netted andnetted blocks Damage was classified at harvestbetween 24 January and 4 February 2013 asbrowning or necrosis following descriptions bySchrader et al (2003a)
Air temperature threshold analysis
A conservative approach was taken to determineminimum air temperature thresholds for potentialsun damage Air temperatures at FST for browning(478 degC) and necrosis (52 degC) thresholds (Schra-der et al 2001) were initially extracted for fruit inthe non-netted and netted blocks To accommodateFST that did not fall precisely on the threshold val‐ue a buffer of +02 degC was applied Specificallyair temperatures for FST between 478ndash480 degC
and 520ndash522 degC were extracted to represent brow‐ning and necrosis respectively
The 10th percentile of the air temperatures atthese FST threshold ranges was then calculatedThis value was used to represent the minimum airtemperature threshold required for fruit to reach anFST that can cause damage ie a conservativelylow air temperature threshold that can cause sundamage It was assumed that at the 10th percent-ile other conditions that moderate damage wereacting to increase the potential of damage ratherthan dampen For instance low wind conditionsThis was performed for browning and necrosisFST thresholds and for non-netted and netted data
Spatial analysis
Analysis of the total number of days in Januarywhere daily maximum temperatures crossed theminimum air temperature threshold for potentialdamage was conducted using historical spatialgridded data (005 times 005 deg) for southern Australiafrom 1911ndash2013 sourced from the Australian Bu‐reau of Meteorology These surfaces were producedthrough a combination of empirical interpolationand function fitting applied to Australiarsquos networkof quality controlled weather stations (Jones et al2009) Within the spatial data sets 10 locationssituated in important Australian pome fruit-growingdistricts were identified for individual site analyses(Fig 1 and Table 1)
Table 1 Location information January maximum temperature data (1911ndash2013) calculated using AWAP data set
LocationLatitude(degS)
Longitude(degE)
Mean January maximumtemperature (degC)
SD January maximumtemperature (degC)
Applethorpe 2862 15195 263 34Batlow 3552 14814 261 45Donnybrook 3358 11583 302 45Huonville 4301 14706 219 44Lenswood 3494 13879 254 58Manjimup 3418 11607 274 47Spreyton 4122 14635 210 26Shepparton 3633 14540 294 50Yarra Valley 3784 14568 252 55
AWAP Australian Water Availability Project SD standard deviation
224 R Darbyshire et al
Dow
nloa
ded
by [
The
Uni
vers
ity O
f M
elbo
urne
Lib
rari
es]
at 1
845
03
Febr
uary
201
6
Across the historical data set variation in thetotal number of potential sun damage days inJanuary was assessed for southern AustraliaDifferences in the number of potential damagedays between non-netted and netted results werecompared
Results
Air temperature thresholds
Prior to analysis exploration of FST data from the120 fruit was conducted Fruit were inspectedevery 2ndash3 days to ensure that the sensors were inplace In the event that a sensor had dislodged thesensor was reinstalled and the data for that sensorwas removed back to the time of the previousinspection Results from one thermocouple in thelower canopy from the non-netted block wereexcluded due to readings consistent with regularwetting from an irrigation emitter The numbers ofdata points available for analysis were 1330588and 1587606 for non-netted and netted fruitrespectively
Using these data air temperatures as related toFST for non-netted and netted fruit were consid-ered (Fig 2) A close relationship between FSTand air temperatures can be seen for cooler air
temperatures At higher FSTs greater variation inair temperatures was observed that is a wideningof the air temperature range at a particular FST
Non-netted and netted air temperatures thatrelated to necrosis (520ndash522 degC) and browning(478ndash480 degC) FST thresholds were extracted Thedistribution of air temperatures along these FSTthresholds are shown in Fig 3 No fruit recordedan FST above 52 degC under netting (Fig 2) andhence no estimates of air temperature thresholdswere evaluated for necrosis damage under netting
The 10th percentile of the extracted air tem-peratures was calculated providing a minimum airtemperature threshold at which sun damage mayoccur For browning in the non-netted and nettedblocks these values were 341 and 379 degCrespectively For non-netted necrosis damage theair temperature threshold was 387 degC
In January 2013 at Shepparton each of the airtemperature thresholds for potential damage wassurpassed several times (Table 2) Note that thefive necrosis damage days were also incorporatedin the potential browning days as the browningthreshold must be surpassed to reach the necrosisthreshold In comparing the total potential fordamage between netted and non-netted fruit therelative risk of damage under netting was 54 ofthat for the non-netted fruit
Observations of sun damage at the study siterecorded differences between non-netted and net-ted trees (Table 3) with lower levels of damagerecorded for fruit under netting (Table 3) A 50reduction of damage was found for fruit undernetting
Historical potential damage analysis
To further investigate the number of potential sundamage days historically and to provide visualisa-tion of risk across Australiarsquos pome fruit-growingregions the air temperature thresholds (Table 2)were applied to southern Australia (Fig 4) Increas-ing risk is observed from the south of the countryto the north A lowering of risk along the easternseaboard reflects the higher elevation in that part ofAustralia Notable variation across the historicaldata set was found (panels left to right in Fig 4)
Figure 2 Fruit surface temperature (degC) recordings andrelated air temperatures (degC) Necrosis and browningFST thresholds represent 52 and 478 degC respectively
Sun damage risk of Royal Gala apple in fruit-growing districts in Australia 225
Dow
nloa
ded
by [
The
Uni
vers
ity O
f M
elbo
urne
Lib
rari
es]
at 1
845
03
Febr
uary
201
6
representing the inter-annual variability in the num‐ber of potential damage days in January
The percentile levels can be taken to representdifferent risk likelihoods assuming the climatedata are sourced from a normal distribution In thisanalysis the 10th and the 90th percentiles repres-ent the low and high ends of the distribution of thedata while the 50th percentile is the median Forexample the 10th percentile value was 2 days forbrowning in the non-netted orchard at Shepparton(Table 4) This can be interpreted as a 1 in 10 yearevent that 2 or fewer damage days will be expe‐rienced Equally this indicates there is a 9 in 10
year chance of 2 or more damage days occurringUsing the upper end of the distribution the 90thpercentile indicates that receiving 12 or moredamage days is a 1 in 10 year event
Locations in cooler regions (Huonville Sprey-ton Applethorpe Batlow) rarely crossed the airtemperature thresholds required for potential sundamage The data indicate that none of these coolersites recorded a day above the air temperaturethreshold for browning under netting or necrosisfor non-netted fruit even at the 90th percentile ofthe data Batlow did record 4 days in January thatmay lead to browning in non-netted blocks at the
Browning minus Nonminusnetted
Air Temperature
Pro
babi
lity
FST = 478minus480 degCn=374
AT threshold = 341 degC
00
02
04
06
08
10
32 34 36 38 40 32 34 36 38 40
00
02
04
06
08
10
Browning minus Netted
Air Temperature
Pro
babi
lity
FST = 478minus480 degCn=36
AT threshold = 379 degC
00
02
04
06
08
10
32 34 36 38 40
Necrosis minus Nonminusnetted
Air Temperature
Pro
babi
lity
FST = 520minus522 degCn=27
AT threshold = 387 degC
Figure 3 Air temperature (AT) for FST which relates to browning in the open and under nets and for necrosis in theopen The 10th percentile of the AT data is shown by the arrow n = sample size
226 R Darbyshire et al
Dow
nloa
ded
by [
The
Uni
vers
ity O
f M
elbo
urne
Lib
rari
es]
at 1
845
03
Febr
uary
201
6
90th percentile which can be translated as a 1 in10 year event
Conversely other pome fruit-growing regionsrecorded consistent potential for sun damage Forinstance Donnybrook Shepparton and Young allrecorded potential damage days for browning innon-netted blocks for each percentile level Thiscan be interpreted for Donnybrook as a 9 in 10chance of at least 3 days in January reachingtemperatures that could lead to browning of non-netted fruit
The wide range in potential damage days atsome sites demonstrates strong inter-annual variab‐ility in the historical data For instance at Shep-parton it can be expected that 2ndash12 days (capturing80 of the historical data) in January could lead tobrowning damage for non-netted fruit
The benefit of netting in terms of reducing thetotal number of potential damage days for brown-ing is shown in Fig 5 Note this was not con‐sidered for necrosis as an air temperature thresholdfor necrosis under netting could not be defined
Again variability is present with a minimal benefitnoted in some years (10th percentile) whereas otheryears indicated great benefit (90th percentile)
The benefit of netting is clear when individualsites within Australiarsquos fruit-growing regions wereconsidered (Table 5) For sites with few instancesof potential browning these episodes werereduced to nil with netting (Batlow Huonville)For locations with greater potential for browningdamage substantial decreases in the total numberof potential damage days recorded (Young Don-nybrook Shepparton) For these sites particularlynotable gains for the more extreme of the histor-ical data (90th percentile) were found (Table 5)
Discussion
Using previously established FST thresholds forGala apple (Schrader et al 2001) air temperaturesthat relate to potential browning and necrosisdamage for non-netted and netted fruit wererecorded at a site in southeastern Australia Awide range of air temperatures were found at thespecified FST thresholds (Figs 2ndash3) This range inair temperatures for a given FST was expected andrepresents a combination of different factors Theseinclude different microclimate conditions surround-ing the fruit such as fluxes in relative humidity andwind speed variation in radiation received due tofruit positioning and leaf shading and fruit char-acteristics such as size
Appreciating this variability in air temperaturefor a given FST this study estimated minimum airtemperature thresholds for potential damage Thiswas achieved by taking the 10th percentile of airtemperatures at two FST thresholds that representbrowning and necrosis By taking this approach itwas assumed that other climate effects and fruitcharacteristics were combining to cause damageat these lower air temperatures Therefore the airtemperature thresholds determined were conser-vatively low and are indicative of when damagemay begin to occur on some fruit primarily themore vulnerable fruit The air temperature thresh-olds calculated should not be regarded as deter-ministic or a reflection of damage for a particularfruit or for all fruit in the orchard Rather the
Table 3 Percentage of fruit affected by sun damage fornon-netted and netted fruit harvest from 10 trees each
Browning () Necrosis () Total ()
Non-netted 130 30 160Netted 81 01 81
Table 2 Summary of total number of days for whichdaily maximum temperature exceeded each air temper-ature threshold for potential damage in January 2013 atShepparton
DamageAir temperaturethreshold (degC)
Number of days inJanuary 2013
Browning(non-netted)
341 13
Browning(netted)
379 7
Necrosis(non-netted)
387 5
Sun damage risk of Royal Gala apple in fruit-growing districts in Australia 227
Dow
nloa
ded
by [
The
Uni
vers
ity O
f M
elbo
urne
Lib
rari
es]
at 1
845
03
Febr
uary
201
6
thresholds are an indication of minimum airtemperatures at which sun damage may begin todevelop
Analyses of theminimumair temperature thresh‐olds were expanded across southern Australia for
1911ndash2013 to demonstrate the flexibility of theapproach Spatial patterns in the number of daysof potential damage follow a north-south gradientand vary with topography These analyses provideinsight into relative sun damage risk in opening of
110 120 130 140 150 160
minus50
minus45
minus40
minus35
minus30
minus25
minus20
10th Percentile
Longitude
Latit
ude
Browning minus Non-netted
0 5 10 15 20 25 30
110 120 130 140 150 160minus
50minus
45minus
40minus
35minus
30minus
25minus
20
50th Percentile
110 120 130 140 150 160
minus50
minus45
minus40
minus35
minus30
minus25
minus20
90th Percentile
110 120 130 140 150 160
minus50
minus45
minus40
minus35
minus30
minus25
minus20
Longitude
Latit
ude
0 5 10 15 20 25 30
110 120 130 140 150 160
minus50
minus45
minus40
minus35
minus30
minus25
minus20
Browning minus Netted
110 120 130 140 150 160
minus50
minus45
minus40
minus35
minus30
minus25
minus20
110 120 130 140 150 160
minus50
minus45
minus40
minus35
minus30
minus25
minus20
Longitude
Latit
ude
0 5 10 15 20 25 30
110 120 130 140 150 160
minus50
minus45
minus40
minus35
minus30
minus25
minus20
Necrosis minus Non-netted
110 120 130 140 150 160
minus50
minus45
minus40
minus35
minus30
minus25
minus20
Figure 4 Number of potential sun damage days in January for browning non-netted browning netted and necrosisnon-netted air temperature thresholds The 10th 50th and 90th percentiles of the data (1911ndash2013) are displayed leftto right The colour-bar legend is measured in number of days
228 R Darbyshire et al
Dow
nloa
ded
by [
The
Uni
vers
ity O
f M
elbo
urne
Lib
rari
es]
at 1
845
03
Febr
uary
201
6
new areas for production or shifts in varietal mixesat established growing regions
For selected fruit-growing regions it was foundthat some sites are more exposed to potential sundamage risk than others This was expected withcooler regions (Spreyton Huonville Applethorpe)illustrating very little risk For warmer regions(Donnybrook Shepparton Young) greater poten-tial riskmdashthat is total number of potential damagedaysmdashwas accompanied by substantial inter-annual variability Considering potential browningfor non-netted fruit at Young there is a 1 in 10 yearchance that 16 days or more in January will be
conducive to browning (90th percentile) equallythere is a 1 in 10 year chance of 1 day or less inJanuary being conducive to browning (10th per-centile) Managing this variability in potential riskis important to maintain yield and quality
These broader analyses both historically andspatially illustrate the flexibility for investigativeanalyses of sun damage using the air temperaturethresholds determined to estimate conditions thatare conducive to damage This approach over-comes the data access limitations of more detailedmodels that require greater data inputs (Thorpe1974 Evans 2004 Schrader 2014) The methods
Table 4 Distribution of potential damage days in January for sites in Australiarsquos growing regions for 10th 50th and90th percentiles of the data
Browning non-netted Browning netted Necrosis non-netted
Site 10th 50th 90th 10th 50th 90th 10th 50th 90th
Spreyton 0 0 0 0 0 0 0 0 0Huonville 0 0 1 0 0 0 0 0 0Applethorpe 0 0 2 0 0 0 0 0 0Batlow 0 0 4 0 0 0 0 0 0Yarra Valley 0 2 5 0 0 1 0 0 1Manjimup 0 3 5 0 0 2 0 0 1Lenswood 0 3 6 0 0 2 0 0 1Young 1 7 16 0 1 5 0 05 4Shepparton 2 6 12 0 1 5 0 1 4Donnybrook 3 7 11 0 1 3 0 05 2
Figure 5 Reduction in the number of potential browning damage days for January across 1911ndash2013 due to nettingThe colour-bar legend is measured in number of days
Sun damage risk of Royal Gala apple in fruit-growing districts in Australia 229
Dow
nloa
ded
by [
The
Uni
vers
ity O
f M
elbo
urne
Lib
rari
es]
at 1
845
03
Febr
uary
201
6
used here prioritised generalisation rather thanspecificity As such only general remarks aboutchanges in potential conditions for damage can bemade To interpret damage to individual fruit useof multivariate models is still required
These thresholds could be used to consider therisk of sunburn damage under future climates asonly maximum temperatures are required to estim-ate conditions that may lead to damage Assess-ments considering netted and non-netted thresholdscould be conducted to highlight any increasingprotection offered by shade netting Note this wouldonly be possible for browning damage as this studywas unable to determine a necrosis air temperaturethreshold as fruit did not reach the required FST fordamage Finally the air temperature thresholds canbe used by growers as a guide for when to useoverhead sprinklers for evaporative cooling inefforts to minimise potential damage
These results have illustrated the benefit ofshade netting in lowering sun damage risk (Table 5and Fig 5) Previous investigations have shownthat shade nets are effective in decreasing sundamage by reducing incident solar radiation (Igle-sias amp Alegre 2006 Gindaba amp Wand 2008) Inthis study a reduction in the number of days ofpotential browning was quantified across Australia(Fig 5) Using Young as an example a decrease of1ndash11 days of potential damage (for 80 of the
historical data) was found reducing the number ofpotential damage days by 68ndash100
This benefit of netting needs to be balancedagainst other possible drawbacks For instance DoAmarante et al (2011) found a reduction in redcoloration and lower firmness values of Royal Galaunder netting Changes to management practicessuch as use of reflective mulch would assist incombating some of these implications An import-ant limitation of installing netting is the expense InAustralia the initial capital cost of erecting nettinghas been estimated at AU$40000 per hectare(Lolicato 2011) For sites with minimal reductionin sun damage with the installation of netting(Applethorpe Batlow) investing in netting maynot be practical although the other benefits thatnetting provides such as a reduction in hail and birddamage should be considered in decision-makingprocesses
Assessments of sun damage rates on the experi-mental trees (Table 3) provide support for the airtemperature thresholds Using the estimated airtemperature thresholds it was determined that forJanuary 2013 there were 13 and 7 days (Table 2)with potential for damage for non-netted and nettedfruit respectively Therefore the potential for dam-age under the nets was predicted to be 46 lowerthan for non-netted fruit This was broadly sup-ported in the damage assessments with a 50reduction found in browning of fruit under netsOther effects may have influenced the observeddamage rates including temperatures experiencedduring December which were not included in theanalysis Additionally the total predicted potentialdamage days may have identified individual days asdamage days that did not lead to any observed fruitdamage As damage assessments occurred at har-vest this cannot be determined
In interpreting these results appreciation ofthe assumptions in the methodology is neededFST thresholds used in this study were determinedin North America (Schrader et al 2003b) Higherultraviolet radiation conditions are experienced inAustralia compared with the northern hemispheredue to lower ozone protection For this reason thetransferability of FST thresholds between hemi-spheres was questioned by Racsko amp Schrader
Table 5 Difference in total number of potentialbrowning days between open and netted fruit Bracketedis the percentage reduction from open values
Site10th
percentile50th
percentile90th
percentile
Spreyton 0 (NA) 0 (NA) 0 (NA)Huonville 0 (NA) 0 (NA) 1 (100)Applethorpe 0 (NA) 0 (NA) 1 (53)Batlow 0 (NA) 0 (NA) 4 (100)Yarra Valley 0 (NA) 2 (100) 4 (80)Manjimup 0 (NA) 2 (67) 4 (80)Lenswood 0 (NA) 2 (67) 5 (83)Young 1 (100) 5 (71) 11 (68)Shepparton 2 (85) 4 (67) 7 (60)Donnybrook 2 (67) 5 (71) 9 (82)
NA indicates no browning events for fruit in the open
230 R Darbyshire et al
Dow
nloa
ded
by [
The
Uni
vers
ity O
f M
elbo
urne
Lib
rari
es]
at 1
845
03
Febr
uary
201
6
(2012) Further research following Schrader et al(2003b) is required to assess if there are differ-ences in FST thresholds between the northern andsouthern hemispheres
In order to extend the results of this study theair temperature threshold values found for Shep-parton were expanded across southern AustraliaOther sites may have weather conditions thatcombine differently than those at Shepparton todetermine FST The conservative approach takenhere should act to minimise potential underesti-mates of damage rates with field observationsneeded for verification of transferability of theseair thresholds
Conclusion
This study determined theminimum air temperaturethresholds that represent potential for sun damagefor Royal Gala apple in non-netted (browning andnecrosis) and netted (browning) blocks Resultswere constructed using a conservative approachindicating when damagemay start to occur for somefruit in the orchard Application of the approachspatially and temporally was demonstrated provid-ing historical context for sunburn damage riskand assessment of relative risk between locationsSuch an analysis has not been previously possibledue to data limitations of more detailed sundamage models The protection offered by nettingwas interpreted and the relative benefits of installa-tion demonstrated Using the methods in this studyto determine air temperature thresholds furtherresearch is possible including expansion to othervarieties assessments of climate change impactsand the use of shade netting as an adaptationstrategy
Acknowledgements
We thank Joerg Klein (Geoffrey Thompson Orchards PtyLtd) for orchard access to conduct this experiment Thisstudy was supported by funding from the VictorianDepartment of Economic Development Jobs Transportand Resources Horticulture Innovation Australia Ltdand the Australian Government Department of Agricul-ture using the apple and pear industry levy and matchedfunds from the Australian government
Disclosure statementNo potential conflict of interest was reported by theauthors
References
Alexander LV Arblaster JM 2009 Assessing trends inobserved and modelled climate extremes overAustralia in relation to future projections Interna-tional Journal of Climatology 29 417ndash435
Alexander LV Hope P Collins D Trewin B Lynch ANicholls N 2007 Trends in Australiarsquos climatemeans and extremes a global context AustralianMeteorological Magazine 56 1ndash18
CSIRO 2007 Climate change in AustraliamdashTechnicalReport 2007 Melbourne CSIRO and Bureau ofMeteorology 148 p
Do Amarante CVT Steffens CA Argenta LC 2011Yield and fruit quality of lsquoGalarsquo and lsquoFujirsquo appletrees protected by white anti-hail net ScientiaHorticulturae 129 79ndash85
Evans RG 2004 Energy balance of apples underevaporative cooling Transactions of the AmericanSociety of Agricultural Engineers 47 1029ndash1037
Gindaba J Wand SJE 2008 Comparison of climateameliorating measures to control sunburn on lsquoFujirsquoapples Acta Horticulturae 772 59ndash64
Iglesias I Alegre S 2006 The effect of anti-hail nets onfruit protection radiation temperature quality andprofitability of lsquoMondial Galarsquo apples Journal ofApplied Horticulture 8 91ndash100
Jones D Wang W Fawcett R 2009 High-qualityspatial climate data-sets for Australia AustralianMeteorological and Oceanographic Journal 58233ndash248
Lolicato S 2011 Sun protection for fruit a practical man‐ual for preventing sunburn on fruitmdash2011 VictoriaDepartment of Primary Industries 43 p
Racsko J Schrader LE 2012 Sunburn of apple fruithistorical background recent advances and futureperspectives Critical Reviews in Plant Sciences31 455ndash504
Schrader L 2014 Interactive sunburn model http horttfrecwsuedupagesSunburn (accessed 6 October2014)
Schrader L Sun J Felicetti D Seo J Jedlow L Zhang J2003a Stress-induced disorders effects on applefruit quality Proceedings of the Washington TreeFruit Postharvest Conference Wenatchee WAPp 1ndash7
Schrader L Zhang J Duplaga W 2001 Two types ofsunburn in apple caused by high fruit surface (Peel)temperature Plant Health Progress doi101094PHP-2001-1004-01-RS
Sun damage risk of Royal Gala apple in fruit-growing districts in Australia 231
Dow
nloa
ded
by [
The
Uni
vers
ity O
f M
elbo
urne
Lib
rari
es]
at 1
845
03
Febr
uary
201
6
Schrader L Zhang JG Sun JS 2003b Environmentalstresses that cause sunburn of apple Acta Horti-culturae 618 397ndash405
Thomson G McCaskill M Goodwin I Kearney GLolicato S 2014 Potential impacts of rising global
temperatures on Australiarsquos pome fruit industry andadaptation strategies New Zealand Journal of Cropand Horticultural Science 42 21ndash30
Thorpe MR 1974 Radiant heating of apples Journal ofApplied Ecology 11 755
232 R Darbyshire et al
Dow
nloa
ded
by [
The
Uni
vers
ity O
f M
elbo
urne
Lib
rari
es]
at 1
845
03
Febr
uary
201
6
Agricultural and Forest Meteorology 226ndash227 (2016) 148ndash160
Contents lists available at ScienceDirect
Agricultural and Forest Meteorology
j o ur na l ho me pag e wwwelsev ier com locate agr formet
How hail netting reduces apple fruit surface temperature Amicroclimate and modelling study
Malcolm R McCaskill alowast Lexie McClymontb Ian Goodwinb Steve GreencDebra L Partingtona
a Department of Economic Development Jobs Transport and Resources Hamilton Centre Private Bag 105 Hamilton Victoria 3300 Australiab Department of Economic Development Jobs Transport and Resources Tatura Centre Private Bag 1 Tatura Victoria 3616 Australiac Plant and Food Research Tennent Drive Palmeston North New Zealand
a r t i c l e i n f o
Article historyReceived 6 October 2015Received in revised form 6 April 2016Accepted 22 May 2016
KeywordsSun damageSunburnUV-BRoyal galaNettingFruit temperature
a b s t r a c t
High fruit temperatures compromise fruit quality and cause production losses in the apple industry Insouth-eastern Australia orchardists have begun investing in netting because of empirical evidence thatit reduces these losses but the magnitude of its effect and mechanisms responsible have not yet beenquantified Models of fruit temperature based on meteorological conditions could inform the design ofnetting structures and improve tactical management to reduce sun damage through treatments such asprotective sprays and the use of overhead irrigation to cool fruit The objectives of this study were firstlyto measure the effect of netting on fruit surface temperature and secondly to test the thermodynamicSmart-Sinclair model The study was conducted near Shepparton Victoria in an orchard where therewere adjacent netted and non-netted sections During late afternoon when sun damage normally occursnetting was able to reduce the median fruit surface temperature by 15ndash20 C but there was a greaterreduction in maximum fruit surface temperature of 40 C The model required calibration to accountfor turbulence in the transfer of heat from fruit to the surrounding air The optimised model was ableto predict fruit surface temperature with a root mean square error of 2ndash4 C The mechanism for thereduction in fruit surface temperature was by reducing the intensity of the solar beam in the late afternoonby interception and scattering which more than offset the potential fruit heating effect of netting thatoccurs through a reduction in internal orchard wind speed
Crown Copyright copy 2016 Published by Elsevier BV All rights reserved
1 Introduction
Fruit exposed to high temperatures while growing on the treesuffers reduced quality particularly in apples (Malus domestica(L)) Reports from South Africa USA Australia and New Zealandsuggest that pack-house culls of 10 could be expected in typicalseasons (Bergh et al 1980 Schrader et al 2004 Wuumlnsche et al2001) but losses can be much higher as these estimates do notinclude severely damaged fruit that is not picked In Australia applegrowers estimate typical losses to vary from 6 to 30 depend-ing on season and fruit variety (Lolicato 2011) Following someyears of high losses orchardists have begun investing in netting
lowast Corresponding authorE-mail addresses malcolmmccaskillecodevvicgovau
(MR McCaskill) lexiemcclymontecodevvicgovau (L McClymont)iangoodwinecodevvicgovau (I Goodwin) stevegreenplantandfoodconz(S Green) debrapartingtonecodevvicgovau (DL Partington)
as a risk reduction strategy because of empirical evidence that itreduces these losses but the magnitude of its effect and mecha-nisms responsible have not yet been quantified
Schrader et al (2003) identified fruit surface temperaturethresholds at which two types of damage occurs At a threshold ofbetween 46 and 49 C sunburn browning occurs which consists ofdiscolouration of the sun-exposed peel that reduces the saleabilityand storage life of the fruit The threshold is cultivar-dependentand requires a combination of both high temperatures and solarradiation Protecting fruit from exposure to ultraviolet radiationgreatly reduces the occurrence of sunburn browning (Schrader2011) At a threshold of 52 C sunburn necrosis occurs in whichepidermal and subepidermal cells die leaving a necrotic spot on thesun-exposed side of the fruit This type of damage can occur in theabsence of solar radiation if the temperature threshold is reachedFruit surface temperatures are dependent not only on the air tem-perature but also solar radiation that heats the sun-exposed fruitsurface and wind that removes heat from the surface Under condi-tions of high solar radiation and low wind speeds the sun-exposed
httpdxdoiorg101016jagrformet2016050170168-1923Crown Copyright copy 2016 Published by Elsevier BV All rights reserved
MR McCaskill et al Agricultural and Forest Meteorology 226ndash227 (2016) 148ndash160 149
surface of fruit can be up to 15 C warmer than air temperature(Schrader et al 2003)
Several thermodynamic models have been developed to cal-culate temperatures in spherical fruit such as apples Internallythese models use similar parameters and equations Thorpe (1974)described a thermodynamic model of apple surface temperaturewhich included the effects of solar radiation wind and the conduc-tion of heat to the shaded side of the fruit This model developedfurther by Smart and Sinclair (1976) who presented a series ofequations that solve for the temperature of the most sun-exposedsurface of spherical fruit known as the ldquohot-spotrdquo Since exces-sive hot-spot temperatures are sufficient to downgrade the entireapple this is the most useful parameter to model Later Evans(2004) described a model that calculated the surface temperature ofapples under evaporative cooling Sauderau et al (2007) presenteda 3-dimensional model that calculated temperatures at all parts ofellipsoid fruit Cola et al (2009) described a model of grape tem-perature which was validated at several sites in Italy while Li et al(2014) built on previous models and tested it on apples in Washing-ton State USA Apart from Cola et al (2009) and Li et al (2014) thesemodels have only had limited field validation and none have beentested under netting Potential uses of a validated model includeboth tactical and strategic management Tactically fruit surfacetemperature could be calculated from numerical weather forecastsso protective sprays can be applied prior to heat events or evapora-tive cooling used when fruit surface temperature reaches a damagethreshold Strategically the value of investment in infrastructuresuch as netting or evaporative cooling systems could be investi-gated with consideration of future climate change scenarios
The objectives of this study were firstly to measure the effectof hail netting on fruit surface temperature and orchard microcli-mate secondly to test the thermodynamic Smart-Sinclair modeland thirdly to quantify the mechanisms by which netting reducessun damage
2 Material and methods
Briefly fruit surface temperatures were measured in adjacentnetted and non-netted areas of a commercial orchard Simulatedfruit surface temperature was calculated using a modified ver-sion of the thermodynamic model developed by Smart and Sinclair(1976) using either microclimate measurements taken within theorchard or surrogates derived from standard weather data mea-sured external to the orchard Table 1 summarises parameters usedin the model and symbols used in this paper
21 Field measurements
Fruit surface temperatures of Royal Gala apples were moni-tored at two sites (ldquonettedrdquo and ldquonon-nettedrdquo) within a commercialorchard located north of Shepparton Australia The majority of theorchard was covered by permanent hail netting except for five rowsin the eastern side The netting (Grey Quad 14 NetPro Pty Ltd Stan-thorpe Qld Australia) had a 10 shade rating and was installed 6 mabove the ground with open sides We refer to the product as ldquohailnettingrdquo because its primary purpose is to protect from hail andto distinguish it from shade-cloth that has shade ratings of 16ndash80(NetPro 2010) Fruit surface temperatures were monitored from 8January 2013 until the first fruit were harvested on 24 January 2013At each site 60 fruit were selected from 4 trees 20 fruit were inthe upper canopy 20 in the middle and 20 in the lower canopyMonitored fruit were selected from fruit on the western sides oftrees that would be exposed to direct radiation in the afternoonin the expectation that maximum daily fruit surface temperaturesnormally occur in the mid-afternoon between 1430 and 1645 h
(Schrader et al 2003) Copper-constantan thermocouples (Type TTranzflo NZ Ltd Palmerston North New Zealand) were insertedunder the fruit skin on the sun-exposed face Data were logged byfour data loggers (CR1000 Campbell Scientific Logan Utah USA)at each site at 1 min intervals The target of 60 monitored fruit wassometimes not achieved because of datalogger difficulties somesensors becoming dislodged from the fruit and because two log-gers were not installed until 15 January On the 2 hottest days (forwhich detailed data are reported later in the paper) 44 fruit weremonitored under netting and 38 in the non-netted orchard on 11January while the equivalent numbers were 59 and 58 respec-tively on 17 January The diameters of the monitored fruit wererecorded on 11 16 and 23 January 2013 Fruit were harvestedcounted and weighted between 24 January and 4 February 2013from 10 trees each in the netted and non-netted sites includingthe 4 trees logged for temperature Fruit harvested from the 4 treeslogged for temperature were visually assessed for sunburn damageDamage was classified as (i) minor sunburn browning (ii) majorsunburn browning (iii) necrosis or (iv) photo-oxidative sunburn(Racsko and Schrader 2012)
The microclimate was monitored at the netted and non-nettedsites and data logged (DataTaker DT80M Thermo Fisher ScientificInc Yokohama Japan) at 1 min intervals Air temperature (Tair C)and humidity (HMP155 Vaisala Oyj Vantaa Finland) were mea-sured at 15 m height with the sensor mounted in a cylindricalwhite aluminium screen Wind speed (v ms) was measured bycup anemometers (PA2 Wittich and Visser Rijswijk Netherlands)in the lower middle and upper canopy at heights of 1 2 and3 m Diffuse and total radiation (Rdf and Rs Wm2) and ultraviolet-B (UV-B Wm2 280ndash315 nm) were monitored above the canopyat 3 m height (SPN1 Delta T Devices Cambridge UK SKU430Skye Instruments Llandrindod Wales) Adjacent to the orchard theexternal environment was logged (6004C-21 STARLOG UnidataOrsquoConnor Australia) at 10 min intervals Humidity and Tair (HMP45A-T Vaisala Oyj Vantaa Finland) were measured at 15 m heightwith the sensor mounted in a cylindrical white aluminium screenA cup anemometer (Wind sensor compact Thies Clima GottingenGermany) was used to measure v at 2 m height Data from the exter-nal weather station were only available 8ndash29 January whereas datafrom the orchard weather stations were available 1ndash31 JanuaryPotential evapotranspiration (ETo mm) was calculated on a 10 mintimestep from weather data measured in the netted and non-nettedorchards by the FAO56 equations of Allen et al (1998)
At both the netted and non-netted sites trees were irrigatedby microjet sprinklers spaced midway between trees and approxi-mately 03 m above the soil surface Trees were 15 m apart trainedon a central leader system in rows 48 m apart and rows wereoriented NNW-SSE (345) Tree age variety rootstock and man-agement did not differ between the netted and non-netted siteswith the exception of increased irrigation flow rates in the non-netted area All management activities (irrigation fertilisation andweed and pest control) were undertaken by staff of the commercialorchard
22 Fruit temperature modelling
Smart and Sinclair (1976) proposed the following algebraic solu-tion to calculate the instantaneous temperature increment aboveTair on the sun-exposed surface of the fruit (Tmax C) as
Tmax = I0 (1 minus ) (ks + 4hr)(rh + ks) 4h
(1)
where I0 is incident solar radiation received by a fruit surface per-pendicular to the solar beam (Wm2) the reflectance of the fruitsurface (albedo) ks the thermal conductivity of the fruit (W(m C))h the heat transfer coefficient from the fruit surface to the atmo-
150 MR McCaskill et al Agricultural and Forest Meteorology 226ndash227 (2016) 148ndash160
Table 1Symbols used in this paper and source of the values used
Symbol Units Explanation Valuessource
Unitless fraction Reflectance of the fruit surface 04 Merzlyak et al (2003)d Days Day number (1 Jan = 1) Calculateddr Relative units Relative inverse distance between the earth and sun
(range 0967ndash1033)Calculated according to equation 23 of Allenet al (1998)
D m Fruit diameter Measuredı m Thickness of the boundary layer of still air at the fruit
surfaceEquation 5 of this paper based on Nobel (1975)
ETo mm Potential evapotranspiration Calculated according to Equation 6 of Allenet al (1998)
f Unitless factor Calibration factor FittedGsc Wm2 Solar constant 1367 Wm2 Allen et al (1998)h W(m2 C) Heat transfer coefficient Equation 5b of Smart and Sinclair (1976)I0 Wm2 Solar radiation received on a fruit surface normal to
the solar beamEquation 2 of this paper based on Smart andSinclair (1976)
ka W(m C) Thermal conductivity of air 255 W(m C) Smart and Sinclair (1976)ks W(m C) Thermal conductivity of the fruit Equation 9 of Smart and Sinclair (1976)r m Fruit radius MeasuredRa Wm2 Extraterrestrial solar radiation on a plane horizontal to
the earthrsquos surfaceCalculated by equation 28 of Allen et al (1998)
Rs Wm2 Total solar radiation measured on a plane horizontal tothe earthrsquos surface
Measured
Rdf Wm2 Indirect solar radiation measured on a plane horizontalto the earthrsquos surface
Measured
RUVB Wm2 Solar radiation in the ultraviolet-B band 280ndash315 nm MeasuredTair
C Air temperature MeasuredTfrmx
C Temperature of the hottest face of sun-exposed fruit inthe orchard
Measured
TmaxC Difference between fruit surface temperature and air
temperatureCalculated from measurements and equation 1of Smart and Sinclair (1976)
v ms Wind speed Measuredzd degrees Zenith angle of the sun (degrees from vertical) Calculated according to Jacobson (2005)zr radians Zenith angle of the sun (radians from vertical) Calculated according to Jacobson (2005)
sphere (W(m2 C)) and r the radius of the fruit (m) In our studyI0 was calculated as
Io = GscdrRs minus Rdf
Ra+ Rdf 2 (2)
where Gsc (Wm2) is the solar constant dr the inverse relative dis-tance between the earth and the sun Rs total radiation measuredabove the canopy on a horizontal plane Ra (Wm2) extra-terrestrialradiation on a horizontal plane and Rdf diffuse radiation measuredon a horizontal plane above the canopy In Eq (2) it is assumedthat the sunlit fruit face was exposed to only half the Rdf measuredon a horizontal plane (Smart and Sinclair 1976) The terms Gsc dr
and Ra were calculated according to Allen et al (1998) Reflectance(˛) was set at 04 based on data from Merzlyak et al (2003) whoreported a range from 035 for dark red fruit to 045 for pale fruitThermal conductivity of fruit (ks) is related to apple temperatureand was calculated as
ks = 0297 + 00024Tfrmx (3)
based on Lisowa et al (2002) where Tfrmx is the temperature ofthe hottest face of sun-exposed fruit in the orchard calculated in theprevious iteration (see Eq (7) below) The heat transfer coefficienth was calculated as
h = ka
ı+ 2kaD (4)
where ka is the thermal conductivity of the air 00257 W(m2 C)ı the thickness of the boundary layer of still air at the surface ofthe hot-spot of the fruit (m) and D the fruit diameter (m) ı wasestimated from v and D by an equation based on Nobel (1975)
ı = f
(028
radicD
v+ 25
v
)(5)
where f is a calibration factor Values of v were set to a minimumvalue of 05 ms to avoid division by zero D was calculated frommeasurements of fruit diameter interpolated by a linear regressionrelationship between measurement dates
D = (5784 + 02133d)100
(6)
where d is the day number (1 January = 1) Preliminary runs ofthe model indicated that without a calibration factor ı was toohigh resulting in insufficient heat transfer from the fruit surfaceto the surrounding air and simulated fruit surface temperatureswere much higher than observed The model was calibrated usinga range of values of f from 01 to 10 in increments of 005 and cal-culating the root mean square error (RMSE) of differences betweencalculated fruit surface temperatures and the maximum fruit sur-face temperature in each 10 min period The optimum value of fwas that with the lowest RMSE A similar approach was used byCola et al (2009) in calibrating aerodynamic roughness to mea-sured fruit temperature in grapevines from wind speeds measuredat a weather station external to the vineyard Separate values of fwere sought for the netted and non-netted sites with v measuredeither at 3 m height within each orchard or at the weather stationexternal to the orchard The first half of the data set from 9 to 15January 2013 was used for model calibration and the remainingdata was used for validation Since the monitored fruit were onlyexposed to the afternoon sun only data from 1400 to 1700 h wereused for calibration and validation
The temperature of the hottest face of sun-exposed fruit in theorchard (Tfrmx C) was then calculated as
Tfrmx = Tmax + Tair (7)
where Tair (C) is the measured air temperature and Tmax thesimulated difference between air temperature and fruit surfacetemperature Calculations were performed on a 10 min timestep
MR McCaskill et al Agricultural and Forest Meteorology 226ndash227 (2016) 148ndash160 151
Table 2Harvested yield fruit weight and sunburn damage from the netted and non-nettedsites in the orchard and the statistical significance of differences
Netted Non-netted Significance
Total fruit yield (tha) 346 373 0564Fruit weight (gfruit) 153 125 lt0001Minor sunburn browning ( by weight) 77 104 0014Major sunburn browning ( by weight) 04 26 0007Necrosis ( by weight) 01 30 0003Photo-oxidative sunburn ( by weight) 02 07 0135Total damage ( by weight) 83 167 0002Yield of undamaged fruit (tha) 317 311 0282
but final output was calculated as a moving average of the previous30 min to compensate for the lack of thermal mass in the equations
23 Supplementary site
To test its structure and calibration modelled Tfrmx was com-pared with measurements taken at a supplementary site east ofShepparton Measurements were made in a commercial Royal Galaorchard without netting in which trees were planted at 25 m spac-ing in rows 50 m apart and irrigated at the tree base by microjetsprinklers This site was part of a larger study of evaporative cooling(Green et al 2011) and data reported here are for 3 apples withoutcooling on the north-west side near the top of the canopy whereprotective foliage had been removed Copper-constantan thermo-couples were inserted beneath the north-west facing surface ofsun-exposed apples on 27 January 2011 and temperatures mon-itored until harvest on 10 February Temperatures were measuredat 10-s intervals and logged (CR1000 Campbell Scientific LoganUtah USA) at a 1-min frequency Fruit diameter was measuredon 25 January and 7 February In a nearby clearing surrounded byorchards an automatic weather station recorded air temperaturesolar radiation and wind speed at a 2 m height at a 15-min fre-quency Solar radiation was measured at 2 m height using a siliconphotodiode pyranometer (SK01D Carter-Scott Design BrunswickAustralia) PAR was measured at 2 m height using a silicon photo-diode quantum sensor (PAR sensor Tranzflow Palmerston NorthNew Zealand) Air temperature and humidity were measured ata 15 m height (HMP 45A-T Vaisala Vantaa Finland) mountedin a cylindrical white aluminium screen Wind speed was mea-sured using a 3-cup anemometer at 2-m height (AN2 MonitorSensors Caboolture Australia) Measurements were taken every30 s and the average calculated and stored at 15-min intervals in adata logger (DT500 Datataker Scoresby Australia) Supplementarywind measurements were also taken from the Irrigateway network(httpawsdataitcsiroau8000idstationTATR) These measure-ments were taken at a 2 m height on an exposed site at the TaturaResearch Station operated by the Department of Economic Devel-opment Jobs Transport and Resources
24 Statistical analysis
Fruit yield and sunburn damage data from each tree were com-pared by one-way analysis of variance Residuals were checked fornormality and homogeneity of variance No transformations wererequired on any of the variables Solar radiation observations inthe netted orchard were compared with the non-netted orchard bymeans and descriptive linear regression with a focus on the after-noon (1400ndash1700 h) when the risk of sun damage is greatest Datafor Tair relative humidity and v from the netted and non-nettedorchards were compared with the weather station external to theorchard using a combined linear regression with the site (netted ornon-netted) as a factor This enabled the orchard microclimate tobe estimated from weather data external to the orchard
Since the model requires some non-standard weather dataparameters relationships were sought to predict these fromstandard parameters Prediction equations of these non-standardparameters ndash Rdf in the non-netted orchard and both Rdf andRs under netting ndash were sought by linear regression from 10 minweather data collected between 1 and 15 January 2013 using rela-tionships of the form
Rdf
Rs= a + b
Rs
Ra+ c
1AM
+ d(
Rs
Ra
) (1
AM
)
Rs
Ragt e (8)
where the coefficients a b c d and e are derived from the regres-sion and AM the air mass number to account for solar angle effectsThe RsRa component of this function was based on Spitters et al(1986) who recommended a series of split line relationships to esti-mate Rdf Rs from RsRa According to these relationships underheavy cloud (low RsRa) the proportion of total radiation that isdiffuse (Rdf Rs) is not influenced by RsRa up to a break point afterwhich there is a linear relationship with RsRa The term AM is usedin astronomy and the solar power industry to describe the pathlength of the solar beam in the atmosphere relative to a direct ver-tical path and was calculated by an empirical function of Kastenand Young (1989)
AM = 1(cos zr + 0050572(607995 + 90 minus zd)minus16364 (9)
where zr and zd are the zenith angle of the sun in radians anddegrees respectively The value of AM ranges from close to 1 whenthe sun is overhead to over 10 at dawn or dusk The inverse ofAM was used in the regression analyses because the attenuationof the solar beam through scattering and absorption would beexpected to follow an inverse relationship with path length Sim-ilar effects would be expected as the solar beam passes throughnetting To determine parameters the Genstat split line regres-sion procedure was first used to estimate e independent of AMThis set a break point for the split line relationship and belowthis threshold the break point value of Rdf Rs was used Valuesof RsRain excess of e were then selected to determine the otherparameters using generalised linear regression A similar approachwas used to estimate netted RsRa from non-netted RsRa but nobreak point was required Since the intent was to develop esti-mates at times of risk of sun damage input values were constrainedto times when Ra exceeded 380 Wm2 to avoid refractive effectsthat occur close to dawn and dusk when the sun is near the hori-zon This constraint limited data to 0640ndash1800 h in mid-JanuaryAnother required constraint was to remove 10 min periods whenRs exceeded clear-sky radiation which was assumed to be 08 RaThese periods occurred when Rs included radiation reflected fromclouds and could at times predict negative values of Rdf Statisticalanalyses were conducted using Genstat (14th Edition VSN Interna-tional Hemel Hempstead UK) Model predictions were comparedwith measurements by the root mean square error (RMSE)
25 Sensitivity analysis
Sensitivity of the model to its inputs was tested by varying indi-vidual parameters by either the range reported in the literature orfor weather parameters the range measured in our study between1400 and 1700 h The range for was from 01 (Sauderau et al2007) to 06 (Evans 2004) ks from 028 to 054 W(m C) (Smartand Sinclair 1976 Donsi et al 1996 Lisowa et al 2002) v from 01to 34 ms Rs 60ndash1040 Wm2 Rdf 50ndash580 Wm2 and Tair 15ndash42 Cwhile D was varied from 0049 to 0080 m based on measurementsof individual fruit The parameters not varied were taken from thetime of maximal Tfrmx during the study which was from the non-netted orchard from 1610 to 1620 h on 17 January 2013
152 MR McCaskill et al Agricultural and Forest Meteorology 226ndash227 (2016) 148ndash160
3 Results
31 Sunburn damage and fruit yield
Fruit in the non-netted orchard had twice the rate of sunburndamage as that in the netted orchard (17 vs 8) (Table 2) The great-est differences were in the major sunburn browning and necrosiscategories Total fruit yield in the non-netted orchard was 8 higherthan with netting but the yield of undamaged fruit was 2 lowerThese differences in fruit yield were not statistically significantbecause of a relatively high coefficient of variation between indi-vidual trees of 29 Fruit harvested from the non-netted orchardwere smaller than those with netting (125 vs 153 g)
32 Fruit surface temperatures
Measured Tfrmx were up to 144 C higher than Tair with net-ting during the afternoon and up to 167 C without netting butat night the differences were small (Fig 1) The two days with thehighest Tfrmx were the 11th of January (a clear day) and the 17thof January (a partly cloudy day) As the days with the greatest riskof sun damage these were examined in greater detail The proba-bility distribution of the maximum temperature achieved in eachmonitored fruit for these days shows that with netting the mediantemperature was 15ndash23 C cooler with netting than without butthat the maximum temperature was 40 C cooler (Fig 2) On theclear day (11 January) 45 of non-netted fruit exceeded the thresh-old of 46 C at which sunburn browning occurs (Schrader 2011)compared with only 9 under netting However on the partlycloudy day (17 January) the proportions exceeding the thresholdwere much higher at 79 without netting and 32 with nettingMeasured Tfrmx on the clear day showed a broad peak in the lateafternoon whereas on the partly cloudy day there was a seriesof sharp peaks (Fig 3) These peaks coincided with short periodsof high solar radiation between clouds The upper quartile of fruitsurface temperature peaked late in the afternoon at 1600ndash1700 h
33 Netted vs non-netted microclimates
Microclimate differences between the netted and non-nettedorchards are addressed here first for the entire month of Januarythen in greater detail for the two days when the highest fruit sur-face temperatures were recorded Averaged across all afternoons inJanuary 2013 the netted orchard had 15 less total radiation thanthe non-netted orchard 32 lower UV-B and a 13 lower potentialevapotranspiration but 20 more diffuse radiation (Table 3) Forthe whole month of January 2013 potential evapotranspiration wasalso 13 lower under netting than without (159 vs 183 mmmonth)
Descriptive linear regressions of radiation parameters duringthe afternoon between the netted and non-netted orchards showeda high level of correlation with R2 values of between 0881 and0987 (Table 3) All slopes and intercepts were statistically signif-icant (P lt 0001) indicating that there were significant differencesin radiation parameters between the environments
Fig 1 Measured (blue) and simulated (red and orange) fruit surface tempera-ture of the hottest face of sun-exposed fruit (Tfrmx) and orchard air temperature(green) at (a) netted and (b) non-netted with simulated Tfrmx calculated from windspeeds measured external to the orchard Simulated temperatures are shown in redbetween 1400 and 1700 h and orange at other times Arrows show spikes in simu-lated values at times of low wind speed and high direct radiation before 1000 andafter 1700 h (For interpretation of the references to colour in this figure legend thereader is referred to the web version of this article)
In the afternoon v at the netted site was lower (22ndash24) at a 3 mmeasurement height but there were no significant differences inTair (Tables 4 and 5) At night the netted orchard was more humidthan the non-netted orchard and had lower v
Predictive relationships for Rdf and Rs under netting based on Eq(8) showed root mean square errors of between 17 and 71 Wm2
(Table 6) In each case all the slopes and intercepts were statisticallysignificant (P lt 0001) Using these relationships for a theoreticalclear day (defined as RsRa = 075) in mid-January netting reducedRs by 10 at 1230 h but by 20 at 1620 h Equivalent reductions inIo were 22 and 26 respectively
On the clear day Rs closely followed the pattern of Ra but onthe cloudy day the pattern was spikey with short periods whenRs was up to 13 greater than at the same time on the clear day
Table 3Summary of differences in afternoon radiation and ETo (1400 and 1700 h Eastern Australian Standard Time) between netted and non-netted environments 1ndash31 January 2013compared by their arithmetic mean and linear regression as y = a + bx where y is the parameter under netting a the intercept b the slope and x the parameter withoutnetting
Parameter Means Regression
Netted Non-netted Difference () Intercept Slope R2
Global radiation (Rs Wm2) 616 726 minus15 minus677 0941 0982Diffuse radiation (Rdf Wm2) 141 117 20 631 0666 0881Ultraviolet radiation-B (UV-B Wm2) 126 184 minus32 minus00734 0723 0997Reference evapotranspiration (ETo mmhr) 047 054 minus13 minus00046 0924 0987
MR McCaskill et al Agricultural and Forest Meteorology 226ndash227 (2016) 148ndash160 153
Fig 2 Cumulative probability distribution of the maximum fruit surface temperature measured in non-netted and netted sections of the orchard on (a) a clear day (11January 2013) and (b) a partly cloudy day (17 January 2013)
Fig 3 Fruit surface temperature (Tfr ) measured in the netted and non-netted sections of the orchard showing the maximum upper quartile median and minimum and thesimulated orchard maximum modelled from weather data according to Eq (7) for a clear day (11 January) and a partly cloudy day (17 January)
Table 4Summary of air temperature humidity and wind speed during afternoons (1400ndash1700 h Eastern Australian Standard Time) and nights (2000ndash0500 h) in the netted orchardnon-netted orchard and external environment 8ndash29 January 2013
Parameter Afternoon Night
Netted Non-netted External Netted Non-netted External
Air temperature (C) 317 322 301 171 173 179Relative humidity () 293 275 263 698 660 622Wind speed (ms)3 m 122 156 055 0842 m 080 074 266 030 023 1701 m 020 035 004 006
(Fig 4) On the clear day without netting about 10 of radiationwas in the diffuse form whereas under netting it was 17 Thepercentage of Rs transmitted through the net was similar on bothdays and ranged from 89 at midday to about 60 close to dawn ordusk Estimated Io reached a broad maximum around the middle ofthe day after which it declined more rapidly under netting than in
the non-netted orchard At a height of 3 m v was about 20 lowerunder netting but there was little difference in Tair (Fig 5) At bothsites there were low wind speeds in the evening and night On 17January these nearly calm conditions had started by 1725 h Differ-ences between the netted and non-netted environments close tothe time of maximum fruit surface temperature are summarised in
154 MR McCaskill et al Agricultural and Forest Meteorology 226ndash227 (2016) 148ndash160
Table 5Microclimate in the netted and non-netted sites expressed as a linear function of readings at the weather station external to the orchard where environment (netted ornon-netted) was a factor in the analysis Significance of differences between netted and non-netted in intercept or slope are shown as for P lt 0001 for P lt 001 forP lt 005 minus for P lt 01 ns for not significant
Afternoon (1400ndash1700 h) Night (2000ndash0500 h) All hours
Intercept Slope R2 Intercept Slope R2 Intercept Slope R2
Air temperature (C)Netted 109 0967 0987 minus024 0938 0962 minus133 1024 0978Non-netted 158 0968 minus124 1009 minus139 1047Difference 049 0001 minus101 0070 minus006 0022Significance of difference ndash ns ns
Relative humidity ()Netted 685 0953 0987 1050 0956 086 783 0983 0951Non-netted 482 0959 minus014 1075 344 1003Difference minus203 0005 minus1064 0119 minus439 0020Significance of difference ns
Wind speed (ms)Netted 3 m minus012 0477 0912 minus018 0468 0918 minus018 0476 0917Non-netted 3 m minus018 0627 minus016 0642 minus016 0633Difference minus005 0150 002 0174 002 0157Significance of difference ns ns ndash Netted 2 m minus024 0370 0824 minus018 0307 0832 minus021 0337 0800Non-netted 2 m minus002 0254 minus012 0220 minus012 0267Difference 023 minus0116 007 minus0088 009 minus0069Significance of difference Netted 1 m minus002 0072 0476 minus004 0049 0622 minus005 0069 0486Non-netted 1 m 008 0083 minus005 0069 minus005 0105Difference 011 0011 minus001 0019 000 0036Significance of difference ns ns
Table 6Predictive relationships calculated from the calibration period (1ndash15 January) based on Eq (8) to estimate global radiation under netting as a proportion of extraterrestrial(RsRa) diffuse radiation as a proportion of global (Rdf Rs) in netted and non-netted environments and the root mean square error (RMSE) and predictive error of therelationships in estimating Rs and Rdf between 0700 and 1800 h for the validation period (16ndash31 January 2013)
Parameter orcoefficient in Eq (7)
Global radiation as a proportion of extraterrestrial(RsRa)
Diffuse radiation as a proportion of global radiation(Rdf Rs)
Netted Netted Non-netted
Split line regressione 0396 0391Rdf Rs at breakpoint 0830 0855No of observations 1017 1017R2 0918 0932
Generalised linear modela 0049 0715 0506b 0546 minus0507 minus0391c minus0079 1088 1515d 0400 minus1684 minus217No of observations 1016 896 896R2 0982 0761 0754
Overall relationship (validation period)RMSE (Wm2) 171 506 712Predictive error (Wm2) 131 241 351
Table 7 On both days between 1610 and 1620 h netting reduced Ioby 26
34 Calibration of the model
Without calibration the model consistently over-predictedTfsmx by an average of 66 C but the calculated values were highlycorrelated with measurements (R2 = 087 data not shown) To cor-rect this over-prediction a calibration factor (f) was applied to v(wind speed) because the relationship between wind speed andheat transfer to the atmosphere was the least well-defined com-ponent of the model The model was first fitted to v measured at3 m height at each site within the orchard This achieved minimumRMSErsquos of 21 and 26 C (Fig 6a) for netted and non-netted orchardsrespectively Secondly the model was fitted to measurements of vmeasured at a height of 2 m external to the orchard which achievedslightly lower RMSErsquos (20 and 23 C respectively) and optimised
at the same calibration factor for both the netted and non-nettedorchards (Fig 6b) Since the second option fitted the data moreclosely and could be calculated from wind speeds from externalto the orchard which are more commonly measured than internalorchard wind speeds this option was used for most simulationsreported in this paper
Measured and simulated Tfrmx showed close agreement on mostdays during the afternoon between 1400 and 1700 h but before andafter these times there were short term spikes in simulated Tfrmx
that were not observed in the measured data (Fig 1) These spikesoccurred before 1000 h and after 1700 h during periods of low windspeed high direct solar radiation and a high angle of incidence ofthe sunrsquos rays (zd gt 36 from zenith before 1000 h and zd gt 76 after1700 h)
Simulated and measured Tfrmx were closely matched between1400 h and 1700 h when fruit were exposed to direct sunlight(Fig 3) However simulated temperatures exceeded measurements
MR McCaskill et al Agricultural and Forest Meteorology 226ndash227 (2016) 148ndash160 155
Fig 4 Solar radiation on a clear day (11 January 2013) and a cloudy day (17 January 2013) showing calculated extraterrestrial radiation (Ra) global radiation measured abovethe plant canopies of netted (Rsnet ) at netted and non-netted sites (Rsnnet ) and diffuse radiation (Rdfnet and Rdfnnet) (a b) Also shown is the percentage of global radiationrecorded above the plant canopy of the non-netted and netted orchards that was in the diffuse form (Rdf Rs) the percentage of global radiation that was transmitted throughthe net (RsnetRsnnet) (c d) and the estimated intensity of the solar energy received on a fruit surface perpendicular to the solar beam (I0) (e f)
in the morning and early evening when the measured fruit wereshaded
35 Model validation from standard weather data
Since in-orchard weather data are rarely available for long-termmodelling studies Tfrmx was also calculated for validation purposesfrom standard weather data using the coefficients in Tables 5 and 6to estimate Tair Rdf and Rs in the netted orchard The externalweather station was used for Tair and v but it was assumed thatglobal radiation measured above the canopy at the non-netted sitewas equivalent to that measured outside the orchard Using thesesurrogates there was only a small increase (02ndash06 C) in RMSE rel-ative to in-orchard weather data (Table 8) This applied to both thecalibration and validation periods
36 Supplementary site
The model was run using weather data from the supplemen-tary site and compared Tfrmx measured at this site between 1400and 1700 h (Fig 7a) (f = 045 optimised for the main site) Themodel tended to over-predict early in the data set followed by
under-prediction later and achieved an overall RMSE of 63 COver-prediction occurred on afternoons with low wind speed andunder-prediction on afternoons of high wind speed a relationshipthat accounted for 67 of variation (data not shown) Optimisingf to this data set reduced the RMSE to 57 C (f = 033) but therewas still a strong relationship between over-prediction or under-prediction and wind speed The closest fit between predicted andmeasured was achieved using wind speed data from Tatura whichachieved an RMSE of 38 C (f = 092) (Fig 7b)
37 Sensitivity analysis
The sensitivity analysis showed that among plant parametersTfrmx was most strongly affected by followed by much smallereffects of D and ks (Table 9) Among weather parameters Tfrmx wasmost affected by Tair followed by Rs v and Rdf The sensitivity analy-sis was also used to test the impact of the reduction in v associatedwith netting and potential offsets A 25 decrease in v increasedfruit surface temperatures by 22 C but this increase could be off-set by either a 16 reduction in total radiation or a 58 increasein the proportion of total radiation in the diffuse form (data notshown)
156 MR McCaskill et al Agricultural and Forest Meteorology 226ndash227 (2016) 148ndash160
Fig 5 Air temperature (a b) and wind speeds (c d) at the netted and non-netted sites and at a weather station external to the orchard on 11 and 17 January 2013
Table 7Summary of differences between the non-netted and netted environments and external to the orchard close to the time of maximum fruit surface temperature between1610 and 1620 on 11 and 17 January 2013 Values are the mean of 1 min readings
11 Jan (clear day) 17 Jan (cloudy day)
External Non-netted orchard Netted orchard Difference () External Non-netted orchard Netted orchard Difference ()
Extraterrestrial radiation Ra
(Wm2)883 883 883 861 861 861
Total measured solar radiationRs (Wm2)
679 572 minus16 769 652 minus15
Diffuse radiation Rdf (Wm2) 87 114 31 175 187 7Direct radiation (Wm2) 572 425 minus26 592 441 minus25Radiation perpendicular to the
sunlit face of fruit Io (Wm2)967 749 minus26 971 761 minus26
Diffuse radiation relative toglobal ()
13 20 56 23 29 26
Ultraviolet B radiation UV-B(Wm2)
146 100 minus31 158 104 minus34
Relative humidity () 10 13 15 10 14 14Wind speed at 3 m (ms) 16 11 minus28 12 13 13Wind speed at 2 m (ms) 238 09 07 minus17 291 07 09 37Wind speed at 1 m (ms) 06 03 minus56 04 02 minus39Fruit surface temperature (C) (C) (C)Simulated 496 472 minus24 516 488 minus28Measured maximum 520 467 minus53 531 479 minus52Measured upper quartile 463 447 minus17 485 460 minus26Measured median 450 437 minus13 465 444 minus22Measured lower quartile 425 418 minus07 450 427 minus23Measured minimum 399 393 minus06 415 401 minus14Air temperature (C) 387 387 384 minus03 40 407 400 minus07
4 Discussion
41 Fruit damage and yield
A higher fruit yield in the non-netted orchard was offset by amuch higher percentage of sunburn damage than in the netted
orchard (17 vs 8) leading to a 2 reduction in the yield of undam-aged fruit This difference in yield was not statistically significantand would require confirmation through studies with a larger sam-ple size The 2-fold difference in the percentage of fruit affected bysunburn was consistent with the difference in the percentage ofmonitored fruit that exceeded the sunburn browning threshold of
MR McCaskill et al Agricultural and Forest Meteorology 226ndash227 (2016) 148ndash160 157
Table 8Root mean square error (C) for fruit surface temperature calculated using the optimum value of the calibration factor (f ) for each data set for 3 combinations of weatherdata with and without netting for the calibration period (9ndash15 January) and validation period (16ndash29 January)
Source of weather data Data period
Total radiation Diffuse radiation Air temperature Wind speed f Calibration Validation
RMSE (C)Netted orchardin-orchard weather station Netted Netted Netted Netted 02 210 355in-orchard and external weather station Netted Netted Netted External 045 201 310standard weather data Externala External External External 045 224 343difference between in-orchard and standard weather data 023 033Non-netted orchardin-orchard weather station Non-netted Non-netted Non-netted Non-netted 025 260 367in-orchard and external weather station Non-netted Non-netted Non-netted External 045 227 309standard weather data Externala External External External 045 288 353difference between in-orchard and standard weather data 061 044
a The source data for total radiation (Rs) were made above the canopy in the non-netted orchard and assumed to be equivalent to that measured externally
Table 9Sensitivity analysis of predicted fruit surface temperature calculated from in-orchard weather readings based on standard weather data values between 1610 and 1620 hon 17th of January 2013
Values Change in Tfrmx (C)
Low Standard High Low High
Apple reflectance () 01 04 06 623 minus419
Apple thermal conductivity (ks) (Wm2) 028 042 054 083 minus057
Fruit diameter (D) (m) 0049 0060 0080 minus080 096
Wind speed (v) (ms) 01 12 34 952 minus692
Total radiation (Rs) (Wm2) 60 768 1040 minus1461 523
Diffuse radiation (Rdf ) (Wm2) (Rs held constant) 50 175 580 168 minus548
Air temperature (Tair ) (C) 150 407 420 minus2539 126
46 C on the hottest day of the study 17 January 2013 (79 vs 32)Monitored fruit were only on the west-facing side of the rows thatwould be exposed to the afternoon sun and were representativeof the half of the apple crop at risk of sun damage An unexpecteddifference was that fruit from the non-netted orchard were smaller(125 vs 153 g) most likely due to differences in crop load (fruit num-ber per tree) The Gala variety used in this study is intermediatein its susceptibility to sunburn relative to other cultivars (Schraderet al 2001 Schrader et al 2008) A more comprehensive samplingregime during harvest would be required to quantify the effects ofnetting on yield and sunburn damage for each cultivar
42 Model performance
The model fitted measured Tfrmx at both the netted and non-netted sites with an RMSE of sim2 C in the calibration period andsim3 C in the validation period which is similar to previouslyreported models in orchards or vineyards without netting (Evans2004 Cola et al 2009 Li et al 2014) While a physically-basedmodel would ideally require no calibration and be based on quan-tities that are directly measureable this was not the case here Themost imprecisely defined process is the transfer of heat from thefruit surface to the air through a boundary layer of still air adjacentto the fruit surface The thickness of this boundary layer (ı) hasnever been directly measured but has either been back-calculatedfrom heat transfer characteristics or estimated from measure-ments of v by semi-empirical relationships (eg Cola et al 2009 Liet al 2014) The equations used by Smart and Sinclair (1976) werebased on an experiment of Nobel (1975) in which fruit were heatedby artificial radiation under laminar air flow and ı inferred fromheat transfer characteristics at various wind speeds Under fieldconditions turbulent air flow alters these relationships and Nobel(1975) recommended empirical modifications suited to vineyardsHowever trellised apple orchards have taller rows of trees andwould be expected to have greater turbulence relative to horizon-
tal wind flow than vineyards Although wind flow in the horizontalplane was measured by anemometers within the orchard thesedata produced a poorer fit to observed fruit surface temperaturethan those measured at an exposed site adjacent to the orchardFurther resolution of the physics of heat transfer from the fruit sur-face to the air would require sensors such as sonic anemometerswhich measure air flow in 3 dimensions However for use in a semi-empirical model it appears Tfrmx was more strongly related to windmeasurements taken at the more exposed measurement site exter-nal to the orchard than those taken with cup anemometers close tothe monitored fruit Likewise at the second site a closer fit to fruittemperature measurements was achieved using wind data from anexposed site 18 km away at Tatura than a relatively sheltered siteclose to the orchard A similar calibration approach was undertakenby Cola et al (2009) in a study of vineyard temperatures in Italy Itis therefore simpler to calibrate directly between fruit temperatureand v measured by a cup anemometer at a standardised weatherstation location
The model produced short-term ldquospikesrdquo of high fruit surfacetemperature in the morning before 1000 and in the late afternoonafter 1700 h This occurred during short periods of nearly calm con-ditions when the model calculated a low value of h in Eq (2) Thesespikes occurred outside the times when sun damage would nor-mally be expected (1430ndash1645 h Schrader et al 2003) and couldcause spurious results should the model be run on long-term orautomated weather data To avoid such problems we suggest theuse of a time-based filter that only utilises Tfrmx between 1000 and1700 h for the following reasons Firstly the sun angle after 1700 h(gt60 from zenith) means most fruit are becoming fully or partiallyshaded by leaves while those fully exposed to the sunrsquos rays areunlikely to receive the direct beam of the sun long enough to causedamage According to Schrader et al (2001) sunburn browningrequires exposure to temperatures exceeding the varietal thresh-old for 30ndash60 min for its full development Secondly spikes after1700 h were over-predicted relative to measurements (eg Fig 4)
158 MR McCaskill et al Agricultural and Forest Meteorology 226ndash227 (2016) 148ndash160
Fig 6 Root mean square error of fruit surface temperature (C) during afternoons(1400ndash1700 h) between 9 and 15 January 2013 in response to the calibration factor(f) calculated from wind speed measured (a) within the orchard at a height of 3 mand (b) adjacent to the orchard at a height of 2 m Arrows show optimum values
This could be because the thermocouples were not installed on theface perpendicular to the sun at this time of day or because Eq (2)overestimates the strength of the solar beam at high solar zenithangles Thirdly UV-B levels are low and likely to cause much lessdamage at the same fruit temperature than earlier in the afternoonbecause after 1700 h UV-B levels declined to less than 25 of that atmidday Morning spikes in simulated Tfrmx were noted until 1000 hafter which wind speeds tended to increase and spikes no longeroccurred Sun damaged apples were observed on the eastern sideof the row but we were unable to determine the time this damageoccurred because our equipment was installed on the western sideof the row It is unlikely temperatures above the damage thresholdswould occur prior to 1000 h or after 1700 h without also occurringbetween these times Since predicted Tfrmx in the early morning orlate afternoon and evening is poorly validated and less likely to bedamaging we suggest that only values between 1000 and 1700 hshould be used in long term modelling
It should be noted that these times are in Eastern AustralianStandard Time and that solar noon at this site occurred at 1230 hbecause it is 474 west of the centre of the time zone Appropriateadjustments would need to be made for other sites such as outlinedby Allen et al (1998)
The sensitivity analysis showed that among plant parameters had the largest effect on Tfrmx Most previous studies that reported did not indicate how the value was measured The only sourcethat reported methods was Merzlyak et al (2003) who undertookmeasurements post-harvest Across the visible range averaged035 for dark coloured apples to 045 for pale apples Commercially-available clay sprays reduce Tfrmx by increasing particularly at
Fig 7 Supplementary site measured (blue) and simulated (red and orange) fruitsurface temperature of the hottest face of sun-exposed fruit (Tfrmx) and orchard airtemperature (green) Simulated Tfrmx calculated from wind speeds (a) in a clear-ing surrounded by orchards and f = 045 (optimised to the main site) and (b) at anexposed site at Tatura and f = 092 (optimised to this data set) Simulated temper-atures are shown in red between 1400 and 1700 h and orange at other times (Forinterpretation of the references to colour in this figure legend the reader is referredto the web version of this article)
shorter wavelengths that are more damaging to the skin (Gindabaand Wand 2005) In our study we initially used an value of 055which resulted in an optimum f value of 07 whereas using a moredefensible value of 04 resulted in an optimum f value of 045 Whilein a semi-empirical model an inappropriate value of one parameteris resolved by a compensating calibration factor there are risks thatthe model performs poorly under conditions that differ from its cal-ibration because the physical processes are not simulated correctlyTo resolve this area of uncertainty there is need to undertake morecomprehensive measurements of during fruit development andover a wider range of wavelengths
43 Effects of hail netting
Hail netting reduced the fruit temperature by 15ndash30 C acrossmost of the probability distribution but for the hottest fruit ateach site within the orchard the difference was 40 C The mech-anism for this effect of netting was by reducing the intensity ofthe solar beam by interception and scattering while allowing goodair flow to enable transfer of heat from the fruit surface to theair The netting structure at the study site represented an idealdesign for minimising sun damage because it was installed highabove the tree canopy and had open sides minimising interfer-ence to air circulation within the orchard and air exchange withthe outside Despite this design the netted orchard had internalwind speeds that averaged 22ndash24 lower than the non-netted siteaveraged across all afternoons in January 2013 (Tables 4 and 5) A
MR McCaskill et al Agricultural and Forest Meteorology 226ndash227 (2016) 148ndash160 159
wide range of designs are used commercially including temporarynets placed over the trees retractable netting installed on struc-tures above the tree canopy and fixed netting with closed or opensides (Lolicato 2011) Some designs could potentially exacerbaterather than reduce sun damage if wind is substantially reduced Thesensitivity analysis showed that if netting caused a 25 reductionin wind speeds this could without other changes to the heat bal-ance increase fruit temperatures by 22 C To maintain fruit surfacetemperatures equivalent to the non-netted orchard would requireeither a decrease in total radiation of 16 or if total radiation isunchanged the proportion in the diffuse form needs to increase by58 Until recently hail protection has been the primary rationalefor investment in netting followed by protection from fruit batsand birds Where the latter is required the sides would need to beclosed but this could reduce internal v leading to increased fruittemperatures From principles developed in this study a designthat uses a more open netting on the sides would minimise theseproblems
While the netting intercepted only 10ndash11 of Rs at solar noonthis is not the time maximum protection is required for two rea-sons Firstly the NNW-SSE row orientation and training structuremeant that a high proportion of fruit were shaded by leaves at thistime of the day Secondly air and fruit temperatures on hot daystend to peak in the late afternoon Our study showed that peakfruit surface temperatures occurred between 1600 and 1700 h atwhich time netting intercepted and scattered a greater proportionof Rs than at midday Protection from radiation at solar noon wasconsistent with its 10 shade rating but at 1620 h when the solarangle was 52 its shading effect was greater (15ndash20) and therewas an even greater reduction in radiation perpendicular to thefruit surface at the hot spot (26) Excessive shading needs to beavoided because it reduces the development of red colour in thefruit (Gindaba and Wand 2005) The main protection from sundamage is therefore required between approximately 1600 and1700 h when netting is over twice as effective in controlling thesurface heating effect of the sun than would be expected from itsshade specifications For this reason hail netting with a 10 shaderating represents a good compromise between protection from hailand sun damage while minimising its effects on fruit colour devel-opment
Our data are a comprehensive comparison of microclimate withand without netting From it we were able to develop equations topredict the netted microclimate from external measurements butthese are only directly applicable to the particular design colourand weave type at the study site Predictive equations could beobtained over a relatively short period (two weeks) through theuse of 10 min data which for radiation were based on measuredRs relative to Ra (as recommended by Spitters et al (1986)) andthe air mass number as a representation of the sun angle Thesound physical basis of these equations means the approach shouldbe applicable to developing relationships for other structures andweave types from relatively short periods of data However thephysical nature of this modelling approach is also a weaknessbecause a large amount of weather data must be assembled attime scales of at least hourly in addition to site-specific rela-tionships between wind measurement locations and fruit surfacetemperature The role of this level of modelling is in understandingprocesses and quantifying the effects of various netting structureswhich can differ in weave type colour height and the presence orabsence of side netting For many applications a simpler approachwould be more suitable For example Darbyshire et al (2015) useddata from our study to identify the external air temperature atwhich fruit surface temperature exceeded a sunburn browningthreshold in 10 of monitored fruit This was determined as 379 Cwith netting and 341 C without netting These thresholds werethen used to assess the benefits of netting in Australiarsquos apple grow-
ing regions for a range of climate change scenarios (Darbyshireet al 2015 Webb et al 2016) Their findings are however spe-cific to the netting design used in our study and the approach islimited in investigating the effects of other management optionssuch as canopy architecture row orientation leaf density and theirinteraction with netting design
Netting was associated with other changes to the agro-ecological environment including reduced ETo higher humidityand lower wind speeds Under netting ETo was 13 lower thanat the non-netted site which would lead to a reduced irrigationrequirement The combination of higher humidity and lower v isa potential disbenefit because it is associated with a longer dura-tion of leaf wetness (Kim et al 2002) which in turn leads to ahigher disease risk The most economically significant disease ofapples is apple scab (Venturia inaequalis) which is a fungus that forlight infection requires at least 12 h of continuous leaf wetness at13 C and longer periods at lower temperatures (Vaillancourt andHartman 2000) The netted environment therefore had a benefitthrough a lower irrigation requirement but there was also a dis-benefit through a greater risk of fungal diseases that may requiremore frequent control measures
5 Conclusions
This study found that netting was able to reduce the median fruitsurface temperatures by 15ndash20 C The mechanism for this effectof netting was by reducing the intensity of the solar beam by inter-ception and scattering while allowing sufficient air flow to enabletransfer of heat from the fruit surface to the air An adaptation ofa previously published thermodynamic model was able to accountfor these differences with an RMSE of 2ndash3 C in the afternoon whensun damage most commonly occurs but in the morning or earlyevening it appeared to over predict fruit temperatures during timesof low wind speed
Acknowledgements
This project was funded by the Department of Economic Devel-opment Jobs Transport and Resources (DEDJTR) the AustralianGovernment Department of Agriculture and Horticulture Innova-tion Australia Limited using the apple and pear industry levy andmatched funds from the Australian Government We thank JoergKlein (Geoffery Thompson Orchards Pty Ltd) for permitting us touse their orchard We also thank Eileen Perry and Des Whitfield(DEDJTR) for valuable discussions during the development of thispaper
References
Allen RG Pereira LS Raes D Smith M 1998 CropEvapotranspirationmdashGuidelines for Computing Crop WaterRequirementsmdashFAO Irrigation and Drainage Paper 56 Food and AgriculturalOrganisation of the United Nations Rome
Bergh O Franken J Van Zyl EJ Kloppers F Dempers A 1980 Sunburn onapples preliminary results of an investigation conducted during the 1978ndash79season Deciduous Fruit Grower 30 8ndash22
Cola G Failla OK Mariani L 2009 BerryTonemdasha simulation model for the dailycourse of grape berry temperature Agric For Meteorol 149 1215ndash1228
Darbyshire R McClymont L Goodwin I 2015 Sun damage risk of Royal Galaapple in fruit-growing districts in Australia New Zeal J Crop Hortic Sci 43 (3)222ndash232
Donsi G Ferrari G Nigro R 1996 Experimental determination of thermalconductivity of apple and potato at different moisture contents J Food Eng 30263ndash268
Evans RG 2004 Energy balance of apples under evaporative cooling Trans ASAE47 1029ndash1037
Gindaba J Wand JE 2005 Comparative effects of evaporative cooling kaolinparticle film and shade net on sunburn and fruit quality in apples HortScience40 592ndash596
Green S Goodwin I Cornwall D 2011 Over-tree sprinkler cooling to reducesunburn on fruit Aust Fruitgrow 5 (10) 12ndash14
160 MR McCaskill et al Agricultural and Forest Meteorology 226ndash227 (2016) 148ndash160
Jacobson MZ 2005 Fundamentals of Atmospheric Modeling 2nd ed CambridgeUniversity Press p 317
Kasten F Young AT 1989 Revised optical air mass tables and approximationformula Appl Opt 28 4735ndash4738
Kim KS Taylor SE Gleason ML Koehler KJ 2002 Model to enhancesite-specific estimation of leaf wetness duration Plant Dis 86 179ndash185
Li L Peters T Zhang Q Zhang J Huang D 2014 Modeling apple surfacetemperature dynamics based on weather data Sensors 14 20217ndash20234
Lisowa H Wujec M Lis T 2002 Influence of temperature and variety on thethermal properties of apples Int Agrophys 16 43ndash52
Lolicato S 2011 Sun Protection for Fruit a Practical Manual for PreventingSunburn on Fruitmdash2011 Department of Primary Industries Farm ServicesVictoria Division Melbourne Australia
Merzlyak MN Solovchenko AE Gitelson AA 2003 Reflectance spectralfeatures and non-destructive estimation of chorophyll carotenoid andanthocyanin content in apple fruit Postharvest Biol Technol 27 197ndash211
NetPro 2010 Product Data Sheet Commercial Horticultural Shade Cloth (accessed220615) httpwwwnetprocanopiescomdocuments-pdfproductsheetsDataSheets OzSmartShade CommHortRangepdf
Nobel PS 1975 Effective thickness and resistance of the air boundary layeradjacent to spherical plant parts J Exp Bot 26 120ndash130
Racsko J Schrader L 2012 Sunburn of apple fruit historical background recentadvances and future perspectives Crit Rev Plant Sci 31 455ndash504
Sauderau M Sinoquet H Santin O Marquier A Adam B Longuenesse JJGuilioni L Chelle M 2007 A 3-d model for simulating the spatial andtemporal distribution of temperature within ellipsoid fruit Agric ForMeteorol 147 1ndash15
Schrader LE 2011 Scientific basis of a unique formulation for reducing sunburnof fruits HortScience 46 6ndash11
Schrader LE Zhang J Duplaga WK 2001 Two Types of Sunburn in AppleCaused by High Fruit Surface (peel) Temperature Plant Health Progress(accessed 020616) httpswwwplantmanagementnetworkorgpubphpresearchsunburn
Schrader L Zhang J Sun J 2003 Environmental stresses that cause sunburn ofapple Acta Hortic 618 397ndash405
Schrader L Sun J Zhang J Seo J Jedlow L Felicetti D 2004 Fruit SkinDisorders Proc 100th Annu Meeting Washington State Hort Association p 4(last accessed 160212) httppostharvesttfrecwsueduPC2004Epdf
Schrader LE Sun J Zhang J Felicetti D Tian J 2008 Heat and light-inducedapple skin disorders causes and prevention Acta Hortic 772 51ndash58
Smart RE Sinclair TR 1976 Solar heating of grape berries and other sphericalfruits Agric Meteorol 17 241ndash259
Spitters CJT Toussaint HAJM Goudriaan J 1986 Separating the diffuse anddirect component of global radiation and its implications for modelling canopyphotosynthesis Part 1 Components of incoming radiation Agric ForMeteorol 38 217ndash229
Thorpe MR 1974 Radiant heating of apples J Appl Ecol 11 755ndash760Vaillancourt LJ Hartman JR 2000 Apple Scab The Plant Health Instructor The
American Phytopathological Society httpdxdoiorg101094PHI-I-2000-1005-01 (accessed 120315) httpwwwapsnetorgedcenterintropplessonsfungiascomycetesPagesAppleScabaspx
Webb L Darbyshire R Erwin T Goodwin I 2016 A robust impact assessmentthat informs actionable climate change adaptation future browning-risk inapple crops Int J Biometeorol (accepted)
Wuumlnsche JN Greer DH Palmer JW Lang A McGhie T 2001 Sunburnmdashthecost of a high light environment Acta Hortic 557 349ndash356
ORIGINAL PAPER
A robust impact assessment that informs actionable climatechange adaptation future sunburn browning risk in apple
Leanne Webb1amp Rebecca Darbyshire1 amp Tim Erwin2
amp Ian Goodwin3
Received 18 October 2015 Revised 21 October 2016 Accepted 22 October 2016 ISB 2016
Abstract Climate change impact assessments are predomi-nantly undertaken for the purpose of informing future adapta-tion decisions Often the complexity of the methodology hin-ders the actionable outcomes The approach used here illus-trates the importance of considering uncertainty in future cli-mate projections at the same time providing robust and sim-ple to interpret information for decision-makers By quantify-ing current and future exposure of Royal Gala apple to dam-aging temperature extremes across ten important pome fruit-growing locations in Australia differences in impact to ripen-ing fruit are highlighted with by the end of the twenty-firstcentury some locations maintaining no sunburn browningrisk while others potentially experiencing the risk for the ma-jority of the January ripening period Installation of over-treenetting can reduce the impact of sunburn browning The ben-efits from employing this management option varied acrossthe ten study locations The two approaches explored to assistdecision-makers assess this information (a) using sunburnbrowning risk analogues and (b) through identifying hypo-thetical sunburn browning risk thresholds resulted in varyingrecommendations for introducing over-tree netting These rec-ommendations were location and future time period depen-dent with some sites showing no benefit for sunburn protec-tion from nets even by the end of the twenty-first century andothers already deriving benefits from employing this
adaptation option Potential best and worst cases of sunburnbrowning risk and its potential reduction through introductionof over-tree nets were explored The range of results presentedhighlights the importance of addressing uncertainty in climateprojections that result from different global climate modelsand possible future emission pathways
Keywords Extreme temperature Sunburn browning
Netting Horticulture Pome fruit Climate projections
Introduction
The purpose for undertaking most climate change impactassessments should be to inform adaptation decisions orprompt action for greenhouse gas mitigation Many impactassessments however are not solution-focused nor do theyrespond to end-user perspectives (Kiem and Austin 2013) Inpresenting their results to end-users and decision-makers thescience community often focuses on exploring and explainingsubjects such as uncertainties in climate projections whichcan over-complicate the advice Here an approach is outlinedthat aimed to provide robust yet simple results to enable ac-tionable decisions while also including the uncertainty in fu-ture climate projections
An increase in the occurrence of extreme heat events hasbeen observed historically in Australia (Alexander et al 2007Trewin and Smalley 2013) The apple industry which had a2014ndash2015 gross value of $AU550 million (ABS 2016) isparticularly vulnerable to these extreme heat events as high airtemperatures and solar radiation exposure cause lsquosunburnbrowningrsquo a brown spot on the sun-exposed side of the fruitwith affected fruit unmarketable (Schrader et al 2003a bThomson et al 2014 Racsko and Schrader 2012) For examplea heat wave event in January 2009 in south-east Australia
Rebecca Darbyshirerebeccadarbyshiredpinswgovau
1 Faculty of Veterinary and Agricultural Science University ofMelbourne Parkville VIC Australia
2 CSIRO Oceans and Atmosphere PMB 1 Aspendale VIC Australia3 Department of Economic Development Jobs Transport and
Resources Tatura Australia
Int J BiometeorolDOI 101007s00484-016-1268-y
resulted in large yield losses due to sun damage approximatedat between 30 and 70 of the crop (Thomson et al 2014)Under anthropogenic climate change increases in the intensityfrequency duration and spatial extent of extreme temperaturesin Australia are expected (Alexander and Arblaster 2009CSIRO and BoM 2015 IPCC 2012) potentially increasingthe risk of sunburn damage
Given this potential risk many fruit-growing districts inAustralia will likely need to implement adaptation strategiesto minimise potential sun damage (Thomson et al 2014) Oneadaptation option is to use over-tree netting to protect fruit fromextreme conditions (Fig 1 left) In a recent study Darbyshireet al (2015) determined minimum air temperature thresholdsthat can result in sun damage of lsquoRoyal Galarsquo apple in non-netted and netted orchards Their assessment employed thermo-couple sensors under the fruit skin (Fig 1 right) in combinationwith air temperature sensors They identified air temperaturethresholds of 341 and 379 degC that correlate to minimumFST thresholds that can cause sunburn browning in nettedand non-netted orchards respectively To evaluate the use ofover-tree netting as an adaptation strategy to reduce the risk ofsun damage this climate change impact study presents a meth-od that minimised the potential number of descriptive climateprojections to produce results aimed at informing adaptive ac-tions This was evaluated considering the frequency of exceed-ance of threshold air temperatures now and in future periods fornon-netted and netted orchards Current (centred on 1995) andprojected threshold exceedance centred on 2030 and 2050aligningwith orchardistsrsquo shorter andmid-term planning frame-works respectively was evaluated In addition a period centredon 2090 was assessed to align with long-term strategicplanning
To address the demand for regionally relevant climatechange information (Kiem and Austin 2013) ten locations im-portant for pome fruit production in Australia covering a broadgeographical extent and corresponding range of underlying cli-mates were assessed One significant advantage to studyingmultiple locations in an impact assessment is that areas thatexperience similar climatic conditions but which may be sep-arated in space or time (ie with past or future climates) can beidentified ie climate analogues (Whetton et al 2013) This canbe helpful when considering adaptation strategies to a changing
climate (Hallegatte et al 2007 Webb et al 2013) a techniquethat will be demonstrated in this study
For adaptation actions to be effective comprehensive andplausible representation of the future climate is required to in-form the projection results The recently published Australianclimate change projections are based on the full body of knowl-edge of the climate system and the most up to date perspectiveon how the current climate may change under enhanced green-house gas concentrations (CSIRO and BoM 2015) These pro-jections of the future climate were informed by 40 CoupledModel Intercomparison Project 5 (CMIP5) (Meehl and Bony2011) global climate models (GCMs) simulating the climateresponse to a range of plausible scenarios of how greenhousegases and aerosols may change throughout the twenty-first cen-tury (Van Vuuren et al 2011) termed RepresentativeConcentration Pathways (RCPs)
The use of over-tree netting as a climate adaptation optionfor Royal Gala apple was used as an example to demonstrate amethod that simplifies complex climate projection informationin a manner that promotes climate adaptation uptake whileretaining scientific robustness Evaluating the potential benefitof installing netting to reduce apple sunburn risk is a useful casestudy as financial loss can be significant from extreme heatevents and netting is a clear implementable management op-tion The method used best-case and worse-case climate sce-narios for several future time periods to evaluate future sunburnbrowning risk with and without the adaptation option ofinstalling netting This was applied Australian wide to tengrowing districts to evaluate the adaptation option under futureclimates and across various site climate conditions The resultswere interpreted using several different approaches includingclimate analogues and considering different levels of growerrisk aversion
Materials and methods
Locations and regions assessed in the study
Climate data were selected from ten locations that represent themain commercial apple-growing regions in Australia Thesewere Applethorpe in Queensland Donnybrook and Manjimup
Fig 1 A netted lsquoRoyal Galarsquo apple orchard in Shepparton Victoria (left) Royal Gala apples with evidence of sunburn browning damage (centre) and athermocouple sensor placed under the fruit skin of a Royal Gala apple to measure fruit surface temperature (right)
Int J Biometeorol
in Western Australia Lenswood in South Australia Batlow andYoung in New South Wales Tatura and the Yarra Valley inVictoria and Spreyton and Huonville in Tasmania (Fig 2)These locations were in two broad regions identified in a studyby CSIRO and BoM (2015) based on their climate change re-sponse denoted as either the Central Slopes or SouthernAustralia
Recent climate projections for Australia were regionalisedaccording to logical groupings of recent-past climatic condi-tions biophysical factors and expected broad patterns of cli-mate change (CSIRO and BoM 2015) The ten study locationsare contained in two of these regions Central Slopes andSouthern Australia (Fig 2) Temperature projection resultsfrom these two regions were used to inform selection ofGCMs for this assessment
Projection methods
Analyses were conducted using daily maximum temperature(Tmax) for January when most sun damage is incurred forRoyal Gala apple following Darbyshire et al (2015) It wasimportant to set the context in this climate change impact as-sessment by including historical risk therefore allowing thechange in risk to be investigated In this study historical riskwas analysed using a 30-year baseline period centred on 1995(1981ndash2010) using gridded (005deg by 005deg) daily JanuaryTmax data obtained from the Australian Water AvailabilityProject (AWAP) (Jones et al 2009) Henceforth this 30-yearhistorical range is referred to as 1995
Future daily Tmax conditions were assessed in the studywith the aim to capture the range of climate projectionsresulting from the future range of RCPs and correspondingrange of CMIP5 GCM output To achieve this a subset ofRCPs and GCMs were identified and combined to createlsquobest-casersquo and lsquoworse-casersquo future climate scenarios The se-lection of RCPs GCMs and the method used to include day-to-day natural variability is detailed below
Emission pathways
Two RCPs (Moss et al 2010 Van Vuuren et al 2011) wereselected to include the likely future range in emissions
1 RCP45 An intermediate pathway which represents afuture where carbon dioxide (CO2) emissions peakaround 2040 and strong mitigation of emissions occursin the latter half of the century CO2 concentrations reach540 ppm by 2100 This scenario is similar to the SpecialReport on Emissions Scenarios (SRES) B1 scenario(Nakićenović and Swart 2000)
2 RCP85 A high pathway which represents a future withlittle curbing of emissions where the CO2 concentrationcontinues to rapidly rise reaching 940 ppm by 2100Current CO2 concentration analysis indicates that we aretracking along this trajectory (Peters et al 2012) Thispathway is similar to the SRES A1FI scenario (Rogeljet al 2012)
Fig 2 Australian pome fruit-growing locations (black dot) areshown in context of Australianstates (capital letters Victoriaabbreviated to Vic) The regionsdefined in CSIRO and BoM(2015) used for model selection inthis study are Southern Australia(dark grey) and Central Slopes(light grey)
Int J Biometeorol
Selecting GCMs
The 40 GCMs available from the CMIP5 were investigated toselect GCMs that best defined the projected range in Tmax forthe two regions (Fig 2) These were selected by analysingsummer (harvest season) Tmax projections for all 40 GCMsover three time periods 2030 (2016ndash2045) 2050 (2036ndash2065) and 2090 (2075ndash2104) (henceforth referred to as2030 2050 and 2090) and the two identified RCPs (40GCMs for RCP85 and 38 GCMs for RCP45) using theAustralian Climate Futures approach (Clarke et al 2011Whetton et al 2012) For each region this approachcategorised and then ranked projected increases in summerTmax GCM output using a multivariate ordering technique(Kokic et al 2002) After ranking only 26 GCMs of the 40were considered for inclusion in the assessment as the remain-ing 14 have been found to perform poorly across a number ofmetrics for Southern Australia (Moise et al 2015)
This assessment found that two GCMs CanESM2 andMIROC5 best described the range in projected summerTmax increases for both the Southern Australian and CentralSlopes regions (Table 1) Across both regions the CanESM2model was consistently warmer than the ensemble meanwhile the MIROC5 model was consistently cooler than themean While these GCMs were not always the absolute leastor most warming for each time period and RCP in the definedregions across the range of future scenarios being consideredthey represented the range well
Using these selections of RCPs and GCMs best-case andworst-case future scenarios were constructed to capture therange of climate projection uncertainty The best-case scenariowas constructed using MIROC5 forced by RCP45 and theworse-case scenario was similarly constructed usingCanESM2 and RCP85 As such reliance on using GCMnames and emission pathway terminology was removed
Representing natural variability in the projected Tmax timeseries
To create future daily Tmax time series projected averagemonthly January Tmax change values centred on 20302050 and 2090 for the best-case and worst-case scenarioswere added to the AWAP observed January daily Tmax timeseries (1981 to 2010) To capture the most reliable estimateof location-specific natural climate variability the baselineTmax time series was contrived to extend for the longestpossible period 30 years while remaining centred on1995 (CSIRO and BoM 2015) In this way the influenceof decadal shifts that may skew the lsquonormalrsquo climatologysuch as the Australian Millennium drought (Dijk et al2013) was minimised By using this approach the futurevariability in each scenario was the same as the underlyingnatural baseline temperature variability
Assessment of sunburn browning risk
For all locations the 10th 50th and 90th percentile of a 30-year time series of the number of days in January that Tmaxexceeded 341 degC (sunburn browning non-netted) and 379 degC(sunburn browning netted) (Darbyshire et al 2015) were gen-erated using the baseline (1995) period and each of the futureperiods (2030 2050 and 2090)
The entire plausible range of days exceeding the thresholdor sunburn browning risk (days) for each future time periodwas captured by incorporating results across the best-case andworst-case scenarios
The potential benefit of netting measured as a reduction inthe number of sunburn browning risk days was evaluated Tointerpret this reduction in terms of benefit of netting two riskcases were identified
1 Risk-sensitive Netting was introduced if the maximum(90th percentile) number of days in a 30-year periodexperiencing sunburn browning risk was greater than20 of days in the month (ie 6 days)
2 Risk-tolerant Netting was introduced if the median (50thpercentile) number of days in a 30-year period experienc-ing sunburn browning risk was greater than 20 of daysin the month (ie 6 days)
Use of lsquosunburn browning riskrsquo analogues
An alternative method to assist decision-makers regarding thetiming of introduction of over-tree nets is to identify a locationwhere the threshold was already exceeded ie where over-treenetting is already employed to minimise sunburn browningrisk Decision-makers will decide to introduce over-tree netsonce the climate becomes similar or analogous to the identi-fied location To assist with using this approach sunburnbrowning risk analogues were identified across the ten studylocations for 2030 2050 and 2090
To define sunburn browning risk analogues sunburn brow-ning risk was categorised and colour coded as in Table 2
Results
Historical (1981ndash2010) daily January Tmax ranges for the tenstudy locations indicated that Spreyton and Huonville werethe coolest locations with the warmest locations beingDonnybrook and Young (Fig 3 also see Fig 2 map)Exceedance of non-netted (341 degC) and netted (379 degC) sun-burn browning air thresholds for the period 1981ndash2010 oc-curred where the boxplot crossed the indicative lines
Int J Biometeorol
Current and projected sunburn browning risk
The current (1995) and future (2030 2050 and 2090) medi-an (10th and 90th percentile in brackets) sunburn browningrisk (days) for non-netted trees at the ten study locations isdescribed in Table 3 To simplify the results the range in-cluded both best-case and worse-case scenarios for eachtime period
The median number of sunburn browning risk daysfor the 1995 period varied with location from no dam-age at Spreyton through to 3 days for Lenswood 7 daysfor Donnybrook and 9 days for Young The maximumexceedance in any 1 year through this period was 16 daysrecorded at Young (in the years 1988 2003 2006 and2009)
For Tatura a key growing district median sunburn brow-ning risk of approximately 9 days was projected by 2030This could be up to 16 days in hottest years under a worst-case scenario but in coolest years and best-case scenarioonly 3 days would be expected to exceed the sunburn brow-ning threshold temperature In contrast under both best-caseand worst-case scenarios and across the natural variabilitySpreyton remained largely risk-free through to 2090(Table 3)
To compare the sunburn browning risk between locationsand for future time periods instances with similar mediansunburn browning risk were colour-coded in Table 3 Theseshadings indicate sunburn browning risk analogues For ex-ample the current sunburn browning risk at Young (medianof 9 days per month) is expected at Tatura in 2030 while the
current risk at Tatura (6 days per month) is expected atLenswoodManjimupBatlow and theYarraValley by 2090
Reduced sunburn browning risk through installationof over-tree nets
Sunburn browning risk (days) with the installation of over-tree netting was evaluated (Table 4) With nets in place atTatura the maximum exposure for 2030 was halved to ap-proximately 8 days for the hottest projected years and aworse-case projection scenario (163 days Table 3 vs84 days Table 4) By 2090 in Young where up to 249 daysof sunburn browning risk was experienced in the hottestyears and under a worst-case scenario (no nets Table 3)sunburn browning risk nearly halved to approximately14 days with over-tree nets in place (Table 4) which is sim-ilar to current risk at Young in the hottest years under aworst-case scenario for non-netted trees (Table 3)
The reduction in sunburn browning risk (days) was calcu-lated by measuring the average difference in exposure withand without over-tree nets This is illustrated spatially sepa-rately for best-case and worst-case future scenarios for 2090(Fig 4) Tasmanian locations had little benefit from the in-stallation of nets with Spreyton indicating 0-day benefitAverage exposure in Huonville was reduced by approxi-mately 1 day under the best-case future scenario and up to2 days under the worst case For Manjimup a more than 5-day (on average) improvementwas realised through applica-tion of nets (worst case) or approximately 3 to 4 days (onaverage best case) In currently hot areas such as Young
Table 1 Projected change in summer Tmax (degC) for Southern Australia and Central Slopes regions (see Fig 2) for 20-year periods centred on 20302050 and 2090 relative to the the 20-year period centred on 1995 under RCP45 and RCP85 for CanESM2 andMIROC5 CMIP5 GCMs compared tothe ensemble mean and standard deviation of 40 (RCP85) and 38 (RCP45) GCMs
Southern Australia Central Slopes
2030 2050 2090 2030 2050 2090
Both RCPs RCP45 RCP85 RCP45 RCP85 Both RCPs RCP45 RCP85 RCP45 RCP85
CanESM2 12 15 25 22 48 09 20 30 27 54
MIROC5 09 12 14 18 27 05 11 15 19 28
Mean 10 15 19 20 38 11 16 21 24 41
Standard deviation 03 04 04 05 09 05 07 07 07 09
Table 2 Sunburn browning risk (days) for the month (top) and proportion of days in the month (bottom)
le 16 days 17 to 31 days 32 to 62 days 63 to 93 days 94 to 155 days ge 156 days
le 50 51 to 100 101 to 200 201 to 300 301 to 500 ge 501
Colour shading corresponds to periods and locations having these sunburn browning risk levels
Int J Biometeorol
nets reduced sunburn browning risk by 8 to 9 days (on aver-age best to worst case)
To evaluate potential decisions to install netting the resultswere interpreted for two risk cases
1 Risk-sensitive option (eg maximum sunburn browningrisk (90th percentile) gt6 days Table 3)
2 Risk-tolerant option (eg median sunburn browning risk(50th percentile) gt6 days Table 3)
Depending on the risk case selected nets were applied at dif-ferent locations and different time periods as shown in Table 5Under the risk-sensitive case nets were applied at more locationsand earlier For example it is only under the risk-sensitive case thatnets were applied in Batlow A further example at Manjimupindicated that nets would be installed in 2030 under the risk-sensitive case and not until 2090 under a risk-tolerant caseInstallation of netting will be beneficial even for the historicalperiod under either risk case in Young Donnybrook and Tatura
Discussion
The disconnect between defendable credible and legitimate cli-mate projection information and end-user requirements can actas a barrier to actionable climate adaptation recommendations(Kiem and Austin 2013) Indeed inability to ever fully resolveuncertainty in climate projections should not restrict decision-relevant information being provided to inform end-users
Presentation of context-specific best-case and worst-caseoutcomes can remove the barrier between the science and theend-user with the decision-maker having robust informationready for decision implementation In a critical first step tosimplifying the outcomes of this study two GCMs representa-tive of the range of change were selected (Clarke et al 2011Whetton et al 2012) Further to this RCP45 and RCP85 (VanVuuren et al 2011) were used to represent the range of plausi-ble future emission scenarios While a lower option (RCP26)was available for modelling this pathway was not consideredachievable given current global emission policy settings(Meinshausen et al 2009 Peters et al 2012) and was thereforenot assessed Combining the projection information scenariosfor the best case ie least-warmingGCMlowest emissionpathway and worst case ie most-warmingGCMhighestemission pathway were identified and presented This ensuredthat the full profile of climate projections was captured in asimplified manner without reducing the credibility of the re-sults or the relevance of potential decision options In doing soa great deal of unnecessary complexity in calculation and pre-sentation of data and results was avoided (Smith and Chandler2010) and climate science terminology minimised This ap-proach could be applied to other impact analyses using tem-perature change or extended to studies where both temperatureand rainfall are important with for instance best case identi-fied as least-warming and wettest and worst case most-warming and driest future scenario
Note that results need to be interpreted across the range ofthe best-case and worse-case scenarios Employing only oneGCM or RCP in an impact assessment can inadvertently leadto potentially flawed adaptation decisions For example atApplethorpe by 2090 and under the best-case scenario a 15-day reduction to sunburn browning risk was achieved fromover-tree netting perhaps resulting in a decision not to installnets (see Fig 4) Under the worst-case scenario with nearly 6-day reduction to sunburn browning risk nets could be consid-ered useful (Fig 4) Presenting the range of best-case andworst-case projections gives end-users the opportunity to makea better-informed decision by appreciating the range of likelyoptions
In this assessment only some growing locations are at riskof sunburn browning under current and future climates Forexample for the Tasmanian locations of Huonville andSpreyton sunburn browning risk remains minimal rightthrough to the end of the century However for Young and
Young
Donnybrook
Tatura
Manjimup
Batlow
Applethorpe
Lenswood
Yarra Valley
Huonville
Spreyton
Maximum temperature (1981 - 2010) deg C
40302010
Fig 3 Boxplot showing daily January maximum temperature (degC) for1981ndash2010 for the ten locations in the study (also see Fig 2 map) Theinterquartile range (IQR) of the sample is indicated by the height of thebox the sample median (the horizontal bar) and 15 times IQR (thewhiskers) with outliers (the lsquoorsquo) Tmax thresholds (the horizontal solidlines) are given for sunburn risk (non-netted) 341 degC and sunburn risk(netted) 379 degC
Int J Biometeorol
Tatura by mid-century over a third of days in the harvestmonth could pose a sunburn browning threat
Over-tree netting is an effective option for reducing sunburnbrowning risk (Smit 2007 Smit et al 2008 Solomakhin andBlanke 2010) and was found in this study to notably reducesunburn browing risk for most growing districts Adaptationplanning to determine the time period in which nets could beintroduced to reduce sunburn browning risk was explored Thiscan be informed by using analogues of current and future expo-sure to extreme heat events (Webb et al 2013) For example theexposure to damaging heat events currently experienced inTatura is likely to be the same as that projected for Lenswoodby 2050 or Batlow by 2090 The benefit of future investment inover-tree nets for Lenswood or Batlow can be informed bylooking at current regional netting practises in Tatura
An alternative approach for informing future adaptationplanning decisions was presented using two hypothetical riskprofiles a risk-sensitive and a risk-tolerant Using this ap-proach nets would be recommended to be installed at differ-ent locations at different times through the twenty-first centu-ryWhile this example was informative individual risk assess-ment will likely change with appetite for business risk growerexperience and financial position A benefit-cost analysiswould assist with this decision-making An assessment ofthe economics of installing nets in the current climate inEurope for example showed that they were not economicallybeneficial (Iglesias and Alegre 2006) This would certainlyapply in Tasmania where the cost of netting would exceedcrop loss due to sunburn browning For other locations thebenefit-cost ratio would vary and could be estimated both
Table 3 Median (10th to 90th percentile in brackets) sunburn browning risk (days) for ten Australian pome fruit-growing locations for 30-year periodscentred on 1995 2030 2050 and 2090
Location 1995 2030 2050 2090
Spreyton 00 (00 to 00) 00 (00 to 00) 00 (00 to 00) 00 (00 to 03)
Huonville 00 (00 to 20) 10 (00 to 27) 10 (00 to 29) 15 (00 to 32)
Yarra Valley 20 (00 to 77) 43 (06 to 92) 46 (06 to 95) 56 (13 to 105)
Lenswood 30 (10 to 70) 45 (16 to 94) 51 (18 to 102) 60 (28 to 107)
Applethorpe 00 (00 to 20) 03 (00 to 46) 10 (00 to 59) 30 (00 to 97)
Batlow 10 (00 to 40) 29 (00 to 77) 41 (00 to 95) 55 (03 to 126)
Manjimup 25 (00 to 50) 39 (01 to 72) 45 (11 to 77) 61 (21 to 95)
Tatura 60 (10 to 130) 94 (33 to 163) 104 (45 to 177) 130 (65 to 210)
Donnybrook 70 (30 to 110) 89 (32 to 139) 103 (41 to 154) 128 (71 to 184)
Young 90 (12 to 160) 133 (26 to 202) 154 (38 to 227) 178 (58 to 249)
Future sunburn browning risk incorporates potential best-case and worst-case results Sunburn browning risk categories and colour coding defined in theMaterials and methods section of this publication
Table 4 As for Table 3 with over-tree nets in place
Location 1995 2030 2050 2090
Spreyton 00 (00 to 00) 00 (00 to 00) 00 (00 to 00) 00 (00 to 00)
Huonville 00 (00 to 00) 00 (00 to 05) 00 (00 to 10) 03 (00 to 13)
Yarra Valley 00 (00 to 19) 09 (00 to 35) 13 (00 to 42) 19 (00 to 61)
Lenswood 10 (00 to 29) 15 (00 to 45) 18 (03 to 52) 23 (03 to 57)
Applethorpe 00 (00 to 00) 00 (00 to 05) 00 (00 to 10) 00 (00 to 20)
Batlow 00 (00 to 00) 00 (00 to 10) 01 (00 to 25) 06 (00 to 40)
Manjimup 00 (00 to 20) 00 (00 to 25) 05 (00 to 30) 14 (00 to 43)
Tatura 20 (00 to 59) 28 (00 to 84) 36 (03 to 94) 56 (08 to 126)
Donnybrook 10 (00 to 30) 20 (00 to 50) 30 (00 to 57) 50 (10 to 82)
Young 20 (00 to 59) 39 (00 to 90) 54 (05 to 115) 78 (11 to 142)
Int J Biometeorol
under current and future climates (not in the scope of thisstudy)
In further support of over-tree netting for use as an adaptationmeasure several additional benefits to reducing sunburn brow-ning risk such as reduced hail damage irrigation requirementincidence of bitter pit and apple scab decay after cold storage andfruit fly damage have been reported (do Amarante et al 2011)
Negative effects of installing netting have been reported includ-ing poorer skin colour (pale blush and a more intense greenbackground colour) higher soluble solid concentration (SSC)and increased starch Interestingly when tasting apple slices ofundamaged and sunburned fruit sunburned fruit were consistent-ly rated higher than undamaged fruit due to their higher SSC andlower tartaric acid concentration (Racsko and Schrader 2012)
Fig 4 The average reduction ofsunburn browning risk days for2090 resulting from using over-tree netting for best-case (top) andworst-case (bottom) scenarios
Int J Biometeorol
therefore processed (eg apple chips apple pie apple juice) orsemi-processed (eg fresh cut slices) forms of apple may showfuture promise for marketing sunburnt fruit
There are also community and social barriers andor incen-tives that need to be considered when deciding to install netsFor example in some regions in Australia (eg Yarra Valley)visual amenity of nets has restricted their introduction whereasin other areas (NSW) government financial incentives exist forgrowers wishing to install netting (NSW Government 2015)
Other adaptation measures to reduce exposure to sunburninclude evaporative cooling fruit bagging or particle films(Gindaba and Wand 2006 Racsko and Schrader 2012) Over-tree evaporative cooling systems based on pulsing water appli-cations can reduce sunburn while also reducing tree transpirationand irrigation requirements (Green et al 2012) However accessto water for this purpose needs to be considered (Evans 2004)especially for drought-prone areas like Australia Many physio-logical and cultural management practises can also influence theextent of sunburn browning in apples cultivar susceptibilitydevelopmental stage of fruit tree form and training systemrow orientation in the orchard growth vigour (rootstock prun-ing) and water stress (Racsko and Schrader 2012) Acclimationby previous exposure to high temperatures within the season canalso reduce the extent of sunburn damage (Racsko and Schrader2012)
This study aimed at providing information to assist with cli-mate adaptation The approach indicated an increase in the num-ber of days potentially suitable for the formation of sunburnbrowning damage Use of a threshold assessment linearlymassing lsquopotential damage daysrsquo or sunburn browning risk wasappropriate for climate projection application and providedgrowers with clear information on potential changes in sunburnbrowning risk Building a more complex model accounting forall additional aspects (UV wind speed humidity colour etc) of
individual fruit incorporating canopy structure modelling couldgo part way to estimating damage at particular growing pointsTo our knowledge such models have not been developedFurthermore combining these sorts of fine flux models(subdaily and very small spatial component) with climate pro-jection data would be misrepresentative Climate projectionmodels are unable to accurately resolve variables such as windspeed through complex landscapes and still require work inpredicting sequences of weather such as heat waves
Apples can respond to high-temperature stress even at ad-vanced stages of maturity by synthesising heat shock proteinswhich likely play an important role in protecting cellular biochem-ical processes during periods of stress (Ritenour et al 2001)Theoretically summer pruning and leaf thinning should be per-formed on cool overcast days when the forecast is for cloudyweather in following days to allow time for heat shock proteinsto accumulate prior to exposure to direct solar radiation Howeverthe timing and duration of exposure required to encourage produc-tion of heat shock proteins are not fully understood Slow progres-sive exposure may allow their protective build-up(Ritenour et al2001 Wuumlnsche et al 2004 Zhang et al 2003 Ma and Cheng2004 Edreva 2005) Future strategies may make better practicaluse of this knowledge by preparing fruit for sun exposure(Wuumlnsche et al 2001 Ritenour et al 2001)
There are other cultivars not commercially grown in Australiathat are more susceptible to sunburn browning For instancelsquoCameorsquo and lsquoHoneycrisprsquo were found to sustain damage at46 degC (Schrader et al 2003b) lower than that for Gala (478 degCSchrader et al 2001) Royal Gala was used in this assessment asproduction in Australia is high with production in 20072008 thethird highest behind Cripps Pink and Granny Smith (AustralianBureau of Statistics 2008)
Other forms of sunburn such as sunburn necrosis a more se-vere level of damage could also be considered using the frame-work outlined in this study Identification of air threshold temper-ature for sunburn necrosis on Royal Gala apple under nets wouldneed to be evaluated prior to such an analysis and highlights atopic for further study (Darbyshire et al 2015) The nature ofextreme heat events often occurring from less than 1 day to afew days at most requires use of special modelling techniques thatare not available directly from GCM output Projections fromGCMs are commonly produced at a monthly timescale with dailyoutput unable to be directly interpreted To overcome this differenttechniques that can produce locally relevant synthetic future dailydata can be used Thesemethods include usingweather generatorsstatistical downscaling the change factor method or dynamicaldownscaling There are pros and cons of these different ap-proaches and there is no one best method (CSIRO and BoM2015Wilby et al 2009) In this analysis the change factormethodwas used to generate a synthetic future daily temperature timeseries incorporating a local representation of natural variabilityuncertainty (Wilby et al 2009) This method involved applyingGCM-derived temperature changes to a higher spatial resolution
Table 5 Decision not to install nets (X) or to install nets () for a risk-sensitive case (maximum sunburn browning risk gt6 days Table 3) (left)and a risk-tolerant case (median sunburn browning risk gt6 days Table 3)(right)
Risk-sensitive Risk-tolerant
Location 2030 2050 2090 2030 2050 2090
Spreyton X X X X X X
Huonville X X X X X X
Yarra Valley X X X
Lenswood X X
Applethorpe X X X X X
Batlow X X X
Manjimup X X
Tatura
Donnybrook
Young
Int J Biometeorol
historical (or baseline) climatology 005deg spacing of longitude andlatitude The projected climatology (with an original spatial reso-lution of approx 15deg (or 150 km) therefore also takes on this finerresolution In this way a synthetic projected temperature climatol-ogy captures local topographical and coastal climate influences
One of the limitations with the change factor method is thatalthough the resultant scenario incorporates the detail of the sta-tion records as well as the average climate change of the speci-fied GCM grid box the scaled and the baseline scenarios onlydiffer in terms of their respectivemeans maxima andminima allother properties of the data such as the range and distributionremain unchanged (Wilby et al 2004) In support of the methodchosen this should pose minimal effect given that for most ofthe Australian region mean temperature change is broadly sim-ilar in magnitude and direction to extreme temperature change(CSIRO and BoM 2015) However in the southern coastal re-gions the increases in the annual and 1-in-20-year maximumsare a little higher than for the means This seems consistent withthe effect of hot winds from the interior providing an even greatertemperature contrast to those from across the ocean under thewarmer climates as examined by Watterson et al (2008) Inviewing the future exposure for locations in Southern Australia(Lenswood and Yarra Valley) this potential underestimateshould be acknowledged It should also be noted that the changefactor method is not advised for producing future rainfall timeseries where in some regions for example changes in extremerainfall are projected to increase even if mean rainfall is projectedto decrease (CSIRO and BoM 2015)
For this case study projected changes to extreme temperatureand the efficacy of over-tree netting in diminishing adverse ef-fects were explored in some detail In a broader assessment ofclimate change impacts on theAustralian apple industry it wouldbe naiumlve to ignore changes to other climate variables given thatthese crops are affected directly and indirectly by many climaticfactors Projections for rainfall evapotranspiration drought fireand wind are all of interest to the grower and have implicationsfor future viability of orchards The importance of these shouldnot be underestimated in terms of the croprsquos vulnerability andalsowith regards to orchard operational practises eg spraying inhot conditions Finally although often overlooked for agriculturalworkers human health as impacted by exposure to extreme heatshould also be considered (Kjellstrom et al 2009)
Conclusion
A methodology was outlined to provide action-oriented climateprojection information The adaptation decision to install over-tree netting to protect apples against sunburn was used as anexample The methodology simplified climate projection infor-mation to a range between best-case and worse-case scenariosThe results were presented in several ways to assist in decision-making including colour-coded analogues and a risk profile
approach For Australia heterogeneity in the benefit of over-tree netting was found geographically and into future time pe-riods The results highlight areas with little risk and hence noadaptation response is required through to areas at considerablerisk and a significant benefit for the installation of netting Thisapproach focussed on adaptation action founded on a robustscientific method can be used as a template for a diverse rangeof impact studies to provide climate projection information that iseasily transferrable into adaptation actions
Acknowledgements We acknowledge the World Climate ResearchProgrammersquos Working Group on Coupled Modelling which is responsi-ble for CMIP and we thank the climate modelling groups for producingand making available their model output For CMIP the US Departmentof Energyrsquos Programme for Climate Model Diagnosis andIntercomparison provides coordinating support and led development ofsoftware infrastructure in partnership with the Global Organisation forEarth System Science Portals
Craig Heady and Tim Bedin for work in preparation of the thresholdexceedance database (CSIRO) and PennyWhetton (CSIRO) for her thor-ough review of the manuscript
Compliance with ethical standards
Funding Funding for this research was provided by the AustralianDepartment of Agriculture and Water Resources
References
ABS (2016) 75030 - Value of Agricultural Commodities ProducedAustralia 2014ndash15 httpwwwabsgovauAUSSTATSabsnsfLookup75030Main+Features12014-15OpenDocument
Alexander L Hope P Collins D Trewin B Lynch A Nicholls N (2007)Trends in Australiarsquos climate means and extremes a global contextAustralian Meteorological and Oceanographic Journal 561ndash18
Alexander LV Arblaster JM (2009) Assessing trends in observed andmodelled climate extremes over Australia in relation to future pro-jections Int J Climatol 29417ndash435 doi101002joc1730
Australian Bureau of Statistics (2008) Agricultural survey apples andpears Australia 2007ndash08 Australian Government Canberra
Clarke JM Whetton PH Hennessy KJ (2011) Providing application-specific climate projections datasets CSIROrsquos climate futuresframework Paper presented at the MODSIM2011 19thInternational Congress on Modelling and Simulation PerthWestern Australia December 2011
CSIRO and BoM (2015) Climate change in Australia information forAustraliarsquos natural resource management regions technical reportCSIRO and Bureau of Meteorology Melbourne pp 222
Darbyshire R McClymont L Goodwin I (2015) Sun damage risk ofRoyal Gala apple in fruit growing districts in Australia N Z JCrop Hortic Sci 43222ndash232
Dijk AI Beck H Crosbie R et al (2013) The millennium drought inSoutheast Australia (2001ndash2009) natural and human causes andimplications for water resources ecosystems economy and societyWater Resour Res 491040ndash1057
do Amarante CVT Steffens CA Argenta LC (2011) Yield and fruit qual-ity of lsquoGalarsquo and lsquoFujirsquo apple trees protected by white anti-hail netSci Hortic 129(1)79ndash85
Int J Biometeorol
Edreva A (2005) The importance of non-photosynthetic pigments andcinnamic acid derivatives in photoprotection Agric EcosystEnviron 106135ndash146
Evans RG (2004) Energy balance of apples under evaporative coolingTransactions of the ASAE 471029ndash1037
Gindaba J Wand SJ (2006) Comparison of climate ameliorating mea-sures to control sunburn on lsquoFujirsquo apples In XXVII InternationalHorticultural Congress-IHC2006 International Symposium onEnhancing Economic and Environmental 772 2006 pp 59ndash64
Green S Goodwin I Cornwall D (2012) Evaporative cooling effects ontree transpiration In VII International Symposium on Irrigation ofHorticultural Crops 1038 2012 pp 401e-406
Hallegatte S Hourcade J-C Ambrosi P (2007) Using climate analoguesfor assessing climate change economic impacts in urban areas ClimChang 8247ndash60 doi101007s10584-006-9161-z
Iglesias I Alegre S (2006) The effect of anti-hail nets on fruit protectionradiation temperature quality and profitability of lsquoMondialGalarsquoapples J Appl Hortic 891ndash100
IPCC (2012) Managing the risks of extreme events and disasters to ad-vance climate change adaptation summary for policymakers Aspecial report of working groups I and II of the intergovernmentalpanel on climate change Cambridge University Press Cambridgeand New York
Jones DA Wang W Fawcett R (2009)High-quality spatial climate data-sets for Australia Australian Meteorological and OceanographicJournal 58233
Kiem AS Austin EK (2013) Disconnect between science and end-usersas a barrier to climate change adaptation Clim Res 5829ndash41
Kjellstrom T Holmer I Lemke B (2009) Workplace heat stress healthand productivitymdashan increasing challenge for low and middle-income countries during climate change Global Health Action 2103402ghav3402i34002047PMCID PMC2799237
Kokic P Breckling J Luumlbke O (2002) A new definition of multivariateM-quantiles In Statistical data analysis based on the L1-norm andrelated methods Springer pp 15ndash24
Ma F Cheng L (2004) Exposure of the shaded side of apple fruit to fullsun leads to up-regulation of both the xanthophyll cycle and theascorbate-glutathione cycle Plant Sci 166(6)1479ndash1486
Meehl GA Bony S (2011) Introduction to CMIP5 CLIVAR Exchanges164ndash5
Meinshausen M Meinshausen N Hare W et al (2009)Greenhouse-gasemission targets for limiting global warming to 2C Nature 4581158
Moise A Wilson L Grose M et al (2015) Evaluation of CMIP3 andCMIP5 models over the Australian region to inform confidence inprojections Australian Meteorological amp Oceanographic Journal(accepted)
Moss RH Edmonds JA Hibberd KA et al (2010) The next generation ofscenarios for climate change research and assessment Nature 463747ndash756 httpwwwnaturecomnaturejournalv463n7282suppinfonature08823_S1html
NakićenovićN Swart R (eds) (2000) Special report on emissions scenar-ios A special report of working group III of the intergovernmentalpanel on climate change Cambridge University Press Cambridgeand New York
NSW Government (2015) Farm innovation fund NSW Rural AssistanceAuthority Orange NSW
Peters GP Marland G Le Queacutereacute C Boden T Canadell JG Raupach MR(2012) Rapid growth in CO2 emissions after the 2008-2009 globalfinancial crisis nature Climate Change 22ndash4
Racsko J Schrader L (2012) Sunburn of apple fruit historical back-ground recent advances and future perspectives Crit Rev PlantSci 31455ndash504
Ritenour MA Kochhar S Schrader LE (2001) Characterisation of heatshock protein expression in apple peel under field and laboratoryconditions J Am Soc Hortic Sci 126(5)564ndash570
Rogelj JMeinshausenMKnutti R (2012) Global warming under old andnew scenarios using IPCC climate sensitivity range estimatesNature Cl im Change 2248ndash253 ht tp wwwna ture comnclimatejournalv2n4absnclimate1385htmlsupplementary-information
Schrader LE Zhang J Duplaga WK (2001) Two types of sunburn inapple caused by high fruit surface (peel) temperature Plant HealthProgress 101ndash5
Schrader L Sun J Felicetti D Seo J Jedlow L Zhang J (2003a)Stress-induced disorders Effects on apple fruit quality In Proceedings ofthe Washington Tree Fruit Postharvest Conference WenatcheeWashington USA 2003 p 7
Schrader LE Zhang J Sun J (2003b) Environmental stresses that causesunburn of apple Acta Hort 618397ndash405
Smit A (2007) Apple tree and fruit responses to shade netting MScDissertation University of Stellenbosch
Smit A Steyn WJ Wand SJE (2008) Effects of shade netting on gasexchange of blushed apple cultivars Acta Horticulturae 772
Smith I Chandler E (2010) Refining rainfall projections for the MurrayDarling Basin of south-East Australia-the effect of sampling modelresults based on performance Clim Chang 102377
Solomakhin A Blanke M (2010) The microclimate under colouredhailnets affects leaf and fruit temperature leaf anatomy vegetativeand reproductive growth as well as fruit colouration in apple AnnAppl Biol 156121ndash136
Thomson G McCaskill M Goodwin I Kearney G Lolicato S (2014)Potential impacts of rising global temperatures on Australiarsquos pomefruit industry and adaptation strategies N Z J Crop Hortic Sci 4221ndash30
Trewin B Smalley R (2013) Changes in extreme temperatures inAustralia 1910 to 2011 In 19th AMOS National ConferenceMelbourne 2013 pp 11ndash13
Van Vuuren DP Edmonds J Kainuma M et al (2011) The representativeconcentration pathways an overview Clim Chang 1095ndash31
Watterson IG McGregor JL Nguyen KC (2008) Changes in extremetemperatures of Australasian summer simulated by CCAM underglobal warming and the roles of winds and land-sea contrastsAustralian Meteorological and Oceanographic Journal 57195ndash212
Webb LB Watterson IG Bhend J Whetton PH (2013) Global climateanalogues for winegrowing regions in future periods projections oftemperature and precipitation Aust J Grape Wine Res 19331ndash341
Whetton P Hennessy K Clarke J McInnes K Kent D (2012) Use ofrepresentative climate futures in impact and adaptation assessmentClim Chang 115433ndash442 doi101007s10584-012-0471-z
Whetton PH Karoly D Watterson IG Webb L Drost F Kirono DMcInnes K (2013) Australiarsquos climate in a four degree world InChristoff P (ed) Four degrees of global warming Australia in a hotworld EarthscanRoutledge London pp 17ndash32
Wilby R Charles S Zorita E Timbal B Whetton P Mearns L (2004)Guidelines for use of climate scenarios developed from statisticaldownscaling methods
Wilby RL Troni J Biot Y Tedd L Hewitson BC Smith DM Sutton RT(2009) A review of climate risk information for adaptation and de-velopment planning Int J Climatol 291193ndash1215
Wuumlnsche JN Bowen J Ferguson I Woolf A McGhie T (2004) Sunburnon applesmdashcauses and control mechanisms XXVI internationalhorticultural congress key processes in the growth amp cropping ofDeciduous Fruit amp Nut Trees (ISHS) Acta Hortic 636631ndash636
Wuumlnsche JN Greer DH Palmer JW Lang A McGhie T (2001)Sunburn-the cost of a high light environment Acta Hortic 557349ndash356
Zhang J-G Liu Y-F Kochhar S Schrader LE (2003) Acclimation of fruitto high temperatures in relation to sunburn in gala apples 36(6)731ndash734 Sci Agric Sin 36(6)731ndash734
Int J Biometeorol
Western Australian Apple Netting Demonstration Site Susie Murphy White1 Rohan Prince2 and Lisa Starkie 3 1 Pomewest Manjimup WA 2 Department of Agriculture and Food Western Australia South Perth WA and 3 Department of Agriculture and Food Western Australia Manjimup WA
Disclaimer This publication may be of assistance to you but the State of Western Australia Pomewest and its employees do not guarantee that the publication is without flaw of any kind or is wholly appropriate for your particular purposes and therefore disclaims all liability for any error loss or other consequence which may arise from you relying on any information in this publication Acknowledgments This project was conducted as part of the apple and pear industry climate variability and climate change program and funded by Horticulture Innovation Australia using the apple and pear industry levy and matched funds from the Australian Government and the Department of Agriculture and Water Resources Collaborations with project partners from Victorian Department of Economic Development Jobs Transport and Resources University of Melbourne University of Tasmania Department of Agriculture and Fisheries Queensland and Department of Agriculture and Food Western Australia have contributed to the outcomes of these projects Additional financial support was provided by Department of Agriculture and Food Western Australia and the states Royalties for Regions to install the netting and evaluate the irrigation efficiency The authors would like to thank Maurie Ann Tim and Michelle Lyster of Lyster Orchards
Introduction
Climate predictions for the future include reduced winter chilling less rainfall and more extreme
high temperature incidents across the South West of Western Australia (Sudmeyer et al 2016 and
Reid 2010) Over tree netting (hail shade or bird netting) has been identified as a potential climate
change adaptation strategy due to the moderating effect of adverse climate conditions (Lolicato
2011) Netting reduces solar radiation and therefore a reduction in the amount of sun damaged
fruit The installation of over tree netting is one adaptation to climate change that can reduce the
impact of browning on apples (Darbyshire et al 2015) Protection from hail events can be achieved
by netting pome fruit orchards enabling the protection of fruit and trees (Middleton and McWaters
2002) The Pome fruit industry is already responding with significant investment in netting
infrastructure despite remaining practical questions on the use of hail netting particularly in warm
growing regions including the effect of different types of netting on temperature fruit quality and
yield (Bosco et al 2014 and Iglesias and Alegre 2006) The effectiveness of netting as a climate
change adaptation strategy in reducing fruit surface temperature under predicted climate change is
unknown
Data collected at the Western Australian netting demonstration site was set up to expand on
existing studies on the effects of netting on air temperature relative humidity wind and solar
radiation (Middleton and McWaters 2002 and Darbyshire et al 2015) The Western Australian
netting demonstration site aims to compare the effect of different coloured net on fruit yield quality
and environmental conditions under black and white net
The Western Australian netting demonstration site at Lyster Orchards Manjimup was constructed
in 2013 to demonstrate the benefits of netting under Western Australian conditions This
demonstration site was part of two nationally funded projects Crossing the Threshold Adaptation
tipping points for Australian Fruit Trees funded by Department of Agriculture and Water Resources
and Understanding Apple and Pear production systems in a changing climate funded by Horticulture
Innovation Australia
The site was set up as demonstration site with one replication of each treatment type 025 hectares
of black net 025 hectares white net and no net (figure 1) There were 10 random trees monitored
under each treatment from 2 rows
Figure 1 Western Australian netting demonstration site at Lyster Matijari Orchard
The aim of the project was to demonstrate the value of hail bird or shade netting as a means to
improve orchard productivity in high density production systems Particular attention was given to
assessing the impact of netting on fruit quality (sunburn wind burn and colour) The effects of black
and white netting on fruit quality (particularly colour) tree growth and chill accrual in the orchard
were compared to the no net treatment
Materials and Methods
The demonstration site Lysterrsquos Matijari Orchard is located 3km south of Manjimup on the South
West Highway Western Australia (3416oS and 11607oE) Half a hectare of a 12 ha commercial
Cripps Pink apple crop has been covered with 16mm quad netting to provide full exclusion to birds
plus shade and hail protection
Construction of the netting started in August 2013 and was completed by 28th October 2013 025ha
of black net provides a 23 percent reduction of both shade and UV radiation while 025ha of white
net provides a 20 percent reduction The white and black net area was compared to no net areas
The three treatment sites have been monitored from 8th November 2013 through to 29th April 2016
The environmental conditions were monitored during this period and the fruit quality and yield for
two harvest seasons Under each treatment 10 monitoring trees were selected 5 in each row (figure
2)
A fourth site with lsquoFrustarrsquo net was expected to be constructed after harvest 2014 but was not
completed during this project
The Cripps Pink apple trees planted in 2004 on a northsouth orientation are on M26 rootstock
trained on a central axis Trees are spaced at 1m with 4m between rows giving a planting density of
2500 trees per ha The soil type includes sandy clay loam with varying gravel content over medium
clay that starts from between 50 to 70cm depth The grower undertook all management of the trees
during the demonstration period
Figure 2 Netting treatment layout at Matijari 5 trees monitored in each row 10 trees monitored in each
block
Weather stations were located in the centre of row 4 (black net) 10 (white net) and 16 (no net)
Measurements taken every minute are averaged and reported each 15 minutes Weather
observations measured include solar radiation UVB radiation mid canopy air temperature relative
humidity wind speed and rainfall
The light interception was calculated by measuring Photosynthetically Active Radiation (PAR) on a
clear sky day in March 2014 and February 2015 using a hand held ceptometer Several
measurements were taken throughout each section at morning solar noon and afternoon to
measure the extent and density of the shade created by the tree
Row 1716
Row 1110 Row 54
No net rows 14 to 19
White net rows 8 to 13
Black net rows 1 to 7
Phenology assessments were performed to determine the beginning of green tip and full bloom
timing Regular visual assessments (Monday Wednesday Friday) were made from just prior to
budburst until flowering was completed Assessments were performed on a whole tree basis on only
spur and terminal buds and spur and terminal flower clusters assessed (axillary buds on one-year-old
pome fruit shoots were not included in the assessments) for the 10 Cripps Pink monitoring trees
under black white and no net treatments
Fruit Surface Temperature (FST) was measured using thermocouples inserted into the surface of 10
Cripps Pink apples Sensors were inserted into apples evenly spaced (upper mid and lower canopy)
on 4 trees in row 4 (black) 10 (white) and 16 (no net) Fruit Surface Temperature (FST) readings
were taken every 15 minutes from end of January until early March over 3 seasons 2014 2015 and
2016
Yield assessments were undertaken in 2014 and 2015 Each of the 10 monitoring trees from the
black white and no net treatments were strip pick approximately one week prior to the growers first
pick The number of apples from each tree was recorded then graded according to the Pink LadyTM
standards then a random sample of 40 was selected During the grading process the number of bird
damage apples and sun damaged apples were recorded from each monitoring tree The grower bin
numbers have been recorded to get the commercial pick data from all Cripps Pink rows under the
black white and no net treatments
From the sample of 40 apples from each of the monitoring trees the colour was assessed using the
Pink LadyTM Europe Ctifl colour charts (Centre technique interprofessionnel des fruits et legumes
(Ctifl) Pink LadyTM Eurofru colour charts) Each apple was given a score for background colour (F1-
F7) a score for blush intensity (R1-R8) and a percentage of blush intensity when the blush was over
R3
The maturity of the apples was tested from a sample of 10 apples randomly selected from the rows
monitored from early April until harvest With the final maturity test completed from the sample of
40 apples The maturity tests included starch conversion using the 1-6 scale (Portman and Sutton
2003) total soluble sugars measured using a refractometer flesh firmness measuring the pressure
from each side of the apple using a 11mm plunger and acid titration (McAlpine et al 1995)
Results and Discussion
Environmental
A summary of the winter chill conditions during the data collection years was compiled Flowering
phenology is influenced by winter chill accumulation with low chill years due to warm winter
conditions potentially delaying flowering Conversely warmer spring conditions may advance
flowering timing
Winter temperature conditions must be converted into chill portions For this project the Dynamic
chill model was used to calculate chill conditions under each net colour This model estimates winter
chill in chill portions and is currently the most robust and reliable chill model available (Luedeling
2012 and Darbyshire et al 2016) Winter chill was calculated from 1st March through until 31st
August 2014 and 2015 from hourly temperature readings collected in the orchard
There is very little difference in chill accumulation under black net white net or no net area (figure
3) The nets do not reduce the amount of chill accumulated as there is minimal impact on the
temperatures recorded under the black or white net or no net (table 1)
Use of netting to increase winter chill is unlikely to be an effective adaptation option however these
results do show that netting established for other management outcomes does not influence
winter chill accumulation in a meaningful way
Table 1 Mean monthly temperatures (degC) from March to October and total chill portions accumulated from 1st March until 31st August under black white and no net
Treatment Season Mar Apr May Jun Jul Aug Sep Oct CP
Black 2015 179 151 12 127 115 117 13 166 66
White 2015 179 151 121 128 117 119 129 166 63
No Net 2015 179 152 12 126 111 114 126 163 66
Black 2014 185 162 139 118 111 128 132 147 55
White 2014 186 163 139 118 112 129 132 147 54
No Net 2014 187 164 14 119 112 129 132 148 52
Figure 3 Chill accumulation under the black net white net and no net at Matijari in 2014 and 2015
Bud break and flowering data was collected from 10 trees under black white and no net rows
Observations were made three times a week from 20 August to 30 October 2014 and 2015 (Parkes
et al 2016) Whole tree assessments were made to determine the dates of bud break occurrence
of first flower and full bloom and to monitor progression of flowering (table 2) There is minimal
difference in flowering progression between the netted trees to the no net trees Rootstock shows a
greater difference with the MM106 trees under no net reaching bud break a week before M26 All
trees still came into full bloom at the same time in 2014 (figure 4)
Table 2 Summary of apple bud break and flowering data for 2014 at Matijari based on whole tree assessments Average dates of bud break (5 percent of buds at green tip or beyond) first flower and full bloom (80 percent of individual flowers open) for ten randomly selected trees
Cultivar Root Stock
Bud break First Flower Full Bloom
201415
No Net Cripps Pink M26 15914 26914 171014
White Net Cripps Pink M26 12914 22914 171014
Black Net Cripps Pink M26 15914 22914 171014
No Net Cripps Pink MM106 8914 15914 171014
201516
No Net Cripps Pink M26 18915 25915 151015
White Net Cripps Pink M26 16915 25915 151015
Black Net Cripps Pink M26 11915 25915 121015
No Net Cripps Pink MM106 23915 30915 141015
Figure 4 Flowering progression at Matijari for Cripps Pink apples on M26 rootstock under black white and no
net The first symbol represents green tip the second first flower and the last full bloom
Mean daily temperatures rarely varied more than 05 to 1 degree (figure 5) The netting led to small
increases in minimum temperatures and dampening of maximum temperatures This action is
similar to a cloud cover effect which reduces radiant heat loss overnight and reflects a portion of
incoming daytime radiation reducing maximum temperatures
Figure 5 Daily maximum (upper) average (centre) and minimum (lower) air temperatures for black white and
no net treatments for summer 2016
The daily maximum air temperature for the summer autumn months (December ndash April 2014 2015
and 2016) the relationship between the white and no net (figure 6) and black and no net (figure 7)
show no effect on air temperature There is a wide range of air temperatures from 14oC to 37oC
245 250 255 260 265 270 275 280 285 290 295 300
DoY (Sept - Nov)Green tip - First Flower - Full Bloom
Flowering Progression Matijari
2014 Black net
2015 Black net
2014 White net
2015 White net
2014 No net
2015 No net
0
5
10
15
20
25
30
35
40
1 January 2016 1 February 2016 1 March 2016
Air
Te
mp
era
ture
oC
Black max Black min Black avgWhite max White min White avgNo Net max No Net min No Net avg
over a 5 month period of the growing season that demonstrating there is no effect on air
temperature Under the nets feels cooler as the solar radiation lower
Figure 6 The relationship of maximum daily air temperature under no-net (ATno-net) and white net (ATwhite) for
Summer and Autumn 2014 to 2016 The fitted linear regression (solid line) was described by ATno-net = 1004 (plusmn
0006) ATwhite - 0081 (plusmn 0155) R2 = 099 n = 438
Figure 7 The relationship of maximum daily air temperature under no-net (ATno-net) and black net (ATblack) for
summer and autumn 2014 to 2016 The fitted linear regression (solid line) was described by ATno-net = 0996 (plusmn
0006) ATblack + 0379 (plusmn 0163) R2 = 098 n = 438
20
25
30
35
40
20 25 30 35 40
ATn
o-n
et(deg
C)
ATwhite (degC)
20
25
30
35
40
20 25 30 35 40
ATn
o-n
et(deg
C)
ATblack (degC)
The humidity under the white net during summer was highest and lowest in no net block (table 3)
The effect of high humidity was seen in the pest and disease management under the nets In the
first year after the nets were constructed woolly aphids were extremely bad under the nets there
was also a high percentage of apples with bitter pit European mites attacked under the nets in late
December 2015 almost defoliating the trees With pest and disease outbreaks can be more
common under netting it is a matter of monitoring more frequently as the conditions under the nets
are favourable to outbreaks
Table 3 Maximum daily relative humidity during summer autumn 2016
Black White No Net
Average 9285 9346 9192
Max 9844 9852 9774
Min 6683 6792 6284
SE 047 040 046
Average wind speeds are highest under the black net which is on the eastern side followed by the no
net which is on the western side (table 4) The white net is the central block between the black and
no net treatments The average wind speeds measured appear to demonstrate a landscape effect
where the eastern side open to the easterly winds off the dam and the white net is protected from
the prevailing winds The no net treatment is protected from the rest of the block of Fuji and Cripps
Pink apple trees Although the maximum wind speeds come from the prevailing westerly winds
Table 4 Average 15 minute wind speed (ms) May 2015 ndash April 2016
Black White No Net
Average 112 064 089
Max 497 602 746
Min 0 0 0
SE 0005 0004 0005
The no net area received the highest global radiation (figure 7) While not exactly the same as the
specifications the white net showed a 15 percent reduction and the black net 26 percent reduction
during January and February 2014 and 2015 Specifications are only given as a guide to how the nets
will perform and in this case the black net was close to specification and the white net slightly less
A similar trend is followed each summer for global radiation
Figure 7 Global radiation measured under the black net white net and no net rows for summer 2014
Figure 8 Global radiation measured under the black net white net and no net rows for summer 2015
Figure 9 Global radiation measured under the black net white net and no net rows for summer 2016
0
5
10
15
20
25
30
35
40
0 20 40 60 80 100
Glo
bal
rad
iati
on
(M
Jm
2 d
)
Julian Day
2014 No net
White net
Black net
0
5
10
15
20
25
30
35
40
0 20 40 60 80 100
Glo
bal
rad
iati
on
(M
Jm
2d
)
Julian Day
2015 No net
White net
Black net
0
5
10
15
20
25
30
35
40
0 20 40 60 80 100
Glo
bal
rad
iati
on
(M
Jm
2d
)
Julian Day
2016 No net
White net
Black net
The effect of the black white and no nets on the interception of light was measured annually as a
percentage of total above canopy Photosynthetically Active Radiation (PAR) using a ceptometer
Figure 10 shows the black net had a greater reduction in shade compared with the white net and no
net
Figure 10 Average photosynthetic radiation interception (PAR) of sky measured at morning noon and
afternoon on March 2014 and February 2015 in the black net white net and no net rows
While measurements reflected shade specification of the net the reduction in PAR was also
influenced by tree vigour or vegetative growth
The fractional PAR is the light intercepted by the tree canopy Tree vigour was higher under the
netted areas than outside the net as seen in the under canopy readings (figure 11)
0
500
1000
1500
2000
2500
3000
830 930 1030 1130 1230 1330 1430 1530
PA
R
mo
lm
2 s
Time
No Net 15 Black 15 White 15No Net 14 Black 14 White 14
Figure 11 Average percentage of fractional photosynthetic radiation interception (fPAR) measured at
morning noon and afternoon on 12 March 2014 in the black net white net and no net rows under tree
canopy
Quality
The fruit quality was a measured through the amount of sun damaged fruit bird damaged colour
development of the background and blush of the apple and maturity of the fruit Fruit surface
temperature was used to measure the amount of sunburn browning that could be expected under
netted conditions
Fruit surface temperature (FST) was higher in the no net area particularly during extreme heat
events in late summer and a higher percentage of sunburnt fruit was observed in the no net rows
25 percent in 2014 Less than half a percent of the apples were sun damaged that came from the
black and white net areas compared to the no net area
From the 2014 and 2016 fruit surface temperature (FST) recorded it is reasonable to think that
amount of solar radiation reaching the fruit surface should influence the FST The FST was measured
over the summer 2013-14 season (figure 12) and 2015-16 season (figure 13) Average FST was lower
under the white net than the black even though greater solar radiation was recorded under white
net
0
10
20
30
40
50
60
70
80
90
100
830 930 1030 1130 1230 1330 1430 1530
Pe
rce
nta
ge f
PA
R
TimeNo Net 15 Black 15 White 15
No Net 14 Black 14 White 14
Figure 12 Fruit surface temperature (FST) and air temperature measured in the black net white net and no
net rows at Matijari for February till mid-March 2014
The FST recordings from 2015 had some computer programming errors at the weather station and
have not been presented in this report
Figure 13 Fruit surface temperature (FST) and air temperature measured in the black net white net and no
net rows at Matijari for February till mid-March 2016
In 2016 the highest FST was 5961 oC in the no net block This was just one sensor in the outside
lower canopy on the western side sun damage was observed in this apple All other sensors in the
no net treatment were only a few degrees warmer than the black and white net
The daily maximum fruit surface temperature for February 2014 and 2016 the relationship between
the white and no net (figure 14) and black and no net (figure 15) show minimal effect on fruit
surface temperature The range of FST start at 20 oC for minimum daily FST and extend through to a
maximum of 48 oC with average maximum FST of 483 oC for black net 489 oC for white net and 596
oC for the no net over the 2 seasons of recording FST
0
10
20
30
40
50
60
4022014 18022014 4032014
Tem
pe
ratu
re o
CAir Temp Black net Air Temp White net Air Temp No net
FST Row 4 Black net FST Row 10 White net FST Row 16 No net
0
10
20
30
40
50
60
29012016 12022016 26022016
Tem
pe
ratu
re o
C
White Max FST No Net Max FST Black Max FST
Black Max Air Temp White Max Air Temp No Net Max Air Temp
Figure 14 The relationship of maximum daily fruit surface temperature under no-net (FSTno-net) and white net
(FSTwhite) for February 2014 and 2016
Figure 15 The relationship of maximum daily fruit surface temperature under no-net (FSTno-net) and black net
(FSTblack) for February 2014 and 2016
Background colour blush and maturity all contribute to the marketability and grade assigned to Pink
LadyTM apples While the results are presented separately it is important to consider them together
In 2015 at the time of strip picking the majority of apples had reached the ideal background colour
(figure 16) Seventy eight percent of fruit in the no net and black net blocks were between F3 to F4
suitable for optimum for long term storage Sixty eight percent of white net apples were between
F3 to F4 (table 5)
y = 11445x - 22008
20
30
40
50
60
70
20 30 40 50 60 70
FST
No
Ne
t (o
C)
FST White Net (oC)
y = 10337x + 15665
20
30
40
50
60
70
20 30 40 50 60 70
FST
No
Ne
t (o
C)
FST Black net (oC)
Background colour greater than F4 is undesirable for long term storage as the green background
begins to move toward yellow the fruit ripens Twenty two percent of the no net fruit were beyond
the ideal background storage colour in 2015 and 67 percent in 2014 of no net and 53 percent of the
white net
Figure 16 Background and blush colour of Cripps Pink apples at time of strip picking 2842015 black net
white net and no net random sample for maturity testing
Table 5 Background colour percentage of apples with F score for background colour from Ctifl standards for
Pink LadyTM Optimum for long term storage F 3-4
F Score lt3 Immature
F Score 3 -4 Optimum for long term
storage
F Score gt4 Optimum for fresh market
to over ripe
2014
Black 6 93 1
White 5 42 53
No Net 2 31 67
2015
Black 0 78 22
White 0 68 32
No Net 0 78 22
While optimum blush is between R4 and R5 for long term storage blush greater than R4 is preferred
in all fruit The no net treatment had better blush colour development with majority of apples at
greater than R4 (table 6)
Table 6 Blush intensity percentage of apples with R score for background colour from Ctifl standards for Pink
LadyTM Optimum for long term storage F 4-5
R score lt4 Immature
R Score 4-5 Optimum for long term
storage
R Score gt5 Optimum for fresh market
2014
Black 43 29 28
White 25 38 37
No Net 26 34 40
2015
Black 68 25 7
White 56 35 9
No Net 47 42 11
Black Net White Net No Net
Colour management was required under the nets to ensure the colour and maturity meet at the
same point A reflective surface can ensure colour develops with the blush colour meeting market
standards
Maturity tests were undertaken from a sample of 10 apples from each treatment after the strip pick
(table 7) The starch conversion guide for the maturity of Pink LadyTM Apples the 1-6 scoring system
was used to assess the apples At picking starch conversion scores were at 4 optimum for only short
to medium controlled atmosphere storage (figure 17) The Total Soluble Sugar (TSS) was generally
lower than the acceptable minimum standard of 13 percent in all areas testing at 11 percent after
the first strip pick The grower did 4 picks of the fruit to harvest the apples at the optimal time of
maturity and colour meeting enabling sugar percentage to rise to the required 13 percent The flesh
firmness was measured on opposite sides of the apple averaging 82kg in 2015 and 8kg in 2014 with
ideal firmness pressure greater than 61kg required
Table 7 Average maturity testing from the strip pick of a sample of 10 apples from each of the 10 monitoring
trees
Treatment Firmness kg
TSS ()
Starch Index
Acid ml
2014
Black 73 118 40 90
White 78 120 39 105
No Net 89 114 35 117
2015
Black 82 107 41 102
White 82 114 43 87
No Net 82 110 41 89
Figure 17 Starch test on 2842015 at the time of strip picking Showing average starch index gt4 suitable for
medium to short term storage
Black Net
White Net
No Net
Yield
Both the strip picked data from the 10 monitoring trees in each treatment (table 8) and the
commercial pick data from the remaining trees in the block (table 9) have been included to
demonstrate the difference in the assessment and importance of working on a commercial property
Forty apples were assessed for size and quality from the strip picked trees
Encouragingly average fruit diameters from the strip pick were all very similar between treatments
There was a slight difference in average fruit weight which when multiplied with the difference in
average number of fruit per tree contributed to the difference in extrapolated yield per hectare
Table 8 Average fruit diameter weight fruit per tree and yield of non-damaged fruit based on strip harvest
Treatment Harvest
Date
Average fruit diameter
(mm)
Standard Deviation of
diameter
Average single fruit weight (g)
Average fruit number per
tree
Extrapolated yield (tha)
2014
Black 2014 752014 716 035 1656 1212 710
White 2014 652014 718 035 1726 1356 749
No Net 2014 3042014 716 062 1724 742 424
2015
Black 2015 2942015 717 058 1702 1557 653
White 2015 2942015 720 061 1626 1433 574
No Net 2015 152015 712 038 1610 2189 900
The data from the grower harvest (table 6) based on bins picked from the remaining 390 trees per
treatment shows a slightly different story The commercial yields are lower for black net and no net
treatment and higher under the white net This is largely due to the increased number of trees per
treatment averaging out differences in fruit numbers and the staggered picking over several weeks
allowing for colour to guide the timing of harvest This meant fruit with less blush than desired may
have increased in size and weight before being picked by the growers with some fruit left on the
trees that were already over mature or not considered marketable
Table 9 Grower yield per treatment total tonnes from each treatment 2013 yield before netting installed
Treatment 2013 Harvest Date
2014 Harvest Date
2015 2016
Black 97 2152014 63 252015 80
White 113 2152014 77 252015 103
No net 103 2152014 70 252015 97
The amount of sun damaged apples strip picked was less than 1 percent of the fruit picked from the
10 monitoring trees The black net apples in 2014 had the lowest amount (69 percent) of the fruit
marketable and had the highest (79 percent) marketable fruit in 2015 The no net was very stable
across the two harvests with the white net showing decreases in marketability in 2015 due to shape
defects and under sized fruit (table 10)
Table 10 Percentage of fruit that was marketable nonmarketable or had sun damage
Treatment Marketable Non-marketable Sunburn
2014
Black 6915 3085 0101
White 78 22 025
No net 74 26 25
2015
Black 787 213 05
White 705 295 04
No Net 730 270 10
sunburn is a subset of non-marketable fruit
In both seasons the damage from birds was minimal with no large losses from birds recorded before
harvest in the rows under the black white or no net The apples strip picked from the monitoring
trees had less than 1 percent of the fruit damaged by birds There were no hail events during the
monitoring period and so no damage from hail could be assessed Other previous studies from
Queensland have shown netting to be effective in preventing hail damage (Middleton and McWaters
2002)
Conclusions
Winter chill accumulation was monitored during the three years of the project It was found that
netting black or white had minimal impact on chill accumulation This was also reflected in the mean
monthly temperature which only varied by about half to one degree There is a linear relationship
between the air temperature of the black and white net and again when the nets are compared to
the no net treatment block The impact on chill conditions under the net was also seen in the
flowering progression which was monitored under the nets in 2014 and 2015 In both years the
black white and no net trees monitored entered into the bud break and reached full bloom on the
same day or within days of each other
The environmental conditions under the nets were very similar although some slight differences can
be seen in the weather data recorded The humidity under the white net during summer was
highest and lowest in no net block The effect of high humidity was seen in the pest and disease
management under the nets In the first year after the nets were constructed woolly aphids were
extremely bad under the nets and a high percentage of apples had bitter pit European mites
attacked under the nets in late December 2015 almost defoliating the trees With pest and disease
outbreaks more common under netting it is a matter of monitoring more frequently as the
conditions under the nets are favourable to outbreaks Although pests and diseases are treatable
they just require prompt management
Solar radiation was the highest in no net followed by white and black net The fruit surface
temperatures recorded in the apples over the late summer period were higher in the no net apples
where the solar radiation was highest The average difference between no net and the netted was
around 3 degrees with the black and white nets only varying by one degree
Measuring the amount of shade under the tree canopy it was found that tree vigour influenced the
Photosynthetically Active Radiation Outside the canopy the PAR followed the netting specifications
rating of the netting black lowest then white and no net
The fruit size was very similar in the three treatments with slight differences in fruit weight and
number of apples per tree after the strip pick The grower yields were highest under the white net
where the fruit had been allowed to stay longer on the trees This was to ensure the apples gained
more colour Initial response in the first year yield was reduced due to bitter pit woolly aphid and
colour management
Colour management is required under the nets to ensure the colour and maturity meet at the same
point A reflective surface can ensure colour develops with the blush colour meeting market
standards
The netting has proven to be successful at the Western Australia netting demonstration site in
reducing the impact of birds on the fruit
reducing the fruit surface temperature
with minimal impact on winter chill and flowering progression
Table 11 Cripps Pink responses to Black White and No Net at Western Australian Netting Demonstration Site
Black Net White Net No Net
Dormancy Chill Accumulation No Effect No Effect No Effect Flowering Progression No Effect No Effect No Effect Environmental data Air Temperature No Effect No Effect No Effect Fruit Surface Temperature Highest Humidity Highest Max Lowest Min Solar Radiation Lowest Highest Wind average speed Highest Lowest Yield and Quality Grower Yield Lowest Highest Colour Best Background Best Blush Best Overall Maturity Highest Sugar Lowest Starch
References
Bosco L Bergamaschi H Cardoso L Paula V Marodin G and Nachtigall G (2014) Apple production and quality
when cultivated under anti-hail cover in Southern Brazil International Journal of Biometeorology 59773-782
Darbyshire R McClymont L and Goodwin I (2015) Sun damage risk of Royal Gala apple in fruit growing districts
in Australia New Zealand Journal of Crop and Horticultural science
Darbyshire R Pope K and Goodwin I 2016 An evaluation of the chill model to predict flowering time in
apple tree Scientia Horticulturae Vol 198 pages 142 ndash 149
Darbyshire R Webb L Goodwin I Barlow EWR (2013) Challenges in predicting climate change impacts on
pome fruit phenology International Journal of Biometeorology1-15 doi101007s00484-013-0705-4
Darbyshire R Webb L Goodwin I Barlow S (2011) Winter chilling trends for deciduous fruit trees in Australia
Agricultural and Forest Meteorology 1511074-1085 doi101016jagrformet201103010
Luedeling E (2012) Climate change impacts on winter chill for temperate fruit and nut production A review
Scientia Horticulturae 144218-229
Iglesias I Alegre S 2006 The effect of anti-hail nets on fruit protection radiation temperature quality and
profitability of lsquoMondial Gala apples Journal of Applied Horticulture 8 91ndash100
Lolicato S 2011 Sun protection for fruit a practical manual for preventing sunburn on fruitmdash2011 Victoria
Department of Primary Industries
McAlpine G Mackay A Sutton J Godley G Price A and Melvin-Carter E (1995) Pink Lady TM and Sundowner TM
Apple specifications Bulletin 4305 Department of Agriculture Western Australia
Middleton S and McWater A (2002) Hail Netting of Apple Orchards - Australian Experience The Compact
Fruit Tree Volume 35 number 2 2002
Portman T and Sutton J (2003) Starch Conversion guide for maturity of Pink Lady TM apples Department of
Agriculture Western Australia
Parkes H Tabing L McClymont L Wilkie JD Combret M 2016 Variation in the flowering phenology of
apple and pear in Australia Acta Horticulturae 1130 (8)55-61
Reid A (2010) Horticulture and climate change A preliminary analysis of climate and crop climatic information
in the south-west of Western Australia Department of Agriculture and Food Western Australia Perth
Sudmeyer R Edward A Fazakerley V Simpkin L amp Foster I 2016 lsquoClimate change impacts and adaptation
for agriculture in Western Australiarsquo Bulletin 4870 Department of Agriculture and Food Western Australia
Perth
Appendix
Presentations
Susie Murphy White 2015 Netting the Benefits of climate change APAL Speed Updating 2015
httpapalorgauresearch-development-extensionprojectsresearch-reviews (accessed
832016)
Materials produced
Posters
Murphy White S Prince R and Starkie L 2015 Is there a difference between Black or White
netting (Manjimup Rotary 2015 Warren Districts Show 2016)
Prince R Murphy White S and Starkie L 2015 Benefits of good irrigation in netted apple
orchards
Fact Sheets
Darbyshire R 2014 Winter Chill and Fruit Trees PICCC Research Fact Sheet wwwpicccorgau
Australian Fruit Grower magazine articles
Murphy White S June 2014 Netting the Benefits of a changing climate (Volume 8 Issue 5)
Prince R and Murphy White S October 2015 Netting Trial results in Western Australia (Volume
9 Issue 9)
Murphy White S Prince R and Starkie L December 2015 Black or White netting which is best
(Vol 9 Issue 11)
Web pages
httpsagricwagovaun4863
httpwwwpicccorgauresearchproject440
httpwwwhincomauprojectswinter-chill-and-fruit-trees
httpapalorgauresearch-development-extensionprojectsapple-pear-production-changing-
climate
1
Apple yield response to climate change and netting
Lexie McClymont1 Rebecca Darbyshire2 and Ian Goodwin1
1 Victorian Department of Economic Development Jobs Transport and Resources
2 New South Wales Department of Primary Industries
Summary
The effect of increased temperature on potential yield of early-season apples in northern Victoria
was investigated using the physiological model MaluSim (Lakso and Johnson 1990) Impacts of
netting on yield were also investigated using observed data and MaluSim With a climate change
scenario of a 2 degC increase in maximum and minimum air temperatures MaluSim predicted
increased fruit weights and yields when crop loads were low However at higher crop loads yield
potential decreased due to greater source limitations resulting from decreased daily photosynthesis
in response to high temperatures later in the season Overall the effects of a 2 degC increase in air
temperatures on potential yields of Royal Gala apples in northern Victoria were small (+13 to -16
tha depending on crop load and presence or absence of netting) Yield potential was higher for
non-netted trees than netted trees but observed yields were lower for non-netted trees This
highlighted the benefits of netting in reducing crop damage and the influence of orchard
management on actual yield
Evaluation of the performance of MaluSim in predicting yield of Royal Gala apples in north Victoria
supported use of this model for preliminary investigation of climate change impacts on yield
However limitations of use of the model for this purpose were identified and are briefly discussed in
this report Additionally long-term investigation of the impact of elevated CO2 on apple yield is
required to more accurately predict climate change impacts A greater understanding of the impact
of temperature shifts on fruit maturation colour development and phenology would further
improve predictions of yield under different climate scenarios
2
1 Introduction
Mean temperatures for coastal and inland Australian apple growing regions are predicted to rise by
07-09oC and 1-12oC respectively by 2030 (Putland et al 2011) Previous research has identified a
range of potential impacts of predicted climate change on the productivity and profitability of the
Australian apple and pear industries (Putland et al 2011 Darbyshire et al 2013) Climate change has
the potential to affect potential productivity of pome fruit trees through effects of changing
environmental conditions on the orchards net carbon exchange (difference between photosynthates
produced and expended for respiration Putland et al 2011 and references within) Netting provides
a climate adaptive option particularly for severe weather events such as extreme heat or hail and is
increasingly being installed by growers Industry has made significant investment in netting
infrastructure despite remaining practical questions on the use of hail netting particularly in warm
growing regions The reduction of solar radiation under netting may influence physiological
responses to climate change
An apple physiological model (MaluSim Lakso and Johnson 1990) has been used to understand the
effects of predicted climate change on net carbon exchange of apples and the upper limit of apple
production (yield potential) The aims of this study were to
- evaluate the model MaluSim with regard to prediction of apple yield under Australian
conditions and
- predict apple yield in netted and non-netted orchards under warmer climate conditions
using MaluSim
Use of the model lsquoMaluSimrsquo (Lakso and Johnson 1990) to predict apple yield was evaluated in
201213 for Royal Gala apples grown at a site in nothern Victoria This site was selected as two
adjacent blocks were netted and non-netted This provided an opportunity to evaluate MaluSim with
and without the adaptation option of over-tree netting Data was collected from 10 trees for both
netted and non-netted trees and measurements for each of the 10 trees were treated as repeat
observations Broader evaluation of the model was conducted by the PICCC project lsquoCrossing the
threshold adaptation tipping points for Australian fruit treesrsquo and reported by Darbyshire and
McClymont (2016)
A future climate scenario of a +2 degC increase in maximum and minimum daily temperatures was
investigated for netted and non-netted orchards and compared to a current season (201213) To
create the future scenario temperature data from 201213 was increased by + 2 degC 201213 solar
radiation values were unchanged and other tree parameters were standardised based on
observations or default parameters within the model Fruit weight predictions were compared to
predictions based on 201213 weather data Calculations of cumulative tree photosynthesis
respiration and dry weight accumulation and daily photosynthesis and fruit carbon demand and
supply were examined to better understand fruit weight and yield responses suggested by the
model
3
2 Methods and materials
21 Evaluation of lsquoMaluSimrsquo
The MaluSim model is a simplified dry matter production model that relies primarily on temperature
and radiation inputs to predict carbohydrate accumulation (Lakso and Johnson 1990 Lakso 1992
Lakso et al 2001 Lakso et al 2006) The model is written in STELLA and consequently can be easily
modified by users (Zibordi 2010) It has been shown to behave realistically in a number of apple
growing regions and in response to factors such as short-term low light (Lakso et al 2001) The
model operates on a daily time step at the tree scale and balances carbohydrate supply against
demand for a lsquostandardrsquo tree Parameters associated with a lsquostandardrsquo tree (eg dates of key
phenological events number of fruit per tree tree spacing length of growing season shoot and spur
numbers) can be modified in the model Required data are summarised in Table 1
Table 1 Required datasets for MaluSim calibration
Dataset
Model inputs Site parameters Tree and row spacing
Latitude
Weather
Maximum and minimum daily air temperature Total daily solar radiation
Phenology
Date of budburst and harvest
Vegetative growth
Shoot and spur number or canopy radiation interception
Reproductive sinks Fruit number per tree (at harvest) Model outputs Average fruit fresh weight
211 Study site and collection of required datasets for model evaluation
Royal Gala apple was selected for evaluation of MaluSim as paired netted and non-netted sites were
available allowing investigation of any impact of netting on potential yield
The study orchard was a Royal Gala block located at Geoff Thompsonrsquos North Shepparton orchard
The selected block was predominantly covered by permanent netting but five rows on the eastern
side of the block were uncovered Tree age variety rootstock and most management activities did
not differ between netted and non-netted trees Data for evaluation of MaluSim were collected
during the 201213 season
Table 2 Description of the study site
Site Season Latitude Longitude Tree and Row spacing
Training System
Row Orientation
Shepparton 201213 -3633 14540 15 x 48 m Central-leader NNW-SSE
4
Weather stations were located within the netted and non-netted orchard areas to measure daily
maximum and minimum air temperature (degC HMP155 Vaisala Oyj Vantaa Finland) and daily total
solar radiation (MJm-2day-1 SPN1 Delta T Devices Ltd Cambridge UK) Data were logged (dataTaker
DT80M Thermo Fisher Scientific Inc Yokohama Japan) from 15 December 2012 at 1 minute
intervals during January and at 10 minute intervals at other times of the year Meteorological data
between budburst and 15 December 2012 were interpolated from relationships established for
radiation and temperature over the remainder of the season between a nearby weather station and
the onsite stations
Budburst day-of-year (DOY = 248) was estimated based on date of flowering at the site and date of
budburst of Gala at a nearby orchard Fruit number at harvest and canopy radiation interception
data were collected from 10 trees for both netted and non-netted sites Measurements for each of
the 10 trees were treated as repeat observations Fruit were colour picked over a two week period
in late-January and early-February Fruit number and fruit weight were recorded at each pick and
the mid-date of harvest (31 January 2013) was used as the harvest day-of-year in MaluSim Light
interception measurements at full canopy prior to harvest for each tree were taken in January
2013 A ceptometer was used to measure light interception in the morning at midday and in the
afternoon Daily light interception was calculated by averaging the morning midday and afternoon
measurements
212 Comparison of observed and predicted fruit weight 201213 season
Two parameterisations of MaluSim were run for analyses Firstly the default MaluSim values were
used (Netted-Default and NonNetted-Default) and secondly alternate values for shoot and spur
numbers were used to adjust the modelled light interception values to be similar to measured values
(Netted-Light Interception and NonNetted-Light Interception) To set the adjusted shoot and spur
numbers MaluSim was rerun for each tree with progressive adjustments to shoot and spur numbers
(maintaining the ratio of shoots to spurs to match that of the default values) until the predicted light
interception was within plusmn 2 of the observed light interception For both parameterisations the
netted and non-netted data were evaluated independently as well as combined Use of the default
maximum fruit growth rate was considered to be a reasonable assumption for an initial investigation
of model performance as Empire and Royal Gala are both early season apple varieties
22 Predictions of apple yield under a warmer climate
A future scenario of a +2 degC increase in maximum and minimum daily temperatures was investigated
for netted and non-netted orchards by inputting solar radiation data and adjusted air temperature
data (+ 2 degC) from 201213 to MaluSim with other (site phenology and tree) parameters
standardised Site and phenology inputs were unchanged from those used in the initial model
evaluation (section 21) Default shoot and spur numbers (194 and 343 respectively) were used
Crop load (fruit number per tree) was varied from 25 to 450 to ensure any lack of response to
changed climate conditions was not due to sink-limited yield restrictions
Fruit weight predictions for 201213 were compared with predictions using the +2 degC scenario
Cumulative tree photosynthesis respiration and dry weight accumulation and daily photosynthesis
and fruit carbon demand and supply were examined to better understand fruit weight (yield)
responses suggested by the model
5
3 Results
31 Evaluation of lsquoMaluSimrsquo
The results using default parameters of MaluSim tended to overestimate fruit weight compared with
observed fruit weight (Figure 1A) Combining both the netted and non-netted results RMSE was 39 g
which equates to a 28 error in estimating mean fruit weight (Table 3) Using the default
parameters the predicted fruit weights for the Netted site were more accurate than those for the
Non-Netted site RMSE 14 and 36 g (9 and 29 of mean fruit weight) respectively (Table 3)
Figure 1 MaluSim predicted and observed mean fruit weight (fresh weight in grams) for netted and non-
netted trees in 20122013 A) MaluSim fruit weight predictions using default shoot and spur number inputs B)
MaluSIm fruit weight predictions using adjusted shoot and spur numbers
100
120
140
160
180
200
100 120 140 160 180 200
Mo
del
led
Fru
it W
eigh
t (g
)
Observed Fruit Weight (g)
A
Netted-Default
NonNetted-Default
100
120
140
160
180
200
100 120 140 160 180 200
Mo
del
led
Fru
it W
eigh
t (g
)
Observed Fruit Weight (g)
B
Netted-Light Interception
NonNetted-Light Interception
6
Table 3 Statistics of MaluSim predicted and observed fruit weight at Royal Gala Netted and NonNetted sites using default shoot and spur numbers (Default) and adjusted shoot and spur numbers to align light interception values in the model with measured values
Site Coefficient p-value R2 RMSE (g)
Netted-Default 020 047 14
NonNetted-Default 005 092 36
All-Default 013 035 39
Netted-Light Interception 098 lt001 046 8
NonNetted-Light Interception -008 086 21
All-Light Interception 039 002 NA 22
linear model intercept was not significant statistics are for analysis omitting the intercept
The model predictions using parameterised adjustments of shoot and spur numbers were improved
for both the netted and non-netted trees (Figure 1 and Table 3) For the combined data RMSE was
improved to 22 g or 16 of the mean fruit weight MaluSim better predicted fruit weight for the
netted trees with RMSE of 8 g or 5 of the mean fruit weight In comparison predictions for the
non-netted trees yield RMSE of 21 g or 17 of mean fruit weight
32 Predictions of apple yield under a warmer climate
Potential fruit weight was predicted using MaluSim for two main scenarios
1 201213 Measured daily maximum and minimum air temperatures from the 201213
season with a range of crop loads for netted and non-netted Royal Gala orchards in north
Victoria
2 + 2 degC Adjusted air temperatures (201213 temperatures + 2 degC) with a range of crop loads
for netted and non-netted Royal Gala orchards in north Victoria
321 Weather inputs
Total solar radiation was 20 lower under netting than in the non-netted site Daily maximum air
temperature varied slightly between netted and non-netted sites with a tendency on hot days for
maximum air temperature under netting to be less than the non-netted site Prior analysis of
weather data showed that air temperature was similar at netted and non-netted sites (Milestone
Report 2 McClymont and Goodwin 2013 McClymont et al 2013)
Table 4 Summary of measured weather inputs at netted and non-netted sites during the 201213 season Max
AT = maximum air temperature Min AT = minimum air temperature Daily Rad = total daily solar radiation
Netted Non-netted
Max AT (degC)
Min AT (degC)
Daily Rad (MJm-2day-1)
Max AT (degC) Min AT (degC)
Daily Rad (MJm-2day-1)
Ave (plusmn st dev) 265 (plusmn 67) 95 (plusmn 45) 197 (plusmn 67) 272 (plusmn 67) 95 (plusmn 45) 244 (plusmn 82)
Max 418 213 282 428 214 349
Min 130 -03 27 135 -03 34
7
322 MaluSim calculation of photosynthesis respiration and dry matter accumulation
MaluSim calculates daily photosynthesis based on canopy interception of daily solar radiation with
adjustments to photosynthetic rate dependent on air temperature (Darbyshire and McClymont
2016) Over the period from budburst to harvest similar leaf area and canopy light interception
were generated by MaluSim for each scenario with only slight differences between netted and non-
netted sites and no differences for differing crop loads (Table 5) Leaf area development was more
rapid under the + 2 degC scenario than the 201213 scenario (data not shown)
Table 5 Leaf area and canopy light interception predicted at harvest by MaluSim under 201213 (201213
season air temperature data) and + 2 degC (201213 season temperatures + 2 degC) scenarios at netted (Net) and
non-netted (NN) sites
Scenario Leaf area (m2) Light interception () Net NN Net NN
201213 109 110 419 420 + 2 degC 110 110 421 420
Over the budburst to harvest period cumulative photosynthesis was effectively unchanged by
increased air temperatures (+ 2 degC scenario) and was approximately 10 lower at the netted site
than the non-netted site (Table 6) However daily photosynthesis during the first 70 ndash 75 days of the
season was greater under the + 2 degC scenario than the 201213 scenario (Figure 2) After this time
daily photosynthesis tended to be greater under the 201213 scenario than the + 2 degC scenario
(Figure 2)
Table 6 Photosynthesis respiration and dry matter accumulation between budburst and harvest predicted by
MaluSim under 201213 (201213 season air temperature data) and + 2 degC (201213 season temperatures + 2
degC) scenarios at netted (Net) and non-netted (NN) sites with a range of crop loads
201213 + 2 degC
Crop load (fruittree)
Photosynthesis (g CO2)
Respiration (g CO2)
Dry Matter Photosynthesis (g CO2)
Respiration (g CO2)
Dry Matter
Net NN Net NN Net NN Net NN Net NN Net NN
25
12637 13875
2220 2291 1805 1846
12758 13867
2730 2793 1804 1843 50 2256 2328 2252 2302 2774 2840 2294 2338 75 2291 2365 2693 2758 2816 2885 2756 2821 100 2325 2402 3117 3201 2858 2929 3208 3289 150 2392 2472 3928 4047 2938 3014 4023 4139 207 2462 2549 4707 4882 3020 3104 4751 4937 250 2510 2601 5162 5403 3073 3163 5111 5371 300 2557 2655 5525 5846 3126 3221 5396 5708 350 2597 2702 5775 6157 3169 3272 5562 5923 450 2659 2776 6039 6506 3237 3352 5759 6182
Average number of fruit per tree observed in 20122013
8
Figure 2 Daily photosynthesis (g CO2day) between budburst and harvest under measured 201213
temperature conditions (201213) and with a 2 degC temperature increase (+2 degC) for A) non-netted (NN) and B)
netted (Net) Royal Gala trees
MaluSim calculates daily respiration by an exponential relationship dependent on air temperature
and scaling for the size of plant parts (Darbyshire and McClymont 2016) Over the budburst to
harvest period cumulative respiration was approximately 20 greater in response to increased air
temperature (+ 2 degC scenario Table 6) Respiration was slightly lower at the netted site than the
non-netted site for 201213 (3 ndash 4 lower depending on crop load) and + 2 degC (2 ndash 3 lower)
scenarios Respiration increased with increasing crop load due to increased total respiration by
greater numbers of fruit
Dry matter accumulation is a function of demand of plant parts for photosynthate and supply
(photosynthesis - respiration) Predictably dry matter accumulation increased with increasing fruit
number as more lsquosinksrsquo were able to utilise produced photosynthates Similarly greater
photosynthate production at non-netted sites (compared to netted sites) enabled greater dry matter
production despite slightly higher respiration Response of dry matter accumulation to increased air
temperatures varied depending on crop load Dry matter production was similar or higher under the
+ 2 degC scenario when fruit number was 250 or less and lower when fruit number was 300 or more
9
323 MaluSim prediction of fruit weight and daily balance of fruit CO2 supply and demand
MaluSim partitions dry matter between plant parts (shoots fruits wood and roots) The amount of
dry matter partitioned to fruits determines fruit weight Demand by the different plant parts for
photosynthates varies through the season For example demand by shoots for photosynthates
increases rapidly from the start of season peaking after approximately one month and then
decreasing until shoot growth ceases Whereas fruit demand for photosynthates is low early in the
season and increases steadily mid-season until a peak potential growth rate is reached prior to
harvest Under excess carbon supply circumstances each growing part is allocated its full demand of
dry matter When photosynthate supply is limited the growing parts compete for resources The
ldquostrengthrdquo of each growing part to compete differs with shoots the strongest followed by fruit wood
and roots Under limited supply conditions dry matter allocated to fruit is less than the demand to
grow at maximum potential
For the 201213 and +2 degC scenarios predictions of fruit weight fell as fruit number per tree
increased (Figure 3A) but yield (fruit weight x fruit number) continued to increase (Figure 3B) over
the range of modelled crop load (25 to 450 fruit per tree) For crop loads between 25 and 100 fruit
per tree there was little change in predicted fruit weight with increasing crop load suggesting that
yield was predominantly sink-limited (ie potential supply of photosynthate to fruit was greater than
fruit demand) At higher crop loads (150 fruit per tree and greater) fruit weight began to decline
steadily indicating that at least on some days fruit growth was source-limited (ie supply of
photosynthate was not meeting fruit demand) Yield began to plateau at a crop load of
approximately 300 fruit per tree For both 201213 and +2 degC scenarios predicted fruit weights and
yields were lower for the netted site than the non-netted (Figure 3) These differences were
primarily due to decreased radiation under netting leading to decreased photosynthate production
For netted and non-netted sites MaluSim predicted a slight increase in fruit weight and yield with a
+2 degC increase in temperature at low crop loads (lt 250 fruit per tree Figure 3) However at higher
crop loads increased temperatures (+2 degC scenario) resulted in reductions in predicted fruit weights
and yields (for the given crop load Figure 3) from more respiration The largest predicted fruit
weight was 186 g (+2 degC scenario without netting and a crop load of 25 fruit per tree) The smallest
predicted fruit weight was 100 g (+2 degC scenario under netting with a crop load of 450 fruit per tree)
The highest yield predicted was 713 tha (201213 scenario without netting and a crop load of 450
fruit per tree)
10
Figure 3 Predicted A) fruit weight and B) yield under measured 201213 temperature conditions (201213)
and with a 2 degC temperature increase (+2 degC) for netted (Net) and non-netted (NN) Royal Gala trees
At low crop loads trees were able to match supply of photosynthates to fruits with demand on most
days (Figure 4) resulting in high fruit weights At higher crop loads supply of photosynthates to
fruits did not match demand on a greater number of days (due to increases in respiration) Figure 4
demonstrates how timing of availability of photosynthates and fruit growth patterns could influence
fruit growth and yield responses to warmer climate scenarios Fruit demand for photosynthates was
predicted to be higher under the +2 degC scenario than the 201213 scenario Although total
production of photosynthates was similar under the +2 degC and 201213 scenarios timing of
availability differed More photosynthate was available under the +2 degC scenario (than the 201213
scenario) early in the season coincident with low fruit demand (Figures 2 and 4) Later in the season
(when fruit demand for photosynthate was greater) the 201213 scenario tended to have more
photosynthate available (Figures 2 and 4)
11
Figure 4 Effects of increased temperatures and crop load on daily A) fruit demand for photosynthates B)
supply of photosynthates to fruit and C) the balance between supply and demand for photosynthates
12
4 Discussion and Conclusions
41 Evaluation of lsquoMaluSimrsquo
The predictive ability of MaluSim for Royal Gala was found to be adequate if adjustments to shoot
and spur numbers in line with observed light interception values are made MaluSim better
predicted fruit weight for netted compared with non-netted trees MaluSim tended towards
overestimating fruit weight for the non-netted trees (points above the line Figure 1) This is more
likely the result of management intervention than differential model performance between netted
and non-netted systems
Potential causes of the modelled overestimate for the non-netted trees may be due to tree stress
andor crop load management Considering tree stress evaporative demand and hence tree water
requirement is higher in non-netted orchards than netted orchards Non-netted trees may have
suffered transient water stress if either irrigation volume or frequency of irrigation events did not
match tree water requirements Noting that the orchard manager did supply more water to the non-
netted trees it is not clear whether this was sufficient to avoid tree stress
Regarding crop load management the non-netted site was thinned later than the netted site This
means that less carbon was available for the early-season growth of retained fruit on the non-netted
trees compared with the netted trees This could have contributed to slower fruit growth rates early
in the season in the non-netted trees than the netted and subsequent lower than predicted fruit
weight at harvest
MaluSim was designed as a model to evaluate potential yield That is expected yield assuming ideal
conditions Given the model design for potential yield not field yield it is reasonable to expect the
model will have a tendency to overestimate fruit weight in many commercial orchard situations
Furthermore evaluation of the performance of MaluSim needs to consider possible measurement
errors (ie errors in model inputs and observed parameters) use of the model outside the range of
parameters for which it was constructed and failure of observations to meet particular model
assumptions At a practical level the programing language used for MaluSim (Stella) limits use of
MaluSim for investigation of potential climate impacts Ideally such investigations would involve
modelling many iterations of simulated weather data to account for natural variability in climate and
use of multiple climate change models At present MaluSim requires the user to lsquorunrsquo each scenario
individually and manually extract data summaries making such detailed investigations impractical
These issues are discussed in greater detail by Darbyshire and McClymont (2016) who concluded
that positive validation of MaluSim under Australian conditions was not achieved based on poor
prediction of yield by MaluSim for Royal Gala and Cripps Pink at multiple sites in Australia However
performance of MaluSim in predicting fruit weight of Royal Gala trees at the North Shepparton site
with adjustment for light interception and consideration of environment and management impacts
supported use of the model for preliminary investigation of influences of climate change on
potential yield
13
42 Predictions of apple yield under a warmer climate
The following points consider the main findings of modelling potential yield under a warmer climate
and factors that could modulate yield response or improve model performance are discussed
- The predicted impact of increased temperatures (+ 2 degC) on yield was minor under the
conditions modelled in this investigation (-16 to +13 tha) dependent on crop load and
presence or absence of netting)
- Given that growers are most likely operating in the medium to high crop load range yield of
Royal Gala apples in north Victoria would be expected to remain unchanged or fall slightly
under a warmer climate This outcome is similar to that projected by Stockle et al (2010) for
apples grown in Washington State USA Although the response predicted by Stockle et al
appeared to be based on earlier harvest date Whereas yield loss in our modelling resulted
from source limitations during the fruit growth period
- Yield could be maintained by increasing crop load However at high crop loads additional
yield loss may occur due to increased downgrading or cullage of small fruit as average fruit
weight falls Avoidance of such additional losses would require either adjustment of market
expectations regarding fruit size or improved crop management to decrease variability in
fruit size
- Predicted yields were lower under netting than without netting Observed yields did not
support this finding and in the medium to long-term netting would offer greater yield
potential because of decreased occurrence of sunburn and hail damage It is noted that
netting reduced solar radiation by approximately 20 at the north Shepparton site
Modelling a greater reduction in solar radiation (30 ) lowered the crop load at which fruit
weight and yield began to fall in response to increased air temperatures (data not shown)
- The modelling undertaken in this investigation assumed no changes to budburst or harvest
date with increased temperatures Darbyshire et al (2016) reported that that most pome
fruit growing regions in Australia will have similar flowering phenology timing for 2030 whilst
progressive delays are expected for 2050 and 2090 Maturity and harvest could occur earlier
(Warrington et al 1999 Stockle et al 2010) or later (Iglesias et al 2002) under a warmer
climate with associated decreases or increases in yield potential and any shift will be
influenced by both physiological impacts of higher temperatures and market expectations
regarding fruit maturity and colour Colour development would most likely be impaired by
higher temperatures (Faragher 1983 Iglesias et al 2000 2002)
- This investigation focussed on the period from budburst to harvest Later season effects
including timing of leaf fall should be considered Accumulation of reserves during the
period from harvest to leaf fall will affect tree performance in the following season (Greer et
al 2002)
- Royal Gala is an early season variety and is picked in late January Late season varieties may
experience greater negative impacts of increased temperatures on accumulation of
photosynthates during the fruit growth period and subsequently yield
- A uniform increase in air temperature is unlikely across the season Use of a climate model
that predicts within season variation in temperatures could further emphasise disparities
between photosynthate supply and demand at particular growth stages
- The modelling undertaken in this investigation did not consider possible effects of elevated
atmospheric carbon dioxide (CO2) concentrations To include this aspect greater
14
understanding of apple tree functioning under both higher CO2 levels and higher
temperatures need to be understood Stockle et al (2010) estimated changes in apple yield
under future climate change with and without an enhancing effect of CO2 Without an
enhancing effect of CO2 apple yields were projected to fall slightly Increases in yield were
expected when increased CO2 was incorporated in modelling However notably they
commented that ldquoprojections for apples are more uncertain as tree fruit models are less
developed and previous studies are not availablerdquo
15
References
Darbyshire R and McClymont L 2016 Technical Report Assessing the potential yield model
lsquoMalusimrsquo Milestone Report 63 PICCC Project 440 Crossing the threshold adaptation tipping
points for Australian fruit trees
Darbyshire R Webb L Goodwin I and Barlow S 2013 Impact of future warming on winter chilling
in Australia International Journal of Biometeorology 57355ndash366
Faragher JD 1983 Temperature regulation of anthocyanin accumulation in apple skin J
Experimental Botany 34(10) 1291ndash1298
Greer DH Wunsche JN and Halligan EA 2002 Influence of postharvest temperatures on leaf gas
exchange carbohydrate reserves and allocations subsequent budbreak and fruit yield of Braeburn
apple (Malus domestica) trees New Zealand J Crop Hort Sci 30 175ndash186
Iglesias I Graell J Echeverria G and Vendrell M 2000 Orchard cooling with overtree sprinkler
irrigation to improve fruit color of lsquoDeliciousrsquo apples HortScience 35(7) 1207ndash1208
Iglesias I Salvia J Torguet L and Cabuacutes C 2002 Orchard cooling with overtree microsprinkler
irrigation to improve fruit colour and quality of lsquoTopred Deliciousrsquo apples Scientia Hort 93 39ndash51
Lakso AN 1992 The simplified dry matter production model for apple estimation of canopy
photosynthesis in discontinuous canopies Acta Hort 313 45ndash51
Lakso AN Greene DW and Palmer JW 2006 Improvements on an apple carbon balance
model Acta Hort 707 57ndash61
Lakso A and Johnson RS 1990 A simplified dry matter production model for apple using automatic
programming simulation software Acta Hort 276 141ndash148
Lakso AN White MD and Tustin DS 2001 Simulation modeling of the effects of short and
long-term climatic variations on carbon balance of apple trees Acta Hort 557 473ndash480
Putland D Deuter P Hayman P Hetherington S Middleton S Nidumolu U Nimmo P Thomas D
Wilkie J Williams D 2011 The apple amp pear industryrsquos response to climate change and climate
variability a desktop study Growcom Fortitude Valley QLD Australia
McClymont L and Goodwin I 2013 Understanding apple and pear production systems in a changing
climate Milestone 2 Progress report on Vic phenology data and the effects of netting on fruit
temperature AP12029
McClymont L Goodwin I and Sessions W 2013 Net benefits ndash the sun protection factor in 2050
Australian Fruitgrower July 28ndash31
Stockle CO Nelson RL Higgins S Brunner J Grove G Boydston R Whiting M and Kruger C 2010
Assessment of climate change impact on Eastern Washington agriculture Clim Change 102(1-2)
77ndash102
Warrington IJ Fulton TA Halligan EA and de Silva HN 1999 Apple fruit growth and maturity are
affected by early season temperatures J Amer Soc Hort Sci 124(5) 468ndash477
Zibordi M 2010 Crop load control in apple via shading exploring the potential of carbon
unbalances to manage fruit growth and tree performance PhD dissertation Universitaacute di
Bologna
Grower workshops ndash AP12029 Apples and pears in a changing climate 1
Understanding apples and pears in a changing climate overview
of the grower workshops
Jenny Treeby Department of Economic Development Jobs Transport and Resources
September 2016
Grower Workshops 2013
Three technical working group meetings were conducted during August (Queensland)
September (South Australia) and October (Victoria) involving 32 growers industry
representatives and service providers The purpose of the technical working groups was to
present relevant local research outcomes as well as identifying gaps in growersrsquo knowledge
around climate change that could be addressed at a later date
The technical working group locations and members were identified using input from DAFWA
DAFF QLD DEPI VIC Lenswood Co-op and APAL South Australia was suggested by APAL
Each technical working group was based on an already existing group and the meetings
scheduled to coincide with other meetings to gain maximum feedback and avoid meeting
fatigue and poor attendance
Format and information provided was tailored to the specific needs of the group based on
input from local industry development officers APAL and the research organisations involved
The Queensland working group session was structured around a presentation of the current
project as well as a questionnaire and the South Australian and Victorian sessions started
with an interactive presentation about chill and in the case of Victoria fruit temperature
followed by a 60-90 minute facilitated QampA session
Outcomes from the workshops varied depending on the location
- The Queensland workshop discussions focussed on the impact of extreme weather with
most growers agreeing that climate change and climate variability impacted on their
orchards lack of rain rain at the wrong time erratic bloom poor colour development
and hail damage all scored highly in the survey
- In South Australia the discussions centred on inconsistency in the reporting of chill
depending on the model used chill hours chill units or chill portions The lack of
conversion factors was mentioned Only the dynamic model which uses chill portions
predicted a high chill season based on local data This was consistent with the short
intensive flowering observed Post-session feedback was positive with suggestions made
to repeat the working group next year albeit to a larger audience as part of the national
workshop series
- In Victoria discussions also focussed on chilling models and temperature thresholds that
lead to heat-related fruit damage in the Goulburn Valley Again informal feedback was
Grower workshops ndash AP12029 Apples and pears in a changing climate 2
positive with the suggestion made to communicate more results as they become
available through emails or workshops
Grower workshops 2014
Three workshops for apple and pear producers were conducted in production regions in
collaboration with apple and pear growersrsquo organisations during May (Victoria) July
(Queensland) and September (Western Australia) Nearly 50 producers industry
representatives and service providers participated The purpose of the workshops was to
present an outline of the project to present relevant local research outcomes and to review
the last season to identify production trends and issues share lessons learnt and identify
future trends and issues
Nearly 50 producers industry representatives and service providers participated in this round
of workshops The purpose of these workshops was to present research outcomes from the
first three years of the project such as the modelled predictions for the regions and relevant
local climate change impacts as well as adaptation strategies and to seek feedback on the
past season perceived climate change risks and the project itself Each interactive workshop
was tailored to the individual needs of the three targeted groups through either general
presentations on climate change research intensive training in the Climate Change Risk
Management Matrix andor site specific presentations on modelled chill requirements and
heat damage projections
Additionally in order to reach a much wider pome fruit audience project outcomes were
highlighted at the 2015 National Horticulture Convention of APAL and AUSVEG where team
members across all participating research organisations were present at the Horticulture
Centre of Excellence stand to answer growersrsquo questions and get feedback on the project
Grower workshops 2015
Three workshops were held in apple and pear production regions to communicate up-to-date
research outcomes such as the model predictions from the last three years to industry in a
consistent manner as well as gathering information about the past season perceived climate
change risks and feedback on the project to 48 growers
Each workshop was held in conjunction with or as part of an industry forummeetingtour to
attract as many growers as possible and to avoid meeting fatigue
The workshops were held in Applethorpe (QLD) in conjunction with the Perth Hills Orchard
Improvement Group during their QLD study tour in July as a stand-alone Climate Change
Risk Management Matrix session with QLD growers in Applethorpe in July and a climate
change workshop in Bilpin (NSW) in September
Grower workshops ndash AP12029 Apples and pears in a changing climate 3
Seventeen growers from the Perth Hills Orchard Improvement Group visited the Applethorpe
Research Station as part of their QLD study tour As the central part of their half day tour of
the research station a climate change workshop event was held to discuss some of the
outcomes from current research and in particular some of the issues facing the growers in the
Perth Hills district This region was not part of the WA grower workshop event held in Manjimup
in 2014
During the workshop presentations were made by Heidi Parkes Peter Nimmo and Allan
McWaters about the climate change research project currently underway including the modelled
predictions management of QFF (one concern under a changed climate) and new apple
varieties better suited to different disease and climate pressures
The Climate Change Risk Management Matrix is a tool developed by DAF QLD to address
uncertainty by identifying the impacts risk and vulnerability associated with climate change
and adaptive responses Identifying and analysing risks and opportunities using this risk
management approach can help to plan responses to climate variability and climate change
and thus enable growers to be proactive and more effective in adapting to future uncertainty
This tool has been adapted to be used not only in grains and meat and wool production but
also in horticulture
As New South Wales has not been included in former National Roadshow tours and based on
interest shown from the Sydney Basin area Kevin Dodds from NSW DPI and an interested
grower in Bilpin Bill Shields were contacted and a workshop organised The interactive
workshop on a growerrsquos property with about 25 participants entailed a tailored winter chill
presentation by Rebecca Darbyshire (The University of Melbourne) introduction to climate
change impacts on pome fruit and research outcomes from the project such as the latest
dormancy breaker research from QLD by Heidi Parkes as well as modelled predictions for the
region plus a field walk The session was organised facilitated and evaluated by Kevin Dodds
(NSW DPI) and Jenny Treeby (DEDJTR VIC) In the evaluation growers pinpointed earlier
bud burst flowering and maturity as well as sunburn as their main climate change related
challenges The workshop gave them a better understanding of the complexity of factors
involved in budburst and flowering and the chill portions calculator was seen as an excellent
toolincentive to collect and utilise their own data better
In order to reach a much wider pome fruit audience project outcomes were displayed at the
Horticulture Centre of Excellence stand at the 2015 National Horticulture Convention A
poster six state specific chill fliers using the chill portions model the HIN (wwwhincomau)
project webpage and the chill calculator were used as a static display Additionally time was
made to meet the project researchers at the stand during program breaks an option which
was taken up by quite a few growers who felt that this was a great opportunity to have a
chat with a scientist
Grower workshops ndash AP12029 Apples and pears in a changing climate 4
Lessons learnt
1 Having a core team responsible for communication (Heidi Parkes DAF QLD) Susie
Murphy-White (DAFF WA) Rebecca Darbyshire (UoM) and Jenny Treeby (DEDJTR
VIC) ensured timely relevant and consistent information was being made available to
growers at the workshops and the APAL conference This also emphasised a multi-
state approach (including New South Wales) and added importance to the project
outputs and resulted in messages such as in New South Wales where the presenters
were thanked for their presentations and the effort made to come to that location
2 Presenting locally relevant data using model predictions established within the
projects by researchers resulted in the grower audience being engaged and feeling
confident to ask questions and provide feedback and lessons learnt in their orchard
3 Utilising well established grower groups such as in Queensland and New South Wales
as well as local well respected extension officers (Front Line Advisors) such as Clinton
McGrath (DAF QLD) and Kevin Dodds (NSW DPI) ensured ease of facilitation
4 Evaluation of workshops is still suffering from low return rates of around 50 of even
short evaluation forms possibly due to a lack of understanding of the importance of
this form of feedback Interactive keypad technology as employed in the last round
seems to have had a better return rate (possibly due to novelty factor) and will be
contemplated for further projects
5 Knowledge gaps identified as a result of these workshops include
varietal chill requirements for existing and new varieties
lack of understanding of the difference between chill hours units and portions
and the use of chill portions as the most accurate measure of winter chill available
adaptation strategies to heat stress
does soil temperature influence endo and or ecto dormancy
do phenology models based on meteorological data adequately represent buds
within a tree
is the current knowledge of pome fruit physiology extensive enough to be able to
accurately predict winter chill accumulation processes
there is a strong focus on the potential impact of extreme events on the industry
under future climate scenarios with less understanding about the potential
impacts of more subtle increases in temperature
need for more accurate in-season and longer term climate forecasting to enable
growers to take actions that reduce climate risk
Resources
httpwwwhincomauprojectsapple-and-pear-production-in-a-changing-climate
Grower workshops ndash AP12029 Apples and pears in a changing climate 5
httpwwwhincomauprojectswinter-chill-and-fruit-trees
regional-chill-accumulation-victoria
regional-chill-accumulation-queensland
regional-chill-accumulation-for-new-south-wales
regional-chill-accumulation-for-south-australia
regional-chill-accumulation-for-tasmania
regional-chill-accumulation-for-western-australia
Blogs
httpwwwhincomauprojectsapple-and-pear-production-in-a-changing-climateexplore-
your-regional-climate
- AP12029 cover sheet
-

3
Impacts of warming temperatures on yield 37
Communication development and extension 37
Evaluation and Discussion 39
Measuring project impact 39
Effectiveness of project activities in delivering project outputs and achieving intended outcomes 40
Feedback on activities and quality and usefulness of project outputs 41
Key learnings 42
Recommendations 46
Industry 46
Extension and communications 47
Scientific 47
Scientific Refereed Publications 50
Intellectual PropertyCommercialisation 51
Acknowledgements 52
Appendices 53
References 54
Table of figures
Figure 1 Research sites were located in Applethorpe (Qld) Shepparton (Vic) Manjimup (WA) and
Huonville (Tas) Orange (NSW) and Mt Barker (SA) were included in the climate data analysis 12
Figure 2 Annual anomaly in accumulation of chill portions (1 Mar to 31 Aug) Anomalies are the
difference between the yearly value and a base period of 1981 to 2010 The black line is an 11-year
moving average 21
Figure 3 Annual anomaly in average number of days where maximum temperature exceeds 35deg C
Anomalies are expressed as the difference between the yearly value and a base period of 1981 to 2010
The black line is an 11-year moving average 22
Figure 4 Chill accumulation in Shepparton Applethorpe and Manjimup in 2012 to 2015 Number in
brackets is the total chill portions received up to 31 Aug 24
Figure 5 Green tip (green) and full bloom (pink) dates for apple cultivars in Applethorpe Shepparton and
Manjimup Data is the average of observations from 2012 to 2015 with bars indicating the confidence
interval 25
Figure 6 The Chill-Overlap Model for flowering in apple Cr is minimum chill required for flowering Co is
4
the maximum additional chill that will reduce the heat requirement Hr is the heat required when Co chill
is accumulated and Ho is the maximum possible heat requirement for flowering (Redrawn from
Darbyshire et al 2016) 28
Figure 7 Variable bud burst and flowering in Cripps Pink Manjimup spring 2014 30
Figure 8 Green tip first flower and full bloom in Gala apples treated with and without dormancy
breaking sprays Dormexreg Waikenreg and Erger in Huonville Applethorpe and Manjimup in 2015 31
Figure 9 Fruit surface temperature (degC) recordings and related air temperatures (degC) Necrosis and
browning fruit surface temperature thresholds represent 52 and 478 degC respectively Figure sourced
from Darbyshire et al 2015 33
Figure 10 Western Australian netting demonstration site at the Lyster Matijari Orchard Manjimup 36
Figure 11 Fruit surface temperature (FST) and air temperature measured in the black net white net and
no net rows at the Lyster Matijari orchard (Manjimup) from February to mid-March 2014 36
Table of tables
Table 1 Average chill portions (1 Mar to 31 Aug) for 2030 and 2050 using a minimum to medium
(RCP45) and worst (RCP85) case scenario The average is of 30 years with the lowest and highest chill
portions in brackets 23
Table 2 Chilling requirements of apple cultivars and a crab apple polliniser cultivar measured in chill
portions chill units and chill hours 27
Table 3 Average date of full bloom for lsquoCripps Pinkrsquo apple in 2030 and 2050 using a minimum to medium
(RCP45) and worst case scenario (RCP85) modelling approach 29
Table 4 Distribution of potential damage days in January for sites in Australiarsquos growing regions for 10th
50th and 90th percentiles of data Table sourced from Darbyshire et al 2015 33
Table 5 Average sunburn browning risk (percentage of days in the January to February period) for lsquoRoyal
Galarsquo apples grown at sites across Australia with and without netting 35
Table 6 Barriers to communication and extension around climate change adaptation 41
5
Summary The objective of this project was to reduce the vulnerability of the Australian apple and pear industry to
climate change by investigating the potential impacts of a changing climate on winter chill flowering
fruit sunburn and yield exploring the effects of adaptation such as netting and dormancy-breaking
products and developing and extending appropriate adaptive responses to industry The project used a
broad range of research and technology transfer activities encompassing field observational data
collection controlled environment experimentation biophysical modelling website development
communication and extension
Australia has undergone a consistent warming trend since 1910 however analysis of historical climates
undertaken in this project indicated that the experience of climate change has been different in each
pome fruit growing region For example milder pome fruit growing regions of Australia have experienced
a decline in annual winter chill accumulation since 1968 while the colder regions of Huonville and Orange
have not changed In modelling studies of future climate scenarios warmer locations were projected to
experience a reduction in winter chill of more than 20 by 2050 with a decline of less than 10 to 14
projected for the coldest production areas over the same period
Flowering observations from 2012 to 2015 indicated that low winter chill in Manjimup was associated with
greater variability in flowering dates between seasons cultivars and individual trees and irregular and protracted flowering across most apple cultivars relative to Applethorpe and Shepparton The variable
pattern of flowering observed in Manjimup was likely the result of mild winter conditions and inadequate
chilling for some cultivars Use of climate analogues and modelling analyses suggest that milder winter
growing regions of Australia are likely to experience symptoms of inadequate chilling with increasing
frequency in future years
Projections from the chill-overlap model for timing of full bloom in lsquoCripps Pinkrsquo apple in 2030 and 2050
projected an earlier full bloom date on average at high chill locations in 2050 and a later full bloom date
at the milder winter locations by 2030 with flowering dates delayed by more than a week in 2050 Trials
with dormancy-breaking sprays demonstrated that they are likely to be a viable adaptation tool for some
cultivars in lower winter chill years but matching cultivars with climate is the preferred adaptation option
Results from the climate modelling showed that by 2030 all pome fruit growing regions will experience
an increase in the average number of extreme heat days during the summer growing season Netting will
reduce the risk of sunburn damage as air temperature thresholds for damage of fruit under netting were
shown to be higher than thresholds for fruit without netting Findings from the Western Australian netting
demonstration site showed little difference in air temperature conditions winter chill or flowering dates
under the white netted black netted and non-netted orchard blocks Black and white netting were
equally effective in reducing fruit surface temperatures over the late summer period compared with the
no net apples
The project highlighted the need for detailed information to enable growers to match apple and pear
cultivars with suitable growing climates including matching chilling requirements with winter chill and
heat tolerance with summer temperatures Comprehensive guidelines on orchard practices for managing
extreme heat (including tree canopy structure use of evaporative cooling netting types plant growth
regulators and stress reduction chemicals) are also recommended
It is clear from the project outcomes that climate change will add significant variability into the pome fruit
production system with respect to flowering and fruit quality Australian growers are used to dealing with
some level of climate variability and it seems likely that impacts on flowering and fruit quality will be
within the range of grower experience up to around 2030 but that by 2050 growers will be operating
outside of current experience This will present challenges for the Australian industry in the consistency of
supply and in maintenance of the uniform orchard blocks
A series of recommendations were developed along with a list of significant research gaps to assist the
Australian apple and pear industry reduce the risks associated with climate variability and climate change
6
Keywords Climate change scenarios climate change impact climate change adaptation dormancy winter chill
flowering extreme heat sunburn browning netting
Key personnel
Department of Agriculture and Fisheries Queensland
Heidi Parkes (project leader) Neil White Osi Tabing Peter Nimmo Allan McWaters John Wilkie and
Clinton McGrath
Department of Economic Development Jobs Transport and Resources Victoria
Ian Goodwin Jenny Treeby Lexie McClymont and Susanna Turpin
Pomewest Western Australia
Susie MurphyWhite
Department of Agriculture and Food Western Australia
Lisa Starkie and Martine Combret
Tasmanian Institute of Agriculture University of Tasmania
Sally Bound
University of Melbourne
Rebecca Darbyshire (leader of the Federal Department of Agriculture funded project lsquoCrossing the
threshold adaptation tipping points for Australian fruit treesrsquo and project collaborator)
7
Introduction Australiarsquos climate has warmed since 1910 and is likely to continue warming with more hot days and
fewer cold days expected in the future (State of the climate 2016) Research has broadly identified a
range of potential impacts of climate change on the productivity and profitability of the Australian apple
and pear industry including inadequate winter chilling increased fruit sunburn and changes to the upper
limit of pome fruit productivity (Darbyshire et al 2013b Putland et al 2011) However the nature and
timing of these potential impacts in different growing regions across Australia remains unclear
Understanding climate change impacts is essential for the timely implementation of appropriate
adaptation strategies (Cobon et al 2009)
Future changes in climate are predicted to result in reduced winter chilling in many apple and pear
growing regions of Australia (Darbyshire et al 2013b Hennessy et al 1995) It is not yet clear what the
impact of this will be on the timing and quality of bud dormancy release and flowering in commercial
pome fruit cultivars and therefore the potential impacts on productivity Advancement in flowering with
increased historical temperature has been observed in temperate fruit trees globally (Legave et al
2013) however effects of recent warming on flowering in Australian pome trees are less obvious
(Darbyshire et al 2013a) Options for adaptation to lower winter chill include appropriate cultivar
selection and the use of plant growth regulators however current understanding around cultivar chilling
requirements and the use of dormancy-breaking sprays to compensate for a lack of winter chill is poor
The risk of fruit sunburn damage is likely to increase under future climates and associated rising summer
temperatures Predictions regarding changes to sun damage risk and evaluation of adaptation options are
therefore important for future planning In Australia apple growers currently estimate typical losses to
vary from 6 to 30 depending on season and fruit cultivar (Lolicato 2011)
Netting has been identified as a potential climate change adaptation strategy to reduce fruit exposure to
solar radiation and hence reduce sunburn damage while also providing protection from hail events
Practical questions remain on the use of hail netting particularly in warm growing regions including the
effect of different types of netting (weave density and colour) on temperature fruit quality and yield The
effectiveness of netting as an adaptation strategy to reduce the risk of sunburn browning under predicted
climate change is also unknown
Project objectives The broad objective was to reduce the vulnerability of the Australian apple and pear industry to climate
change through 1) investigation of the overarching research question lsquoWhat are the potential impacts of
a changing climate on apple and pear production in Australia and how can the industry adapt to minimize
the risksrsquo and 2) developing and extending appropriate adaptive responses to industry
Specific objectives for the research component of the project were to
1 Develop climate change scenarios for pome fruit growing regions of Australia in 2030 and 2050
including the likely impact of climate change on winter chill and extreme heat
2 Understand how changes in autumn winter and spring temperatures might impact the timing
and quality of flowering in cultivars of apple and pear
8
3 Identify adaptations to manage any negative effects of climate change on flowering
4 Understand how changes in the frequency of extreme heat days might impact on the incidence of
sunburn in pome fruit and the effectiveness of netting as an adaptation strategy
5 Understand how different colours of netting impact on the orchard environment fruit yield and
quality
6 Understand how the changing climate might impact the yield potential of apples
The development and extension components of the project were targeted at the Australian apple and
pear industry Target groups were apple and pear growers industry consultants Apple and Pear Australia
Limited (APAL) and temperate fruit tree researchers Specific objectives of this component were to
1 Facilitate greater understanding of how the climate is likely to change by 2030 and 2050 in apple
and pear growing regions of Australia how this might impact on apple and pear production and
potential adaptation strategies to reduce the associated risks
2 Increase knowledge and skills to enable informed decision-making around climate change
adaptation and orchard investment and planning based on scientific evidence
3 Build a connected and collaborative approach between research partners funding bodies
industry and growers around managing and adapting to climate change
9
General methodology The objectives were investigated through a broad range of research and technology transfer activities
encompassing field observational data collection controlled environment experimentation biophysical
modelling website development written and oral communication and extension The project combined
research of immediate adaptive responses to current climate risks with long-term climate change impacts
and adaptation The general methodological approach and associated activities undertaken for each of
the stated project objectives are described in this section Details of specific methods are given in the
appropriate appendices as indicated in the text
Research methodology
The approach was to validate and refine models of flowering time fruit surface temperature and yield
potential and use them in conjunction with regional climate projections to model the effects of the
changing climate on apple and pear production systems and the effectiveness of specific adaptation
strategies Climate analogues were also investigated as an alternative approach to understanding climate
change impacts and adaptation
1 Develop climate change scenarios for pome fruit growing regions of Australia in 2030 and
2050 including the likely impact of climate change on winter chill and extreme heat
Future climate scenarios were constructed for two representative concentration pathways (RCPs) RCP45
(minimum to medium case scenario) and RCP85 (worst case scenario) to represent a plausible range of
future climates (Appendix 1) RCPs are greenhouse gas concentration trajectories adopted by the
Intergovernmental Panel on Climate Change in its fifth Assessment Report in 2014 (a detailed description
of these is given in Appendix 1) Scenarios were developed for 2030 and 2050 to support the mid to long-
term orchard decision-making process Trees planted in 2017 will be in their 13th leaf in 2030 the height
of production and therefore planting decisions made now will impact orchard profitability in 2030
Climate projections were not made beyond 2050 due the high degree of climate uncertainty associated
with long-term projections
Climate scenarios were expressed in terms of relevant horticultural metrics (chill portions and number of
sunburn browning risk days) rather than simply as mean temperature changes to enable better
understanding of how warming temperatures might impact pome fruit production
Winter chill was calculated in chill portions using the Dynamic Model (Erez et al 1990 Fishman et al
1987) This is the current lsquobest-practicersquo model and has been shown to perform better than other models
for calculating winter chill particularly in mild winter climates such as Australia (Luedeling et al 2011)
2 Understand how changes in winter and spring temperatures might impact the timing and
quality of flowering in cultivars of apple and pear
Detailed baseline data sets for temperature bud burst and flowering were collected from three
climatically distinct pome fruit growing regions of Australia (Applethorpe Queensland Manjimup
Western Australia Shepparton Victoria Figure 1) for apple and pear cultivars and their pollinisers from
2012 to 2015 Phenology observation and collection methodology was standardised across locations
making this dataset unique in Australia
The data set was used to assess the variation in bud burst and flowering time across locations seasons
10
and cultivars (Appendix 2) and to validate a phenology model (chill overlap model (Darbyshire et al
2016)) for prediction of flowering time in apple now and under future climates (Appendix 1)
Climate analogue analysis involves a detailed comparison between locations where the current climate of
one location is similar to the projected future climate of the location of interest This approach was
investigated using Stanthorpe as a case study to predict impacts of climate change on pome fruit
flowering in Stanthorpe and to identify possible methods for adaptation (Appendix 3)
3 Identify adaptations to manage any negative effects of climate change on flowering
Forced bud experiments using controlled environment conditions were undertaken to determine cultivar
chilling requirements for use by industry in selection of suitable cultivars for different winter chill
climates Methods for collecting bud burst and flowering records were developed for growers to use for
assessing cultivar performance in their local climate (Treeby et al 2017a)
A one-year trial was conducted in three locations (Applethorpe Queensland Manjimup Western
Australia Huonville Tasmania) to determine the efficacy of using dormancy-breaking sprays in Gala as
an adaptation to low winter chill years (Appendix 4)
Potential adaptations were also identified through the capture of grower experiences at national grower
workshops and industry conferences
4 Understand how changes in the frequency of extreme heat days might impact on the incidence
of sunburn in pome fruit and the effectiveness of netting as an adaptation strategy
Two methodological approaches were taken using weather and fruit surface temperature data collected
from two adjacent lsquoRoyal Galarsquo sites in Shepparton Victoria one netted and one non-netted site The first
approach was to determine minimum air temperature thresholds for lsquoRoyal Galarsquo apples grown with and
without net with potential to lead to sunburn damage under current climates (Appendix 5) Once
established these minimum air temperature thresholds were used to investigate the frequency of days
exceeding these threshold air temperatures in current and future climates The future sunburn risk and
the effectiveness of netting in reducing this risk was determined for growing locations around Australia
for 2030 and 2050 (Appendix 1 and 7)
The second approach was to validate the thermodynamic Smart-Sinclair model for prediction of fruit
surface temperature (Appendix 6)
5 Understand how different colours of netting impact on the orchard environment fruit yield
and quality
A netting demonstration site was established over a block of lsquoCripps Pinkrsquo trees in Manjimup Western
Australia to expand on results from existing studies on the effects of netting on air temperature relative
humidity wind and solar radiation (Darbyshire et al 2015 Middleton et al 2002) and to compare the
effects of black and white net on the orchard environment flowering fruit yield and quality (Appendix 8)
6 Understand how the changing climate might impact the yield potential of apples
An apple physiological model MaluSim (Lakso et al 1990) was used to understand the effects of
predicted climate change on net carbon exchange of apples and the upper limit of apple production (yield
11
potential) The model was evaluated for lsquoRoyal Galarsquo with regard to prediction of apple yield under
current Australian conditions in netted and non-netted orchard sites and yield was predicted under
warmer future climate conditions (Appendix 9)
Development and extension methodology
Extension and research activities were coordinated and conducted side-by-side to encourage the flow of
information between growers industry representatives extension officers and researchers throughout
the project with industry feedback continuously informing the research
The technology transfer activities undertaken as part of the extension component are outlined under each
of the following objectives
1 Facilitate greater understanding of how the climate is likely to change by 2030 and 2050 in
apple and pear growing regions of Australia how this might impact on apple and pear
production and potential adaptation strategies to reduce the associated risks
Multiple activities were undertaken to provide information to and obtain feedback from the apple and
pear industry A review of available climate change information relevant to Australian apple and pear
growers was conducted at the project start to identify information needs A grower survey was
performed to gain insight into grower attitudes and knowledge in regards to climate change and its
impacts
Communication and extension was undertaken throughout the project and included two years of national
grower workshops (Appendix 10) regular publications in industry magazines and websites presentations
at industry conferences field days and seminars dedicated project web pages (APAL and Horticulture
Industry Network (HIN)) and general media items
Climate change information specific to Australiarsquos apple and pear industry was published in a series of
three grower publications at the conclusion of the project to communicate key project findings as well as
important climate change information for the industry generally (Treeby et al 2017a Treeby et al
2017b White et al 2017)
2 Increase knowledge and skills to enable informed decision making around climate change
adaptation and orchard investment and planning based on scientific evidence
The grower publications and winter chill website were designed to provide practical information to
growers for use in every day decision making and for long-term strategic planning
3 Build a connected and collaborative approach between research partners funders industry
and growers around managing and adapting to climate change
Relationships between stakeholders were established maintained and developed through
- Regular project teleconferences and face-to-face meetings
- Close links with the University of Melbourne project lsquoCrossing the threshold adaptation
tipping points for Australian fruit treesrsquo undertaken within the Primary Industries Climate
12
Challenges Centre (PICCC)1
- Meetings with APAL staff at the head office in Melbourne at conferences or via phone hook-
up
- Informal links with other apple and pear industry research programs such as the PIPS
program as well as with researchers and industry representatives from other horticultural
industries for example cherries and almonds
- Establishment of the netting demonstration site in Western Australia
- Data collection trials conducted on grower properties which provided avenues for informal
engagement growers
- Involvement and participation in industry conferences and events
- Organisation and participation in national grower workshops
- Involvement with the Climate Change Research Strategy for Primary Industries (CCRSPI)
- Involvement of post-graduate students and work experience students in project activities
Figure 1 Research sites were located in Applethorpe (Qld) Shepparton (Vic) Manjimup
(WA) and Huonville (Tas) Orange (NSW) and Mt Barker (SA) were included in the climate
data analysis
1 httpwwwpicccorgauresearchproject440
13
Outputs
Grower publications
Treeby J Goodwin I MurphyWhite S Darbyshire R White N McClymont L Richards S
Measham P Bound S and Parkes H 2017 Winter chill and flowering ndash what is there to know
Department of Agriculture and Fisheries Queensland
Treeby J Goodwin I MurphyWhite S Darbyshire R White N McClymont L Richards S Webb
L Erwin T and Parkes H 2017 Netting for heat ndash what is there to know Department of
Agriculture and Fisheries Queensland
White N Parkes H and Treeby J 2017 Future climates in pome fruit orchards ndash what is there to
know Department of Agriculture and Fisheries Queensland
Grower workshops
Heidi Parkes Jenny Treeby and Ian Goodwin presented ldquoclimate change impacts and adaptation research
for the pome fruit industryrdquo at Fruit Grower Victoriarsquos end of season review Mooroopna Vic 12
May 2014 httpwwwhincomauassociationsfruit-growersfgv-end-of-season-review
httpwwwhincomauresourcesextreme-heat-powerpoint-may-2014
httpwwwhincomauresourcesapples-and-pears-in-a-changing-climate-powerpoint-may2014
Heidi Parkes Neil White and Clinton McGrath presented an ldquoapple climate change workshoprdquo at
Applethorpe Research Facility Qld 23 July 2014
Heidi Parkes and Susie MurphyWhite presented ldquoapples and pears in a changing climaterdquo at an orchard
walk in Manjimup WA 1 October 2014 httpwwwhincomauassociationsapples-and-
pearspit-stop-wa-for-the-national-roadshow
Heidi Parkes presented a ldquowinter chill and floweringrdquo workshop for the Perth Hills Orchard Improvement
Group at Applethorpe Research Facility Qld 31 July 2015
Clinton McGrath Heidi Parkes and Neil White presented a climate change risk management matrix
workshop in Thulimbah Qld 5 August 2015
Heidi Parkes Rebecca Darbyshire and Jenny Treeby presented a ldquowinter chilling and climate adaptation
workshoprdquo in Bilpin NSW 16 September 2015
Websites and tools
White N and Parkes H 2017 Winter chill and growing degree day website an interactive tool to
calculate and interpret local chill and growing degree day accumulation httpshort-
scienceshinyappsioChillCalculator
Technical working group meetings
Queensland technical working group meeting facilitated by Clinton McGrath Applethorpe Research
Facility Qld 20 August 2013
South Australian technical working group meeting facilitated by Jenny Treeby and Paul James (Lenswood
Co-op) Lenswood SA April 2013
14
Victorian technical working group meeting facilitated by Jenny Treeby and Michael Crisera (Fruit Growers
Victoria) Shepparton Vic October 2013
Industry surveys
A nation-wide survey of apple and pear growers was developed and coordinated by Jenny Treeby (based
on input from DEDJTRrsquos Service Innovations branch) to ascertain growersrsquo attitudes perceptions
and knowledge of climate change 2013 httpswwwsurveymonkeycomsQTG7QKH
A nation-wide survey of apple and pear growers was developed and coordinated by Heidi Parkes Jenny
Treeby and Susie MurphyWhite to gauge grower understanding and perceptions of winter chill
2015
Industry articles
Calderon M 2014 Bud burst in lsquoWilliamsrsquo Pears highly variable Australian Fruitgrower 8(8) 32
Darbyshire R and Parkes H 2014 Whatrsquos the blooming difference Australian Fruitgrower 8(10) 30
Darbyshire R and Parkes H 2015 Get in the chill zone Australian Tree Crop Winter edition pp 14
Darbyshire R Goodwin I and MurphyWhite S 2016 New understandings to better predict apple
flowering- introducing the chill overlap model Australian Fruitgrower JuneJuly edition
httpapalorgauaustralian-fruitgrower-june-july-2016
McClymont L Goodwin I and Sessions W 2013 Net benefits- the sun protection factor in 2050
Australian Fruitgrower 7(6) 28-31
McClymont L Goodwin I and Sessions W 2013 Effectiveness of netting in reducing sun damage Part
I Tree Fruit August 5-8
McClymont L Goodwin I and Sessions W 2013 Effectiveness of netting in reducing sun damage Part
II Tree Fruit September 8-11
MurphyWhite S 2014 Netting the benefits of a changing climate Australian Fruitgrower 8(5) 21
httpapalorgaunetting-benefits-changing-climate
MurphyWhite S 2014 Manjimup apple update- netting quality results for south west apples South-West
AgMemo August issue 5 httpswwwagricwagovaunewsletterssouth-west-agmemo-august-
2014-issue-5page=02C3smartpaging_toc_p3_s0_h2
MurphyWhite S 2014 Blooms affected by winter chill South-West AgMemo October issue 5
httpswwwagricwagovaunewsletterssouth-west-agmemo-october-2014-issue-
5page=02C2smartpaging_toc_p2_s0_h2
MurphyWhite S 2015 Investigating fruit surface temperature in apples South West AgMemo February
issue 1 httpswwwagricwagovaunewsletterssouth-west-agmemo-february-2015-issue-
1page=08smartpaging_toc_p8_s0_h2
MurphyWhite S Prince R and Starkie L 2016 Black or white netting Is there a difference Or just a
preferencehellip WA Grower Autumn 68 - 70 httppomewestnetauwp-
contentuploadsnewslettersWAGROWERAutumn16_POMEWESTPDF
MurphyWhite S Prince R and Starkie L 2016 Black or white netting Is there a difference Or just a
preferencehellip VegetablesWA Autumn 71 - 73 httpwwwvegetableswacomauwa-growers-
magazine
15
MurphyWhite S Prince R and Starkie L 20152016 Black or white netting which is best Australian
Fruitgrower 9(11) 22 ndash 24 httpapalorgaublack-or-white-netting-which-is-best
Parkes H 2015 Producing Apples and Pears in a changing climate Australian Tree Crop Winter edition
26
Parkes H 20152016 Sharing ideas to climate change-proof orchards Australian Fruitgrower 9(11) 12
httpapalorgausharing-ideas-to-climate-change-proof-orchards
Parkes H MurphyWhite S and Bound S 2016 Dormancy-breaking sprays for low chill years
Australian Fruitgrower AugSept httpapalorgaudormancy-breaking-sprays
Parkes H MurphyWhite S and Bound S 2016 Dormancy-breaking sprays for low chill years (Part 1
and 2) Tree Fruit AugSept httpwwwtreefruitcomauorchardcrop-growth-
managementitem712-dormancy-breaking-sprays-for-low-chill-years
httpwwwtreefruitcomauorchardcrop-growth-managementitem723-dormancy-breaking-
sprays-for-low-chill-years-part-2
Parkes H White N and Darbyshire R 2015 Winter chill how did 2014 compare with previous years
Australian Fruitgrower 9(3) 32 ndash 33 httpapalorgauwinter-chill-how-did-2014-compare-with-
previous-years
Prince R and MurphyWhite S 2015 Netting trial results in WA Australian Fruitgrower 9(9) 26 - 29
httpapalorgaunetting-trial-results-in-wa
Thomson G McClymont L Goodwin I 2014 Sunburn protection Part 1 Adapt and limit apple sunburn
during heatwaves Tree Fruit November 5ndash9
Thomson G McClymont L Goodwin I 2014 Part 2 Orchard design tree training and pruning for
apple sunburn reduction Tree Fruit December 3ndash6
Thomson G McCaskill M McClymont L Goodwin I 2015 Part 3 Fruit protection with spray-on
products shade-netting or evaporative cooling can help reduce sunburn during heatwaves Tree
Fruit January 3ndash5
Thomson G McCaskill M McClymont L Goodwin I 2015 Part 4 Fruit protection with spray-on
products shade-netting or evaporative cooling can help reduce sunburn during heatwaves Tree
Fruit February-March 3ndash4
Thomson G McCaskill M McClymont L Goodwin I 2015 Part 5 Fruit protection with spray-on
products shade-netting or evaporative cooling can help reduce sunburn during heatwaves Tree
Fruit April 3ndash4
Treeby J 2014 Apple and pears weathering the climate Australian Fruitgrower 8(2) 18
Treeby J 2014 Research Roadshows on coping with extreme weather Australian Fruitgrower 8(10) 11
Wilkie J Combret M Goodwin I McGrath C McClymont L Middleton S Nimmo P Starkie L
Tabing O and Treeby J 2013 The apple and pear climate change research program Australian
Fruitgrower 7(6) 20-23
Industry conferences
MurphyWhite S 2015 Netting the benefits of climate change APAL Speed Updating Day National
Horticulture Convention Gold Coast 25 June httpapalorgauresearch-development-
extensionprojectsresearch-reviews
16
Parkes H 2015 Towards understanding bud burst and flowering in a changing climate approaches to
research and extension APAL Speed Updating Day National Horticulture Convention Gold Coast
25 June httpapalorgauresearch-development-extensionprojectsresearch-reviews
Parkes H 2016 Reducing vulnerability to a changing climate in Australian temperate fruit tree industries
CCRSPI 2016 conference- striving for climate resilience Sydney 27-28 April
httpwwwccrspinetaureducing-vulnerabilities-temperature-extremes
Parkes H 2016 Winter chill how much is enough for profitable yields APAL Industry Updating Day
National Horticulture Convention Gold Coast 23 June httpapalorgauwp-contentuploads5-
Heidi-Parkes_APAL_Industry_Updating_2016_withnotescompressedpdf
Wilkie J 2013 Understanding apple and pear production systems in a changing climate APAL speed
updating day Apple and Pear Industry Conference Gold Coast 17 July
Stakeholder and grower engagement
Lexie McClymont 2013 Outcomes from the fruit temperature and yield modelling research Fruit Growers
Victoria Young Growerrsquos group (Goulburn Valley) Shepparton Vic 24 October
Lexie McClymont 2013 Climate change and Horticulture - Impacts and Adaptation Meeting with DEPI
Deputy Secretary James Flintoft Tatura Vic 15 November
Heidi Parkes 2013 Understanding apple and pear production systems in a changing climate DAFFQ
regional stakeholders meeting Applethorpe Qld 26 November
Ian Goodwin 2014 Apple and pear productivity Reducing weather losses Meeting with DEPI Deputy
Secretary James Flintoft Tatura Vic 7 February
Susie MurphyWhite 2014 Extreme temperatures and sunburn Netting demonstration site orchard walk
Manjimup WA 23 April
Heidi Parkes 2014 Climate change impacts and adaptations for horticultural industries EE Muirs Pty Ltd
growerrsquos evening Stanthorpe Qld 23 October
Ian Goodwin 2015 Climate change project progression DEDJTR Victoria group Rural Development and
Transition Policy Tatura Vic 3 March
Heidi Parkes 2015 Approaches and challenges to studying climate change impacts on apple production
Applethorpe Research Facility open day Applethorpe Qld 1 April
Susie MurphyWhite 2015 Dynamic chill portions for pome fruit in WA Donnybrook Apple Festival WA 4
ndash 5 April
Jenny Treeby Susie MurphyWhite Rebecca Darbyshire and Heidi Parkes 2015 Winter chill poster- A bit
chilly Climate change project stand as part of the DEDJTR booth National Horticulture
Convention Gold Coast 25 - 27 June
Heidi Parkes 2015 Current research in the area of apple production in a changing climate Applethorpe
Research Facility Qld 24 November
Heidi Parkes 2015 Current and future research into climate change impacts and adaptation for the
Horticulture industry DAF South Regional Leaders Team and the Director General Applethorpe
Research Facility Qld 25 November
17
Susie MurphyWhite 2016 Dormancy-breaking spray trial Pomewest Growers Meeting Manjimup WA
17 May
Ian Goodwin 2016 Dealing with seasonal climate risk and extreme weather events Regional Innovation
Forum Tatura Vic 18 May httpwwwhincomauassociationshorticulture-centre-of-
excellenceregional-innovation-forum
Heidi Parkes 2016 Winter chill website Stanthorpe Apple Growerrsquos meeting Applethorpe Research
Facility Qld 26 May
Reports
Darbyshire R and McClymont L 2016 Assessing the potential yield model lsquoMaluSimrsquo The University of
Melbourne and Department of Economic Development Jobs Transport and Resources 27 pp
MurphyWhite S Prince R and Starkie L 2016 Western Australian apple netting demonstration site
Pomewest 24 pp
Parkes H and White N 2016 Flowering in pome fruit trees across Australia implications of a changing
climate Department of Agriculture and Fisheries Queensland 21 pp
Parkes H and White N 2016 A climate analogue approach to understanding the impact of climate
change on flowering in Australian temperate fruit trees Department of Agriculture and Fisheries
Queensland 17 pp
Parkes H MurphyWhite S and Bound S 2016 Dormancy-breaking sprays for low winter chill in
apples Department of Agriculture and Fisheries Queensland Pomewest University of Tasmania
28 pp
Treeby J 2013 Review of current apple and pear climate change grower information Department of
Economic Development Jobs Transport and Resources 6 pp
httpwwwhincomauresourcesreview-of-current-apple-and-pear-climate-change-information-
for-growers
Treeby J 2016 Understanding apples and pears in a changing climate overview of the grower
workshops Department of Economic Development Jobs Transport and Resources 5 pp
White N 2016 Analysis of historical and future climate and the production of pome fruit Department of
Agriculture and Fisheries Queensland 29 pp
Media items
ldquoNew Development Officer to continue research into climate changerdquo was published in AgMemo South
West Agricultural Region February 2014 Issue 1 The article introduced Susie Murphy White to
the West Australian growers httpswwwagricwagovaunewsletterssouth-west-agmemo-
2014-issue-1page=02C1smartpaging_toc_p1_s0_h2
Susie MurphyWhite 14 March 2014 Interviewed by ABC Rural on the Manjimup netting trial ldquoStates first
trial tests heat impactsrdquo httpwwwabcnetaunews2014-03-17apple-netting-trial5326112
Susie MurphyWhite 25 March 2014 Interviewed by GWN7 rural news on the use of netting to reduce
sunburn
18
lsquoClimate threats studiedrsquo was published in The Border Post and Warwick Daily News Southern Downs
Qld 16 December 2014 Heidi Parkes was interviewed for the article
httpwwwruralweeklycomaunewsclimate-threats-studied2485263
lsquoA model for the futurersquo was published in the Bush Telegraph Southern Downs Qld 9 April 2015 The
article featured a summary of the presentation given by Heidi Parkes on the climate change
research program at the Applethorpe Research Facility open day
Horticulture Innovation Australia media release 13 April 2015 Reducing the vulnerability of apple and
pear production to a changing climate
Heidi Parkes 21 April 2015 Interviewed by Australian Rural Communication Network on reducing the
vulnerability of apple and pear production to a changing climate
lsquoClimate research crucial for apple and pear growers in Australiarsquo was published by The Weekly Times
Vic 8 July 2015 Heidi Parkes was interviewed for the article following the Speed Updating Day
presentation at the National Horticulture Convention
httpwwwweeklytimesnowcomauagribusinesshorticultureclimate-research-crucial-for-apple-
and-pear-growers-in-australiastory-fnker6g8-1227431799897
Susie MurphyWhite 18 August 2015 Interviewed by ABC local radio morning rural report on the progress
of winter chill in the South West of WA
Heidi Parkes 28 October 2015 Interviewed by the ABC Country hour Tasmania during the Greenhouse
2015 conference in Hobart on the potential impacts of warming climate on Australiarsquos apple and
pear industry
Heidi Parkes 23 June 2016 Interviewed live by the ABC Country hour during the 2016 National
Horticulture Convention on potential impacts of warming climate on Australiarsquos apple and pear
industry
Project web pages factsheets and online information
Horticulture Industry Network project page httpwwwhincomauprojectsapple-and-pear-production-
in-a-changing-climate
Apple and Pear Australia Limited project page httpapalorgauresearch-development-
extensionprojectsclimate-change
Regional chill factsheets httpwwwhincomauregional-chill-accumulation-victoria
httpwwwhincomauregional-chill-accumulation-queensland
httpwwwhincomauregional-chill-accumulation-for-new-south-wales
httpwwwhincomauregional-chill-accumulation-for-south-australia
httpwwwhincomauregional-chill-accumulation-for-tasmania
httpwwwhincomauregional-chill-accumulation-for-western-australia
Jenny Treeby 15 May 2015 httpwwwhincomauprojectsapple-and-pear-production-in-a-changing-
climateexplore-your-regional-climate
Heidi Parkes 4 November 2014 httpwwwhincomauprojectsapple-and-pear-production-in-a-
changing-climatewill-extreme-october-heat-impact-on-fruit-size
Heidi Parkes 6 December 2013 httpapalorgaua-discussion-on-dormancy-and-why-its-worth-
thinking-about-in-early-december
19
Scientific conferences
Parkes HA Tabing O McClymont L Combret M and Wilkie JD 2014 Variation in the Flowering
Phenology of Apple and Pear in Australia 29th International Horticulture Congress Brisbane
Convention and Exhibition Centre 17-22 August (Oral presentation)
Parkes HA White NA MurphyWhite S 2015 Understanding the impact of climate change on flowering
in Australian temperate fruit trees Greenhouse 2015 Wrest Point conference center Hobart
Tasmania 26 ndash 30 October (Oral presentation)
Datasets
Spring phenology observations for pome-fruit cultivars in Australia 2013 ndash 2015 Available at
httpsdataqldgovau
Post-graduate student projects
Marco Calderon 2014 Orcharding the future the influence of temperature on pome fruit flowering
across Australia University of Melbourne Masterrsquos Degree
20
Outcomes
Historical climate trends and future scenarios
Historical trends in average temperatures winter chill and heat days
(Appendix 1)
Australia has undergone a consistent warming trend since 1910 (State of the climate 2016) In pome
fruit growing regions across Australia this changing climate has been experienced in different ways at the
local level Changes in average minimum and maximum temperatures experienced in autumnwinter and
springsummer since 1968 differ between regions (appendix 1) The milder growing regions of
Applethorpe Manjimup and Mt Barker have experienced a decline in the number of chill portions over this
period while Shepparton has seen a small reduction in winter chill and the colder regions of Huonville
and Orange have not changed (Figure 2) Increases in the number of extreme heat days have been
experienced in Shepparton and Mt Barker while the last seven years in Manjimup have been above the
long-term average (Figure 3)
21
Applethorpe
Shepparton
Manjimup Huonville
Orange Mount Barker
Figure 2 Annual anomaly in accumulation of chill portions (1 Mar to 31 Aug) Anomalies are the difference
between the yearly value and a base period of 1981 to 2010 The black line is an 11-year moving average
22
Applethorpe
Shepparton
Manjimup
Huonville
Orange Mount Barker
Figure 3 Annual anomaly in average number of days where maximum temperature exceeds 35deg C
Anomalies are expressed as the difference between the yearly value and a base period of 1981 to 2010
The black line is an 11-year moving average
23
Climate projections for average winter chill and heat days
(Appendix 1)
Climate projections were developed for minimum to medium (RCP45) and worst case (RCP85) scenarios
for 2030 and 2050 for each of the pome fruit growing regions Winter chill accumulation declined at all
sites in 2030 and 2050 under both scenarios The greatest declines were in the milder growing regions of
Applethorpe and Manjimup (greater than 20 in 2050) and the smallest declines in Huonville and Orange
(around 5 in 2030 and less than 15 in 2050) (Table 1)
By 2050 growers will be managing orchards under a different climatic environment For example in
Applethorpe a low chill year is currently around 60 chill portions This will be a good year in 2050 and
the worst years will be outside the existing range of experience
Table 1 Average chill portions (1 Mar to 31 Aug) for 2030 and 2050 using a minimum to
medium (RCP45) and worst (RCP85) case scenario The average is of 30 years with the
lowest and highest chill portions in brackets
Average chill portions Present
2030 2050
RCP45 RCP85 RCP45 RCP85
Applethorpe 72 (62-83) 63 (48-75) 60 (44-73) 56 (41-69) 51 (36-65)
Shepparton 84 (73-93) 75 (63-85) 74 (62-86) 71 (58-81) 67 (57-79)
Manjimup 67 (55-82) 57 (43-76) 55 (42-75) 50 (36-72) 47 (33-68)
Huonville 105 (94-113) 98 (81-112) 97 (78-110) 93 (74-105) 90 (71-104)
Orange 100 (90-110) 94 (85-104) 93 (82-101) 90 (81-99) 87 (78-94)
Mount Barker 84 (67-93) 74 (55-88) 73 (53-88) 70 (53-84) 65 (47-80)
The climate projections for 2030 and 2050 show that all pome fruit regions across Australia can expect to
experience an increase in the number of extreme heat days during the growing season with the greatest
impacts likely to be in regions such as Shepparton with hot summer climates (data not shown) Impacts
on the risk of sunburn browning in apples are described in the section lsquoPotential impact of an increased
frequency in extreme heat events on the incidence of sunburn and the effectiveness of netting as an
adaptation strategyrsquo on p34
24
Impacts of warming autumn winter and spring temperatures on flowering and
options for adaptation
Understanding relationships between temperature and flowering
1 Variation in flowering of pome fruit trees across Australia
(Appendix 2)
Differences in the pattern of chill accumulation (Figure 4) were accompanied by variability in the timing
and pattern of green tip and flowering between locations and between years (Figure 5) Green tip and full
bloom dates were more variable between years cultivars and individual trees in Manjimup compared with
Applethorpe and Shepparton and trees consistently displayed a more protracted pattern of flowering
(Figure 5) Delayed and uneven flowering are symptoms of inadequate chill and it is likely that the
observed patterns of bud burst and flowering in Manjimup were in response to the mild winter conditions
experienced in that location in 2012 to 2014
Figure 4 Chill accumulation in Shepparton Applethorpe and Manjimup in 2012 to 2015
Number in brackets is the total chill portions received up to 31 Aug
25
Figure 5 Green tip (green) and full bloom (pink) dates for apple cultivars in Applethorpe
Shepparton and Manjimup Data is the average of observations from 2012 to 2015 with bars
indicating the confidence interval
Applethorpe
Shepparton
Manjimup
26
2 Chilling requirements
A collection of apple chilling requirements in chill portions chill units and chill hours were produced for
the mild climatic region of Applethorpe Queensland Australia (Table 2)
The chilling requirements measured were higher across a number of cultivars when compared with
previously published thresholds (Ghariani et al 1994 Hauagge et al 1991) For example Darbyshire et
al (2016) estimated a chilling requirement of 34 chill portions for lsquoCripps Pinkrsquo notably lower than the
chilling requirement of 73 chill portions calculated here Comparison of chilling requirements between
studies is problematic due to the use of vastly different methodologies for threshold determination
(Dennis 2003) Research to understand the genetic basis of progression through the phases of dormancy
is needed to enable accurate definition of cultivar chilling requirements (Cooke et al 2012)
Regardless of these gaps in knowledge the chilling requirements measured using the forced bud
methodology can be used to put apple cultivars into groups with low (lsquoCripps Redrsquo lsquoManchurianrsquo crab
apple) medium (lsquoRS103-110rsquo lsquoGranny Smithrsquo lsquoCripps Pinkrsquo lsquoKaleirsquo) and higher chilling requirements
(lsquoGalaxyrsquo Fujirsquo lsquoHi-Earlyrsquo) These groupings provide practical benefit to industry by enabling growers to
make more informed cultivar and pollinizer choices at planting particularly when considering projected
changes to future climate
A draft manuscript titled lsquochilling requirements of apple varieties grown in mild Australian winter
conditionsrsquo details this work and has been prepared for submission to the journal HortScience
27
Table 2 Chilling requirements of apple cultivars and a crab apple polliniser cultivar measured in chill portions chill units and chill
hours
Cultivar Year Dynamic (CP) meanplusmnsd CV() Utah (CU) meanplusmnsd CV() Chill Hours (CH) meanplusmnsd CV()
Cripps Red 2014 549 57plusmn29 51 947 976plusmn403 41 694 662plusmn445 67
2015 59
1004
631
Manchurian 2014 585 61plusmn36 59 1016 1031plusmn216 21 748 724plusmn332 46
2015 636
10465
701
RS103-110 2014 687 708plusmn29 41 1207 1186plusmn293 25 845 838plusmn106 13
2015 728
11655
830
Granny Smith 2014 729 728plusmn01 01 1312 1239plusmn1036 84 875 852plusmn318 37
2015 728
11655
830
Cripps Pink 2014 729 733plusmn06 09 1312 1242plusmn99 8 875 856plusmn276 32
2015 738
1172
836
Kalei 2014 729 755plusmn37 49 1305 1275plusmn421 33 875 883plusmn113 13
2015 781
12455
891
Galaxy 2014 795 767plusmn4 53 1429 1300plusmn1817 14 950 893plusmn806 9
2015 738
1172
836
Fuji 2014 76 77plusmn15 19 1368 1307plusmn866 66 924 908plusmn233 26
2015 781
12455
891
Hi Early 2014 76 77plusmn15 19 1368 1307plusmn866 66 924 908plusmn233 26
2015 781
12455
891
lowest coefficient of variation CV() across the three chill models
28
3 Modelling to predict the timing of flowering in apple under current climates
(Appendix 1)
The relationship between winter chill heat and flowering was described mathematically in the chill-
overlap model of flowering developed for almonds (Pope et al 2014) (Figure 6) This model assumes
that there is a minimum amount of chill and a minimum amount of heat required for flowering The more
chill that is received over and above the minimum chilling requirement the lower the amount of heat that
is needed In this way the timing of flowering is determined by the complex relationship between the
amount of chill and heat that is received during dormancy
The baseline flowering and temperature datasets collected as part of this project were used to
successfully validate the chill-overlap model for lsquoCripps Pinkrsquo apple (Darbyshire et al 2016) enabling
projections of climate change impacts on the timing of flowering to be made (Table 3)
Figure 6 The Chill-Overlap Model for flowering in apple Cr is minimum chill required for
flowering Co is the maximum additional chill that will reduce the heat requirement Hr is the
heat required when Co chill is accumulated and Ho is the maximum possible heat
requirement for flowering (Redrawn from Darbyshire et al 2016)
29
Potential impacts of warming temperatures on flowering
1 Modelling to predict changes in the timing of apple flowering under future
climates
(Appendix 1)
The chill-overlap model for lsquoCripps Pinkrsquo apple was used to predict changes in the timing of full bloom in
growing regions across Australia in 2030 and 2050 In Orange a high chill location the average date of
full bloom was advanced (earlier bloom) in 2050 by 4 to 5 days The milder winter locations showed a
delayed full bloom date in 2030 and 2050 with the greatest impact felt at Manjimup
Changes in flowering time for lsquoCripps Pinkrsquo in 2030 are likely to be within the current range of grower
experience However by 2050 flowering times are predicted to be considerably later in milder winter
regions To determine how flowering time in other apple cultivars will be impacted by climate change the
chill-overlap model would require validation with flowering data from each cultivar
Table 3 Average date of full bloom for lsquoCripps Pinkrsquo apple in 2030 and 2050 using a
minimum to medium (RCP45) and worst case scenario (RCP85) modelling approach
Average Predicted Full Bloom date Present
2030
2050
RCP45 RCP85 RCP45 RCP85 Applethorpe 4 Oct 7 Oct 9 Oct 12 Oct 16 Oct
Shepparton 30 Sep 3 Oct 3 Oct 5 Oct 6 Oct
Manjimup 16 Oct 22 Oct 25 Oct 30 Oct 2 Nov
Huonville 26 Sep 27 Sep 29 Sep 29 Sep 29 Sep
Orange 2 Oct 28 Sep 28 Sep 28 Sep 27 Sep
Mount Barker 1 Oct 5 Oct 4 Oct 6 Oct 8 Oct
2 Using climate analogues
(Appendix 3)
The climate analogue analysis using Manjimup as an analogue for Stanthorpe in 2030 indicated that
growers in the Stanthorpe region were likely to experience a more variable and protracted pattern of
flowering across many apple cultivars by 2030 (Figure 7) but without any clear negative impact on
productivity Use of dormancy-breaking sprays was identified as a possible adaptation with no obvious
requirement to shift to different cultivars or tree crop species at this stage
Results from this case study indicated that the climate analogue approach can provide valuable
information around potential climate change impacts and adaptation strategies for horticultural industries
30
This finding comes with a note of caution however Climate and plant physiology are complex systems
and the information gained from using climate analogues should be considered in a broad context with
care taken to the detail
Figure 7 Variable bud burst and flowering in Cripps Pink Manjimup spring 2014
Options for adaptation management of flowering under future climates
1 Cultivar selection mdash matching cultivars with appropriate winter climates
Ideally apple and pear cultivars should be matched with suitable growing climates which in this case
refers to selection of cultivars with chilling requirements that are comfortably below the minimum winter
chill received in a particular location (Atkinson et al 2013 Luedeling et al 2015) However there are
multiple factors that influence cultivar choice (for example market opportunities) and uncertainty around
determination of cultivar chilling requirements make this somewhat difficult
The collection of flowering time observations undertaken as part of this study indicated that more
detailed monitoring and recording of green tip and flowering dates across the orchard would enable
growers to identify cultivars that are performing well in the local climate and those that are not getting
enough chilling from season-to-season (providing early indication of cultivars that might be impacted by
warmer winters in the future changing climate) These records could also be used to identify subtle shifts
in the timing of flowering between cultivars and their pollinisers New sensing technologies will enable
simpler collection of large amounts of data in the future (Panda et al 2010)
31
2 Dormancy-breaking sprays as an adaption to inadequate winter chill
(Appendix 4)
The dormancy-breaking sprays assessed in this 2015-16 study were able to advance flowering time and
compact the flowering period in lsquoGalarsquo apple with differences observed between products and sites
(Figure 8) A more compact and uniform flowering period has been shown to have a number of benefits
including improved management of flowering pests and chemical thinning practices (Bound et al 2004
Theron 2013)
Despite the compaction of flowering there were no clear differences observed in fruit set yield or
variability of apple maturity in trees treated with dormancy-breaking sprays More work is required to test
the potential of these products to improve fruit quality and reduce the length of harvest Advances in
harvest timing were observed with the dormancy-breakers and generally reflected differences in
flowering dates The ability to manipulate harvest timing can be useful in situations where advantage can
be taken of a high-price market window
The results suggest that dormancy-breaking products are likely to be a viable adaptation tool for some
cultivars in lower winter chill years but the degree to which flowering can be managed with dormancy-
breakers as the climate continues to warm is yet to be determined
Figure 8 Green tip first flower and full bloom in Gala apples treated with and without
dormancy breaking sprays Dormexreg Waikentrade and Ergerreg in Huonville Applethorpe and
Manjimup in 2015
32
3 Changing cultural practices
(Appendices 2 and 3)
A review of the scientific literature undertaken as part of this project together with information gained
from personal communication with growers and industry suggest that irregular and protracted flowering
can be difficult to manage and will likely require changes in thinning practices (Bound et al 2004
Theron 2013) Determining an appropriate thinning program is likely to be challenging when buds are at
multiple stages of green tip and flowering on individual trees (Theron 2013) Fruitlets may vary more in
size and developmental stage and careful hand thinning will likely be required to optimise crop
uniformity (personal comm) Where uniformity cannot be achieved the greater spread of fruit maturity
at harvest may require greater effort to pick at the appropriate time (personal comm)
Impacts of increased frequency of extreme heat days on fruit quality and options for
adaptation
Understanding relationships between summer temperatures and the incidence of
sunburn under net and no net
1 Air temperature thresholds for sunburn damage
(Appendix 5)
Minimum air temperatures for potential sun damage were determined for lsquoRoyal Galarsquo apple in Australia
The air temperature thresholds were 341 and 387degC respectively for browning and necrosis for non-
netted fruit and 379degC for browning under netting (Figure 9)
When the air temperature thresholds were applied across southern Australia it was found that some
fruit-growing regions were more exposed to potential sun damage risk than others Cooler summer
regions (such as Huonville and Applethorpe) illustrated very little risk while warmer summer regions
(such as Shepparton) displayed a greater potential risk accompanied by substantial variability between
years (Table 4) Managing this variability in potential risk is important to maintain yield and quality
Air temperature thresholds can be used by growers as a guide for timing the use of overhead sprinklers
for evaporative cooling in efforts to minimize potential damage
33
Figure 9 Fruit surface temperature (degC) recordings and related air temperatures (degC)
Necrosis and browning fruit surface temperature thresholds represent 52 and 478 degC
respectively Figure sourced from Darbyshire et al 2015
Table 4 Distribution of potential damage days in January for sites in Australiarsquos growing
regions for 10th 50th and 90th percentiles of data Table sourced from Darbyshire et al
2015
Browning non-netted Browning netted Necrosis non-netted
Site 10th 50th 90th 10th 50th 90th 10th 50th 90th
Spreyton1 0 0 0 0 0 0 0 0 0
Huonville 0 0 1 0 0 0 0 0 0
Applethorpe 0 0 2 0 0 0 0 0 0
Batlow1 0 0 4 0 0 0 0 0 0
Yarra Valley1 0 2 5 0 0 1 0 0 1
Manjimup 0 3 5 0 0 2 0 0 1
Lenswood1 0 3 6 0 0 2 0 0 1
Young1 1 7 16 0 1 5 0 05 4
Shepparton 2 6 12 0 1 5 0 1 4
Donnybrook1 3 7 11 0 1 3 0 05 2 1additional locations included in this table were part of the Crossing the threshold adaptation tipping
points for Australian fruit trees project
2 Predicting fruit surface temperature from weather data using the
lsquothermodynamic Smart-Sinclairrsquo model
(Appendix 6)
The thermodynamic Smart-Sinclair model (Smart et al 1976) was tested on lsquoRoyal Galarsquo grown under
34
net and no net The optimised model produced was able to predict fruit surface temperature with a root
mean square error of 2 to 3degC The presence of netting reduced the median fruit surface temperatures by
15 to 20degC The mechanism for this netting effect was through the reduction of the intensity of the solar
beam by interception and scattering while still allowing sufficient air flow to enable transfer of heat from
the fruit surface to the air
This type of modelling can be used to understand processes and quantify the effects of various netting
structures on fruit surface temperature and sun damage risk However the thermodynamic fruit surface
temperature model cannot be used for predicting the effects of climate change due to the lack of reliable
projected solar radiation and wind speed data for future climates For applications such as assessing the
benefits of netting in Australiarsquos apple growing regions for a range of climate change scenarios the air
temperature threshold approach of Darbyshire et al 2015 described above is more appropriate
Potential impact of an increased frequency in extreme heat events on the incidence of
sunburn and the effectiveness of netting as an adaptation strategy
(Appendices 1 and 7)
Minimum air temperature thresholds for sunburn damage in lsquoRoyal Galarsquo apple grown with and without
net (Darbyshire et al 2015) were used to consider the risk of sunburn damage under future climates in
pome fruit growing regions of Australia and the effectiveness of netting to reduce this risk (Table 5)
Exposure to sunburn browning-risk was highly dependent on the geographical location Some locations
were found to maintain minimal sunburn browning-risk up to 2050 while others will potentially
experience the risk for a significant proportion of the JanuaryFebruary fruit growing period Shepparton
Mt Barker and Manjimup will be most adversely affected however the installation of over-tree netting
substantially reduced the impact of sunburn browning
Analysis of multiple locations enables the use of climate analogues (Whetton et al 2013) for impact and
adaptation assessments
35
Table 5 Average sunburn browning risk (percentage of days in the January to February
period) for lsquoRoyal Galarsquo apples grown at sites across Australia with and without netting
Sunburn browning risk classifications
5 gt 5 to 10 gt 10 to 20 gt 20 to 30 gt 30 to 50
Without Netting 2030 2050
Site Present RCP45 RCP85 RCP45 RCP85
Applethorpe 11 24 28 28 49
Shepparton 183 239 268 275 358
Manjimup 100 152 152 166 198
Huonville 24 34 38 45 42
Orange 24 38 44 37 84
Mt Barker 173 207 229 232 258
With Netting
2030 2050
Site Present RCP45 RCP85 RCP45 RCP85
Applethorpe 00 00 01 01 04
Shepparton 48 70 90 88 132
Manjimup 16 38 39 44 60
Huonville 03 06 10 12 11
Orange 01 01 01 01 07
Mt Barker 54 72 91 94 107
36
Black and white netting impacts on the orchard environment fruit yield and quality
(Appendix 8)
Observations from the Western Australian netting demonstration site (Figure 10) showed similar air
temperature conditions (including winter chill accumulation) under the netted and non-netted orchard
blocks There was a slight increase in humidity under net which was associated with a higher incidence of
pest and disease There were no differences in bud burst and full bloom dates between trees under
black white and no net
Fruit surface temperatures recorded in apples over the late summer period were higher in the non-netted
apples (Figure 11) Fruit size was similar between netted and non-netted blocks however fruit colour
management using reflective mulch was required under the nets
Figure 10 Western Australian netting demonstration site at the Lyster Matijari Orchard
Manjimup
Figure 11 Fruit surface temperature (FST) and air temperature measured in the black net
white net and no net rows at the Lyster Matijari orchard (Manjimup) from February to mid-
March 2014
37
Impacts of warming temperatures on yield
(Appendix 9)
Modelling potential yield in apple using Malusim
In a recent report Darbyshire and McClymont (2016) concluded that positive validation of MaluSim under
Australian conditions was not achieved based on poor prediction of yield by MaluSim for lsquoRoyal Galarsquo and
lsquoCripps Pinkrsquo at multiple sites in Australia However performance of MaluSim in predicting fruit weight of
lsquoRoyal Galarsquo trees at the North Shepparton site supported use of the model for preliminary investigation
of influences of climate change on potential yield as part of this project
Potential impacts of warming temperatures on yield in apple
Using Malusim the predicted impact of increased temperatures (+ 2degC) on yield in lsquoRoyal Galarsquo apples in
north Victoria was minor under the conditions modelled in this investigation However further research
into possible effects of changes in harvest timing leaf fall and elevated atmospheric carbon dioxide
concentrations is required to better understand yield responses to climate change
Communication development and extension
Assessing the status of available information around climate change in the apple and
pear industry in 2013
A review of climate change information available to the Australian apple and pear industry showed a lack
of readily accessible reliable and consistent information available to growers at the time As a result it
was concluded that a) scientific outcomes from this project need to be published in a grower friendly
format b) research should be extended in a consistent manner through national grower workshops
across the country and online blogs and c) information generated needs to be stored online for easy
access
Improving industry understanding of likely changes in climate potential impacts on
apple and pear production and options for adaptation
Outcomes from the national grower workshops (appendix 10) were overwhelmingly positive with the
specific feedback varying depending on the location A number of knowledge gaps were identified during
the workshops including the need for cultivar chilling requirements for existing and new cultivars the
role of soil temperature in dormancy breaking and the need for more accurate in-season and long-term
climate forecasting There was a strong focus on the potential impact of extreme events on the industry
under future climate scenarios with less understanding about the potential impacts of more subtle
increases in temperature
Three grower publications were put together reporting on the latest project outcomes and information
already available from either earlier research in Australia andor other pome fruit growing regions The
publications were written with input from the project researchers and APAL (as the technical working
group) on the topics of winter chill netting for heat and climate scenarios The guides will be available
online (wwwhincomau) and as hardcopies from APAL andor the participating agencies
38
Increasing knowledge and skills to enable informed decision making on climate change
adaptation
Research outcomes were interpreted and communicated with a clear focus on practical on-farm
application For example findings from the fruit surface temperature research were interpreted and
communicated as regional sunburn browning-risk with analysis of the effectiveness of netting as an
adaptation strategy to increased frequency of extreme heat days The Western Australian netting
demonstration site enabled on-site communication with growers in that state around the effectiveness of
netting and the associated practical implications Green tip and flowering data collection methods were
developed for growers to use in their personal orchard record systems to determine cultivar performance
and identify shifts in flowering time andor quality A winter chill website was developed to assist growers
and industry more broadly to access and interpret winter chill data for their local region
Building a connected and collaborative approach to climate change in the apple and
pear industry
A strong network of researchers extension officers industry development officers growers and other
industry representatives was established nationally and continued to grow until project completion The
success of this project objective is discussed in the lsquoevaluation and discussionrsquo (p39)
39
Evaluation and Discussion
Measuring project impact
The proposed project outcome was to provide Australian apple and pear growers pome fruit researchers
and industry consultants with a greater understanding of predicted climate change in their region the
potential impacts and strategies for adaptation A formal evaluation of the projectrsquos ability to deliver on
this outcome was undertaken at the mid-way point through Horticulture Innovation Australiarsquos
independent mid-term review process
Through extensive research development and extension activities this project delivered new knowledge
to industry on regional climate change scenarios potential impacts of changing climate on flowering and
fruit quality and options for adaptation
Project outputs were produced across a broad variety of print digital and oral communication mediums
(refer to p13) The list includes 3 dedicated grower publications communicating climate risk and
adaptation information for the apple and pear industry a website for provision of up-to-date winter chill
information 6 grower workshops 3 grower technical working group meetings 2 industry surveys 28
articles published in industry magazines 5 presentations at industry conferences 15 presentations at
government and industry stakeholder meetings 11 media items in-print and on radio 9 technical reports
2 dedicated project web pages 6 regional chill factsheets numerous blogs 5 scientific publications and
presentation at 2 scientific conferences
The project trial sites were located in three growing regions (Western Australia Victoria and
Queensland) however significant effort was made to extend and communicate project outcomes more
broadly across the industry Grower workshops and technical working group meetings were held in New
South Wales and South Australia Collaboration with researchers from the University of Tasmania through
the lsquoCrossing the threshold adaptation tipping points for Australian fruit treesrsquo project and the dormancy-
breaking spray trial facilitated effective communication with industry in that state In addition multiple
members of the research and extension team organized and operated a project stand in the trade hall of
the 2015 National Horticulture Convention in conjunction with the Department of Economic Development
Jobs Transport and Resources
To measure lsquogreater understandingrsquo of climate change by the apple and pear industry an extensive
surveying process before and after project completion would have been required This was not
undertaken as part of the project however the extent of project outputs delivered across the country
give a good indication of the level of engagement that this project successfully achieved
In the next few years the project impact will be measurable by assessing the level of uptake and use of
the grower publications and lsquowinter chill and growing degree dayrsquo website In addition national networks
developed over the last four years between members of the project team and industry are likely to
continue to provide ongoing benefit to Australian horticulture as its members move to reduce
vulnerability to climate change risks
40
Effectiveness of project activities in delivering project outputs and achieving intended
outcomes
Efficiency of the delivery mechanisms and appropriateness of the methodology
A mid-term project review conducted in 2014 by Professor Snow Barlow from The University of
Melbourne found the research to be lsquoscientifically rigorous and directed towards the contracted objectives
of the projectrsquo The review highlighted the good progress made by the research and extension team in
engaging with industry and in the delivery of a broad information mix incorporating immediate adaptive
strategies such as netting to reduce sunburn risk and future long-term climate change impacts
Our use of small grower-based technical working groups to receive guidance on research project direction
and outputs was sound methodology but required considerably more resources to maximize its value
The process of establishing these groups nationally running meetings compiling and disseminating
outcomes and maintaining communication with the groups throughout the project was significant
Ideally the groups need to be coordinated by a local industry representative with strong connections to
the industry in their region and good knowledge of the industry itself
Barriers to communication and extension around climate change adaptation
Effective communication between researchers and growers is particularly important in delivering
messages on climate change impact and adaptation due to the vast quantity of information and
misinformation in the public sphere A number of communication and extension barriers were identified
during the course of project engagement activities (Table 6) and these learnings were used to improve
the effectiveness of our communications
For example widespread confusion in the industry around measurement of winter chill and chilling
requirements was identified as a significant barrier to effective communication of research findings
related to climate change impacts on winter chill and flowering As a result the lsquowinter chill and growing
degree dayrsquo website was developed (as part of a project variation) to provide chill calculation tools and
supporting information for industry with the aim of improving understanding and enabling better
management of low winter chill years in orchards across Australia
41
Table 6 Barriers to communication and extension around climate change adaptation
Barriers Comments
Skepticism of climate change Communication with growers nationally
suggested that this was a minority of industry
Conflicting messages from Governments
regarding potential climate change impacts and the need for adaptation
Feeling of responsibility for climate change
without having realistic strategies to combat it
Resistance to implementing changes required for climate change adaptation
Could be for a variety of reasons including financial and family pressures
Timing of communication- needs to be considered in the context of production
stresses more broadly
Growers in the midst of battling drought are unlikely to be concentrating on understanding
chilling requirements Information provided needs
to be carefully matched with local industry needs
Large knowledge gaps in the science For example it is difficult for growers to make
cultivar choices based on climate suitability due
to the lack of basic understanding around chilling requirements and tolerance to heat
Confusion around chilling requirements and measurement of winter chill
Generated historically by the reporting of winter chill in different units and general spread of
misinformation
Confusion around the terms lsquoclimate variabilityrsquo versus lsquoclimate changersquo
Confusion over the use of different scientific
terminologies
Need to use consistent terminology in all
communications for example around winter chill and phenological stages
Feedback on activities and quality and usefulness of project outputs
Feedback on research and extension activities was obtained from a broad cross-section of apple and pear
growers and industry representatives nationally through meetings with APAL staff and discussions and
evaluations at grower workshops A formal evaluation completed by 12 growers at the Bilpin workshop in
2015 indicated that 100 of them found the workshop content useful for their orchard businesses and
that they would like to attend further events Similarly positive results were obtained elsewhere through
informal discussions
In addition feedback was sought via the project websites through Australian Fruitgrower articles and
regular discussions with growers on-site during research data collection and various grower meetings
Grower experiences of local climate change impacts were often communicated during one-on-one
conversations The APAL industry conferences were utilized as an effective medium for sharing project
outcomes A dedicated project stand and display was set up in the exhibition hall at the National
Horticulture Convention on the Gold Coast in 2015 for the purpose of sharing project outcomes
responding to targeted inquiries and obtaining feedback from industry nationally
42
The value of online project outputs can be quantified through the number lsquohitsrsquo to project website pages The project pages on the Horticulture Industry Network site have received 987 hits since they were developed in 2014 indicating the usefulness of this medium for project communication
Scientific feedback was obtained from within the project team as well as through linkages with
researchers nationally Critique of research methodology and results was sought from international
scientists through publication in peer-reviewed journals presentations at scientific conferences and
through hosting visits from international researchers
Feedback received was discussed with the project team during the monthly teleconferences and annual
face-to-face meetings and was incorporated back into the project as deemed appropriate by the group
Key learnings
Climate change will add significant variability into the pome fruit crop production system with respect to
flowering and fruit quality Most Australian growers are already used to dealing with some level of climate
variability and it seems likely that impacts on flowering and fruit quality may be within the range of
grower experience up to around 2030 but that by 2050 growers will be operating outside of current
experience This will present challenges for the Australian industry in the consistency of supply and in
maintenance of the uniform orchard blocks that are a prerequisite for the efficient use of mechanisation
Precise timeframes for impacts of warming temperatures on pome fruit production are difficult to
determine because of the amount of variability in both the climate (including microclimate) and orchard
production systems For example under the worst case scenario Manjimup is projected to receive an
average of 46 chill portions in 2050 This means that in cold years there is likely to be plenty of chill for
apple production but warm years will challenge many current commercial cultivars If the grower has
adapted by planting lower chill cultivars and adjusted their management practices they are more likely to
grow a good crop every year
The Australian apple and pear industry in Australia and globally has a strong capacity for adaptation to
the changing climate due to the availability of new technologies for crop sensing opportunities for
protected cropping a strong research history in crop physiology and availability of a broad diversity of
scion and rootstock genetics Genetic diversity in particular can be exploited to ensure commercial
cultivars are better adapted to the changing climatic conditions
Successful adaptation to the changing climate will be supported by capture and interpretation of data on
tree phenology climate and orchard practices Australiarsquos industry is made up of growing regions with
diverse climates and much can be learnt about climate change impacts and options for adaptation by
sharing of knowledge In future more comprehensive data will be collected on orchards through the use
of sensing and mapping technologies This data can be used to undertake more sophisticated and
comprehensive analysis of flowering patterns and variability between and within locations
Specific research learnings are listed under the stated project objectives
1 Develop climate change scenarios for pome fruit growing regions of Australia in 2030
and 2050 including the likely impact of climate change on winter chill and extreme
heat
- Australia has undergone a consistent warming trend since 1910 however at a local level the
experience of climate change has been different in each pome fruit growing region Changes in
average minimum and maximum temperatures and extreme heat for the period from 1968 to
43
2016 varied between locations
- Milder growing regions have experienced a decline in annual winter chill accumulation since 1968
while the colder regions of Huonville and Orange have not changed
- Increases in the number of extreme heat days have been experienced in Shepparton and Mt
Barker while the frequency of extreme heat days in Manjimup in the last seven years has been
above the long-term average
- The climate projections for 2030 and 2050 show that all pome fruit regions across Australia can
expect to experience
Declines in winter chill accumulation Warmer winter growing regions such as Manjimup and
Applethorpe were projected to experience a reduction in winter chill of 20 to 30 by 2050
A decline of between 10 and 15 chill was projected for the coldest regions (Huonville and
Orange) over the same period
An increase in the number of extreme heat days during the growing season The greatest
impacts were projected to be in regions such as Shepparton and Mt Barker with hot summer
climates
- Climate change impacts on winter chill are likely to be within grower experiences of season-to-
season variability up to approximately 2030 On-farm adaptation to this variability will reduce
longer term climate change risk to orchard profitability By 2050 it is likely that growers will be
operating under climates outside of the current range of experience for a particular region
- Expression of climate change projections in terms of meaningful horticultural climate metrics
(chill portions and sunburn browning risk days) instead of average temperatures improves their
value to industry by directly linking projected changes in climate with impacts on production
2 Understand how changes in autumn winter and spring temperatures might impact
the timing and quality of flowering in cultivars of apple and pear
- Analysis of winter chill and flowering from 2012 to 2015 in Applethorpe Shepparton and
Manjimup showed
Low winter chill as observed in Manjimup was associated with uneven chill accumulation caused by short periods of warm weather throughout the autumn and winter seasons
Low winter chill in Manjimup was associated with greater variability in flowering dates between seasons cultivars and individual trees and irregular and protracted flowering across most apple cultivars relative to the other sites
The variable pattern of flowering observed in Manjimup was likely the result of mild winter
conditions and inadequate chilling for some cultivars
- Analysis using Manjimup as a climate analogue for Stanthorpe in 2030 indicated that growers in
the Stanthorpe region were likely to experience a more variable and protracted pattern of
flowering across many apple cultivars by 2030 but without any clear negative impact on
productivity Use of dormancy-breaking sprays is an adaptation option There was with no clear
need to shift to different cultivars or species at this stage (objective 3)
- Projections from the chill-overlap model for timing of full bloom in lsquoCripps Pinkrsquo apple in 2030 and
2050 showed
An earlier full bloom date on average in some high chill locations (for example in Orange) in
44
2030 and 2050
A later full bloom date at the milder winter locations (Applethorpe Manjimup and even
Shepparton) in 2030 with average flowering dates delayed by more than a week in 2050
Changes in flowering time for lsquoCripps Pinkrsquo in 2030 are likely to be within the current range of
grower experience
- Increased frequency of low chill years in milder winter growing regions will likely result in
symptoms of inadequate chill in some cultivars Advances in the timing of flowering might be
observed in cooler winter regions Changes in the timing of flowering can result in reduced yields
in cases where the flowering period of polliniser trees no longer overlaps that of the commercial
cultivar
3 Identify adaptations to manage any negative effects of climate change on flowering
- The dormancy-breaking spray trial in lsquoGalarsquo apple in Qld WA and Tas demonstrated that
Dormexreg Waikentrade and Ergerreg were able to advance flowering time and compact the
flowering period
Fruit maturity was advanced with dormancy-breakers and generally reflected differences in
flowering dates
Dormancy-breaking sprays are likely to be an effective tool for managing flowering in lsquoGalarsquo
and other apple cultivars in lower chill years in Australia
Benefits from the use of dormancy-breakers are likely to be greater in low chill years when
the potential impacts of inadequate chill on flowering are greatest Therefore benefits are
likely to increase under future climate scenarios
- Changes to cultural practices will be required to manage symptoms of inadequate chill such as
delayed irregular and protracted flowering
Development of an appropriate chemical thinning program for managing buds at multiple
stages of green tip and flowering on individual trees
Careful hand thinning to optimise crop uniformity when fruitlets vary considerably in size and
developmental stage
Additional labour input to pick fruit at the appropriate stage of maturity when there is a
greater spread of fruit maturity at harvest
Pollination management to reduce the risk of poor flowering overlap in any particular year
caused by large shifts in flowering dates between cultivars and seasons
- The increased irregularity and unevenness of flowering is likely to be a greater management
challenge for Australian growers than managing changes in flowering time as growers are
already experienced at dealing with large shifts in flowering dates between seasons
- Using forced bud methodology to determine chilling requirements apple cultivars fell into groups
with low (lsquoCripps Redrsquo lsquoManchurianrsquo crab apple) medium (lsquoRS103-110rsquo lsquoGranny Smithrsquo lsquoCripps
Pinkrsquo lsquoKaleirsquo) and higher chilling requirements (lsquoGalaxyrsquo lsquoFujirsquo lsquoHi-Earlyrsquo) Groupings such as these
enable growers to make more informed cultivar and polliniser choices at planting based on the
winter chill climate in their region
45
4 Understand how changes in the frequency of extreme heat days might impact on the
incidence of sunburn in pome fruit and the effectiveness of netting as an adaptation
strategy
- Minimum air temperatures for potential sun damage in lsquoRoyal Galarsquo apple were established
341degC and 387degC respectively for browning and necrosis for non-netted fruit
379degC for browning under netting
- Air temperature thresholds were applied across southern Australia and potential sun damage risk
and effectiveness of netting was determined under future climates
Shepparton Mt Barker and Manjimup were the most adversely affected by projected
increases in the percentage of days with potential sunburn browning risk in January and
February
The percentage of risk days in Shepparton was projected to increase from 18 at present to
28 to 36 in 2050 with the installation of netting reducing the risk considerably to around 9
to 13
- Most growing regions are likely to notice an increased sunburn risk by 2030 (if they havenrsquot
already) By 2050 growers in regions with currently milder summers will need to have adapted
their current orchard practices to manage the impacts that an increased frequency of heat events
will have on fruit quality
- The thermodynamic Smart-Sinclair model was tested on lsquoRoyal Galarsquo grown under net and no net
and was able to predict fruit surface temperature with a root mean square error of 2 to 3degC
Netting reduced the median fruit surface temperatures by 15 to 20degC
- The thermodynamic Smart-Sinclair model can be used to understand processes and quantify the
effects of various netting structures on fruit surface temperature and sun damage risk but
cannot be used for predicting the effects of climate change due to the lack of reliable projected
solar radiation and wind speed data
5 Understand how different colours of netting impact on the orchard environment fruit
yield and quality
- Comparison of black and white netting at the Western Australian netting demonstration site
showed little difference in environmental conditions or bud burst and flowering under the black
netting white netting and non-netted orchard blocks Fruit surface temperatures were higher in
the no net apples
6 Understand how the changing climate might impact the yield potential of apples
- The Malusim model for the prediction of potential apple yield could not be positively validated
under Australian conditions as it was generally a poor predictor of yield for lsquoRoyal Galarsquo and
lsquoCripps Pinkrsquo at multiple sites in Australia
- The MaluSim model was able to predict fruit weight of lsquoRoyal Galarsquo trees at the North Shepparton
site and supported use of the model for preliminary investigation of influences of climate change
on potential yield The predicted impact of increased temperatures (+ 2degC) on yield in lsquoRoyal
Galarsquo apples in north Victoria was minor under the conditions modelled in this investigation
46
Recommendations
Industry
- The following tools and strategies are recommended for adaptation to an increased frequency of low
chill years in milder growing regions of Australia
Planting lower chill cultivars Matching cultivars to their chilling climate is the best option but
it is not always possible due to market pressures and a lack of information on chilling
requirements
Management of delayed and variable flowering with the use of dormancy-breakers
Development of a set of broad guidelines around the use of dormancy-breaking sprays based
on existing knowledge Such guidelines could include information on when dormancy-
breaking sprays should be used and in which cultivars and regions
Adjustments to chemical and hand thinning practices to reduce variability in fruit size and
maturity
Use of the lsquowinter chill and growing degree dayrsquo website for monitoring in-season chill
accumulation
Preparation of an orchard management strategy to enact in low chill years This would likely
include monitoring of winter chill accumulation and the use of dormancy-breakers
Comprehensive in-orchard monitoring of flowering dates across cultivars to provide early
indication of cultivars that might be impacted by warmer winters as well as identification of
subtle shifts in the timing of flowering between cultivars and their pollinisers
In blocks where flowering is becoming increasingly irregular growers will need to assess the
point at which the increased cost of inputs and effort required to produce a consistently high
quality crop make a block of trees unprofitable
- To reduce the risks to pollination from shifting flowering times planting of multiple polliniser cultivars
with early middle and late flowering habits to ensure a good supply of pollen throughout the
flowering period is recommended where possible Use of floral bouquets or artificial pollination
methods can be considered to compensate for loss in flowering overlap
- The following tools and strategies are recommended for adaptation by the apple and pear industry to
increased frequency of extreme heat
Continued investment in netting in locations such as Manjimup and Orange where many
orchards are currently un-netted
Use of air temperature thresholds as a guide for using overhead sprinklers for evaporative
cooling in efforts to minimize potential sunburn damage
Planting heat tolerant cultivars As for winter chill matching cultivars to their growing climate
is the best option but it is not always possible due to market pressures and a lack of
information on different heat tolerances of cultivars
Development of orchard practice guidelines for managing extreme heat (bringing together
47
aspects of tree canopy structure evaporative cooling netting types irrigation nutrition
spray-on protectants and other stress reduction products)
Development of orchard practice guidelines for optimising post-harvest fruit quality in warm
to hot summerautumn conditions (pre and post-harvest management)
- For improved tactical and strategic planning in the orchard use of the Bureau of Meteorology climate
outlook videos (httpwwwbomgovauclimateoutlooksoverviewsummary) State of the Climate
reports (httpwwwbomgovaustate-of-the-climate) and the lsquoclimate change in Australiarsquo website
(httpswwwclimatechangeinaustraliagovauen) is recommended
- It is recommended that the Australian apple and pear industry utilise and exploit the genetic diversity
available in scions and rootstocks globally to ensure that commercial cultivars can be better adapted
to the changing climatic conditions
- Climate analogues should be used to better identify the timeframes for impacts of low chill and
extreme heat on apple and pear production and the best strategies for adaptation For example
growers in Manjimup are already successfully managing the impacts of inadequate chill in some
years lessons can be learnt from their knowledge and experience
- This project focussed specifically on climate change impacts on crop physiology and it is
recommended that the industry undertake a broad economic assessment of climate change impacts
from storm events drought increased wind changes in evapotranspiration and so on
- The industry needs to consider how basic research gaps such as knowledge around relationships
between temperature and tree physiology may be filled in future years to ensure the flow of new
information and ideas into the industry does not become limited
Extension and communications
- Having an extension and research team working side-by-side from project start to end has significant
benefits for communications and industry engagement
- National collaboration was enormously beneficial to the success of this project as were linkages
between projects and across industries
- Having a core team responsible for communication ensured timely relevant and consistent
information was made available and utilising well established local grower groups and extension
officers ensured ease of facilitation
Scientific
Priority research needs
- Determination of significant biological thresholds (chilling requirements sunburn damage thresholds
pest and disease development thresholds) to enable conversion of weather and climate data into
useful horticultural metrics for everyday decision making
- Investigation of methods programs for evaluation of new and existing scions and rootstocks with
the objective of providing sufficient information to enable matching of apple and pear cultivars with
suitable growing climates including matching chilling requirements with winter chill and heat
48
tolerance with summer temperatures
- New genetics breeding programs are needed that focus on lower chill cultivars with good tolerance
for heat alongside other quality parameters
- Determination of genetic andor physiological markers of flower bud progression into dormancy and
out of dormancy prior to bud burst This would improve the definition of apple and pear chilling
requirements
- Efficacy of using dormancy-breaking sprays for long-term adaptation to warming temperatures
including the extent to which dormancy-breaking sprays can be used as an adaptation to low chill
years relationships between dormancy-breaking sprays and fruit quality particularly in cultivars and
investigations into alternatives to Dormexreg
- Methods for managing heat in the orchard for improved fruit quality
Efficient tree canopies for balancing multiple requirements including low sunburn damage
optimal fruit quality (including colour development) water-use efficiency and disease
management
Understanding relationships between orchard temperatures during the growing season and
fruit quality at harvest and after storage
Use of plant growth regulators and stress reduction chemicals
Additional research gaps
- Pest and disease management under warmer climates Codling moth are likely to increase generation
number per season fruit fly are likely to have an extended range and disease management under
netting on trellis systems will present new challenges particularly when combined with the use of
evaporative cooling
- Determination of the limits of profitable apple production with regards to winter chill Production
areas with very low winter chill accumulation in South Africa and Southern Brazil rely heavily on
dormancy-breakers and would be obvious target locations for a global investigative study
- Potential impacts of low winter chill on marketable yield
- For improved definition of apple and pear chilling requirements
Cultivar specific parameterisation of the Dynamic model for improved chill model
performance
Relationship between bud temperature and dormancy breaking
Standardisation of methods for determination of chilling requirements
Investigation of the potential role of day length in dormancy breaking in apples
Effectiveness of early versus late season chill in dormancy breaking
Role of root-zone temperature and rootstocks in bud burst
Relationship between temperatures received during autumn prior to dormancy and quality of
bud burst and flowering
Impacts of pruning and defoliation on modifying winter chill requirements
49
- Validation of the chill-overlap model with flowering data from cultivars other than lsquoCripps Pinkrsquo apple
to determine how flowering time will be impacted by climate change
- Better understanding of flowering in new and existing pear cultivars and the likely impacts of
changing climate
- Fruit surface temperature thresholds for sunburn for a wide variety of cultivars Transferability of fruit
surface temperature thresholds across cultivars and locations needs to be investigated
- Effectiveness of different types (colours weaves) of netting in reducing the risk of sunburn damage
and its effect on assimilation transpiration and fruit quality
- Impact of climate change on the duration of fruit development and maturity times for apple and pear
cultivars of interest
- Potential impacts of the extended growing season (caused by the later onset of cold temperatures in
autumn and warmer springs) on canopy management and fruit quality
- Impacts of warming spring and summer temperatures on flower bud initiation and development
- The impact of elevated CO2 temperature shifts on fruit maturation colour development and leaf fall
to improve predictions of yield under different climate scenarios
- Pollination in a changing climate Warming temperatures will impact bee behavior synchronisation of
flowering (due to changes in the timing of flowering) flower viability and floral bud initiation
- Potential for POAMA (Predictive Ocean Atmosphere Model for Australia) to make in-season and short
to medium-term climate forecasts with a level of accuracy necessary to inform decision making at
tactical and strategic levels
50
Scientific Refereed Publications Darbyshire R McClymont L Goodwin I 2015 Sun damage risk of Royal Gala apple in fruit growing
districts in Australia New Zealand Journal of Crop amp Horticultural Science 43 222 -232
McCaskill M R McClymont L Goodwin I Green S Partington DL How hail netting reduces apple
fruit surface temperature a microclimate and modelling study Agricultural and Forest
Meteorology 226ndash227 148ndash160
Parkes HA Tabing O McClymont L Combret M and Wilkie JD 2016 Variation in the flowering
phenology of apple and pear in Australia Acta Horticulturae 1130 (8) 55 - 61
Parkes H Darbyshire R and White N Chilling requirements of apple varieties grown in mild Australian
winter conditions Prepared for HortScience
Webb L Darbyshire R Erwin T and Goodwin I 2016 A robust impact assessment that informs
actionable climate change adaptation Future browning-risk in apple crops International Journal
of Biometeorology Doi101007s00484-016-1268-y
51
Intellectual PropertyCommercialisation
No commercial IP generated
52
Acknowledgements The research described in this final report is a culmination of the inputs and efforts of a great many
individuals over the course of the last four and a half years
The project team would like to thank the following people for their work in the provision of technical and
farm support and for their contribution of knowledge and ideas along the way Jeff Paten John
Finocchiaro Wendy Sessions David Cornwall Diana Fisher Rohan Prince John Sutton Penny Measham
and Steve Paterson We also thank Marco Calderon for his work analysing individual bud data for his
Masterrsquos degree from the University of Melbourne
The cooperation and collaboration of a number of growers was essential for the timely collection of
phenology fruit quality and netting data used for this research The project team would like to thank
Steven and Ugo Tomasel Celeste from C Pozzebon amp Co Anne and Mauri Lyster Maurice Silverstein
Geoffrey Thompson and Scott Price
For their support in providing us with opportunities to speak at industry events publish in the Fruitgrower
magazine and deliver information via the APAL website we would like to thank Angus Crawford Sophie
Clayton and Richelle Zealley The project team also thank Kevin Dodds Marcel Veens and Fruit Growers
Victoria for on-the-ground help with the organization and delivery of the grower workshops
And finally we acknowledge the valuable contributions of all of the industry representatives and apple
and pear growers across Australia who attended workshops and seminars answered surveys and
provided us with the comments and interesting anecdotes that kept challenging our thinking and helped
us focus our work Thank you
53
Appendices
1 White N 2016 Technical report Analysis of historical and future climate and the production of
pome fruit Department of Agriculture and Fisheries Queensland 29 pp
2 Parkes H and White N 2016 Technical report Flowering in pome fruit trees across Australia
implications of a changing climate Department of Agriculture and Fisheries Queensland 21 pp
3 Parkes H and White N 2016 Technical report A climate analogue approach to understanding
climate change impacts on flowering in Australian pome fruit trees Department of Agriculture
and Fisheries Queensland 17 pp
4 Parkes H MurphyWhite S and Bound S 2016 Technical report Dormancy-breaking sprays for
low winter chill in apples Department of Agriculture and Fisheries Queensland Pomewest
University of Tasmania 28 pp
5 Darbyshire R McClymont L Goodwin I 2015 Sun damage risk of Royal Gala apple in fruit
growing districts in Australia New Zealand Journal of Crop amp Horticultural Science 43 222 - 232
6 McCaskill M R McClymont L Goodwin I Green S Partington DL How hail netting reduces
apple fruit surface temperature a microclimate and modelling study Submitted to Agricultural
and Forest Meteorology 226-227 148 ndash 160
7 Webb L Darbyshire R Erwin T and Goodwin I 2016 A robust impact assessment that
informs actionable climate change adaptation Future browning-risk in apple crops International
Journal of Biometeorology Doi101007s00484-016-1268-y
8 MurphyWhite S Prince R and Starkie L 2016 Technical report Western Australian apple
netting demonstration site Pomewest 24 pp
9 McClymont L Darbyshire R and Goodwin I 2016 Technical report Apple yield response to
climate change and netting Department of Economic Development Jobs Transport and
Resources and University of Melbourne 15 pp
10 Treeby J 2016 Understanding apples and pears in a changing climate overview of the grower
workshops Department of Economic Development Jobs Transport and Resources 5 pp
54
References
Atkinson C J Brennan R M amp Jones H G (2013) Declining chilling and its impact on temperate perennial crops Environmental and Experimental Botany 91
Bound S A amp Jones K M (2004) Hydrogen cyanamide impacts on flowering crop load and fruit
quality of red Fuji apple (Malus domestica) [Article] New Zealand Journal of Crop and Horticultural Science 32(2) 227-234
Cobon D H Stone G S Carter J O Scanlan J C Toombs N R Zhang X et al (2009) The climate change risk management matrix for the grazing industry of northern Australia Rangeland Journal 31(1)
Cooke J E K Eriksson M E amp Junttila O (2012) The dynamic nature of bud dormancy in trees
environmental control and molecular mechanisms Plant Cell and Environment 35(10) 1707-
1728 Darbyshire R McClymont L amp Goodwin I (2015) Sun damage risk of Royal Gala apple in fruit-
growing districts in Australia New Zealand Journal of Crop and Horticultural Science 43(3) 222-232
Darbyshire R Pope K amp Goodwin I (2016) An evaluation of the chill overlap model to predict
flowering time in apple tree Scientia Horticulturae 198 142-149 Darbyshire R Webb L Goodwin I amp Barlow E W R (2013a) Evaluation of recent trends in
Australian pome fruit spring phenology International Journal of Biometeorology 57(3) Darbyshire R Webb L Goodwin I amp Barlow E W R (2013b) Impact of future warming on winter
chilling in Australia International Journal of Biometeorology 57(3) 355-366 Dennis F G Jr (2003) Problems in standardizing methods for evaluating the chilling requirements for
the breaking of dormancy in buds of woody plants HortScience 38(3)
Erez A Fishman S Linsley-Noakes G C amp Allan P (1990) The dynamic model for rest completion in peach buds Acta Horticulturae 276 165-174
Fishman S Erez A amp Couvillon G A (1987) The temperature dependence of dormancy breaking in plants mathematical analysis of a two-step model involving a cooperative transition Journal of Theoretical Biology 124 473 - 483
Ghariani K amp Stebbins R L (1994) Chilling requirements of apple and pear cultivars Fruit varieties journal 48(4) 215 - 222
Hauagge R amp Cummins J N (1991) Phenotypic variation of length of bud dormancy in apple cultivars and related Malus species Journal of the American Society for Horticultural Science 116(1) 100-
106
Hennessy K J amp Clayton-Greene K (1995) Greenhouse warming and vernalisation of high-chill fruit in southern Australia Climatic Change 30(3)
Lakso A N amp Johnson R S (1990) A simplified dry matter production model for apple using automatic programming simulation software Acta Horticulturae 276 141 - 148
Legave J M Blanke M Christen D Giovannini D Mathieu V amp Oger R (2013) A comprehensive overview of the spatial and temporal variability of apple bud dormancy release and blooming
phenology in Western Europe International Journal of Biometeorology 57(2)
Lolicato S (2011) Sun protection for fruit a practical manual for preventing sunburn on fruit - 2011 Department of Primary Industries Farm Services Victoria Division Melbourne Australia
Luedeling E Blanke M amp Gebauer J (2015) Chilling challenges in a warming world In J C Mauget amp S Godet (Eds) Acta Horticulturae (pp 901-907) Leuven Belgium International Society for
Horticultural Science (ISHS)
Luedeling E amp Brown P H (2011) A global analysis of the comparability of winter chill models for fruit and nut trees International Journal of Biometeorology 55(3)
Middleton S amp McWaters A (2002) Hail netting of apple orchards- Australian experience The Compact Fruit Tree 35(2) 51 - 55
Panda S S Hoogenboom G amp Paz J O (2010) Remote sensing and geospatial technological
55
applications for site-specific management of fruit and nut crops A review [Review] Remote Sensing 2(8) 1973-1997
Pope K S Da Silva D Brown P H amp DeJong T M (2014) A biologically based approach to
modeling spring phenology in temperate deciduous trees Agricultural and Forest Meteorology 198ndash199(0) 15-23
Putland D Deuter P Hayman P Hetherington S Middleton S Nidumolu U et al (2011) The apple and pear industrys response to climate change and climate variability a desktop study Growcom Fortitude Valley Queensland Australia
Smart R E amp Sinclair T R (1976) Solar heating of grape berries and other spherical fruits [Article] Agricultural Meteorology 17(4) 241-259
State of the climate (2016) Australian Bureau of Meteorology amp CSIRO Theron K (2013) Chemical thinning of apple South African perspective Acta Horticulturae 998 85 -
90
Treeby J Goodwin I MurphyWhite S Darbyshire R White N McClymont L et al (2017a) Winter chill and flowering- what is there to know Queensland
Treeby J Goodwin I MurphyWhite S Darbyshire R White N McClymont L et al (2017b) Netting for heat- what is there to know Queensland
Whetton P H Karoly D Watterson I G Webb L Drost F Kirono D et al (2013) Australias
climate in a four degree world In P Christoff (Ed) Four degrees of global warming Australia in a hot world (pp 17 - 32) London EarthscanRoutledge
White N Parkes H amp Treeby J (2017) Future climates in pome fruit orchards- what is there to know Queensland
TechnicalReportAnalysisofHistoricalandFutureClimateandtheProductionofPomeFruitNeilWhite
February2017
2
TableofContents
Technical Report Analysis of Historical and Future Climate and the Production of Pome Fruit1
Introduction5
Site Descriptions and Data Preparation5
Reliability of techniques used to interpolate between daily and hourly temperatures7
Models of Chill Accumulation8
What is winter chill8
Chill Hours9
Utah Chill Units9
Dynamic Model9
Trends in Temperature and Chill Accumulation11
Autumn and winter11
Winter chill13
Spring and Summer15
Extreme Heat17
Climate Scenarios for apple growing regions for 2030 and 205018
How were the scenarios chosen18
Selection of Global Climate Models20
Calculation of Climate Projections for Station Data21
Future Climate Projections and the Impact on Flowering23
Future Projections of Impact on Quality25
Discussion and Conclusions27
Take-home messages from the historical record28
Take-home messages from the future scenarios28
References29
3
ListofTablesTable1Descriptionofweatherstationsusedintheanalysis6
Table2DescriptionofGCMsusedinthisstudy21
Table3Summaryofaveragechillportions(1Marchndash31August)for2030and2050usingamoderate(RCP45)toworstcasescenario(RCP85)modellingapproachbasedonhistoricaldatafrom1985to2014Meanof30yearswithlowestandhighestinparentheses24
Table4Safewinterchillcalculationsfortheperiod1985to201424
Table5Summaryofaveragedateoffullbloom(CrippsPink)for2030and2050usingamoderate(RCP45)toworstcasescenario(RCP85)basedonhistoricaldatafrom1985to201425
Table6Summaryofmeanvaluesforbrowningrisk(percentageofdays)forJanuaryandFebruary26
ListofFigures
Figure1Australiarsquosappleandpearindustrycentres(white)andlocationsreferredtointhetext5
Figure2ExamplesoftheuseoftheinterpolationroutinetoconvertdailymaximumandminimumtemperaturestohourlyTheorangelineis21December2015andthebluelineis21June2015forApplethorpeDotsindicatethemaximum(orange)andminimum(blue)foreachdaythatwereusedtogeneratetheinterpolatedhourlydata7
Figure3MeasuredhourlytemperaturedataandhourlydatainterpolatedfromdailymaximumandminimumforApplethorpeLineshowsthe11correlation8
Figure4ComparisonofchillportionaccumulationcalculatedfromorchardhourlydatahourlydatainterpolatedfromtheorcharddailymaximaandminimaandthenearbyAWS8
Figure5Trendsintemperaturefrom1970to2015RedshowsthatthetrendintemperaturehasbeentowardshottertemperatureswhileblueshowsatrendtowardscoolertemperaturesThehighertheintensityofcolourthestrongerthetrendcopyCommonwealthofAustralia2016AustralianBureauofMeteorology11
Figure6Averageautumn-winterminimumtemperatureanomaliescomparedtoabaseperiodof1981to2010Theblacklineisan11-yearmovingaverage12
Figure7Averageautumn-wintermaximumtemperatureanomaliescomparedtoabaseperiodof1981to2010Theblacklineisan11-yearmovingaverage13
Figure8Annualanomaly(averagechange)inaccumulationofchillportions(1Marchndash31August)comparedtoabaseperiodof1981to2010Theblacklineisan11-yearmovingaverage14
Figure9Averagespring-summerminimumtemperatureanomaliescomparedtoabaseperiodof1981to2010Theblacklineisan11-yearmovingaverage15
Figure10Averagespring-summermaximum(right)temperatureanomaliescomparedtoabaseperiodof1981to2010Theblacklineisan11-yearmovingaverage16
Figure11Annualanomaly(averagechange)inaveragenumberofdayswheremaximumtemperatureexceeds35degCcomparedtoabaseperiodof1981to2010Theblacklineisan11-yearmovingaverage17
Figure12Measured(CapeGrimTasmaniaandMaunaLoaHawaii)andFutureCO2forRCP45andRCP85andmeasuredandpredictedtemperatureanomaly(TA)usingtherelationshownintheinset19
4
Figure13AccumulationofchillforhistoricalaverageconditionsatManjimupandforaprojectedclimatefor2030underRCP45andRCP85(top)Themonthlychangeinaveragetemperaturethatcausedthedifferenceinthechillaccumulationinthefutureisshowinthelowergraph20
Figure14MeanmonthlyminimumtemperaturesforApplethorpefor2030underRCP45(left)andRCP85(right)22
Figure15MeanmonthlyminimumtemperaturesforApplethorpefor2050underRCP45(left)andRCP85(right)22
Figure16TheChill-OverlapModelCristhechillrequiredforfloweringCoisthemaximumadditionalchillthatwillreducetheheatrequirementHristheheatrequiredwhenCochillisaccumulatedandHoistheheatrequiredwhenchillisanCr(RedrawnfromDarbyshireetal2016)23
5
IntroductionThisreportsetsoutourcurrentknowledgeofhowclimatechangewillaffectpomefruitgrowing
regionsinAustraliaAllthepomefruitgrowingregionsinAustraliahaveseenaconsistentwarming
trendsince1970forbothwinterandsummertemperaturesInresponsetothisgrowershavebegun
toadaptthemanagementoftheirorchardstocopewiththesechangestoremainprofitableThese
trendsarelikelytocontinuesowhatcangrowersexpectinthefuture
SiteDescriptionsandDataPreparation
Trendsintemperatureovertheperiod1968to2015havebeenpresentedastheyearlyaverage
change(anomaly)fromabaselineperiodof1981to2010(30years)foreachofthesitesshownin
Figure1
DatawereobtainedfromSILO1
(Jeffreyetal2001)arepositoryof
climatedataforAustraliaThereare
twosetsofdataavailableagridded
dailydatasetandthepatchedpoint
dataset(PPD)Dataforthesites
showninTable1wasextracted
fromthePPDwhichprovidesdaily
maximumandminimum
temperaturesfrom1889tothe
presentInterpolatedvaluesare
insertedtomaintaincontinuitywhen
dataaremissingforsomereason
egthestationwasnotoperating
duetomalfunctionInterpolationis
usuallyfromdailysurfacesbutinsomecasesmightcomefrommorelong-termandhenceless
accuratespatialdataThesitesselectedforthestudyhadagenerallylownumberofdayswhendata
wasmissing(Table1)
1httplongpaddockqldgovau
Figure1Australiarsquosappleandpearindustrycentres(white)andlocationsreferredtointhetext
6
MeteorologicalstationsinAustraliathatrecordtemperatureareasmallfractionofthetotalnumber
ofstationsStationsatlocalpostofficesthatrecordeddatabyhandhavesometimesbeenclosedin
favourofautomaticweatherstations(AWS)nearbyoftenatanairfieldThePPDresolvessomeof
theseproblemsandprovidesdataforstationsregardlessoftheirprevioushistoryHoweverthis
reducesthereliabilityofdatasetsfromstationswithalotofmissingobservationsMountBarkerand
OrangewereusedhereinpreferencetoLenswoodandBatlowrespectivelybecausethesestations
havemorereliablehistoricaltemperaturerecords
Table1Descriptionofweatherstationsusedintheanalysis
StationNumber
StationName2
(Shortname)
LongitudeLatitude
FirstObservation LastObservation
Missing()
41175 Applethorpe 15195degE2862degS
1Jan1968 Current 74
81049 TaturaInstituteforSustainableAgriculture
(Shepparton)
14539degE3643degS
2July1965 Current 32
9573 Manjimup 11614degE3425degS
2Jan1968 Current 37
63254 OrangeAgriculturalInstitute
(Orange)
14908degE3332degS
2Jan1976 Current 203
94069 Grove
(Huonville)
14708degE4298degS
1Jan1968 10Feb2010 203
23733 MountBarker 13885degE3507degS
1Jan1968 Current 19
2DataforSheppartonandHuonvillecomesfromtheTaturaInstituteforSustainableAgricultureandGroverespectively
7
ModelsforcalculatingwinterchillrelyonhourlydataHoweverhourlydataisnotgenerallyavailable
fromtheBureauofMeteorologyweatherstationsandneedstobegeneratedfromdailymaximaand
minima
DailydatawereconvertedtohourlyusingtheroutineinthechillRpackage(Luedelingetal2013)
usingtheRStatisticalLanguage(RCoreTeam2015)Thisusestheinterpolationroutinedevelopedin
Linvill(1990)AnexampleofthisinterpolationisshowninFigure2
Figure2ExamplesoftheuseoftheinterpolationroutinetoconvertdailymaximumandminimumtemperaturestohourlyTheorangelineis21December2015andthebluelineis21June2015forApplethorpeDotsindicatethemaximum(orange)andminimum(blue)foreachdaythatwereusedtogeneratetheinterpolatedhourlydata
Reliabilityoftechniquesusedtointerpolatebetweendailyandhourlytemperatures
Hourlytemperaturedatafor2013inApplethorpe(collectedfromanon-siteorchardtemperature
loggerARS1)wasusedtoassesstheaccuracyoftheinterpolationmethodThedailymaximaand
minimaweretakenfromtheorchardhourlydatasetandtheinterpolationmethodwasappliedto
recreatethehourlydataTheorchardhourlydatawasthencomparedwiththeinterpolatedhourly
dataFigure3
Thecorrelationcoefficientis097indicatingacloserelationshipbetweenthetwosetsofdata
howevertheeffectoftheinterpolationcanstillbeseenThesensitivityoftheDynamicModeltothe
discrepanciesbetweenobservedandinterpolatedhourlydataneedstobeassessedintermsofchill
accumulationandheatstress
8
Figure3MeasuredhourlytemperaturedataandhourlydatainterpolatedfromdailymaximumandminimumforApplethorpeLineshowsthe11correlation
Figure4ComparisonofchillportionaccumulationcalculatedfromorchardhourlydatahourlydatainterpolatedfromtheorcharddailymaximaandminimaandthenearbyAWS
Thechillportionscalculatedfromthethreedatasetswereincloseagreementwhichisimportantas
theSILOdataneedstobeusedtoconsiderfutureclimateprojectionsFigure4
Theimpactoftheinterpolationonthecalculationofheatthresholdsismoreproblematic
Interpolationfromdailyorcharddatatohourlyoverestimatedthenumberofhoursexceeding30degC
by36Importantlybasedonthenumberofdaysexceedingthe30degCthresholdtherewasonlya
differenceoftwodaysbetweenorcharddailyandtheautomaticweatherstation(AWS)dataThisis
acceptableandistheapproachthatisusedinourstudy
ModelsofChillAccumulationWhatiswinterchill
Thedormantwinterphaseisanevolutionaryadvantagethatprotectsfruittreesfromcoldweather
damagebypreventingthegrowthofcold-sensitiveshootsandflowersinresponsetoawinterwarm
spellFortreestoresumegrowthinspringthisdormantphasemustbebrokenPerennialfruittrees
breakdormancyaftercertainwinterconditionshavepassed-thetreehasthendeterminedthat
winterhasfinishedandwillbegintoflowerinresponsetowarmtemperaturesThewinterchill
requiredtobreakdormancythechillingrequirementdiffersbycropandvarietyandpossibly
locality
AccumulationofwinterchilltobreakdormancyislargelyatemperaturedependentprocessThe
relationshipofdifferenttemperaturesandtemperatureregimestodormancybreakingarespecies
andcultivar-specificbuttherearesomegeneralaspectsthatarethoughttobeinvolved
bull Freezingtemperaturesdonotcontributetodormancybreaking
9
bull Thereareoptimumtemperaturesfortheaccumulationofwinterchill
bull Temperatureseithersideoftheoptimumdecreasethecontributiontowinterchill
bull Hightemperaturescanundopreviouslyaccumulatedchill
bull Cyclingmoderatetemperatureswitheffectivechillingtemperaturesenhancesthe
accumulationofwinterchill
bull Itisstilllargelyunknownwhenatreebecomessensitivetothechillingtemperaturendashitcould
evenbebeforeleafdrop
TheseassumptionscanbeexpressedasasetofcalculationsthattogetherformachillmodelThe
threemostcommonmodelsareChillHoursUtahChillUnitsandtheDynamicModel
ChillHours
TheChillHoursmodel(Weinberger1950)isbyfarthesimplestmodelItaccumulatesthenumberof
thehourswherethetemperatureislessthan72degCandgreaterthan0degCThereisaformthatalso
includeshoursbelow0degCbutinthisstudywehaveusedthe0degCthreshold
UtahChillUnits
Thismodel(Richardsonetal1974)usesaslightlymorecomplicatedprocedureinwhichlowandhigh
temperaturesadverselyaffecttheaccumulationofchillThemethodofcalculationisasfollows
whereTisthetemperaturerecordedforthehourindegC
LowerLimit(TgtdegC) UpperLimit(Tlt=degC) ChillUnitsContributed
14 0
14 24 05
24 91 10
91 159 05
159 18 -05
18 -10
Hoursspentatorbelow14degCdonotcontributetochillaccumulationGreatestchillaccumulationis
between24andlessthanorequalto91degCTemperaturesabove159degCreducethechill
accumulationastheycontributenegativechillunits
DynamicModel
10
TheDynamicModel(Fishmanetal1987Erezetal1990)whichcalculateschillinChillPortionsis
themostcomplexofthechillmodelsItisthecurrentbestpracticemodelespeciallyinwarmer
climates(Erez2000Luedelingetal2011)andisthereforethemodelwehaveusedforwinterchill
calculationsInthismodelaccumulationofchillisadynamicprocesswherebytheequationsdescribe
thebuild-upofahypotheticaldormancybreakingfactor(DBF)throughatwo-stepprocess
TheaccumulationofDBFisreferredtoasChillPortionsandaChillPortionhasaccumulatedwhenthe
amountofDBFreaches1AtthispointitformspartofthestablepoolandcannotbedestroyedIf
lessthan1iscurrentlyinthelabilepoolitcanbereducedThisisseenwhenwarmtemperatures
occurandthereisnochillaccumulationHoweverthecurrentnumberofChillPortionsisnot
reducedProductionofDBFoccursbetween0degCand12degCandisoptimalbetween6degCand8degCThe
modelalsocapturesthesituationobservedinsometreecropswhereaccumulationofchillis
enhancedwheniftemperaturesintherange13degCto16degCarecycledwithlowertemperatures
11
TrendsinTemperatureandChillAccumulationTrendsintemperaturehavebeenassessedintermsofannualtemperatureandseasonalmaximum
andminimumtemperaturesforeachofthesitesTheBureauofMeteorology(BoM)maintainsaweb
pagethatallowstrendsinclimatevariablestobeassessed3ThemapsshowninFigure5show
consistentwarmingtrendsacrossthepomeandstonefruitgrowingregions
Figure5Trendsintemperaturefrom1970to2015RedshowsthatthetrendintemperaturehasbeentowardshottertemperatureswhileblueshowsatrendtowardscoolertemperaturesThehighertheintensityofcolourthestrongerthetrendcopyCommonwealthofAustralia2016AustralianBureauofMeteorology
Autumnandwinter
Autumnandwintertemperatureslargelydetermineprogressionthroughdormancyandsignificantly
impactfloweringtimingandqualityinpomefruittreesForexamplewarmweatherinautumn
causesdelaysinleafdropandslowstheentranceintodormancyMildwintersresultinginalackof
winterchillcausedelayedunevenandprotractedflowering
3httpwwwbomgovauclimatechangetabs=Trackeramptracker=timeseries
12
MinimumtemperaturesinautumnandwinterhaveincreasedinHuonvilleOrangeandMtBarker
since1968(Figures6)InHuonvilleandOrangethewarmingtrendismoreapparentinminimum
temperaturesthanmaximumsoverthisperiodwhileApplethorpeSheppartonManjimupandMt
Barkerallshowanincreaseinmaximumautumnandwintertemperatures(Figure7)
Applethorpe Shepparton
Manjimup Huonville
Orange MountBarker
Figure6Averageautumn-winterminimumtemperatureanomaliescomparedtoabaseperiodof1981to2010Theblacklineisan11-yearmovingaverage
AtApplethorpeSheppartonandMountBarkeritwasmorelikelythatafter1990maximum
temperaturesduringautumnandwinterwouldgreaterthanthelong-termaverage(Figure7)
13
Applethorpe Shepparton
Manjimup Huonville
Orange MountBarker
Figure7Averageautumn-wintermaximumtemperatureanomaliescomparedtoabaseperiodof1981to2010Theblacklineisan11-yearmovingaverage
Winterchill
ThemildergrowingregionsofApplethorpeManjimupandMtBarkerhaveexperiencedadeclinein
thenumberofchillportionsaccumulatedsince1968(Figure8)Sheppartonhasseenasmall
reductioninwinterchilloverthisperiodwhilethecolderregionsofHuonvilleandOrangehavenot
changedEightoutoftenyearsinManjimupfrom2006to2016havehadlesswinterchillthanthe
long-termaverageFigure8
14
Applethorpe Shepparton
Manjimup Huonville
Orange MountBarker
Figure8Annualanomaly(averagechange)inaccumulationofchillportions(1Marchndash31August)comparedtoabaseperiodof1981to2010Theblacklineisan11-yearmovingaverage
15
SpringandSummer
Temperaturesexperiencedinspringandsummerareanimportantdriverofflowerandfruit
developmentandsignificantlyimpactonfruitqualityinappleandpeartreesForexamplewarm
weatherinspringtendstoshortentheperiodoffloweringandheatinsummerimpactscolour
developmentthroughinhibitionofanthocyanins(Lin-Wangetal2011)Extremesummer
temperaturesinhibitfruitgrowthandcausesunburnbrowning(Flaishmanetal2015)
Applethorpe Shepparton
Manjimup Huonville
Orange MountBarker
Figure9Averagespring-summerminimumtemperatureanomaliescomparedtoabaseperiodof1981to2010Theblacklineisan11-yearmovingaverage
16
TherewereclearwarmingtrendsintheminimumspringandsummertemperaturesatOrangeand
MtBarker(Figure9)AtSheppartonOrangeandMountBarkeritwasthreetofourtimesmorelikely
thattheaverageminimumtemperaturemeasuredafter1990wasgreaterthanthelong-term
averagecomparedtothatmeasuredbefore1990Springandsummermaximumtemperatureshave
warmedinmostlocationssince1968exceptforHuonville(Figure10)Thishasimplicationsforthe
frequencyofextremeheateventsandwarmerspringtemperaturesmayhaveoffsetthereductionin
chillingobservedinmildergrowingregions
Applethorpe Shepparton
Manjimup Huonville
Orange MountBarker
Figure10Averagespring-summermaximum(right)temperatureanomaliescomparedtoabaseperiodof1981to2010Theblacklineisan11-yearmovingaverage
17
ExtremeHeat
Sheppartonhasexperiencedanincreaseinthenumberofextremeheatdays(iemaximum
temperatureexceeded35degC)receivedperyearsince1968(Figure11)Maximumtemperaturesrarely
exceedthisthresholdinApplethorpeandHuonvilleandthesesiteshavenotseenmuchchangeover
theperiodMountBarkershowedasignificanttrendinthenumberofheatdaysandthelastsixyears
inManjimuphavebeenabovethelong-termaverage
Applethorpe Shepparton
Manjimup Huonville
Orange MountBarker
Figure11Annualanomaly(averagechange)inaveragenumberofdayswheremaximumtemperatureexceeds35degCcomparedtoabaseperiodof1981to2010Theblacklineisan11-yearmovingaverage
18
ClimateScenariosforapplegrowingregionsfor2030and2050
Howwerethescenarioschosen
Futureclimateprojectionsarederivedusingsimulationsoftheearthrsquosclimatesystem(GlobalClimate
ModelorGCM)underdifferentscenariosoffuturegreenhousegasandaerosolemissionsThe
scenariosarereferredtoasrepresentativeconcentrationpathways(RCPseeinsetbelow)and
representaplausiblesetoffutureemissionsAGCMusesthisinformationthroughthecomplexset
ofequationsthatdeterminehowtheclimaterespondstochangesintheatmosphereRCPsare
classifiedbytheamountofradiativeforcing(seeinset)thatwillbeexperiencedin2100
The measured and projected levels of atmospheric CO2 are shown in Figure12 It is worth noting
that the projected level in 2100 under RCP 45 is the same as the level reached in 2050 under
RCP 85 The observed emission trends (2005-2012) are in line with the worst-case scenario
RCP85(Petersetal2012) Policy decisions made over the next decade or so will be critical in
RepresentativeConcentrationPathways(RCPs)
Radiativeforcingistheextraheatthattheloweratmospherewillretainasthe
resultofadditionalgreenhousegasesIn1979thisamountedto17Wm-2By
2014thishasrisento29Wm-2In1979theCO2concentrationwas335ppmThe
currentlevelasofFebruary2016is398ppm
RCP45andRCP85havebeenselectedtorepresenttherangeofplausiblefuture
climates
RCP45achievingloweremissionsduetosomemitigationeffortsandtheCO2
concentrationreaching540ppmby2100(risingmoderatelyrapidlyandthen
peakingearly)ndashsettingaminimumtomediumcaseclimatechangescenario
RCP85abusiness-as-usualapproachwithCO2concentrationcontinuingtorapidly
risereaching940ppmby2100ndashsettingaworst-caseclimatechangescenario
Source(ButlerandMontzka2016CSIRO2016)
19
determining the pathway that is taken Data from BoM4 of the global temperature anomaly and
yearly maximum atmospheric CO2 recorded at Mauna Loa from 1958 to 2016 were used to
derive a simple relationship between them that accounts for 82 of the variation (see inset
Figure12)
Figure12Measured(CapeGrimTasmaniaandMaunaLoaHawaii)andFutureCO2forRCP45andRCP85andmeasuredandpredictedtemperatureanomaly(TA)usingtherelationshownintheinset
Todeterminetheprojectionsoffutureclimatechangeitisfirstnecessarytoextractthemonthly
changefactorsClimatechangefactorsallowtheinformationfromcoarse-grainedGCMs(typically
100-200km)toberepresentedatalocalscaleAclimatechangefactorforJanuary2030usingthe
ACCES10modelmightbe+1degCthisisaddedtothedailyobservationsforJanuarytocreatea
possibleclimateThisprocessisrepeatedforeachmonthtimescaleandGCMThisallowsafuture
climatesettobecreatedthatincorporateshistoricalvariability
4httpwwwbomgovauclimatechangeindexshtmltabs=Trackeramptracker=global-timeseries
20
Whiletheactualchangesmaybesmallrelativetodailytemperaturevariationsthebiological
responsemaybesignificantbecauseoftheimpactofthresholdtemperaturesCalculationsofchilling
forexampleusethresholdtemperaturestodeterminethecontributionmadetodailychill
accumulationAsmallshiftintemperaturethroughoutautumnandwintercanhavealargeeffecton
theoutcomeasdemonstratedforManjimupin2030Figure13Theindividualtemperaturechange
foragivenmonthandRCPmayonlybeintheregionof05to12degCbutovertheseasonthisis
enoughtoreducetheaccumulatedchill
Figure13AccumulationofchillforhistoricalaverageconditionsatManjimupandforaprojectedclimatefor2030underRCP45andRCP85(top)Themonthlychangeinaveragetemperaturethatcausedthedifferenceinthechillaccumulationinthefutureisshowinthelowergraph
SelectionofGlobalClimateModels
GlobalClimateModels(GCM)wereselectedfromthelistofmodelsgeneratedbytheClimateFutures
ToolattheClimatechangeinAustraliawebsite5ThreeGCMs(Table2)wereselectedbasedonahigh
Mscore(Watterson1996)thatmeasurestheabilityoftheGCMtorepresenthistoricalobservations
AperfectmatchwouldhaveanMscoreof1000TheGCMsselectedandtheiraverageMscores
wereACCCES1-0(727)HadGEM2-ES(720)andMPI-ESM-LR(720)Inthiscasetheagreement
betweenmodelledandobservedclimatewasbasedontemperaturerainfallandmeansealevel
pressureforthefourseasonsoverthewholeofAustraliaThesemodelsscoredgreaterthan800for
5httpwwwclimatechangeinaustraliagovau
21
surfacetemperaturealoneForRCP45theseGCMswereinagroup(2338GCMs)thatpredicted
warmerwintermaximumandminimumtemperaturesTheprojectedchangeintemperaturewas
from05degCto15degCForRCP85HadGEM2-ESwasgroupedwiththosethatshowedawarmer
minimumtemperaturebuthottermaximumtemperatures15degCto30degC(1340GCMs)ACCESS10
andMPI-ESM-LRweregroupedwiththosethatshowedwarmerminimumandmaximum
temperaturesinwinter(2440)
Table2DescriptionofGCMsusedinthisstudy
GCM Institute AverageM
score1000
FurtherInformationandspatialresolution
(latitudexlongitude)
ACCESS1-0 CSIROand
Bureauof
Meteorology
727 httpsconfluencecsiroaudisplayACCESSHome
(125degx1875deg)
HadGEM2-
ESM
MetOffice
HadleyCentre
720 httpwwwmetofficegovukresearchmodelling-
systemsunified-modelclimate-modelshadgem2
(125degx1875deg)
MPI-ESM-LR MaxPlanck
Institutefor
Meteorology
720 httpwwwmpimetmpgdeensciencemodelsmpi-
esmhtml
(1865degx1875deg)
CalculationofClimateProjectionsforStationData
ClimatechangefactorswereobtainedfromgriddeddatasetsintheCIMP5multi-modelensemble6
(seeTayloretal2011)andappliedasmonthlyclimatechangefactorstothedailydataforeachof
thesites
Themethodusedtoperturbthepresentclimatetoafutureclimateresultsinashiftthatcanbeseen
onamonthlyscale(Figures14and15)Thisisbecausethechangefactorappliedtodaily
temperaturesisthesamewithineachmonth
Figures14and15demonstratethatuntil2030thechoiceoftheRCPhaslittleimpactbutby2050
thedifferencescausedbythehigheremissionsintheRCP85pathwaycanbeclearlyseen
6httpnrm-erddapnciorgauerddapindexhtml
22
Figure14MeanmonthlyminimumtemperaturesforApplethorpefor2030underRCP45(left)andRCP85(right)
Figure15MeanmonthlyminimumtemperaturesforApplethorpefor2050underRCP45(left)andRCP85(right)
23
FutureClimateProjectionsandtheImpactonFloweringThe relationship between chilling and flowering can been described mathematically (Popeetal
2014) such that the amount of chill that accumulates affects the flowering date because the
amount of heat required to promote
flowering is altered(Darbyshireetal
2016) found that for Cripps Pink
apples the minimum amount of chill
required is 34 Chill Portions Less
than this critical amount of chill
cannot be compensated for with
heating and there is no effective
flowering If additional chill is
accumulated then there is a lower
requirement for heat This
relationship between the
accumulation of chill and the heat
requirement is referred to as the
Chill-Overlap Model Figure16
FuturechillaccumulationasmeasuredbyChillPortions(CP)willdeclinein2030and2050under
boththeRCP45andRCP85scenariosatgrowingregionsacrossAustralia(Table3)Thehighest
declineswillbeforManjimupApplethorpeandMtBarkeralthoughallsitesshowadeclineThe
smallestdeclinesareatOrangeandHuonvillewhichdeclinebylessthan5in2030andbylessthan
15in2050undereitherRCP45orRCP85
Using the mathematical relationships embodied in the Chill-Overlap model (Figure16) it is
possible to compare how full bloom dates might change in the future and whether the
increased temperatures during spring and summer can compensate for the reduced chill
accumulation (Table5)
Figure16TheChill-OverlapModelCristhechillrequiredforfloweringCoisthemaximumadditionalchillthatwillreducetheheatrequirementHristheheatrequiredwhenCochillisaccumulatedandHoistheheatrequiredwhenchillisanCr(RedrawnfromDarbyshireetal2016)
24
Table3Summaryofaveragechillportions(1Marchndash31August)for2030and2050usingamoderate(RCP45)toworstcasescenario(RCP85)modellingapproachbasedonhistoricaldatafrom1985to2014Meanof30yearswithlowestandhighestinparentheses
Present
2030 2050
RCP45 RCP85 RCP45 RCP85
Applethorpe 72(62-83) 63(48-75) 60(44-73) 56(41-69) 51(36-65)
Shepparton 84(73-93) 75(63-85) 74(62-86) 71(58-81) 67(57-79)
Manjimup 67(55-82) 57(43-76) 55(42-75) 50(36-72) 47(33-68)
Huonville 105(94-113) 98(81-112) 97(78-110) 93(74-105) 90(71-104)
Orange 100(90-110) 94(85-104) 93(82-101) 90(81-99) 87(78-94)
MountBarker 84(67-93) 74(55-88) 73(53-88) 70(53-84) 65(47-80)
Theconceptofsafewinterchill(SWC)wasintroducedbyLuedelingetal(2009)ameasurethatcan
bethoughtofasthenumberofchillportionsthatagrowercouldexpectin90ofyears
Table4Safewinterchillcalculationsfortheperiod1985to2014
Present
2030 2050
RCP45 RCP85 RCP45 RCP85
Applethorpe 67 55 55 47 46
Shepparton 76 67 68 66 59
Manjimup 60 49 52 44 41
Huonville 99 91 94 88 86
Orange 94 87 87 85 81
MountBarker 74 62 66 60 56
ReductionsintheSWCinApplethorpeManjimupandMountBarkerweresimilarandrangedfrom
16to17in2030and18to32in2050
25
Orangealocationwithahighchillaccumulationtheaveragedateoffullbloomisadvanced(earlier
bloom)by4to5daysOtherlocationsshowedadelayedfullbloomdatewiththegreatestimpactfelt
atManjimupthelocationwiththeleastchillatpresentandintothefuture
Table5Summaryofaveragedateoffullbloom(CrippsPink)for2030and2050usingamoderate(RCP45)toworstcasescenario(RCP85)basedonhistoricaldatafrom1985to2014
Average
PredictedFull
BloomDate Present
2030
2050
RCP45 RCP85 RCP45 RCP85
Applethorpe 4Oct 7Oct 9Oct 12Oct 16Oct
Shepparton 30Sep 3Oct 3Oct 5Oct 6Oct
Manjimup 16Oct 22Oct 25Oct 30Oct 2Nov
Huonville 26Sep 27Sep 29Sep 29Sep 29Sep
Orange 2Oct 28Sep 28Sep 28Sep 27Sep
MountBarker 1Oct 5Oct 4Oct 6Oct 8Oct
Delaysinfullbloomdatearecausedwhenlesswinterchillisaccumulatedduringtheautumnand
winterperiodandconsequentlymoreheatisneededtopromotefloweringManjimupislikelyto
experiencethegreatestdelayinfullbloomdatesinfutureclimatescomparedwithotherlocations
Thisisbecausechillaccumulationabove34CPthisisCrFigure16-thechilloverlapmodelin
Manjimupdropsfrom22CPinthepresentclimateto14ndash16CPin2030and10ndash12CPin2050To
compensateforthisagreateraboutofheatneedstobeaccumulated(iemovingfromHrtowards
HoinFigure16)andthisrequiredanextra6to9daysin2030and14to17daysin2050In
comparisonatOrangethemuchcoolerwintertemperaturesandhighchillaccumulationloweredthe
requirementforheatThishelpedtoadvancethedatefullbloombecauseofhigherspring
temperatures(Figure9andFigure10)
FutureProjectionsofImpactonQualityOneofthemainrisksforproductionisextremeheatdaysasthisleadstosunburnbrowningSun
damageriskinRoyalGalawasstudiedinapplegrowingregionsinAustralia(Darbyshireetal2015)
Theydevisedabrowningriskdayfornon-nettedandnettedorchardsbasedonairtemperaturesand
26
foundthatdailymaximumtemperaturesgreaterthan341degCinnon-nettedorchardsand379degCin
nettedorchardswereassociatedwithanincreasedriskofbrowningWhilethatstudyandWebbet
al(2016)consideredJanuarytemperatureswehaveextendedtheanalysistoincludeFebruaryas
thiscoincideswiththefruitingperiodUsingthedailymaximumtemperaturesforJanuaryand
Februaryfrom1981to2010(present)andfutureclimatesin2030and2050wecalculatedthe
browningriskasthepercentageofdaysthatexceededthetemperaturethresholdswithandwithout
nettingFollowingWebbetal(2016)weclassifiedbrowningriskin5categories
pound5 gt5to10 gt10to20 gt20to30 gt30to50
Table6Summaryofmeanvaluesforbrowningrisk(percentageofdays)forJanuaryandFebruary
WithoutNetting 2030 2050
Site Present RCP45 RCP85 RCP45 RCP85
Applethorpe 11 24 28 28 49
Shepparton 183 239 268 275 358
Manjimup 100 152 152 166 198
Huonville 24 34 38 45 42
Orange 24 38 44 37 84
MtBarker 173 207 229 232 258
WithNetting 2030 2050
Site Present RCP45 RCP85 RCP45 RCP85
Applethorpe 00 00 01 01 04
Shepparton 48 70 90 88 132
Manjimup 16 38 39 44 60
Huonville 03 06 10 12 11
Orange 01 01 01 01 07
MtBarker 54 72 91 94 107
27
SheppartonMountBarkerandManjimupwillbemostadverselyaffectedwithoutnettinghowever
thiscanbelargelyoffsetwithnettingWithoutnettingManjimupmovestothesamecategoryby
2030thatSheppartonandMountBarkercurrentlyexperienceApplethorpeHuonvilleandtoalesser
extentOrangeareinlowriskcategoriesandarelikelytoremainthatwayinthefuture
DiscussionandConclusionsClimatechangerepresentsanimportantfactorforperennialtreecropswhetherthatisbecauseof
reducedchillorincreasedriskofsunburnbrowningTherehasbeenatendencytoconsiderthat
applesgenerallyhaveahighchillingrequirementyetsuccessfulcropsaregrowninSouthAfrica
(Cook2010)andManjimupwherethechillislowincomparisontotraditionalgrowingregionsLow
chillcancausearangeofproblemsincludingdelayedorerraticbudbreakbudabscissionlower
flowerandfruitqualityandreducedyield(seetableinAtkinsonetal2013)Safewinterchill
(Luedelingetal2009)underfutureclimatesisapossibleindicationofwhattoexpectApplethorpe
recordsalowerSWCin2030forthemoreoptimisticRCP45thanpresentdayManjimup(Table4)
Perennialtreecropindustriesareparticularlyvulnerabletoclimatechangebecauseofthecostand
longevityoforchardestablishmentWhilemanygrowershavebeenadaptingtothetrendsalready
evidentinahighlyvariableclimatetheimpactoffutureclimatemightbeunderestimatedbecauseof
thelanguageusedbyclimatescientistsandthemediaA1-2degCincreaseintemperaturemightseem
trivialconsideringdailyfluctuationshoweverascanbeseenfromtheanalysesthesecan
accumulateacrosstheseasonandhavelargerimpactsthroughdelayedfloweringandincreasedrisk
ofsundamage
Theimpactofchangesintemperaturesonfloweringinthefuturearecomplicatedbytheinteraction
betweenareductioninchillaccumulationduringwinterandincreasedspringandsummer
temperaturesWhilethechill-overlapmodelisusefulinunderstandingtheserelationshipsitisbased
largelyonhypotheticalprocessesGapsinourknowledgesuchasunderstandingwhenplantsstart
andstopchillaccumulationneedtobebasedonphysiologyietheunderstandingofthechemical
processes(Atkinsonetal2013)Thishasproveddifficultbecausetherearenooutwardsignsthat
canbeusedItishopedthatchemicalmarkersfortheseprocessescanbefoundsothatour
understandingwillbegreatlyadvancedThiswouldhavetheadvantageofbeingabletomakebetter
estimatesofhowthingsmightchangeinthefutureandpossiblyleadtobreakthroughsinbreeding
programsAtamorefundamentallevelourcurrentbestmodelformeasuringandpredictingchill
accumulationtheDynamicModelusesparametersthathaveonlybeenparameterisedforpeach
28
becausetheonerousexperimentalproceduresrequiredtoderivethemFurthermoreitreliesona
hypotheticalfactorthatmayormaynotexistThemodelespeciallyaspartofthechilloverlap
modelremainsthemostusefulwayofpredictingflowering
Take-homemessagesfromthehistoricalrecord
bull Allpomefruitgrowingregionshavegenerallyseenanincreasingtrendinmaximum
temperaturesinwinterandmaximumandminimumspringtemperatures
bull Thestrongestdownwardstrendinchillaccumulationhasoccurredatthemilderlocationsof
ApplethorpeManjimupandMountBarker
bull SpringandsummermaximumtemperaturesatalllocationsexceptHuonvilleshowan
upwardtrendThisisparticularlynoticeableforManjimupwhichhasrecordedahigherthan
long-termaveragemaximumsince2009
bull ExtremeheatisanemergingprobleminManjimupandgrowingregionsinNSWHeatdamage
hasbeenaprobleminVictoriaandtheincreaseobservedinManjimuphasprompteddetailed
studiesofhowandwhenbrowningoccursandatrialofnetsinthoseareas
Take-homemessagesfromthefuturescenarios
bull Smallincreasesinaveragetemperaturesmultiplytheireffectthroughtheaccumulationof
timeaboveorbelowthresholds
bull Theresponseofthepomefruittreetoreducedchillmaybepartiallyoffsetbyincreased
springandsummertemperaturesbutourcurrentbestunderstandingofthissuggeststhat
thiscannotoccurindefinitely
bull Upto2030-2040thedifferencesbetweentheclimatechangescenariosaresmallThe
childrenofthegrowerswhoarefarmingtodaymayin2050befacingaverydifferent
growingenvironmentInApplethorpewherealowchillyearis60CPnowwillfeellikeagood
yearandtheworstyearswillbelikenothingthathasbeenencounteredbefore
bull Thereisacomplexinterplaybetweenchillingandwarmingonthetimingoffloweringthatwe
areonlyjuststartingtounderstandMuchofourknowledgeofhowpomefruittreesrespond
hasbeeninconditionswherechillhasbeenmorethanadequateThechilloverlapmodelhas
beenusefulasmodelofthissituationbutthebiologicalbasisisuncertain
bull ExtremeheatwillcontinuetobeaprobleminhotsummerregionssuchasSheppartonwhere
italreadypresentschallengesforfruitqualityandisanemergingproblemforregionslike
ManjimupwhichcurrentlyhaveamildersummerclimateTheimpactonmarketablequalityis
wellknownandinvestmentinnettingseemstobethemostpracticalsolution
29
ReferencesAtkinsonCJRMBrennanandHGJones2013Decliningchillinganditsimpactontemperate
perennialcrops9148ndash62
ButlerJHandSAMontzka2016theNOAAannualgreenhousegasindex(AGGI)
httpwwwesrlnoaagovgmdaggiaggihtml
CookNC2010Appleproductionunderconditionsofsub-optimalwinterchillinginSouth
Africa199ndash204
CSIRO2016CapeGrimGreenhouseGasdataCSIROhttpwwwcsiroaugreenhouse-gases
DarbyshireRKPopeandIGoodwin2016Anevaluationofthechilloverlapmodeltopredict
floweringtimeinappletree198142ndash149
DarbyshireRLMcClymontandIGoodwin2015SundamageriskofRoyalGalaappleinfruit-
growingdistrictsinAustralia43222ndash232
ErezA2000BudDormancyPhenomenonProblemsandSolutionsintheTropicsandSubtropics
Pages17ndash48inTemperateFruitCropsinWarmClimatesSpringerNetherlandsDordrecht
ErezASFishmanGCLinsley-NoakesandPAllan1990TheDynamicModelforRestCompletion
inPeachBuds165ndash174
FishmanSAErezandGACouvillon1987Thetemperaturedependenceofdormancybreakingin
plantsMathematicalanalysisofatwo-stepmodelinvolvingacooperativetransition124473ndash483
FlaishmanMAYPelesYDahanSMilo-CochaviAFriemanandANaor2015Differential
responseofcell-cycleandcell-expansionregulatorstoheatstressinapple(Malusdomestica)
fruitletsPlantScience23382ndash94
JeffreySJJOCarterKBMoodieandARBeswick2001Usingspatialinterpolationto
constructacomprehensivearchiveofAustralianclimatedata16309ndash330
Lin-WangKUIDMichelettiJPalmerRVolzLLozanoREspleyRPHellensDChagnEgraveDD
RowanMTroggioIIglesiasandACAllan2011Hightemperaturereducesapplefruitcolourvia
modulationoftheanthocyaninregulatorycomplex341176ndash1190
LinvillDE1990CalculatingChillingHoursandChillUnitsfromDailyMaximumandMinimum
TemperatureObservations2514ndash16
30
LuedelingEAKunzandMBlanke2013Identificationofchillingandheatrequirementsofcherry
treesmdashastatisticalapproach57679ndash689
LuedelingEEHGirvetzMASemenovandPHBrown2011ClimateChangeAffectsWinter
ChillforTemperateFruitandNutTreesPLoSONE6e20155
LuedelingEMZhangandEHGirvetz2009ClimaticChangesLeadtoDecliningWinterChillfor
FruitandNutTreesinCaliforniaduring1950ndash2099PLoSONE4e6166
PetersGPRMAndrewTBodenJGCanadellPCiaisCLeQuereGMarlandMRRaupach
andCWilson2012Thechallengetokeepglobalwarmingbelow2degC34ndash6
PopeKSDDaSilvaPHBrownandTMDeJong2014Abiologicallybasedapproachto
modelingspringphenologyintemperatedeciduoustreesAgriculturalandForestMeteorology198ndash
19915ndash23
RCoreTeam2015RALanguageandEnvironmentforStatisticalComputingRFoundationfor
StatisticalComputingViennaAustria
RichardsonEASDSeeleyandRDWalker1974Amodelforestimatingthecompletionofrest
forRedHavenandElbertapeach9331ndash332
TaylorKERJStoufferandGAMeehl2011AnOverviewofCMIP5andtheExperimentDesign
93485ndash498
WattersonIG1996Non-dimensionalmeasuresofclimatemodelperformance16379ndash391
WebbLRDarbyshireTErwinandIGoodwin2016Arobustimpactassessmentthatinforms
actionableclimatechangeadaptationfuturesunburnbrowningriskinapple
WeinbergerJH1950Chillingrequirementsofpeachvarieties56122ndash128
Flowering in pome fruit trees across Australia
Implications of a changing climate
Heidi Parkes and Neil White Department of Agriculture and Fisheries Queensland
November 2016
This publication has been compiled by Heidi Parkes and Neil White of Horticulture and Forestry Science Department of Agriculture and Fisheries copy State of Queensland 2016 The Queensland Government supports and encourages the dissemination and exchange of its information The copyright in this publication is licensed under a Creative Commons Attribution 30 Australia (CC BY) licence Under this licence you are free without having to seek our permission to use this publication in accordance with the licence terms
You must keep intact the copyright notice and attribute the State of Queensland as the source of the publication Note Some content in this publication may have different licence terms as indicated For more information on this licence visit httpcreativecommonsorglicensesby30audeeden The information contained herein is subject to change without notice The Queensland Government shall not be liable for technical or other errors or omissions contained herein The readeruser accepts all risks and responsibility for losses damages costs and other consequences resulting directly or indirectly from using this information
Summary
Australia has warmed by 1degC in the last 100 years and temperatures are predicted to continue warming This will result in reduced winter chill for many apple and pear growing regions of Australia and it is not clear how this will impact on pome fruit production To better understand how climate change will impact flowering in pome fruit trees research was undertaken to evaluate the timing and quality of flowering in cultivars of apple and pear across Australia and how they relate to temperatures received in the orchard Green tip flowering and temperature data was collected in the spring of 2012 2013 2014 and 2015 for cultivars of apple and pear grown in the climatically distinct regions of Applethorpe (Queensland) Shepparton (Victoria) and Manjimup (Western Australia)
For all years of the study Shepparton received the most winter chill with 89 chill portions on average followed by Applethorpe (75 chill portions) and Manjimup (63 chill portions) Low winter chill in Manjimup was associated with greater variation in green tip and full bloom dates between years cultivars and individual trees compared with observations from Applethorpe and Shepparton Additionally trees in Manjimup displayed a long and protracted flowering period compared with the other sites The patterns of flowering observed in Manjimup are possibly the result of inadequate chill Shepparton the site with the most winter chill showed the greatest consistency in green tip and flowering dates
Results from this research support findings from previous studies performed in other parts of the world showing that apples grown in warmer climates exhibit increased variability in flowering Uneven and irregular flowering results in the reduced ability to predict timing of orchard operations more difficult pollination management challenges for thinning and crop load management and can result in increased variability of fruit maturity at harvest
As the climate warms low chill years will become more frequent in milder growing regions of Australia and will likely result in symptoms of inadequate chill in some cultivars Advances in the timing of flowering might be observed in cooler growing regions Australian growers already manage seasonal changes in flowering time and it may be the increasingly protracted and variable flowering that presents the greater management challenge
Options for adaptation to low chill years include planting lower chill cultivars management of delayed and variable flowering with the use of dormancy-breakers and adjustments to chemical and hand thinning practices to reduce variability in fruit size and maturity
Climate change will add significant variability into the pome fruit crop production system This will present challenges for the Australian industry in its ability to consistently supply high quality fruit into export markets and in maintenance of the uniform orchard blocks required to maximise the benefits of mechanisation Ongoing observations of flowering performance and its relationship with chilling will be necessary for making informed predictions about future block and cultivar profitability
Table of contents
Introduction 1
Study objectives 1
Materials and methods 1
Site description 1
Green tip and flowering data collection 3
Calculation of winter chill 5
Results and discussion 5
Winter chill and spring heat 5
Green tip and flowering 7
Green tip and flowering time 7
Variation between cultivars and locations 7
Variation between years 9
Quality of flowering 13
Variation between cultivars and locations 13
Flowering overlap and pollination 15
Flowering and temperature implications of a changing climate 15
Conclusions 17
Key messages 17
Recommendations 18
Industry 18
Scientific research needs 19
Acknowledgements 20
References 20
Table of figures
Figure 1 Site locations across Australia (large blue dot) 2
Figure 2 Mean monthly temperatures for Shepparton Applethorpe and Manjimup 3
Figure 3 Chill accumulation across sites and years Number in brackets is the total chill portions received up to 31 August 5
Figure 4 Green tip (green) and full bloom (pink) dates for apple cultivars in Applethorpe Shepparton and Manjimup Data is the average of observations from 2012 to 2015 with bars indicating the confidence interval 8
Figure 5 Green tip (green) and full bloom (pink) dates for pear cultivars in Applethorpe Shepparton and Manjimup Data is the average of observations from 2012 to 2015 with bars indicating the confidence interval 9
Figure 6 Green tip (green) and full bloom (pink) dates for apple cultivars grown in Applethorpe Shepparton and Manjimup 2013 and 2014 Data points are the average of individual tree observations 11
Figure 7 Chill accumulation in Applethorpe Shepparton and Manjimup 2012 to 2015 Number in brackets is the total chill portions received up to 31 August 12
Figure 8 First flower (orange) and full bloom (pink) dates for apple cultivars in Applethorpe Shepparton and Manjimup Data is the average of observations from 2012 to 2015 Bars indicate the confidence interval 14
Figure 9 First flower (orange) and full bloom (pink) dates for pear cultivars in Applethorpe Shepparton and Manjimup Data is the average of observations from 2012 to 2015 Bars indicate the confidence interval 15
Table of tables
Table 1 Site details 2
Table 2 Description of trees used for phenology observations 4
Flowering in pome fruit trees across Australia Department of Agriculture and Fisheries 2016 1
Introduction
Flowering timing and quality in apple and pear trees is determined by interactions between the genetics of a cultivar and the temperatures it experiences in the orchard throughout the year Cultivars require a certain amount of winter chill and a certain amount of heat for bud dormancy release and flowering and these requirements are largely genetically determined (Cannell 1989 Saure 1985 Samish 1954) Day length is not believed to have a significant role in the timing of flowering in apple (Dennis 2003)
Australia has warmed by 1degC in the last 100 years and temperatures are predicted to continue warming (State of the climate 2016) This will result in reduced winter chill for many apple and pear growing regions of Australia (Darbyshire et al 2013b Hennessy and Clayton-Greene 1995) It is not yet clear what the impact of this will be on the timing and quality of bud dormancy release and flowering in commercial pome fruit cultivars and therefore the potential impacts on productivity Advances in flowering time with increased temperatures has been observed in temperate fruit trees globally (Legave et al 2013) however effects of recent warming in Australia on pome tree flowering are not as clear (Darbyshire et al 2013a)
Changes in timing of flowering may have impacts on yield through the loss of flowering overlap between a cultivar and its pollinisers and potential for increased frost risk (Kaukoranta et al 2010) Variable and protracted patterns of flowering are likely to occur in locations where the warmer climate leads to inadequate chill (Erez 2000) Poor quality of flowering impacts production and profitability through reductions in fruit set difficulties with chemical thinning and greater variability of fruit maturity at harvest (Theron 2013 Oukabli 2003)
Understanding potential impacts of climate change is essential for the timely implementation of appropriate adaptation strategies (Cobon et al 2009) To understand how warming temperatures might impact on flowering it is necessary to first understand the existing flowering behaviour of pome fruit tree cultivars across Australia and how it relates to temperatures received in the orchard
Study objectives
The objective of this research was to evaluate the timing and quality of green tip and flowering in cultivars of apple and pear across Australia and how they relate to temperature to contribute towards understanding of how climate change will impact on pome fruit production
Materials and methods
Site description
Green tip and flowering data was collected in the spring of 2012 2013 2014 and 2015 for cultivars of apple and pear grown in commercial orchards and research facilities situated in Applethorpe (Queensland) Shepparton (Victoria) and Manjimup (Western Australia) (Figure 1 and Table 1)
Flowering in pome fruit trees across Australia Department of Agriculture and Fisheries 2016 2
Figure 1 Site locations across Australia (large blue dot)
Table 1 Site details
State Location Orchard Latitude and Longitude
Cultivars
Qld Applethorpe Department of Agriculture and Fisheries Qld Applethorpe Research Facility
2852 S 15190 E
All apples and pears (except Josephine)
C Pozzebon amp Co Orchard 2863 S 15197 E Josephine pear
Vic Shepparton Silversteinrsquos orchard Shepparton East
3642 S 14546 E All apples and pears
WA Manjimup Department of Agriculture and Food WA Manjimup Horticultural research Institute
3418 S 11607 E All apples
Newton Brothers Orchards
3413 S 11607 E All pears
The three study sites are climatically diverse with Shepparton experiencing the hottest summers and Manjimup the warmest winters Applethorpe has the highest average spring temperatures (Figure 2)
Flowering in pome fruit trees across Australia Department of Agriculture and Fisheries 2016 3
Figure 2 Mean monthly temperatures for Shepparton Applethorpe and Manjimup
Green tip and flowering data collection
Cultivars (including crab apple pollinisers) and rootstocks used for phenology data collection are described in Table 2 All observations were taken on mature productive trees
Flowering in pome fruit trees across Australia Department of Agriculture and Fisheries 2016 4
Table 2 Description of trees used for phenology observations
Study site Tree crop Cultivar Rootstock1 Number of trees (yearly observation)
Net
Applethorpe Apple Braeburn M26 5 Yes
Cripps Pink (Pink Ladytrade) M26 MM106
5 3
Yes
Cripps Red (Sundownertrade) M26 MM106
5 5
Yes
Fuji M26 5 Yes
Galaxy (Gala) M26 5 Yes
Granny Smith M26 MM106
4 5
Yes
Hi Early (Red delicious) M26 5 Yes
Jonathan M26 5 Yes
Kalei M26 MM106
5 5
Yes
Manchurian Crab apple MM102 5 Yes
Pear Josephine D6 5 Yes
Packhamrsquos Triumph D6 5 No
Williamsrsquo Bon Chreacutetien D6 5 No
Wintercole D6 5 No
Shepparton Apple Braeburn MM106 5 Yes
Cripps Pink (Pink Ladytrade) MM106 5 Yes
Cripps Red (Sundownertrade) M26 MM106
5 5
Yes
Galaxy (Gala) MM106 5 Yes
Granny Smith MM106 5 Yes
Manchurian Crab apple MM106 5 Yes
Pear Josephine D6 5 Yes
Packhamrsquos Triumph D6 5 Yes
Williamsrsquo Bon Chreacutetien D6 5 Yes
Manjimup Apple
Braeburn MM109 2 No
Cripps Pink (Pink Ladytrade) MM104 M26
2 2
No
Cripps Red (Sundownertrade) MM104 M26
3 1
No
Galaxy (Gala) MM104 2 No
Granny Smith MM104 2 No
Hi Early (Red delicious) MM104 2 No
Jonathan MM106 2 No
Golden Hornet Crab apple MM104 2 No
Red Fuji (Fuji) MM104 2 No
Pear Josephine D6 5 No
Packhamrsquos Triumph D6 5 No
Williamsrsquo Bon Chreacutetien D6 5 No 1 Rootstock effects were not considered in this analysis as previous studies indicated that rootstocks did not significantly impact the timing of green tip and flowering dates in data collected for this study (Darbyshire 2016) Green tip and flowering data was collected three times per week at the whole tree level For each tree the date of green tip first open flower and full bloom were recorded A tree was defined as being at lsquogreen tiprsquo when 5 of the buds had observable green tips corresponding to the 07 stage in the international BBCH code for pome fruit (Meier et al 1994) A tree was defined as being at lsquofull bloomrsquo when 80 of the flowers were open (BBCH code stage 65)
Flowering in pome fruit trees across Australia Department of Agriculture and Fisheries 2016 5
Assessments of flowering quality were made based on the duration between first open flower and full bloom on the assumption that a protracted period of time between these events was a reflection of variable and uneven flowering This assumption was based on our observations of flowering in Manjimup and Applethorpe
A 95 confidence interval was used to represent variability in data about the mean It indicates that 95 of the data values recorded fall within this particular interval
Ideally green tip and flowering data would have been collected from a number of orchards across each region to fully capture variation within regions caused by microclimate soils differences in tree structure nutrition and so on Time and resources required to collect such data were not available and therefore observations were taken from representative orchards in each region In future more comprehensive data will be collected on orchards through the use of sensing and mapping technologies which will enable more sophisticated and comprehensive analysis of flowering patterns and variability between and within locations
Calculation of winter chill
The Dynamic model (Erez et al 1990 Fishman et al 1987) was used to calculate winter chill from on-site hourly temperature data recorded in the orchard This is the current lsquobest-practicersquo model and has been shown to perform better than other models for calculating winter chill particularly in mild winter climates such as Australia (Darbyshire et al 2013a Luedeling et al 2009)
Note that while chill is commonly referred to as lsquowinter chillrsquo it has been calculated here from the beginning of autumn until the end of winter (1 March to 31 August) The point at which tree buds become sensitive to chilling temperatures remains to be determined
Results and discussion
Winter chill and spring heat
Figure 3 Chill accumulation across sites and years Number in brackets is the total chill portions received up to 31 August
Flowering in pome fruit trees across Australia Department of Agriculture and Fisheries 2016 6
The pattern of winter chill accumulation was different between locations and years (Figure 3) For all years of the study Shepparton was the coolest site followed by Applethorpe and Manjimup Shepparton and Applethorpe received above-average chill portions for the four year period while Manjimup received below-average chill in 2013 and 2014 Historical chill portion averages for the 1981 to 2010 period are Shepparton 78 Applethorpe 70 and Manjimup 64
Lower winter chill tended to be associated with a later start to chill accumulation (that is a warmer autumn) and a more uneven chill accumulation curve For example 2012 2013 and 2014 in Manjimup were distinguished by the irregular accumulation of chill portions caused by climatic conditions where cold autumn and winter temperatures were interspersed with spells of warm weather This resulted in somewhat lsquowobblyrsquo chill accumulation curves
In this study winter chill accumulation was calculated from 1 March to 31 August according to previously published protocols (Darbyshire et al 2016) Questions remain about when to start and stop calculating chill It is not clear that it is meaningful to start calculating chill for late season cultivars before fruit has been harvested and or before leaves have fallen or indeed to stop calculating chill before a cultivar such as lsquoHi Earlyrsquo has reached green tip It seems likely that the period of sensitivity to chill accumulation will vary between cultivars however with current gaps in understanding of the physiological processes involved in the movement through dormancy it is not possible to determine cultivar-specific chilling periods
It is also quite likely that there are differences in the impact of chilling temperatures on the dormancy-breaking process depending on the time of year For example chill received earlier in the winter may be more effective than chill received in late winter Further research is required to fully elucidate these features of dormancy-breaking in pome fruit
Table 3 Average spring temperatures1 for 2012 to 2015 in Applethorpe Shepparton and
Manjimup
Location Year Average monthly temperature
September October November
Applethorpe Long term average2 124 154 177 2012 128 152 192 2013 149 171 185 2014 125 175 218 2015 118 170 202
Shepparton Long term average2 114 142 175 2012 118 139 191 2013 133 141 168 2014 121 160 189 2015 115 186 189
Manjimup Long term average2 119 136 160 2012 129 155 163 2013 126 150 180 2014 136 154 163 2015 132 171 186
1Temperature data sourced from Australian Bureau of Meteorology website 2As determined by the Australian Bureau of Meteorology
Flowering in pome fruit trees across Australia Department of Agriculture and Fisheries 2016 7
According to the long term average Applethorpe has the warmest spring compared with Shepparton and then Manjimup (Table 3) With few exceptions spring temperatures were above-average at all sites throughout the period of the study
Green tip and flowering
Differences in chill accumulation and spring heat between locations and years were accompanied by variability in the timing and pattern of green tip and flowering of apple and pear cultivars Results were analysed to develop a picture of green tip and flowering patterns in Applethorpe Shepparton and Manjimup over the four years of the study
Green tip and flowering time
Variation between cultivars and locations
Green tip and flowering dates were later in Manjimup than in Applethorpe and Shepparton (Figure 4) Across all cultivars the average green tip date was 4 September in Applethorpe 3 September in Shepparton and 25 September in Manjimup while the average full bloom date was 1 October in Applethorpe and Shepparton and 25 October in Manjimup
Variability in green tip and full bloom dates between years and individual trees was greater in Manjimup compared with Applethorpe and Shepparton as reflected by the length of the bars in Figure 4 Variability in green tip and full bloom dates between cultivars was also greater in Manjimup compared with the other sites Average green tip dates for all cultivars were spread across 32 days in Manjimup compared with 15 days in Applethorpe and 5 days in Shepparton Similarly average full bloom dates were spread across 19 days in Manjimup compared with 9 days in Applethorpe and 7 days in Shepparton
Overall Shepparton the site with the greatest winter chill showed the most consistency in green tip and flowering time from year to year while the relatively low chill in Manjimup was associated with the greatest variability Greater consistency has benefits for flowering and pollination management including determination of appropriate polliniser plantings and planning of pollination services It also benefits tactical decision making for orchard operations generally Improvements in the ability of models to predict flowering dates would remove the uncertainty associated with variability making it easier to manage
Flowering in pome fruit trees across Australia Department of Agriculture and Fisheries 2016 8
Figure 4 Green tip (green) and full bloom (pink) dates for apple cultivars in Applethorpe Shepparton and Manjimup Data is the average of observations from 2012 to 2015 with bars indicating the confidence interval
Shepparton
Manjimup
Applethorpe
Flowering in pome fruit trees across Australia Department of Agriculture and Fisheries 2016 9
Differences in Green tip and flowering patterns between locations were less consistent for pear cultivars (Figure 5) In Manjimup full bloom dates for lsquoJosephinersquo lsquoPackhamrsquo and lsquoWilliamsrsquo were later across all years compared with the other sites Shepparton showed the least variability in full bloom dates across years trees and cultivars
Figure 5 Green tip (green) and full bloom (pink) dates for pear cultivars in Applethorpe Shepparton and Manjimup Data is the average of observations from 2012 to 2015 with bars indicating the confidence interval
Variation between years
Variability in the dates of green tip and flowering between individual years was evaluated to determine the degree to which growers are currently managing shifts in flowering timing from season to season at each location
In Applethorpe green tip and flowering were consistently later across all cultivars in 2014 compared with the other years of the study (Figure 6 shows comparison between 2013 and 2014 data for other year comparisons not shown) On average green tip was 9 days later in 2014 compared with 2013 and full bloom was 12 days later (Figure 6)
This consistent shift in timing was associated with an unusual autumn and winter chill accumulation pattern (Figure 7) Total chill accumulated up to 31 August was similar in 2013 and 2014 73 and 75 chill portions respectively However in 2014 there was a warm week in late-May to early-June that resulted in a pause in accumulation of chill which can be seen in the chill curve (Figure 7) Even though the total chill accumulated for 2014 eventually caught up with the other curves by the end of August this plateau appears to have impacted the timing of flowering (although other factors such as the role of heat cannot be ruled out in this study) There was little difference in green tip and flowering dates between the other years
In Shepparton there was little variability in green tip and flowering dates between any of the four years of the study When averaged across cultivars green tip varied by 5 days between 2013 and 2014 and full bloom dates varied by 4 days (Figure 6) Plateaus in the accumulation of chill in late-May early-June of 2013 and 2014 (Figure 7) were not associated with big shifts in flowering time as
Flowering in pome fruit trees across Australia Department of Agriculture and Fisheries 2016 10
was observed for Applethorpe perhaps due to the higher amount of overall chill received in Shepparton
In Manjimup green tip and flowering dates were highly variable between years 2013 was a lower chill year than 2014 with 55 and 59 chill portions received respectively Shifts in green tip and full bloom dates were not consistent between cultivars (Figure 6) For example in 2014 full bloom was 15 days earlier in rsquoGalaxyrsquo and 10 days later in lsquoHi Earlyrsquo compared with full bloom dates for those cultivars in 2013 while the full bloom dates for lsquoGranny Smithrsquo were similar in both years (Figure 6)
Flowering in pome fruit trees across Australia Department of Agriculture and Fisheries 2016 11
Figure 6 Green tip (green) and full bloom (pink) dates for apple cultivars grown in Applethorpe Shepparton and Manjimup 2013 and 2014 Data points are the average of individual tree observations
Shepparton
Manjimup
Applethorpe
Flowering in pome fruit trees across Australia Department of Agriculture and Fisheries 2016 12
Figure 7 Chill accumulation in Applethorpe Shepparton and Manjimup 2012 to 2015 Number in brackets is the total chill portions received up to 31 August
Shepparton
Manjimup
Applethorpe
Flowering in pome fruit trees across Australia Department of Agriculture and Fisheries 2016 13
Quality of flowering
Variation between cultivars and locations
The duration between the first flower opening and full bloom was more than twice as long in Manjimup (21 days) as it was in Applethorpe (9 days) and Shepparton (10 days) when averaged across cultivars and years (Figure 8) The protracted pattern of flowering was consistently observed in Manjimup over the period of the study and was largely the result of irregular and uneven bud movement within individual tree canopies (data not shown)
A prolonged and irregular period of flowering can be difficult to manage for a number of reasons Determining an appropriate chemical thinning program is challenging when buds are at multiple stages of green tip and flowering on each tree within the block at any given time (Theron 2013) Fruitlets are likely to vary greatly in size and development stage and therefore careful attention is required at the time of hand thinning to ensure that fruitlets are thinned in a manner that optimises crop uniformity and reduces the spread of fruit maturity at harvest (Theron 2013 Erez 2000)
Flowering in pome fruit trees across Australia Department of Agriculture and Fisheries 2016 14
Figure 8 First flower (orange) and full bloom (pink) dates for apple cultivars in Applethorpe Shepparton and Manjimup Data is the average of observations from 2012 to 2015 Bars indicate the confidence interval
Shepparton
Manjimup
Applethorpe
Flowering in pome fruit trees across Australia Department of Agriculture and Fisheries 2016 15
In cultivars of pear the duration of the period between the first flower opening and full bloom was the greatest in Manjimup (Figure 9) as was observed in apple However the patterns of flowering were less consistent within and between locations
Figure 9 First flower (orange) and full bloom (pink) dates for pear cultivars in Applethorpe Shepparton and Manjimup Data is the average of observations from 2012 to 2015 Bars indicate the confidence interval
Flowering overlap and pollination
Overlap of flowering between a cultivar and its pollinisers is essential for good fruit set (Ramirez and Davenport 2013) Changes in the timing of flowering between seasons or across years that result in the loss of flowering synchronisation can therefore result in reduced yields Large shifts in flowering dates like those observed between cultivars and years in Manjimup (Figure 8) increase the risk of poor flowering overlap in any particular season and make it more difficult to select appropriate pollinisers Use of floral bouquets or artificial pollination methods can compensate for loss in flowering overlap however these methods require significant additional labour (Dennis 2003)
The chances of achieving good flowering overlap each season are greatly increased by planting multiple polliniser cultivars with early middle and late flowering habits to ensure a good supply of pollen throughout the flowering period of the commercial cultivar and to reduce frost risk (Delaplane and Mayer 2000 Dennis 2003) Cultivars that flower profusely over an extended period of time generally make good pollinisers (Jackson 2003)
Shifts in flowering timing do not affect fruit set if similar shifts occur in both the cultivar and its pollinisers This was observed in Applethorpe in 2014 when flowering in all cultivars was consistently delayed compared with flowering in 2013
Flowering and temperature implications of a changing climate
Apple trees in Manjimup exhibited greater variability in green tip and flowering dates and a more protracted flowering period compared with trees in Applethorpe and Shepparton Delayed and uneven flowering are symptoms of inadequate chill and it seems likely that the observed patterns of
Flowering in pome fruit trees across Australia Department of Agriculture and Fisheries 2016 16
flowering in Manjimup were a response to mild autumn and winter conditions received throughout the period of this study This finding is supported by numerous studies in the literature describing irregular flowering in apples grown in warm low chill climates (Oukabli 2003 Saure 1985 Theron 2013 Erez 2000) Abnormalities in the late stages of apple flower bud development have also been reported in low chill regions (Oukabli 2003) however flower viability was not assessed in our study
The timing of flowering varied from year to year within each location with the greatest differences observed in Manjimup This variability was caused largely by differences in temperatures from season to season and Australian growers have always had to manage these seasonal shifts in the timing of dormancy-break The relative importance of cold and warm temperatures in determining the timing of flowering is likely to vary between locations and years For example in cold growing regions where plenty of winter chill is received and chilling requirements are well satisfied by the middle of winter dormancy-break will be promoted by warm temperatures in late winter and early spring (Saure 1985) In this case from around mid-winter onwards the trees are sitting in a phase of dormancy known as lsquoeco-dormancyrsquo that is the buds are ready to burst when the environmental conditions are right for growth
This response to heat is evident in cold pome fruit growing regions of the Northern Hemisphere where clear advances in flowering dates have been observed with warmer spring temperatures caused by the changing climate (Legave et al 2013)
In warmer growing locations and years the timing of dormancy-break and flowering are likely to be determined primarily by the accumulation of enough chill (Saure 1985) That is dormancy tends to be prolonged and there is little or no eco-dormancy period buds burst as soon as they have received enough chill (Theron 2013) It is likely that pome trees growing in the warmer regions of Manjimup and Applethorpe in some years do not experience any significant eco-dormancy
As the climate warms most growing regions of Australia will receive less winter chill (Darbyshire et al 2013b) The impacts that this will have on flowering over the next 10 to 20 years will vary between different parts of the country
Cooler regions such as those in Tasmania and NSW with plenty of chilling may experience advances in the timing of flowering as spring temperatures increase As chill accumulation falls below the chilling requirements of cultivars in warmer growing regions of Australia they will likely see increasing variability in green tip and flowering dates from season to season and between cultivars Delayed uneven and protracted flowering will occur in the medium to higher chill cultivars as was observed in Manjimup during this study Low chill years will be experienced more often as the climate warms
Irregular and protracted flowering presents a significant management challenge for growers Options for orchard adaptation to warming autumns and winters include the planting of lower chill cultivars management of delayed and variable flowering with the use of dormancy-breakers and adjustments to chemical and hand thinning practices to reduce variability in fruit size and maturity
It should be noted that while exposure to enough chill is essential for quality flowering in pome fruit (defined here as the uniform blossoming of viable flowers) once chilling requirements have been met the quality of flowering can be further influenced by other factors such as heat nutritional status and water stress These factors were not considered here
While this study looked at temperature and the timing and quality of flowering climate change will have other impacts on flowering and pollination Warming temperatures will potentially impact on floral initiation bee activity and fruit set (Dennis 2003 Atkinson et al 2001 Ramirez and Davenport 2013) In addition this study did not collect data on leaf area development during the green tip and full bloom period Weak leaf development is a symptom of delayed foliation (Saure 1985) caused by inadequate winter chill and reduced leaf area in the weeks after full bloom has been shown to have negative impacts on fruit set and development (Proctor and Palmer 1991 Lauri et al 1996) Further research is required to fully determine the nature of these impacts on the Australian pome fruit industry
Flowering in pome fruit trees across Australia Department of Agriculture and Fisheries 2016 17
The discussion and conclusions from this study were based primarily on the results from observations in apples While results from the pear data were generally consistent with that observed in apples further research would improve the understanding of flowering in this crop Since the vast majority of pears are grown in Victoria (89) (Australian Bureau of Statistics) there was less opportunity to collect extensive datasets from diverse climatic regions
Conclusions
Results from this research support findings from previous studies performed in other parts of the world showing that apples grown in warmer climates exhibit increased variability in flowering within the canopy between individual trees and between varieties and years (Erez 2000 Theron 2013 Cook and Jacobs 2000) Increased variability in flowering results in the reduced ability to predict timing of orchard operations more difficult pollination management challenges for thinning and crop load management and can result in increased variability of fruit maturity at harvest
The Australian apple and pear industry is aiming to increase global competitiveness in an effort to help secure new export markets Success in the global market requires consistent supply of high quality fruit from season to season at competitive prices Additional variability in the crop production system from a warming climate will challenge the Australian industryrsquos ability to achieve the desired export goals on two fronts consistency of supply and in the maintenance of uniform orchard blocks that are a prerequisite for efficient use of labour-saving technologies
Variability caused by inadequate chilling can be managed with the use of additional input of products and labour however grower capacity to respond to these challenges will vary depending on individual social and financial factors An important assessment for growers to make of their orchard businesses will be lsquoat what point will the increased cost of inputs and effort required to produce a consistently high quality crop make a block of trees unprofitablersquo Ongoing orchard observations of flowering performance and relationships with winter chill will be necessary for making meaningful predictions about future block and cultivar profitability
Key messages
- Low winter chill as observed in Manjimup was associated with an uneven (or lsquounevenrsquo) chill accumulation curve caused by short periods of warm weather throughout the autumn and winter seasons
- Green tip and full bloom dates were more variable between years cultivars and individual trees in Manjimup and trees consistently displayed a long and protracted flowering compared with Applethorpe and Shepparton
- Shepparton the site with the most winter chill showed the greatest consistency in green tip and flowering dates from year to year
- The patterns of flowering observed in Manjimup are likely the result of inadequate chill Low winter chill at this site was associated with
High variability in flowering dates between seasons cultivars and individual trees of the same cultivar
Irregular and protracted flowering across most cultivars of apple
- Large shifts in flowering dates between cultivars and seasons increases the risk of poor flowering overlap in any particular year and makes it more difficult to select appropriate pollinisers Greater predictability in the timing of green tip and full bloom has benefits for flowering and pollination management and for planning of orchard operations generally
- Irregular and protracted flowering can be difficult to manage for a number of reasons
Flowering in pome fruit trees across Australia Department of Agriculture and Fisheries 2016 18
Determining an appropriate chemical thinning program is challenging when buds are at multiple stages of green tip and flowering on individual trees
Fruitlets will vary more in size and developmental stage and careful hand thinning is required to optimise crop uniformity
Greater spread of fruit maturity at harvest requires greater effort to pick fruit at the appropriate stage of maturity
- As the climate warms low chill years will become more frequent in milder growing regions of Australia and will likely result in symptoms of inadequate chill in some cultivars Advances in the timing of flowering might be observed in cooler growing regions
- Australian growers already manage seasonal changes in flowering time and it may be the increased irregularity of flowering that presents the greater management challenge
- Options for adaptation to low chill years include planting lower chill cultivars management of delayed and variable flowering with the use of dormancy-breakers and adjustments to chemical and hand thinning practices to reduce variability in fruit size and maturity
- Risks to pollination from shifting flowering times can be reduced through planting multiple polliniser cultivars with early middle and late flowering habits to ensure a good supply of pollen throughout the flowering period Use of floral bouquets or artificial pollination methods can compensate for loss in flowering overlap
- Climate change will add significant variability into the pome fruit crop production system This will present challenges for the Australian industry in the consistency of supply and in maintenance of the uniform orchard blocks that are a prerequisite for the efficient use of mechanisation
- An important assessment for growers to make of their orchard businesses will be lsquoat what point will the increased cost of inputs and effort required to produce a consistently high quality crop make a block of trees unprofitablersquo Ongoing observations of flowering performance and its relationship with chilling will be necessary for making informed predictions about future block and cultivar profitability
Recommendations
Industry
- Warmer temperatures will mean less winter chill for most growing regions of Australia Successful adaptation by the apple and pear industry will require
Comprehensive in-orchard monitoring of flowering dates across cultivars to provide early indication of cultivars that might be impacted by warmer winters in the future changing climate as well as identification of subtle shifts in the timing of flowering between cultivars and their pollinisers
Information about chilling requirements of new and existing cultivars so that growers can make cultivar choices appropriate to their particular growing environment
Consideration of chilling requirements in apple and pear breeding programs when selecting potential new cultivars for development and release Selecting for lower chill cultivars
Good understanding of the efficacy of dormancy-breaking sprays
- Growers in warmer growing regions of Australia would benefit from preparing a strategy for managing low chill years Monitoring of winter chill accumulation and use of dormancy-
Flowering in pome fruit trees across Australia Department of Agriculture and Fisheries 2016 19
breakers in low chill years is a logical inclusion Changes to chemical and hand thinning practices may also form part of the strategy
- Where shifting full bloom dates are likely to be a problem consideration should be given to planting more than one polliniser cultivar to improve the chances of flowering overlap every year
- Models of flowering time have significantly improved in recent times with the development of the lsquoChill-overlap modelrsquo (Darbyshire et al 2016 White 2016) The use of these models will improve the ability to predict changes in the timing of flowering in cultivars of apple under future climates
- Climate analogues (Parkes and White 2016) should be used by the industry to broadly identify climate change impacts on apple and pear production systems and possible options for adaptation Growers in Manjimup are already successfully managing the impacts of inadequate chill in some years lessons can be learnt from their knowledge and experience
- In future more comprehensive data should be collected on orchards through the use of sensing and mapping technologies This data should be used to undertake more sophisticated and comprehensive analysis of flowering patterns and variability between and within locations
- Further research in Australian pears is needed to improve the understanding of flowering in cultivars of this tree crop and the likely impacts of changing climate
- In blocks where flowering is becoming increasingly irregular an important assessment for growers to make of their orchard businesses will be to determine at what point the increased cost of inputs and effort required to produce a consistently high quality crop make a block of trees unprofitable Ongoing observations of flowering performance and its relationship with chilling will be necessary for making informed predictions about future block and cultivar profitability
Scientific research needs
- Better understanding of apple and pear chilling requirements is necessary for making appropriate cultivar selections for particular growing climates This will require
Research into the genetic basis of progression through the phases of dormancy
Determination of the point when buds enter into true dormancy and become sensitive to chilling temperatures and when buds exit true dormancy prior to bud burst Genetic andor physiological markers of these phase shifts are needed
Improved chill model performance through cultivar specific parameterisation of the dynamic model
Understanding of the effectiveness of early versus late season chill in dormancy breaking
- Development of chill-overlap models for flowering time of pome fruit cultivars other than lsquoCripps Pinkrsquo This will improve the predictability of climate change impacts on flowering timing
- Determine the potential effects of warming temperatures on leaf area development floral initiation flower viability fruit set and bee activity as these are likely to have significant impacts for productivity in apple and pear
Flowering in pome fruit trees across Australia Department of Agriculture and Fisheries 2016 20
Acknowledgements
The authors would like to extend a very big thank you to the growers who kindly provided orchard blocks for research observations Celeste from C Pozzebon amp Co Ann and Mauri Lyster Newton Brothers Orchards Maurice Silverstein and Geoffrey Thompson
Thank you to Susie Murphy White Lisa Starkie and Martine Combret from Western Australia Lexie McClymont Susanna Turpin and Wendy Sessions from Victoria and Osi Tabing Peter Nimmo and Allan McWaters from Queensland for the collection of orchard phenology and temperature data And finally thank you to Rebecca Darbyshire Ian Goodwin Jenny Treeby and Penny Measham as well as all of the aforementioned names for the many discussions around the interpretation of the results that were had formally and informally throughout the four years of the project
References
Atkinson C J Taylor L and Kingswell G (2001) The importance of temperature differences directly after anthesis in determining growth and cellular development of Malus fruits Journal of Horticultural Science and Biotechnology 76(6)
Cannell M G R (1989) Chilling thermal time and date of flowering of trees in Wright C J ed Manipulation of Fruiting London Butterworths 99 - 113
Cobon D H Stone G S Carter J O Scanlan J C Toombs N R Zhang X Willcocks J and McKeon G M (2009) The climate change risk management matrix for the grazing industry of northern Australia Rangeland Journal 31(1)
Cook N C and Jacobs G (2000) Progression of apple ( Malus domestica Borkh) bud dormancy in two mild winter climates Journal of Horticultural Science and Biotechnology 75(2)
Darbyshire R (2016) Crossing the threshold adaptation tipping points for Australian fruit trees University of Melbourne
Darbyshire R Pope K and Goodwin I (2016) An evaluation of the chill overlap model to predict flowering time in apple tree Scientia Horticulturae 198 142-149
Darbyshire R Webb L Goodwin I and Barlow E W R (2013a) Evaluation of recent trends in Australian pome fruit spring phenology International Journal of Biometeorology 57(3)
Darbyshire R Webb L Goodwin I and Barlow E W R (2013b) Impact of future warming on winter chilling in Australia International Journal of Biometeorology 57(3) 355-366
Delaplane K S and Mayer D F (2000) Crop Pollination by Bees New York CABI
Dennis F G Jr (2003) Flowering pollination and fruit set and development in Ferree D C and Warrington I J eds Apples botany production and uses Cambridge CAB International 153 - 166
Erez A (2000) Bud dormancy phenomenon problems and solutions in the tropics and subtropics in Erez A ed Temperate Fruit Crops in Warm Climates Kluwer Academic Publishers 17 - 47
Erez A Fishman S Linsley-Noakes G C and Allan P (1990) The dynamic model for rest completion in peach buds Acta Horticulturae 276 165-174
Fishman S Erez A and Couvillon G A (1987) The temperature dependence of dormancy breaking in plants mathematical analysis of a two-step model involving a cooperative transition Journal of Theoretical Biology 124 473 - 483
Hennessy K J and Clayton-Greene K (1995) Greenhouse warming and vernalisation of high-chill fruit in southern Australia Climatic Change 30(3)
Flowering in pome fruit trees across Australia Department of Agriculture and Fisheries 2016 21
Jackson J E (2003) Biology of Apples and Pears Cambridge Cambridge University Press
Lauri P Eacute Teacuterouanne Eacute and Lespinasse J M (1996) Quantitative analysis of relationships between inflorescence size bearing-axis size and fruit-set - An apple tree case study Annals of Botany 77(3) 277-286
Legave J M Blanke M Christen D Giovannini D Mathieu V and Oger R (2013) A comprehensive overview of the spatial and temporal variability of apple bud dormancy release and blooming phenology in Western Europe International Journal of Biometeorology 57(2)
Luedeling E Zhang M H Luedeling V and Girvetz E H (2009) Sensitivity of winter chill models for fruit and nut trees to climatic changes expected in Californias Central Valley Agriculture Ecosystems amp Environment 133(12)
Meier U Graf H Hess M Kennel W Klose R Mappes D Seipp D Stauss R Streif J and van den Boom T (1994) Phaumlnologische Entwick-lungsstadien des Kernobstes (Malus domestica Borkh und Pyrus communis L) des Steinobstes (Prunus-Arten) der Johannisbeere (Ribes-Arten) und der Erdbeere (Fragaria x ananassa Duch) Nachrichtenbl Deut Pflanzenschutzd 46 141 - 153
Oukabli A Bartolini S and Viti R (2003) Anatomical and morphological study of apple (Malus x domestica Borkh) flower buds growing under inadequate winter chilling Journal of Horticultural Science and Biotechnology 78(4) 580-585
Parkes H A and White N (2016) Climate change impacts on flowering in Australian pome fruit trees A climate analogue approach Queensland Department of Agriculture and Fisheries
Proctor J T A and Palmer J W (1991) The role of spur and bourse leaves of three apple cultivars on fruit set and growth and calcium content HortScience 26(6) 789
Ramirez F and Davenport T L (2013) Apple pollination a review Scientia Horticulturae 162
Samish R M (1954) Dormancy in woody plants Annual Review of Plant Physiology 5 183-204
Saure M C (1985) Dormancy release in deciduous fruit trees Horticultural Reviews 7 239-300
State of the climate (2016) Australian Bureau of Meteorology amp CSIRO
Theron K (2013) Chemical thinning of apple South African perspective Acta Horticulturae 998 85 - 90
White N (2016) Approaches for modelling flowering timing in apple trees grown in mild winter climates Department of Agriculture and Fisheries Department of Agriculture and Fisheries
A climate analogue approach to understanding climate change impacts on flowering in Australian pome fruit trees
Heidi Parkes1 Neil White1 and Susie Murphy White2
November 2016
1Department of Agriculture and Fisheries Queensland 2Pomewest Western Australia
This research was presented at Greenhouse 2015 Wrest Point Conference Centre Hobart 27-30 October
This publication has been compiled by Heidi Parkes and Neil White of Horticulture and Forestry Science Department of Agriculture and Fisheries copy State of Queensland 2016 The Queensland Government supports and encourages the dissemination and exchange of its information The copyright in this publication is licensed under a Creative Commons Attribution 30 Australia (CC BY) licence Under this licence you are free without having to seek our permission to use this publication in accordance with the licence terms
You must keep intact the copyright notice and attribute the State of Queensland as the source of the publication Note Some content in this publication may have different licence terms as indicated For more information on this licence visit httpcreativecommonsorglicensesby30audeeden The information contained herein is subject to change without notice The Queensland Government shall not be liable for technical or other errors or omissions contained herein The readeruser accepts all risks and responsibility for losses damages costs and other consequences resulting directly or indirectly from using this information
Climate change impacts on flowering in pome fruit trees a climate analogue approach 2016 1
Summary
Future changes in climate are predicted to result in reduced winter chill in apple and pear growing regions of Australia Potential impacts on the pome fruit industry due to effects of reduced chill on bud dormancy release and flowering of fruit trees in these regions are not yet clear Inadequate winter chill can result in variable and protracted flowering potentially leading to impacts on fruit set and marketable yield at harvest Climate analogues are one option for investigation of potential climate change impacts on agricultural production and appropriate adaptation strategies This study investigated the potential for using the climate analogue concept together with collected datasets to predict impacts of climate change on pome fruit flowering in Australia and to identify possible methods for adaptation
The temperate tree fruit growing regions of Manjimup (WA) and Stanthorpe (QLD) were used as a case study to test this strategy Based on mean autumn and winter temperatures alone Manjimup was considered to be an appropriate climate analogue for Stanthorpe in 2030 Flowering datasets from commercial apple and pear cultivars were collected at each site in 2013 and 2014 Whole tree field assessments were made of 5 green tip first open flower and progression of flowering to full bloom using standardised methods across sites The data show an uneven and protracted pattern of flowering in Manjimup compared with Stanthorpe Average green tip dates for all cultivars were spread across 32 days in Manjimup compared with 15 days in Stanthorpe Similarly average full bloom dates were spread across 19 days in Manjimup and 9 days in Stanthorpe The duration between the first flower opening and full bloom in Manjimup was more than twice as long as in Stanthorpe (an average of 25 days compared with 10 days) when averaged across years and cultivars There were no clear differences in yield between the locations Comparison of grower orchard management practices indicated that 50 of Manjimup growers use dormancy-breaking sprays compared with zero in Stanthorpe
Results from the climate analogue approach suggested that a more variable and protracted pattern of flowering is likely to exist across many apple cultivars in Stanthorpe in 2030 The more variable flowering will not necessarily have significant impacts on productivity of apple orchards in that timeframe and Stanthorpe growers are likely to be able to manage low chill years with the use of dormancy-breaking sprays At this stage there is no apparent need to shift to lower chill cultivars (or crops) as Manjimup growers are achieving high levels of productivity with the same variety mix as is currently grown in Stanthorpe
The climate analogue approach is a valuable tool for providing broad information around potential impacts and adaptation strategies for Australian temperate tree crops and horticulture more generally There are a number of important details to consider when applying this methodology and these are outlined in this report
Climate change impacts on flowering in pome fruit trees a climate analogue approach 2016 2
Table of contents
Introduction 4
Study objectives 4
Methodology 4
Identification of an appropriate climate analogue location 5
Industry comparison 5
Comparison of flowering 5
Comparison of productivity and orchard management practice 6
Results and discussion 7
Identification of an appropriate climate analogue location for Stanthorpe 2030 7
The apple and pear industries in Manjimup and Stanthorpe 8
Apple and pear tree flowering in Manjimup and Stanthorpe 9
Apple and pear productivity in Manjimup and Stanthorpe 12
Orchard management practices in Manjimup and Stanthorpe 13
Conclusions 14
Key messages 15
Recommendations 15
Acknowledgments 16
References 16
Table of figures
Figure 1 Map of Australia showing the locations of Stanthorpe and Manjimup Manjimup was identified as an appropriate climate analogue for Stanthorpe in 2030 7
Figure 2 Box plot showing winter chill projections from four climate models for Stanthorpe in 2030 compared with current winter chill in Manjimup Orange red and blue dots show winter chill data calculated from hourly temperature data collected on-site from 2012 2013 and 2014 respectively Historical boxplot data is for the period from 1986 to 2005 8
Figure 3 Green tip first flower and full bloom dates for cultivars of apple and pear in Manjimup and Stanthorpe in 2013 and 2014 Dates are given as the lsquoday of yearrsquo day 260 is 17 September and day 300 is 27 October Data points are the average of individual tree observations CP is the total chill portions calculated up to 31 Aug 9
Figure 4 Duration of the flowering period from first flower to full bloom in cultivars of apple and pear grown in Manjimup and Stanthorpe in 2013 and 2014 Results are the average of individual tree observations 10
Figure 5 Overlap of flowering periods from first open flower to full bloom in cultivars of apple and pear in Manjimup and Stanthorpe Dates are given as the lsquoday of yearrsquo day 260 is 17 September and day 300 is 27 October Data points are the average of individual tree observations for 2013 and 2014 11
Figure 6 Uneven flowering in lsquoCripps Pinkrsquo Lysterrsquos Orchard Manjimup 2014 11
Climate change impacts on flowering in pome fruit trees a climate analogue approach 2016 3
Figure 7 Results from a survey of Manjimup growers on lsquoCripps Pinkrsquo yields and quality in 2014 The survey was undertaken at a grower roadshow event using digital audience response technology 1 October 2014 13
Table of tables
Table 1 Description of sites used for flowering data observations 5 Table 2 Description of trees used for flowering observations 6 Table 3 Characteristics1 of the apple industries in Manjimup and Stanthorpe 8
Climate change impacts on flowering in pome fruit trees a climate analogue approach 2016 4
Introduction
Future changes in climate are predicted to result in reduced winter chill in apple and pear growing regions of Australia (Darbyshire et al 2013b Hennessy and Clayton-Greene 1995) Potential impacts on the pome fruit industry in these regions are not yet clear Inadequate winter chill results in variable and protracted flowering potentially leading to impacts on fruit set and marketable yield at harvest (Theron 2013 Erez 2000 Saure 1985) Climate analogue analysis involves a detailed comparison between locations where the current climate of one location is similar to the projected future climate of the location of interest (Nyairo et al 2014) This is one option for investigation of potential climate change impacts on agricultural production and identification of appropriate adaptation strategies
Relationships between temperature and flowering in apple and pear trees are complex and poorly understood making it difficult to determine future impacts of warming climate on flowering in these crops A number of benefits of applying a climate analogue approach have been identified (Nyairo et al 2014 Veloz et al 2012) and suggest that it may be a useful approach in the investigation of this question Some of the benefits are
Ability to analyse climate change impacts without the need for understanding of complex physiological processes underlying flowering
Ability to analyse options and capacity for adaptation The question can be asked how do growers in region X respond to a climate that is similar to ours in the future Impacts and adaptation can be investigated simultaneously
Impacts of climate change on flowering are analysed within the production system as a whole
Provision of tangible practical information for growers to work with and allows for growers at the test location to learn from growers at the analogue location
Analogue location can be used as a research site for possible adaptation strategies Improved communication of climate change impacts and options for adaptation to growers
Although the concept has been around for some time most studies have focussed broadly on whole farming systems (Nyairo et al 2014) rather than investigating climate change impacts on a single cropping system or on one physiological aspect of a crop such as flowering
Study objectives
The aim of this project was to investigate potential for using a climate analogue approach together with collected data sets to predict impacts of climate change on pome fruit flowering and to identify possible methods for adaptation
Methodology
To test the potential of the climate analogue approach a case study was undertaken in Stanthorpe Queensland The following questions were posed
1 How will flowering of apple and pear trees be impacted by reduced winter chill in Stanthorpe in 2030
2 Will there be an impact on productivity 3 What can growers do to adapt 4 Is the climate analogue approach appropriate in this context and can it be applied more
broadly 5 Are there factors that should be considered when using climate analogues for informing
climate change adaptation in horticulture
There were four parts to the investigation the identification of an appropriate climate analogue location for Stanthorpe in 2030 comparison of the apple and pear industries in each location to
Climate change impacts on flowering in pome fruit trees a climate analogue approach 2016 5
ensure a meaningful comparison analysis and comparison of flowering behaviour and productivity in each location and comparison of relevant orchard management practices to investigate possible climate change adaptations
Identification of an appropriate climate analogue location
The lsquoanalogues explorerrsquo tool from the Climate change in Australia website1 was used to identify a broad pool of possible climate analogue locations for Stanthorpe in 2030
Winter chill projections for Stanthorpe in 2030 were constructed from four Global Climate Models selected from the list of models generated by the Climate Futures Tool at the Climate Change in Australia website1 for a Representative Concentration Pathway (RCP) of 45 The RCP45 emissions scenario assumes that lower greenhouse gas emissions are achieved in future due to some mitigation efforts It is a minimum to medium case climate change scenario
Historical temperature data from 1986 to 2005 for Manjimup and Stanthorpe was obtained from the SILO climate database2 Point data for the years 2012 2013 and 2014 was obtained from the weather station at Manjimup Horticultural Research Institute (Manjimup) and an on-site temperature logger in the orchard at Applethorpe Research Facility (Stanthorpe)
The Dynamic model (Erez et al 1990 Fishman et al 1987)) was used to calculate winter chill from hourly temperature data recorded in the orchard from the beginning of autumn until the end of winter (1 Mar to 31 Aug) This is the current lsquobest-practicersquo model and has been shown to perform better than other models for calculating winter chill particularly in mild winter climates such as Australia (Darbyshire et al 2013a Luedeling et al 2009)
Industry comparison
Comparison of the apple and pear industries in Manjimup and Stanthorpe was made based on information sourced from the Australian Bureau of Statistics a Shire Council report (Tancred and McGrath 2013) and personal communication with growers and local industry representatives
Comparison of flowering
The flowering datasets were from orchards in Manjimup and Stanthorpe (Table 1) collected in spring 2013 and 2014 from cultivars of apple and pear as part of the project AP12029 Understanding apple and pear production systems in a changing climate (Table 2)
Table 1 Description of sites used for flowering data observations State Location Orchard Latitude and
Longitude Cultivars
Qld Stanthorpe Department of Agriculture and Fisheries Qld Applethorpe Research Facility
2852 S 15190 E
All apples and pears
WA Manjimup Department of Agriculture and Food WA Manjimup Horticultural research Institute
3418 S 11607 E All apples
Newton Brothers Orchards
3413 S 11607 E All pears
1 httpwwwclimatechangeinaustraliagovauenclimate-projectionsclimate-analoguesanalogues-explorer 2 httpswwwlongpaddockqldgovausilo
Climate change impacts on flowering in pome fruit trees a climate analogue approach 2016 6
Table 2 Description of trees used for flowering observations Study site Tree
crop Cultivar Rootstock1 Number of trees
(for yearly observation) Net
Stanthorpe Apple Braeburn M26 5 Yes
Cripps Pink (Pink Ladytrade)
M26 MM106
5 3
Yes
Cripps Red (Sundownertrade)
M26 MM106
5 5
Yes
Fuji M26 5 Yes
Galaxy (Gala)
M26 5 Yes
Granny Smith M26 MM106
4 5
Yes
Hi Early (red delicious)
M26 5 Yes
Pear Packhamrsquos Triumph
D6 5 No
Williamsrsquo Bon Chreacutetien
D6 5 No
Manjimup Apple
Braeburn MM109 2 No
Cripps Pink (Pink Ladytrade)
MM104 M26
2 2
No
Cripps Red (Sundownertrade)
MM104 M26
3 1
No
Galaxy (Gala)
MM104 2 No
Granny Smith MM104 2 No
Hi Early (red delicious)
MM104 2 No
Red Fuji (Fuji)
MM104 2 No
Pear Packhamrsquos Triumph
D6 5 No
Williamsrsquo Bon Chreacutetien
D6 5 No
1Rootstock effects were not considered in this analysis as previous studies indicated that rootstocks did not significantly impact the timing of green tip and flowering dates in data collected for this study (Darbyshire 2016)
Green tip and flowering data was collected three times per week at the whole tree level For each tree the date of green tip first open flower and full bloom were recorded A tree was defined as being at lsquogreen tiprsquo when 5 of the buds had observable green tips corresponding to the 07 stage in the international BBCH code for pome fruit (Meier et al 1994) A tree was defined as being at lsquofull bloomrsquo when 80 of the flowers were open similar to the 65 stage in the international BBCH code for pome fruit (Meier et al 1994)
Comparison of productivity and orchard management practice
Broad yield data and information on orchard management practices was obtained from the Australian Bureau of Statistics personal communication with growers and local industry representatives and from a grower survey performed using digital audience response technology at the AP12029 project
Climate change impacts on flowering in pome fruit trees a climate analogue approach 2016 7
roadshow event held in Manjimup on 1 October 2014 Detailed yield and orchard practice data was not collected as part of this study
Results and discussion
Identification of an appropriate climate analogue location for Stanthorpe 2030
The Analogues Explorer tool was used to identify a broad pool of possible climate analogue locations for Stanthorpe in 2030 When climates were matched for annual temperature and rainfall twelve analogue locations were listed including Bega Manjimup Mount Barker Young and Albury-Wodonga
To ensure that the climate analogue selected could be used to specifically investigate the impacts of reduced chilling on flowering the Analogues Explorer tool was set-up to identify analogues matched on autumn and winter temperatures only Spring and summer temperatures were removed from the assessment along with rainfall A slightly different set of climate analogues was listed including Nuriootpa Horsham Naracoorte Manjimup Mount Barker and Sale From this list Manjimup one of Australiarsquos main apple and pear growing regions was selected as the climate analogue location for Stanthorpe in 2030 (Figure 1)
Figure 1 Map of Australia showing the locations of Stanthorpe and Manjimup Manjimup was identified as an appropriate climate analogue for Stanthorpe in 2030
It is worth noting that when the seasons are considered separately Manjimup is a reasonable analogue for 2030 in Stanthorpe for summer autumn and winter but not for the spring This is because in the current climate Stanthorpe has a warmer spring than Manjimup
Projections of winter chill using global climate models were undertaken to evaluate how well winter chill in Manjimup is likely to match chill received under a 2030 climate in Stanthorpe (Figure 2) The historical chill portion data for the period 1986 to 2005 in Manjimup is similar to the chill data for Stanthorpe over this same period (Figure 2) However 2012 2013 and 2014 were low chill years in Manjimup If the chill portion data for these years is considered separately it falls neatly within the range of the projected winter chill results for Stanthorpe in 2030 (Figure 2) Therefore Manjimup in the years 2012 to 2014 was considered to be a good climate analogue for assessing the impacts of reduced winter chill on flowering in Stanthorpe in 2030
Climate change impacts on flowering in pome fruit trees a climate analogue approach 2016 8
Figure 2 Box plot showing winter chill projections from four climate models for Stanthorpe in 2030 compared with current winter chill in Manjimup Orange red and blue dots show winter chill data calculated from hourly temperature data collected on-site from 2012 2013 and 2014 respectively Historical boxplot data is for the period from 1986 to 2005
The apple and pear industries in Manjimup and Stanthorpe
The apple and pear industries in Manjimup and Stanthorpe are comparable on most industry characteristics including gross value orchard size variety mix rootstocks and planting systems (Table 3) One significant difference is in the use of orchard netting Stanthorpe apples are grown almost entirely under hail netting while most of the apple orchards in the Manjimup district are un-netted (although this is changing rapidly)
Table 3 Characteristics1 of the apple industries in Manjimup and Stanthorpe Industry characteristic Manjimup Stanthorpe
1Gross value is the average from the 2002-2003 to 2012-2013 seasons
Climate change impacts on flowering in pome fruit trees a climate analogue approach 2016 9
Apple and pear tree flowering in Manjimup and Stanthorpe
In 2013 and 2014 Stanthorpe received 72 and 74 chill portions respectively while Manjimup received 54 chill portions in both years (well below its long-term average) (Figure 3) The low winter chill in Manjimup was associated with a greater spread of green tip and full bloom dates in both years (Figure 3) Average green tip dates for all cultivars were spread across 32 days in Manjimup compared with 15 days in Stanthorpe Similarly average full bloom dates were spread across 19 days in Manjimup compared with 9 days in Stanthorpe
Figure 3 Green tip first flower and full bloom dates for cultivars of apple and pear in Manjimup and Stanthorpe in 2013 and 2014 Dates are given as the lsquoday of yearrsquo day 260 is 17 September and day 300 is 27 October Data points are the average of individual tree observations CP is the total chill portions calculated up to 31 Aug
The duration between the first flower opening and full bloom in Manjimup was more than twice as long as in Stanthorpe (an average of 25 days compared with 10 days) when averaged across years and cultivars (Figure 4 and Figure 5) This protracted pattern of flowering was consistently observed in Manjimup over the period of the study and was largely the result of irregular and uneven bud movement within individual tree canopies (Figure 6)
A prolonged and irregular period of flowering can be difficult to manage for a number of reasons Determining an appropriate chemical thinning program is challenging when buds are at multiple stages of green tip and flowering on each tree within the block at any given time (Theron 2013) Fruitlets are likely to vary greatly in size and development stage and therefore careful attention is required at the time of hand thinning to ensure that fruitlets are thinned in a manner that optimises crop uniformity and reduces the spread of fruit maturity at harvest (Theron 2013 Erez 2000)
A long drawn out flowering season has other indirect impacts on orchard activities including a longer period for controlling flowering pests such as dimpling bug and for managing of bee hives These impacts were not assessed in this study
Overlap of flowering between a cultivar and its pollinisers is essential for good fruit set (Ramirez and Davenport 2013) Changes in the timing of flowering between seasons or across years that result in
Climate change impacts on flowering in pome fruit trees a climate analogue approach 2016 10
the loss of flowering synchronisation can therefore result in reduced yields Flowering overlap does not appear be a problem for either Manjimup or Stanthorpe in the years of study (Figure 5) however reduced marketable yields can result from the extended period of flowering overlap that is caused by irregular bud movement (Petri and Leite 2004) In this situation fruit set occurs over an extended period of time resulting in the significant spread of fruit maturity within individual trees
Figure 4 Duration of the flowering period from first flower to full bloom in cultivars of apple and pear grown in Manjimup and Stanthorpe in 2013 and 2014 Results are the average of individual tree observations
Climate change impacts on flowering in pome fruit trees a climate analogue approach 2016 11
Figure 5 Overlap of flowering periods from first open flower to full bloom in cultivars of apple and pear in Manjimup and Stanthorpe Dates are given as the lsquoday of yearrsquo day 260 is 17 September and day 300 is 27 October Data points are the average of individual tree observations for 2013 and 2014
Figure 6 Uneven flowering in lsquoCripps Pinkrsquo Lysterrsquos Orchard Manjimup 2014
Climate change impacts on flowering in pome fruit trees a climate analogue approach 2016 12
Apple and pear productivity in Manjimup and Stanthorpe
Low winter chill and irregular flowering can reduce productivity through impacts on fruit set and variability of fruit quality at harvest (Petri and Leite 2004 Erez 2000) To investigate any association between irregular and protracted flowering in Manjimup in 2013 and 2014 with productivity in those years broad assessments of yield were undertaken
Meaningful comparison of yield data between locations can be problematic as yield is impacted by the interaction of many complex factors including pests and diseases irrigation planting systems tree canopy management practices as well as climatic factors Long-term apple yield data was similar between locations with an average of 377 kg per tree in Manjimup and 382 kg in Stanthorpe (source Australian Bureau of Statistics)
There was no evidence of reduced productivity in Manjimup in the low chill year of 2014 In a survey of Manjimup growers 69 reported an above average or excellent yield in 2014 and 79 reported average or really good fruit quality in 2014 (Figure 7) These results were based on grower perceptions detailed yield data was not collected as part of this study
Climate change impacts on flowering in pome fruit trees a climate analogue approach 2016 13
Figure 7 Results from a survey of Manjimup growers on lsquoCripps Pinkrsquo yields and quality in 2014 The survey was undertaken at a grower roadshow event using digital audience response technology 1 October 2014
Orchard management practices in Manjimup and Stanthorpe
The lack of evidence for losses in marketable yield as a result of the variable and protracted flowering observed in Manjimup in 2014 could be because 1) the observed pattern of flowering had no impact on fruit set or fruit quality at harvest 2) Manjimup growers have adjusted management practices to adapt to low chill years or 3) impacts on productivity were there but were not great enough to be picked up in grower yield records
While it was not possible to distinguish between these alternative explanations with the data collected in this study it was worth considering whether Manjimup growers have implemented any changes to cultural practices and or longer term strategies to manage variable and protracted flowering In the survey of Manjimup growers 50 indicated that they were using dormancy-breaking sprays on some
Climate change impacts on flowering in pome fruit trees a climate analogue approach 2016 14
cultivars to manage the irregular flowering This is compared with zero growers in Stanthorpe for that year
It is not clear whether the use of dormancy-breaking sprays in Manjimup is the reason that there was no clear impact of the variable and protracted flowering on productivity but it is likely to have helped (Erez 1995 Saure 1985 Petri et al 2014)
A longer-term strategy for managing the effects of low chill years on flowering is to plant cultivars with lower chilling requirements The existing variety mix was similar in Stanthorpe and Manjimup and there was no apparent difference in the cultivars under consideration for new plantings (personal communication)
Conclusions
The following conclusions on the impact of reduced winter chill on Stanthorpersquos apple industry in 2030 can be drawn from the evaluation of flowering productivity and orchard management practices in Manjimup
1 How will flowering of apple and pear trees be impacted by reduced winter chill in
Stanthorpe in 2030
A more variable and protracted pattern of flowering is likely to exist across many apple cultivars in Stanthorpe in 2030
2 Will there be an impact on productivity
The more variable flowering will not necessarily have significant impacts on productivity of apple orchards in 2030
3 What can growers do to adapt
Stanthorpe growers are likely to be able to manage low chill years with the use of dormancy-breaking sprays At this stage there is no clear need to shift to lower chill cultivars (or crops) as Manjimup growers are achieving high levels of productivity with the same variety mix as is currently grown in Stanthorpe
4 Is the climate analogue approach appropriate in this context and can it be applied more
broadly
Yes the climate analogue approach provided insight into potential impacts of reduced winter chill on flowering in Stanthorpe in 2030 and is likely to be a valuable tool for broadly evaluating climate change impacts and options for adaptation in many horticultural contexts
5 Are there factors that should be considered when using climate analogues for informing
climate change adaptation in horticulture
Three important factors for consideration were identified during this case study
Selection of the climate analogue should be undertaken carefully with consideration given to differences between the analogue and target locations with respect to environment industry social factors and so on
The Analogues Explorer tool comes with the following qualifying statement
ldquoIt is important to note that other potentially important aspects of local climate are not matched when using this approach such as frost days or other local climate influences Furthermore for agricultural applications solar radiation and soils are not considered Thus we advise against the analogues being used directly in adaptation planning without considering more detailed informationrdquo
Climate change impacts on flowering in pome fruit trees a climate analogue approach 2016 15
A good example of why this is important was identified in this case study The town of Young was one of the possible climate analogues listed for Stanthorpe in 2030 when the climates were matched on annual temperature and rainfall In the current climate Young receives significantly higher winter chill than Stanthorpe but has a hotter summer Hence they might be a good match based on annual temperature but Young would not have been a useful analogue for evaluating reduced winter chill in Stanthorpe On the other hand it might be a good analogue for assessing risk associated with extreme summer heat
An intrinsic assumption of the climate analogue approach is that the only significant difference between the test site and the analogue location is the climate however locations might differ in other ways that could significantly reduce the value of the climate analogue approach For instance if comparing crop production in Australia with that of somewhere else in the world the production systems may be too different to provide meaningful impact and adaptation information
Relationships between climate and physiology are complex the details and nuances of climate change impacts may not be fully defined by the climate analogue approach
This case study concluded that the differences in flowering behaviour observed in Manjimup compared with Stanthorpe were the result of low winter chill in Manjimup in 2013 and 2014 However it is possible that the variable and protracted flowering in Manjimup was a response to the complex interaction between multiple factors other than total winter chill such as the pattern of chill accumulation heat spring temperatures and day-length factors This will only be understood through further experimentation detailed climate data and modelling
The climate analogue approach is limited to investigation of one possible climate scenario at a time while a modelling approach enables the testing of many different climate scenarios
Manjimup was used as a climate analogue for Stanthorpe in 2030 To investigate impacts of reduced winter chill in Stanthorpe in 2050 or 2090 alternative analogue locations would need to be sought as the conclusions from this case study cannot be extended beyond the intended time-frame
Key messages
- Results from the climate analogue approach suggested that more variable and protracted flowering behaviour is likely in pome fruit trees in Stanthorpe by 2030 without significant impact on productivity Adaptations will include the use of dormancy-breaking sprays to manage flowering but there is no evidence for a need to switch to low chill cultivars at this stage
- The climate analogue approach can provide broad information around potential impacts and adaptation strategies for Australian temperate tree crops and horticulture more generally however the details need to be considered cautiously
Recommendations
- Climate analogues should be used by the industry to broadly identify climate change impacts on apple and pear production systems and possible options for adaptation Growers in Manjimup are already successfully managing the impacts of inadequate chill in some years lessons can be learnt from their knowledge and experience
- This study did not capture the many potential impacts that protracted flowering can have on orchard management including a longer period for flowering pest control such as dimpling bug and for management of bee hives difficulties in the timing of chemical thinner application more labour intensive hand thinning and dealing with greater variability of fruit maturity at
Climate change impacts on flowering in pome fruit trees a climate analogue approach 2016 16
harvest A more detailed grower survey should be undertaken to better understand how growers in Manjimup are managing flowering in low chill years
- Potential impacts of low winter chill on marketable yield were not adequately addressed in this study and requires further research using a climate analogue and or modelling approach
- A global study to investigate the limits of profitable apple production with regards to winter chill would provide valuable information for the Australian industry in climate change adaptation planning Production areas with very low winter chill accumulation in South Africa and Southern Brazil rely heavily on dormancy-breakers and would be obvious target locations for this research
- The Australian Apple and Pear Industryrsquos ability to adapt to changing climate will depend not only on basic research but on its ability to observe and capture data on tree physiology climate and orchard practice and interpret it in a meaningful way Australiarsquos industry is made up of growing regions with diverse climates and much can be learnt about climate change impacts and options for adaptation by sharing of knowledge
Acknowledgments
The authors would like to extend a very big thank you to the growers Anne and Mauri Lyster and Newton Brothers Orchards who kindly provided orchard blocks for research observations
Thank you to Lisa Starkie and Martine Combret from Western Australia and Osi Tabing Peter Nimmo and Allan McWaters from Queensland for the collection of orchard phenology and temperature data Thank you also to Rebecca Darbyshire for the discussion and input around the interpretation of results
References
Darbyshire R (2016) Crossing the threshold adaptation tipping points for Australian fruit trees University of Melbourne
Darbyshire R Webb L Goodwin I and Barlow E W R (2013a) Evaluation of recent trends in
Australian pome fruit spring phenology International Journal of Biometeorology 57(3)
Darbyshire R Webb L Goodwin I and Barlow E W R (2013b) Impact of future warming on
winter chilling in Australia International Journal of Biometeorology 57(3) 355-366
Erez A (1995) Means to compensate for insufficient chilling to improve bloom and leafing Acta
Horticulturae 395 81-95
Erez A (2000) Bud dormancy phenomenon problems and solutions in the tropics and subtropics in
Erez A ed Temperate Fruit Crops in Warm Climates Kluwer Academic Publishers 17 - 47
Erez A Fishman S Linsley-Noakes G C and Allan P (1990) The dynamic model for rest
completion in peach buds Acta Horticulturae 276 165-174
Fishman S Erez A and Couvillon G A (1987) The temperature dependence of dormancy
breaking in plants mathematical analysis of a two-step model involving a cooperative transition Journal of Theoretical Biology 124 473 - 483
Climate change impacts on flowering in pome fruit trees a climate analogue approach 2016 17
Hennessy K J and Clayton-Greene K (1995) Greenhouse warming and vernalisation of high-chill
fruit in southern Australia Climatic Change 30(3)
Luedeling E Zhang M H Luedeling V and Girvetz E H (2009) Sensitivity of winter chill models
for fruit and nut trees to climatic changes expected in Californias Central Valley Agriculture Ecosystems amp Environment 133(12)
Meier U Graf H Hess M Kennel W Klose R Mappes D Seipp D Stauss R Streif J and
van den Boom T (1994) Phaumlnologische Entwick-lungsstadien des Kernobstes (Malus domestica Borkh und Pyrus communis L) des Steinobstes (Prunus-Arten) der Johannisbeere (Ribes-Arten) und der Erdbeere (Fragaria x ananassa Duch) Nachrichtenbl Deut Pflanzenschutzd 46 141 - 153
Nyairo R Onwonga R Cherogony K and Luedeling E (2014) Applicability of climate analogues
for climate change adaptation planning in Bugabira commune of Burundi Sustainable Agriculture Research 3(4) 46 - 62
Petri J L and Leite G B (2004) Consequences of insufficient winter chilling on apple tree bud-
break Acta Horticulturae 662 53-60
Petri J L Leite G B Couto M Gabardo G C and Haverroth F J (2014) Chemical induction of
budbreak New generation products to replace hydrogen cyanamide Acta Horticulturae 1042 159-166
Ramirez F and Davenport T L (2013) Apple pollination a review Scientia Horticulturae 162
Saure M C (1985) Dormancy release in deciduous fruit trees Horticultural Reviews 7 239-300
Tancred S and McGrath C (2013) Horticulture Production in Queenslands Southern Downs
Region
Theron K (2013) Chemical thinning of apple South African perspective Acta Horticulturae 998 85
- 90
Veloz S Williams J W Lorenz D Notaro M Vavrus S and Vimont D J (2012) Identifying
climatic analogs for Wisconsin under 21st-century climate-change scenarios Climatic Change 112(3-4) 1037-1058
Dormancy-breaking sprays for low winter chill in apples
Heidi Parkes Department of Agriculture and Fisheries Queensland
Susie Murphy White Pomewest Western Australia
Sally Bound University of Tasmania Tasmania
September 2016
This publication has been compiled by Heidi Parkes of Horticulture and Forestry Science Department of Agriculture and Fisheries copy State of Queensland 2016 The Queensland Government supports and encourages the dissemination and exchange of its information The copyright in this publication is licensed under a Creative Commons Attribution 30 Australia (CC BY) licence Under this licence you are free without having to seek our permission to use this publication in accordance with the licence terms
You must keep intact the copyright notice and attribute the State of Queensland as the source of the publication Note Some content in this publication may have different licence terms as indicated For more information on this licence visit httpcreativecommonsorglicensesby30audeeden The information contained herein is subject to change without notice The Queensland Government shall not be liable for technical or other errors or omissions contained herein The readeruser accepts all risks and responsibility for losses damages costs and other consequences resulting directly or indirectly from using this information
iii Dormancy-breaking sprays for low winter chill in apples
Summary
In the 2015-16 season trials were undertaken in lsquoGalarsquo apple trees at three locations
(Queensland Western Australia and Tasmania) to assess the efficacy of using dormancy-
breaking sprays under current Australian climates and the potential to use these sprays as
an orchard management adaptation to inadequate winter chill under future Australian
climates The trials compared the effect of Waikentrade Dormexreg and Ergerreg on the timing of
green tip and flowering the duration of the flowering period fruit set yield harvest time and
variability of maturity at harvest All dormancy-breaking sprays were able to advance
flowering time and compact the flowering period in lsquoGalarsquo apple with differences observed
between products and sites Fruit maturity was advanced with dormancy-breakers (again
with differences observed between products and sites) and generally reflected differences in
flowering dates There were no differences in fruit set yield or variability of apple maturity in
trees treated with dormancy-breaking sprays despite the compaction of flowering Dormexreg
had the most significant impacts on lsquoGalarsquo flowering and harvest timing in WA and QLD
when compared with Waikentrade and Ergerreg The timing of spray application relative to green
tip and winter chill accumulation impacted the bud burst and flowering response to
dormancy-breaking products and therefore flowering responses are likely to vary between
seasons and cultivars Dormancy-breaking sprays are likely to be an effective tool for
managing flowering in lsquoGalarsquo and other apple cultivars in lower chill years in Australia
Benefits from the use of dormancy-breakers would be greater in low chill years when the
potential impacts of inadequate chill on flowering are greatest Therefore benefits are likely
to increase under future warmer climate scenarios Impacts of dormancy-breaking sprays on
fruit quality and length of the harvest window remain unclear
iv Dormancy-breaking sprays for low winter chill in apples
Table of contents
Introduction 6
Project Objectives 7
Materials and methods 7
Site description 7
Experimental design 8
Spray application 8
Temperature data and calculation winter chill 10
Green tip and flowering 10
Fruit set 11
Fruit sampling and maturity assessments 11
Variability in fruit quality at harvest 11
Yield 11
Phytotoxicity 11
Results and discussion 12
Timing of spray application 12
Green tip and flowering 12
Fruit set and yield 15
Fruit maturity and quality 16
Cost-benefit analysis 18
Conclusions 20
Key messages 22
Recommendations 22
Acknowledgements 23
Appendices 23
References 23
Table of figures
Figure 1 Study sites in Huonville TAS (a) Stanthorpe QLD (b) and Manjimup WA (c) in spring 2015 8
Figure 2 Application of dormancy-breaking sprays using a hand lance in Manjimup WA 9
Figure 3 Chill Portion accumulation and dormancy-breaking spray application timing at study sites in TAS QLD and WA 2015 10
Figure 4 Green tip first flower and full bloom in Gala apples treated with and without dormancy-breaking sprays in TAS QLD and WA 13
Figure 5 Differences in stages of flowering on 18 September 2015 in QLD lsquoGalarsquo trees treated with and without dormancy-breakers 14
Figure 6 Fruit set in lsquoGalarsquo apple trees treated with dormancy-breaking sprays at study sites in TAS QLD and WA 2015 15
v Dormancy-breaking sprays for low winter chill in apples
Figure 7 Fruit at harvest on 27 January 2016 in lsquoGalarsquo trees treated with Dormexreg and Ergerreg QLD (centre tree was sprayed surrounding trees are untreated) 18
Figure 8 A schematic representation of the progression of buds through dormancy showing the point at which buds become responsive to the action of dormancy-breaking sprays (Faust et al 1997) 21
Table of tables
Table 1 Description of the orchard study sites 7
Table 2 Details of the dormancy-breaking sprays applied to lsquoGalarsquo trees in WA TAS and QLD in winter 2015 9
Table 3 Actual timing of dormancy-breaking spray application on lsquoGalarsquo trees in QLD WA and TAS 2015 10
Table 4 Effect of dormancy-breaking sprays on green tip and flowering dates and duration for lsquoGalarsquo apple strains grown in TAS QLD and WA in the 2015 - 2016 season 14
Table 5 Effect of dormancy-breaking sprays on gross yield and its components at harvest for lsquoGalarsquo apple strains grown in TAS QLD and WA in the 2015-2016 season 16
Table 6 Effect of dormancy-breaking sprays on fruit maturity and quality at harvest for lsquoGalarsquo apple strains grown in TAS QLD and WA in the 2015-2016 season 17
Table 7 Outline of cost and benefits associated with the use of dormancy-breaking sprays to manage low winter chill years in apple 19
6 Dormancy-breaking sprays for low winter chill in apples
Introduction
Dormancy is a phase of the annual cycle of apple trees that allows them to survive unfavourably cold winter conditions (Saure 1985) The minimum accumulation of winter chill needed to break bud dormancy is defined as the chilling requirement and is thought to be genetically determined (Labuschagne et al 2002 Samish 1954)
Failure to adequately satisfy the chilling requirement can result in delayed and uneven bud burst and flowering and extended duration of the flowering period (Saure 1985 Oukabli 2003) An extended flowering period reduces the effectiveness of chemical thinning (Petri and Leite 2004) and can impact on fruit set and yield (Erez 1995) It has also been shown to result in greater variability of fruit size and maturity which impacts pest and disease management and harvest efficiency (Petri and Leite 2004)
Efforts are being made to breed lower chill cultivars in some crops to enable commercial production in milder growing regions however management tools to compensate for insufficient chilling are still required in many temperate tree fruit production systems in warmer climates (Erez 1995) These tools utilise a range of strategies to manipulate bud progression through dormancy including the use of dormancy-breaking sprays to promote bud burst (Erez 1995 Allderman et al 2011 Saure 1985) The use of dormancy-breaking sprays is perhaps the most widely used and accepted method for managing low chill conditions globally (Erez 2000 Jackson and Bepete 1995 Petri et al 2014)
Winter chill is predicted to decrease in Australian growing regions under future climate change with milder districts likely to experience the impacts of inadequate chilling on a more regular basis (Darbyshire et al 2013 White 2016) The use of dormancy-breaking sprays is a potential adaptation for the apple industry to manage existing commercial cultivars in warmer years as they have been shown to stimulate earlier more homogenous bud burst and flowering in a number of crops grown in conditions with insufficient winter chill (Erez et al 2008 Petri et al 2012 Saure 1985) Additional benefits such as improved uniformity of fruit maturity and quality with the use of dormancy-breaking sprays have been reported (Petri and Leite 2004)
Different types of products have been shown to have dormancy-breaking action in a range of crops These include thidiazuron (a compound with cytokinin-like activity) (Wang et al 1986) dinitro-o-cresol (DNOC-oil) and potassium nitrate (Faust et al 1997) garlic extract and gibberellic acid (Abd El-Razek et al 2013) the emulsified vegetable oil compound Waikentrade (Bound and Miller 2006) and hydrogen cyanamide which is better known as Dormexreg (Bound and Jones 2004) Dormexreg has known risks for plant and human health and therefore alternatives to the use of this product have been sought (Petri et al 2014) More recently Ergerreg an inorganic nitrogen compound combined with calcium nitrate has been shown to cause earlier and more compact flowering in apples (Petri et al 2014 Petri et al 2010)
However with the exception of two studies (Bound and Jones 2004 Bound and Miller 2006) little work has been undertaken in Australia to investigate the efficacy of dormancy-breaking sprays to induce earlier and more uniform flowering in apple cultivars grown under local conditions and the effects on fruit quality and yield remain unclear
A survey performed at the WA National Climate Change project Roadshow event in 2014 indicated that half of the growers were currently using Waikentrade and or Dormexreg for the purposes of stimulating uniform bud burst and flowering under conditions of inadequate chill however there was considerable uncertainty around best practice issues and effectiveness Questions and discussions with growers in other growing regions also indicated an interest in these products but highlighted the need for better understanding regarding use and efficacy in low chill years under current climates and potential as an adaptation strategy for climate change
7 Dormancy-breaking sprays for low winter chill in apples
Project Objectives
The overarching research question was are dormancy-breaking sprays a feasible adaptation option for the Australian apple industry to low chill years in current and future climates
The specific research objectives were to determine
a Impact of dormancy-breaking sprays on the timing of bud burst and flowering and duration of the flowering period in lsquoGalarsquo apple grown in diverse Australian climates
b Impact of dormancy-breaking sprays on fruit set yield and variability of maturity and quality in Australian lsquoGalarsquo apple trees
c Comparative effectiveness of using Waikentrade Dormexreg and Ergerreg as dormancy-breaking sprays in apple
d Cost-benefit of using dormancy-breaking sprays
e Issues (actual and potential) associated with using dormancy-breaking sprays for management of and adaptation to inadequate winter chill under Australian conditions
f Future research needs towards improving orchard practices around the use of dormancy-breaking products
To investigate these objectives a study was undertaken in lsquoGalarsquo apple tree cultivars in the 2015 2016 season at three orchard locations around Australia (QLD WA and TAS)
Materials and methods
Site description
The study was performed at three commercial orchard sites around Australia in the 2015 to 2016
season (Table 1 and Figure 1) Sites were fully mature lsquoGalarsquo blocks and were representative of high-
density plantings in Australia Trees were trained to a dominant central leader and with the
exception of the application of dormancy-breaking sprays as part of this study were managed by the
grower using standard orchard practices
Table 1 Description of the orchard study sites
State Growing region
Latitude and longitude
lsquoGalarsquo strain Rootstock
Density treesha
Netted
Queensland (QLD)
Stanthorpe 2852 S 15190 E
Royal GalaM26 2500 Yes
Western Australia (WA)
Manjimup 3416 S 11670 E
GalaxyM26 2500 No
Tasmania (TAS)
Huonville 4301 S 14706 E
Alvina GalaM26 2500 No
8 Dormancy-breaking sprays for low winter chill in apples
Figure 1 Study sites in Huonville TAS (a) Stanthorpe QLD (b) and Manjimup WA (c) in spring 2015
Experimental design
The experiment was a randomised complete block design with two treatments (Waikentrade and Dormexreg) and an untreated control in WA and TAS and three treatments (Waikentrade Dormexreg and Ergerreg) and an untreated control in QLD Replicates were individual trees with five replicates per
treatment Guard trees were included either side of the datum trees to ensure complete coverage of
datum trees and to protect other datum trees in the row from over-spraying Sprays were applied at
one concentration and timing according to directions on the product label
Spray application
Dormancy-breaking sprays were applied to the datum trees using a hand lance (Figure 2) as
described in Table 2
a
b
c
9 Dormancy-breaking sprays for low winter chill in apples
Table 2 Details of the dormancy-breaking sprays applied to lsquoGalarsquo trees in WA TAS and QLD in winter 2015
Dormexreg Waikentrade Ergerreg
Active constituent 520gL Cyanamide 388gL Methyl esters of fatty acids
250gL Decanol alkoxylate (fertiliser adjuvant)
Product rate 3L 100L water (3 vv) 4L 100L water (4 vv) 5L 100L water (5 vv)
Additives
50ml100L Agral or 125ml100L Kendeen 20
NA 10kg100L Calcium nitrate
Application Applied as a fine spray over entire tree to the point of run-off
Application timing
35 days before expected green tip (label suggests 30 ndash 45 days)
35 before expected green tip (label suggests 35 ndash 50 days)
35 days before expected green tip (label suggests 45 days)
Determination of application date
Grower records of historical green tip dates were accessed for the study site Chill accumulation was monitored during the winter and compared with historical chill accumulation data to obtain the best estimate of expected green tip date
Figure 2 Application of dormancy-breaking sprays using a hand lance in Manjimup WA
10 Dormancy-breaking sprays for low winter chill in apples
Table 3 Actual timing of dormancy-breaking spray application on lsquoGalarsquo trees in QLD WA and TAS 2015
Location Spray Date Green tip date
Spray timing (days before
green tip)
Chill Portions at spraying
(brackets total chill)
Total chill Portions
TAS 13 Aug 8 Sep 26 95 (84) 113
QLD 30 July 5 Sep 37 60 (75) 80
WA 18 Aug 23 Sep 36 58 (75) 77
In untreated trees accumulated from 1 Jan to green tip
Figure 3 Chill Portion accumulation and dormancy-breaking spray application timing at study sites in TAS QLD and WA 2015
Temperature data and calculation winter chill
Hourly temperature data was recorded in the orchard using temperature data loggers placed inside a miniature Stevensonrsquos screen positioned approximately 15 to 2m within the tree row Winter chill was calculated in Chill Portions using the Dynamic model (Erez et al 1990 Fishman et al 1987)
Green tip and flowering
Buds were monitored three times per week (full methods described in appendix 1) from just prior to green tip until the end of flowering Only spur and terminal buds were assessed with axillary buds
11 Dormancy-breaking sprays for low winter chill in apples
and long highly vigorous shoots excluded Dates were recorded for the day on which each tree reached green tip 5 flowering and full bloom
Green tip was defined as the date when 5 of the buds of the tree had observable green tips corresponding to the 07 stage in the international BBCH code for pome fruit (beginning of bud break first green leaf tips just visible) (Meier et al 1994) Full bloom was defined as the date when 80 of the flowers were open similar to stage 65 in the international BBCH code for pome fruit (full flowering at least 50 of flowers open first petals falling) (Meier et al 1994)
Fruit set
Fruit set measurements were taken from three representative mid-canopy branches per tree The number of spur and terminal flower clusters were recorded for each limb soon after green tip when flowers were emerging The number of fruit set per cluster was recorded for each tagged limb after final fruit drop but before hand-thinning
Fruit sampling and maturity assessments
A 30 fruit sample was taken per datum tree prior but as close as possible to the growerrsquos first harvest For the purpose of standardisation between treatments fruit was sampled from the mid-section of each tree on the same side of the row To ensure the full range of variability was captured fruit were picked from along the entire length of a branch before moving on to the next branch This ensured that fruit was not biased towards selection from the outside or inside of the canopy
The following assessments were made on the 30 fruit sample
- Starch Pattern Index (SPI) was determined using the starch-iodine test for apples Each fruit was cut transversely across the equator and the cut surface of one side sprayed with a solution of 1g potassium iodide plus 025g iodine per 100ml water (01 iodine 1 potassium iodide The resulting pattern of starch hydrolysis was compared with the ENZA 0-6 scale
- Background colour (BGC) was estimated using an ENZA lsquoRoyal Galarsquo swatch - Red blush intensity (RBI) was assessed by comparing the blushred side of the fruit with the
lsquoRoyal Galarsquo ENZA 11 point colour chart - Red blush coverage (RBC) was assessed by estimating the of the fruit surface covered by
greater than or equal to an RBI of 2 (on the ENZA 11 point chart)
Variability in fruit quality at harvest
Variability of fruit maturity and quality at harvest was assessed by calculating the standard deviation of the fruit weight SPI BGC RBI RBC measurements taken from the 30 fruit sample
Yield
Yield was calculated per tree by multiplying the total fruit number (counted and recorded prior to harvest) by the average fruit weight (taken from the 30 fruit sample) Trunk cross-sectional area (TCA) was calculated from a trunk circumference measurement taken 20 cm above the graft
Phytotoxicity
As both Dormexreg (Bound and Jones 2004) and Ergerreg (Hawerroth et al 2010) can cause phytotoxicity phtotoxicity was assessed and recorded from the date of spray application to flowering using a 0-4 scale (appendix 2)
12 Dormancy-breaking sprays for low winter chill in apples
Results and discussion
Timing of spray application
The target spray timing was 35 days before green tip Historical green tip records together with in-season chill accumulation calculations were used to predict the estimated date of green tip for 2015 A best estimate of green tip date was determined by comparing the current seasonrsquos chill accumulation curve with that of the previous few seasons to determine how the season was tracking The actual spray date was further dictated by the weather with favourable conditions for spraying required Actual spray timing was 26 37 and 36 days before green tip in TAS QLD and WA respectively (Table 3)
The timing of dormancy-breaking spray application can have considerable impact on product efficacy (Faust et al 1997 Petri et al 2010) Spraying too early reduces effectiveness and spraying too close to bud burst can have undesirable effects such as delayed green tip and bud damage (Bound and Jones 2004 Bound and Miller 2006) Getting the timing right can be problematic however due to difficulties in estimating the date of green tip Dormancy-breaking sprays are commonly applied according to calendar date in other crops such as grapes (pers comm) but this is not recommended in apples as the date of green tip can vary considerably from season to season The methods described in this study estimated green tip dates successfully in WA and QLD Green tip timing was more difficult to predict in TAS primarily due to the exceptionally cold winter conditions
No bud or flower phytotoxicity was observed in this study with any of the dormancy-breaking spray treatments
Green tip and flowering
Green tip and flowering responses to dormancy-breaking sprays varied between sites (Figure 4 and Table 4)
In TAS green tip was delayed by five and six days in Dormexreg and Waikentrade sprayed trees respectively (Figure 4 and Table 4) Extended dormancy is not an uncommon response and occurs when dormancy-breaking sprays are sprayed close to bud burst (Bound and Miller 2006) These trees caught up with the untreated control trees and there were no significant differences in the date of full bloom or the duration of the flowering period A reduction in the length of flowering was observed in trees sprayed with both of the dormancy-breaking products but this was not statistically significant
The lack of flowering response to the dormancy-breaking sprays was likely due to the cold 2015 winter in which Huonville received 113 chill portions well above the long-term average of 88 Under these conditions it was likely that the lsquoGalarsquo chilling requirement was satisfied prior to application of the dormancy-breaking sprays limiting the potential impact Buds were possibly already sitting in the eco-dormant phase of dormancy waiting for favourable growing conditions The rapid onset of a warm spring resulted in a short flowering period of just two to three days in all trees
In QLD green tip was significantly advanced in trees sprayed with Dormexreg Ergerreg and Waikentrade by nine six and five days respectively when compared with untreated trees (Figure 4 and Table 4) Full bloom was advanced by 12 5 and 5 days with Dormexreg Ergerreg and Waikentrade respectively (Figure 5) and the flowering period was condensed with all dormancy-breaking sprays Green tip and flowering responses to the Dormexreg spray were significantly stronger than responses to Waikentrade and Ergerreg with no differences observed between the latter two products
In WA green tip was significantly advanced by 14 days in trees sprayed with Dormexreg and four days in trees sprayed with Waikentrade (Figure 4 and Table 4) Full bloom was advanced by nine days in Dormexreg sprayed trees while there was no difference in full bloom dates between trees sprayed with Waikentrade and the untreated trees The length of the flowering period was reduced by 19 with
13 Dormancy-breaking sprays for low winter chill in apples
Dormexreg while Waikentrade caused a significant increase in the flowering period by 39 In studies of both time and rate of application across five cultivars Bound and Miller (2006) reported that Waiken concentrated the flowering period regardless of whether the flowering period was brought forward or delayed The cause of the lengthening of flowering in this study in the Waikentrade treated trees is unclear and requires further studies to determine if this is a real response to Waikentrade or the result of other experimental factors
The differences observed in green tip and flowering responses to dormancy-breaking sprays at each site in the 2015-2016 season indicate that responses are likely to vary from season to season depending on factors including temperatures before and after spraying and timing of spraying relative to green tip Petri et al (2010) described the impact of temperature at spraying and in the days immediately following spraying on the response to dormancy-breaking sprays
In QLD and WA dormancy-breaking sprays caused large changes to full bloom timing and duration indicating that careful consideration needs to be given to the flowering time of polliniser varieties to ensure fruit set is not impacted With historical knowledge of cultivar flowering times dormancy-breaking sprays can be used to improved synchronisation of flowering between cultivars and their pollinisers (Petri et al 2012)
Figure 4 Green tip first flower and full bloom in Gala apples treated with and without dormancy-breaking sprays in TAS QLD and WA
14 Dormancy-breaking sprays for low winter chill in apples
Table 4 Effect of dormancy-breaking sprays on green tip and flowering dates and duration for lsquoGalarsquo apple strains grown in TAS QLD and WA in the 2015 - 2016 season
Site lsquoGalarsquo strain
Treatment Green tip (DoY)
First flower (DoY)
Full bloom
(DoY) Green tip to first flower (days)
First flower to full bloom (days)
Tas Alvina Untreated 251 b 275 b 278 24 a 3
Dormexreg 256 a 277 a 279 20 b 2
Waikentrade 257 a 277 a 279 20 b 2
QLD Royal Untreated 248 a 266 a 278 17 c 12 a
Dormexreg 239 c 259 c 266 20 b 7 c
Ergerreg 242 b 264 b 273 22 a 9 b
Waikentrade 243 b 264 b 273 21 ab 9 b
WA Galaxy Untreated 266 a 281 a 287 15 b 6 b
Dormexreg 252 c 273 c 278 21 a 5 c
Waikentrade 262 b 278 b 287 17 b 9 a
DoY = Day of year Within a single and site only means with different letters are significantly different P = 005 LSD test Full bloom dates did not vary between trees within each treatment and therefore no statistics could be performed
Figure 5 Differences in stages of flowering on 18 September 2015 in QLD lsquoGalarsquo trees treated with and without dormancy-breakers
Ergerreg
Untreated Waikentrade
tradereg
Dormexreg
regregregreg
15 Dormancy-breaking sprays for low winter chill in apples
Fruit set and yield
Fruit set expressed as the percentage of flower clusters that set fruit was not significantly different between treatments at any location (Figure 6) indicating that compaction of the flowering period observed most strongly in QLD did not negatively (or positively) impact the effectiveness of pollination Similarly when expressed as the number of fruit set per 100 flower clusters there was no difference between treatments (data not shown) Dormancy-breaking sprays have been shown to have a slightly negative effect on fruit set in some studies (Hawerroth et al 2010 Bound and Jones 2004) suggesting that impacts on pollination success are likely to be influenced by factors such as cultivar and season
Interestingly the number of fruit set per 100 flower clusters was significantly different between locations with TAS showing the highest fruit set followed by WA and then QLD (data not shown)
Figure 6 Fruit set in lsquoGalarsquo apple trees treated with dormancy-breaking sprays at study sites in TAS QLD and WA 2015
There were no differences in gross apple yields between treatments at any location (Table 5) In TAS fruit from Waikentrade treated trees had the highest and most marketable mean fruit weight compared with the other treatments however this was likely a crop load effect and not a result of the treatment per se (Table 5) Yield adjusted for trunk cross sectional area was significantly higher in the control trees compared with both Waikentrade and Dormexreg treated trees in TAS It is unclear whether these differences were a result of the treatment as flowering density varied widely between trees in the block and therefore it is possible that any differences in yield were a reflection of flowering density rather than an impact of the treatments
In QLD fruit numbers were significantly higher in the Dormexreg treated trees compared with those sprayed with Ergerreg and Waikentrade (Table 5) Again it is unclear whether this is the result of the treatments as there were no significant differences in the percentage of flowers setting fruit (Figure 6) In WA there were no differences in the components of yield between treatments (Table 5)
Dormexreg has been shown to significantly improve yields in other studies of apple including in lsquoGranny Smithrsquo and lsquoGolden Deliciousrsquo (Jackson and Bepete 1995) Such improvements are likely to be more substantial in very warm growing regions such as the one used in the Jackson and Bepete (1995)
16 Dormancy-breaking sprays for low winter chill in apples
study which had less than 300 chill hours where yields are generally very low to start with In most Australian growing regions significant improvements are more likely to be related to fruit quality and marketable yield rather than gross yield
Table 5 Effect of dormancy-breaking sprays on gross yield and its components at harvest for lsquoGalarsquo apple strains grown in TAS QLD and WA in the 2015-2016 season
Site lsquoGalarsquo strain
Treatment TCA1 (cm2)
Fruit no tree
Fruit no TCA
Mean fruit weight (g)
Kgtree KgTCA Tha
Tas Alvina Untreated 141 233 166 a 1332 b 308 22 a 77
Dormexreg 162 201 121 b 1248 c 241 15 b 60
Waikentrade 158 118 77 c 1573 a 187 12 b 47
QLD Royal Untreated 185 196 ab 108 a 1288 252 14 63
Dormexreg 217 241 a 111 a 1285 308 14 77
Ergerreg 212 167 b 81 b 1395 233 11 58
Waikentrade 206 187 b 93 ab 1303 242 12 60
WA Galaxy Untreated 173 162 105 1070 166 11 41
Dormexreg 180 161 102 1141 184 11 46
Waikentrade 196 212 108 1044 219 11 55
1TCA = trunk cross-sectional area Within a single and site only means with different letters are significantly different P = 005 LSD test
Fruit maturity and quality
Results of the effect of dormancy-breaking sprays on fruit maturity and quality are shown in Table 6 In TAS fruit from trees treated with Waikentrade were the most advanced according to the delta absorbance (DA) meter and background colour however the starch pattern index results indicate that fruit from untreated trees were the most mature at harvest Therefore differences in the timing of maturity with treatments are not clear but the impacts were not large
In QLD fruit was harvested on different dates due to the large differences in maturity between treatments Fruit from Dormexreg trees were more than one week ahead of untreated trees (Table 6) Fruit from Ergerreg and Waikentrade trees were also ahead by at least two days however comparison of the background colour and red blush coverage data suggested that fruit on these trees were further advanced (Figure 7) Advances in fruit maturity reflected the differences in flowering dates
In WA fruit maturity was slightly advanced in Dormexreg trees compared with control but this was not statistically significant (Table 6) The background colour was significantly higher in fruit from Waikentrade treated trees compared with Dormexreg and control trees According to the data there were no differences in red blush coverage between treatments although grower observation suggested that
17 Dormancy-breaking sprays for low winter chill in apples
the colour was more intense in the trees sprayed with Dormexreg compared with other treatments This may have been due to advanced maturity
Table 6 Effect of dormancy-breaking sprays on fruit maturity and quality at harvest for lsquoGalarsquo apple strains grown in TAS QLD and WA in the 2015-2016 season
Site lsquoGalarsquo strain
Treatment Fruit sample date
Starch pattern index
Background colour
Red blush coverage2
()
Red blush intensity2
DA index1
Tas Alvina Untreated 7316 08 a 64 b 045 b
Dormexreg 7316 03 b 62 c 051 a
Waikentrade 7316 03 b 65 a 035 c
QLD Royal Untreated 3216 24 34 c 156 b 18
Dormexreg 27116 32 41 b 356 a 29
Ergerreg 1216 35 45 a 360 a 31
Waikentrade 1216 35 43 ab 339 a 30
WA Galaxy Untreated 9216 21 34 b 709 52
Dormexreg 9216 31 34 b 682 46
Waikentrade 9216 25 41 a 726 50
1DA index was measured with the Delta Absorbance meter in Tasmania only 2Red blush coverage and intensity were not measured in Tasmania Numbers are the average of 30 fruit samples Within a single and site only means with different letters are significantly different P = 005 LSD test
18 Dormancy-breaking sprays for low winter chill in apples
Figure 7 Fruit at harvest on 27 January 2016 in lsquoGalarsquo trees treated with Dormexreg and Ergerreg QLD (centre tree was sprayed surrounding trees are untreated)
There was no measurable reduction in the variability of fruit maturity (as assessed by looking at colour starch pattern index and fruit weight) at harvest with any of the sprays (data not shown) despite the significant effect of the treatments on compaction of flowering at some sites Similar results were observed by Bound and Jones (2004) who found no consistent trends in impacts on fruit quality with the use of Dormexreg even though significant compaction of the flowering period was observed
Based on the finding that an extended flowering period increases the variability of fruit size at harvest (Petri and Leite 2004) it was hypothesised in this study that a reduction in the spread of flowering would result in a reduction in the spread of maturity potentially reducing the number of picks and increasing the percentage of fruit picked at optimum maturity
Failure to observe an improvement in variability could be the result of a number of factors Firstly the small experimental scale Up-scaling the experiment to rows or blocks of trees would provide more scope for identifying differences in fruit variability and potential for improving harvest management Secondly other influences impacting on fruit quality may have overshadowed any effects of the more uniform flowering Factors such as position in the canopy shading leaf area associated with individual fruit development and age of wood bearing the fruit have all been shown to impact on mineral content and quality (Volz et al 1994)
Cost-benefit analysis
A full cost-benefit analysis was not undertaken here as the size of the study did not enable sufficient collection of data for meaningful analysis of dollar value however the broad costs and benefits are outlined in Error Reference source not found
Dormexreg
reg
Ergerreg (centre tree only)
19 Dormancy-breaking sprays for low winter chill in apples
Table 7 Outline of cost and benefits associated with the use of dormancy-breaking sprays to manage low winter chill years in apple
Costs
Direct costs
Product purchase
Labour to apply product
Tractor and associated costs to perform one spray during the dormant period
Potential indirect costs
Inappropriate application timing could result in anything from nil benefit to significant bud damage resulting in negative impacts on pollination and fruit set
Human health impacts from inappropriate handling and use of some dormancy-breaking products
Benefits
More compact and uniform flowering resulting in improved efficiency of chemical thinning and management of flowering pests
More compact flowering potentially resulting in more uniform fruit maturity throughout the canopy and therefore shorter harvest duration (saving on labour costs) and improvements in fruit quality Also likely to be benefits for the effectiveness of pest and disease management and efficacy of plant growth regulators such as ReTainreg to manage harvest
Benefits would be greater in low chill years when the potential impacts of inadequate chill on flowering are greatest Benefits are likely to increase under future warmer climate scenarios
Earlier flowering and harvest time market-price benefits in some cases
Benefits are likely to vary with cultivar and block (for example tree structure may effect impact of dormancy-breaking sprays on fruit quality)
20 Dormancy-breaking sprays for low winter chill in apples
Conclusions
The dormancy-breaking sprays assessed in this study were able to advance flowering time and compact the flowering period in lsquoGalarsquo apple with differences observed between products and sites A more compact and uniform flowering period has a number of benefits including improved management of bee hives flowering pests and chemical thinning practices
Despite the compaction of flowering there were no clear differences observed in fruit set yield or variability of apple maturity in trees treated with dormancy-breaking sprays More work is required to test the potential of these products to improve fruit quality and reduce the length of harvest Advances in harvest timing were observed with the dormancy-breakers and generally reflected differences in flowering dates The ability to manipulate harvest timing can be useful in situations where advantage can be taken of a high-price market window
Dormexreg had the most significant impacts on lsquoGalarsquo flowering and harvest timing in WA and QLD when compared with Waikentrade and Ergerreg However Dormexreg is considerably more toxic to humans than either Waikentrade or Ergerreg and has greater capacity to cause phytotoxicity (Bound and Miller 2006) It has been noted in other studies that a significant advantage of using non-toxic dormancy-breaking products such as Waikentrade is greater flexibility with the timing of application The product can be applied later in the season (up to when some buds are showing green) without causing damage to buds (Bound and Miller 2006)
Application timing of dormancy-breaking sprays relative to green tip previous winter chill accumulation and temperatures received after spraying had considerable impact on product efficacy in this study As a consequence flowering responses are likely to vary between seasons and it is important to consider the flowering time of polliniser cultivars to ensure flowering overlap so that fruit set is not affected
The overarching research question posed at the outset of this study was are dormancy-breaking sprays a feasible adaptation option for the Australian apple industry to low chill years in current and future climates Results have indicated that dormancy-breaking sprays are likely to be an effective tool for managing flowering in lsquoGalarsquo in lower chill years in Australian growing conditions It seems reasonable to broaden this conclusion to other apple cultivars when considered in the context of results from previously published research in lsquoFujirsquo lsquoGranny Smithrsquo lsquoCripps Pinkrsquo and lsquoCripps Redrsquo (Bound and Jones 2004 Bound and Miller 2006 Petri et al 2014 Erez 2000) However significant research gaps still remain
How effective will dormancy-breaking sprays be as an adaptation for the Australian apple industry to the climate change in the longer term Or to phrase the question another way when will the winter chill received in an orchard fall too far below the chilling requirement for even the use of dormancy-breaking sprays to enable economic production Only a proportion of the chilling requirement can be compensated for by the use of dormancy-breaking sprays (Faust et al 1997) but the size of this proportion is unclear It has been suggested that up to 30 of the chilling requirement can be compensated for with dormancy-breaking sprays (Erez 1995) however compensation closer to 45 has been demonstrated in stone fruit (George et al 2002)
A global study to investigate the limits of profitable apple production with regards to winter chill would provide valuable information for the Australian industry in climate change adaptation planning Production areas with very low winter chill accumulation in South Africa and Southern Brazil rely heavily on dormancy-breakers and would be obvious target locations for this research
A more accurate method for determining dormancy-breaking spray timing is required to improve the consistency and predictability of the flowering response Difficulties in estimating the green tip date has potential to reduce the product efficacy and cause bud damage in the worst cases Faust et al
21 Dormancy-breaking sprays for low winter chill in apples
(1997) suggested that dormancy-breakers are only effective when sprayed during the lsquos-endodormancyrsquo phase of dormancy and not before (Figure 8) A biological marker is required to determine when buds are at this stage and therefore responsive to dormancy-breaking sprays Biochemical changes in water status cell membrane composition hormone production and anabolic potential have been identified in buds as they progress through the stages of dormancy (Faust et al 1997) and could potentially be used as markers of dormancy status Incidentally the use of tetrazolium staining (Carvalho et al 2010) as a simple tool to monitor the status of bud dormancy in apples was assessed as part of this study but could not reliably track the shift from dormancy to bud burst (data not shown)
The mechanism by which dormancy-breaking sprays act to promote bud burst particularly in the case of Dormexreg remains unclear Vergara et al (2012) suggested that a respiratory stress may be involved in the release of buds from dormancy and Melke (2015) concluded that oxygen starvation was involved in the dormancy breaking mechanism when applying oils Understanding the mode of action would enable the development of products with greater efficacy and safety
The Australian pistachio industry has recommended winter oil application in low chill years to advance bud burst The recommendation states that winter oil be applied if 57 Chill Portions have not been reached by 15 August (Zhang and Taylor 2011) Defined guidelines for apple varieties on the use of dormancy-breaking sprays are likely to be some way off due to a lack of understanding around cultivar chilling requirements Investigations should be undertaken however into the possibility of determining broad guidelines based on current knowledge
Figure 8 A schematic representation of the progression of buds through dormancy showing the point at which buds become responsive to the action of dormancy-breaking sprays (Faust et al 1997)
22 Dormancy-breaking sprays for low winter chill in apples
Key messages
- Dormancy-breaking sprays are likely to be an effective tool for managing flowering in lsquoGalarsquo and other apple cultivars in lower chill years in Australia
- Impacts of dormancy-breaking sprays on fruit quality and length of the harvest window remain unclear
- Benefits from the use of dormancy-breakers are likely to be greater in low chill years when the potential impacts of inadequate chill on flowering are greatest Therefore benefits are likely to increase under future warmer climate scenarios
- Dormexreg Waikentrade and Ergerreg were able to advance flowering time and compact the flowering period in lsquoGalarsquo apple with differences observed between products and sites Compact and uniform flowering period has benefits for improved management of bee hives flowering pests and chemical thinning practices
- Fruit maturity was advanced with dormancy-breakers with differences observed between products and sites and generally reflected differences in flowering dates The ability to manipulate harvest timing can be useful in situations where advantage can be taken of a high-price market window
- There were no differences in fruit set yield or variability of apple maturity in trees treated with dormancy-breaking sprays despite the compaction of flowering
- Dormexreg had the most significant impacts on lsquoGalarsquo flowering and harvest timing in WA and QLD when compared with Waikentrade and Ergerreg
- The timing of spray application relative to green tip previous winter chill accumulation and temperatures received after spraying impacts the bud burst and flowering response to dormancy-breaking products
- Flowering responses are likely to vary between seasons cultivars and blocks
- Flowering time of polliniser cultivars needs to be considered to ensure flowering overlaps so that fruit set is not affected
Recommendations
- The timing of dormancy-breaking spray application should be carefully considered as inappropriate timing could result in anything from nil benefit to significant bud damage resulting in negative impacts on pollination and fruit set
- Application timing should be determined using historical green tip and winter chill records together with monitoring of in-season chill accumulation Historical and up-to-date in-season winter chill information will be available from the Australian winter chill website (to be released in March 2017)
- Investigations should be undertaken into the possibility of determining broad guidelines around for the use of dormancy-breaking sprays to manage low chill years in cultivars of apple based on existing knowledge Such guidelines should include information on when dormancy-breaking sprays should be used and in which cultivars and regions
- Potential benefits of dormancy-breaking sprays on variability of fruit maturity and the length of the harvest window remain unclear Further research is required to investigate how these products might be used to improve fruit quality and harvest efficiency particularly in cultivars requiring multiple picks
23 Dormancy-breaking sprays for low winter chill in apples
- Investigations into alternatives to Dormexreg are required Current research suggests that this product remains the most efficacious dormancy-breaker available in Australia but its mammalian health impacts may result in de-registration in the future Research is required to determine the mode of action of Dormexreg to enable development of dormancy-breaking products with greater efficacy and safety
- In considering potential for adaptation to warmer winters Australian apple growers need to know when the winter chill received in their orchard will fall too far below the chilling requirement for dormancy-breaking sprays to enable economic production of each cultivar Further research at both the basic and applied levels would be required to provide these guidelines
- A global study to investigate the limits of profitable apple production with regards to winter chill would provide valuable information for the Australian industry in climate change adaptation planning Production areas with very low winter chill accumulation in South Africa and Southern Brazil rely heavily on dormancy-breakers and would be obvious target locations for this research
- Basic research is necessary to identify a biological marker of bud progression through dormancy to facilitate optimal timing for dormancy-breaking spray application
- Further research to develop phenology models of bud burst timing for apple cultivars is required to enable more accurate estimations of green tip date
Acknowledgements
We thank Steven and Ugo Tomasel (Qld) Maurie Ann Tim and Michelle Lyster (WA) and Scott Price (TAS) for the use of their orchards in this trial Thanks to Allan McWaters John Sutton Lisa Starkie and Steve Paterson for providing the technical support necessary to conduct this trial
Appendices
1 Phenology Data Collection Protocols 2 Bud damage scale
References
Abd El-Razek E Abd El-Migeed M M M and Abdel-Hamid N (2013) Response of le conte pear trees to garlic extract and GA3 as budbreak dormancy agents Middle East Journal of Scientific Research 14(11) 1407-1413
Allderman L A Steyn W J and Cook N C (2011) Growth regulator manipulation of apple bud
dormancy progressions under conditions of inadequate winter chilling South African Journal of Plant and Soil 28(2) 103 - 109
Bound S A and Jones K M (2004) Hydrogen cyanamide impacts on flowering crop load and fruit
quality of red Fuji apple (Malus domestica) New Zealand Journal of Crop and Horticultural Science 32(2) 227-234
Bound S A and Miller P (2006) Effects of Waikenreg on flowering and spring growth in apple Acta
Horticulturae 727 167-174
24 Dormancy-breaking sprays for low winter chill in apples
Carvalho R I N Rendoke J C Biasi L A and Zanette F (2010) Metabolic activity evaluation of
temperate tree fruit buds by using the tetrazolium test Acta Horticulturae 872 89 - 95
Darbyshire R Webb L Goodwin I and Barlow E W R (2013) Impact of future warming on winter
chilling in Australia International Journal of Biometeorology 57(3) 355-366
Erez A (1995) Means to compensate for insufficient chilling to improve bloom and leafing Acta
Horticulturae 395 81-95
Erez A (2000) Bud dormancy phenomenon problems and solutions in the tropics and subtropics in
Erez A ed Temperate Fruit Crops in Warm Climates Kluwer Academic Publishers 17 - 47
Erez A Fishman S Linsley-Noakes G C and Allan P (1990) The dynamic model for rest
completion in peach buds Acta Horticulturae 276 165-174
Erez A Yablowitz Z Aronovitz A and Hadar A (2008) Dormancy breaking chemicals Efficiency
with reduced phytotoxicity Acta Horticulturae 772 105-112
Faust M Erez A Rowland L J Wang S Y and Norman H A (1997) Bud dormancy in
perennial fruit trees Physiological basis for dormancy induction maintenance and release HortScience 32(4) 623-629
Fishman S Erez A and Couvillon G A (1987) The temperature dependence of dormancy
breaking in plants mathematical analysis of a two-step model involving a cooperative transition Journal of Theoretical Biology 124 473 - 483
George A P Broadley R H Nissen R J and Ward G (2002) Effects of new rest-breaking
chemicals on flowering shoot production and yield of subtropical tree crops Acta Horticulturae 575 835-840
Hawerroth F J Petri J L and Leite G B (2010) Erger and calcium nitrate concentration for
budbreak induction in apple trees Acta Horticulturae 872 239-244
Jackson J E and Bepete M (1995) The effect of hydrogen cyanamide (Dormex) on flowering and
cropping of different apple cultivars under tropical conditions of sub-optimal winter chilling Scientia Horticulturae 60(3-4) 293-304
Labuschagne I F Louw J H Schmidt K and Sadie A (2002) Genetic variation in chilling
requirement in apple progeny Journal of the American Society for Horticultural Science 127(4) 663-672
Meier U Graf H Hess M Kennel W Klose R Mappes D Seipp D Stauss R Streif J and
van den Boom T (1994) Phaumlnologische Entwick-lungsstadien des Kernobstes (Malus domestica Borkh und Pyrus communis L) des Steinobstes (Prunus-Arten) der Johannisbeere (Ribes-Arten) und der Erdbeere (Fragaria x ananassa Duch) Nachrichtenbl Deut Pflanzenschutzd 46 141 - 153
25 Dormancy-breaking sprays for low winter chill in apples
Oukabli A Bartolini S and Viti R (2003) Anatomical and morphological study of apple (Malus x domestica Borkh) flower buds growing under inadequate winter chilling Journal of Horticultural Science and Biotechnology 78(4) 580-585
Petri J L Hawerroth F J Leite G B Couto M and Francescatto P (2012) Apple phenology in
subtropic climate conditions in Zhang X ed Phenology and climate change Rijeka Croatia InTech 195 - 216
Petri J L and Leite G B (2004) Consequences of insufficient winter chilling on apple tree bud-
break in Jindal K K Sharma R C and Rehalia A S eds Acta Horticulturae
Petri J L Leite G B Couto M Gabardo G C and Haverroth F J (2014) Chemical induction of
budbreak New generation products to replace hydrogen cyanamide Acta Horticulturae 1042 159-166
Petri J L Leite G B and Hawerroth F J (2010) Time of Erger application for budbreak induction
in apple trees Acta Horticulturae 872 205-210
Samish R M (1954) Dormancy in woody plants Annual Review of Plant Physiology 5 183-204
Saure M C (1985) Dormancy release in deciduous fruit trees Horticultural Reviews 7 239-300
Volz R K Ferguson I B Hewett E W and Woolley D J (1994) Wood age and leaf area
influence fruit size and mineral composition of apple fruit Journal of Horticultural Science 69(2) 385-395
Wang S Y Steffens G L and Faust M (1986) Breaking bud dormancy in apple with a plant
bioregulator thidiazuron Phytochemistry 25(2) 311-317
White N (2016) Climate scenarios for pome fruit growing regions of Australia (2030 and 2050)
Queensland Australia Department of Agriculture and Fisheries
Zhang J and Taylor C (2011) The Dynamic Model Provides the Best Description of the Chill
Process on Sirora Pistachio Trees in Australia HortScience 46(3) 420-425
26 Dormancy-breaking sprays for low winter chill in apples
Appendix 1
PHENOLOGY DATA COLLECTION PROTOCOLS
11 Phenology Data
Phenology assessments will be performed to determine 5 green tip (apple) and full bloom
(80 open flowers) dates for apple varieties Regular visual assessments (Monday
Wednesday and Friday) will be made from just prior to budburst until flowering is
completed Assessments will be performed on a whole tree basis with only spur and terminal
buds and spur and terminal flower clusters assessed (axillary buds on one-year-old pome fruit
shoots are not included in the assessments)
12 Apple Phenology Collection Methods
Select five trees to monitor for each variety and rootstock (where applicable) under
investigation
Green tip
Prior to green tip count the number of buds (spur and terminal) on one of the
five selected trees and record
Compare the remaining four trees and estimate up or down the number of buds
on each tree If there is an obvious variation to the counted tree perform a full
count
Estimate green tip percentages by counting all buds at the green tip stage The
initial bud count will inform this For instance if the tree has 500 buds 25 buds
at green tip will indicate the tree is at 5
After the tree has reached 5 green tip make one more visit to ensure the
observation was correct
Flowering
Once flowering commences initially record the number of open flowers up to
50 This will be easier than calculating small percentages
Count the number of flower clusters on one tree Similarly to the bud count
estimate the number of clusters on the remaining four trees and make
adjustments up or down for differences between the trees
To estimate flowering percentage count the number of full clusters open by
estimating across clusters For instance if two clusters have halve the flowers
open that equates to one full cluster Estimate percentage open based on total
cluster number previously recorded
For very large trees (flower clusters greater than 1000) additional estimates
may need to be made to account for the size of the tree Follow the above
27 Dormancy-breaking sprays for low winter chill in apples
protocol for three representative branches (similar cluster distribution up the
branch as the tree) on each tree rather than the whole tree If the tree is less than 50 bloom counting the number of open clusters will be
easiest If more than 50 of flowers are open counting the number yet to bloom
will be easier
As a general rule round estimates to the nearest 5
13 Recording Phenology Data
An Excel based data collection pro forma has been developed to ensure data is recorded
consistently between sites Attachment A is an example of the data recording sheet
Dormancy-breaking sprays for low winter chill in apples 2016 28
Bud damage scale
Scale
0 No damage
1 Mild burning
Mild burning of bud scales but buds normally recover
2 Moderate damage
Buds likely to develop but some flowers too burnt to open some flowers undamaged
3 Severe burning
Buds do not develop usually results in bud death
Full Terms amp Conditions of access and use can be found athttpwwwtandfonlinecomactionjournalInformationjournalCode=tnzc20
Download by [The University Of Melbourne Libraries] Date 03 February 2016 At 1845
New Zealand Journal of Crop and Horticultural Science
ISSN 0114-0671 (Print) 1175-8783 (Online) Journal homepage httpwwwtandfonlinecomloitnzc20
Sun damage risk of Royal Gala apple in fruit-growing districts in Australia
R Darbyshire L McClymont amp I Goodwin
To cite this article R Darbyshire L McClymont amp I Goodwin (2015) Sun damage risk of RoyalGala apple in fruit-growing districts in Australia New Zealand Journal of Crop and HorticulturalScience 433 222-232 DOI 1010800114067120151034731
To link to this article httpdxdoiorg1010800114067120151034731
Published online 26 May 2015
Submit your article to this journal
Article views 41
View related articles
View Crossmark data
RESEARCH ARTICLE
Sun damage risk of Royal Gala apple in fruit-growing districts in Australia
R Darbyshirea L McClymontb and I Goodwinab
aFaculty of Veterinary and Agricultural Science University of Melbourne Melbourne Australia bDepartment ofEconomic Development JobsTraining and Resources Tatura Australia
(Received 17 November 2014 accepted 18 March 2015)
This study estimated minimum air temperatures for potential sun damage for sunburn browning (non-netted and netted) and sunburn necrosis (non-netted) for Royal Gala apple in Australia The approachestimated when conditions may be conducive to the development of sun damage in some fruit Theapproach provides a measure of potential damage This allows for more flexible analyses of potentialsun damage which current models are unable to produce due to data limitations The air temperaturethresholds determined were 341 and 387 degC respectively for browning and necrosis for non-nettedfruit and 379 degC for browning under netting These air temperature thresholds were applied acrosssouthern Australia from 1911ndash2013 demonstrating different risk profiles between sites inter-annualvariability and the benefit of installing netting via a reduction in potential damage days The resultscan be further extended to estimate impacts from climate change and assess the benefit of installingnetting to adapt to increasingly extreme hot weather
Keywords browning necrosis shade net sunburn sunscald
Introduction
Sun damage in apple occurs as the result ofexposure to high radiation loads (Schrader et al2003ab) and can reduce market yield by down-grading quality and increasing cullage Regionswith summers characterised by clear skies and hightemperatures such as southern Australia havehigh sun damage risk A heat wave event inJanuary 2009 in the Goulburn Valley in southeastAustralia provides an example with large yieldlosses incurred due to sun damage approximatedat 30ndash70 (Thomson et al 2014)
Sun damage can manifest in many formsSunburn necrosis (henceforth referred to as nec-rosis) appears as a dark penetrative burn and is athermal response with a fruit surface temperature(FST) of 52 plusmn 1 degC for 10 min sufficient to inducenecrosis of several apple varieties including Gala(Schrader et al 2001) Sunburn browning (hence-forth referred to as browning) is characterised by a
yellow brown bronze or dark tan spot on the sun-exposed side of the fruit (Schrader et al 2003aRacsko amp Schrader 2012) and results from a com‐bination of high FST and light exposure Forattached Gala apples fully exposed to sunlight on aclear day Schrader et al (2001) reported a thresholdFST of 478 degC for browning damage when FSTwas maintained at constant temperature for 60 min
In the context of future climate change andassociated rising summertime temperatures in‐creased risk of sunburn damage is highly likelyPredictions regarding changes to sun damage riskand evaluation of adaptation options are thereforeimportant for future planning This is particularlypertinent for Australia Currently in many ofAustraliarsquos pome fruit-growing regions extremeheat events are common with incidences of extremeheat days increasing historically (Alexander et al2007) Further it is expected that such events willcontinue to increase in both frequency and severity
Corresponding author Email rebeccadarbyshireunimelbeduau
New Zealand Journal of Crop and Horticultural Science 2015Vol 43 No 3 222ndash232 httpdxdoiorg1010800114067120151034731
copy 2015 The Royal Society of New Zealand
Dow
nloa
ded
by [
The
Uni
vers
ity O
f M
elbo
urne
Lib
rari
es]
at 1
845
03
Febr
uary
201
6
due to anthropogenically induced climate change(Alexander amp Arblaster 2009) Given the backdropof increasingly extreme climate conditions thisresearch aimed to develop potential sun damageincidences for Royal Gala apple using air temper-ature information for netted and non-netted fruit
Few studies have scaled up analyses of sundamage beyond the experimental unit due tocomplexities in determining precise climate andgrowing conditions that lead to sunburn damage onindividual fruit Schrader et al (2003b) consideredthe influence of several factors on FST includingair temperature radiation wind speed and relativehumidity Of these air temperature was found to bemost highly correlated to FST In a predictivemodel developed later Schrader (2014) addedcultivar fruit diameter and canopy density asadditional factors that influence the FST of apple
Developing a method to use air temperature as aproxy for potential sun damage provides a flexibleplatform for broader analyses both temporally andspatially Daily maximum temperatures are com-monly recorded by meteorological organisationsand are available for long historical periods andwith large spatial coverage Other climate vari-ables such as relative humidity are much lessavailable Furthermore climate projection informa-tion for temperature is more reliable and readilyavailable than for other climate variables (CSIRO2007) Restrictions in the application of an existingFST model (Schrader 2014) due to data availabilityare already apparent (Racsko amp Schrader 2012)supporting the need for a simplified but consideredapproach
The objective of this study was to identifyair temperature thresholds that have the potentialto lead to sunburn damage To determine thesethresholds two aspects must be known First theFST threshold that induces damage for this studyRoyal Gala apple was used and threshold valuesof 52 degC for necrosis and 478 degC for browningwere utilised following previous findings (Schra-der et al 2001) Second estimates of air tempera-tures required to reach FST thresholds need to bedetermined This aspect is the focus of this study
Materials and methods
Fruit surface temperature data
Two adjacent Royal Gala apple blocks one non-netted and one netted situated at Shepparton(3642degS 14546degE) in southeast Australia (Fig 1)were used for the experiment The trees wereplanted on MM106 rootstock using a central leadertrellis system with 20 times 45 m tree spacing Theexperiment was conducted in January 2013 In thisregion Royal Gala is usually harvested late Januaryto early February The nets (Grey Quad 14 NetProStanthorpe Queensland Australia) were installedat a height of 6 m above ground with open sidesThese nets provided an 18 reduction in incidentradiation and are in common use in parts ofAustralia
Ten trees in each of the non-netted and nettedblocks were selected Of these four trees in thenon-netted block and five trees (due to somesmaller tree sizes) in the netted block were usedto measure FST Thermocouple sensors (Type Tthermocouples Tranzflo NZ Palmerston NorthNew Zealand) were placed under the skin of 60fruit in both the non-netted and netted blocks (iea total of 120 sensors) The sensors were distrib-uted across the selected trees such that 20 sensorswere located in each of the upper middle and
110 120 130 140 150 160
minus50
minus45
minus40
minus35
minus30
minus25
minus20
Longitude
Latit
ude
BatlowYoung
Lenswood
Spreyton
Yarra Valley
Donnybrook
Applethorpe
Manjimup
Huonville
Shepparton
Figure 1 Spatial area investigated and sites used for ana‐lyses marks the study site for observations (Shepparton)
Sun damage risk of Royal Gala apple in fruit-growing districts in Australia 223
Dow
nloa
ded
by [
The
Uni
vers
ity O
f M
elbo
urne
Lib
rari
es]
at 1
845
03
Febr
uary
201
6
lower parts of the canopy for both the netted andnon-netted blocks Sensors were positioned to-wards the western side of the tree to increase thelikelihood of reaching FST damage thresholdsFST was logged at 1 min intervals (CR1000Campbell Scientific Logan Utah USA) Averageair temperatures were concurrently measured(HMP155 Vaisala Vantaa Finland) and loggedat 1 min intervals (Datataker DT80M ThermoFisher Scientific Yokohama Japan) in both thenon-netted and netted blocks Air temperaturesensors were shielded and positioned 15 m abovethe ground surface Both FST and air temperaturedata were logged from 8ndash29 January 2013
Observations of sun damage were conductedfor fruit on the 10 trees in the non-netted andnetted blocks Damage was classified at harvestbetween 24 January and 4 February 2013 asbrowning or necrosis following descriptions bySchrader et al (2003a)
Air temperature threshold analysis
A conservative approach was taken to determineminimum air temperature thresholds for potentialsun damage Air temperatures at FST for browning(478 degC) and necrosis (52 degC) thresholds (Schra-der et al 2001) were initially extracted for fruit inthe non-netted and netted blocks To accommodateFST that did not fall precisely on the threshold val‐ue a buffer of +02 degC was applied Specificallyair temperatures for FST between 478ndash480 degC
and 520ndash522 degC were extracted to represent brow‐ning and necrosis respectively
The 10th percentile of the air temperatures atthese FST threshold ranges was then calculatedThis value was used to represent the minimum airtemperature threshold required for fruit to reach anFST that can cause damage ie a conservativelylow air temperature threshold that can cause sundamage It was assumed that at the 10th percent-ile other conditions that moderate damage wereacting to increase the potential of damage ratherthan dampen For instance low wind conditionsThis was performed for browning and necrosisFST thresholds and for non-netted and netted data
Spatial analysis
Analysis of the total number of days in Januarywhere daily maximum temperatures crossed theminimum air temperature threshold for potentialdamage was conducted using historical spatialgridded data (005 times 005 deg) for southern Australiafrom 1911ndash2013 sourced from the Australian Bu‐reau of Meteorology These surfaces were producedthrough a combination of empirical interpolationand function fitting applied to Australiarsquos networkof quality controlled weather stations (Jones et al2009) Within the spatial data sets 10 locationssituated in important Australian pome fruit-growingdistricts were identified for individual site analyses(Fig 1 and Table 1)
Table 1 Location information January maximum temperature data (1911ndash2013) calculated using AWAP data set
LocationLatitude(degS)
Longitude(degE)
Mean January maximumtemperature (degC)
SD January maximumtemperature (degC)
Applethorpe 2862 15195 263 34Batlow 3552 14814 261 45Donnybrook 3358 11583 302 45Huonville 4301 14706 219 44Lenswood 3494 13879 254 58Manjimup 3418 11607 274 47Spreyton 4122 14635 210 26Shepparton 3633 14540 294 50Yarra Valley 3784 14568 252 55
AWAP Australian Water Availability Project SD standard deviation
224 R Darbyshire et al
Dow
nloa
ded
by [
The
Uni
vers
ity O
f M
elbo
urne
Lib
rari
es]
at 1
845
03
Febr
uary
201
6
Across the historical data set variation in thetotal number of potential sun damage days inJanuary was assessed for southern AustraliaDifferences in the number of potential damagedays between non-netted and netted results werecompared
Results
Air temperature thresholds
Prior to analysis exploration of FST data from the120 fruit was conducted Fruit were inspectedevery 2ndash3 days to ensure that the sensors were inplace In the event that a sensor had dislodged thesensor was reinstalled and the data for that sensorwas removed back to the time of the previousinspection Results from one thermocouple in thelower canopy from the non-netted block wereexcluded due to readings consistent with regularwetting from an irrigation emitter The numbers ofdata points available for analysis were 1330588and 1587606 for non-netted and netted fruitrespectively
Using these data air temperatures as related toFST for non-netted and netted fruit were consid-ered (Fig 2) A close relationship between FSTand air temperatures can be seen for cooler air
temperatures At higher FSTs greater variation inair temperatures was observed that is a wideningof the air temperature range at a particular FST
Non-netted and netted air temperatures thatrelated to necrosis (520ndash522 degC) and browning(478ndash480 degC) FST thresholds were extracted Thedistribution of air temperatures along these FSTthresholds are shown in Fig 3 No fruit recordedan FST above 52 degC under netting (Fig 2) andhence no estimates of air temperature thresholdswere evaluated for necrosis damage under netting
The 10th percentile of the extracted air tem-peratures was calculated providing a minimum airtemperature threshold at which sun damage mayoccur For browning in the non-netted and nettedblocks these values were 341 and 379 degCrespectively For non-netted necrosis damage theair temperature threshold was 387 degC
In January 2013 at Shepparton each of the airtemperature thresholds for potential damage wassurpassed several times (Table 2) Note that thefive necrosis damage days were also incorporatedin the potential browning days as the browningthreshold must be surpassed to reach the necrosisthreshold In comparing the total potential fordamage between netted and non-netted fruit therelative risk of damage under netting was 54 ofthat for the non-netted fruit
Observations of sun damage at the study siterecorded differences between non-netted and net-ted trees (Table 3) with lower levels of damagerecorded for fruit under netting (Table 3) A 50reduction of damage was found for fruit undernetting
Historical potential damage analysis
To further investigate the number of potential sundamage days historically and to provide visualisa-tion of risk across Australiarsquos pome fruit-growingregions the air temperature thresholds (Table 2)were applied to southern Australia (Fig 4) Increas-ing risk is observed from the south of the countryto the north A lowering of risk along the easternseaboard reflects the higher elevation in that part ofAustralia Notable variation across the historicaldata set was found (panels left to right in Fig 4)
Figure 2 Fruit surface temperature (degC) recordings andrelated air temperatures (degC) Necrosis and browningFST thresholds represent 52 and 478 degC respectively
Sun damage risk of Royal Gala apple in fruit-growing districts in Australia 225
Dow
nloa
ded
by [
The
Uni
vers
ity O
f M
elbo
urne
Lib
rari
es]
at 1
845
03
Febr
uary
201
6
representing the inter-annual variability in the num‐ber of potential damage days in January
The percentile levels can be taken to representdifferent risk likelihoods assuming the climatedata are sourced from a normal distribution In thisanalysis the 10th and the 90th percentiles repres-ent the low and high ends of the distribution of thedata while the 50th percentile is the median Forexample the 10th percentile value was 2 days forbrowning in the non-netted orchard at Shepparton(Table 4) This can be interpreted as a 1 in 10 yearevent that 2 or fewer damage days will be expe‐rienced Equally this indicates there is a 9 in 10
year chance of 2 or more damage days occurringUsing the upper end of the distribution the 90thpercentile indicates that receiving 12 or moredamage days is a 1 in 10 year event
Locations in cooler regions (Huonville Sprey-ton Applethorpe Batlow) rarely crossed the airtemperature thresholds required for potential sundamage The data indicate that none of these coolersites recorded a day above the air temperaturethreshold for browning under netting or necrosisfor non-netted fruit even at the 90th percentile ofthe data Batlow did record 4 days in January thatmay lead to browning in non-netted blocks at the
Browning minus Nonminusnetted
Air Temperature
Pro
babi
lity
FST = 478minus480 degCn=374
AT threshold = 341 degC
00
02
04
06
08
10
32 34 36 38 40 32 34 36 38 40
00
02
04
06
08
10
Browning minus Netted
Air Temperature
Pro
babi
lity
FST = 478minus480 degCn=36
AT threshold = 379 degC
00
02
04
06
08
10
32 34 36 38 40
Necrosis minus Nonminusnetted
Air Temperature
Pro
babi
lity
FST = 520minus522 degCn=27
AT threshold = 387 degC
Figure 3 Air temperature (AT) for FST which relates to browning in the open and under nets and for necrosis in theopen The 10th percentile of the AT data is shown by the arrow n = sample size
226 R Darbyshire et al
Dow
nloa
ded
by [
The
Uni
vers
ity O
f M
elbo
urne
Lib
rari
es]
at 1
845
03
Febr
uary
201
6
90th percentile which can be translated as a 1 in10 year event
Conversely other pome fruit-growing regionsrecorded consistent potential for sun damage Forinstance Donnybrook Shepparton and Young allrecorded potential damage days for browning innon-netted blocks for each percentile level Thiscan be interpreted for Donnybrook as a 9 in 10chance of at least 3 days in January reachingtemperatures that could lead to browning of non-netted fruit
The wide range in potential damage days atsome sites demonstrates strong inter-annual variab‐ility in the historical data For instance at Shep-parton it can be expected that 2ndash12 days (capturing80 of the historical data) in January could lead tobrowning damage for non-netted fruit
The benefit of netting in terms of reducing thetotal number of potential damage days for brown-ing is shown in Fig 5 Note this was not con‐sidered for necrosis as an air temperature thresholdfor necrosis under netting could not be defined
Again variability is present with a minimal benefitnoted in some years (10th percentile) whereas otheryears indicated great benefit (90th percentile)
The benefit of netting is clear when individualsites within Australiarsquos fruit-growing regions wereconsidered (Table 5) For sites with few instancesof potential browning these episodes werereduced to nil with netting (Batlow Huonville)For locations with greater potential for browningdamage substantial decreases in the total numberof potential damage days recorded (Young Don-nybrook Shepparton) For these sites particularlynotable gains for the more extreme of the histor-ical data (90th percentile) were found (Table 5)
Discussion
Using previously established FST thresholds forGala apple (Schrader et al 2001) air temperaturesthat relate to potential browning and necrosisdamage for non-netted and netted fruit wererecorded at a site in southeastern Australia Awide range of air temperatures were found at thespecified FST thresholds (Figs 2ndash3) This range inair temperatures for a given FST was expected andrepresents a combination of different factors Theseinclude different microclimate conditions surround-ing the fruit such as fluxes in relative humidity andwind speed variation in radiation received due tofruit positioning and leaf shading and fruit char-acteristics such as size
Appreciating this variability in air temperaturefor a given FST this study estimated minimum airtemperature thresholds for potential damage Thiswas achieved by taking the 10th percentile of airtemperatures at two FST thresholds that representbrowning and necrosis By taking this approach itwas assumed that other climate effects and fruitcharacteristics were combining to cause damageat these lower air temperatures Therefore the airtemperature thresholds determined were conser-vatively low and are indicative of when damagemay begin to occur on some fruit primarily themore vulnerable fruit The air temperature thresh-olds calculated should not be regarded as deter-ministic or a reflection of damage for a particularfruit or for all fruit in the orchard Rather the
Table 3 Percentage of fruit affected by sun damage fornon-netted and netted fruit harvest from 10 trees each
Browning () Necrosis () Total ()
Non-netted 130 30 160Netted 81 01 81
Table 2 Summary of total number of days for whichdaily maximum temperature exceeded each air temper-ature threshold for potential damage in January 2013 atShepparton
DamageAir temperaturethreshold (degC)
Number of days inJanuary 2013
Browning(non-netted)
341 13
Browning(netted)
379 7
Necrosis(non-netted)
387 5
Sun damage risk of Royal Gala apple in fruit-growing districts in Australia 227
Dow
nloa
ded
by [
The
Uni
vers
ity O
f M
elbo
urne
Lib
rari
es]
at 1
845
03
Febr
uary
201
6
thresholds are an indication of minimum airtemperatures at which sun damage may begin todevelop
Analyses of theminimumair temperature thresh‐olds were expanded across southern Australia for
1911ndash2013 to demonstrate the flexibility of theapproach Spatial patterns in the number of daysof potential damage follow a north-south gradientand vary with topography These analyses provideinsight into relative sun damage risk in opening of
110 120 130 140 150 160
minus50
minus45
minus40
minus35
minus30
minus25
minus20
10th Percentile
Longitude
Latit
ude
Browning minus Non-netted
0 5 10 15 20 25 30
110 120 130 140 150 160minus
50minus
45minus
40minus
35minus
30minus
25minus
20
50th Percentile
110 120 130 140 150 160
minus50
minus45
minus40
minus35
minus30
minus25
minus20
90th Percentile
110 120 130 140 150 160
minus50
minus45
minus40
minus35
minus30
minus25
minus20
Longitude
Latit
ude
0 5 10 15 20 25 30
110 120 130 140 150 160
minus50
minus45
minus40
minus35
minus30
minus25
minus20
Browning minus Netted
110 120 130 140 150 160
minus50
minus45
minus40
minus35
minus30
minus25
minus20
110 120 130 140 150 160
minus50
minus45
minus40
minus35
minus30
minus25
minus20
Longitude
Latit
ude
0 5 10 15 20 25 30
110 120 130 140 150 160
minus50
minus45
minus40
minus35
minus30
minus25
minus20
Necrosis minus Non-netted
110 120 130 140 150 160
minus50
minus45
minus40
minus35
minus30
minus25
minus20
Figure 4 Number of potential sun damage days in January for browning non-netted browning netted and necrosisnon-netted air temperature thresholds The 10th 50th and 90th percentiles of the data (1911ndash2013) are displayed leftto right The colour-bar legend is measured in number of days
228 R Darbyshire et al
Dow
nloa
ded
by [
The
Uni
vers
ity O
f M
elbo
urne
Lib
rari
es]
at 1
845
03
Febr
uary
201
6
new areas for production or shifts in varietal mixesat established growing regions
For selected fruit-growing regions it was foundthat some sites are more exposed to potential sundamage risk than others This was expected withcooler regions (Spreyton Huonville Applethorpe)illustrating very little risk For warmer regions(Donnybrook Shepparton Young) greater poten-tial riskmdashthat is total number of potential damagedaysmdashwas accompanied by substantial inter-annual variability Considering potential browningfor non-netted fruit at Young there is a 1 in 10 yearchance that 16 days or more in January will be
conducive to browning (90th percentile) equallythere is a 1 in 10 year chance of 1 day or less inJanuary being conducive to browning (10th per-centile) Managing this variability in potential riskis important to maintain yield and quality
These broader analyses both historically andspatially illustrate the flexibility for investigativeanalyses of sun damage using the air temperaturethresholds determined to estimate conditions thatare conducive to damage This approach over-comes the data access limitations of more detailedmodels that require greater data inputs (Thorpe1974 Evans 2004 Schrader 2014) The methods
Table 4 Distribution of potential damage days in January for sites in Australiarsquos growing regions for 10th 50th and90th percentiles of the data
Browning non-netted Browning netted Necrosis non-netted
Site 10th 50th 90th 10th 50th 90th 10th 50th 90th
Spreyton 0 0 0 0 0 0 0 0 0Huonville 0 0 1 0 0 0 0 0 0Applethorpe 0 0 2 0 0 0 0 0 0Batlow 0 0 4 0 0 0 0 0 0Yarra Valley 0 2 5 0 0 1 0 0 1Manjimup 0 3 5 0 0 2 0 0 1Lenswood 0 3 6 0 0 2 0 0 1Young 1 7 16 0 1 5 0 05 4Shepparton 2 6 12 0 1 5 0 1 4Donnybrook 3 7 11 0 1 3 0 05 2
Figure 5 Reduction in the number of potential browning damage days for January across 1911ndash2013 due to nettingThe colour-bar legend is measured in number of days
Sun damage risk of Royal Gala apple in fruit-growing districts in Australia 229
Dow
nloa
ded
by [
The
Uni
vers
ity O
f M
elbo
urne
Lib
rari
es]
at 1
845
03
Febr
uary
201
6
used here prioritised generalisation rather thanspecificity As such only general remarks aboutchanges in potential conditions for damage can bemade To interpret damage to individual fruit useof multivariate models is still required
These thresholds could be used to consider therisk of sunburn damage under future climates asonly maximum temperatures are required to estim-ate conditions that may lead to damage Assess-ments considering netted and non-netted thresholdscould be conducted to highlight any increasingprotection offered by shade netting Note this wouldonly be possible for browning damage as this studywas unable to determine a necrosis air temperaturethreshold as fruit did not reach the required FST fordamage Finally the air temperature thresholds canbe used by growers as a guide for when to useoverhead sprinklers for evaporative cooling inefforts to minimise potential damage
These results have illustrated the benefit ofshade netting in lowering sun damage risk (Table 5and Fig 5) Previous investigations have shownthat shade nets are effective in decreasing sundamage by reducing incident solar radiation (Igle-sias amp Alegre 2006 Gindaba amp Wand 2008) Inthis study a reduction in the number of days ofpotential browning was quantified across Australia(Fig 5) Using Young as an example a decrease of1ndash11 days of potential damage (for 80 of the
historical data) was found reducing the number ofpotential damage days by 68ndash100
This benefit of netting needs to be balancedagainst other possible drawbacks For instance DoAmarante et al (2011) found a reduction in redcoloration and lower firmness values of Royal Galaunder netting Changes to management practicessuch as use of reflective mulch would assist incombating some of these implications An import-ant limitation of installing netting is the expense InAustralia the initial capital cost of erecting nettinghas been estimated at AU$40000 per hectare(Lolicato 2011) For sites with minimal reductionin sun damage with the installation of netting(Applethorpe Batlow) investing in netting maynot be practical although the other benefits thatnetting provides such as a reduction in hail and birddamage should be considered in decision-makingprocesses
Assessments of sun damage rates on the experi-mental trees (Table 3) provide support for the airtemperature thresholds Using the estimated airtemperature thresholds it was determined that forJanuary 2013 there were 13 and 7 days (Table 2)with potential for damage for non-netted and nettedfruit respectively Therefore the potential for dam-age under the nets was predicted to be 46 lowerthan for non-netted fruit This was broadly sup-ported in the damage assessments with a 50reduction found in browning of fruit under netsOther effects may have influenced the observeddamage rates including temperatures experiencedduring December which were not included in theanalysis Additionally the total predicted potentialdamage days may have identified individual days asdamage days that did not lead to any observed fruitdamage As damage assessments occurred at har-vest this cannot be determined
In interpreting these results appreciation ofthe assumptions in the methodology is neededFST thresholds used in this study were determinedin North America (Schrader et al 2003b) Higherultraviolet radiation conditions are experienced inAustralia compared with the northern hemispheredue to lower ozone protection For this reason thetransferability of FST thresholds between hemi-spheres was questioned by Racsko amp Schrader
Table 5 Difference in total number of potentialbrowning days between open and netted fruit Bracketedis the percentage reduction from open values
Site10th
percentile50th
percentile90th
percentile
Spreyton 0 (NA) 0 (NA) 0 (NA)Huonville 0 (NA) 0 (NA) 1 (100)Applethorpe 0 (NA) 0 (NA) 1 (53)Batlow 0 (NA) 0 (NA) 4 (100)Yarra Valley 0 (NA) 2 (100) 4 (80)Manjimup 0 (NA) 2 (67) 4 (80)Lenswood 0 (NA) 2 (67) 5 (83)Young 1 (100) 5 (71) 11 (68)Shepparton 2 (85) 4 (67) 7 (60)Donnybrook 2 (67) 5 (71) 9 (82)
NA indicates no browning events for fruit in the open
230 R Darbyshire et al
Dow
nloa
ded
by [
The
Uni
vers
ity O
f M
elbo
urne
Lib
rari
es]
at 1
845
03
Febr
uary
201
6
(2012) Further research following Schrader et al(2003b) is required to assess if there are differ-ences in FST thresholds between the northern andsouthern hemispheres
In order to extend the results of this study theair temperature threshold values found for Shep-parton were expanded across southern AustraliaOther sites may have weather conditions thatcombine differently than those at Shepparton todetermine FST The conservative approach takenhere should act to minimise potential underesti-mates of damage rates with field observationsneeded for verification of transferability of theseair thresholds
Conclusion
This study determined theminimum air temperaturethresholds that represent potential for sun damagefor Royal Gala apple in non-netted (browning andnecrosis) and netted (browning) blocks Resultswere constructed using a conservative approachindicating when damagemay start to occur for somefruit in the orchard Application of the approachspatially and temporally was demonstrated provid-ing historical context for sunburn damage riskand assessment of relative risk between locationsSuch an analysis has not been previously possibledue to data limitations of more detailed sundamage models The protection offered by nettingwas interpreted and the relative benefits of installa-tion demonstrated Using the methods in this studyto determine air temperature thresholds furtherresearch is possible including expansion to othervarieties assessments of climate change impactsand the use of shade netting as an adaptationstrategy
Acknowledgements
We thank Joerg Klein (Geoffrey Thompson Orchards PtyLtd) for orchard access to conduct this experiment Thisstudy was supported by funding from the VictorianDepartment of Economic Development Jobs Transportand Resources Horticulture Innovation Australia Ltdand the Australian Government Department of Agricul-ture using the apple and pear industry levy and matchedfunds from the Australian government
Disclosure statementNo potential conflict of interest was reported by theauthors
References
Alexander LV Arblaster JM 2009 Assessing trends inobserved and modelled climate extremes overAustralia in relation to future projections Interna-tional Journal of Climatology 29 417ndash435
Alexander LV Hope P Collins D Trewin B Lynch ANicholls N 2007 Trends in Australiarsquos climatemeans and extremes a global context AustralianMeteorological Magazine 56 1ndash18
CSIRO 2007 Climate change in AustraliamdashTechnicalReport 2007 Melbourne CSIRO and Bureau ofMeteorology 148 p
Do Amarante CVT Steffens CA Argenta LC 2011Yield and fruit quality of lsquoGalarsquo and lsquoFujirsquo appletrees protected by white anti-hail net ScientiaHorticulturae 129 79ndash85
Evans RG 2004 Energy balance of apples underevaporative cooling Transactions of the AmericanSociety of Agricultural Engineers 47 1029ndash1037
Gindaba J Wand SJE 2008 Comparison of climateameliorating measures to control sunburn on lsquoFujirsquoapples Acta Horticulturae 772 59ndash64
Iglesias I Alegre S 2006 The effect of anti-hail nets onfruit protection radiation temperature quality andprofitability of lsquoMondial Galarsquo apples Journal ofApplied Horticulture 8 91ndash100
Jones D Wang W Fawcett R 2009 High-qualityspatial climate data-sets for Australia AustralianMeteorological and Oceanographic Journal 58233ndash248
Lolicato S 2011 Sun protection for fruit a practical man‐ual for preventing sunburn on fruitmdash2011 VictoriaDepartment of Primary Industries 43 p
Racsko J Schrader LE 2012 Sunburn of apple fruithistorical background recent advances and futureperspectives Critical Reviews in Plant Sciences31 455ndash504
Schrader L 2014 Interactive sunburn model http horttfrecwsuedupagesSunburn (accessed 6 October2014)
Schrader L Sun J Felicetti D Seo J Jedlow L Zhang J2003a Stress-induced disorders effects on applefruit quality Proceedings of the Washington TreeFruit Postharvest Conference Wenatchee WAPp 1ndash7
Schrader L Zhang J Duplaga W 2001 Two types ofsunburn in apple caused by high fruit surface (Peel)temperature Plant Health Progress doi101094PHP-2001-1004-01-RS
Sun damage risk of Royal Gala apple in fruit-growing districts in Australia 231
Dow
nloa
ded
by [
The
Uni
vers
ity O
f M
elbo
urne
Lib
rari
es]
at 1
845
03
Febr
uary
201
6
Schrader L Zhang JG Sun JS 2003b Environmentalstresses that cause sunburn of apple Acta Horti-culturae 618 397ndash405
Thomson G McCaskill M Goodwin I Kearney GLolicato S 2014 Potential impacts of rising global
temperatures on Australiarsquos pome fruit industry andadaptation strategies New Zealand Journal of Cropand Horticultural Science 42 21ndash30
Thorpe MR 1974 Radiant heating of apples Journal ofApplied Ecology 11 755
232 R Darbyshire et al
Dow
nloa
ded
by [
The
Uni
vers
ity O
f M
elbo
urne
Lib
rari
es]
at 1
845
03
Febr
uary
201
6
Agricultural and Forest Meteorology 226ndash227 (2016) 148ndash160
Contents lists available at ScienceDirect
Agricultural and Forest Meteorology
j o ur na l ho me pag e wwwelsev ier com locate agr formet
How hail netting reduces apple fruit surface temperature Amicroclimate and modelling study
Malcolm R McCaskill alowast Lexie McClymontb Ian Goodwinb Steve GreencDebra L Partingtona
a Department of Economic Development Jobs Transport and Resources Hamilton Centre Private Bag 105 Hamilton Victoria 3300 Australiab Department of Economic Development Jobs Transport and Resources Tatura Centre Private Bag 1 Tatura Victoria 3616 Australiac Plant and Food Research Tennent Drive Palmeston North New Zealand
a r t i c l e i n f o
Article historyReceived 6 October 2015Received in revised form 6 April 2016Accepted 22 May 2016
KeywordsSun damageSunburnUV-BRoyal galaNettingFruit temperature
a b s t r a c t
High fruit temperatures compromise fruit quality and cause production losses in the apple industry Insouth-eastern Australia orchardists have begun investing in netting because of empirical evidence thatit reduces these losses but the magnitude of its effect and mechanisms responsible have not yet beenquantified Models of fruit temperature based on meteorological conditions could inform the design ofnetting structures and improve tactical management to reduce sun damage through treatments such asprotective sprays and the use of overhead irrigation to cool fruit The objectives of this study were firstlyto measure the effect of netting on fruit surface temperature and secondly to test the thermodynamicSmart-Sinclair model The study was conducted near Shepparton Victoria in an orchard where therewere adjacent netted and non-netted sections During late afternoon when sun damage normally occursnetting was able to reduce the median fruit surface temperature by 15ndash20 C but there was a greaterreduction in maximum fruit surface temperature of 40 C The model required calibration to accountfor turbulence in the transfer of heat from fruit to the surrounding air The optimised model was ableto predict fruit surface temperature with a root mean square error of 2ndash4 C The mechanism for thereduction in fruit surface temperature was by reducing the intensity of the solar beam in the late afternoonby interception and scattering which more than offset the potential fruit heating effect of netting thatoccurs through a reduction in internal orchard wind speed
Crown Copyright copy 2016 Published by Elsevier BV All rights reserved
1 Introduction
Fruit exposed to high temperatures while growing on the treesuffers reduced quality particularly in apples (Malus domestica(L)) Reports from South Africa USA Australia and New Zealandsuggest that pack-house culls of 10 could be expected in typicalseasons (Bergh et al 1980 Schrader et al 2004 Wuumlnsche et al2001) but losses can be much higher as these estimates do notinclude severely damaged fruit that is not picked In Australia applegrowers estimate typical losses to vary from 6 to 30 depend-ing on season and fruit variety (Lolicato 2011) Following someyears of high losses orchardists have begun investing in netting
lowast Corresponding authorE-mail addresses malcolmmccaskillecodevvicgovau
(MR McCaskill) lexiemcclymontecodevvicgovau (L McClymont)iangoodwinecodevvicgovau (I Goodwin) stevegreenplantandfoodconz(S Green) debrapartingtonecodevvicgovau (DL Partington)
as a risk reduction strategy because of empirical evidence that itreduces these losses but the magnitude of its effect and mecha-nisms responsible have not yet been quantified
Schrader et al (2003) identified fruit surface temperaturethresholds at which two types of damage occurs At a threshold ofbetween 46 and 49 C sunburn browning occurs which consists ofdiscolouration of the sun-exposed peel that reduces the saleabilityand storage life of the fruit The threshold is cultivar-dependentand requires a combination of both high temperatures and solarradiation Protecting fruit from exposure to ultraviolet radiationgreatly reduces the occurrence of sunburn browning (Schrader2011) At a threshold of 52 C sunburn necrosis occurs in whichepidermal and subepidermal cells die leaving a necrotic spot on thesun-exposed side of the fruit This type of damage can occur in theabsence of solar radiation if the temperature threshold is reachedFruit surface temperatures are dependent not only on the air tem-perature but also solar radiation that heats the sun-exposed fruitsurface and wind that removes heat from the surface Under condi-tions of high solar radiation and low wind speeds the sun-exposed
httpdxdoiorg101016jagrformet2016050170168-1923Crown Copyright copy 2016 Published by Elsevier BV All rights reserved
MR McCaskill et al Agricultural and Forest Meteorology 226ndash227 (2016) 148ndash160 149
surface of fruit can be up to 15 C warmer than air temperature(Schrader et al 2003)
Several thermodynamic models have been developed to cal-culate temperatures in spherical fruit such as apples Internallythese models use similar parameters and equations Thorpe (1974)described a thermodynamic model of apple surface temperaturewhich included the effects of solar radiation wind and the conduc-tion of heat to the shaded side of the fruit This model developedfurther by Smart and Sinclair (1976) who presented a series ofequations that solve for the temperature of the most sun-exposedsurface of spherical fruit known as the ldquohot-spotrdquo Since exces-sive hot-spot temperatures are sufficient to downgrade the entireapple this is the most useful parameter to model Later Evans(2004) described a model that calculated the surface temperature ofapples under evaporative cooling Sauderau et al (2007) presenteda 3-dimensional model that calculated temperatures at all parts ofellipsoid fruit Cola et al (2009) described a model of grape tem-perature which was validated at several sites in Italy while Li et al(2014) built on previous models and tested it on apples in Washing-ton State USA Apart from Cola et al (2009) and Li et al (2014) thesemodels have only had limited field validation and none have beentested under netting Potential uses of a validated model includeboth tactical and strategic management Tactically fruit surfacetemperature could be calculated from numerical weather forecastsso protective sprays can be applied prior to heat events or evapora-tive cooling used when fruit surface temperature reaches a damagethreshold Strategically the value of investment in infrastructuresuch as netting or evaporative cooling systems could be investi-gated with consideration of future climate change scenarios
The objectives of this study were firstly to measure the effectof hail netting on fruit surface temperature and orchard microcli-mate secondly to test the thermodynamic Smart-Sinclair modeland thirdly to quantify the mechanisms by which netting reducessun damage
2 Material and methods
Briefly fruit surface temperatures were measured in adjacentnetted and non-netted areas of a commercial orchard Simulatedfruit surface temperature was calculated using a modified ver-sion of the thermodynamic model developed by Smart and Sinclair(1976) using either microclimate measurements taken within theorchard or surrogates derived from standard weather data mea-sured external to the orchard Table 1 summarises parameters usedin the model and symbols used in this paper
21 Field measurements
Fruit surface temperatures of Royal Gala apples were moni-tored at two sites (ldquonettedrdquo and ldquonon-nettedrdquo) within a commercialorchard located north of Shepparton Australia The majority of theorchard was covered by permanent hail netting except for five rowsin the eastern side The netting (Grey Quad 14 NetPro Pty Ltd Stan-thorpe Qld Australia) had a 10 shade rating and was installed 6 mabove the ground with open sides We refer to the product as ldquohailnettingrdquo because its primary purpose is to protect from hail andto distinguish it from shade-cloth that has shade ratings of 16ndash80(NetPro 2010) Fruit surface temperatures were monitored from 8January 2013 until the first fruit were harvested on 24 January 2013At each site 60 fruit were selected from 4 trees 20 fruit were inthe upper canopy 20 in the middle and 20 in the lower canopyMonitored fruit were selected from fruit on the western sides oftrees that would be exposed to direct radiation in the afternoonin the expectation that maximum daily fruit surface temperaturesnormally occur in the mid-afternoon between 1430 and 1645 h
(Schrader et al 2003) Copper-constantan thermocouples (Type TTranzflo NZ Ltd Palmerston North New Zealand) were insertedunder the fruit skin on the sun-exposed face Data were logged byfour data loggers (CR1000 Campbell Scientific Logan Utah USA)at each site at 1 min intervals The target of 60 monitored fruit wassometimes not achieved because of datalogger difficulties somesensors becoming dislodged from the fruit and because two log-gers were not installed until 15 January On the 2 hottest days (forwhich detailed data are reported later in the paper) 44 fruit weremonitored under netting and 38 in the non-netted orchard on 11January while the equivalent numbers were 59 and 58 respec-tively on 17 January The diameters of the monitored fruit wererecorded on 11 16 and 23 January 2013 Fruit were harvestedcounted and weighted between 24 January and 4 February 2013from 10 trees each in the netted and non-netted sites includingthe 4 trees logged for temperature Fruit harvested from the 4 treeslogged for temperature were visually assessed for sunburn damageDamage was classified as (i) minor sunburn browning (ii) majorsunburn browning (iii) necrosis or (iv) photo-oxidative sunburn(Racsko and Schrader 2012)
The microclimate was monitored at the netted and non-nettedsites and data logged (DataTaker DT80M Thermo Fisher ScientificInc Yokohama Japan) at 1 min intervals Air temperature (Tair C)and humidity (HMP155 Vaisala Oyj Vantaa Finland) were mea-sured at 15 m height with the sensor mounted in a cylindricalwhite aluminium screen Wind speed (v ms) was measured bycup anemometers (PA2 Wittich and Visser Rijswijk Netherlands)in the lower middle and upper canopy at heights of 1 2 and3 m Diffuse and total radiation (Rdf and Rs Wm2) and ultraviolet-B (UV-B Wm2 280ndash315 nm) were monitored above the canopyat 3 m height (SPN1 Delta T Devices Cambridge UK SKU430Skye Instruments Llandrindod Wales) Adjacent to the orchard theexternal environment was logged (6004C-21 STARLOG UnidataOrsquoConnor Australia) at 10 min intervals Humidity and Tair (HMP45A-T Vaisala Oyj Vantaa Finland) were measured at 15 m heightwith the sensor mounted in a cylindrical white aluminium screenA cup anemometer (Wind sensor compact Thies Clima GottingenGermany) was used to measure v at 2 m height Data from the exter-nal weather station were only available 8ndash29 January whereas datafrom the orchard weather stations were available 1ndash31 JanuaryPotential evapotranspiration (ETo mm) was calculated on a 10 mintimestep from weather data measured in the netted and non-nettedorchards by the FAO56 equations of Allen et al (1998)
At both the netted and non-netted sites trees were irrigatedby microjet sprinklers spaced midway between trees and approxi-mately 03 m above the soil surface Trees were 15 m apart trainedon a central leader system in rows 48 m apart and rows wereoriented NNW-SSE (345) Tree age variety rootstock and man-agement did not differ between the netted and non-netted siteswith the exception of increased irrigation flow rates in the non-netted area All management activities (irrigation fertilisation andweed and pest control) were undertaken by staff of the commercialorchard
22 Fruit temperature modelling
Smart and Sinclair (1976) proposed the following algebraic solu-tion to calculate the instantaneous temperature increment aboveTair on the sun-exposed surface of the fruit (Tmax C) as
Tmax = I0 (1 minus ) (ks + 4hr)(rh + ks) 4h
(1)
where I0 is incident solar radiation received by a fruit surface per-pendicular to the solar beam (Wm2) the reflectance of the fruitsurface (albedo) ks the thermal conductivity of the fruit (W(m C))h the heat transfer coefficient from the fruit surface to the atmo-
150 MR McCaskill et al Agricultural and Forest Meteorology 226ndash227 (2016) 148ndash160
Table 1Symbols used in this paper and source of the values used
Symbol Units Explanation Valuessource
Unitless fraction Reflectance of the fruit surface 04 Merzlyak et al (2003)d Days Day number (1 Jan = 1) Calculateddr Relative units Relative inverse distance between the earth and sun
(range 0967ndash1033)Calculated according to equation 23 of Allenet al (1998)
D m Fruit diameter Measuredı m Thickness of the boundary layer of still air at the fruit
surfaceEquation 5 of this paper based on Nobel (1975)
ETo mm Potential evapotranspiration Calculated according to Equation 6 of Allenet al (1998)
f Unitless factor Calibration factor FittedGsc Wm2 Solar constant 1367 Wm2 Allen et al (1998)h W(m2 C) Heat transfer coefficient Equation 5b of Smart and Sinclair (1976)I0 Wm2 Solar radiation received on a fruit surface normal to
the solar beamEquation 2 of this paper based on Smart andSinclair (1976)
ka W(m C) Thermal conductivity of air 255 W(m C) Smart and Sinclair (1976)ks W(m C) Thermal conductivity of the fruit Equation 9 of Smart and Sinclair (1976)r m Fruit radius MeasuredRa Wm2 Extraterrestrial solar radiation on a plane horizontal to
the earthrsquos surfaceCalculated by equation 28 of Allen et al (1998)
Rs Wm2 Total solar radiation measured on a plane horizontal tothe earthrsquos surface
Measured
Rdf Wm2 Indirect solar radiation measured on a plane horizontalto the earthrsquos surface
Measured
RUVB Wm2 Solar radiation in the ultraviolet-B band 280ndash315 nm MeasuredTair
C Air temperature MeasuredTfrmx
C Temperature of the hottest face of sun-exposed fruit inthe orchard
Measured
TmaxC Difference between fruit surface temperature and air
temperatureCalculated from measurements and equation 1of Smart and Sinclair (1976)
v ms Wind speed Measuredzd degrees Zenith angle of the sun (degrees from vertical) Calculated according to Jacobson (2005)zr radians Zenith angle of the sun (radians from vertical) Calculated according to Jacobson (2005)
sphere (W(m2 C)) and r the radius of the fruit (m) In our studyI0 was calculated as
Io = GscdrRs minus Rdf
Ra+ Rdf 2 (2)
where Gsc (Wm2) is the solar constant dr the inverse relative dis-tance between the earth and the sun Rs total radiation measuredabove the canopy on a horizontal plane Ra (Wm2) extra-terrestrialradiation on a horizontal plane and Rdf diffuse radiation measuredon a horizontal plane above the canopy In Eq (2) it is assumedthat the sunlit fruit face was exposed to only half the Rdf measuredon a horizontal plane (Smart and Sinclair 1976) The terms Gsc dr
and Ra were calculated according to Allen et al (1998) Reflectance(˛) was set at 04 based on data from Merzlyak et al (2003) whoreported a range from 035 for dark red fruit to 045 for pale fruitThermal conductivity of fruit (ks) is related to apple temperatureand was calculated as
ks = 0297 + 00024Tfrmx (3)
based on Lisowa et al (2002) where Tfrmx is the temperature ofthe hottest face of sun-exposed fruit in the orchard calculated in theprevious iteration (see Eq (7) below) The heat transfer coefficienth was calculated as
h = ka
ı+ 2kaD (4)
where ka is the thermal conductivity of the air 00257 W(m2 C)ı the thickness of the boundary layer of still air at the surface ofthe hot-spot of the fruit (m) and D the fruit diameter (m) ı wasestimated from v and D by an equation based on Nobel (1975)
ı = f
(028
radicD
v+ 25
v
)(5)
where f is a calibration factor Values of v were set to a minimumvalue of 05 ms to avoid division by zero D was calculated frommeasurements of fruit diameter interpolated by a linear regressionrelationship between measurement dates
D = (5784 + 02133d)100
(6)
where d is the day number (1 January = 1) Preliminary runs ofthe model indicated that without a calibration factor ı was toohigh resulting in insufficient heat transfer from the fruit surfaceto the surrounding air and simulated fruit surface temperatureswere much higher than observed The model was calibrated usinga range of values of f from 01 to 10 in increments of 005 and cal-culating the root mean square error (RMSE) of differences betweencalculated fruit surface temperatures and the maximum fruit sur-face temperature in each 10 min period The optimum value of fwas that with the lowest RMSE A similar approach was used byCola et al (2009) in calibrating aerodynamic roughness to mea-sured fruit temperature in grapevines from wind speeds measuredat a weather station external to the vineyard Separate values of fwere sought for the netted and non-netted sites with v measuredeither at 3 m height within each orchard or at the weather stationexternal to the orchard The first half of the data set from 9 to 15January 2013 was used for model calibration and the remainingdata was used for validation Since the monitored fruit were onlyexposed to the afternoon sun only data from 1400 to 1700 h wereused for calibration and validation
The temperature of the hottest face of sun-exposed fruit in theorchard (Tfrmx C) was then calculated as
Tfrmx = Tmax + Tair (7)
where Tair (C) is the measured air temperature and Tmax thesimulated difference between air temperature and fruit surfacetemperature Calculations were performed on a 10 min timestep
MR McCaskill et al Agricultural and Forest Meteorology 226ndash227 (2016) 148ndash160 151
Table 2Harvested yield fruit weight and sunburn damage from the netted and non-nettedsites in the orchard and the statistical significance of differences
Netted Non-netted Significance
Total fruit yield (tha) 346 373 0564Fruit weight (gfruit) 153 125 lt0001Minor sunburn browning ( by weight) 77 104 0014Major sunburn browning ( by weight) 04 26 0007Necrosis ( by weight) 01 30 0003Photo-oxidative sunburn ( by weight) 02 07 0135Total damage ( by weight) 83 167 0002Yield of undamaged fruit (tha) 317 311 0282
but final output was calculated as a moving average of the previous30 min to compensate for the lack of thermal mass in the equations
23 Supplementary site
To test its structure and calibration modelled Tfrmx was com-pared with measurements taken at a supplementary site east ofShepparton Measurements were made in a commercial Royal Galaorchard without netting in which trees were planted at 25 m spac-ing in rows 50 m apart and irrigated at the tree base by microjetsprinklers This site was part of a larger study of evaporative cooling(Green et al 2011) and data reported here are for 3 apples withoutcooling on the north-west side near the top of the canopy whereprotective foliage had been removed Copper-constantan thermo-couples were inserted beneath the north-west facing surface ofsun-exposed apples on 27 January 2011 and temperatures mon-itored until harvest on 10 February Temperatures were measuredat 10-s intervals and logged (CR1000 Campbell Scientific LoganUtah USA) at a 1-min frequency Fruit diameter was measuredon 25 January and 7 February In a nearby clearing surrounded byorchards an automatic weather station recorded air temperaturesolar radiation and wind speed at a 2 m height at a 15-min fre-quency Solar radiation was measured at 2 m height using a siliconphotodiode pyranometer (SK01D Carter-Scott Design BrunswickAustralia) PAR was measured at 2 m height using a silicon photo-diode quantum sensor (PAR sensor Tranzflow Palmerston NorthNew Zealand) Air temperature and humidity were measured ata 15 m height (HMP 45A-T Vaisala Vantaa Finland) mountedin a cylindrical white aluminium screen Wind speed was mea-sured using a 3-cup anemometer at 2-m height (AN2 MonitorSensors Caboolture Australia) Measurements were taken every30 s and the average calculated and stored at 15-min intervals in adata logger (DT500 Datataker Scoresby Australia) Supplementarywind measurements were also taken from the Irrigateway network(httpawsdataitcsiroau8000idstationTATR) These measure-ments were taken at a 2 m height on an exposed site at the TaturaResearch Station operated by the Department of Economic Devel-opment Jobs Transport and Resources
24 Statistical analysis
Fruit yield and sunburn damage data from each tree were com-pared by one-way analysis of variance Residuals were checked fornormality and homogeneity of variance No transformations wererequired on any of the variables Solar radiation observations inthe netted orchard were compared with the non-netted orchard bymeans and descriptive linear regression with a focus on the after-noon (1400ndash1700 h) when the risk of sun damage is greatest Datafor Tair relative humidity and v from the netted and non-nettedorchards were compared with the weather station external to theorchard using a combined linear regression with the site (netted ornon-netted) as a factor This enabled the orchard microclimate tobe estimated from weather data external to the orchard
Since the model requires some non-standard weather dataparameters relationships were sought to predict these fromstandard parameters Prediction equations of these non-standardparameters ndash Rdf in the non-netted orchard and both Rdf andRs under netting ndash were sought by linear regression from 10 minweather data collected between 1 and 15 January 2013 using rela-tionships of the form
Rdf
Rs= a + b
Rs
Ra+ c
1AM
+ d(
Rs
Ra
) (1
AM
)
Rs
Ragt e (8)
where the coefficients a b c d and e are derived from the regres-sion and AM the air mass number to account for solar angle effectsThe RsRa component of this function was based on Spitters et al(1986) who recommended a series of split line relationships to esti-mate Rdf Rs from RsRa According to these relationships underheavy cloud (low RsRa) the proportion of total radiation that isdiffuse (Rdf Rs) is not influenced by RsRa up to a break point afterwhich there is a linear relationship with RsRa The term AM is usedin astronomy and the solar power industry to describe the pathlength of the solar beam in the atmosphere relative to a direct ver-tical path and was calculated by an empirical function of Kastenand Young (1989)
AM = 1(cos zr + 0050572(607995 + 90 minus zd)minus16364 (9)
where zr and zd are the zenith angle of the sun in radians anddegrees respectively The value of AM ranges from close to 1 whenthe sun is overhead to over 10 at dawn or dusk The inverse ofAM was used in the regression analyses because the attenuationof the solar beam through scattering and absorption would beexpected to follow an inverse relationship with path length Sim-ilar effects would be expected as the solar beam passes throughnetting To determine parameters the Genstat split line regres-sion procedure was first used to estimate e independent of AMThis set a break point for the split line relationship and belowthis threshold the break point value of Rdf Rs was used Valuesof RsRain excess of e were then selected to determine the otherparameters using generalised linear regression A similar approachwas used to estimate netted RsRa from non-netted RsRa but nobreak point was required Since the intent was to develop esti-mates at times of risk of sun damage input values were constrainedto times when Ra exceeded 380 Wm2 to avoid refractive effectsthat occur close to dawn and dusk when the sun is near the hori-zon This constraint limited data to 0640ndash1800 h in mid-JanuaryAnother required constraint was to remove 10 min periods whenRs exceeded clear-sky radiation which was assumed to be 08 RaThese periods occurred when Rs included radiation reflected fromclouds and could at times predict negative values of Rdf Statisticalanalyses were conducted using Genstat (14th Edition VSN Interna-tional Hemel Hempstead UK) Model predictions were comparedwith measurements by the root mean square error (RMSE)
25 Sensitivity analysis
Sensitivity of the model to its inputs was tested by varying indi-vidual parameters by either the range reported in the literature orfor weather parameters the range measured in our study between1400 and 1700 h The range for was from 01 (Sauderau et al2007) to 06 (Evans 2004) ks from 028 to 054 W(m C) (Smartand Sinclair 1976 Donsi et al 1996 Lisowa et al 2002) v from 01to 34 ms Rs 60ndash1040 Wm2 Rdf 50ndash580 Wm2 and Tair 15ndash42 Cwhile D was varied from 0049 to 0080 m based on measurementsof individual fruit The parameters not varied were taken from thetime of maximal Tfrmx during the study which was from the non-netted orchard from 1610 to 1620 h on 17 January 2013
152 MR McCaskill et al Agricultural and Forest Meteorology 226ndash227 (2016) 148ndash160
3 Results
31 Sunburn damage and fruit yield
Fruit in the non-netted orchard had twice the rate of sunburndamage as that in the netted orchard (17 vs 8) (Table 2) The great-est differences were in the major sunburn browning and necrosiscategories Total fruit yield in the non-netted orchard was 8 higherthan with netting but the yield of undamaged fruit was 2 lowerThese differences in fruit yield were not statistically significantbecause of a relatively high coefficient of variation between indi-vidual trees of 29 Fruit harvested from the non-netted orchardwere smaller than those with netting (125 vs 153 g)
32 Fruit surface temperatures
Measured Tfrmx were up to 144 C higher than Tair with net-ting during the afternoon and up to 167 C without netting butat night the differences were small (Fig 1) The two days with thehighest Tfrmx were the 11th of January (a clear day) and the 17thof January (a partly cloudy day) As the days with the greatest riskof sun damage these were examined in greater detail The proba-bility distribution of the maximum temperature achieved in eachmonitored fruit for these days shows that with netting the mediantemperature was 15ndash23 C cooler with netting than without butthat the maximum temperature was 40 C cooler (Fig 2) On theclear day (11 January) 45 of non-netted fruit exceeded the thresh-old of 46 C at which sunburn browning occurs (Schrader 2011)compared with only 9 under netting However on the partlycloudy day (17 January) the proportions exceeding the thresholdwere much higher at 79 without netting and 32 with nettingMeasured Tfrmx on the clear day showed a broad peak in the lateafternoon whereas on the partly cloudy day there was a seriesof sharp peaks (Fig 3) These peaks coincided with short periodsof high solar radiation between clouds The upper quartile of fruitsurface temperature peaked late in the afternoon at 1600ndash1700 h
33 Netted vs non-netted microclimates
Microclimate differences between the netted and non-nettedorchards are addressed here first for the entire month of Januarythen in greater detail for the two days when the highest fruit sur-face temperatures were recorded Averaged across all afternoons inJanuary 2013 the netted orchard had 15 less total radiation thanthe non-netted orchard 32 lower UV-B and a 13 lower potentialevapotranspiration but 20 more diffuse radiation (Table 3) Forthe whole month of January 2013 potential evapotranspiration wasalso 13 lower under netting than without (159 vs 183 mmmonth)
Descriptive linear regressions of radiation parameters duringthe afternoon between the netted and non-netted orchards showeda high level of correlation with R2 values of between 0881 and0987 (Table 3) All slopes and intercepts were statistically signif-icant (P lt 0001) indicating that there were significant differencesin radiation parameters between the environments
Fig 1 Measured (blue) and simulated (red and orange) fruit surface tempera-ture of the hottest face of sun-exposed fruit (Tfrmx) and orchard air temperature(green) at (a) netted and (b) non-netted with simulated Tfrmx calculated from windspeeds measured external to the orchard Simulated temperatures are shown in redbetween 1400 and 1700 h and orange at other times Arrows show spikes in simu-lated values at times of low wind speed and high direct radiation before 1000 andafter 1700 h (For interpretation of the references to colour in this figure legend thereader is referred to the web version of this article)
In the afternoon v at the netted site was lower (22ndash24) at a 3 mmeasurement height but there were no significant differences inTair (Tables 4 and 5) At night the netted orchard was more humidthan the non-netted orchard and had lower v
Predictive relationships for Rdf and Rs under netting based on Eq(8) showed root mean square errors of between 17 and 71 Wm2
(Table 6) In each case all the slopes and intercepts were statisticallysignificant (P lt 0001) Using these relationships for a theoreticalclear day (defined as RsRa = 075) in mid-January netting reducedRs by 10 at 1230 h but by 20 at 1620 h Equivalent reductions inIo were 22 and 26 respectively
On the clear day Rs closely followed the pattern of Ra but onthe cloudy day the pattern was spikey with short periods whenRs was up to 13 greater than at the same time on the clear day
Table 3Summary of differences in afternoon radiation and ETo (1400 and 1700 h Eastern Australian Standard Time) between netted and non-netted environments 1ndash31 January 2013compared by their arithmetic mean and linear regression as y = a + bx where y is the parameter under netting a the intercept b the slope and x the parameter withoutnetting
Parameter Means Regression
Netted Non-netted Difference () Intercept Slope R2
Global radiation (Rs Wm2) 616 726 minus15 minus677 0941 0982Diffuse radiation (Rdf Wm2) 141 117 20 631 0666 0881Ultraviolet radiation-B (UV-B Wm2) 126 184 minus32 minus00734 0723 0997Reference evapotranspiration (ETo mmhr) 047 054 minus13 minus00046 0924 0987
MR McCaskill et al Agricultural and Forest Meteorology 226ndash227 (2016) 148ndash160 153
Fig 2 Cumulative probability distribution of the maximum fruit surface temperature measured in non-netted and netted sections of the orchard on (a) a clear day (11January 2013) and (b) a partly cloudy day (17 January 2013)
Fig 3 Fruit surface temperature (Tfr ) measured in the netted and non-netted sections of the orchard showing the maximum upper quartile median and minimum and thesimulated orchard maximum modelled from weather data according to Eq (7) for a clear day (11 January) and a partly cloudy day (17 January)
Table 4Summary of air temperature humidity and wind speed during afternoons (1400ndash1700 h Eastern Australian Standard Time) and nights (2000ndash0500 h) in the netted orchardnon-netted orchard and external environment 8ndash29 January 2013
Parameter Afternoon Night
Netted Non-netted External Netted Non-netted External
Air temperature (C) 317 322 301 171 173 179Relative humidity () 293 275 263 698 660 622Wind speed (ms)3 m 122 156 055 0842 m 080 074 266 030 023 1701 m 020 035 004 006
(Fig 4) On the clear day without netting about 10 of radiationwas in the diffuse form whereas under netting it was 17 Thepercentage of Rs transmitted through the net was similar on bothdays and ranged from 89 at midday to about 60 close to dawn ordusk Estimated Io reached a broad maximum around the middle ofthe day after which it declined more rapidly under netting than in
the non-netted orchard At a height of 3 m v was about 20 lowerunder netting but there was little difference in Tair (Fig 5) At bothsites there were low wind speeds in the evening and night On 17January these nearly calm conditions had started by 1725 h Differ-ences between the netted and non-netted environments close tothe time of maximum fruit surface temperature are summarised in
154 MR McCaskill et al Agricultural and Forest Meteorology 226ndash227 (2016) 148ndash160
Table 5Microclimate in the netted and non-netted sites expressed as a linear function of readings at the weather station external to the orchard where environment (netted ornon-netted) was a factor in the analysis Significance of differences between netted and non-netted in intercept or slope are shown as for P lt 0001 for P lt 001 forP lt 005 minus for P lt 01 ns for not significant
Afternoon (1400ndash1700 h) Night (2000ndash0500 h) All hours
Intercept Slope R2 Intercept Slope R2 Intercept Slope R2
Air temperature (C)Netted 109 0967 0987 minus024 0938 0962 minus133 1024 0978Non-netted 158 0968 minus124 1009 minus139 1047Difference 049 0001 minus101 0070 minus006 0022Significance of difference ndash ns ns
Relative humidity ()Netted 685 0953 0987 1050 0956 086 783 0983 0951Non-netted 482 0959 minus014 1075 344 1003Difference minus203 0005 minus1064 0119 minus439 0020Significance of difference ns
Wind speed (ms)Netted 3 m minus012 0477 0912 minus018 0468 0918 minus018 0476 0917Non-netted 3 m minus018 0627 minus016 0642 minus016 0633Difference minus005 0150 002 0174 002 0157Significance of difference ns ns ndash Netted 2 m minus024 0370 0824 minus018 0307 0832 minus021 0337 0800Non-netted 2 m minus002 0254 minus012 0220 minus012 0267Difference 023 minus0116 007 minus0088 009 minus0069Significance of difference Netted 1 m minus002 0072 0476 minus004 0049 0622 minus005 0069 0486Non-netted 1 m 008 0083 minus005 0069 minus005 0105Difference 011 0011 minus001 0019 000 0036Significance of difference ns ns
Table 6Predictive relationships calculated from the calibration period (1ndash15 January) based on Eq (8) to estimate global radiation under netting as a proportion of extraterrestrial(RsRa) diffuse radiation as a proportion of global (Rdf Rs) in netted and non-netted environments and the root mean square error (RMSE) and predictive error of therelationships in estimating Rs and Rdf between 0700 and 1800 h for the validation period (16ndash31 January 2013)
Parameter orcoefficient in Eq (7)
Global radiation as a proportion of extraterrestrial(RsRa)
Diffuse radiation as a proportion of global radiation(Rdf Rs)
Netted Netted Non-netted
Split line regressione 0396 0391Rdf Rs at breakpoint 0830 0855No of observations 1017 1017R2 0918 0932
Generalised linear modela 0049 0715 0506b 0546 minus0507 minus0391c minus0079 1088 1515d 0400 minus1684 minus217No of observations 1016 896 896R2 0982 0761 0754
Overall relationship (validation period)RMSE (Wm2) 171 506 712Predictive error (Wm2) 131 241 351
Table 7 On both days between 1610 and 1620 h netting reduced Ioby 26
34 Calibration of the model
Without calibration the model consistently over-predictedTfsmx by an average of 66 C but the calculated values were highlycorrelated with measurements (R2 = 087 data not shown) To cor-rect this over-prediction a calibration factor (f) was applied to v(wind speed) because the relationship between wind speed andheat transfer to the atmosphere was the least well-defined com-ponent of the model The model was first fitted to v measured at3 m height at each site within the orchard This achieved minimumRMSErsquos of 21 and 26 C (Fig 6a) for netted and non-netted orchardsrespectively Secondly the model was fitted to measurements of vmeasured at a height of 2 m external to the orchard which achievedslightly lower RMSErsquos (20 and 23 C respectively) and optimised
at the same calibration factor for both the netted and non-nettedorchards (Fig 6b) Since the second option fitted the data moreclosely and could be calculated from wind speeds from externalto the orchard which are more commonly measured than internalorchard wind speeds this option was used for most simulationsreported in this paper
Measured and simulated Tfrmx showed close agreement on mostdays during the afternoon between 1400 and 1700 h but before andafter these times there were short term spikes in simulated Tfrmx
that were not observed in the measured data (Fig 1) These spikesoccurred before 1000 h and after 1700 h during periods of low windspeed high direct solar radiation and a high angle of incidence ofthe sunrsquos rays (zd gt 36 from zenith before 1000 h and zd gt 76 after1700 h)
Simulated and measured Tfrmx were closely matched between1400 h and 1700 h when fruit were exposed to direct sunlight(Fig 3) However simulated temperatures exceeded measurements
MR McCaskill et al Agricultural and Forest Meteorology 226ndash227 (2016) 148ndash160 155
Fig 4 Solar radiation on a clear day (11 January 2013) and a cloudy day (17 January 2013) showing calculated extraterrestrial radiation (Ra) global radiation measured abovethe plant canopies of netted (Rsnet ) at netted and non-netted sites (Rsnnet ) and diffuse radiation (Rdfnet and Rdfnnet) (a b) Also shown is the percentage of global radiationrecorded above the plant canopy of the non-netted and netted orchards that was in the diffuse form (Rdf Rs) the percentage of global radiation that was transmitted throughthe net (RsnetRsnnet) (c d) and the estimated intensity of the solar energy received on a fruit surface perpendicular to the solar beam (I0) (e f)
in the morning and early evening when the measured fruit wereshaded
35 Model validation from standard weather data
Since in-orchard weather data are rarely available for long-termmodelling studies Tfrmx was also calculated for validation purposesfrom standard weather data using the coefficients in Tables 5 and 6to estimate Tair Rdf and Rs in the netted orchard The externalweather station was used for Tair and v but it was assumed thatglobal radiation measured above the canopy at the non-netted sitewas equivalent to that measured outside the orchard Using thesesurrogates there was only a small increase (02ndash06 C) in RMSE rel-ative to in-orchard weather data (Table 8) This applied to both thecalibration and validation periods
36 Supplementary site
The model was run using weather data from the supplemen-tary site and compared Tfrmx measured at this site between 1400and 1700 h (Fig 7a) (f = 045 optimised for the main site) Themodel tended to over-predict early in the data set followed by
under-prediction later and achieved an overall RMSE of 63 COver-prediction occurred on afternoons with low wind speed andunder-prediction on afternoons of high wind speed a relationshipthat accounted for 67 of variation (data not shown) Optimisingf to this data set reduced the RMSE to 57 C (f = 033) but therewas still a strong relationship between over-prediction or under-prediction and wind speed The closest fit between predicted andmeasured was achieved using wind speed data from Tatura whichachieved an RMSE of 38 C (f = 092) (Fig 7b)
37 Sensitivity analysis
The sensitivity analysis showed that among plant parametersTfrmx was most strongly affected by followed by much smallereffects of D and ks (Table 9) Among weather parameters Tfrmx wasmost affected by Tair followed by Rs v and Rdf The sensitivity analy-sis was also used to test the impact of the reduction in v associatedwith netting and potential offsets A 25 decrease in v increasedfruit surface temperatures by 22 C but this increase could be off-set by either a 16 reduction in total radiation or a 58 increasein the proportion of total radiation in the diffuse form (data notshown)
156 MR McCaskill et al Agricultural and Forest Meteorology 226ndash227 (2016) 148ndash160
Fig 5 Air temperature (a b) and wind speeds (c d) at the netted and non-netted sites and at a weather station external to the orchard on 11 and 17 January 2013
Table 7Summary of differences between the non-netted and netted environments and external to the orchard close to the time of maximum fruit surface temperature between1610 and 1620 on 11 and 17 January 2013 Values are the mean of 1 min readings
11 Jan (clear day) 17 Jan (cloudy day)
External Non-netted orchard Netted orchard Difference () External Non-netted orchard Netted orchard Difference ()
Extraterrestrial radiation Ra
(Wm2)883 883 883 861 861 861
Total measured solar radiationRs (Wm2)
679 572 minus16 769 652 minus15
Diffuse radiation Rdf (Wm2) 87 114 31 175 187 7Direct radiation (Wm2) 572 425 minus26 592 441 minus25Radiation perpendicular to the
sunlit face of fruit Io (Wm2)967 749 minus26 971 761 minus26
Diffuse radiation relative toglobal ()
13 20 56 23 29 26
Ultraviolet B radiation UV-B(Wm2)
146 100 minus31 158 104 minus34
Relative humidity () 10 13 15 10 14 14Wind speed at 3 m (ms) 16 11 minus28 12 13 13Wind speed at 2 m (ms) 238 09 07 minus17 291 07 09 37Wind speed at 1 m (ms) 06 03 minus56 04 02 minus39Fruit surface temperature (C) (C) (C)Simulated 496 472 minus24 516 488 minus28Measured maximum 520 467 minus53 531 479 minus52Measured upper quartile 463 447 minus17 485 460 minus26Measured median 450 437 minus13 465 444 minus22Measured lower quartile 425 418 minus07 450 427 minus23Measured minimum 399 393 minus06 415 401 minus14Air temperature (C) 387 387 384 minus03 40 407 400 minus07
4 Discussion
41 Fruit damage and yield
A higher fruit yield in the non-netted orchard was offset by amuch higher percentage of sunburn damage than in the netted
orchard (17 vs 8) leading to a 2 reduction in the yield of undam-aged fruit This difference in yield was not statistically significantand would require confirmation through studies with a larger sam-ple size The 2-fold difference in the percentage of fruit affected bysunburn was consistent with the difference in the percentage ofmonitored fruit that exceeded the sunburn browning threshold of
MR McCaskill et al Agricultural and Forest Meteorology 226ndash227 (2016) 148ndash160 157
Table 8Root mean square error (C) for fruit surface temperature calculated using the optimum value of the calibration factor (f ) for each data set for 3 combinations of weatherdata with and without netting for the calibration period (9ndash15 January) and validation period (16ndash29 January)
Source of weather data Data period
Total radiation Diffuse radiation Air temperature Wind speed f Calibration Validation
RMSE (C)Netted orchardin-orchard weather station Netted Netted Netted Netted 02 210 355in-orchard and external weather station Netted Netted Netted External 045 201 310standard weather data Externala External External External 045 224 343difference between in-orchard and standard weather data 023 033Non-netted orchardin-orchard weather station Non-netted Non-netted Non-netted Non-netted 025 260 367in-orchard and external weather station Non-netted Non-netted Non-netted External 045 227 309standard weather data Externala External External External 045 288 353difference between in-orchard and standard weather data 061 044
a The source data for total radiation (Rs) were made above the canopy in the non-netted orchard and assumed to be equivalent to that measured externally
Table 9Sensitivity analysis of predicted fruit surface temperature calculated from in-orchard weather readings based on standard weather data values between 1610 and 1620 hon 17th of January 2013
Values Change in Tfrmx (C)
Low Standard High Low High
Apple reflectance () 01 04 06 623 minus419
Apple thermal conductivity (ks) (Wm2) 028 042 054 083 minus057
Fruit diameter (D) (m) 0049 0060 0080 minus080 096
Wind speed (v) (ms) 01 12 34 952 minus692
Total radiation (Rs) (Wm2) 60 768 1040 minus1461 523
Diffuse radiation (Rdf ) (Wm2) (Rs held constant) 50 175 580 168 minus548
Air temperature (Tair ) (C) 150 407 420 minus2539 126
46 C on the hottest day of the study 17 January 2013 (79 vs 32)Monitored fruit were only on the west-facing side of the rows thatwould be exposed to the afternoon sun and were representativeof the half of the apple crop at risk of sun damage An unexpecteddifference was that fruit from the non-netted orchard were smaller(125 vs 153 g) most likely due to differences in crop load (fruit num-ber per tree) The Gala variety used in this study is intermediatein its susceptibility to sunburn relative to other cultivars (Schraderet al 2001 Schrader et al 2008) A more comprehensive samplingregime during harvest would be required to quantify the effects ofnetting on yield and sunburn damage for each cultivar
42 Model performance
The model fitted measured Tfrmx at both the netted and non-netted sites with an RMSE of sim2 C in the calibration period andsim3 C in the validation period which is similar to previouslyreported models in orchards or vineyards without netting (Evans2004 Cola et al 2009 Li et al 2014) While a physically-basedmodel would ideally require no calibration and be based on quan-tities that are directly measureable this was not the case here Themost imprecisely defined process is the transfer of heat from thefruit surface to the air through a boundary layer of still air adjacentto the fruit surface The thickness of this boundary layer (ı) hasnever been directly measured but has either been back-calculatedfrom heat transfer characteristics or estimated from measure-ments of v by semi-empirical relationships (eg Cola et al 2009 Liet al 2014) The equations used by Smart and Sinclair (1976) werebased on an experiment of Nobel (1975) in which fruit were heatedby artificial radiation under laminar air flow and ı inferred fromheat transfer characteristics at various wind speeds Under fieldconditions turbulent air flow alters these relationships and Nobel(1975) recommended empirical modifications suited to vineyardsHowever trellised apple orchards have taller rows of trees andwould be expected to have greater turbulence relative to horizon-
tal wind flow than vineyards Although wind flow in the horizontalplane was measured by anemometers within the orchard thesedata produced a poorer fit to observed fruit surface temperaturethan those measured at an exposed site adjacent to the orchardFurther resolution of the physics of heat transfer from the fruit sur-face to the air would require sensors such as sonic anemometerswhich measure air flow in 3 dimensions However for use in a semi-empirical model it appears Tfrmx was more strongly related to windmeasurements taken at the more exposed measurement site exter-nal to the orchard than those taken with cup anemometers close tothe monitored fruit Likewise at the second site a closer fit to fruittemperature measurements was achieved using wind data from anexposed site 18 km away at Tatura than a relatively sheltered siteclose to the orchard A similar calibration approach was undertakenby Cola et al (2009) in a study of vineyard temperatures in Italy Itis therefore simpler to calibrate directly between fruit temperatureand v measured by a cup anemometer at a standardised weatherstation location
The model produced short-term ldquospikesrdquo of high fruit surfacetemperature in the morning before 1000 and in the late afternoonafter 1700 h This occurred during short periods of nearly calm con-ditions when the model calculated a low value of h in Eq (2) Thesespikes occurred outside the times when sun damage would nor-mally be expected (1430ndash1645 h Schrader et al 2003) and couldcause spurious results should the model be run on long-term orautomated weather data To avoid such problems we suggest theuse of a time-based filter that only utilises Tfrmx between 1000 and1700 h for the following reasons Firstly the sun angle after 1700 h(gt60 from zenith) means most fruit are becoming fully or partiallyshaded by leaves while those fully exposed to the sunrsquos rays areunlikely to receive the direct beam of the sun long enough to causedamage According to Schrader et al (2001) sunburn browningrequires exposure to temperatures exceeding the varietal thresh-old for 30ndash60 min for its full development Secondly spikes after1700 h were over-predicted relative to measurements (eg Fig 4)
158 MR McCaskill et al Agricultural and Forest Meteorology 226ndash227 (2016) 148ndash160
Fig 6 Root mean square error of fruit surface temperature (C) during afternoons(1400ndash1700 h) between 9 and 15 January 2013 in response to the calibration factor(f) calculated from wind speed measured (a) within the orchard at a height of 3 mand (b) adjacent to the orchard at a height of 2 m Arrows show optimum values
This could be because the thermocouples were not installed on theface perpendicular to the sun at this time of day or because Eq (2)overestimates the strength of the solar beam at high solar zenithangles Thirdly UV-B levels are low and likely to cause much lessdamage at the same fruit temperature than earlier in the afternoonbecause after 1700 h UV-B levels declined to less than 25 of that atmidday Morning spikes in simulated Tfrmx were noted until 1000 hafter which wind speeds tended to increase and spikes no longeroccurred Sun damaged apples were observed on the eastern sideof the row but we were unable to determine the time this damageoccurred because our equipment was installed on the western sideof the row It is unlikely temperatures above the damage thresholdswould occur prior to 1000 h or after 1700 h without also occurringbetween these times Since predicted Tfrmx in the early morning orlate afternoon and evening is poorly validated and less likely to bedamaging we suggest that only values between 1000 and 1700 hshould be used in long term modelling
It should be noted that these times are in Eastern AustralianStandard Time and that solar noon at this site occurred at 1230 hbecause it is 474 west of the centre of the time zone Appropriateadjustments would need to be made for other sites such as outlinedby Allen et al (1998)
The sensitivity analysis showed that among plant parameters had the largest effect on Tfrmx Most previous studies that reported did not indicate how the value was measured The only sourcethat reported methods was Merzlyak et al (2003) who undertookmeasurements post-harvest Across the visible range averaged035 for dark coloured apples to 045 for pale apples Commercially-available clay sprays reduce Tfrmx by increasing particularly at
Fig 7 Supplementary site measured (blue) and simulated (red and orange) fruitsurface temperature of the hottest face of sun-exposed fruit (Tfrmx) and orchard airtemperature (green) Simulated Tfrmx calculated from wind speeds (a) in a clear-ing surrounded by orchards and f = 045 (optimised to the main site) and (b) at anexposed site at Tatura and f = 092 (optimised to this data set) Simulated temper-atures are shown in red between 1400 and 1700 h and orange at other times (Forinterpretation of the references to colour in this figure legend the reader is referredto the web version of this article)
shorter wavelengths that are more damaging to the skin (Gindabaand Wand 2005) In our study we initially used an value of 055which resulted in an optimum f value of 07 whereas using a moredefensible value of 04 resulted in an optimum f value of 045 Whilein a semi-empirical model an inappropriate value of one parameteris resolved by a compensating calibration factor there are risks thatthe model performs poorly under conditions that differ from its cal-ibration because the physical processes are not simulated correctlyTo resolve this area of uncertainty there is need to undertake morecomprehensive measurements of during fruit development andover a wider range of wavelengths
43 Effects of hail netting
Hail netting reduced the fruit temperature by 15ndash30 C acrossmost of the probability distribution but for the hottest fruit ateach site within the orchard the difference was 40 C The mech-anism for this effect of netting was by reducing the intensity ofthe solar beam by interception and scattering while allowing goodair flow to enable transfer of heat from the fruit surface to theair The netting structure at the study site represented an idealdesign for minimising sun damage because it was installed highabove the tree canopy and had open sides minimising interfer-ence to air circulation within the orchard and air exchange withthe outside Despite this design the netted orchard had internalwind speeds that averaged 22ndash24 lower than the non-netted siteaveraged across all afternoons in January 2013 (Tables 4 and 5) A
MR McCaskill et al Agricultural and Forest Meteorology 226ndash227 (2016) 148ndash160 159
wide range of designs are used commercially including temporarynets placed over the trees retractable netting installed on struc-tures above the tree canopy and fixed netting with closed or opensides (Lolicato 2011) Some designs could potentially exacerbaterather than reduce sun damage if wind is substantially reduced Thesensitivity analysis showed that if netting caused a 25 reductionin wind speeds this could without other changes to the heat bal-ance increase fruit temperatures by 22 C To maintain fruit surfacetemperatures equivalent to the non-netted orchard would requireeither a decrease in total radiation of 16 or if total radiation isunchanged the proportion in the diffuse form needs to increase by58 Until recently hail protection has been the primary rationalefor investment in netting followed by protection from fruit batsand birds Where the latter is required the sides would need to beclosed but this could reduce internal v leading to increased fruittemperatures From principles developed in this study a designthat uses a more open netting on the sides would minimise theseproblems
While the netting intercepted only 10ndash11 of Rs at solar noonthis is not the time maximum protection is required for two rea-sons Firstly the NNW-SSE row orientation and training structuremeant that a high proportion of fruit were shaded by leaves at thistime of the day Secondly air and fruit temperatures on hot daystend to peak in the late afternoon Our study showed that peakfruit surface temperatures occurred between 1600 and 1700 h atwhich time netting intercepted and scattered a greater proportionof Rs than at midday Protection from radiation at solar noon wasconsistent with its 10 shade rating but at 1620 h when the solarangle was 52 its shading effect was greater (15ndash20) and therewas an even greater reduction in radiation perpendicular to thefruit surface at the hot spot (26) Excessive shading needs to beavoided because it reduces the development of red colour in thefruit (Gindaba and Wand 2005) The main protection from sundamage is therefore required between approximately 1600 and1700 h when netting is over twice as effective in controlling thesurface heating effect of the sun than would be expected from itsshade specifications For this reason hail netting with a 10 shaderating represents a good compromise between protection from hailand sun damage while minimising its effects on fruit colour devel-opment
Our data are a comprehensive comparison of microclimate withand without netting From it we were able to develop equations topredict the netted microclimate from external measurements butthese are only directly applicable to the particular design colourand weave type at the study site Predictive equations could beobtained over a relatively short period (two weeks) through theuse of 10 min data which for radiation were based on measuredRs relative to Ra (as recommended by Spitters et al (1986)) andthe air mass number as a representation of the sun angle Thesound physical basis of these equations means the approach shouldbe applicable to developing relationships for other structures andweave types from relatively short periods of data However thephysical nature of this modelling approach is also a weaknessbecause a large amount of weather data must be assembled attime scales of at least hourly in addition to site-specific rela-tionships between wind measurement locations and fruit surfacetemperature The role of this level of modelling is in understandingprocesses and quantifying the effects of various netting structureswhich can differ in weave type colour height and the presence orabsence of side netting For many applications a simpler approachwould be more suitable For example Darbyshire et al (2015) useddata from our study to identify the external air temperature atwhich fruit surface temperature exceeded a sunburn browningthreshold in 10 of monitored fruit This was determined as 379 Cwith netting and 341 C without netting These thresholds werethen used to assess the benefits of netting in Australiarsquos apple grow-
ing regions for a range of climate change scenarios (Darbyshireet al 2015 Webb et al 2016) Their findings are however spe-cific to the netting design used in our study and the approach islimited in investigating the effects of other management optionssuch as canopy architecture row orientation leaf density and theirinteraction with netting design
Netting was associated with other changes to the agro-ecological environment including reduced ETo higher humidityand lower wind speeds Under netting ETo was 13 lower thanat the non-netted site which would lead to a reduced irrigationrequirement The combination of higher humidity and lower v isa potential disbenefit because it is associated with a longer dura-tion of leaf wetness (Kim et al 2002) which in turn leads to ahigher disease risk The most economically significant disease ofapples is apple scab (Venturia inaequalis) which is a fungus that forlight infection requires at least 12 h of continuous leaf wetness at13 C and longer periods at lower temperatures (Vaillancourt andHartman 2000) The netted environment therefore had a benefitthrough a lower irrigation requirement but there was also a dis-benefit through a greater risk of fungal diseases that may requiremore frequent control measures
5 Conclusions
This study found that netting was able to reduce the median fruitsurface temperatures by 15ndash20 C The mechanism for this effectof netting was by reducing the intensity of the solar beam by inter-ception and scattering while allowing sufficient air flow to enabletransfer of heat from the fruit surface to the air An adaptation ofa previously published thermodynamic model was able to accountfor these differences with an RMSE of 2ndash3 C in the afternoon whensun damage most commonly occurs but in the morning or earlyevening it appeared to over predict fruit temperatures during timesof low wind speed
Acknowledgements
This project was funded by the Department of Economic Devel-opment Jobs Transport and Resources (DEDJTR) the AustralianGovernment Department of Agriculture and Horticulture Innova-tion Australia Limited using the apple and pear industry levy andmatched funds from the Australian Government We thank JoergKlein (Geoffery Thompson Orchards Pty Ltd) for permitting us touse their orchard We also thank Eileen Perry and Des Whitfield(DEDJTR) for valuable discussions during the development of thispaper
References
Allen RG Pereira LS Raes D Smith M 1998 CropEvapotranspirationmdashGuidelines for Computing Crop WaterRequirementsmdashFAO Irrigation and Drainage Paper 56 Food and AgriculturalOrganisation of the United Nations Rome
Bergh O Franken J Van Zyl EJ Kloppers F Dempers A 1980 Sunburn onapples preliminary results of an investigation conducted during the 1978ndash79season Deciduous Fruit Grower 30 8ndash22
Cola G Failla OK Mariani L 2009 BerryTonemdasha simulation model for the dailycourse of grape berry temperature Agric For Meteorol 149 1215ndash1228
Darbyshire R McClymont L Goodwin I 2015 Sun damage risk of Royal Galaapple in fruit-growing districts in Australia New Zeal J Crop Hortic Sci 43 (3)222ndash232
Donsi G Ferrari G Nigro R 1996 Experimental determination of thermalconductivity of apple and potato at different moisture contents J Food Eng 30263ndash268
Evans RG 2004 Energy balance of apples under evaporative cooling Trans ASAE47 1029ndash1037
Gindaba J Wand JE 2005 Comparative effects of evaporative cooling kaolinparticle film and shade net on sunburn and fruit quality in apples HortScience40 592ndash596
Green S Goodwin I Cornwall D 2011 Over-tree sprinkler cooling to reducesunburn on fruit Aust Fruitgrow 5 (10) 12ndash14
160 MR McCaskill et al Agricultural and Forest Meteorology 226ndash227 (2016) 148ndash160
Jacobson MZ 2005 Fundamentals of Atmospheric Modeling 2nd ed CambridgeUniversity Press p 317
Kasten F Young AT 1989 Revised optical air mass tables and approximationformula Appl Opt 28 4735ndash4738
Kim KS Taylor SE Gleason ML Koehler KJ 2002 Model to enhancesite-specific estimation of leaf wetness duration Plant Dis 86 179ndash185
Li L Peters T Zhang Q Zhang J Huang D 2014 Modeling apple surfacetemperature dynamics based on weather data Sensors 14 20217ndash20234
Lisowa H Wujec M Lis T 2002 Influence of temperature and variety on thethermal properties of apples Int Agrophys 16 43ndash52
Lolicato S 2011 Sun Protection for Fruit a Practical Manual for PreventingSunburn on Fruitmdash2011 Department of Primary Industries Farm ServicesVictoria Division Melbourne Australia
Merzlyak MN Solovchenko AE Gitelson AA 2003 Reflectance spectralfeatures and non-destructive estimation of chorophyll carotenoid andanthocyanin content in apple fruit Postharvest Biol Technol 27 197ndash211
NetPro 2010 Product Data Sheet Commercial Horticultural Shade Cloth (accessed220615) httpwwwnetprocanopiescomdocuments-pdfproductsheetsDataSheets OzSmartShade CommHortRangepdf
Nobel PS 1975 Effective thickness and resistance of the air boundary layeradjacent to spherical plant parts J Exp Bot 26 120ndash130
Racsko J Schrader L 2012 Sunburn of apple fruit historical background recentadvances and future perspectives Crit Rev Plant Sci 31 455ndash504
Sauderau M Sinoquet H Santin O Marquier A Adam B Longuenesse JJGuilioni L Chelle M 2007 A 3-d model for simulating the spatial andtemporal distribution of temperature within ellipsoid fruit Agric ForMeteorol 147 1ndash15
Schrader LE 2011 Scientific basis of a unique formulation for reducing sunburnof fruits HortScience 46 6ndash11
Schrader LE Zhang J Duplaga WK 2001 Two Types of Sunburn in AppleCaused by High Fruit Surface (peel) Temperature Plant Health Progress(accessed 020616) httpswwwplantmanagementnetworkorgpubphpresearchsunburn
Schrader L Zhang J Sun J 2003 Environmental stresses that cause sunburn ofapple Acta Hortic 618 397ndash405
Schrader L Sun J Zhang J Seo J Jedlow L Felicetti D 2004 Fruit SkinDisorders Proc 100th Annu Meeting Washington State Hort Association p 4(last accessed 160212) httppostharvesttfrecwsueduPC2004Epdf
Schrader LE Sun J Zhang J Felicetti D Tian J 2008 Heat and light-inducedapple skin disorders causes and prevention Acta Hortic 772 51ndash58
Smart RE Sinclair TR 1976 Solar heating of grape berries and other sphericalfruits Agric Meteorol 17 241ndash259
Spitters CJT Toussaint HAJM Goudriaan J 1986 Separating the diffuse anddirect component of global radiation and its implications for modelling canopyphotosynthesis Part 1 Components of incoming radiation Agric ForMeteorol 38 217ndash229
Thorpe MR 1974 Radiant heating of apples J Appl Ecol 11 755ndash760Vaillancourt LJ Hartman JR 2000 Apple Scab The Plant Health Instructor The
American Phytopathological Society httpdxdoiorg101094PHI-I-2000-1005-01 (accessed 120315) httpwwwapsnetorgedcenterintropplessonsfungiascomycetesPagesAppleScabaspx
Webb L Darbyshire R Erwin T Goodwin I 2016 A robust impact assessmentthat informs actionable climate change adaptation future browning-risk inapple crops Int J Biometeorol (accepted)
Wuumlnsche JN Greer DH Palmer JW Lang A McGhie T 2001 Sunburnmdashthecost of a high light environment Acta Hortic 557 349ndash356
ORIGINAL PAPER
A robust impact assessment that informs actionable climatechange adaptation future sunburn browning risk in apple
Leanne Webb1amp Rebecca Darbyshire1 amp Tim Erwin2
amp Ian Goodwin3
Received 18 October 2015 Revised 21 October 2016 Accepted 22 October 2016 ISB 2016
Abstract Climate change impact assessments are predomi-nantly undertaken for the purpose of informing future adapta-tion decisions Often the complexity of the methodology hin-ders the actionable outcomes The approach used here illus-trates the importance of considering uncertainty in future cli-mate projections at the same time providing robust and sim-ple to interpret information for decision-makers By quantify-ing current and future exposure of Royal Gala apple to dam-aging temperature extremes across ten important pome fruit-growing locations in Australia differences in impact to ripen-ing fruit are highlighted with by the end of the twenty-firstcentury some locations maintaining no sunburn browningrisk while others potentially experiencing the risk for the ma-jority of the January ripening period Installation of over-treenetting can reduce the impact of sunburn browning The ben-efits from employing this management option varied acrossthe ten study locations The two approaches explored to assistdecision-makers assess this information (a) using sunburnbrowning risk analogues and (b) through identifying hypo-thetical sunburn browning risk thresholds resulted in varyingrecommendations for introducing over-tree netting These rec-ommendations were location and future time period depen-dent with some sites showing no benefit for sunburn protec-tion from nets even by the end of the twenty-first century andothers already deriving benefits from employing this
adaptation option Potential best and worst cases of sunburnbrowning risk and its potential reduction through introductionof over-tree nets were explored The range of results presentedhighlights the importance of addressing uncertainty in climateprojections that result from different global climate modelsand possible future emission pathways
Keywords Extreme temperature Sunburn browning
Netting Horticulture Pome fruit Climate projections
Introduction
The purpose for undertaking most climate change impactassessments should be to inform adaptation decisions orprompt action for greenhouse gas mitigation Many impactassessments however are not solution-focused nor do theyrespond to end-user perspectives (Kiem and Austin 2013) Inpresenting their results to end-users and decision-makers thescience community often focuses on exploring and explainingsubjects such as uncertainties in climate projections whichcan over-complicate the advice Here an approach is outlinedthat aimed to provide robust yet simple results to enable ac-tionable decisions while also including the uncertainty in fu-ture climate projections
An increase in the occurrence of extreme heat events hasbeen observed historically in Australia (Alexander et al 2007Trewin and Smalley 2013) The apple industry which had a2014ndash2015 gross value of $AU550 million (ABS 2016) isparticularly vulnerable to these extreme heat events as high airtemperatures and solar radiation exposure cause lsquosunburnbrowningrsquo a brown spot on the sun-exposed side of the fruitwith affected fruit unmarketable (Schrader et al 2003a bThomson et al 2014 Racsko and Schrader 2012) For examplea heat wave event in January 2009 in south-east Australia
Rebecca Darbyshirerebeccadarbyshiredpinswgovau
1 Faculty of Veterinary and Agricultural Science University ofMelbourne Parkville VIC Australia
2 CSIRO Oceans and Atmosphere PMB 1 Aspendale VIC Australia3 Department of Economic Development Jobs Transport and
Resources Tatura Australia
Int J BiometeorolDOI 101007s00484-016-1268-y
resulted in large yield losses due to sun damage approximatedat between 30 and 70 of the crop (Thomson et al 2014)Under anthropogenic climate change increases in the intensityfrequency duration and spatial extent of extreme temperaturesin Australia are expected (Alexander and Arblaster 2009CSIRO and BoM 2015 IPCC 2012) potentially increasingthe risk of sunburn damage
Given this potential risk many fruit-growing districts inAustralia will likely need to implement adaptation strategiesto minimise potential sun damage (Thomson et al 2014) Oneadaptation option is to use over-tree netting to protect fruit fromextreme conditions (Fig 1 left) In a recent study Darbyshireet al (2015) determined minimum air temperature thresholdsthat can result in sun damage of lsquoRoyal Galarsquo apple in non-netted and netted orchards Their assessment employed thermo-couple sensors under the fruit skin (Fig 1 right) in combinationwith air temperature sensors They identified air temperaturethresholds of 341 and 379 degC that correlate to minimumFST thresholds that can cause sunburn browning in nettedand non-netted orchards respectively To evaluate the use ofover-tree netting as an adaptation strategy to reduce the risk ofsun damage this climate change impact study presents a meth-od that minimised the potential number of descriptive climateprojections to produce results aimed at informing adaptive ac-tions This was evaluated considering the frequency of exceed-ance of threshold air temperatures now and in future periods fornon-netted and netted orchards Current (centred on 1995) andprojected threshold exceedance centred on 2030 and 2050aligningwith orchardistsrsquo shorter andmid-term planning frame-works respectively was evaluated In addition a period centredon 2090 was assessed to align with long-term strategicplanning
To address the demand for regionally relevant climatechange information (Kiem and Austin 2013) ten locations im-portant for pome fruit production in Australia covering a broadgeographical extent and corresponding range of underlying cli-mates were assessed One significant advantage to studyingmultiple locations in an impact assessment is that areas thatexperience similar climatic conditions but which may be sep-arated in space or time (ie with past or future climates) can beidentified ie climate analogues (Whetton et al 2013) This canbe helpful when considering adaptation strategies to a changing
climate (Hallegatte et al 2007 Webb et al 2013) a techniquethat will be demonstrated in this study
For adaptation actions to be effective comprehensive andplausible representation of the future climate is required to in-form the projection results The recently published Australianclimate change projections are based on the full body of knowl-edge of the climate system and the most up to date perspectiveon how the current climate may change under enhanced green-house gas concentrations (CSIRO and BoM 2015) These pro-jections of the future climate were informed by 40 CoupledModel Intercomparison Project 5 (CMIP5) (Meehl and Bony2011) global climate models (GCMs) simulating the climateresponse to a range of plausible scenarios of how greenhousegases and aerosols may change throughout the twenty-first cen-tury (Van Vuuren et al 2011) termed RepresentativeConcentration Pathways (RCPs)
The use of over-tree netting as a climate adaptation optionfor Royal Gala apple was used as an example to demonstrate amethod that simplifies complex climate projection informationin a manner that promotes climate adaptation uptake whileretaining scientific robustness Evaluating the potential benefitof installing netting to reduce apple sunburn risk is a useful casestudy as financial loss can be significant from extreme heatevents and netting is a clear implementable management op-tion The method used best-case and worse-case climate sce-narios for several future time periods to evaluate future sunburnbrowning risk with and without the adaptation option ofinstalling netting This was applied Australian wide to tengrowing districts to evaluate the adaptation option under futureclimates and across various site climate conditions The resultswere interpreted using several different approaches includingclimate analogues and considering different levels of growerrisk aversion
Materials and methods
Locations and regions assessed in the study
Climate data were selected from ten locations that represent themain commercial apple-growing regions in Australia Thesewere Applethorpe in Queensland Donnybrook and Manjimup
Fig 1 A netted lsquoRoyal Galarsquo apple orchard in Shepparton Victoria (left) Royal Gala apples with evidence of sunburn browning damage (centre) and athermocouple sensor placed under the fruit skin of a Royal Gala apple to measure fruit surface temperature (right)
Int J Biometeorol
in Western Australia Lenswood in South Australia Batlow andYoung in New South Wales Tatura and the Yarra Valley inVictoria and Spreyton and Huonville in Tasmania (Fig 2)These locations were in two broad regions identified in a studyby CSIRO and BoM (2015) based on their climate change re-sponse denoted as either the Central Slopes or SouthernAustralia
Recent climate projections for Australia were regionalisedaccording to logical groupings of recent-past climatic condi-tions biophysical factors and expected broad patterns of cli-mate change (CSIRO and BoM 2015) The ten study locationsare contained in two of these regions Central Slopes andSouthern Australia (Fig 2) Temperature projection resultsfrom these two regions were used to inform selection ofGCMs for this assessment
Projection methods
Analyses were conducted using daily maximum temperature(Tmax) for January when most sun damage is incurred forRoyal Gala apple following Darbyshire et al (2015) It wasimportant to set the context in this climate change impact as-sessment by including historical risk therefore allowing thechange in risk to be investigated In this study historical riskwas analysed using a 30-year baseline period centred on 1995(1981ndash2010) using gridded (005deg by 005deg) daily JanuaryTmax data obtained from the Australian Water AvailabilityProject (AWAP) (Jones et al 2009) Henceforth this 30-yearhistorical range is referred to as 1995
Future daily Tmax conditions were assessed in the studywith the aim to capture the range of climate projectionsresulting from the future range of RCPs and correspondingrange of CMIP5 GCM output To achieve this a subset ofRCPs and GCMs were identified and combined to createlsquobest-casersquo and lsquoworse-casersquo future climate scenarios The se-lection of RCPs GCMs and the method used to include day-to-day natural variability is detailed below
Emission pathways
Two RCPs (Moss et al 2010 Van Vuuren et al 2011) wereselected to include the likely future range in emissions
1 RCP45 An intermediate pathway which represents afuture where carbon dioxide (CO2) emissions peakaround 2040 and strong mitigation of emissions occursin the latter half of the century CO2 concentrations reach540 ppm by 2100 This scenario is similar to the SpecialReport on Emissions Scenarios (SRES) B1 scenario(Nakićenović and Swart 2000)
2 RCP85 A high pathway which represents a future withlittle curbing of emissions where the CO2 concentrationcontinues to rapidly rise reaching 940 ppm by 2100Current CO2 concentration analysis indicates that we aretracking along this trajectory (Peters et al 2012) Thispathway is similar to the SRES A1FI scenario (Rogeljet al 2012)
Fig 2 Australian pome fruit-growing locations (black dot) areshown in context of Australianstates (capital letters Victoriaabbreviated to Vic) The regionsdefined in CSIRO and BoM(2015) used for model selection inthis study are Southern Australia(dark grey) and Central Slopes(light grey)
Int J Biometeorol
Selecting GCMs
The 40 GCMs available from the CMIP5 were investigated toselect GCMs that best defined the projected range in Tmax forthe two regions (Fig 2) These were selected by analysingsummer (harvest season) Tmax projections for all 40 GCMsover three time periods 2030 (2016ndash2045) 2050 (2036ndash2065) and 2090 (2075ndash2104) (henceforth referred to as2030 2050 and 2090) and the two identified RCPs (40GCMs for RCP85 and 38 GCMs for RCP45) using theAustralian Climate Futures approach (Clarke et al 2011Whetton et al 2012) For each region this approachcategorised and then ranked projected increases in summerTmax GCM output using a multivariate ordering technique(Kokic et al 2002) After ranking only 26 GCMs of the 40were considered for inclusion in the assessment as the remain-ing 14 have been found to perform poorly across a number ofmetrics for Southern Australia (Moise et al 2015)
This assessment found that two GCMs CanESM2 andMIROC5 best described the range in projected summerTmax increases for both the Southern Australian and CentralSlopes regions (Table 1) Across both regions the CanESM2model was consistently warmer than the ensemble meanwhile the MIROC5 model was consistently cooler than themean While these GCMs were not always the absolute leastor most warming for each time period and RCP in the definedregions across the range of future scenarios being consideredthey represented the range well
Using these selections of RCPs and GCMs best-case andworst-case future scenarios were constructed to capture therange of climate projection uncertainty The best-case scenariowas constructed using MIROC5 forced by RCP45 and theworse-case scenario was similarly constructed usingCanESM2 and RCP85 As such reliance on using GCMnames and emission pathway terminology was removed
Representing natural variability in the projected Tmax timeseries
To create future daily Tmax time series projected averagemonthly January Tmax change values centred on 20302050 and 2090 for the best-case and worst-case scenarioswere added to the AWAP observed January daily Tmax timeseries (1981 to 2010) To capture the most reliable estimateof location-specific natural climate variability the baselineTmax time series was contrived to extend for the longestpossible period 30 years while remaining centred on1995 (CSIRO and BoM 2015) In this way the influenceof decadal shifts that may skew the lsquonormalrsquo climatologysuch as the Australian Millennium drought (Dijk et al2013) was minimised By using this approach the futurevariability in each scenario was the same as the underlyingnatural baseline temperature variability
Assessment of sunburn browning risk
For all locations the 10th 50th and 90th percentile of a 30-year time series of the number of days in January that Tmaxexceeded 341 degC (sunburn browning non-netted) and 379 degC(sunburn browning netted) (Darbyshire et al 2015) were gen-erated using the baseline (1995) period and each of the futureperiods (2030 2050 and 2090)
The entire plausible range of days exceeding the thresholdor sunburn browning risk (days) for each future time periodwas captured by incorporating results across the best-case andworst-case scenarios
The potential benefit of netting measured as a reduction inthe number of sunburn browning risk days was evaluated Tointerpret this reduction in terms of benefit of netting two riskcases were identified
1 Risk-sensitive Netting was introduced if the maximum(90th percentile) number of days in a 30-year periodexperiencing sunburn browning risk was greater than20 of days in the month (ie 6 days)
2 Risk-tolerant Netting was introduced if the median (50thpercentile) number of days in a 30-year period experienc-ing sunburn browning risk was greater than 20 of daysin the month (ie 6 days)
Use of lsquosunburn browning riskrsquo analogues
An alternative method to assist decision-makers regarding thetiming of introduction of over-tree nets is to identify a locationwhere the threshold was already exceeded ie where over-treenetting is already employed to minimise sunburn browningrisk Decision-makers will decide to introduce over-tree netsonce the climate becomes similar or analogous to the identi-fied location To assist with using this approach sunburnbrowning risk analogues were identified across the ten studylocations for 2030 2050 and 2090
To define sunburn browning risk analogues sunburn brow-ning risk was categorised and colour coded as in Table 2
Results
Historical (1981ndash2010) daily January Tmax ranges for the tenstudy locations indicated that Spreyton and Huonville werethe coolest locations with the warmest locations beingDonnybrook and Young (Fig 3 also see Fig 2 map)Exceedance of non-netted (341 degC) and netted (379 degC) sun-burn browning air thresholds for the period 1981ndash2010 oc-curred where the boxplot crossed the indicative lines
Int J Biometeorol
Current and projected sunburn browning risk
The current (1995) and future (2030 2050 and 2090) medi-an (10th and 90th percentile in brackets) sunburn browningrisk (days) for non-netted trees at the ten study locations isdescribed in Table 3 To simplify the results the range in-cluded both best-case and worse-case scenarios for eachtime period
The median number of sunburn browning risk daysfor the 1995 period varied with location from no dam-age at Spreyton through to 3 days for Lenswood 7 daysfor Donnybrook and 9 days for Young The maximumexceedance in any 1 year through this period was 16 daysrecorded at Young (in the years 1988 2003 2006 and2009)
For Tatura a key growing district median sunburn brow-ning risk of approximately 9 days was projected by 2030This could be up to 16 days in hottest years under a worst-case scenario but in coolest years and best-case scenarioonly 3 days would be expected to exceed the sunburn brow-ning threshold temperature In contrast under both best-caseand worst-case scenarios and across the natural variabilitySpreyton remained largely risk-free through to 2090(Table 3)
To compare the sunburn browning risk between locationsand for future time periods instances with similar mediansunburn browning risk were colour-coded in Table 3 Theseshadings indicate sunburn browning risk analogues For ex-ample the current sunburn browning risk at Young (medianof 9 days per month) is expected at Tatura in 2030 while the
current risk at Tatura (6 days per month) is expected atLenswoodManjimupBatlow and theYarraValley by 2090
Reduced sunburn browning risk through installationof over-tree nets
Sunburn browning risk (days) with the installation of over-tree netting was evaluated (Table 4) With nets in place atTatura the maximum exposure for 2030 was halved to ap-proximately 8 days for the hottest projected years and aworse-case projection scenario (163 days Table 3 vs84 days Table 4) By 2090 in Young where up to 249 daysof sunburn browning risk was experienced in the hottestyears and under a worst-case scenario (no nets Table 3)sunburn browning risk nearly halved to approximately14 days with over-tree nets in place (Table 4) which is sim-ilar to current risk at Young in the hottest years under aworst-case scenario for non-netted trees (Table 3)
The reduction in sunburn browning risk (days) was calcu-lated by measuring the average difference in exposure withand without over-tree nets This is illustrated spatially sepa-rately for best-case and worst-case future scenarios for 2090(Fig 4) Tasmanian locations had little benefit from the in-stallation of nets with Spreyton indicating 0-day benefitAverage exposure in Huonville was reduced by approxi-mately 1 day under the best-case future scenario and up to2 days under the worst case For Manjimup a more than 5-day (on average) improvementwas realised through applica-tion of nets (worst case) or approximately 3 to 4 days (onaverage best case) In currently hot areas such as Young
Table 1 Projected change in summer Tmax (degC) for Southern Australia and Central Slopes regions (see Fig 2) for 20-year periods centred on 20302050 and 2090 relative to the the 20-year period centred on 1995 under RCP45 and RCP85 for CanESM2 andMIROC5 CMIP5 GCMs compared tothe ensemble mean and standard deviation of 40 (RCP85) and 38 (RCP45) GCMs
Southern Australia Central Slopes
2030 2050 2090 2030 2050 2090
Both RCPs RCP45 RCP85 RCP45 RCP85 Both RCPs RCP45 RCP85 RCP45 RCP85
CanESM2 12 15 25 22 48 09 20 30 27 54
MIROC5 09 12 14 18 27 05 11 15 19 28
Mean 10 15 19 20 38 11 16 21 24 41
Standard deviation 03 04 04 05 09 05 07 07 07 09
Table 2 Sunburn browning risk (days) for the month (top) and proportion of days in the month (bottom)
le 16 days 17 to 31 days 32 to 62 days 63 to 93 days 94 to 155 days ge 156 days
le 50 51 to 100 101 to 200 201 to 300 301 to 500 ge 501
Colour shading corresponds to periods and locations having these sunburn browning risk levels
Int J Biometeorol
nets reduced sunburn browning risk by 8 to 9 days (on aver-age best to worst case)
To evaluate potential decisions to install netting the resultswere interpreted for two risk cases
1 Risk-sensitive option (eg maximum sunburn browningrisk (90th percentile) gt6 days Table 3)
2 Risk-tolerant option (eg median sunburn browning risk(50th percentile) gt6 days Table 3)
Depending on the risk case selected nets were applied at dif-ferent locations and different time periods as shown in Table 5Under the risk-sensitive case nets were applied at more locationsand earlier For example it is only under the risk-sensitive case thatnets were applied in Batlow A further example at Manjimupindicated that nets would be installed in 2030 under the risk-sensitive case and not until 2090 under a risk-tolerant caseInstallation of netting will be beneficial even for the historicalperiod under either risk case in Young Donnybrook and Tatura
Discussion
The disconnect between defendable credible and legitimate cli-mate projection information and end-user requirements can actas a barrier to actionable climate adaptation recommendations(Kiem and Austin 2013) Indeed inability to ever fully resolveuncertainty in climate projections should not restrict decision-relevant information being provided to inform end-users
Presentation of context-specific best-case and worst-caseoutcomes can remove the barrier between the science and theend-user with the decision-maker having robust informationready for decision implementation In a critical first step tosimplifying the outcomes of this study two GCMs representa-tive of the range of change were selected (Clarke et al 2011Whetton et al 2012) Further to this RCP45 and RCP85 (VanVuuren et al 2011) were used to represent the range of plausi-ble future emission scenarios While a lower option (RCP26)was available for modelling this pathway was not consideredachievable given current global emission policy settings(Meinshausen et al 2009 Peters et al 2012) and was thereforenot assessed Combining the projection information scenariosfor the best case ie least-warmingGCMlowest emissionpathway and worst case ie most-warmingGCMhighestemission pathway were identified and presented This ensuredthat the full profile of climate projections was captured in asimplified manner without reducing the credibility of the re-sults or the relevance of potential decision options In doing soa great deal of unnecessary complexity in calculation and pre-sentation of data and results was avoided (Smith and Chandler2010) and climate science terminology minimised This ap-proach could be applied to other impact analyses using tem-perature change or extended to studies where both temperatureand rainfall are important with for instance best case identi-fied as least-warming and wettest and worst case most-warming and driest future scenario
Note that results need to be interpreted across the range ofthe best-case and worse-case scenarios Employing only oneGCM or RCP in an impact assessment can inadvertently leadto potentially flawed adaptation decisions For example atApplethorpe by 2090 and under the best-case scenario a 15-day reduction to sunburn browning risk was achieved fromover-tree netting perhaps resulting in a decision not to installnets (see Fig 4) Under the worst-case scenario with nearly 6-day reduction to sunburn browning risk nets could be consid-ered useful (Fig 4) Presenting the range of best-case andworst-case projections gives end-users the opportunity to makea better-informed decision by appreciating the range of likelyoptions
In this assessment only some growing locations are at riskof sunburn browning under current and future climates Forexample for the Tasmanian locations of Huonville andSpreyton sunburn browning risk remains minimal rightthrough to the end of the century However for Young and
Young
Donnybrook
Tatura
Manjimup
Batlow
Applethorpe
Lenswood
Yarra Valley
Huonville
Spreyton
Maximum temperature (1981 - 2010) deg C
40302010
Fig 3 Boxplot showing daily January maximum temperature (degC) for1981ndash2010 for the ten locations in the study (also see Fig 2 map) Theinterquartile range (IQR) of the sample is indicated by the height of thebox the sample median (the horizontal bar) and 15 times IQR (thewhiskers) with outliers (the lsquoorsquo) Tmax thresholds (the horizontal solidlines) are given for sunburn risk (non-netted) 341 degC and sunburn risk(netted) 379 degC
Int J Biometeorol
Tatura by mid-century over a third of days in the harvestmonth could pose a sunburn browning threat
Over-tree netting is an effective option for reducing sunburnbrowning risk (Smit 2007 Smit et al 2008 Solomakhin andBlanke 2010) and was found in this study to notably reducesunburn browing risk for most growing districts Adaptationplanning to determine the time period in which nets could beintroduced to reduce sunburn browning risk was explored Thiscan be informed by using analogues of current and future expo-sure to extreme heat events (Webb et al 2013) For example theexposure to damaging heat events currently experienced inTatura is likely to be the same as that projected for Lenswoodby 2050 or Batlow by 2090 The benefit of future investment inover-tree nets for Lenswood or Batlow can be informed bylooking at current regional netting practises in Tatura
An alternative approach for informing future adaptationplanning decisions was presented using two hypothetical riskprofiles a risk-sensitive and a risk-tolerant Using this ap-proach nets would be recommended to be installed at differ-ent locations at different times through the twenty-first centu-ryWhile this example was informative individual risk assess-ment will likely change with appetite for business risk growerexperience and financial position A benefit-cost analysiswould assist with this decision-making An assessment ofthe economics of installing nets in the current climate inEurope for example showed that they were not economicallybeneficial (Iglesias and Alegre 2006) This would certainlyapply in Tasmania where the cost of netting would exceedcrop loss due to sunburn browning For other locations thebenefit-cost ratio would vary and could be estimated both
Table 3 Median (10th to 90th percentile in brackets) sunburn browning risk (days) for ten Australian pome fruit-growing locations for 30-year periodscentred on 1995 2030 2050 and 2090
Location 1995 2030 2050 2090
Spreyton 00 (00 to 00) 00 (00 to 00) 00 (00 to 00) 00 (00 to 03)
Huonville 00 (00 to 20) 10 (00 to 27) 10 (00 to 29) 15 (00 to 32)
Yarra Valley 20 (00 to 77) 43 (06 to 92) 46 (06 to 95) 56 (13 to 105)
Lenswood 30 (10 to 70) 45 (16 to 94) 51 (18 to 102) 60 (28 to 107)
Applethorpe 00 (00 to 20) 03 (00 to 46) 10 (00 to 59) 30 (00 to 97)
Batlow 10 (00 to 40) 29 (00 to 77) 41 (00 to 95) 55 (03 to 126)
Manjimup 25 (00 to 50) 39 (01 to 72) 45 (11 to 77) 61 (21 to 95)
Tatura 60 (10 to 130) 94 (33 to 163) 104 (45 to 177) 130 (65 to 210)
Donnybrook 70 (30 to 110) 89 (32 to 139) 103 (41 to 154) 128 (71 to 184)
Young 90 (12 to 160) 133 (26 to 202) 154 (38 to 227) 178 (58 to 249)
Future sunburn browning risk incorporates potential best-case and worst-case results Sunburn browning risk categories and colour coding defined in theMaterials and methods section of this publication
Table 4 As for Table 3 with over-tree nets in place
Location 1995 2030 2050 2090
Spreyton 00 (00 to 00) 00 (00 to 00) 00 (00 to 00) 00 (00 to 00)
Huonville 00 (00 to 00) 00 (00 to 05) 00 (00 to 10) 03 (00 to 13)
Yarra Valley 00 (00 to 19) 09 (00 to 35) 13 (00 to 42) 19 (00 to 61)
Lenswood 10 (00 to 29) 15 (00 to 45) 18 (03 to 52) 23 (03 to 57)
Applethorpe 00 (00 to 00) 00 (00 to 05) 00 (00 to 10) 00 (00 to 20)
Batlow 00 (00 to 00) 00 (00 to 10) 01 (00 to 25) 06 (00 to 40)
Manjimup 00 (00 to 20) 00 (00 to 25) 05 (00 to 30) 14 (00 to 43)
Tatura 20 (00 to 59) 28 (00 to 84) 36 (03 to 94) 56 (08 to 126)
Donnybrook 10 (00 to 30) 20 (00 to 50) 30 (00 to 57) 50 (10 to 82)
Young 20 (00 to 59) 39 (00 to 90) 54 (05 to 115) 78 (11 to 142)
Int J Biometeorol
under current and future climates (not in the scope of thisstudy)
In further support of over-tree netting for use as an adaptationmeasure several additional benefits to reducing sunburn brow-ning risk such as reduced hail damage irrigation requirementincidence of bitter pit and apple scab decay after cold storage andfruit fly damage have been reported (do Amarante et al 2011)
Negative effects of installing netting have been reported includ-ing poorer skin colour (pale blush and a more intense greenbackground colour) higher soluble solid concentration (SSC)and increased starch Interestingly when tasting apple slices ofundamaged and sunburned fruit sunburned fruit were consistent-ly rated higher than undamaged fruit due to their higher SSC andlower tartaric acid concentration (Racsko and Schrader 2012)
Fig 4 The average reduction ofsunburn browning risk days for2090 resulting from using over-tree netting for best-case (top) andworst-case (bottom) scenarios
Int J Biometeorol
therefore processed (eg apple chips apple pie apple juice) orsemi-processed (eg fresh cut slices) forms of apple may showfuture promise for marketing sunburnt fruit
There are also community and social barriers andor incen-tives that need to be considered when deciding to install netsFor example in some regions in Australia (eg Yarra Valley)visual amenity of nets has restricted their introduction whereasin other areas (NSW) government financial incentives exist forgrowers wishing to install netting (NSW Government 2015)
Other adaptation measures to reduce exposure to sunburninclude evaporative cooling fruit bagging or particle films(Gindaba and Wand 2006 Racsko and Schrader 2012) Over-tree evaporative cooling systems based on pulsing water appli-cations can reduce sunburn while also reducing tree transpirationand irrigation requirements (Green et al 2012) However accessto water for this purpose needs to be considered (Evans 2004)especially for drought-prone areas like Australia Many physio-logical and cultural management practises can also influence theextent of sunburn browning in apples cultivar susceptibilitydevelopmental stage of fruit tree form and training systemrow orientation in the orchard growth vigour (rootstock prun-ing) and water stress (Racsko and Schrader 2012) Acclimationby previous exposure to high temperatures within the season canalso reduce the extent of sunburn damage (Racsko and Schrader2012)
This study aimed at providing information to assist with cli-mate adaptation The approach indicated an increase in the num-ber of days potentially suitable for the formation of sunburnbrowning damage Use of a threshold assessment linearlymassing lsquopotential damage daysrsquo or sunburn browning risk wasappropriate for climate projection application and providedgrowers with clear information on potential changes in sunburnbrowning risk Building a more complex model accounting forall additional aspects (UV wind speed humidity colour etc) of
individual fruit incorporating canopy structure modelling couldgo part way to estimating damage at particular growing pointsTo our knowledge such models have not been developedFurthermore combining these sorts of fine flux models(subdaily and very small spatial component) with climate pro-jection data would be misrepresentative Climate projectionmodels are unable to accurately resolve variables such as windspeed through complex landscapes and still require work inpredicting sequences of weather such as heat waves
Apples can respond to high-temperature stress even at ad-vanced stages of maturity by synthesising heat shock proteinswhich likely play an important role in protecting cellular biochem-ical processes during periods of stress (Ritenour et al 2001)Theoretically summer pruning and leaf thinning should be per-formed on cool overcast days when the forecast is for cloudyweather in following days to allow time for heat shock proteinsto accumulate prior to exposure to direct solar radiation Howeverthe timing and duration of exposure required to encourage produc-tion of heat shock proteins are not fully understood Slow progres-sive exposure may allow their protective build-up(Ritenour et al2001 Wuumlnsche et al 2004 Zhang et al 2003 Ma and Cheng2004 Edreva 2005) Future strategies may make better practicaluse of this knowledge by preparing fruit for sun exposure(Wuumlnsche et al 2001 Ritenour et al 2001)
There are other cultivars not commercially grown in Australiathat are more susceptible to sunburn browning For instancelsquoCameorsquo and lsquoHoneycrisprsquo were found to sustain damage at46 degC (Schrader et al 2003b) lower than that for Gala (478 degCSchrader et al 2001) Royal Gala was used in this assessment asproduction in Australia is high with production in 20072008 thethird highest behind Cripps Pink and Granny Smith (AustralianBureau of Statistics 2008)
Other forms of sunburn such as sunburn necrosis a more se-vere level of damage could also be considered using the frame-work outlined in this study Identification of air threshold temper-ature for sunburn necrosis on Royal Gala apple under nets wouldneed to be evaluated prior to such an analysis and highlights atopic for further study (Darbyshire et al 2015) The nature ofextreme heat events often occurring from less than 1 day to afew days at most requires use of special modelling techniques thatare not available directly from GCM output Projections fromGCMs are commonly produced at a monthly timescale with dailyoutput unable to be directly interpreted To overcome this differenttechniques that can produce locally relevant synthetic future dailydata can be used Thesemethods include usingweather generatorsstatistical downscaling the change factor method or dynamicaldownscaling There are pros and cons of these different ap-proaches and there is no one best method (CSIRO and BoM2015Wilby et al 2009) In this analysis the change factormethodwas used to generate a synthetic future daily temperature timeseries incorporating a local representation of natural variabilityuncertainty (Wilby et al 2009) This method involved applyingGCM-derived temperature changes to a higher spatial resolution
Table 5 Decision not to install nets (X) or to install nets () for a risk-sensitive case (maximum sunburn browning risk gt6 days Table 3) (left)and a risk-tolerant case (median sunburn browning risk gt6 days Table 3)(right)
Risk-sensitive Risk-tolerant
Location 2030 2050 2090 2030 2050 2090
Spreyton X X X X X X
Huonville X X X X X X
Yarra Valley X X X
Lenswood X X
Applethorpe X X X X X
Batlow X X X
Manjimup X X
Tatura
Donnybrook
Young
Int J Biometeorol
historical (or baseline) climatology 005deg spacing of longitude andlatitude The projected climatology (with an original spatial reso-lution of approx 15deg (or 150 km) therefore also takes on this finerresolution In this way a synthetic projected temperature climatol-ogy captures local topographical and coastal climate influences
One of the limitations with the change factor method is thatalthough the resultant scenario incorporates the detail of the sta-tion records as well as the average climate change of the speci-fied GCM grid box the scaled and the baseline scenarios onlydiffer in terms of their respectivemeans maxima andminima allother properties of the data such as the range and distributionremain unchanged (Wilby et al 2004) In support of the methodchosen this should pose minimal effect given that for most ofthe Australian region mean temperature change is broadly sim-ilar in magnitude and direction to extreme temperature change(CSIRO and BoM 2015) However in the southern coastal re-gions the increases in the annual and 1-in-20-year maximumsare a little higher than for the means This seems consistent withthe effect of hot winds from the interior providing an even greatertemperature contrast to those from across the ocean under thewarmer climates as examined by Watterson et al (2008) Inviewing the future exposure for locations in Southern Australia(Lenswood and Yarra Valley) this potential underestimateshould be acknowledged It should also be noted that the changefactor method is not advised for producing future rainfall timeseries where in some regions for example changes in extremerainfall are projected to increase even if mean rainfall is projectedto decrease (CSIRO and BoM 2015)
For this case study projected changes to extreme temperatureand the efficacy of over-tree netting in diminishing adverse ef-fects were explored in some detail In a broader assessment ofclimate change impacts on theAustralian apple industry it wouldbe naiumlve to ignore changes to other climate variables given thatthese crops are affected directly and indirectly by many climaticfactors Projections for rainfall evapotranspiration drought fireand wind are all of interest to the grower and have implicationsfor future viability of orchards The importance of these shouldnot be underestimated in terms of the croprsquos vulnerability andalsowith regards to orchard operational practises eg spraying inhot conditions Finally although often overlooked for agriculturalworkers human health as impacted by exposure to extreme heatshould also be considered (Kjellstrom et al 2009)
Conclusion
A methodology was outlined to provide action-oriented climateprojection information The adaptation decision to install over-tree netting to protect apples against sunburn was used as anexample The methodology simplified climate projection infor-mation to a range between best-case and worse-case scenariosThe results were presented in several ways to assist in decision-making including colour-coded analogues and a risk profile
approach For Australia heterogeneity in the benefit of over-tree netting was found geographically and into future time pe-riods The results highlight areas with little risk and hence noadaptation response is required through to areas at considerablerisk and a significant benefit for the installation of netting Thisapproach focussed on adaptation action founded on a robustscientific method can be used as a template for a diverse rangeof impact studies to provide climate projection information that iseasily transferrable into adaptation actions
Acknowledgements We acknowledge the World Climate ResearchProgrammersquos Working Group on Coupled Modelling which is responsi-ble for CMIP and we thank the climate modelling groups for producingand making available their model output For CMIP the US Departmentof Energyrsquos Programme for Climate Model Diagnosis andIntercomparison provides coordinating support and led development ofsoftware infrastructure in partnership with the Global Organisation forEarth System Science Portals
Craig Heady and Tim Bedin for work in preparation of the thresholdexceedance database (CSIRO) and PennyWhetton (CSIRO) for her thor-ough review of the manuscript
Compliance with ethical standards
Funding Funding for this research was provided by the AustralianDepartment of Agriculture and Water Resources
References
ABS (2016) 75030 - Value of Agricultural Commodities ProducedAustralia 2014ndash15 httpwwwabsgovauAUSSTATSabsnsfLookup75030Main+Features12014-15OpenDocument
Alexander L Hope P Collins D Trewin B Lynch A Nicholls N (2007)Trends in Australiarsquos climate means and extremes a global contextAustralian Meteorological and Oceanographic Journal 561ndash18
Alexander LV Arblaster JM (2009) Assessing trends in observed andmodelled climate extremes over Australia in relation to future pro-jections Int J Climatol 29417ndash435 doi101002joc1730
Australian Bureau of Statistics (2008) Agricultural survey apples andpears Australia 2007ndash08 Australian Government Canberra
Clarke JM Whetton PH Hennessy KJ (2011) Providing application-specific climate projections datasets CSIROrsquos climate futuresframework Paper presented at the MODSIM2011 19thInternational Congress on Modelling and Simulation PerthWestern Australia December 2011
CSIRO and BoM (2015) Climate change in Australia information forAustraliarsquos natural resource management regions technical reportCSIRO and Bureau of Meteorology Melbourne pp 222
Darbyshire R McClymont L Goodwin I (2015) Sun damage risk ofRoyal Gala apple in fruit growing districts in Australia N Z JCrop Hortic Sci 43222ndash232
Dijk AI Beck H Crosbie R et al (2013) The millennium drought inSoutheast Australia (2001ndash2009) natural and human causes andimplications for water resources ecosystems economy and societyWater Resour Res 491040ndash1057
do Amarante CVT Steffens CA Argenta LC (2011) Yield and fruit qual-ity of lsquoGalarsquo and lsquoFujirsquo apple trees protected by white anti-hail netSci Hortic 129(1)79ndash85
Int J Biometeorol
Edreva A (2005) The importance of non-photosynthetic pigments andcinnamic acid derivatives in photoprotection Agric EcosystEnviron 106135ndash146
Evans RG (2004) Energy balance of apples under evaporative coolingTransactions of the ASAE 471029ndash1037
Gindaba J Wand SJ (2006) Comparison of climate ameliorating mea-sures to control sunburn on lsquoFujirsquo apples In XXVII InternationalHorticultural Congress-IHC2006 International Symposium onEnhancing Economic and Environmental 772 2006 pp 59ndash64
Green S Goodwin I Cornwall D (2012) Evaporative cooling effects ontree transpiration In VII International Symposium on Irrigation ofHorticultural Crops 1038 2012 pp 401e-406
Hallegatte S Hourcade J-C Ambrosi P (2007) Using climate analoguesfor assessing climate change economic impacts in urban areas ClimChang 8247ndash60 doi101007s10584-006-9161-z
Iglesias I Alegre S (2006) The effect of anti-hail nets on fruit protectionradiation temperature quality and profitability of lsquoMondialGalarsquoapples J Appl Hortic 891ndash100
IPCC (2012) Managing the risks of extreme events and disasters to ad-vance climate change adaptation summary for policymakers Aspecial report of working groups I and II of the intergovernmentalpanel on climate change Cambridge University Press Cambridgeand New York
Jones DA Wang W Fawcett R (2009)High-quality spatial climate data-sets for Australia Australian Meteorological and OceanographicJournal 58233
Kiem AS Austin EK (2013) Disconnect between science and end-usersas a barrier to climate change adaptation Clim Res 5829ndash41
Kjellstrom T Holmer I Lemke B (2009) Workplace heat stress healthand productivitymdashan increasing challenge for low and middle-income countries during climate change Global Health Action 2103402ghav3402i34002047PMCID PMC2799237
Kokic P Breckling J Luumlbke O (2002) A new definition of multivariateM-quantiles In Statistical data analysis based on the L1-norm andrelated methods Springer pp 15ndash24
Ma F Cheng L (2004) Exposure of the shaded side of apple fruit to fullsun leads to up-regulation of both the xanthophyll cycle and theascorbate-glutathione cycle Plant Sci 166(6)1479ndash1486
Meehl GA Bony S (2011) Introduction to CMIP5 CLIVAR Exchanges164ndash5
Meinshausen M Meinshausen N Hare W et al (2009)Greenhouse-gasemission targets for limiting global warming to 2C Nature 4581158
Moise A Wilson L Grose M et al (2015) Evaluation of CMIP3 andCMIP5 models over the Australian region to inform confidence inprojections Australian Meteorological amp Oceanographic Journal(accepted)
Moss RH Edmonds JA Hibberd KA et al (2010) The next generation ofscenarios for climate change research and assessment Nature 463747ndash756 httpwwwnaturecomnaturejournalv463n7282suppinfonature08823_S1html
NakićenovićN Swart R (eds) (2000) Special report on emissions scenar-ios A special report of working group III of the intergovernmentalpanel on climate change Cambridge University Press Cambridgeand New York
NSW Government (2015) Farm innovation fund NSW Rural AssistanceAuthority Orange NSW
Peters GP Marland G Le Queacutereacute C Boden T Canadell JG Raupach MR(2012) Rapid growth in CO2 emissions after the 2008-2009 globalfinancial crisis nature Climate Change 22ndash4
Racsko J Schrader L (2012) Sunburn of apple fruit historical back-ground recent advances and future perspectives Crit Rev PlantSci 31455ndash504
Ritenour MA Kochhar S Schrader LE (2001) Characterisation of heatshock protein expression in apple peel under field and laboratoryconditions J Am Soc Hortic Sci 126(5)564ndash570
Rogelj JMeinshausenMKnutti R (2012) Global warming under old andnew scenarios using IPCC climate sensitivity range estimatesNature Cl im Change 2248ndash253 ht tp wwwna ture comnclimatejournalv2n4absnclimate1385htmlsupplementary-information
Schrader LE Zhang J Duplaga WK (2001) Two types of sunburn inapple caused by high fruit surface (peel) temperature Plant HealthProgress 101ndash5
Schrader L Sun J Felicetti D Seo J Jedlow L Zhang J (2003a)Stress-induced disorders Effects on apple fruit quality In Proceedings ofthe Washington Tree Fruit Postharvest Conference WenatcheeWashington USA 2003 p 7
Schrader LE Zhang J Sun J (2003b) Environmental stresses that causesunburn of apple Acta Hort 618397ndash405
Smit A (2007) Apple tree and fruit responses to shade netting MScDissertation University of Stellenbosch
Smit A Steyn WJ Wand SJE (2008) Effects of shade netting on gasexchange of blushed apple cultivars Acta Horticulturae 772
Smith I Chandler E (2010) Refining rainfall projections for the MurrayDarling Basin of south-East Australia-the effect of sampling modelresults based on performance Clim Chang 102377
Solomakhin A Blanke M (2010) The microclimate under colouredhailnets affects leaf and fruit temperature leaf anatomy vegetativeand reproductive growth as well as fruit colouration in apple AnnAppl Biol 156121ndash136
Thomson G McCaskill M Goodwin I Kearney G Lolicato S (2014)Potential impacts of rising global temperatures on Australiarsquos pomefruit industry and adaptation strategies N Z J Crop Hortic Sci 4221ndash30
Trewin B Smalley R (2013) Changes in extreme temperatures inAustralia 1910 to 2011 In 19th AMOS National ConferenceMelbourne 2013 pp 11ndash13
Van Vuuren DP Edmonds J Kainuma M et al (2011) The representativeconcentration pathways an overview Clim Chang 1095ndash31
Watterson IG McGregor JL Nguyen KC (2008) Changes in extremetemperatures of Australasian summer simulated by CCAM underglobal warming and the roles of winds and land-sea contrastsAustralian Meteorological and Oceanographic Journal 57195ndash212
Webb LB Watterson IG Bhend J Whetton PH (2013) Global climateanalogues for winegrowing regions in future periods projections oftemperature and precipitation Aust J Grape Wine Res 19331ndash341
Whetton P Hennessy K Clarke J McInnes K Kent D (2012) Use ofrepresentative climate futures in impact and adaptation assessmentClim Chang 115433ndash442 doi101007s10584-012-0471-z
Whetton PH Karoly D Watterson IG Webb L Drost F Kirono DMcInnes K (2013) Australiarsquos climate in a four degree world InChristoff P (ed) Four degrees of global warming Australia in a hotworld EarthscanRoutledge London pp 17ndash32
Wilby R Charles S Zorita E Timbal B Whetton P Mearns L (2004)Guidelines for use of climate scenarios developed from statisticaldownscaling methods
Wilby RL Troni J Biot Y Tedd L Hewitson BC Smith DM Sutton RT(2009) A review of climate risk information for adaptation and de-velopment planning Int J Climatol 291193ndash1215
Wuumlnsche JN Bowen J Ferguson I Woolf A McGhie T (2004) Sunburnon applesmdashcauses and control mechanisms XXVI internationalhorticultural congress key processes in the growth amp cropping ofDeciduous Fruit amp Nut Trees (ISHS) Acta Hortic 636631ndash636
Wuumlnsche JN Greer DH Palmer JW Lang A McGhie T (2001)Sunburn-the cost of a high light environment Acta Hortic 557349ndash356
Zhang J-G Liu Y-F Kochhar S Schrader LE (2003) Acclimation of fruitto high temperatures in relation to sunburn in gala apples 36(6)731ndash734 Sci Agric Sin 36(6)731ndash734
Int J Biometeorol
Western Australian Apple Netting Demonstration Site Susie Murphy White1 Rohan Prince2 and Lisa Starkie 3 1 Pomewest Manjimup WA 2 Department of Agriculture and Food Western Australia South Perth WA and 3 Department of Agriculture and Food Western Australia Manjimup WA
Disclaimer This publication may be of assistance to you but the State of Western Australia Pomewest and its employees do not guarantee that the publication is without flaw of any kind or is wholly appropriate for your particular purposes and therefore disclaims all liability for any error loss or other consequence which may arise from you relying on any information in this publication Acknowledgments This project was conducted as part of the apple and pear industry climate variability and climate change program and funded by Horticulture Innovation Australia using the apple and pear industry levy and matched funds from the Australian Government and the Department of Agriculture and Water Resources Collaborations with project partners from Victorian Department of Economic Development Jobs Transport and Resources University of Melbourne University of Tasmania Department of Agriculture and Fisheries Queensland and Department of Agriculture and Food Western Australia have contributed to the outcomes of these projects Additional financial support was provided by Department of Agriculture and Food Western Australia and the states Royalties for Regions to install the netting and evaluate the irrigation efficiency The authors would like to thank Maurie Ann Tim and Michelle Lyster of Lyster Orchards
Introduction
Climate predictions for the future include reduced winter chilling less rainfall and more extreme
high temperature incidents across the South West of Western Australia (Sudmeyer et al 2016 and
Reid 2010) Over tree netting (hail shade or bird netting) has been identified as a potential climate
change adaptation strategy due to the moderating effect of adverse climate conditions (Lolicato
2011) Netting reduces solar radiation and therefore a reduction in the amount of sun damaged
fruit The installation of over tree netting is one adaptation to climate change that can reduce the
impact of browning on apples (Darbyshire et al 2015) Protection from hail events can be achieved
by netting pome fruit orchards enabling the protection of fruit and trees (Middleton and McWaters
2002) The Pome fruit industry is already responding with significant investment in netting
infrastructure despite remaining practical questions on the use of hail netting particularly in warm
growing regions including the effect of different types of netting on temperature fruit quality and
yield (Bosco et al 2014 and Iglesias and Alegre 2006) The effectiveness of netting as a climate
change adaptation strategy in reducing fruit surface temperature under predicted climate change is
unknown
Data collected at the Western Australian netting demonstration site was set up to expand on
existing studies on the effects of netting on air temperature relative humidity wind and solar
radiation (Middleton and McWaters 2002 and Darbyshire et al 2015) The Western Australian
netting demonstration site aims to compare the effect of different coloured net on fruit yield quality
and environmental conditions under black and white net
The Western Australian netting demonstration site at Lyster Orchards Manjimup was constructed
in 2013 to demonstrate the benefits of netting under Western Australian conditions This
demonstration site was part of two nationally funded projects Crossing the Threshold Adaptation
tipping points for Australian Fruit Trees funded by Department of Agriculture and Water Resources
and Understanding Apple and Pear production systems in a changing climate funded by Horticulture
Innovation Australia
The site was set up as demonstration site with one replication of each treatment type 025 hectares
of black net 025 hectares white net and no net (figure 1) There were 10 random trees monitored
under each treatment from 2 rows
Figure 1 Western Australian netting demonstration site at Lyster Matijari Orchard
The aim of the project was to demonstrate the value of hail bird or shade netting as a means to
improve orchard productivity in high density production systems Particular attention was given to
assessing the impact of netting on fruit quality (sunburn wind burn and colour) The effects of black
and white netting on fruit quality (particularly colour) tree growth and chill accrual in the orchard
were compared to the no net treatment
Materials and Methods
The demonstration site Lysterrsquos Matijari Orchard is located 3km south of Manjimup on the South
West Highway Western Australia (3416oS and 11607oE) Half a hectare of a 12 ha commercial
Cripps Pink apple crop has been covered with 16mm quad netting to provide full exclusion to birds
plus shade and hail protection
Construction of the netting started in August 2013 and was completed by 28th October 2013 025ha
of black net provides a 23 percent reduction of both shade and UV radiation while 025ha of white
net provides a 20 percent reduction The white and black net area was compared to no net areas
The three treatment sites have been monitored from 8th November 2013 through to 29th April 2016
The environmental conditions were monitored during this period and the fruit quality and yield for
two harvest seasons Under each treatment 10 monitoring trees were selected 5 in each row (figure
2)
A fourth site with lsquoFrustarrsquo net was expected to be constructed after harvest 2014 but was not
completed during this project
The Cripps Pink apple trees planted in 2004 on a northsouth orientation are on M26 rootstock
trained on a central axis Trees are spaced at 1m with 4m between rows giving a planting density of
2500 trees per ha The soil type includes sandy clay loam with varying gravel content over medium
clay that starts from between 50 to 70cm depth The grower undertook all management of the trees
during the demonstration period
Figure 2 Netting treatment layout at Matijari 5 trees monitored in each row 10 trees monitored in each
block
Weather stations were located in the centre of row 4 (black net) 10 (white net) and 16 (no net)
Measurements taken every minute are averaged and reported each 15 minutes Weather
observations measured include solar radiation UVB radiation mid canopy air temperature relative
humidity wind speed and rainfall
The light interception was calculated by measuring Photosynthetically Active Radiation (PAR) on a
clear sky day in March 2014 and February 2015 using a hand held ceptometer Several
measurements were taken throughout each section at morning solar noon and afternoon to
measure the extent and density of the shade created by the tree
Row 1716
Row 1110 Row 54
No net rows 14 to 19
White net rows 8 to 13
Black net rows 1 to 7
Phenology assessments were performed to determine the beginning of green tip and full bloom
timing Regular visual assessments (Monday Wednesday Friday) were made from just prior to
budburst until flowering was completed Assessments were performed on a whole tree basis on only
spur and terminal buds and spur and terminal flower clusters assessed (axillary buds on one-year-old
pome fruit shoots were not included in the assessments) for the 10 Cripps Pink monitoring trees
under black white and no net treatments
Fruit Surface Temperature (FST) was measured using thermocouples inserted into the surface of 10
Cripps Pink apples Sensors were inserted into apples evenly spaced (upper mid and lower canopy)
on 4 trees in row 4 (black) 10 (white) and 16 (no net) Fruit Surface Temperature (FST) readings
were taken every 15 minutes from end of January until early March over 3 seasons 2014 2015 and
2016
Yield assessments were undertaken in 2014 and 2015 Each of the 10 monitoring trees from the
black white and no net treatments were strip pick approximately one week prior to the growers first
pick The number of apples from each tree was recorded then graded according to the Pink LadyTM
standards then a random sample of 40 was selected During the grading process the number of bird
damage apples and sun damaged apples were recorded from each monitoring tree The grower bin
numbers have been recorded to get the commercial pick data from all Cripps Pink rows under the
black white and no net treatments
From the sample of 40 apples from each of the monitoring trees the colour was assessed using the
Pink LadyTM Europe Ctifl colour charts (Centre technique interprofessionnel des fruits et legumes
(Ctifl) Pink LadyTM Eurofru colour charts) Each apple was given a score for background colour (F1-
F7) a score for blush intensity (R1-R8) and a percentage of blush intensity when the blush was over
R3
The maturity of the apples was tested from a sample of 10 apples randomly selected from the rows
monitored from early April until harvest With the final maturity test completed from the sample of
40 apples The maturity tests included starch conversion using the 1-6 scale (Portman and Sutton
2003) total soluble sugars measured using a refractometer flesh firmness measuring the pressure
from each side of the apple using a 11mm plunger and acid titration (McAlpine et al 1995)
Results and Discussion
Environmental
A summary of the winter chill conditions during the data collection years was compiled Flowering
phenology is influenced by winter chill accumulation with low chill years due to warm winter
conditions potentially delaying flowering Conversely warmer spring conditions may advance
flowering timing
Winter temperature conditions must be converted into chill portions For this project the Dynamic
chill model was used to calculate chill conditions under each net colour This model estimates winter
chill in chill portions and is currently the most robust and reliable chill model available (Luedeling
2012 and Darbyshire et al 2016) Winter chill was calculated from 1st March through until 31st
August 2014 and 2015 from hourly temperature readings collected in the orchard
There is very little difference in chill accumulation under black net white net or no net area (figure
3) The nets do not reduce the amount of chill accumulated as there is minimal impact on the
temperatures recorded under the black or white net or no net (table 1)
Use of netting to increase winter chill is unlikely to be an effective adaptation option however these
results do show that netting established for other management outcomes does not influence
winter chill accumulation in a meaningful way
Table 1 Mean monthly temperatures (degC) from March to October and total chill portions accumulated from 1st March until 31st August under black white and no net
Treatment Season Mar Apr May Jun Jul Aug Sep Oct CP
Black 2015 179 151 12 127 115 117 13 166 66
White 2015 179 151 121 128 117 119 129 166 63
No Net 2015 179 152 12 126 111 114 126 163 66
Black 2014 185 162 139 118 111 128 132 147 55
White 2014 186 163 139 118 112 129 132 147 54
No Net 2014 187 164 14 119 112 129 132 148 52
Figure 3 Chill accumulation under the black net white net and no net at Matijari in 2014 and 2015
Bud break and flowering data was collected from 10 trees under black white and no net rows
Observations were made three times a week from 20 August to 30 October 2014 and 2015 (Parkes
et al 2016) Whole tree assessments were made to determine the dates of bud break occurrence
of first flower and full bloom and to monitor progression of flowering (table 2) There is minimal
difference in flowering progression between the netted trees to the no net trees Rootstock shows a
greater difference with the MM106 trees under no net reaching bud break a week before M26 All
trees still came into full bloom at the same time in 2014 (figure 4)
Table 2 Summary of apple bud break and flowering data for 2014 at Matijari based on whole tree assessments Average dates of bud break (5 percent of buds at green tip or beyond) first flower and full bloom (80 percent of individual flowers open) for ten randomly selected trees
Cultivar Root Stock
Bud break First Flower Full Bloom
201415
No Net Cripps Pink M26 15914 26914 171014
White Net Cripps Pink M26 12914 22914 171014
Black Net Cripps Pink M26 15914 22914 171014
No Net Cripps Pink MM106 8914 15914 171014
201516
No Net Cripps Pink M26 18915 25915 151015
White Net Cripps Pink M26 16915 25915 151015
Black Net Cripps Pink M26 11915 25915 121015
No Net Cripps Pink MM106 23915 30915 141015
Figure 4 Flowering progression at Matijari for Cripps Pink apples on M26 rootstock under black white and no
net The first symbol represents green tip the second first flower and the last full bloom
Mean daily temperatures rarely varied more than 05 to 1 degree (figure 5) The netting led to small
increases in minimum temperatures and dampening of maximum temperatures This action is
similar to a cloud cover effect which reduces radiant heat loss overnight and reflects a portion of
incoming daytime radiation reducing maximum temperatures
Figure 5 Daily maximum (upper) average (centre) and minimum (lower) air temperatures for black white and
no net treatments for summer 2016
The daily maximum air temperature for the summer autumn months (December ndash April 2014 2015
and 2016) the relationship between the white and no net (figure 6) and black and no net (figure 7)
show no effect on air temperature There is a wide range of air temperatures from 14oC to 37oC
245 250 255 260 265 270 275 280 285 290 295 300
DoY (Sept - Nov)Green tip - First Flower - Full Bloom
Flowering Progression Matijari
2014 Black net
2015 Black net
2014 White net
2015 White net
2014 No net
2015 No net
0
5
10
15
20
25
30
35
40
1 January 2016 1 February 2016 1 March 2016
Air
Te
mp
era
ture
oC
Black max Black min Black avgWhite max White min White avgNo Net max No Net min No Net avg
over a 5 month period of the growing season that demonstrating there is no effect on air
temperature Under the nets feels cooler as the solar radiation lower
Figure 6 The relationship of maximum daily air temperature under no-net (ATno-net) and white net (ATwhite) for
Summer and Autumn 2014 to 2016 The fitted linear regression (solid line) was described by ATno-net = 1004 (plusmn
0006) ATwhite - 0081 (plusmn 0155) R2 = 099 n = 438
Figure 7 The relationship of maximum daily air temperature under no-net (ATno-net) and black net (ATblack) for
summer and autumn 2014 to 2016 The fitted linear regression (solid line) was described by ATno-net = 0996 (plusmn
0006) ATblack + 0379 (plusmn 0163) R2 = 098 n = 438
20
25
30
35
40
20 25 30 35 40
ATn
o-n
et(deg
C)
ATwhite (degC)
20
25
30
35
40
20 25 30 35 40
ATn
o-n
et(deg
C)
ATblack (degC)
The humidity under the white net during summer was highest and lowest in no net block (table 3)
The effect of high humidity was seen in the pest and disease management under the nets In the
first year after the nets were constructed woolly aphids were extremely bad under the nets there
was also a high percentage of apples with bitter pit European mites attacked under the nets in late
December 2015 almost defoliating the trees With pest and disease outbreaks can be more
common under netting it is a matter of monitoring more frequently as the conditions under the nets
are favourable to outbreaks
Table 3 Maximum daily relative humidity during summer autumn 2016
Black White No Net
Average 9285 9346 9192
Max 9844 9852 9774
Min 6683 6792 6284
SE 047 040 046
Average wind speeds are highest under the black net which is on the eastern side followed by the no
net which is on the western side (table 4) The white net is the central block between the black and
no net treatments The average wind speeds measured appear to demonstrate a landscape effect
where the eastern side open to the easterly winds off the dam and the white net is protected from
the prevailing winds The no net treatment is protected from the rest of the block of Fuji and Cripps
Pink apple trees Although the maximum wind speeds come from the prevailing westerly winds
Table 4 Average 15 minute wind speed (ms) May 2015 ndash April 2016
Black White No Net
Average 112 064 089
Max 497 602 746
Min 0 0 0
SE 0005 0004 0005
The no net area received the highest global radiation (figure 7) While not exactly the same as the
specifications the white net showed a 15 percent reduction and the black net 26 percent reduction
during January and February 2014 and 2015 Specifications are only given as a guide to how the nets
will perform and in this case the black net was close to specification and the white net slightly less
A similar trend is followed each summer for global radiation
Figure 7 Global radiation measured under the black net white net and no net rows for summer 2014
Figure 8 Global radiation measured under the black net white net and no net rows for summer 2015
Figure 9 Global radiation measured under the black net white net and no net rows for summer 2016
0
5
10
15
20
25
30
35
40
0 20 40 60 80 100
Glo
bal
rad
iati
on
(M
Jm
2 d
)
Julian Day
2014 No net
White net
Black net
0
5
10
15
20
25
30
35
40
0 20 40 60 80 100
Glo
bal
rad
iati
on
(M
Jm
2d
)
Julian Day
2015 No net
White net
Black net
0
5
10
15
20
25
30
35
40
0 20 40 60 80 100
Glo
bal
rad
iati
on
(M
Jm
2d
)
Julian Day
2016 No net
White net
Black net
The effect of the black white and no nets on the interception of light was measured annually as a
percentage of total above canopy Photosynthetically Active Radiation (PAR) using a ceptometer
Figure 10 shows the black net had a greater reduction in shade compared with the white net and no
net
Figure 10 Average photosynthetic radiation interception (PAR) of sky measured at morning noon and
afternoon on March 2014 and February 2015 in the black net white net and no net rows
While measurements reflected shade specification of the net the reduction in PAR was also
influenced by tree vigour or vegetative growth
The fractional PAR is the light intercepted by the tree canopy Tree vigour was higher under the
netted areas than outside the net as seen in the under canopy readings (figure 11)
0
500
1000
1500
2000
2500
3000
830 930 1030 1130 1230 1330 1430 1530
PA
R
mo
lm
2 s
Time
No Net 15 Black 15 White 15No Net 14 Black 14 White 14
Figure 11 Average percentage of fractional photosynthetic radiation interception (fPAR) measured at
morning noon and afternoon on 12 March 2014 in the black net white net and no net rows under tree
canopy
Quality
The fruit quality was a measured through the amount of sun damaged fruit bird damaged colour
development of the background and blush of the apple and maturity of the fruit Fruit surface
temperature was used to measure the amount of sunburn browning that could be expected under
netted conditions
Fruit surface temperature (FST) was higher in the no net area particularly during extreme heat
events in late summer and a higher percentage of sunburnt fruit was observed in the no net rows
25 percent in 2014 Less than half a percent of the apples were sun damaged that came from the
black and white net areas compared to the no net area
From the 2014 and 2016 fruit surface temperature (FST) recorded it is reasonable to think that
amount of solar radiation reaching the fruit surface should influence the FST The FST was measured
over the summer 2013-14 season (figure 12) and 2015-16 season (figure 13) Average FST was lower
under the white net than the black even though greater solar radiation was recorded under white
net
0
10
20
30
40
50
60
70
80
90
100
830 930 1030 1130 1230 1330 1430 1530
Pe
rce
nta
ge f
PA
R
TimeNo Net 15 Black 15 White 15
No Net 14 Black 14 White 14
Figure 12 Fruit surface temperature (FST) and air temperature measured in the black net white net and no
net rows at Matijari for February till mid-March 2014
The FST recordings from 2015 had some computer programming errors at the weather station and
have not been presented in this report
Figure 13 Fruit surface temperature (FST) and air temperature measured in the black net white net and no
net rows at Matijari for February till mid-March 2016
In 2016 the highest FST was 5961 oC in the no net block This was just one sensor in the outside
lower canopy on the western side sun damage was observed in this apple All other sensors in the
no net treatment were only a few degrees warmer than the black and white net
The daily maximum fruit surface temperature for February 2014 and 2016 the relationship between
the white and no net (figure 14) and black and no net (figure 15) show minimal effect on fruit
surface temperature The range of FST start at 20 oC for minimum daily FST and extend through to a
maximum of 48 oC with average maximum FST of 483 oC for black net 489 oC for white net and 596
oC for the no net over the 2 seasons of recording FST
0
10
20
30
40
50
60
4022014 18022014 4032014
Tem
pe
ratu
re o
CAir Temp Black net Air Temp White net Air Temp No net
FST Row 4 Black net FST Row 10 White net FST Row 16 No net
0
10
20
30
40
50
60
29012016 12022016 26022016
Tem
pe
ratu
re o
C
White Max FST No Net Max FST Black Max FST
Black Max Air Temp White Max Air Temp No Net Max Air Temp
Figure 14 The relationship of maximum daily fruit surface temperature under no-net (FSTno-net) and white net
(FSTwhite) for February 2014 and 2016
Figure 15 The relationship of maximum daily fruit surface temperature under no-net (FSTno-net) and black net
(FSTblack) for February 2014 and 2016
Background colour blush and maturity all contribute to the marketability and grade assigned to Pink
LadyTM apples While the results are presented separately it is important to consider them together
In 2015 at the time of strip picking the majority of apples had reached the ideal background colour
(figure 16) Seventy eight percent of fruit in the no net and black net blocks were between F3 to F4
suitable for optimum for long term storage Sixty eight percent of white net apples were between
F3 to F4 (table 5)
y = 11445x - 22008
20
30
40
50
60
70
20 30 40 50 60 70
FST
No
Ne
t (o
C)
FST White Net (oC)
y = 10337x + 15665
20
30
40
50
60
70
20 30 40 50 60 70
FST
No
Ne
t (o
C)
FST Black net (oC)
Background colour greater than F4 is undesirable for long term storage as the green background
begins to move toward yellow the fruit ripens Twenty two percent of the no net fruit were beyond
the ideal background storage colour in 2015 and 67 percent in 2014 of no net and 53 percent of the
white net
Figure 16 Background and blush colour of Cripps Pink apples at time of strip picking 2842015 black net
white net and no net random sample for maturity testing
Table 5 Background colour percentage of apples with F score for background colour from Ctifl standards for
Pink LadyTM Optimum for long term storage F 3-4
F Score lt3 Immature
F Score 3 -4 Optimum for long term
storage
F Score gt4 Optimum for fresh market
to over ripe
2014
Black 6 93 1
White 5 42 53
No Net 2 31 67
2015
Black 0 78 22
White 0 68 32
No Net 0 78 22
While optimum blush is between R4 and R5 for long term storage blush greater than R4 is preferred
in all fruit The no net treatment had better blush colour development with majority of apples at
greater than R4 (table 6)
Table 6 Blush intensity percentage of apples with R score for background colour from Ctifl standards for Pink
LadyTM Optimum for long term storage F 4-5
R score lt4 Immature
R Score 4-5 Optimum for long term
storage
R Score gt5 Optimum for fresh market
2014
Black 43 29 28
White 25 38 37
No Net 26 34 40
2015
Black 68 25 7
White 56 35 9
No Net 47 42 11
Black Net White Net No Net
Colour management was required under the nets to ensure the colour and maturity meet at the
same point A reflective surface can ensure colour develops with the blush colour meeting market
standards
Maturity tests were undertaken from a sample of 10 apples from each treatment after the strip pick
(table 7) The starch conversion guide for the maturity of Pink LadyTM Apples the 1-6 scoring system
was used to assess the apples At picking starch conversion scores were at 4 optimum for only short
to medium controlled atmosphere storage (figure 17) The Total Soluble Sugar (TSS) was generally
lower than the acceptable minimum standard of 13 percent in all areas testing at 11 percent after
the first strip pick The grower did 4 picks of the fruit to harvest the apples at the optimal time of
maturity and colour meeting enabling sugar percentage to rise to the required 13 percent The flesh
firmness was measured on opposite sides of the apple averaging 82kg in 2015 and 8kg in 2014 with
ideal firmness pressure greater than 61kg required
Table 7 Average maturity testing from the strip pick of a sample of 10 apples from each of the 10 monitoring
trees
Treatment Firmness kg
TSS ()
Starch Index
Acid ml
2014
Black 73 118 40 90
White 78 120 39 105
No Net 89 114 35 117
2015
Black 82 107 41 102
White 82 114 43 87
No Net 82 110 41 89
Figure 17 Starch test on 2842015 at the time of strip picking Showing average starch index gt4 suitable for
medium to short term storage
Black Net
White Net
No Net
Yield
Both the strip picked data from the 10 monitoring trees in each treatment (table 8) and the
commercial pick data from the remaining trees in the block (table 9) have been included to
demonstrate the difference in the assessment and importance of working on a commercial property
Forty apples were assessed for size and quality from the strip picked trees
Encouragingly average fruit diameters from the strip pick were all very similar between treatments
There was a slight difference in average fruit weight which when multiplied with the difference in
average number of fruit per tree contributed to the difference in extrapolated yield per hectare
Table 8 Average fruit diameter weight fruit per tree and yield of non-damaged fruit based on strip harvest
Treatment Harvest
Date
Average fruit diameter
(mm)
Standard Deviation of
diameter
Average single fruit weight (g)
Average fruit number per
tree
Extrapolated yield (tha)
2014
Black 2014 752014 716 035 1656 1212 710
White 2014 652014 718 035 1726 1356 749
No Net 2014 3042014 716 062 1724 742 424
2015
Black 2015 2942015 717 058 1702 1557 653
White 2015 2942015 720 061 1626 1433 574
No Net 2015 152015 712 038 1610 2189 900
The data from the grower harvest (table 6) based on bins picked from the remaining 390 trees per
treatment shows a slightly different story The commercial yields are lower for black net and no net
treatment and higher under the white net This is largely due to the increased number of trees per
treatment averaging out differences in fruit numbers and the staggered picking over several weeks
allowing for colour to guide the timing of harvest This meant fruit with less blush than desired may
have increased in size and weight before being picked by the growers with some fruit left on the
trees that were already over mature or not considered marketable
Table 9 Grower yield per treatment total tonnes from each treatment 2013 yield before netting installed
Treatment 2013 Harvest Date
2014 Harvest Date
2015 2016
Black 97 2152014 63 252015 80
White 113 2152014 77 252015 103
No net 103 2152014 70 252015 97
The amount of sun damaged apples strip picked was less than 1 percent of the fruit picked from the
10 monitoring trees The black net apples in 2014 had the lowest amount (69 percent) of the fruit
marketable and had the highest (79 percent) marketable fruit in 2015 The no net was very stable
across the two harvests with the white net showing decreases in marketability in 2015 due to shape
defects and under sized fruit (table 10)
Table 10 Percentage of fruit that was marketable nonmarketable or had sun damage
Treatment Marketable Non-marketable Sunburn
2014
Black 6915 3085 0101
White 78 22 025
No net 74 26 25
2015
Black 787 213 05
White 705 295 04
No Net 730 270 10
sunburn is a subset of non-marketable fruit
In both seasons the damage from birds was minimal with no large losses from birds recorded before
harvest in the rows under the black white or no net The apples strip picked from the monitoring
trees had less than 1 percent of the fruit damaged by birds There were no hail events during the
monitoring period and so no damage from hail could be assessed Other previous studies from
Queensland have shown netting to be effective in preventing hail damage (Middleton and McWaters
2002)
Conclusions
Winter chill accumulation was monitored during the three years of the project It was found that
netting black or white had minimal impact on chill accumulation This was also reflected in the mean
monthly temperature which only varied by about half to one degree There is a linear relationship
between the air temperature of the black and white net and again when the nets are compared to
the no net treatment block The impact on chill conditions under the net was also seen in the
flowering progression which was monitored under the nets in 2014 and 2015 In both years the
black white and no net trees monitored entered into the bud break and reached full bloom on the
same day or within days of each other
The environmental conditions under the nets were very similar although some slight differences can
be seen in the weather data recorded The humidity under the white net during summer was
highest and lowest in no net block The effect of high humidity was seen in the pest and disease
management under the nets In the first year after the nets were constructed woolly aphids were
extremely bad under the nets and a high percentage of apples had bitter pit European mites
attacked under the nets in late December 2015 almost defoliating the trees With pest and disease
outbreaks more common under netting it is a matter of monitoring more frequently as the
conditions under the nets are favourable to outbreaks Although pests and diseases are treatable
they just require prompt management
Solar radiation was the highest in no net followed by white and black net The fruit surface
temperatures recorded in the apples over the late summer period were higher in the no net apples
where the solar radiation was highest The average difference between no net and the netted was
around 3 degrees with the black and white nets only varying by one degree
Measuring the amount of shade under the tree canopy it was found that tree vigour influenced the
Photosynthetically Active Radiation Outside the canopy the PAR followed the netting specifications
rating of the netting black lowest then white and no net
The fruit size was very similar in the three treatments with slight differences in fruit weight and
number of apples per tree after the strip pick The grower yields were highest under the white net
where the fruit had been allowed to stay longer on the trees This was to ensure the apples gained
more colour Initial response in the first year yield was reduced due to bitter pit woolly aphid and
colour management
Colour management is required under the nets to ensure the colour and maturity meet at the same
point A reflective surface can ensure colour develops with the blush colour meeting market
standards
The netting has proven to be successful at the Western Australia netting demonstration site in
reducing the impact of birds on the fruit
reducing the fruit surface temperature
with minimal impact on winter chill and flowering progression
Table 11 Cripps Pink responses to Black White and No Net at Western Australian Netting Demonstration Site
Black Net White Net No Net
Dormancy Chill Accumulation No Effect No Effect No Effect Flowering Progression No Effect No Effect No Effect Environmental data Air Temperature No Effect No Effect No Effect Fruit Surface Temperature Highest Humidity Highest Max Lowest Min Solar Radiation Lowest Highest Wind average speed Highest Lowest Yield and Quality Grower Yield Lowest Highest Colour Best Background Best Blush Best Overall Maturity Highest Sugar Lowest Starch
References
Bosco L Bergamaschi H Cardoso L Paula V Marodin G and Nachtigall G (2014) Apple production and quality
when cultivated under anti-hail cover in Southern Brazil International Journal of Biometeorology 59773-782
Darbyshire R McClymont L and Goodwin I (2015) Sun damage risk of Royal Gala apple in fruit growing districts
in Australia New Zealand Journal of Crop and Horticultural science
Darbyshire R Pope K and Goodwin I 2016 An evaluation of the chill model to predict flowering time in
apple tree Scientia Horticulturae Vol 198 pages 142 ndash 149
Darbyshire R Webb L Goodwin I Barlow EWR (2013) Challenges in predicting climate change impacts on
pome fruit phenology International Journal of Biometeorology1-15 doi101007s00484-013-0705-4
Darbyshire R Webb L Goodwin I Barlow S (2011) Winter chilling trends for deciduous fruit trees in Australia
Agricultural and Forest Meteorology 1511074-1085 doi101016jagrformet201103010
Luedeling E (2012) Climate change impacts on winter chill for temperate fruit and nut production A review
Scientia Horticulturae 144218-229
Iglesias I Alegre S 2006 The effect of anti-hail nets on fruit protection radiation temperature quality and
profitability of lsquoMondial Gala apples Journal of Applied Horticulture 8 91ndash100
Lolicato S 2011 Sun protection for fruit a practical manual for preventing sunburn on fruitmdash2011 Victoria
Department of Primary Industries
McAlpine G Mackay A Sutton J Godley G Price A and Melvin-Carter E (1995) Pink Lady TM and Sundowner TM
Apple specifications Bulletin 4305 Department of Agriculture Western Australia
Middleton S and McWater A (2002) Hail Netting of Apple Orchards - Australian Experience The Compact
Fruit Tree Volume 35 number 2 2002
Portman T and Sutton J (2003) Starch Conversion guide for maturity of Pink Lady TM apples Department of
Agriculture Western Australia
Parkes H Tabing L McClymont L Wilkie JD Combret M 2016 Variation in the flowering phenology of
apple and pear in Australia Acta Horticulturae 1130 (8)55-61
Reid A (2010) Horticulture and climate change A preliminary analysis of climate and crop climatic information
in the south-west of Western Australia Department of Agriculture and Food Western Australia Perth
Sudmeyer R Edward A Fazakerley V Simpkin L amp Foster I 2016 lsquoClimate change impacts and adaptation
for agriculture in Western Australiarsquo Bulletin 4870 Department of Agriculture and Food Western Australia
Perth
Appendix
Presentations
Susie Murphy White 2015 Netting the Benefits of climate change APAL Speed Updating 2015
httpapalorgauresearch-development-extensionprojectsresearch-reviews (accessed
832016)
Materials produced
Posters
Murphy White S Prince R and Starkie L 2015 Is there a difference between Black or White
netting (Manjimup Rotary 2015 Warren Districts Show 2016)
Prince R Murphy White S and Starkie L 2015 Benefits of good irrigation in netted apple
orchards
Fact Sheets
Darbyshire R 2014 Winter Chill and Fruit Trees PICCC Research Fact Sheet wwwpicccorgau
Australian Fruit Grower magazine articles
Murphy White S June 2014 Netting the Benefits of a changing climate (Volume 8 Issue 5)
Prince R and Murphy White S October 2015 Netting Trial results in Western Australia (Volume
9 Issue 9)
Murphy White S Prince R and Starkie L December 2015 Black or White netting which is best
(Vol 9 Issue 11)
Web pages
httpsagricwagovaun4863
httpwwwpicccorgauresearchproject440
httpwwwhincomauprojectswinter-chill-and-fruit-trees
httpapalorgauresearch-development-extensionprojectsapple-pear-production-changing-
climate
1
Apple yield response to climate change and netting
Lexie McClymont1 Rebecca Darbyshire2 and Ian Goodwin1
1 Victorian Department of Economic Development Jobs Transport and Resources
2 New South Wales Department of Primary Industries
Summary
The effect of increased temperature on potential yield of early-season apples in northern Victoria
was investigated using the physiological model MaluSim (Lakso and Johnson 1990) Impacts of
netting on yield were also investigated using observed data and MaluSim With a climate change
scenario of a 2 degC increase in maximum and minimum air temperatures MaluSim predicted
increased fruit weights and yields when crop loads were low However at higher crop loads yield
potential decreased due to greater source limitations resulting from decreased daily photosynthesis
in response to high temperatures later in the season Overall the effects of a 2 degC increase in air
temperatures on potential yields of Royal Gala apples in northern Victoria were small (+13 to -16
tha depending on crop load and presence or absence of netting) Yield potential was higher for
non-netted trees than netted trees but observed yields were lower for non-netted trees This
highlighted the benefits of netting in reducing crop damage and the influence of orchard
management on actual yield
Evaluation of the performance of MaluSim in predicting yield of Royal Gala apples in north Victoria
supported use of this model for preliminary investigation of climate change impacts on yield
However limitations of use of the model for this purpose were identified and are briefly discussed in
this report Additionally long-term investigation of the impact of elevated CO2 on apple yield is
required to more accurately predict climate change impacts A greater understanding of the impact
of temperature shifts on fruit maturation colour development and phenology would further
improve predictions of yield under different climate scenarios
2
1 Introduction
Mean temperatures for coastal and inland Australian apple growing regions are predicted to rise by
07-09oC and 1-12oC respectively by 2030 (Putland et al 2011) Previous research has identified a
range of potential impacts of predicted climate change on the productivity and profitability of the
Australian apple and pear industries (Putland et al 2011 Darbyshire et al 2013) Climate change has
the potential to affect potential productivity of pome fruit trees through effects of changing
environmental conditions on the orchards net carbon exchange (difference between photosynthates
produced and expended for respiration Putland et al 2011 and references within) Netting provides
a climate adaptive option particularly for severe weather events such as extreme heat or hail and is
increasingly being installed by growers Industry has made significant investment in netting
infrastructure despite remaining practical questions on the use of hail netting particularly in warm
growing regions The reduction of solar radiation under netting may influence physiological
responses to climate change
An apple physiological model (MaluSim Lakso and Johnson 1990) has been used to understand the
effects of predicted climate change on net carbon exchange of apples and the upper limit of apple
production (yield potential) The aims of this study were to
- evaluate the model MaluSim with regard to prediction of apple yield under Australian
conditions and
- predict apple yield in netted and non-netted orchards under warmer climate conditions
using MaluSim
Use of the model lsquoMaluSimrsquo (Lakso and Johnson 1990) to predict apple yield was evaluated in
201213 for Royal Gala apples grown at a site in nothern Victoria This site was selected as two
adjacent blocks were netted and non-netted This provided an opportunity to evaluate MaluSim with
and without the adaptation option of over-tree netting Data was collected from 10 trees for both
netted and non-netted trees and measurements for each of the 10 trees were treated as repeat
observations Broader evaluation of the model was conducted by the PICCC project lsquoCrossing the
threshold adaptation tipping points for Australian fruit treesrsquo and reported by Darbyshire and
McClymont (2016)
A future climate scenario of a +2 degC increase in maximum and minimum daily temperatures was
investigated for netted and non-netted orchards and compared to a current season (201213) To
create the future scenario temperature data from 201213 was increased by + 2 degC 201213 solar
radiation values were unchanged and other tree parameters were standardised based on
observations or default parameters within the model Fruit weight predictions were compared to
predictions based on 201213 weather data Calculations of cumulative tree photosynthesis
respiration and dry weight accumulation and daily photosynthesis and fruit carbon demand and
supply were examined to better understand fruit weight and yield responses suggested by the
model
3
2 Methods and materials
21 Evaluation of lsquoMaluSimrsquo
The MaluSim model is a simplified dry matter production model that relies primarily on temperature
and radiation inputs to predict carbohydrate accumulation (Lakso and Johnson 1990 Lakso 1992
Lakso et al 2001 Lakso et al 2006) The model is written in STELLA and consequently can be easily
modified by users (Zibordi 2010) It has been shown to behave realistically in a number of apple
growing regions and in response to factors such as short-term low light (Lakso et al 2001) The
model operates on a daily time step at the tree scale and balances carbohydrate supply against
demand for a lsquostandardrsquo tree Parameters associated with a lsquostandardrsquo tree (eg dates of key
phenological events number of fruit per tree tree spacing length of growing season shoot and spur
numbers) can be modified in the model Required data are summarised in Table 1
Table 1 Required datasets for MaluSim calibration
Dataset
Model inputs Site parameters Tree and row spacing
Latitude
Weather
Maximum and minimum daily air temperature Total daily solar radiation
Phenology
Date of budburst and harvest
Vegetative growth
Shoot and spur number or canopy radiation interception
Reproductive sinks Fruit number per tree (at harvest) Model outputs Average fruit fresh weight
211 Study site and collection of required datasets for model evaluation
Royal Gala apple was selected for evaluation of MaluSim as paired netted and non-netted sites were
available allowing investigation of any impact of netting on potential yield
The study orchard was a Royal Gala block located at Geoff Thompsonrsquos North Shepparton orchard
The selected block was predominantly covered by permanent netting but five rows on the eastern
side of the block were uncovered Tree age variety rootstock and most management activities did
not differ between netted and non-netted trees Data for evaluation of MaluSim were collected
during the 201213 season
Table 2 Description of the study site
Site Season Latitude Longitude Tree and Row spacing
Training System
Row Orientation
Shepparton 201213 -3633 14540 15 x 48 m Central-leader NNW-SSE
4
Weather stations were located within the netted and non-netted orchard areas to measure daily
maximum and minimum air temperature (degC HMP155 Vaisala Oyj Vantaa Finland) and daily total
solar radiation (MJm-2day-1 SPN1 Delta T Devices Ltd Cambridge UK) Data were logged (dataTaker
DT80M Thermo Fisher Scientific Inc Yokohama Japan) from 15 December 2012 at 1 minute
intervals during January and at 10 minute intervals at other times of the year Meteorological data
between budburst and 15 December 2012 were interpolated from relationships established for
radiation and temperature over the remainder of the season between a nearby weather station and
the onsite stations
Budburst day-of-year (DOY = 248) was estimated based on date of flowering at the site and date of
budburst of Gala at a nearby orchard Fruit number at harvest and canopy radiation interception
data were collected from 10 trees for both netted and non-netted sites Measurements for each of
the 10 trees were treated as repeat observations Fruit were colour picked over a two week period
in late-January and early-February Fruit number and fruit weight were recorded at each pick and
the mid-date of harvest (31 January 2013) was used as the harvest day-of-year in MaluSim Light
interception measurements at full canopy prior to harvest for each tree were taken in January
2013 A ceptometer was used to measure light interception in the morning at midday and in the
afternoon Daily light interception was calculated by averaging the morning midday and afternoon
measurements
212 Comparison of observed and predicted fruit weight 201213 season
Two parameterisations of MaluSim were run for analyses Firstly the default MaluSim values were
used (Netted-Default and NonNetted-Default) and secondly alternate values for shoot and spur
numbers were used to adjust the modelled light interception values to be similar to measured values
(Netted-Light Interception and NonNetted-Light Interception) To set the adjusted shoot and spur
numbers MaluSim was rerun for each tree with progressive adjustments to shoot and spur numbers
(maintaining the ratio of shoots to spurs to match that of the default values) until the predicted light
interception was within plusmn 2 of the observed light interception For both parameterisations the
netted and non-netted data were evaluated independently as well as combined Use of the default
maximum fruit growth rate was considered to be a reasonable assumption for an initial investigation
of model performance as Empire and Royal Gala are both early season apple varieties
22 Predictions of apple yield under a warmer climate
A future scenario of a +2 degC increase in maximum and minimum daily temperatures was investigated
for netted and non-netted orchards by inputting solar radiation data and adjusted air temperature
data (+ 2 degC) from 201213 to MaluSim with other (site phenology and tree) parameters
standardised Site and phenology inputs were unchanged from those used in the initial model
evaluation (section 21) Default shoot and spur numbers (194 and 343 respectively) were used
Crop load (fruit number per tree) was varied from 25 to 450 to ensure any lack of response to
changed climate conditions was not due to sink-limited yield restrictions
Fruit weight predictions for 201213 were compared with predictions using the +2 degC scenario
Cumulative tree photosynthesis respiration and dry weight accumulation and daily photosynthesis
and fruit carbon demand and supply were examined to better understand fruit weight (yield)
responses suggested by the model
5
3 Results
31 Evaluation of lsquoMaluSimrsquo
The results using default parameters of MaluSim tended to overestimate fruit weight compared with
observed fruit weight (Figure 1A) Combining both the netted and non-netted results RMSE was 39 g
which equates to a 28 error in estimating mean fruit weight (Table 3) Using the default
parameters the predicted fruit weights for the Netted site were more accurate than those for the
Non-Netted site RMSE 14 and 36 g (9 and 29 of mean fruit weight) respectively (Table 3)
Figure 1 MaluSim predicted and observed mean fruit weight (fresh weight in grams) for netted and non-
netted trees in 20122013 A) MaluSim fruit weight predictions using default shoot and spur number inputs B)
MaluSIm fruit weight predictions using adjusted shoot and spur numbers
100
120
140
160
180
200
100 120 140 160 180 200
Mo
del
led
Fru
it W
eigh
t (g
)
Observed Fruit Weight (g)
A
Netted-Default
NonNetted-Default
100
120
140
160
180
200
100 120 140 160 180 200
Mo
del
led
Fru
it W
eigh
t (g
)
Observed Fruit Weight (g)
B
Netted-Light Interception
NonNetted-Light Interception
6
Table 3 Statistics of MaluSim predicted and observed fruit weight at Royal Gala Netted and NonNetted sites using default shoot and spur numbers (Default) and adjusted shoot and spur numbers to align light interception values in the model with measured values
Site Coefficient p-value R2 RMSE (g)
Netted-Default 020 047 14
NonNetted-Default 005 092 36
All-Default 013 035 39
Netted-Light Interception 098 lt001 046 8
NonNetted-Light Interception -008 086 21
All-Light Interception 039 002 NA 22
linear model intercept was not significant statistics are for analysis omitting the intercept
The model predictions using parameterised adjustments of shoot and spur numbers were improved
for both the netted and non-netted trees (Figure 1 and Table 3) For the combined data RMSE was
improved to 22 g or 16 of the mean fruit weight MaluSim better predicted fruit weight for the
netted trees with RMSE of 8 g or 5 of the mean fruit weight In comparison predictions for the
non-netted trees yield RMSE of 21 g or 17 of mean fruit weight
32 Predictions of apple yield under a warmer climate
Potential fruit weight was predicted using MaluSim for two main scenarios
1 201213 Measured daily maximum and minimum air temperatures from the 201213
season with a range of crop loads for netted and non-netted Royal Gala orchards in north
Victoria
2 + 2 degC Adjusted air temperatures (201213 temperatures + 2 degC) with a range of crop loads
for netted and non-netted Royal Gala orchards in north Victoria
321 Weather inputs
Total solar radiation was 20 lower under netting than in the non-netted site Daily maximum air
temperature varied slightly between netted and non-netted sites with a tendency on hot days for
maximum air temperature under netting to be less than the non-netted site Prior analysis of
weather data showed that air temperature was similar at netted and non-netted sites (Milestone
Report 2 McClymont and Goodwin 2013 McClymont et al 2013)
Table 4 Summary of measured weather inputs at netted and non-netted sites during the 201213 season Max
AT = maximum air temperature Min AT = minimum air temperature Daily Rad = total daily solar radiation
Netted Non-netted
Max AT (degC)
Min AT (degC)
Daily Rad (MJm-2day-1)
Max AT (degC) Min AT (degC)
Daily Rad (MJm-2day-1)
Ave (plusmn st dev) 265 (plusmn 67) 95 (plusmn 45) 197 (plusmn 67) 272 (plusmn 67) 95 (plusmn 45) 244 (plusmn 82)
Max 418 213 282 428 214 349
Min 130 -03 27 135 -03 34
7
322 MaluSim calculation of photosynthesis respiration and dry matter accumulation
MaluSim calculates daily photosynthesis based on canopy interception of daily solar radiation with
adjustments to photosynthetic rate dependent on air temperature (Darbyshire and McClymont
2016) Over the period from budburst to harvest similar leaf area and canopy light interception
were generated by MaluSim for each scenario with only slight differences between netted and non-
netted sites and no differences for differing crop loads (Table 5) Leaf area development was more
rapid under the + 2 degC scenario than the 201213 scenario (data not shown)
Table 5 Leaf area and canopy light interception predicted at harvest by MaluSim under 201213 (201213
season air temperature data) and + 2 degC (201213 season temperatures + 2 degC) scenarios at netted (Net) and
non-netted (NN) sites
Scenario Leaf area (m2) Light interception () Net NN Net NN
201213 109 110 419 420 + 2 degC 110 110 421 420
Over the budburst to harvest period cumulative photosynthesis was effectively unchanged by
increased air temperatures (+ 2 degC scenario) and was approximately 10 lower at the netted site
than the non-netted site (Table 6) However daily photosynthesis during the first 70 ndash 75 days of the
season was greater under the + 2 degC scenario than the 201213 scenario (Figure 2) After this time
daily photosynthesis tended to be greater under the 201213 scenario than the + 2 degC scenario
(Figure 2)
Table 6 Photosynthesis respiration and dry matter accumulation between budburst and harvest predicted by
MaluSim under 201213 (201213 season air temperature data) and + 2 degC (201213 season temperatures + 2
degC) scenarios at netted (Net) and non-netted (NN) sites with a range of crop loads
201213 + 2 degC
Crop load (fruittree)
Photosynthesis (g CO2)
Respiration (g CO2)
Dry Matter Photosynthesis (g CO2)
Respiration (g CO2)
Dry Matter
Net NN Net NN Net NN Net NN Net NN Net NN
25
12637 13875
2220 2291 1805 1846
12758 13867
2730 2793 1804 1843 50 2256 2328 2252 2302 2774 2840 2294 2338 75 2291 2365 2693 2758 2816 2885 2756 2821 100 2325 2402 3117 3201 2858 2929 3208 3289 150 2392 2472 3928 4047 2938 3014 4023 4139 207 2462 2549 4707 4882 3020 3104 4751 4937 250 2510 2601 5162 5403 3073 3163 5111 5371 300 2557 2655 5525 5846 3126 3221 5396 5708 350 2597 2702 5775 6157 3169 3272 5562 5923 450 2659 2776 6039 6506 3237 3352 5759 6182
Average number of fruit per tree observed in 20122013
8
Figure 2 Daily photosynthesis (g CO2day) between budburst and harvest under measured 201213
temperature conditions (201213) and with a 2 degC temperature increase (+2 degC) for A) non-netted (NN) and B)
netted (Net) Royal Gala trees
MaluSim calculates daily respiration by an exponential relationship dependent on air temperature
and scaling for the size of plant parts (Darbyshire and McClymont 2016) Over the budburst to
harvest period cumulative respiration was approximately 20 greater in response to increased air
temperature (+ 2 degC scenario Table 6) Respiration was slightly lower at the netted site than the
non-netted site for 201213 (3 ndash 4 lower depending on crop load) and + 2 degC (2 ndash 3 lower)
scenarios Respiration increased with increasing crop load due to increased total respiration by
greater numbers of fruit
Dry matter accumulation is a function of demand of plant parts for photosynthate and supply
(photosynthesis - respiration) Predictably dry matter accumulation increased with increasing fruit
number as more lsquosinksrsquo were able to utilise produced photosynthates Similarly greater
photosynthate production at non-netted sites (compared to netted sites) enabled greater dry matter
production despite slightly higher respiration Response of dry matter accumulation to increased air
temperatures varied depending on crop load Dry matter production was similar or higher under the
+ 2 degC scenario when fruit number was 250 or less and lower when fruit number was 300 or more
9
323 MaluSim prediction of fruit weight and daily balance of fruit CO2 supply and demand
MaluSim partitions dry matter between plant parts (shoots fruits wood and roots) The amount of
dry matter partitioned to fruits determines fruit weight Demand by the different plant parts for
photosynthates varies through the season For example demand by shoots for photosynthates
increases rapidly from the start of season peaking after approximately one month and then
decreasing until shoot growth ceases Whereas fruit demand for photosynthates is low early in the
season and increases steadily mid-season until a peak potential growth rate is reached prior to
harvest Under excess carbon supply circumstances each growing part is allocated its full demand of
dry matter When photosynthate supply is limited the growing parts compete for resources The
ldquostrengthrdquo of each growing part to compete differs with shoots the strongest followed by fruit wood
and roots Under limited supply conditions dry matter allocated to fruit is less than the demand to
grow at maximum potential
For the 201213 and +2 degC scenarios predictions of fruit weight fell as fruit number per tree
increased (Figure 3A) but yield (fruit weight x fruit number) continued to increase (Figure 3B) over
the range of modelled crop load (25 to 450 fruit per tree) For crop loads between 25 and 100 fruit
per tree there was little change in predicted fruit weight with increasing crop load suggesting that
yield was predominantly sink-limited (ie potential supply of photosynthate to fruit was greater than
fruit demand) At higher crop loads (150 fruit per tree and greater) fruit weight began to decline
steadily indicating that at least on some days fruit growth was source-limited (ie supply of
photosynthate was not meeting fruit demand) Yield began to plateau at a crop load of
approximately 300 fruit per tree For both 201213 and +2 degC scenarios predicted fruit weights and
yields were lower for the netted site than the non-netted (Figure 3) These differences were
primarily due to decreased radiation under netting leading to decreased photosynthate production
For netted and non-netted sites MaluSim predicted a slight increase in fruit weight and yield with a
+2 degC increase in temperature at low crop loads (lt 250 fruit per tree Figure 3) However at higher
crop loads increased temperatures (+2 degC scenario) resulted in reductions in predicted fruit weights
and yields (for the given crop load Figure 3) from more respiration The largest predicted fruit
weight was 186 g (+2 degC scenario without netting and a crop load of 25 fruit per tree) The smallest
predicted fruit weight was 100 g (+2 degC scenario under netting with a crop load of 450 fruit per tree)
The highest yield predicted was 713 tha (201213 scenario without netting and a crop load of 450
fruit per tree)
10
Figure 3 Predicted A) fruit weight and B) yield under measured 201213 temperature conditions (201213)
and with a 2 degC temperature increase (+2 degC) for netted (Net) and non-netted (NN) Royal Gala trees
At low crop loads trees were able to match supply of photosynthates to fruits with demand on most
days (Figure 4) resulting in high fruit weights At higher crop loads supply of photosynthates to
fruits did not match demand on a greater number of days (due to increases in respiration) Figure 4
demonstrates how timing of availability of photosynthates and fruit growth patterns could influence
fruit growth and yield responses to warmer climate scenarios Fruit demand for photosynthates was
predicted to be higher under the +2 degC scenario than the 201213 scenario Although total
production of photosynthates was similar under the +2 degC and 201213 scenarios timing of
availability differed More photosynthate was available under the +2 degC scenario (than the 201213
scenario) early in the season coincident with low fruit demand (Figures 2 and 4) Later in the season
(when fruit demand for photosynthate was greater) the 201213 scenario tended to have more
photosynthate available (Figures 2 and 4)
11
Figure 4 Effects of increased temperatures and crop load on daily A) fruit demand for photosynthates B)
supply of photosynthates to fruit and C) the balance between supply and demand for photosynthates
12
4 Discussion and Conclusions
41 Evaluation of lsquoMaluSimrsquo
The predictive ability of MaluSim for Royal Gala was found to be adequate if adjustments to shoot
and spur numbers in line with observed light interception values are made MaluSim better
predicted fruit weight for netted compared with non-netted trees MaluSim tended towards
overestimating fruit weight for the non-netted trees (points above the line Figure 1) This is more
likely the result of management intervention than differential model performance between netted
and non-netted systems
Potential causes of the modelled overestimate for the non-netted trees may be due to tree stress
andor crop load management Considering tree stress evaporative demand and hence tree water
requirement is higher in non-netted orchards than netted orchards Non-netted trees may have
suffered transient water stress if either irrigation volume or frequency of irrigation events did not
match tree water requirements Noting that the orchard manager did supply more water to the non-
netted trees it is not clear whether this was sufficient to avoid tree stress
Regarding crop load management the non-netted site was thinned later than the netted site This
means that less carbon was available for the early-season growth of retained fruit on the non-netted
trees compared with the netted trees This could have contributed to slower fruit growth rates early
in the season in the non-netted trees than the netted and subsequent lower than predicted fruit
weight at harvest
MaluSim was designed as a model to evaluate potential yield That is expected yield assuming ideal
conditions Given the model design for potential yield not field yield it is reasonable to expect the
model will have a tendency to overestimate fruit weight in many commercial orchard situations
Furthermore evaluation of the performance of MaluSim needs to consider possible measurement
errors (ie errors in model inputs and observed parameters) use of the model outside the range of
parameters for which it was constructed and failure of observations to meet particular model
assumptions At a practical level the programing language used for MaluSim (Stella) limits use of
MaluSim for investigation of potential climate impacts Ideally such investigations would involve
modelling many iterations of simulated weather data to account for natural variability in climate and
use of multiple climate change models At present MaluSim requires the user to lsquorunrsquo each scenario
individually and manually extract data summaries making such detailed investigations impractical
These issues are discussed in greater detail by Darbyshire and McClymont (2016) who concluded
that positive validation of MaluSim under Australian conditions was not achieved based on poor
prediction of yield by MaluSim for Royal Gala and Cripps Pink at multiple sites in Australia However
performance of MaluSim in predicting fruit weight of Royal Gala trees at the North Shepparton site
with adjustment for light interception and consideration of environment and management impacts
supported use of the model for preliminary investigation of influences of climate change on
potential yield
13
42 Predictions of apple yield under a warmer climate
The following points consider the main findings of modelling potential yield under a warmer climate
and factors that could modulate yield response or improve model performance are discussed
- The predicted impact of increased temperatures (+ 2 degC) on yield was minor under the
conditions modelled in this investigation (-16 to +13 tha) dependent on crop load and
presence or absence of netting)
- Given that growers are most likely operating in the medium to high crop load range yield of
Royal Gala apples in north Victoria would be expected to remain unchanged or fall slightly
under a warmer climate This outcome is similar to that projected by Stockle et al (2010) for
apples grown in Washington State USA Although the response predicted by Stockle et al
appeared to be based on earlier harvest date Whereas yield loss in our modelling resulted
from source limitations during the fruit growth period
- Yield could be maintained by increasing crop load However at high crop loads additional
yield loss may occur due to increased downgrading or cullage of small fruit as average fruit
weight falls Avoidance of such additional losses would require either adjustment of market
expectations regarding fruit size or improved crop management to decrease variability in
fruit size
- Predicted yields were lower under netting than without netting Observed yields did not
support this finding and in the medium to long-term netting would offer greater yield
potential because of decreased occurrence of sunburn and hail damage It is noted that
netting reduced solar radiation by approximately 20 at the north Shepparton site
Modelling a greater reduction in solar radiation (30 ) lowered the crop load at which fruit
weight and yield began to fall in response to increased air temperatures (data not shown)
- The modelling undertaken in this investigation assumed no changes to budburst or harvest
date with increased temperatures Darbyshire et al (2016) reported that that most pome
fruit growing regions in Australia will have similar flowering phenology timing for 2030 whilst
progressive delays are expected for 2050 and 2090 Maturity and harvest could occur earlier
(Warrington et al 1999 Stockle et al 2010) or later (Iglesias et al 2002) under a warmer
climate with associated decreases or increases in yield potential and any shift will be
influenced by both physiological impacts of higher temperatures and market expectations
regarding fruit maturity and colour Colour development would most likely be impaired by
higher temperatures (Faragher 1983 Iglesias et al 2000 2002)
- This investigation focussed on the period from budburst to harvest Later season effects
including timing of leaf fall should be considered Accumulation of reserves during the
period from harvest to leaf fall will affect tree performance in the following season (Greer et
al 2002)
- Royal Gala is an early season variety and is picked in late January Late season varieties may
experience greater negative impacts of increased temperatures on accumulation of
photosynthates during the fruit growth period and subsequently yield
- A uniform increase in air temperature is unlikely across the season Use of a climate model
that predicts within season variation in temperatures could further emphasise disparities
between photosynthate supply and demand at particular growth stages
- The modelling undertaken in this investigation did not consider possible effects of elevated
atmospheric carbon dioxide (CO2) concentrations To include this aspect greater
14
understanding of apple tree functioning under both higher CO2 levels and higher
temperatures need to be understood Stockle et al (2010) estimated changes in apple yield
under future climate change with and without an enhancing effect of CO2 Without an
enhancing effect of CO2 apple yields were projected to fall slightly Increases in yield were
expected when increased CO2 was incorporated in modelling However notably they
commented that ldquoprojections for apples are more uncertain as tree fruit models are less
developed and previous studies are not availablerdquo
15
References
Darbyshire R and McClymont L 2016 Technical Report Assessing the potential yield model
lsquoMalusimrsquo Milestone Report 63 PICCC Project 440 Crossing the threshold adaptation tipping
points for Australian fruit trees
Darbyshire R Webb L Goodwin I and Barlow S 2013 Impact of future warming on winter chilling
in Australia International Journal of Biometeorology 57355ndash366
Faragher JD 1983 Temperature regulation of anthocyanin accumulation in apple skin J
Experimental Botany 34(10) 1291ndash1298
Greer DH Wunsche JN and Halligan EA 2002 Influence of postharvest temperatures on leaf gas
exchange carbohydrate reserves and allocations subsequent budbreak and fruit yield of Braeburn
apple (Malus domestica) trees New Zealand J Crop Hort Sci 30 175ndash186
Iglesias I Graell J Echeverria G and Vendrell M 2000 Orchard cooling with overtree sprinkler
irrigation to improve fruit color of lsquoDeliciousrsquo apples HortScience 35(7) 1207ndash1208
Iglesias I Salvia J Torguet L and Cabuacutes C 2002 Orchard cooling with overtree microsprinkler
irrigation to improve fruit colour and quality of lsquoTopred Deliciousrsquo apples Scientia Hort 93 39ndash51
Lakso AN 1992 The simplified dry matter production model for apple estimation of canopy
photosynthesis in discontinuous canopies Acta Hort 313 45ndash51
Lakso AN Greene DW and Palmer JW 2006 Improvements on an apple carbon balance
model Acta Hort 707 57ndash61
Lakso A and Johnson RS 1990 A simplified dry matter production model for apple using automatic
programming simulation software Acta Hort 276 141ndash148
Lakso AN White MD and Tustin DS 2001 Simulation modeling of the effects of short and
long-term climatic variations on carbon balance of apple trees Acta Hort 557 473ndash480
Putland D Deuter P Hayman P Hetherington S Middleton S Nidumolu U Nimmo P Thomas D
Wilkie J Williams D 2011 The apple amp pear industryrsquos response to climate change and climate
variability a desktop study Growcom Fortitude Valley QLD Australia
McClymont L and Goodwin I 2013 Understanding apple and pear production systems in a changing
climate Milestone 2 Progress report on Vic phenology data and the effects of netting on fruit
temperature AP12029
McClymont L Goodwin I and Sessions W 2013 Net benefits ndash the sun protection factor in 2050
Australian Fruitgrower July 28ndash31
Stockle CO Nelson RL Higgins S Brunner J Grove G Boydston R Whiting M and Kruger C 2010
Assessment of climate change impact on Eastern Washington agriculture Clim Change 102(1-2)
77ndash102
Warrington IJ Fulton TA Halligan EA and de Silva HN 1999 Apple fruit growth and maturity are
affected by early season temperatures J Amer Soc Hort Sci 124(5) 468ndash477
Zibordi M 2010 Crop load control in apple via shading exploring the potential of carbon
unbalances to manage fruit growth and tree performance PhD dissertation Universitaacute di
Bologna
Grower workshops ndash AP12029 Apples and pears in a changing climate 1
Understanding apples and pears in a changing climate overview
of the grower workshops
Jenny Treeby Department of Economic Development Jobs Transport and Resources
September 2016
Grower Workshops 2013
Three technical working group meetings were conducted during August (Queensland)
September (South Australia) and October (Victoria) involving 32 growers industry
representatives and service providers The purpose of the technical working groups was to
present relevant local research outcomes as well as identifying gaps in growersrsquo knowledge
around climate change that could be addressed at a later date
The technical working group locations and members were identified using input from DAFWA
DAFF QLD DEPI VIC Lenswood Co-op and APAL South Australia was suggested by APAL
Each technical working group was based on an already existing group and the meetings
scheduled to coincide with other meetings to gain maximum feedback and avoid meeting
fatigue and poor attendance
Format and information provided was tailored to the specific needs of the group based on
input from local industry development officers APAL and the research organisations involved
The Queensland working group session was structured around a presentation of the current
project as well as a questionnaire and the South Australian and Victorian sessions started
with an interactive presentation about chill and in the case of Victoria fruit temperature
followed by a 60-90 minute facilitated QampA session
Outcomes from the workshops varied depending on the location
- The Queensland workshop discussions focussed on the impact of extreme weather with
most growers agreeing that climate change and climate variability impacted on their
orchards lack of rain rain at the wrong time erratic bloom poor colour development
and hail damage all scored highly in the survey
- In South Australia the discussions centred on inconsistency in the reporting of chill
depending on the model used chill hours chill units or chill portions The lack of
conversion factors was mentioned Only the dynamic model which uses chill portions
predicted a high chill season based on local data This was consistent with the short
intensive flowering observed Post-session feedback was positive with suggestions made
to repeat the working group next year albeit to a larger audience as part of the national
workshop series
- In Victoria discussions also focussed on chilling models and temperature thresholds that
lead to heat-related fruit damage in the Goulburn Valley Again informal feedback was
Grower workshops ndash AP12029 Apples and pears in a changing climate 2
positive with the suggestion made to communicate more results as they become
available through emails or workshops
Grower workshops 2014
Three workshops for apple and pear producers were conducted in production regions in
collaboration with apple and pear growersrsquo organisations during May (Victoria) July
(Queensland) and September (Western Australia) Nearly 50 producers industry
representatives and service providers participated The purpose of the workshops was to
present an outline of the project to present relevant local research outcomes and to review
the last season to identify production trends and issues share lessons learnt and identify
future trends and issues
Nearly 50 producers industry representatives and service providers participated in this round
of workshops The purpose of these workshops was to present research outcomes from the
first three years of the project such as the modelled predictions for the regions and relevant
local climate change impacts as well as adaptation strategies and to seek feedback on the
past season perceived climate change risks and the project itself Each interactive workshop
was tailored to the individual needs of the three targeted groups through either general
presentations on climate change research intensive training in the Climate Change Risk
Management Matrix andor site specific presentations on modelled chill requirements and
heat damage projections
Additionally in order to reach a much wider pome fruit audience project outcomes were
highlighted at the 2015 National Horticulture Convention of APAL and AUSVEG where team
members across all participating research organisations were present at the Horticulture
Centre of Excellence stand to answer growersrsquo questions and get feedback on the project
Grower workshops 2015
Three workshops were held in apple and pear production regions to communicate up-to-date
research outcomes such as the model predictions from the last three years to industry in a
consistent manner as well as gathering information about the past season perceived climate
change risks and feedback on the project to 48 growers
Each workshop was held in conjunction with or as part of an industry forummeetingtour to
attract as many growers as possible and to avoid meeting fatigue
The workshops were held in Applethorpe (QLD) in conjunction with the Perth Hills Orchard
Improvement Group during their QLD study tour in July as a stand-alone Climate Change
Risk Management Matrix session with QLD growers in Applethorpe in July and a climate
change workshop in Bilpin (NSW) in September
Grower workshops ndash AP12029 Apples and pears in a changing climate 3
Seventeen growers from the Perth Hills Orchard Improvement Group visited the Applethorpe
Research Station as part of their QLD study tour As the central part of their half day tour of
the research station a climate change workshop event was held to discuss some of the
outcomes from current research and in particular some of the issues facing the growers in the
Perth Hills district This region was not part of the WA grower workshop event held in Manjimup
in 2014
During the workshop presentations were made by Heidi Parkes Peter Nimmo and Allan
McWaters about the climate change research project currently underway including the modelled
predictions management of QFF (one concern under a changed climate) and new apple
varieties better suited to different disease and climate pressures
The Climate Change Risk Management Matrix is a tool developed by DAF QLD to address
uncertainty by identifying the impacts risk and vulnerability associated with climate change
and adaptive responses Identifying and analysing risks and opportunities using this risk
management approach can help to plan responses to climate variability and climate change
and thus enable growers to be proactive and more effective in adapting to future uncertainty
This tool has been adapted to be used not only in grains and meat and wool production but
also in horticulture
As New South Wales has not been included in former National Roadshow tours and based on
interest shown from the Sydney Basin area Kevin Dodds from NSW DPI and an interested
grower in Bilpin Bill Shields were contacted and a workshop organised The interactive
workshop on a growerrsquos property with about 25 participants entailed a tailored winter chill
presentation by Rebecca Darbyshire (The University of Melbourne) introduction to climate
change impacts on pome fruit and research outcomes from the project such as the latest
dormancy breaker research from QLD by Heidi Parkes as well as modelled predictions for the
region plus a field walk The session was organised facilitated and evaluated by Kevin Dodds
(NSW DPI) and Jenny Treeby (DEDJTR VIC) In the evaluation growers pinpointed earlier
bud burst flowering and maturity as well as sunburn as their main climate change related
challenges The workshop gave them a better understanding of the complexity of factors
involved in budburst and flowering and the chill portions calculator was seen as an excellent
toolincentive to collect and utilise their own data better
In order to reach a much wider pome fruit audience project outcomes were displayed at the
Horticulture Centre of Excellence stand at the 2015 National Horticulture Convention A
poster six state specific chill fliers using the chill portions model the HIN (wwwhincomau)
project webpage and the chill calculator were used as a static display Additionally time was
made to meet the project researchers at the stand during program breaks an option which
was taken up by quite a few growers who felt that this was a great opportunity to have a
chat with a scientist
Grower workshops ndash AP12029 Apples and pears in a changing climate 4
Lessons learnt
1 Having a core team responsible for communication (Heidi Parkes DAF QLD) Susie
Murphy-White (DAFF WA) Rebecca Darbyshire (UoM) and Jenny Treeby (DEDJTR
VIC) ensured timely relevant and consistent information was being made available to
growers at the workshops and the APAL conference This also emphasised a multi-
state approach (including New South Wales) and added importance to the project
outputs and resulted in messages such as in New South Wales where the presenters
were thanked for their presentations and the effort made to come to that location
2 Presenting locally relevant data using model predictions established within the
projects by researchers resulted in the grower audience being engaged and feeling
confident to ask questions and provide feedback and lessons learnt in their orchard
3 Utilising well established grower groups such as in Queensland and New South Wales
as well as local well respected extension officers (Front Line Advisors) such as Clinton
McGrath (DAF QLD) and Kevin Dodds (NSW DPI) ensured ease of facilitation
4 Evaluation of workshops is still suffering from low return rates of around 50 of even
short evaluation forms possibly due to a lack of understanding of the importance of
this form of feedback Interactive keypad technology as employed in the last round
seems to have had a better return rate (possibly due to novelty factor) and will be
contemplated for further projects
5 Knowledge gaps identified as a result of these workshops include
varietal chill requirements for existing and new varieties
lack of understanding of the difference between chill hours units and portions
and the use of chill portions as the most accurate measure of winter chill available
adaptation strategies to heat stress
does soil temperature influence endo and or ecto dormancy
do phenology models based on meteorological data adequately represent buds
within a tree
is the current knowledge of pome fruit physiology extensive enough to be able to
accurately predict winter chill accumulation processes
there is a strong focus on the potential impact of extreme events on the industry
under future climate scenarios with less understanding about the potential
impacts of more subtle increases in temperature
need for more accurate in-season and longer term climate forecasting to enable
growers to take actions that reduce climate risk
Resources
httpwwwhincomauprojectsapple-and-pear-production-in-a-changing-climate
Grower workshops ndash AP12029 Apples and pears in a changing climate 5
httpwwwhincomauprojectswinter-chill-and-fruit-trees
regional-chill-accumulation-victoria
regional-chill-accumulation-queensland
regional-chill-accumulation-for-new-south-wales
regional-chill-accumulation-for-south-australia
regional-chill-accumulation-for-tasmania
regional-chill-accumulation-for-western-australia
Blogs
httpwwwhincomauprojectsapple-and-pear-production-in-a-changing-climateexplore-
your-regional-climate
- AP12029 cover sheet
-