final report 2019/951 - era.daf.qld.gov.au
TRANSCRIPT

Sugar Research Australia Final Report - Project 2016/955
1
•
Final report prepared by: Phil-Anthony Patane, Carol Norris, Brendon Nothard, Tichaona Pfumayaramba & Casey Venables
Chief Investigator(s): Phil-Anthony Patane
Research organisations: Sugar Research Australia & Queensland Department of Agriculture and Fisheries
Co-funder: Australian Department of Agriculture, Water and the Environment
Date: 8 April 2020
Key Focus Area (KFA): 7. Knowledge and technology transfer andadoption
Adoption of practices to mitigate harvest losses
− Phase 2
Adoption of practices to mitigate harvest losses
Adoption of practices to mitigate harvest losses
Adoption of practices to mitigate harvest losses
FINAL REPORT 2019/951

Sugar Research Australia Final Report - Project 2016/955
2
© Sugar Research Australia Limited 2020
Copyright in this document is owned by Sugar Research Australia Limited (SRA) or by one or more other parties which have provided it to SRA, as indicated in the document. With the exception of any material protected by a trade mark, this document is licensed under a Creative Commons Attribution-NonCommercial 4.0 International licence (as described through this link). Any use of this publication, other than as authorised under this licence or copyright law, is prohibited.
http://creativecommons.org/licenses/by-nc/4.0/legalcode - This link takes you to the relevant licence conditions, including the full legal code.
In referencing this document, please use the citation identified in the document.
Disclaimer:
In this disclaimer a reference to “SRA” means Sugar Research Australia Ltd and its directors, officers, employees, contractors and agents.
This document has been prepared in good faith by the organisation or individual named in the document on the basis of information available to them at the date of publication without any independent verification. Although SRA does its best to present information that is correct and accurate, to the full extent permitted by law SRA makes no warranties, guarantees or representations about the suitability, reliability, currency or accuracy of the information in this document, for any purposes.
The information contained in this document (including tests, inspections and recommendations) is produced for general information only. It is not intended as professional advice on any particular matter. No person should act or fail to act on the basis of any information contained in this document without first conducting independent inquiries and obtaining specific and independent professional advice as appropriate.
To the full extent permitted by law, SRA expressly disclaims all and any liability to any persons in respect of anything done by any such person in reliance (whether in whole or in part) on any information contained in this document, including any loss, damage, cost or expense incurred by any such persons as a result of the use of, or reliance on, any information in this document.
The views expressed in this publication are not necessarily those of SRA.
Any copies made of this document or any part of it must incorporate this disclaimer.
Please cite as: Patane P, Norris CA, Nothard B, Pfumayaramba T, Venables C (2020) Adoption of
practices to mitigate harvest losses – Phase 2: Final report Project 2019/951. Sugar Research
Australia Limited, Brisbane.

Sugar Research Australia Final Report - Project 2016/955
1
ABSTRACT
Patane et al. 2019 determined that Harvesting Best Practice (HBP) is predicated by two essential objectives:
1. Defining the critical point where harvesting losses can be minimised and delivered yields improved to achieve the best economic return for the grower and harvesting operation; and
2. Balancing losses with cane quality, which is determined by sound billet quality with an acceptable level of Extraneous Matter (EM).
Despite significant research into the impact of higher harvester pour rates and fan speeds on harvested cane yields, use of HBP recommendations prior to the commencement of the adoption program across the industry was relatively low. Full HBP adoption across the Australian sugarcane industry could substantially increase industry revenue without the need for horizontal expansion (increase in cane land).
In 2019, continuing on from the work conducted by Patane et al. (2019), Sugar Research Australia in partnership with the Queensland Department of Agriculture and Fisheries delivered:
• 14 demonstration trials:
o 12 Green Cane
o 2 Burnt Cane
• Herbert commercial demonstration trial
o 12 trials – 2 x Contractors and their grower groups
• 6 SCHLOT Live validation trials to benchmark the accuracy of the SCHLOT Live cane loss monitor against the SRA Infield Sucrose Loss Measurement System.
The performance of settings recommended by HBP was compared with each harvesting operation’s standard practice by assessing yield, CCS, bin mass, extraneous matter (EM), fibre, sugar loss and revenue. To highlight the strong relationship between cane loss and excessive pour rates and fan speeds, treatments with higher pour rates and fan speeds and lower pour rates and fan speeds were also trialled. Results were presented to each harvesting group to inform their decision-making. Cane loss, production and revenue data from the fully replicated and randomised trials were analysed to identify differences between industry standard harvesting practices and those recommended by HBP.
The 2019 project learnings from eight ’conforming’ green cane trials, i.e. trials that supplied all the necessary data, suggest that participating harvesters are typically operated at ground and fan speeds that are on average 0.9 km/hr and 101 rpm above those recommended under HBP boundaries.
The trial process indicates that the average sugar loss out of the extractor increased by 0.20 t/ha at contractor standard when compared with recommended HBP settings. There was a marginal decrease in EM from standard to recommended practice (not statistically different). Mill analysis across all trials identified that cane and sugar yields for recommended practice were 4.19 t/ha (cane yield) and 0.5 t/ha (sugar yield) higher than standard practice. Neither CCS nor fibre levels were significantly different between standard to recommended treatments However, reduced pour rates (i.e. lower ground speeds) also increased the cost of harvesting.
The Herbert commercial demonstration trials revealed that fan speeds and ground speeds were on average 52 rpm and 1.1 km/hr above recommended guidelines. Mill analysis across the 12 trials suggested cane yield were 4.26 t/ha higher (significantly different) at recommended practice when compared to contractor standard practice. Sugar yield increased by 0.6 t/ha (significantly different) when moving from standard to recommended practice. CCS and Fibre levels remained relatively stable, with no significant difference.

Sugar Research Australia Final Report - Project 2016/955
2
To improve adoption rates, growers would need to consider compensating contractors for these additional costs. A cost analysis for selected trials in the 14 green and burnt cane demonstration trials has not yet been completed. However, cost analysis on the Herbert commercial demonstration trial suggests the increased cane and sugar yields generated by the recommended practice, when compared to contractor standard practice, implies an increase to grower gross revenue of $151/ha (+4.7%). Reduced ground speeds increased the cost of harvesting by $37/ha. To incentivise the move to HBP, additional compensation would need to be paid to harvesting contractors by growers. Subtracting the additional harvesting costs (including fuel and levies) from the additional grower revenue leaves a net benefit of $114/ha for the grower (+4.4% higher net revenue).

Sugar Research Australia Final Report - Project 2016/955
3
EXECUTIVE SUMMARY
Research dating back to the 1990s substantiates the significant gains to the sugar industry value chain
when cane is harvested within Harvesting Best Practice (HBP) parameters. Unfortunately, due to
constraints (real or perceived), the industry continues with sub-standard harvesting practices (e.g.
operating parameters above the identified optimal capacity), high fan speeds and too many blades
per chopper drum leading to juice loss through increased cuts per stalk.
The barriers to adopting HBP have become more apparent over time and include two important
factors:
1) The industry has a limited understanding of the impact of harvesting cost changes and the
importance of incentives; and
2) Poor implementation of HBP results in no significant production or economic benefit.
These barriers are exacerbated by the complexities of differing regional requirements. Each region
has unique drivers (e.g. payment arrangements between growers and contractors and between
contractors and their machine operators) and pinch points (operating hours, bin fleets, number of
contractors). In order to address these constraining forces, growers, contractors and millers must
work together.
To gain adoption of HBP, milling companies require further support to fully investigate the impact on
logistics, cane quality and sugar production. It is anticipated that the delivery of cane and cane-quality
must be monitored to determine the effect (if any) on milling processing requirements.
Regional working groups comprising of representatives from all three sectors of the value chain are
needed to support the implementation of economically beneficial HBP and limit or reduce the limiting
forces in the adoption of HBP parameters.
Patane et al. (2019) continued the research, development and adoption program to improve the
efficiency of the Australian sugarcane harvesting sector and address the issues previously outlined.
The project, Enhancing the sugar industry value chain by addressing mechanical harvest losses through
research, technology, and adoption, comprised considerable contributions from the Queensland
Department of Agriculture and Fisheries (DAF), other industry advisory bodies, milling companies,
harvester operators and growers. The continued investment in this project leverages off the initial
$3.55 million investment from the Australian Government (Department of Agriculture, Water and the
Environment) and $1.85 million from SRA. SRA Project 2016/955, Adoption of practices to mitigate
harvest losses, formed part of this wider project.
Project 2019/951, an addendum to Project 2016/955, was divided into three specific components:
1. Demonstration trials:
a. 12 green cane trials; and
b. 2 burnt cane.
Each group participated in a demonstration trial to determine the impact of harvesting operations on
cane and sugar loss. Trials were conducted by SRA using the Infield Sucrose Loss Measurement System
(ISLMS) together with mass-balance analysis. Data collected included cane and sugar yields, CCS, gross
and net grower revenue per hectare, extraneous matter (EM), billet quality and length, and amounts
of sugar and biomass left in the field.
The green cane 2019 trials concluded that, by reducing the average flowrate into the harvester by 19
t/hr (or groundspeed by 0.9 km/hr) and primary extractor fan speed by 101 rpm from standard

Sugar Research Australia Final Report - Project 2016/955
4
practice (commercial), cane yield and sugar increased by 4.2 t/ha and 0.5 t/ha respectively (or 3.7%
and 3.3%).
The yield gain delivered a $136/ha (or 3.1%) increase in grower gross revenue.
The reduction in flowrate into the harvester will, however, impact harvesting costs. Harvesting cost
variations are determined by the size of the flowrate reduction but offset by the yield gain associated
with reduced extractor fan speed. Costs analysis have not been completed for any of 14 trials (12
green cane, 2 burnt cane) for the 2019 harvest season.
Five burnt cane trials, two from this project and three from 2016/955, indicate an improvement in
cane and sugar yield of 3.3 t/ha and 0.3 ts/ha respectively when comparing the moderate treatment
against the aggressive treatment. The control treatment had the highest mean total grower revenue
followed by the moderate (-$124/ha) and aggressive (-$249/ha) treatments. Net grower revenue
followed a similar trend with the moderate and aggressive treatments obtaining $88/ha and $185/ha
less than the control treatment respectively.
2. Herbert Demonstration trial: a. 12 commercial trials (economic outcomes of standard vs recommended practice) with
two Herbert region contractors and their grower groups.
Two Herbert contractors and their grower group participated in a series of demonstration trials
(Contractor 1 – 7 trials; Contractor 2 – 5 trials). Trials were conducted by SRA using the mass balance
analysis. Data collected included cane and sugar yields, CCS, gross and net grower revenue per
hectare, extraneous matter (EM), billet quality and length. Harvesting costs were evaluated for all 12
trials to determine the impact on harvesting costs from using HBP, which commonly involved slowing
down the harvester. The cost evaluations were comprehensive and considered the full spectrum of
costs (machinery depreciation, labour, fuel, maintenance, etc.), which drew upon trial data and
required a substantial amount of operational information to be collected from the respective
harvesting operations.
Results from the 2019 Herbert green cane commercial trials reflected a similar trend. By reducing fan and ground speed by 53 rpm (7%) and 1.1 km/h from standard (commercial) practice, cane yield increased by 4.3 t/ha (4.9%) with sugar yield increasing by 0.6 t/ha (5.2%). This yield gain delivered a $150/ha (or 4.7%) increase in grower gross revenue with an average increase in harvesting cost of $36/ha to harvest at recommended practices (including the cost to harvest at slower ground speed), leaving a net grower benefit of $114/ha.
3. SCHLOT Live validation trials: a. Six trials (incorporated into the 12 green cane trials) to substantiate the accuracy of the
SCHLOT Live cane loss monitor (from Project 2016/951) against the SRA Infield Sucrose Loss Measurement System (ISLMS).
The SCHLOT Live trial results using electronically logged data indicated that the repeatability of the cane loss values derived by SCHLOT under typical harvesting conditions was high and well-correlated with the ISLMS measurements. Where variance was observed between the SCHLOT estimate and the ISLMS, in particular with the Case IH 8800 series harvester, SCHLOT Live algorithms can be adjusted with the support of the data.

Sugar Research Australia Final Report - Project 2016/955
5
TABLE OF CONTENTS
ABSTRACT ............................................................................................................................................. 1
EXECUTIVE SUMMARY .......................................................................................................................... 3
LIST OF TABLES ...................................................................................................................................... 7
TABLE OF FIGURES ................................................................................................................................ 7
1. BACKGROUND ............................................................................................................................... 9
2. PROJECT OBJECTIVES .................................................................................................................. 10
2.1. Objectives ........................................................................................................................... 10
3. OUTPUTS, OUTCOMES AND IMPLICATIONS ................................................................................ 10
3.1. Outputs ............................................................................................................................... 10
3.2. Outcomes and Implications................................................................................................. 11
4. INDUSTRY COMMUNICATION AND ENGAGEMENT ..................................................................... 13
4.1. Industry engagement during course of project ................................................................... 13
4.1.1. Key Messages: ............................................................................................................. 14
4.1.2. Target Audience .......................................................................................................... 14
4.1.3. Key Objectives ............................................................................................................. 15
4.2. Industry engagement activity .............................................................................................. 15
4.2.1. Industry Engagement activities: .................................................................................. 15
5. METHODOLOGY .......................................................................................................................... 16
5.1. Harvesting trial methodology (Patane et al., 2019) ............................................................ 16
5.1.1. Green Cane Trials ........................................................................................................ 16
5.1.2. Burnt Cane Trials ......................................................................................................... 16
5.1.3. Net revenue methodology .......................................................................................... 17
5.1.4. Herbert commercial demonstration trial methodology .............................................. 17
5.1.5. Harvesting cost and net benefit methodology ............................................................ 17
5.1.6. Trial statistical analysis methodology .......................................................................... 18
5.1.7. SCHLOT LIVE Trial methodology .................................................................................. 19
6. RESULTS ...................................................................................................................................... 19
6.1. Harvesting Trials .............................................................................................................. 19
6.1.1. Green cane trial results ............................................................................................... 19
6.1.2. Burnt cane trial results ................................................................................................ 21
6.1.3. Herbert commercial demonstration trial results ......................................................... 23
6.1.4. SCHLOT Live Trial Results ............................................................................................ 24
7. DISCUSSION ................................................................................................................................. 27
7.1.1. Green cane trials ......................................................................................................... 27
Sugar Research Australia Final Report - Project 2016/955
6
7.1.2. Burnt Cane .................................................................................................................. 28
7.2. Herbert Demonstrations ................................................................................................. 29
7.3. SCHLOT Live .................................................................................................................... 30
8. CONCLUSION ............................................................................................................................... 31
9. RECOMMENDATIONS FOR FURTHER RD&A ................................................................................ 32
9.1.1. HBP net benefit decision making tool ......................................................................... 32
9.1.2. Impact to milling logistics and efficiencies .................................................................. 32
9.1.3. Harvester operator training program .......................................................................... 32
9.1.4. Burnt cane loss assessments ....................................................................................... 32
9.1.5. Impact of HBP on crop ratoonability ........................................................................... 32
10. PUBLICATIONS ............................................................................................................................. 33
11. ACKNOWLEDGEMENTS ............................................................................................................... 33
12. REFERENCES ................................................................................................................................ 33
13. APPENDIX .................................................................................................................................... 35
13.1.1. Appendix 1 METADATA DISCLOSURE .......................................................................... 35
13.2. Appendix 2 – New South Wales Bin Configuration Costings ........................................... 37
13.2.1. Background ................................................................................................................. 37
13.2.2. Costing methodology .................................................................................................. 37
13.2.3. Burnt cane results ....................................................................................................... 37
13.2.4. Green cane results ...................................................................................................... 39

Sugar Research Australia Final Report - Project 2016/955
7
LIST OF TABLES
Table 1: Key industry messages .......................................................................................................... 14
Table 2: Harvesting adoption communication framework .................................................................. 15
Table 3: Average harvester performance under different practices ................................................... 20
Table 4: Sugar loss (measured in field) and total biomass for each treatment ................................... 20
Table 5: Mean production and revenue results for each treatment ................................................... 21
Table 6: Average harvester performance under different practices (burned cane) ............................ 22
Table 7: Mean production and revenue results for each treatment (burned cane)............................ 22
Table 8 Average harvester performance between recommended and contractor standard practice
(commercial) ....................................................................................................................................... 23
Table 9 Mean production and revenue results for each treatment .................................................... 23
Table 10 SCHLOT Live Trial parameters .............................................................................................. 24
Table 11 Metadata disclosure 1 .......................................................................................................... 35
Table 12 Metadata disclosure 2 .......................................................................................................... 35
Table 13 Metadata disclosure 3 .......................................................................................................... 35
Table 14 Metadata disclosure 4 .......................................................................................................... 36
Table 15 Metadata disclosure 5 .......................................................................................................... 36
Table 16: Bin size and haulout configurations .................................................................................... 37
Table 17: Time cycle outputs (summary) - burnt ................................................................................ 38
Table 18: Configuration of cost changes (including fuel) - burnt ........................................................ 38
Table 19: Configuration of cost changes (excluding fuel) - burnt ........................................................ 38
Table 20: Configuration of time cycle and efficiency outputs detailed - burnt ................................... 39
Table 21: Time cycle outputs (summary) - Green ............................................................................... 39
Table 22: Configuration of cost changes (including fuel) - green ........................................................ 40
Table 23: Configuration of cost changes (excluding fuel) - green ....................................................... 40
Table 24: Configuration of time cycle and efficiency outputs detailed - green ................................... 41
TABLE OF FIGURES
Figure 1: Breakdown of respondents .................................................................................................. 11
Figure 2. Are you interested in adopting Harvesting Best Practice (HBP) settings for your operation as
either a grower or harvesting contractor? .......................................................................................... 12
Figure 3. What do you consider your barriers to adoption? ............................................................... 12
Figure 4. How are harvesting charge rates being determined? .......................................................... 13
Figure 5. Do you think a tool would be useful in assisting you to determine a harvester charge rate to
implement HBP, which might help to inform negotiations? ............................................................... 13
Figure 6: Harvesting cost modelling process ....................................................................................... 18
Figure 7: ISLMS compared to SCHLOT Live Cane loss monitor - CH570 .............................................. 25
Figure 8: ISLMS compared to SCHLOT Live cane loss monitor - Case IH 8810 ..................................... 25
Figure 9: ISLMS compared to SCHLOT Live cane loss monitor - JD3520 .............................................. 26
Figure 10: ISLMS compared to SCHLOT Live cane loss monitor - Case IH 8800 ................................... 26
Figure 11: Harvester parameters of replicate two and three - Proserpine trial (Case IH 8800) .......... 27
Figure 12. Graphical depiction of different speeds, flow rate, sugar loss, pour rate and cane yield
between standard (Std.) and recommended (Rec.) settings in green cane. ....................................... 27

Sugar Research Australia Final Report - Project 2016/955
8
Figure 13. Graphical depiction of different speeds, flow rate, pour rate and cane yield between
control (Ctrl.) and aggressive (Aggr.) settings in burnt cane. .............................................................. 29
Figure 14. Graphical depiction of different speeds, flow rate, sugar loss, pour rate and cane yield
between standard (Std.) and recommended (Rec.) settings. .............................................................. 30

Sugar Research Australia Final Report - Project 2016/955
9
1. BACKGROUND
Historically, the benefits of Harvesting Best Practice have been extensively promoted within the Australian sugar industry. Research in the 1970s identified substantial losses of both cane and sugar from mechanically harvesting green cane. Hurney et al. (1984) identified cleaning losses of 5-8 t/ha in burnt cane, while Ridge and Dick (1988) identified a wide range of losses depending on harvesting practice, field conditions, varieties and time of harvest. Shaw and Brotherton (1992) reported an average cane loss of 8.2 t/ha in green cane in the Mulgrave region.
Linedale and Ridge (1996) described a “successful campaign to minimise harvesting losses” over the period 1992 to 1995. Agnew et al. (2002) ran a series of in-depth trials and workshops looking at different aspects of harvester design and operation.
From 1997 to 1999, Whiteing and Paton (Sandell and Agnew, 2002) conducted over 50 harvesting trials that investigated pour rate, fan speed, cane loss and cane quality. Key findings included:
• Harvester cane loss is strongly correlated to extractor fan speed.
• Extraneous Matter (EM) is influenced by harvester pour rate and field conditions.
The above findings led to the publication of the BSES Harvesting Best Practice Manual for Chopper-Extractor Harvesters (Sandell and Agnew, 2002), which was updated in 2014 by Sugar Research Australia. Industry interest in harvesting losses regained focus in 2013 with a value chain analysis of the industry prepared by John Pollock (Pollock, 2013), which demonstrated the beneficial impact of adopting Harvesting Best Practice (HBP) across the entire industry.
Despite identification of these losses, there was little evidence of industry adoption of HBP by 2016 and incentive-based schemes for contractors were not customary. Deterioration in many parameters of cane quality was noted by Larsen et al. (2016). Keeffe (2017) conducted a survey of harvester operators and growers, seeking to better understand attitudes towards improvements to harvesting equipment. Participants (harvester operators and growers) who responded to the survey reported the following:
- 42% of contractors felt growers were not providing the best possible conditions to harvest their cane.
- 33% of growers felt their contractor was not providing the best possible harvesting service.
It was clear from these observations that the industry required ongoing support to overcome these attributional biases and eliminate barriers to adoption.
Barriers to the adoption of HBP are complex. Patane et al. (2019) identified the following as key restraints:
1. Lack of recognition of the scale of losses and opportunity to minimise these losses through improved practices. It has been stated that current machines are very good at disguising the “evidence” in harvesting losses.
2. Harvester owner expectations that there will be extra harvesting costs from changes to practice and a perceived inability to recoup them.
3. Lack of communication between the harvester operator and the farmers in the group concerning HBP.
4. Pressures on harvesting groups to harvest at high flow rates to ensure bin allotments are filled and area is covered.

Sugar Research Australia Final Report - Project 2016/955
10
5. Concern that large contracts, which already need to harvest over a significant part of the working day, do not allow for lower flow rates.
6. Pressure to maximise bin weights, leading to a perception of the need to shorten billet lengths to increase bulk density.
7. Concern that reducing fan speed would lead to an increase in EM and a subsequent loss of CCS.
Overcoming these issues needed a different approach. With some exceptions, past efforts to reduce losses involved advisors urging harvester operators to slow down and reduce fan speed, without considering the economic and social constraints. To effect change, it was necessary to involve those with the ability to make decisions – the harvesting group (defined as the harvester owner and the growers serviced) and not just the operator. The inclusion of the milling sector was also part of the approach, to ensure that important milling considerations such as billet length, bin weights and Extraneous Matter (EM) levels were not in conflict with the aim to reduce losses.
2. PROJECT OBJECTIVES
2.1. Objectives
Cultural change is a protracted and evolutionary process. Whilst significant progress has been made in Project 2016/955, it is apparent harvesting, a crucial component of the sugar value chain, requires further work to realise the industry gains identified by the 95 trials from the 2017 and 2018 seasons.
In order to continue the work undertaken in 2017 and 2018, the 2019 project focused on the following key objectives:
• Work closely with harvesting groups and assist with decision-support regarding an appropriate
practice change response to capture additional value
• Establish a change in harvesting practice in at least 50% of the harvesting groups engaged
• Evaluate the benefits and costs of improved harvesting practice across the value chain
• Validate outputs of the real-time cane loss monitoring system SCHLOT Live in commercial
harvesting operations
Each of the above targets was an important step in providing information to reinforce the decision-making process when Contractors and Growers seek to bridge the gap between commercial (contractor standard practice) and HBP. However, further consideration must be given to the decision-making process to support the desired industry outcomes. Understanding the focus of industry stakeholders has enabled the SRA Harvesting Team to uncover potential challenges, prioritise tasks and opportunities, identify solutions and develop a framework of engagement to transform information and data into practice change.
3. OUTPUTS, OUTCOMES AND IMPLICATIONS
3.1. Outputs
1. 14 harvesting groups that participated in demonstration trials now acknowledge the reality of
harvest losses and will continue to work within the groups (growers and contractors) to
minimise them.
2. Productivity evaluations from 14 demonstration trials evaluating sugar and cane loss from a
suite of harvester settings, including HBP.

Sugar Research Australia Final Report - Project 2016/955
11
3. Validation of yield and economic gains of HBP to the Herbert region growers.
4. Validation of increased revenues and yield gain for Growers to compensate the Harvesting
Contractor to change practice whilst preserving a substantial net benefit per hectare to the
Grower.
5. Validation of SCHLOT Live performance against the Infield Sucrose Loss Measurement System;
and
6. Validation of the effectiveness of SCHLOT Live as a tool to support the adoption of HBP.
3.2. Outcomes and Implications
When considering the extra cost of harvesting, green cane industry-wide adoption of HBP has the potential to add $26 million of net benefit (i.e. change in revenue less change in cost of HBP) to growers’ pockets.
As a result of the work undertaken during the 2017, 2018 and 2019 seasons, the project focus has now moved from information and data gathering to driving meaningful decision making in the adoption of efficient harvesting practices in the Australian sugar industry. SRA has identified the economic impact to industry as the primary motivator for adoption. However, making accurate economic decisions is daunting. Outcomes of an industry survey have strongly indicated a decision-support tool will assist in the dismissal of insufficient motivation and cognitive biases as outlined in the above-mentioned barriers to adoption. SRA and the Department of Agriculture and Fisheries have commenced work on the development of a harvesting predictive model, maximising the use of the data gathered through the 123 demonstration trials conducted between 2017 and 2019.
In late 2019, the SRA and DAF Harvesting Team conducted a whole-of-industry survey of growers, contractors, millers, farm managers and contractor employers (148 responses) to understand industry sentiment towards the adoption of HBP. Responses were not limited to project participants. Analysis of the data indicated that 59% of customers were growers who didn’t own a harvester while 37% owned harvesters either for their own use or for contracting purposes (Figure 1).
Figure 1: Breakdown of respondents

Sugar Research Australia Final Report - Project 2016/955
12
Figure 2. Are you interested in adopting Harvesting Best Practice (HBP) settings for your operation as either a grower or harvesting contractor?
65% of total respondents, and 72% of growers not involved in harvesting, indicated they would be interested in implementing HBP (Figure 2). Interestingly 23% (18% of growers) indicated that they had already adopted HBP.
Figure 3. What do you consider your barriers to adoption?
50 of the 148 participants named barriers to adoption of HBP (Figure 3), with 78% identifying the most significant barriers to be:
• Contractor opposition and resentment (industry perception that contractors are doing a bad job),
• Uncertainty of the benefits/trust in research (“What’s in it for me?”/lack of mentoring and coaching in research outcomes),
• Cost uncertainty (lack of decision-support tools to support economic outcomes),
• time constraints (social and economic impact to contractors).

Sugar Research Australia Final Report - Project 2016/955
13
Figure 4. How are harvesting charge rates being determined?
From 92 responses, it is apparent the payment system lacks appropriate frameworks to negotiate contractor and grower arrangements (Figure 4).
Figure 5. Do you think a tool would be useful in assisting you to determine a harvester charge rate to implement HBP, which might help to inform negotiations?
Of 104 participants, 63% indicated that they would be interested in a decision-support model to assist with their decision making (Figure 5). However, this percentage will represent early industry adopters. It is believed once acceptance of research increases through coaching and mentoring, this ratio would likely increase.
4. INDUSTRY COMMUNICATION AND ENGAGEMENT
4.1. Industry engagement during course of project
The project team implemented a communication strategy specifically designed to address the diversified needs of the value chain (grower, contractor, millers and industry stakeholders). The communication plan raised the awareness of project objectives and outcomes and outlined key messages, target audiences, mechanisms and activities related to facilitating dissemination of information (Patane et al., 2019).

Sugar Research Australia Final Report - Project 2016/955
14
4.1.1. Key Messages:
Table 1: Key industry messages
Target Audience
Key Messages
Growers • Losses are real and the grower should take an interest in how their harvesting contractor operates, planning the harvest with their contractor.
• Economic modelling suggests additional revenue gained from harvesting at best practice adequately covers the harvesting cost to slow down and yield a net benefit to the grower.
• Field conditions impact on harvesting efficiency. For example: o Matching row profile to harvester setup will result in less chance of stool damage and better crop yield in
future years. o Field arrangement to lengthen rows and facilitate turning.
Contractors - Harvesting
• Changed commercial arrangements can generally compensate for any potential cost increase arising from improved harvesting practices that reduce harvesting loss.
• Grower / contractor dialogue is crucial.
• Harvesting contractors are operating within a constrained industry.
• Grower returns can be greatly maximised by supplying high quality cane (sound billets with reasonably low EM levels) to the mill that result in improved sugar yield.
• Harvesting rates are governed by flow rate into the choppers and chamber size: o +/-80 tph – Case (red machine) o +/-90 tph – John Deere (green machine).
• Correct Flow Rate = function of yield, ground speed, row width.
• Reduced loss = function of extractor fan and flow rate.
• Relatively small changes to flow rate through adjusting ground speed and fan speed to ensure optimum settings can make a big difference in reducing losses.
Millers • Significant increase in cane delivered to the mill, with no increase in area under cane.
• No significant difference in EM levels across the Australian green cane industry.
• No significant difference in bin weights and bin fill rates.
• Improved cane quality through consistent billet length and improved billet quality.
• Longer billet length will reduce sugar loss without significantly decreasing bin density.
Industry Stakeholders
• Industry support is crucial to the adoption of HBP.
• Significant boost to industry cane yield with no increase in cane land.
• Changed contractor payment arrangements are required to adopt HBP.
• Harvesting rates are governed by flow rate into the choppers and chamber size: o +/-80 tph – Case (red machine) o +/-90 tph – John Deere (green machine).
• Correct Flow Rate = function of yield, ground speed, row width.
• Reduced loss = function of extractor fan and flow rate.
• It is essential industry adopts the use of decision-support tools, live monitoring and validation tools.
• Cultural change is necessary in the sugar industry value change, requiring collaboration to diagnose solutions to barriers to adoption.
(Patane et al., 2019)
4.1.2. Target Audience
The following audiences were targeted as part of communication activities in this project:
• Growers and miller investors in SRA.
• Harvester operators.
• Industry representative bodies.
• Productivity Services organisations.
• General community.

Sugar Research Australia Final Report - Project 2016/955
15
4.1.3. Key Objectives
• To deliver a communication program that enhances and supports the adoption of HBP:
o Clearly communicate the vision for the HBP Adoption project.
o Deliver a communication program that outlines the benefits and impacts of changed practices.
o Deliver a communications program that provides opportunities for dialogue with the value chain.
o Promote the activities of the SRA Harvesting Team.
Table 2: Harvesting adoption communication framework
Activity Audience Outcome Workshop presentations. Growers;
contractors; millers; industry.
Appropriately branded presentations outlining adoption trial results, highlighting the impact of moving from standard practice to HBP. Facilitated discussion, enquiry and adoption.
Appropriate and targeted social media activities throughout the duration of the project – publicising industry forums, field activities (trials, field days, research and adoption updates published in other media - cane clip videos, industry newsletter).
Growers; contractors; industry; government; journalists and community.
Regular updates which enabled the communication of the project’s research and adoption activities. Generated ongoing interest and discussion amongst the value chain.
Graphic design of event invitations, hand-outs, survey questionnaires and communication materials.
Growers; contractors; industry; government; journalists and community.
Ensured consistent branding across SRA, whilst acknowledging SRA project partners (Australian Government – Department of Agriculture, Water and the Environment; Queensland Government – Department of Agriculture and Fisheries).
Media activity. Growers; contractors; millers; industry; government; journalists and community.
Promotion of the project through the broadcast of encouraging “good news” stories, in particular positive outcomes experienced by early adopters. This strategy validated the process and supported a move towards HBP parameters.
Update in SRA Cane Connection magazine and SRA Milling Matters.
Growers; contractors and millers.
Dissemination of information to SRA’s primary audience: growers, millers and contractors.
Informal communication activities. Growers; contractors; millers and industry.
Informal dialogue engaging in active listening whilst encouraging divergent thinking. Assisted in enabling constructive discussion and consequently raising SRA’s and the project team’s profile. Stakeholders recognised they were being consulted on drivers for and barriers to adoption.
4.2. Industry engagement activity
4.2.1. Industry Engagement activities:
The Harvesting Adoption Team continued its concerted program to brief the Australian sugarcane industry of trial results. These briefings have been useful collaboration sessions to inform the strategy and future direction of the project.
• Herbert – Ongoing workshops to mentor growers and harvesting contractors towards the adoption of HBP

Sugar Research Australia Final Report - Project 2016/955
16
• Proserpine – one-on-one meetings with the Productivity Services, growers and harvesting contractors to develop a long-term strategy to support the adoption of HBP in the Proserpine region.
• Mackay– One-on-one meetings with Mackay Sugar Executive Management, and presentation to Mackay Sugar 2020 pre-season harvesting contractor meeting (~100 attendees)
• Burdekin – Presentation to Regional Adoption Advisory Group and Burdekin harvesting focus group.
• Bundaberg – Ongoing workshops to mentor growers and harvesting contractors towards the adoption of HBP.
• Isis – Ongoing workshops to mentor growers and harvesting contractors towards the adoption of HBP.
• NSW – Presentation on project findings to Sunshine Sugar and NSW harvesting focus group. Cost analysis for changing bin fleet was conducted and presented to Sunshine Sugar and NSW harvesting focus group.
It must be noted that recent planned industry engagement had been severely impacted by the onset of the COVID-19 pandemic.
5. METHODOLOGY
5.1. Harvesting trial methodology (Patane et al., 2019)
Industry demonstration trials (17) were designed to validate the production and revenue implications from using commercial (standard) harvester settings instead of HBP settings and were split into the following categories:
1. Green cane – 12 trials. 2. Burnt cane – 5 trials (2 from this project and 3 from 2016/955).
The trial protocols were block-specific, and all treatments were adapted for prevailing block and machine conditions.
5.1.1. Green Cane Trials
Four treatments in each trial were labelled ‘control’, ‘recommended’ (HBP), ‘contractor’s standard’ and ‘aggressive’. All treatments followed the same protocols as outlined in Patane et al. (2019)
Cane yields were assessed using conventional mass-balance protocol including mill weighbridge, NIR and ISLMS (Whiteing et al., 2016). The GPS time-stamped waypoints enabled the calculation of average ground speeds and product flow rates into and exiting the harvester. Paddock losses were assessed using the SRA ISLMS protocol (Whiteing et al., 2016). The ‘control’ treatment was used as the best possible practical estimate of total biomass in the field. Although operating the harvester with all fans off would be a better estimate of total biomass, this was impractical as EM levels would potentially impact mill processing requirements. Cane loss in other treatments was estimated by inference.
5.1.2. Burnt Cane Trials
As outlined in Patane et al. (2019), the burnt cane methodology included three treatments: control, moderate and aggressive. The ‘control’ treatment was designed to deliver total biomass available in the paddock. The primary and secondary extractor fans were turned off. Ground speeds were the
Sugar Research Australia Final Report - Project 2016/955
17
same for all three treatments across four of the five trials, but ground speed for the control treatment from one trial was 2 km/hr lower than the remaining treatments. The ‘moderate’ treatment targeted a similar ground speed as the control treatment, but fan speed was set at 600 to 730 rpm depending on fan blade and hub type, variety, field conditions and burn quality. The ‘aggressive’ treatment consisted of the same ground speed as the ‘moderate’ treatment with an increase of 150 rpm on the primary extractor. The secondary extractor was on for both ‘moderate’ and ‘aggressive’ treatments.
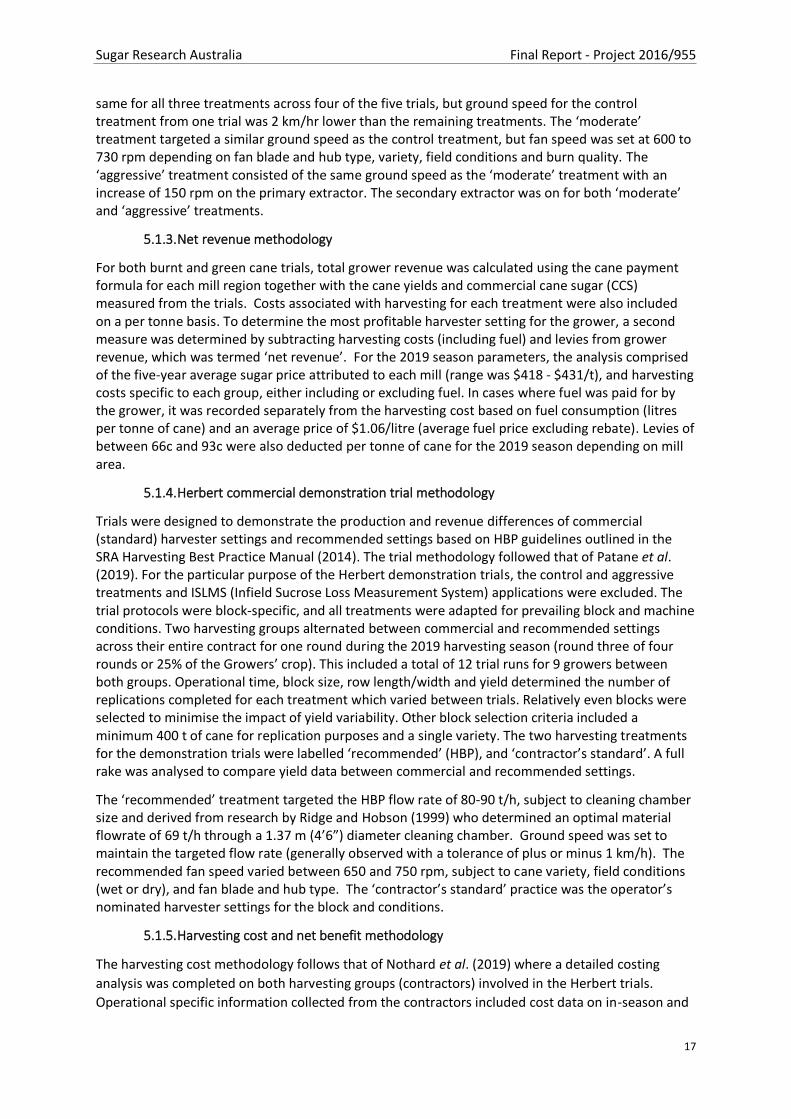
5.1.3. Net revenue methodology
For both burnt and green cane trials, total grower revenue was calculated using the cane payment formula for each mill region together with the cane yields and commercial cane sugar (CCS) measured from the trials. Costs associated with harvesting for each treatment were also included on a per tonne basis. To determine the most profitable harvester setting for the grower, a second measure was determined by subtracting harvesting costs (including fuel) and levies from grower revenue, which was termed ‘net revenue’. For the 2019 season parameters, the analysis comprised of the five-year average sugar price attributed to each mill (range was $418 - $431/t), and harvesting costs specific to each group, either including or excluding fuel. In cases where fuel was paid for by the grower, it was recorded separately from the harvesting cost based on fuel consumption (litres per tonne of cane) and an average price of $1.06/litre (average fuel price excluding rebate). Levies of between 66c and 93c were also deducted per tonne of cane for the 2019 season depending on mill area.
5.1.4. Herbert commercial demonstration trial methodology
Trials were designed to demonstrate the production and revenue differences of commercial (standard) harvester settings and recommended settings based on HBP guidelines outlined in the SRA Harvesting Best Practice Manual (2014). The trial methodology followed that of Patane et al. (2019). For the particular purpose of the Herbert demonstration trials, the control and aggressive treatments and ISLMS (Infield Sucrose Loss Measurement System) applications were excluded. The trial protocols were block-specific, and all treatments were adapted for prevailing block and machine conditions. Two harvesting groups alternated between commercial and recommended settings across their entire contract for one round during the 2019 harvesting season (round three of four rounds or 25% of the Growers’ crop). This included a total of 12 trial runs for 9 growers between both groups. Operational time, block size, row length/width and yield determined the number of replications completed for each treatment which varied between trials. Relatively even blocks were selected to minimise the impact of yield variability. Other block selection criteria included a minimum 400 t of cane for replication purposes and a single variety. The two harvesting treatments for the demonstration trials were labelled ‘recommended’ (HBP), and ‘contractor’s standard’. A full rake was analysed to compare yield data between commercial and recommended settings.
The ‘recommended’ treatment targeted the HBP flow rate of 80-90 t/h, subject to cleaning chamber size and derived from research by Ridge and Hobson (1999) who determined an optimal material flowrate of 69 t/h through a 1.37 m (4’6”) diameter cleaning chamber. Ground speed was set to maintain the targeted flow rate (generally observed with a tolerance of plus or minus 1 km/h). The recommended fan speed varied between 650 and 750 rpm, subject to cane variety, field conditions (wet or dry), and fan blade and hub type. The ‘contractor’s standard’ practice was the operator’s nominated harvester settings for the block and conditions.
5.1.5. Harvesting cost and net benefit methodology
The harvesting cost methodology follows that of Nothard et al. (2019) where a detailed costing
analysis was completed on both harvesting groups (contractors) involved in the Herbert trials.
Operational specific information collected from the contractors included cost data on in-season and

Sugar Research Australia Final Report - Project 2016/955
18
pre-season labour, harvester and haulout depreciation, interest, repairs and maintenance, fuel and
oil, and overheads. Repairs and maintenance inputs were also guided by industry-wide costings for
green cane operations to improve on accuracy. Various agronomic data (e.g. yield, row width, etc.)
and machinery time cycle interactions (between harvester and haulouts) formed the basis of
algorithms used to determine harvesting cost allocations. Figure 6 shows the steps taken to model
the cost of harvesting. The majority of data was collected during contractor interviews. These lasted
for two to three hours and involved follow-up discussions where data was not immediately available.
The remaining data came from the trial results.
The DAF cost-comparison model (Model) was used to complete the trial costings. Two treatments
required analysis in a standard versus recommended treatment comparison. Once baseline data was
captured from each harvesting group, a separate run (of the Model) was developed for each trial (12
trials in total). This allowed for individual cost and net benefit calculations under each trial scenario.
Individual costings incorporated yields, bin weights, haulout distances, harvester ground speeds, fuel
utilisation, row widths and row lengths specific to each trial.
Net benefit is defined as the change in grower revenue per hectare less the change in grower and
contractor cost per hectare. Costs include harvesting, haulage and levies. The net benefit analysis did
not include the benefits or costs attributed to the wider supply chain (e.g. mill).
Figure 6: Harvesting cost modelling process
5.1.6. Trial statistical analysis methodology
Data collected in the 2019 harvest season was statistically analysed to assess the effects of green and burnt cane harvesting treatments on harvested outputs. Data was pooled from all regions into a single analysis. A linear mixed model was fitted to the data using Proc Mixed of SAS Analytical software package (SAS Institute 2013). The model applied to the data for each harvest output was:
Trait ~ Treatment + Location (Replicate) + Grower/contractor + Ɛ
where Trait was the harvested output of interest. Treatment (control, recommended (HBP), contractor’s standard and aggressive) was considered a fixed effect and replicate nested within location was treated as a random effect in the model. The error term Ɛ represents the deviations from our predictions due to random factors that we cannot control experimentally. The random
Sugar Research Australia Final Report - Project 2016/955
19
component effect was grouped by block/contractor to account for the variation due to each block/contractor. Where the treatment effect was significant, a Tukey’s multiple comparison test was used to identify differences among means at a family significance level of 5%.
For the 17 harvesting trials, 13 (8 green cane and 5 burnt cane) complied with the trial protocols and met the requirements for the statistical analysis. The remainder were excluded on the grounds of poor crop yield estimates (which affected product flow rates through the harvesters), insufficient replication, poor adherence to trial protocols, or contractors already operating at, or very close to, recommended practices (of which there were very few).
Data collected from the Herbert demonstration program was also statistically analysed using the above methodology. Analysis targeted the effects of the two harvesting treatments (commercial – operator standard practice and recommended practice) on harvested outputs.
5.1.7. SCHLOT LIVE Trial methodology
SCHLOT Live trials utilised the SRA ISLMS procedure to assess cane loss (Patane et al., 2019). Data
was collected and recorded as stated in demonstration trials methodology and compared against
logged data from SCHLOT Live. Installation of SCHLOT Live units was conducted by Norris ECT. Data
from SCHLOT Live was recorded throughout the field, but specific points logged as the harvester past
over the tarpaulin (this allowed both methods to be compared accurately). The comparison of the
two methods is reported in the results.
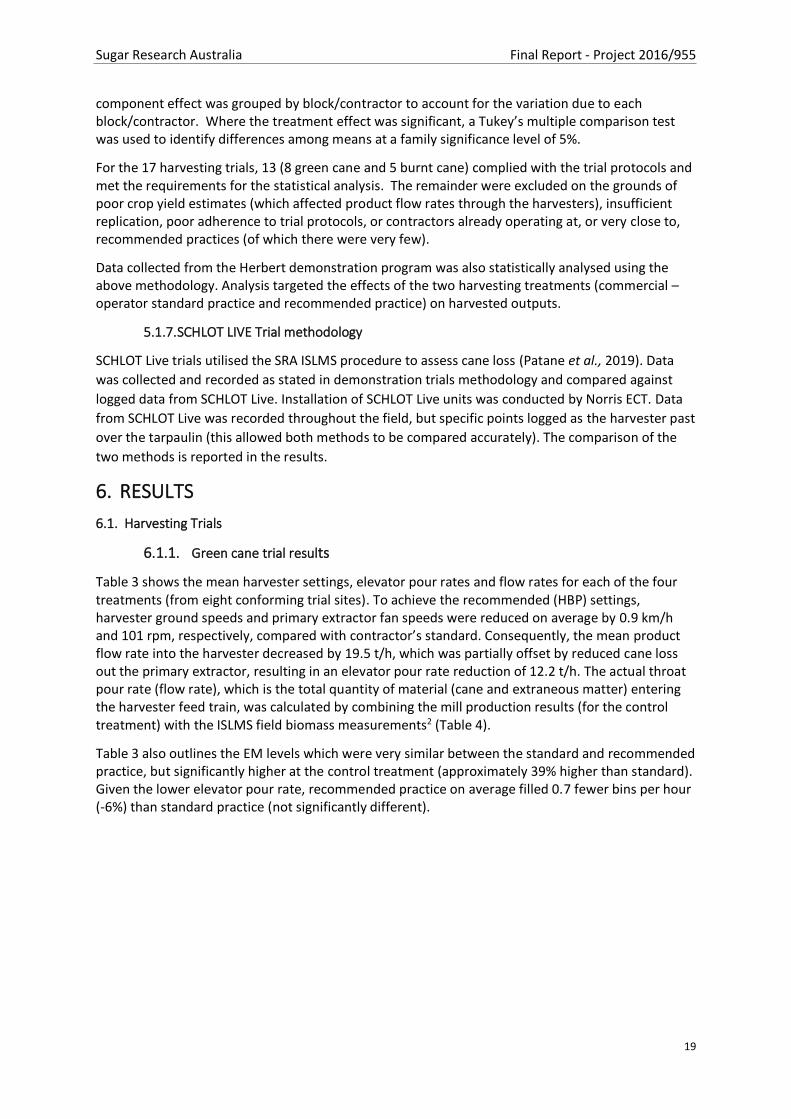
6. RESULTS
6.1. Harvesting Trials
6.1.1. Green cane trial results
Table 3 shows the mean harvester settings, elevator pour rates and flow rates for each of the four treatments (from eight conforming trial sites). To achieve the recommended (HBP) settings, harvester ground speeds and primary extractor fan speeds were reduced on average by 0.9 km/h and 101 rpm, respectively, compared with contractor’s standard. Consequently, the mean product flow rate into the harvester decreased by 19.5 t/h, which was partially offset by reduced cane loss out the primary extractor, resulting in an elevator pour rate reduction of 12.2 t/h. The actual throat pour rate (flow rate), which is the total quantity of material (cane and extraneous matter) entering the harvester feed train, was calculated by combining the mill production results (for the control treatment) with the ISLMS field biomass measurements2 (Table 4).
Table 3 also outlines the EM levels which were very similar between the standard and recommended practice, but significantly higher at the control treatment (approximately 39% higher than standard). Given the lower elevator pour rate, recommended practice on average filled 0.7 fewer bins per hour (-6%) than standard practice (not significantly different).

Sugar Research Australia Final Report - Project 2016/955
20
Table 3: Average harvester performance under different practices
*Common letters within a row indicate no statistically significant differences among treatments (p = 0.05). **Estimated flow rate using results from the ISLMS and delivered product.
Table 4 presents the sugar loss and total biomass results for each treatment as measured by the ISLMS. The ISLMS quantified the total biomass (t/ha) of trash blanket extracted from the harvester’s extractor chamber and determined the total sugar content of measured field residue. The total tonnes sugar/ha were then determined to give an indication of harvesting sugar loss for each trial. Recommended practice was found to have a significantly lower mean in-field sugar loss (-0.21 t/ha) and total biomass (cane and EM, -1.8 t/ha) left in the paddock than standard practice. These results identified a strong positive relationship between ground/fan speed settings and sugar loss (speeds above harvester capacity equated to greater sugar loss).
Table 4: Sugar loss (measured in field) and total biomass for each treatment
*Common letters within a row indicate no statistically significant differences among treatments (p = 0.05).
The mean production and revenue results for each harvester treatment setting are outlined in Table 5. Control and recommended settings obtained significantly higher cane and sugar yield than aggressive practice, which obtained the lowest yields. The trend for Recommended practice gained 4.2 t cane/ha (+3.8%) and 0.5 t sugar/ha (+3.4%) more than standard practice. However, this was not significantly different, due to the limited number of trials and variation in the data set. Both CCS and fibre levels were very similar between recommended and standard practice (no significant differences).
Total grower revenue was calculated using the five-year average sugar price, yield and CCS results (at the plot level), together with the cane payment formula specific to the mill area where the trial was conducted. Net grower revenue subtracted harvesting costs, fuel costs and levies from total grower revenue. Grower gross and net revenue were significantly different for the control and recommended treatments against the aggressive treatment. Although not statistically different, the trend identifies the recommended treatment delivering $136/ha (+3.2%) and $108/ha (+3.2%) respectively higher grower gross and net revenues than the standard treatment.
Parameter Practice
Control Recommended Standard Aggressive
Ground speed 3.39 4.91 5.83 6.49
Primary fan speed, rpm 580 694 795 901
Elevator pour rate, t/h 67.7 92.7 104.9 110.9
Flow rate**, t/h 75.1 108.0 127.4 137.4
Extraneous matter, % 16.3 a 11.4 b 11.7 b 10.6 b
Bin fill rates, bins/h 11.5 a 10.9 a 11.6 a 12.4 a
Parameter Practice
Control Recommended Standard Aggressive
Sugar loss, t/ha 0.52 c 0.61 c 0.82 b 1.05 a
Total biomass, t/ha 14.30 c 16.54 b 18.32 b 20.74 a
Sugar Research Australia Final Report - Project 2016/955
21
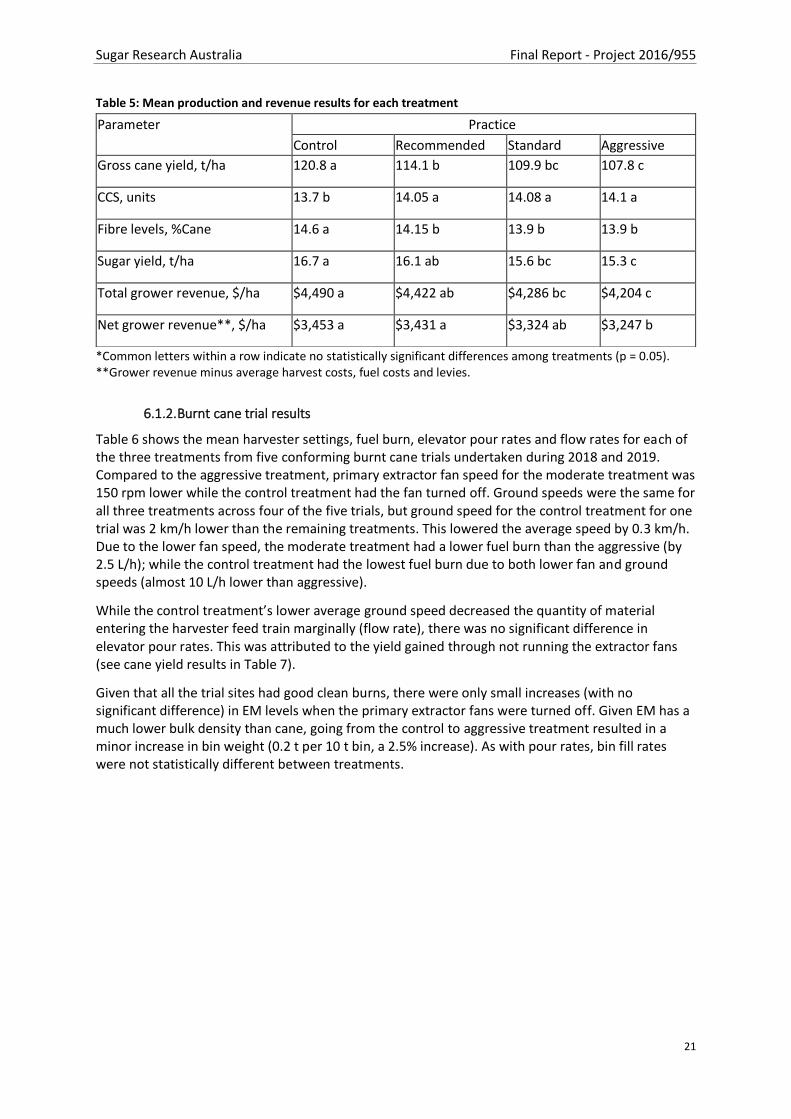
Table 5: Mean production and revenue results for each treatment
*Common letters within a row indicate no statistically significant differences among treatments (p = 0.05). **Grower revenue minus average harvest costs, fuel costs and levies.
6.1.2. Burnt cane trial results
Table 6 shows the mean harvester settings, fuel burn, elevator pour rates and flow rates for each of the three treatments from five conforming burnt cane trials undertaken during 2018 and 2019. Compared to the aggressive treatment, primary extractor fan speed for the moderate treatment was 150 rpm lower while the control treatment had the fan turned off. Ground speeds were the same for all three treatments across four of the five trials, but ground speed for the control treatment for one trial was 2 km/h lower than the remaining treatments. This lowered the average speed by 0.3 km/h. Due to the lower fan speed, the moderate treatment had a lower fuel burn than the aggressive (by 2.5 L/h); while the control treatment had the lowest fuel burn due to both lower fan and ground speeds (almost 10 L/h lower than aggressive).
While the control treatment’s lower average ground speed decreased the quantity of material entering the harvester feed train marginally (flow rate), there was no significant difference in elevator pour rates. This was attributed to the yield gained through not running the extractor fans (see cane yield results in Table 7).
Given that all the trial sites had good clean burns, there were only small increases (with no significant difference) in EM levels when the primary extractor fans were turned off. Given EM has a much lower bulk density than cane, going from the control to aggressive treatment resulted in a minor increase in bin weight (0.2 t per 10 t bin, a 2.5% increase). As with pour rates, bin fill rates were not statistically different between treatments.
Parameter Practice
Control Recommended Standard Aggressive Gross cane yield, t/ha 120.8 a 114.1 b 109.9 bc 107.8 c
CCS, units 13.7 b 14.05 a 14.08 a 14.1 a
Fibre levels, %Cane 14.6 a 14.15 b 13.9 b 13.9 b
Sugar yield, t/ha 16.7 a 16.1 ab 15.6 bc 15.3 c
Total grower revenue, $/ha $4,490 a $4,422 ab $4,286 bc $4,204 c
Net grower revenue**, $/ha $3,453 a $3,431 a $3,324 ab $3,247 b

Sugar Research Australia Final Report - Project 2016/955
22
Table 6: Average harvester performance under different practices (burned cane)
The mean production and revenue results for each harvester treatment setting are outlined in Table 7. There were significant differences in yield between treatments where the control and moderate treatments delivered 7.5 and 3.3 tc/ha respectively more than the aggressive treatment. Mean CCS for the control treatment was slightly lower than the other two treatments but the difference was not statistically significant. Differences in mean fibre levels were found to be statistically significant, with the control treatment having fibre levels around 0.6 percentage points higher than the other treatments. While not significant, the sugar yield results had a similar trend to cane yield but were less distinct given the depressed CCS levels at the lower fan speeds.
While also not significantly different, the control treatment had the highest mean total grower revenue followed by the moderate (-$124/ha) and aggressive (-$249/ha) treatments. Net grower revenue followed a similar trend with the moderate and aggressive treatments obtaining $88/ha and $184/ha less than the control treatment respectively.
Table 7: Mean production and revenue results for each treatment (burned cane)
Parameter
Practice
Control Moderate Aggressive
Ground speed, km/h 7.3 7.6 7.6
Primary fan speed, rpm 0 683 836
Fuel burn, L/h 44.2 c 51.1 b 53.6 a
Elevator pour rate, t/h 133.4 a 134.2 a 137.6 a
Flow rate, t/h 134.4 b 143.2 a 142.5 a
Extraneous matter, % 9.7 a 10.3 a 8.6 a
Average bin mass, t/10-t bin 9.6 b 9.7 ab 9.8 a
Bin fill rates, bins/h 13.8 a 14.1 a 13.4 a
Parameter Practice
Control Moderate Aggressive
Gross cane yield, tc/ha 131.9 a 127.7 ab 124.4 b
CCS, units 14.6 b 14.8 ab 14.8 a
Fibre levels, %Cane 13.8 a 13.2 b 13.2 b
Sugar yield, ts/ha 19.6 a 19.2 a 18.9 a
Total grower revenue, $/ha $5,582 a $5,458 a $5,333 a
Net grower revenue*, $/ha $4,439 a $4,351 a $4,255 a

Sugar Research Australia Final Report - Project 2016/955
23
6.1.3. Herbert commercial demonstration trial results
Table 8 shows the mean harvester settings and elevator pour rates for the commercial (Contractor standard practice) and recommended treatments (from 12 trials undertaken in the 2019 harvesting season). To achieve the recommended (HBP) settings, harvester ground speeds and primary extractor fan speeds were reduced on average by 1 km/h and 53 rpm, respectively, compared with contractor’s standard practice.
Table 8 further outlines the EM levels in the delivered cane and average bin masses (using an average of 6, 8 and 10 tonnes bins for the Herbert region). EM levels and average bin masses were very similar between the standard and recommended practice, with no significant difference. However, given the lower ground speed, recommended practice on average harvested 0.78 ha/h compared to 0.90 ha/h at standard practice. This represents a statistically significant reduction in harvested area of 0.12 ha/h.
Table 8 Average harvester performance between recommended and contractor standard practice (commercial)
Parameter Practice
Recommended Standard Ground speed 6.1 7.1
Primary fan speed, rpm 657 710
Elevator pour rate, t/h 84.5 a 95.4 b
Extraneous matter, % 15.9 a 15.7 a
Average bin mass, t/bin 6.4 6.2
Average harvest rate, ha/hr 0.78 a 0.90 b
*Common letters within a row indicate no statistically significant differences among treatments (p = 0.05).
Table 9 Mean production and revenue results for each treatment
Parameter Practice
Recommended Standard Gross cane yield, t/ha 91.7 a 87.4 b
CCS, units * 14.2 a 14.2 a
Fibre levels, %Cane * 16.2 a 16.2 a
Sugar yield, t/ha 12.29 a 11.68 b
Total grower revenue, $/ha $3,324 a $3,173 b
Total harvesting/Levy cost**, $/ha $650 $613
Net grower revenue, $/ha $2,674 a $2,560 b
*Common letters within a row indicate no statistically significant differences among treatments (p = 0.05). ** Total harvesting costs include cost of harvesting, grower levies and cost for harvester to slow down.

Sugar Research Australia Final Report - Project 2016/955
24
The mean production results for each harvester treatment setting are outlined in Table 9. Significantly higher cane and sugar yield occurred at recommended settings when compared to standard practice. In particular, recommended practice obtained 4.3 tc/ha (+4.9%) and 0.6 ts/ha (+5.2%) more than standard practice. Both CCS and fibre levels were very similar between recommended and standard practice (no significant differences), which demonstrated that the increased sugar/ha was driven largely by increased cane yield.
Table 9 also presents the average economic results from the demonstration trials including total
grower revenue and net grower revenue. Total grower revenue was calculated using the five-year
average sugar price ($418/t), yield and CCS results (for each trial), together with the cane payment
formula specific to the Herbert mill area. Net grower revenue includes total grower revenue less
harvesting costs (including fuel) and levies. Actual harvesting costs and levies are $37/ha ($0.07/t)
higher for the recommended setting due to higher yields, reduced harvester ground speeds and
lower extractor fan speeds. Despite the higher harvesting costs, recommended settings obtained
significantly higher total revenue ($150/ha, +4.7%). This resulted in an overall net benefit of $114/ha
(+4.4% higher net revenue) in adoption of recommended settings.
6.1.4. SCHLOT Live Trial Results
Six harvesting trials were conducted to assess SCHLOT Live cane loss monitor results to the ISLMS
measurements. Table 10 identifies the trial parameters. Trials were conducted in six different
regions. Three different models of harvesters were utilised to assess SCHLOT Live calibration with
regard to agronomic information from five different varieties, four different crop classes and six
different crop yields. Unfortunately, two trials were unable to be analysed due to logfile download
protocol issues at Mackay and incorrect fitting of the SCHLOT Live unit at Plane Creek.
Table 10 SCHLOT Live Trial parameters
Harvester Region Variety Ratoon Crop Condition Crop yield (based off total biomass)
CH570 - 2018 Tablelands Q208 First Erect 169 t/ha
Case IH 8800 - 2014
South Johnstone
Q200 Older Erect 109 t/ha
John Deere 3520 - 2015
Herbert Q253 First Erect 143 t/ha
Case IH 8800 - 2014
Proserpine Q240 Second Erect 70t/ha
John Deere 3520 - 2016
Mackay Q208 Plant Erect 123 t/ha
John Deere 3520 - 2015
Plane Creek Q183 Plant Erect 103 t/ha
Figure 7 indicates the correlation of SCHLOT Live and ISLMS data with a CH570 in the Tablelands region. SCHLOT Live pre-calibration for CH 570 gave similar values to the ISLMS. As can be seen, as fan speed has increased so has measured cane loss with both cane loss methods.

Sugar Research Australia Final Report - Project 2016/955
25
Figure 7: ISLMS compared to SCHLOT Live Cane loss monitor - CH570
Figure 8 indicates the correlation of SCHLOT Live and ISLMS data with a Case IH 8810 in the South Johnstone region. SCHLOT Live pre-calibration for Case IH 8810 followed the same trend as ISLMS. Similarly, as fan speed has increased so has cane loss, however, SCHLOT Live has tended to overestimate cane loss. This may be due to the limited number of trials with Case IH 8810 and calibration factors are still being refined for this machine.
Figure 8: ISLMS compared to SCHLOT Live cane loss monitor - Case IH 8810
Figure 9 indicates the correlation of SCHLOT Live and ISLMS data with a John Deere 3520 in the Herbert region. SCHLOT Live pre-calibration for John Deere 3520 gave similar values to the ISLMS. As can be seen, as fan speed has increased so has cane loss with both methods.

Sugar Research Australia Final Report - Project 2016/955
26
Figure 9: ISLMS compared to SCHLOT Live cane loss monitor - JD3520
Figure 10: ISLMS compared to SCHLOT Live cane loss monitor - Case IH 8800Figure 10 indicates the
correlation of SCHLOT Live and ISLMS data with a Case IH 8800 in the Proserpine region. SCHLOT Live
pre-calibration for Case IH 8800 followed the same trend as ISLMS. Similarly, as fan speed has
increased so has cane loss, however, SCHLOT Live has tended to underestimate cane loss. This may
be due to the limited number of trials with Case IH 8800 and calibration factors are still being refined
for this machine.
Figure 10: ISLMS compared to SCHLOT Live cane loss monitor - Case IH 8800
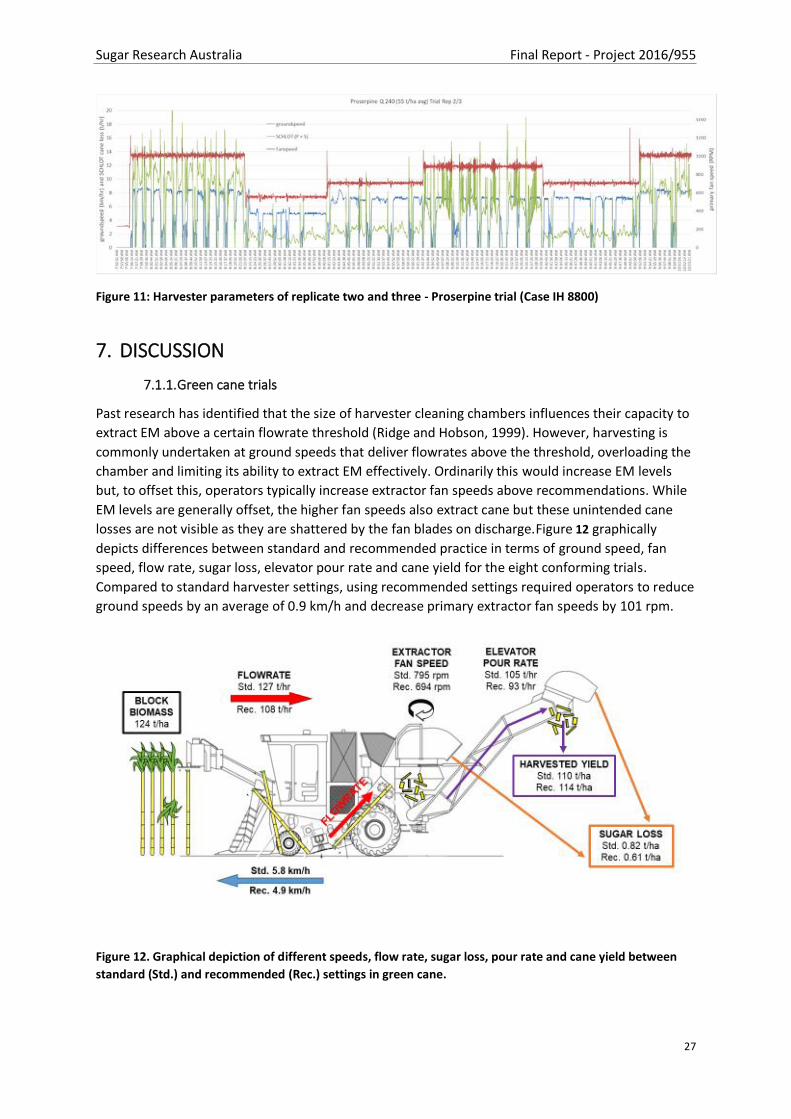
Figure 11 graphically depicts ground speed, fan speed and cane loss from the primary and secondary
extractor from replicate two and three of the Proserpine SCHLOT Live trial. As fan speed and ground
speed change throughout the trial cane loss adjusts simultaneously.
Sugar Research Australia Final Report - Project 2016/955
27
Figure 11: Harvester parameters of replicate two and three - Proserpine trial (Case IH 8800)
7. DISCUSSION
7.1.1. Green cane trials
Past research has identified that the size of harvester cleaning chambers influences their capacity to
extract EM above a certain flowrate threshold (Ridge and Hobson, 1999). However, harvesting is
commonly undertaken at ground speeds that deliver flowrates above the threshold, overloading the
chamber and limiting its ability to extract EM effectively. Ordinarily this would increase EM levels
but, to offset this, operators typically increase extractor fan speeds above recommendations. While
EM levels are generally offset, the higher fan speeds also extract cane but these unintended cane
losses are not visible as they are shattered by the fan blades on discharge.Figure 12 graphically
depicts differences between standard and recommended practice in terms of ground speed, fan
speed, flow rate, sugar loss, elevator pour rate and cane yield for the eight conforming trials.
Compared to standard harvester settings, using recommended settings required operators to reduce
ground speeds by an average of 0.9 km/h and decrease primary extractor fan speeds by 101 rpm.
Figure 12. Graphical depiction of different speeds, flow rate, sugar loss, pour rate and cane yield between
standard (Std.) and recommended (Rec.) settings in green cane.

Sugar Research Australia Final Report - Project 2016/955
28
The harvesting trials identified that reducing harvester ground speeds from current industry practice
to the recommended speeds decreased the flowrate of material to be within the recommended
threshold for the cleaning chamber size. Consequently, the primary extractor fan could be operated
at the recommended speed to effectively clean the cane by removing EM without the unintended
cane loss (e.g. minimal loss). Compared to standard practice, the trial results showed that operating
the harvester at the recommended ground speeds (which were the maximum before exceeding
flowrate threshold and cleaning capacity) and fan speeds, increased the amount of recovered cane
by 4.2 tc/ha (3.8%) on average. The change from standard to recommended practice did not have a
detrimental impact on EM levels, fibre levels or CCS, and no significant effect on nominal bin mass.
These results support previous research by Patane et al. (2019). Given no difference in CCS, the
improvement in sugar yield and grower revenue followed a similar trend to cane yield with
recommended practice obtaining 0.5 t/ha more sugar and $136/ha more total grower revenue than
standard practice.
Similar to the mass balance results that were measured at the mill, in-field testing (ISLMS) also
confirmed that standard practice had significantly greater sugar loss (0.21 ts/ha or 25.6% increase)
than recommended practice. Furthermore, in-field testing identified that significantly less material
was extracted from the cleaning chamber when using recommended practice (against standard
practice), also confirming additional cane loss (given there was no negative impact on EM, fibre or
CCS in delivered cane). In-field tests were carried out by laying tarps next to the moving harvester,
which enabled a sample of the material extracted from the harvester cleaning chamber to be
collected before mulching and measuring the amount of sugar it contained (for each treatment
replicate). This type of test also provided the opportunity on the day of the trial for growers to touch
and smell each sample and feel that samples from the more aggressive harvesting practices
(associated with increased fan and ground speeds) were moister, stickier and sweeter in aroma, thus
enabling growers to verify the increased sugar loss first hand.
Using recommended settings did have its drawbacks. The lower ground speeds decreased the
quantity of cane material entering the elevator and distributed to haulouts (elevator pour rate) by
12 t/h on average. Consequently, total harvesting time frequently increased so wider adoption of
recommended practice would require longer workdays, increased season length, additional
harvesting operations or some combination of these adjustments. Longer harvester times would also
likely follow through to fewer rail bins being filled per hour (reduction of 0.6 bins/h, for a nominal 10
t bin capacity) at the siding or pad, which could influence the efficiency of bin deliveries depending
on the mill region’s bin fleet capacity.
7.1.2. Burnt Cane
Although there was no recent literature identified that related to burnt cane HBP, there were
publications addressing the comparison between burnt and green cane harvesting practices (e.g.
Sugar Research Australia, 2014). Literature indicated that cane loss was less of a concern under
burnt conditions when compared to harvesting green cane. This is understandable given the far
lower EM levels found in burnt cane. However, initial trial results suggest that losses may be an
important factor to consider in burnt cane, particularly in relation to extractor fan speed.

Sugar Research Australia Final Report - Project 2016/955
29
Figure 13 graphically depicts differences between control and aggressive practice in terms of ground
speed, fan speed, flow rate, elevator pour rate and cane yield. Results from five ‘good burn’ cane
trials in 2018 (from 2016/955) and 2019 (this project) gave preliminary indication that running the
primary extractor fan reduced delivered yields (increased losses) without significant gains in either
cane quality or bin weights (or reduced fibre levels). In a move from an aggressive to no-fan
scenario, the eight tonne per hectare improvement in cane yield (supported by a report published by
Hurney et al. (1984) that identified cleaning losses of 5-8 t/ha in burnt cane). Turning both the
primary and secondary fans off under a good burn scenario increased cane and sugar yield by 7.5
tc/ha and 0.7 ts/ha respectively (or 6.0% and 3.7%), and this translated to an additional $249/ha in
grower gross revenue. This signified a significant economic return from a marginal change in the
overall harvesting operation.
Figure 13. Graphical depiction of different speeds, flow rate, pour rate and cane yield between control (Ctrl.)
and aggressive (Aggr.) settings in burnt cane.
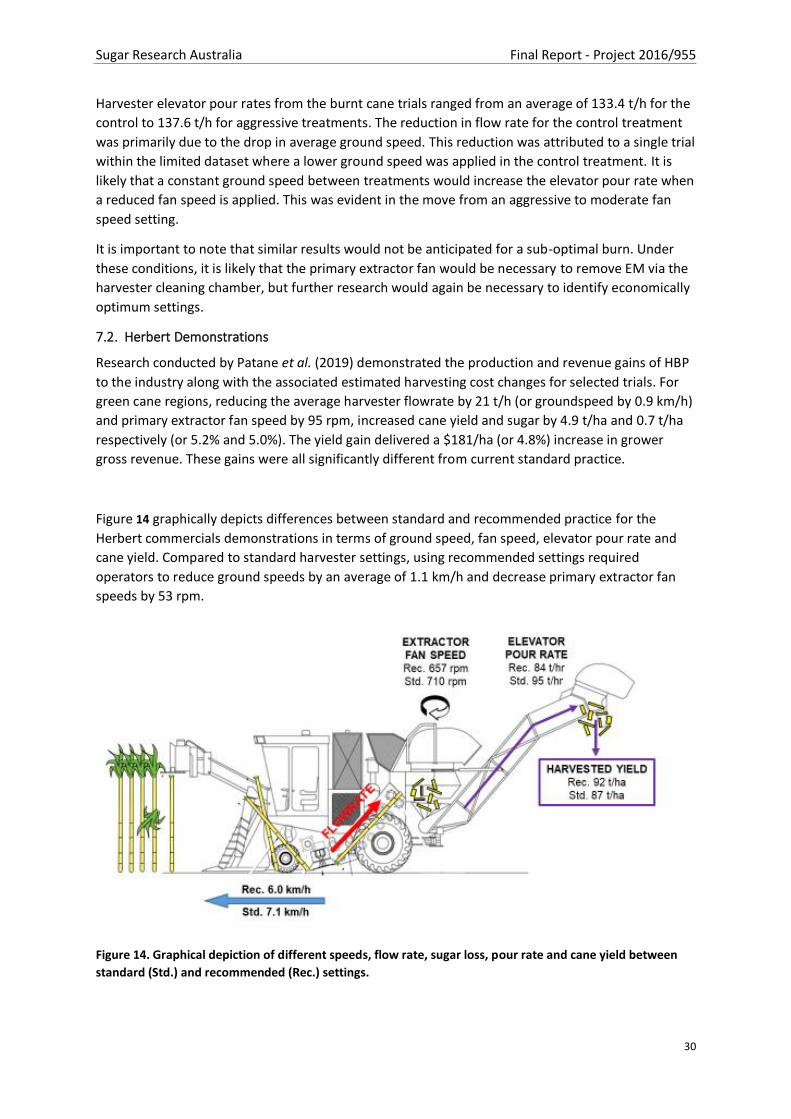
Sugar Research Australia Final Report - Project 2016/955
30
Harvester elevator pour rates from the burnt cane trials ranged from an average of 133.4 t/h for the
control to 137.6 t/h for aggressive treatments. The reduction in flow rate for the control treatment
was primarily due to the drop in average ground speed. This reduction was attributed to a single trial
within the limited dataset where a lower ground speed was applied in the control treatment. It is
likely that a constant ground speed between treatments would increase the elevator pour rate when
a reduced fan speed is applied. This was evident in the move from an aggressive to moderate fan
speed setting.
It is important to note that similar results would not be anticipated for a sub-optimal burn. Under
these conditions, it is likely that the primary extractor fan would be necessary to remove EM via the
harvester cleaning chamber, but further research would again be necessary to identify economically
optimum settings.
7.2. Herbert Demonstrations
Research conducted by Patane et al. (2019) demonstrated the production and revenue gains of HBP
to the industry along with the associated estimated harvesting cost changes for selected trials. For
green cane regions, reducing the average harvester flowrate by 21 t/h (or groundspeed by 0.9 km/h)
and primary extractor fan speed by 95 rpm, increased cane yield and sugar by 4.9 t/ha and 0.7 t/ha
respectively (or 5.2% and 5.0%). The yield gain delivered a $181/ha (or 4.8%) increase in grower
gross revenue. These gains were all significantly different from current standard practice.
Figure 14 graphically depicts differences between standard and recommended practice for the
Herbert commercials demonstrations in terms of ground speed, fan speed, elevator pour rate and
cane yield. Compared to standard harvester settings, using recommended settings required
operators to reduce ground speeds by an average of 1.1 km/h and decrease primary extractor fan
speeds by 53 rpm.
Figure 14. Graphical depiction of different speeds, flow rate, sugar loss, pour rate and cane yield between
standard (Std.) and recommended (Rec.) settings.
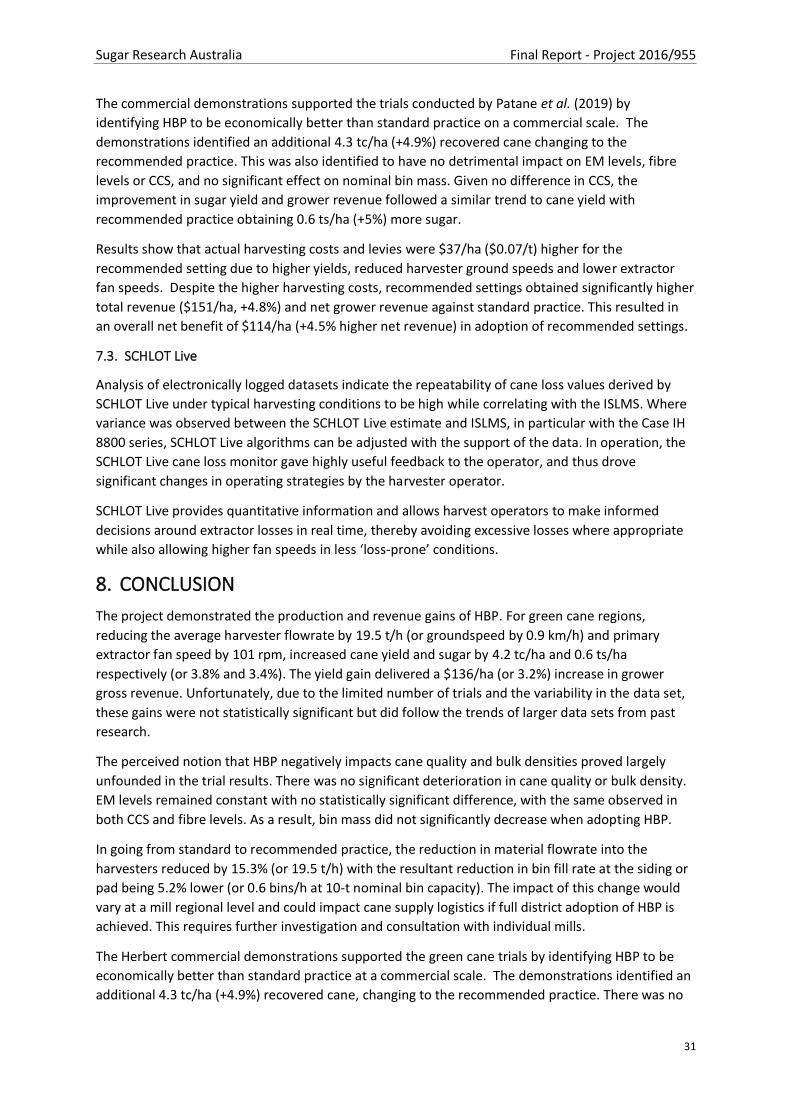
Sugar Research Australia Final Report - Project 2016/955
31
The commercial demonstrations supported the trials conducted by Patane et al. (2019) by
identifying HBP to be economically better than standard practice on a commercial scale. The
demonstrations identified an additional 4.3 tc/ha (+4.9%) recovered cane changing to the
recommended practice. This was also identified to have no detrimental impact on EM levels, fibre
levels or CCS, and no significant effect on nominal bin mass. Given no difference in CCS, the
improvement in sugar yield and grower revenue followed a similar trend to cane yield with
recommended practice obtaining 0.6 ts/ha (+5%) more sugar.
Results show that actual harvesting costs and levies were $37/ha ($0.07/t) higher for the
recommended setting due to higher yields, reduced harvester ground speeds and lower extractor
fan speeds. Despite the higher harvesting costs, recommended settings obtained significantly higher
total revenue ($151/ha, +4.8%) and net grower revenue against standard practice. This resulted in
an overall net benefit of $114/ha (+4.5% higher net revenue) in adoption of recommended settings.
7.3. SCHLOT Live
Analysis of electronically logged datasets indicate the repeatability of cane loss values derived by
SCHLOT Live under typical harvesting conditions to be high while correlating with the ISLMS. Where
variance was observed between the SCHLOT Live estimate and ISLMS, in particular with the Case IH
8800 series, SCHLOT Live algorithms can be adjusted with the support of the data. In operation, the
SCHLOT Live cane loss monitor gave highly useful feedback to the operator, and thus drove
significant changes in operating strategies by the harvester operator.
SCHLOT Live provides quantitative information and allows harvest operators to make informed
decisions around extractor losses in real time, thereby avoiding excessive losses where appropriate
while also allowing higher fan speeds in less ‘loss-prone’ conditions.
8. CONCLUSION
The project demonstrated the production and revenue gains of HBP. For green cane regions,
reducing the average harvester flowrate by 19.5 t/h (or groundspeed by 0.9 km/h) and primary
extractor fan speed by 101 rpm, increased cane yield and sugar by 4.2 tc/ha and 0.6 ts/ha
respectively (or 3.8% and 3.4%). The yield gain delivered a $136/ha (or 3.2%) increase in grower
gross revenue. Unfortunately, due to the limited number of trials and the variability in the data set,
these gains were not statistically significant but did follow the trends of larger data sets from past
research.
The perceived notion that HBP negatively impacts cane quality and bulk densities proved largely
unfounded in the trial results. There was no significant deterioration in cane quality or bulk density.
EM levels remained constant with no statistically significant difference, with the same observed in
both CCS and fibre levels. As a result, bin mass did not significantly decrease when adopting HBP.
In going from standard to recommended practice, the reduction in material flowrate into the
harvesters reduced by 15.3% (or 19.5 t/h) with the resultant reduction in bin fill rate at the siding or
pad being 5.2% lower (or 0.6 bins/h at 10-t nominal bin capacity). The impact of this change would
vary at a mill regional level and could impact cane supply logistics if full district adoption of HBP is
achieved. This requires further investigation and consultation with individual mills.
The Herbert commercial demonstrations supported the green cane trials by identifying HBP to be
economically better than standard practice at a commercial scale. The demonstrations identified an
additional 4.3 tc/ha (+4.9%) recovered cane, changing to the recommended practice. There was no

Sugar Research Australia Final Report - Project 2016/955
32
detrimental impact on EM levels, fibre levels or CCS, and no significant effect on nominal bin mass.
Given no difference in CCS, the improvement in sugar yield and grower revenue followed a similar
trend to cane yield with recommended practice obtaining 0.6 ts/ha (+5.2%) more sugar. These
results confirm that HBP delivered more cane per hectare to the mill without significantly impacting
quality, a gain in production to industry.
The reduction in flowrate into the harvester did, however, impact harvesting costs. The severity of
the cost change was driven by the size of the flowrate reduction but dampened by the resultant
yield gain associated with reduced extractor fan speed. On average, actual harvesting costs and
levies were $37/ha ($0.07/t) higher for the recommended setting due to higher yields, reduced
harvester ground speeds and lower extractor fan speeds. Despite the higher harvesting costs,
recommended settings obtained significantly higher total revenue ($151/ha, +4.8%) and net grower
revenue against standard practice. This resulted in an overall net benefit of $114/ha (+4.5% higher
net revenue) in adoption of recommended settings.
Further research is required in burnt cane regions, but preliminary indications are that appropriate
extractor fan speed selection can improve harvested yields by up to 7.5 tc/ha and reduce fuel
consumption by 9.8 L/h. These results culminated in an estimated grower net benefit of $185/ha in
the trials, although this was not statistically significant.
The SCHLOT Live trial results using electronically logged data indicated that the repeatability of the
cane loss values derived by SCHLOT Live under typical harvesting conditions was high and well-
correlated with the ISLMS measurements. Where variance was observed between the SCHLOT
estimate and the ISLMS with the Case IH 8800 series harvester, SCHLOT Live algorithms can be
adjusted with the support of the data.
9. RECOMMENDATIONS FOR FURTHER RD&A
9.1.1. HBP net benefit decision making tool
One key barrier to adoption is that presently growers and harvesting operators cannot confidently
estimate what the benefit is from using HBP (instead of standard harvesting practice) in a particular
block of cane. One practical solution to this problem would be the development of a decision-
support tool that harvesting groups could utilise to estimate the grower revenue benefit and
additional harvesting costs. This would require estimating cane yield and CCS impacts to enable the
revenue benefit to be determined. Given the extensive amount of production data collected in
projects 2016/955 and 2019/951, it makes sense to utilise this data to calculate the algorithms
needed for the tool. Work was also undertaken during the project to develop the network of
calculations needed to evaluate harvesting cost changes, along with the collection of harvesting
operational data. These calculations and data could be integrated into the proposed tool to enable
harvesting cost changes to be estimated. With both revenue and cost impacts known, the net
benefit from using HBP in a particular block could be derived to help growers decide if the benefit
was large enough to warrant HBP and, if so, what would be fair compensation for the harvesting
operations to use HBP settings (to inform the negotiation process between grower and harvesting
operation).
9.1.2. Impact to milling logistics and efficiencies
Further investigation into the cost and implications to the milling and transport sectors, with a
particular focus on cane supply logistics and milling efficiencies, is required. During informal
discussions at the 2019 ASSCT conference, QUT/SRI expressed an interest in exploring these costs

Sugar Research Australia Final Report - Project 2016/955
33
and efficiencies further. Millers and regional industry leaders acknowledged this needs investigation
to understand the impact of adoption of HBP across a whole mill supply region.
9.1.3. Harvester operator training program
After the completion of the project workshop, it was identified that there was a lack of harvesting
operator training programs to industry. It is important that this gap be addressed through the
development of an industry-accredited training program.
9.1.4. Burnt cane loss assessments
The limited number of burned cane trials highlighted the opportunity to reduce fuel costs and
increase harvested yields through appropriate extractor fan speed selection. The long-held belief
that burned cane harvesting produced minimal losses through the cleaning chamber extractor fans is
being mistakenly applied to aggressive and often unnecessary cleaning practices in burnt cane and
requires further investigation to establish the opportunities to increase harvested yields with
appropriate fan speed selection.
9.1.5. Impact of HBP on crop ratoonability
The impact of reducing harvester groundspeed is expected to have long term benefit on
ratoonability, although this would need the support of longer-term trials. The project 2016/952
“Understanding interactions between basecutters and other forward-feed components with the cane
stalk and determining practical strategies to minimise damage as harvester speed increases” has
provided some insight into ratoonability.
10. PUBLICATIONS
No formal publications occurred with the project.
11. ACKNOWLEDGEMENTS
This project was supported by Sugar Research Australia through funding from the Australian
Government Department of Agriculture, Water and the Environment as part of the Rural R&D for
Profit program.
The Queensland Department of Agriculture and Fisheries (DAF) provided extensive support in the
auditing of all trial data and detailed economic analysis applied thorough their proprietary economic
modelling algorithms. The DAF Agricultural Economics Manager provided vital support to the
project.
The regional Canegrowers organisations and productivity services were instrumental in supporting
the identification and approaching of growers and harvesters to participate in the program. Their
support continued through trial execution, workshop feedback sessions and finally to the facilitating
of presentations to regional industry boards, decision makers and Canegrowers organisations.
The following milling groups provided invaluable support with cane supply logistics and laboratory
results:
• Sunshine Sugar
• MSF Sugar
• Isis Central Sugar

Sugar Research Australia Final Report - Project 2016/955
34
• Bundaberg Sugar
• Wilmar Sugar
• Mackay Sugar
• Tully Sugar
Norris ECT provided the necessary support in the form of installation of SCHLOT Live and data
analysis of the SCHLOT Live logfile.
Sugar Research Australia’s Regional Co-ordinators and Biometricians provided the necessary support
in the form of trial coordination and statistical analysis respectively.
12. REFERENCES
Agnew J, Sandell G, Stainlay G, Whiteing C (2002) Increased sugar profitability through harvesting best
practice. Proceedings of the Australian Society of Sugar Cane Technologists 24: 8 pp.
Hurney AP, Ridge DR, Dick RG (1984) Evaluation of the efficiency of cane harvesters in removing
extraneous matter and in limiting cane losses during the cleaning process. Proceedings of the
Australian Society of Sugar Cane Technologists 6: 11–19.
Keeffe EC (2017) Sensors for improved harvesting feedback: evaluation of suitability. Final report
Project 2016/954. Sugar Research Australia Limited, Brisbane.
Larsen PL, Patane PA, Asamoah I (2017) Benchmarking cane supply quality in the Herbert, Burdekin,
Proserpine and Plane Creek Regions. Proceedings of the Australian Society of Sugar Cane
Technologists 39: 77-88.
Linedale AI, Ridge DR (1996) A successful campaign to minimise harvesting losses within the
Queensland sugar industry. Proceedings of the Australian Society of Sugar Cane Technologists 18:
1-5.
Nothard B, Thompson M, Patane P, Lander G, Norris CA, Poggio M (2019) Cost assessment of the
adoption of harvesting best practice. Proceedings of the Australian Society of Sugar Cane
Technologists 41: 497–506.
Patane P, Landers G, Thompson M, Nothard B, Norris CA, Olayemi M (2019) Adoption of practices to
mitigate harvest losses: 2017 results. Proceedings of the Australian Society of Sugar Cane
Technologists 41: 488-496.
Patane P, Landers G, Thompson M, Nothard B, Norris CA, Olayemi M (2019) Adoption of practices to
mitigate harvest losses: Final report Project 2016/955. Sugar Research Australia Limited, Brisbane.
Pollock J, O’Hara I, Griffin K (2007) Aligning the drivers in the value chain - a new cane payment system
for Mackay Sugar. Proceedings of the Australian Society of Sugar Cane Technologists 29.
Ridge DR, Dick RG (1988) Current research on green cane harvesting and dirt rejection by harvesters.
Proceedings of the Australian Society of Sugar Cane Technologists 10: 19-25
Ridge DR, Hobson PA (1999) Analysis of Field and Factory Options for Efficient Gathering and
Utilisation of Trash from Green Cane Harvesting. SRDC Final Report SD99005. Sugar Research and
Development Corporation, Brisbane.

Sugar Research Australia Final Report - Project 2016/955
35
Sandell G, Agnew J (2002) Harvesting Best Practice Manual for Chopper-Extractor Harvesters, Bureau
of Sugar Experiment Stations, Brisbane.
Shaw GR, Brotherton GA (1992) Green cane harvesting – a dilemma. Proceedings of the Australian
Society of Sugar Cane Technologists 14: 1-7.
Whiteing C, Giddy L, Norris CP (2016) A cane-loss measuring system for machine-harvested sugarcane.
Proceedings of the International Society of Sugar Cane Technologists 29: 959-967.
Whiteing C (2002) Facilitation of best practice to reduce extraneous matter and cane loss. Final report
- SRDC project BSS189. Bureau of Sugar Experiment Stations, Bundaberg. Available at:
https://elibrary.sugarresearch.com.au/handle/11079/988

Sugar Research Australia Final Report - Project 2016/955
36
13. APPENDIX
13.1.1. Appendix 1 METADATA DISCLOSURE
Table 11 Metadata disclosure 1
Data Green Cane Harvesting Loss Trials Statistical Report and Source Data
Stored Location Sugar Research Australia Server
Access
Data is available upon request
Contact
Phil-Anthony Patane, Sugar Research Australia; +61 (0)7 3331 3333
Table 12 Metadata disclosure 2
Data Burned Cane Harvesting Loss Trials Statistical Report and Source Data
Stored Location Sugar Research Australia Server
Access
Data is available upon request
Contact
Phil-Anthony Patane, Sugar Research Australia; +61 (0)7 3331 3333
Table 13 Metadata disclosure 3
Data Herbert Demonstration Harvesting Loss Trials Statistical Report and Source Data
Stored Location Sugar Research Australia Server
Access
Data is available upon request
Contact
Phil-Anthony Patane, Sugar Research Australia; +61 (0)7 3331 3333

Sugar Research Australia Final Report - Project 2016/955
37
Table 14 Metadata disclosure 4
Data SCHLOT Live Source Data
Stored Location Sugar Research Australia Server
Access
Data is available upon request
Contact
Phil-Anthony Patane, Sugar Research Australia; +61 (0)7 3331 3333
Table 15 Metadata disclosure 5
Data New South Wales Bin Configuration Costings Source Data
Stored Location Queensland Department of Agriculture and Fisheries (DAF) Server
Access
Data is available upon request
Contact
Brendon Nothard, DAF; +61 (0)7 4999 8564
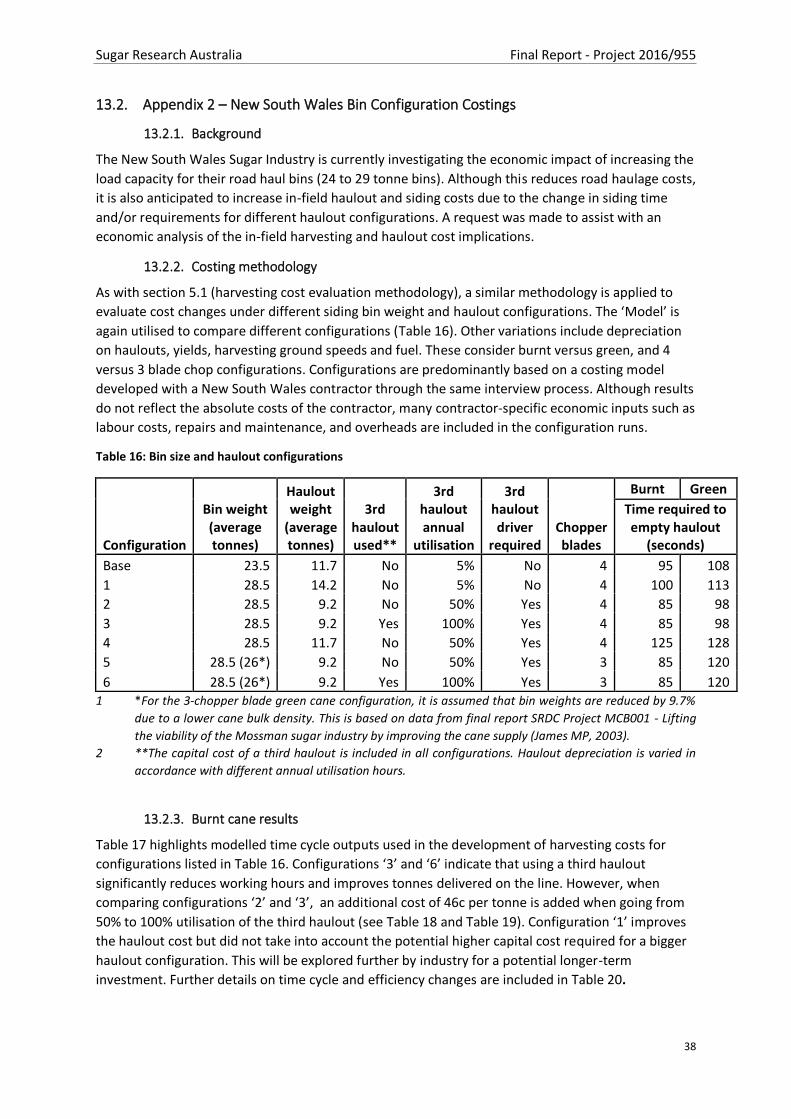
Sugar Research Australia Final Report - Project 2016/955
38
13.2. Appendix 2 – New South Wales Bin Configuration Costings
13.2.1. Background
The New South Wales Sugar Industry is currently investigating the economic impact of increasing the
load capacity for their road haul bins (24 to 29 tonne bins). Although this reduces road haulage costs,
it is also anticipated to increase in-field haulout and siding costs due to the change in siding time
and/or requirements for different haulout configurations. A request was made to assist with an
economic analysis of the in-field harvesting and haulout cost implications.
13.2.2. Costing methodology
As with section 5.1 (harvesting cost evaluation methodology), a similar methodology is applied to
evaluate cost changes under different siding bin weight and haulout configurations. The ‘Model’ is
again utilised to compare different configurations (Table 16). Other variations include depreciation
on haulouts, yields, harvesting ground speeds and fuel. These consider burnt versus green, and 4
versus 3 blade chop configurations. Configurations are predominantly based on a costing model
developed with a New South Wales contractor through the same interview process. Although results
do not reflect the absolute costs of the contractor, many contractor-specific economic inputs such as
labour costs, repairs and maintenance, and overheads are included in the configuration runs.
Table 16: Bin size and haulout configurations
Configuration
Bin weight (average tonnes)
Haulout weight
(average tonnes)
3rd haulout used**
3rd haulout annual
utilisation
3rd haulout driver
required Chopper blades
Burnt Green
Time required to empty haulout
(seconds)
Base 23.5 11.7 No 5% No 4 95 108
1 28.5 14.2 No 5% No 4 100 113
2 28.5 9.2 No 50% Yes 4 85 98
3 28.5 9.2 Yes 100% Yes 4 85 98
4 28.5 11.7 No 50% Yes 4 125 128
5 28.5 (26*) 9.2 No 50% Yes 3 85 120
6 28.5 (26*) 9.2 Yes 100% Yes 3 85 120 1 *For the 3-chopper blade green cane configuration, it is assumed that bin weights are reduced by 9.7%
due to a lower cane bulk density. This is based on data from final report SRDC Project MCB001 - Lifting
the viability of the Mossman sugar industry by improving the cane supply (James MP, 2003).
2 **The capital cost of a third haulout is included in all configurations. Haulout depreciation is varied in
accordance with different annual utilisation hours.
13.2.3. Burnt cane results
Table 17 highlights modelled time cycle outputs used in the development of harvesting costs for
configurations listed in Table 16. Configurations ‘3’ and ‘6’ indicate that using a third haulout
significantly reduces working hours and improves tonnes delivered on the line. However, when
comparing configurations ‘2’ and ‘3’, an additional cost of 46c per tonne is added when going from
50% to 100% utilisation of the third haulout (see Table 18 and Table 19). Configuration ‘1’ improves
the haulout cost but did not take into account the potential higher capital cost required for a bigger
haulout configuration. This will be explored further by industry for a potential longer-term
investment. Further details on time cycle and efficiency changes are included in Table 20.
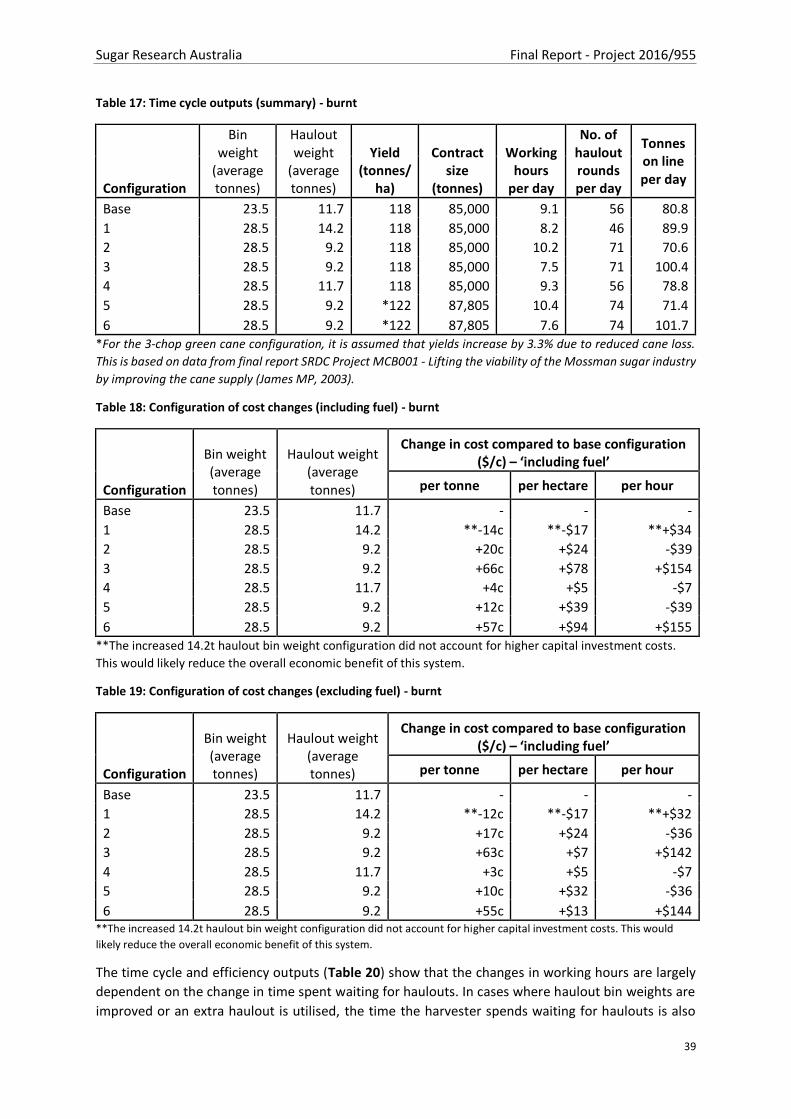
Sugar Research Australia Final Report - Project 2016/955
39
Table 17: Time cycle outputs (summary) - burnt
Configuration
Bin weight
(average tonnes)
Haulout weight
(average tonnes)
Yield (tonnes/
ha)
Contract size
(tonnes)
Working hours
per day
No. of haulout rounds per day
Tonnes on line per day
Base 23.5 11.7 118 85,000 9.1 56 80.8
1 28.5 14.2 118 85,000 8.2 46 89.9
2 28.5 9.2 118 85,000 10.2 71 70.6
3 28.5 9.2 118 85,000 7.5 71 100.4
4 28.5 11.7 118 85,000 9.3 56 78.8
5 28.5 9.2 *122 87,805 10.4 74 71.4
6 28.5 9.2 *122 87,805 7.6 74 101.7 *For the 3-chop green cane configuration, it is assumed that yields increase by 3.3% due to reduced cane loss.
This is based on data from final report SRDC Project MCB001 - Lifting the viability of the Mossman sugar industry
by improving the cane supply (James MP, 2003).
Table 18: Configuration of cost changes (including fuel) - burnt
Configuration
Bin weight (average tonnes)
Haulout weight (average tonnes)
Change in cost compared to base configuration ($/c) – ‘including fuel’
per tonne per hectare per hour
Base 23.5 11.7 - - -
1 28.5 14.2 **-14c **-$17 **+$34
2 28.5 9.2 +20c +$24 -$39
3 28.5 9.2 +66c +$78 +$154
4 28.5 11.7 +4c +$5 -$7
5 28.5 9.2 +12c +$39 -$39
6 28.5 9.2 +57c +$94 +$155 **The increased 14.2t haulout bin weight configuration did not account for higher capital investment costs.
This would likely reduce the overall economic benefit of this system.
Table 19: Configuration of cost changes (excluding fuel) - burnt
Configuration
Bin weight (average tonnes)
Haulout weight (average tonnes)
Change in cost compared to base configuration ($/c) – ‘including fuel’
per tonne per hectare per hour
Base 23.5 11.7 - - -
1 28.5 14.2 **-12c **-$17 **+$32
2 28.5 9.2 +17c +$24 -$36
3 28.5 9.2 +63c +$7 +$142
4 28.5 11.7 +3c +$5 -$7
5 28.5 9.2 +10c +$32 -$36
6 28.5 9.2 +55c +$13 +$144 **The increased 14.2t haulout bin weight configuration did not account for higher capital investment costs. This would
likely reduce the overall economic benefit of this system.
The time cycle and efficiency outputs (Table 20) show that the changes in working hours are largely
dependent on the change in time spent waiting for haulouts. In cases where haulout bin weights are
improved or an extra haulout is utilised, the time the harvester spends waiting for haulouts is also

Sugar Research Australia Final Report - Project 2016/955
40
reduced. This improves both harvester field efficiencies (time spent harvesting relative to total time
infield) and tonnes online for the mill.
Table 20: Configuration of time cycle and efficiency outputs detailed - burnt
13.2.4. Green cane results
Results for green cane configurations follow burnt cane trends. Table 21 highlights modelled time
cycle outputs used while configurations ‘3’ and ‘6’ again indicate that working day hours and tonnes
on the line improve through use of a third haulout. For green cane, this adds 52c per tonne as shown
in Table 23 and Table 23 when moving from configuration ‘2’ to ‘3’. Further details on time cycle and
efficiency changes are also included for green cane (Table 24).
Table 21: Time cycle outputs (summary) - Green
Configuration
Bin weight (average tonnes)
Haulout weight
(average tonnes)
Yield (tonnes/
ha)
Contract size
(tonnes)
Working hours
per day
No. of haulout rounds per day
Tonnes on line per day
Base 23.5 11.7 104 75,000 9.1 50 71.0
1 28.5 14.2 104 75,000 8.4 41 78.0
2 28.5 9.2 104 75,000 10.1 63 62.9
3 28.5 9.2 104 75,000 7.7 63 85.4
4 28.5 11.7 104 75,000 9.2 50 70.0
5 26.0 9.2 *107 77,475 10.5 65 62.4
6 26.0 9.2 *107 77,475 7.7 65 88.3 3 *For the 3-chop green cane configuration, it is assumed that yields increase by 3.3% due to reduced cane
loss. This is based on data from final report SRDC Project MCB001 - Lifting the viability of the Mossman
sugar industry by improving the cane supply (James MP, 2003).
Configuration Base 1 2 3 4 5 6Cutting time (hrs/day) 4.8 4.8 4.8 4.8 4.8 4.8 4.8
Turning time (hrs/day) 0.9 0.9 0.9 0.9 0.9 0.9 0.9
Time spent waiting for haulouts (hrs/day) 2.3 1.5 3.5 0.7 2.5 3.7 0.9
Backing time (hrs/day, 1-way cutting)
Time spent waiting for bins (hrs/day) 0.0 0.0 0.0 0.0 0.0 0.0 0.0
Servicing time (hrs/day) 0.8 0.8 0.8 0.8 0.8 0.8 0.8
Moving time (hrs/day) 0.3 0.3 0.3 0.3 0.3 0.3 0.3
TOTAL 9.1 8.2 10.2 7.5 9.3 10.4 7.6
Field Efficiency 53.5% 58.7% 47.3% 64.7% 52.3% 46.5% 63.6%
Ha/ hour 1.14 1.14 1.14 1.14 1.14 1.14 1.14
Elevator pour rate (tc/hr) 135 135 135 135 135 139 139
Adjusted harvest contract (t) 85,000 85,000 85,000 85,000 85,000 87,805 87,805
Total harvester cutting hours per year 632 632 632 632 632 632 632
Daily Allotment (t cut/day) 651 651 651 651 651 673 673
Rows harvested per day 73 73 73 73 73 73 73
Time lost to turning (mins/day) 54 54 54 54 54 54 54
Number of Haulout rounds per day 28.0 22.9 35.4 23.6 27.8 36.6 24.4
Time to fill haulout bin - mins 5.2 6.3 4.1 4.1 5.2 4.0 4.0
Haulout round trip - excluding bin fill (mins) 10.3 10.4 10.2 10.2 10.8 10.2 10.2
Lost harvest time per haulout cycle (min) 5.1 4.1 6.1 2.0 5.6 6.2 2.2
Total lost harvesting time per day - waiting (min) 138.5 89.6 208.6 44.3 150.7 220.3 51.9
Tonnes on Line (TCH) 80.8 89.9 70.6 100.4 78.8 71.4 101.7
Total harvesting time (hrs/day) 8.1 7.2 9.2 6.5 8.3 9.4 6.6
Average Idle Time per Haulout per day (hrs) 0.0 0.0 0.0 0.0 0.0 0.0 0.0
Haulout Net Time in Motion (hrs) 8.1 7.2 9.2 6.5 8.3 9.4 6.6
Haulout Time in Motion per day (hrs) 8.1 7.2 9.2 6.5 8.3 9.4 6.6
Total engine hours per day 8.3 7.5 9.5 6.7 8.5 9.7 6.9
Total engine hours per year (harvester & haulouts) 1,084 978 1,237 879 1,111 1,262 896
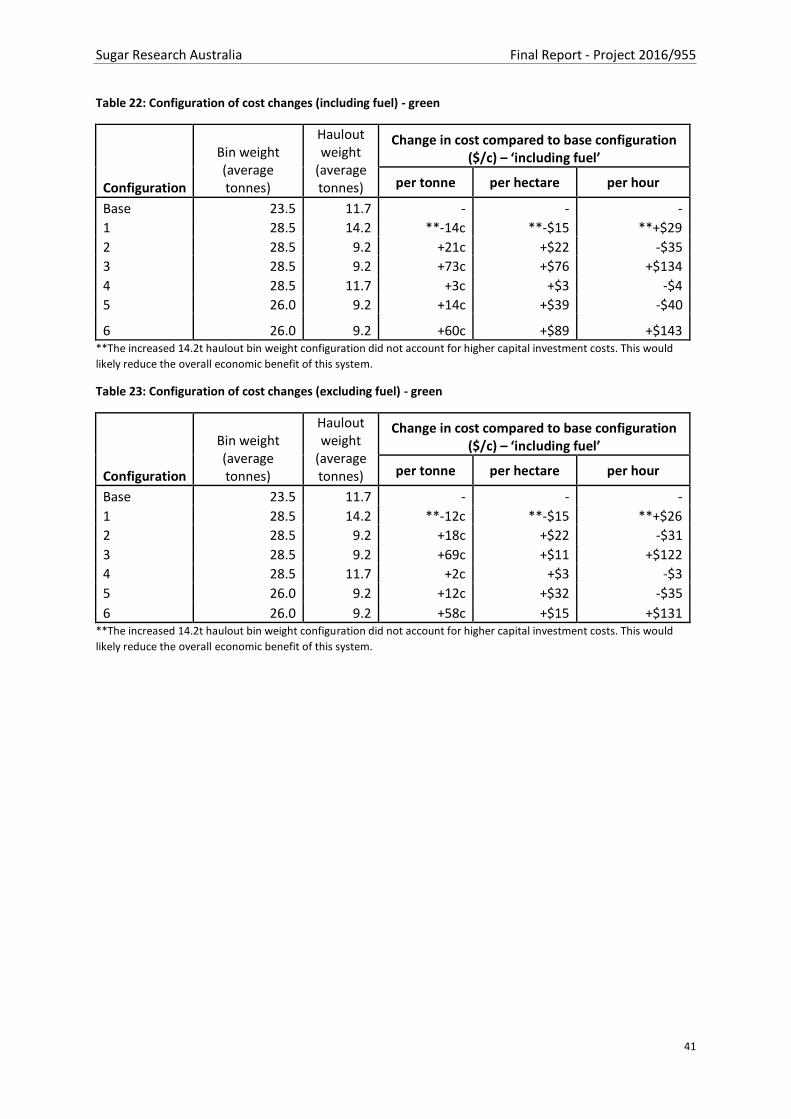
Sugar Research Australia Final Report - Project 2016/955
41
Table 22: Configuration of cost changes (including fuel) - green
Configuration
Bin weight (average tonnes)
Haulout weight
(average tonnes)
Change in cost compared to base configuration ($/c) – ‘including fuel’
per tonne per hectare per hour
Base 23.5 11.7 - - -
1 28.5 14.2 **-14c **-$15 **+$29
2 28.5 9.2 +21c +$22 -$35
3 28.5 9.2 +73c +$76 +$134
4 28.5 11.7 +3c +$3 -$4
5 26.0 9.2 +14c +$39 -$40
6 26.0 9.2 +60c +$89 +$143 **The increased 14.2t haulout bin weight configuration did not account for higher capital investment costs. This would
likely reduce the overall economic benefit of this system.
Table 23: Configuration of cost changes (excluding fuel) - green
Configuration
Bin weight (average tonnes)
Haulout weight
(average tonnes)
Change in cost compared to base configuration ($/c) – ‘including fuel’
per tonne per hectare per hour
Base 23.5 11.7 - - -
1 28.5 14.2 **-12c **-$15 **+$26
2 28.5 9.2 +18c +$22 -$31
3 28.5 9.2 +69c +$11 +$122
4 28.5 11.7 +2c +$3 -$3
5 26.0 9.2 +12c +$32 -$35
6 26.0 9.2 +58c +$15 +$131 **The increased 14.2t haulout bin weight configuration did not account for higher capital investment costs. This would
likely reduce the overall economic benefit of this system.

Sugar Research Australia Final Report - Project 2016/955
42
Table 24: Configuration of time cycle and efficiency outputs detailed - green
Configuration Base 1 2 3 4 5 6Cutting time (hrs/day) 5.8 5.8 5.8 5.8 5.8 5.8 5.8
Turning time (hrs/day) 0.9 0.9 0.9 0.9 0.9 0.9 0.9
Time spent waiting for haulouts (hrs/day) 1.4 0.6 2.4 0.0 1.5 2.8 0.0
Backing time (hrs/day, 1-way cutting)
Time spent waiting for bins (hrs/day) 0.0 0.0 0.0 0.0 0.0 0.0 0.0
Servicing time (hrs/day) 0.8 0.8 0.8 0.8 0.8 0.8 0.8
Moving time (hrs/day) 0.3 0.3 0.3 0.3 0.3 0.3 0.3
TOTAL 9.1 8.4 10.1 7.7 9.2 10.5 7.7
Field Efficiency 63.9% 69.5% 57.4% 75.3% 63.2% 55.4% 75.3%
Ha/ hour 0.95 0.95 0.95 0.95 0.95 0.95 0.95
Elevator pour rate (tc/hr) 99 99 99 99 99 102 102
Adjusted harvest contract (t) 75,000 75,000 75,000 75,000 75,000 77,475 77,475
Total harvester cutting hours per year 759 759 759 759 759 759 759
Daily Allotment (t cut/day) 575 575 575 575 575 594 594
Rows harvested per day 73 73 73 73 73 73 73
Time lost to turning (mins/day) 55 55 55 55 55 55 55
Number of Haulout rounds per day 24.7 20.2 31.2 20.8 24.6 32.3 21.5
Time to fill haulout bin - mins 7.1 8.6 5.6 5.6 7.1 5.4 5.4
Haulout round trip - excluding bin fill (mins) 10.6 10.6 10.4 10.4 10.9 10.8 10.8
Lost harvest time per haulout cycle (min) 3.5 2.0 4.8 0.0 3.8 5.3 0.0
Total lost harvesting time per day - waiting (min) 82.2 38.7 145.0 0.0 89.0 167.0 0.0
Tonnes on Line (TCH) 71.0 78.0 62.9 85.4 70.0 62.4 88.3
Total harvesting time (hrs/day) 8.1 7.4 9.1 6.7 8.2 9.5 6.7
Average Idle Time per Haulout per day (hrs) 0.0 0.0 0.0 0.3 0.0 0.0 0.0
Haulout Net Time in Motion (hrs) 8.1 7.4 9.1 6.5 8.2 9.5 6.7
Haulout Time in Motion per day (hrs) 8.1 7.4 9.1 6.7 8.2 9.5 6.7
Total engine hours per day 8.3 7.6 9.4 7.0 8.5 9.8 7.0
Total engine hours per year (harvester & haulouts) 1,089 994 1,226 910 1,104 1,274 910