final report - calvin college
TRANSCRIPT

Team 11: Design Report
Anna Groendyk Josh Uitvlugt
Amanda Hayes Calvin College
Engineering 340 18 May 2011

Acknowledgements
This project would not have been possible without many willing and gracious people
who guided and helped our team throughout the year. Of particular note are:
Dr. David Wunder, Ph.D., Senior Design Advisor. Professor Wunder was a source of
great encouragement and guidance to our team, especially through the early stages of
project definition. Mrs. Navy Chann, Director of GCT. Mrs. Chann was our team’s main contact in
Cambodia, and spent hours helping us to understand GCT’s needs over Skype, despite
the 12-hour time difference. Mr. Roger Lamer, P.E., Industrial Consultant. Mr. Lamer was especially helpful in
giving our team a vision for how to start our floor plan design. Dr. Don Wotring, Ph.D, Soils Instructor. Dr. Wotring took the time to give us a basic
education in pile foundations, material that was several steps beyond the scope of our
class. Dr. Leonard De Rooy, Ph.D., Structural Professor. Professor De Rooy was our
team’s greatest resource in this project. Despite his busy schedule, he consistently
spent hours at a time teaching our team how to design a reinforced concrete building, a
topic that we had barely brushed in previous classes – and all with a smile on his face.
Thank you!

ii | P a g e
Executive Summary The nation of Cambodia is slowly developing into a stable and prosperous part of the
global community. Because of the devastation of the nation's political, educational, and
healthcare systems in recent history, much of the remaining population is young and
poorly educated. The Genesis Community of Transformation (GCT) was created as a
non-profit, Non-Governmental Organization (NGO) by Navy Chann and Ly Chhay to help
educate and improve the lives of Cambodian Citizens. GCT is currently renting office space
in Phnom Penh, but they would like to construct their own building to serve as a new base
of operations.
The Khmer Genesis Project focuses on the design of a nine-story building, which can
be seen in Figure 1 and a basic site plan for the location of GCT’s new office facility.
The building itself is designed with space for offices, hotel-style rooms, meeting rooms,
an assembly hall, a kitchen, a fitness center, a store, and a permanent residence for
GCT’s directors. The site plan for the property includes space for a garden, parking,
access for cars to drive through the site, a small pool, and the building itself. Through
this project, Team 11 has utilized culturally appropriate materials and construction
practices, provided clear and usable feedback to GCT, and designed a structure that
can be trusted. The final product delivered to GCT includes structural, architectural,
and promotional drawings of the building, plans for construction, a cost estimate and bill
of materials for the building and foundation, a proposed general layout of the developed
site, and feasibility-level suggestions for foundation design and management of waste
and drinking water.

iii | P a g e
From square meter estimates, the entire finished building was expected to cost
between 2 and 3.5 million dollars. The cost of materials for structural elements
alone was significantly less, as expected, around $502,000 without block walls and
$684,000 with blocks.
Figure 1: View of Building Design, Rendered in Source™.

iv | P a g e
TABLE OF CONTENTS ACKNOWLEDGEMENTS .................................................................................................................................................................. II
EXECUTIVE SUMMARY ................................................................................................................................................................... II
1. INTRODUCTION ........................................................................................................................................................................... 1
1.1. PROJECT STATEMENT................................................................................................................................................................ 1
1.2. TEAM....................................................................................................................................................................................... 1
1.2.1. Amanda Hayes............................................................................................................................................................ 1
1.2.2. Anna Groendyk ........................................................................................................................................................... 1
1.2.3. Josh Uitvlugt................................................................................................................................................................ 2
2. BACKGROUND ............................................................................................................................................................................. 3
2.1. CAMBODIAN HISTORY............................................................................................................................................................... 3
2.2. CAMBODIA TODAY.................................................................................................................................................................... 4
2.3. WEATHER DATA ....................................................................................................................................................................... 4
2.4. GENESIS COMMUNITY OF TRANSFORMATION ............................................................................................................................ 6
3. PROBL EM DEFINITION ............................................................................................................................................................... 7
4. PROJECT ......................................................................................................................................................................................10
4.1. SCOPE ....................................................................................................................................................................................10
4.2. TIMELINE................................................................................................................................................................................10
4.3. COST......................................................................................................................................................................................12
4.3.1. Design Costs ..............................................................................................................................................................12
4.3.2. Construction Costs ...................................................................................................................................................12
4.3.3. Costs Calculated from Bil l of Materials ................................................................................................................15
5. DESIGN CONSIDERATIONS ......................................................................................................................................................16
5.1. SITE .......................................................................................................................................................................................16
5.1.1. Site History ................................................................................................................................................................16
5.1.2. Topography ...............................................................................................................................................................16
5.1.3. Hydrology ..................................................................................................................................................................16
5.1.4. Soil...............................................................................................................................................................................17
5.2. FLOODING & FLOOD CONTROL OPTIONS .................................................................................................................................19
5.3. BUILDING CODE ......................................................................................................................................................................20
5.4. LOADING FACTORS .................................................................................................................................................................20
5.4.1. Wind load ..................................................................................................................................................................20

v | P a g e
5.4.2. Earthquake Load ......................................................................................................................................................27
5.4.3. Rainfall Load .............................................................................................................................................................29
5.4.4. Dead Loads ................................................................................................................................................................30
5.4.5. Live Load ....................................................................................................................................................................31
5.5. MATERIALS AND BUILDING STYLE ............................................................................................................................................31
5.5.1. Building Material......................................................................................................................................................31
5.5.2. Traditional Building Styles ......................................................................................................................................31
5.5.3. Alternate Building Materials ..................................................................................................................................32
5.5.4. Deep Foundations ....................................................................................................................................................33
6. DESIGN NORMS.........................................................................................................................................................................35
6.1. CULTURAL APPROPRIATENESS .................................................................................................................................................35
6.2. STEWARDSHIP ........................................................................................................................................................................35
6.3. INTEGRITY ..............................................................................................................................................................................36
6.4. TRUST ....................................................................................................................................................................................36
7. ALTERNATIVE SOL UTIONS.......................................................................................................................................................37
8. DESIGN ........................................................................................................................................................................................38
8.1. DESIGN MODELING ................................................................................................................................................................38
8.1.1. STAAD.Pro..................................................................................................................................................................38
8.1.2. Model Verification....................................................................................................................................................39
8.1.3. Cracked Element Analysis .......................................................................................................................................40
8.1.4. Source™ Modeling....................................................................................................................................................41
8.2. BEAM DESIGN ........................................................................................................................................................................42
8.3. COLUMN DESIGN....................................................................................................................................................................48
8.4. SLAB DESIGN ..........................................................................................................................................................................52
8.5. SHEAR WALL DESIGN..............................................................................................................................................................54
8 .6. MECHANICAL.........................................................................................................................................................................56
8.6.1. Plumbing ....................................................................................................................................................................56
8.6.2. Air Conditioning ........................................................................................................................................................56
8.7. PARKING DESIGN ....................................................................................................................................................................57
9. SUGGESTIONS ............................................................................................................................................................................59
9.1. FOUNDATION COST ESTIMATION.............................................................................................................................................59
9.2. DRINKING WATER ..................................................................................................................................................................60
9.2.1. Current Condition/Quality Needed .......................................................................................................................60

vi | P a g e
9.2.2. Current/Future Water Use......................................................................................................................................62
9.2.3. GCT Drinking Water Possibilities/Alternatives ....................................................................................................62
9.3. WASTEWATER ........................................................................................................................................................................64
9.3.1. Current/Future Water Use......................................................................................................................................64
9.3.2. GCT Sewage Possibilities/Alternatives .................................................................................................................64
9.3.3. Sewage Trench/Trench Control Options ..............................................................................................................65
9.4. UTILITIES ................................................................................................................................................................................65
9.4.1. Electricity ...................................................................................................................................................................65
9.4.2. City Water..................................................................................................................................................................65
9.4.3. City Sanitary Sewer ..................................................................................................................................................65
9.4.4. Gas ..............................................................................................................................................................................65
10. CONCLUSION AND RECOMMENDATIONS .........................................................................................................................66
10.1. CONCLUSION........................................................................................................................................................................66
10.2. RECOMMENDATIONS FOR FURTHER DESIGN ..........................................................................................................................66
APPENDIX A – REFERENCES.........................................................................................................................................................68
APPENDIX B – COST ESTIMATES.................................................................................................................................................72
APPENDIX C – DETAILED CALCULATIONS .................................................................................................................................83
C.1. LOAD CALCULATIONS..............................................................................................................................................................83
C.1.1. Wind Calculations ....................................................................................................................................................83
C.1.2. Seismic Loads ............................................................................................................................................................84
C.1.3. Dead Load Calculations...........................................................................................................................................85
C.1.4 Live Load Calculations ..............................................................................................................................................86
C.2. BEAM DESIGN ........................................................................................................................................................................87
C.2.1 Metric Concrete Excel Design Program Calculations ..........................................................................................87
C.2.2. Stirrup Calculations..................................................................................................................................................89
C.2.3. Whitney Stress Block Method ................................................................................................................................90
C.2.4. Hand Calculations ....................................................................................................................................................98
C.3. COLUMN DESIGN .................................................................................................................................................................109
C.3.1 Column Ties ..............................................................................................................................................................116
C.4. SHEAR WALL REINFORCEMENT .............................................................................................................................................117
C.5. WATER USAGE ESTIMATES ...................................................................................................................................................119
C.6. CAISSON FOUNDATION COST-ESTIMATE CALCULATIONS ........................................................................................................126

vii | P a g e
LIST OF TABLES
TABLE 1: ABBREVIATIONS USED IN REPORT .............................................................................................X TABLE 2: SUMMARY OF CAMBODIAN STATISTICS .....................................................................................4 TABLE 3: THE DAILY AVERAGE TEMPERATURES (°C).................................................................................5 TABLE 4: THE RECORD HIGH AND LOW TEMPERATURES ............................................................................5 TABLE 5: THE DAILY AVERAGE HUMIDITY ................................................................................................5 TABLE 6: THE DAILY WIND DATA FOR PHNOM PENH, CAMBODIA .................................................................5 TABLE 7: THE AVERAGE NUMBER OF PRECIPITATION EVENTS IN PHNOM PENH..............................................5 TABLE 8: PROJECT TASKS FOR FIRST AND SECOND SEMESTER.................................................................11 TABLE 9: ESTIMATION OF FEE AN ENGINEERING CONSULTATION FIRM WOULD CHARGE FOR THIS PROJECT. ..12 TABLE 10: PROJECT COST CALCULATION FROM GCT’S COST-PER-SQUARE-METER E STIMATION. ....................14 TABLE 11: BUILDING COST ESTIMATION BASED ON BUILDINGS IN PHNOM PENH ............................................14 TABLE 12: CALCULATION SUMMARY OF CONCRETE AND STEEL COSTS ......................................................15 TABLE 13: TOTAL STRUCTURAL AND BLOCK WALL MATERIAL COSTS........................................................15 TABLE 14: CAMBODIAN RAINFALL ........................................................................................................16 TABLE 15: WIND LOADS I N MODEL .......................................................................................................24 TABLE 16: WIND LOAD MINI-CASE MULTIPLIER FOR STAAD MODEL .........................................................26 TABLE 17: ASCE 7 TABLE 11.6-1 SEISMIC DESIGN CATEGORY BASED ON SHORT PERIOD RESPONSE
ACCELERATION PARAMETER ........................................................................................................27 TABLE 18: ASCE 7 TABLE 11.4-1 SITE COEFFICIENT ..............................................................................28 TABLE 19: ASCE 7 TABLE 20.3-1 SITE CLASSIFICATION .................................................................29 TABLE 20: DEAD LOADS .....................................................................................................................30 TABLE 21: LIVE LOADS .......................................................................................................................31 TABLE 22: THE TYPICAL SLUMP FOR VARIOUS PILE TYPES ......................................................................33 TABLE 23: THE TYPICAL MENARD PRESSURE-METER VALUES FOR VARIOUS SOIL TYPES .............................34 TABLE 24: CALCULATED A ND ALLOWABLE MAXIMUM DEFLECTION BY FLOOR .............................................40 TABLE 25A: LIST OF BEAM SIZES AND STRENGTHS .................................................................................44 TABLE 26: DEVELOPMENT LENGTH FACTORS FOR VARIOUS BAR CONDITIONS ............................................47 TABLE 27: COLUMN PLACEMENT: FOUR CUT VIEWS NORMAL TO X-AXIS....................................................49 TABLE 28: COLUMN DESIGN DETAILS....................................................................................................51 TABLE 29: COLUMN TIE DESIGN ...........................................................................................................51 TABLE 30: SPACING FOR SHEAR WALL REINFORCEMENT .........................................................................55 TABLE 31: THE RESULTS OF PARKING NEEDS INVESTIGATION...................................................................58 TABLE 32: CAISSON PLACEMENT BASED ON SOIL COMPRESSION STRENGTH [KN] ......................................59 TABLE 33: CAISSON DESIGN DETAILS ...................................................................................................60 TABLE 34: FUTURE WATER USE PROJECTIONS. ......................................................................................62 TABLE 35: OPTIONS FOR GCT’S DRINKING WATER TREATMENT ...............................................................63

viii | P a g e
TABLE 36: SUMMARY FOR THE FIRST METHOD OF TOTAL COST ESTIMATION ...............................................72 TABLE 37: CONSUMER PRICE INDEX......................................................................................................72 TABLE 38: CALCULATIONS OF CONSTRUCTION COST INDEXES ..................................................................73 TABLE 39: PURCHASING POWER PARITY INDEX FOR CAMBODIA ................................................................73 TABLE 40: COST OF CONCRETE FOR BEAMS ..........................................................................................74 TABLE 41A: LENGTH OF LONGITUDNAL REINFORCING STEEL FOR BEAMS ...................................................75 TABLE 42: COST OF LONGITUDNAL REINFORCING STEEL FOR BEAMS ........................................................76 TABLE 43: COST OF STIRRUPS; THE SHEAR REINFORCING FOR BEAMS .....................................................76 TABLE 44: APPROXIMATION OF THE COST AND NUMBER OF BLOCKS NEEDED FOR WALLS...........................77 TABLE 45: COST OF CONCRETE FOR COLUMNS ......................................................................................78 TABLE 46: COST OF LONGITUDNAL REINFORCING STEEL FOR COLUMNS ....................................................79 TABLE 47: COST OF TIES; THE SHEAR REINFORCING FOR COLUMNS .........................................................79 TABLE 48: COST OF CONCRETE FOR SHEAR WALLS................................................................................80 TABLE 49: COST OF THE STEEL REINFORCING FOR SHEAR WALLS ............................................................80 TABLE 50: COST OF CONCRETE FOR T HE SLAB.......................................................................................81 TABLE 51: COST OF THE STEEL REINFORCING FOR THE SLAB ...................................................................81 TABLE 52: COST OF CONCRETE FOR T HE ELEVATOR PLATFORM ...............................................................82 TABLE 53: COST OF CONCRETE FOR T HE STAIRS ....................................................................................82 TABLE 54: DEAD LOAD CALCULATIONS .................................................................................................85 TABLE 55: LIVE LOAD CALCULATIONS ..................................................................................................86 TABLE 58: CALCULATING TIE BAR SIZE REQUIREM ENTS ........................................................................ 116 TABLE 59: CALCULATING TIE SPACING REQUIREMENTS ......................................................................... 116 TABLE 60: TOTAL FIXTURES FOR BUILDING, BY LEVEL .......................................................................... 119 TABLE 60: DRAINAGE PIPE SIZE REQUIRED FOR ALL FIXTURES ON STACK 1 ............................................. 120 TABLE 62: DRAINAGE PIPE SIZE REQUIRED FOR ALL FIXTURES ON STACK 2 ............................................. 123

ix | P a g e
TABLE O F FIGURES
FIGURE 1: VIEW O F BUILDING DESIGN, RENDERED IN SOURCE™. ............................................................... III FIGURE 2: GCT'S PROPERTY IN PHNOM PENH, MARKED WITH THE PURPLE PIN.. ...........................................8 FIGURE 3: ARIAL VIEW O F GCT'S LAND. CORNERS OF THE PROPERTY ARE MARKED WITH BLUE PINS .............8 FIGURE 4: TONLE SAP FLOODPLAIN ......................................................................................................17 FIGURE 5: LOCATION OF BUILDING SITE O N MAP OF SOIL TYPES OF PHNOM PENH, CAMBODIA ......................18 FIGURE 6: DESIGN WIND PRESSURE ACTING ON EXTERIOR OF BUILDING BY ELEVATION ...............................22 FIGURE 7:TRIBUTARY AREA CASE O F EACH NODE FOR T HE WIND LOADS WITH BUILDING IN SIDE-VIEW ..........23 FIGURE 8: ORIENTATION OF WIND LOAD MINI-CASES F OR STAAD.PRO MODEL ..........................................25 FIGURE 9: APARTMENT COMPLEX IN PHNOM PENH FEATURING WRAP-AROUND BALCONY ............................31 FIGURE 10: RENDERING OF INTERIOR OF SOURCE™ MODEL .....................................................................41 FIGURE 11: LENGTH GUIDE FOR TABLE 25. ............................................................................................45 FIGURE 12: BEAM SIZE SCHEMATIC FOR LEVELS 1-8 ...............................................................................45 FIGURE 13: BEAM SIZE SCHEMATIC FOR LEVEL 9....................................................................................45 FIGURE 14: METHOD FOR DETERMINING INFLECTION POINTS ....................................................................46 FIGURE 15: MOMENT (MN) VS. AXIAL FORCE (PN) CURVES FOR COLUMNS .................................................50 FIGURE 16: LOCATION OF SHEAR WALLS...............................................................................................54 FIGURE 17: RDI CERAMIC FILTRATION ..................................................................................................61 FIGURE 18: FIGURE D-1 FO USGS "DOCUMENTATION FOR THE SOUTHEAST ASIA SEISMIC HAZARD MAPS" ....84 FIGURE 19: WHITNEY STRESS BLOCK DIAGRAM .....................................................................................91 FIGURE 20: BETA FACTOR FOR BEAMS..................................................................................................91 FIGURE 21: FIRST ITERATION BEAM WIDTH CALCULATOR IN EXCEL (M) ......................................................93 FIGURE 22: DETAILED CALCULATOR FOR BEAM SIZES .............................................................................94 FIGURE 23: B100’S BENDING MOMENT GRAPHS .....................................................................................95 FIGURE 24: B200’S BENDING MOMENT GRAPHS .....................................................................................95 FIGURE 25: B300’S BENDING MOMENT GRAPHS .....................................................................................96 FIGURE 26: B400’S BENDING MOMENT GRAPHS .....................................................................................97 FIGURE 27: B300’S BENDING MOMENT GRAPHS .....................................................................................97 FIGURE 28: MOMENT HAND CALCULATION LAYOUT .................................................................................99 FIGURE 29: COLUMN DESIGN DIMENSIONS ........................................................................................... 109 FIGURE 30: "EXACT COLUMN DESIGN.XLSX" CALCULATIONS.................................................................. 115 FIGURE 31: CALCULATIONS FROM EXCEL DOCUMENT "FOUNDATION DESIGN FOR COST ESTIMATE ONLY.XLSX"
.............................................................................................................................................. 127

x | P a g e
Table 1: Abbreviations Used in Report
Abbreviation DefinitionASCE American Society of Civil EngineersCO Community Organization (process)CPI Consumer Price IndexCRWRC Christian Reformed World Relief CommitteeDOL Department of LaborGCT Genesis Community of TransformationIBC International Building CodeLLC Limited Liability CompanyNGO Non-Government OrganizationPPP Purchasing Power ParityRDI Research Development International

1 | P a g e
1. Introduction
1.1. Project Statement
The Khmer Genesis project focuses on designing a multi-story office building for the
Cambodian non-profit Non-Government Organization (NGO) Genesis Community of
Transformation (GCT). GCT was created by Cambodian national Navy Chan to help
improve the lives of the people of Cambodia by training farmers, improving local
community organization, and providing educational opportunities to people who
would not normally have them. This proposed office bui lding would allow the
organization to expand significantly and greatly increase its ability to serve the
community.
1.2. Team
1.2.1. Amanda Hayes
Amanda Hayes will be graduating from Calvin in the spring of 2011 with a
Bachelor Degree of Science in Engineering and a concentration in the Civil and
Environmental discipline. She spent last summer in Atlanta working for the
Environmental Protection Agency, and the summer before doing engineering
research at Calvin. She grew up in suburban Pittsburgh, but hopes to spend the
rest of her life in the developing world or inner city, whether doing engineering
work, ministry, teaching, or anything else God leads her to. Currently, she is
planning to leave in July for an 11-month volunteer internship with Christian
Reformed World Missions in Cambodia. When she returns, she plans to learn to
be an inner-city physics teacher through the Memphis Teacher Residency.
1.2.2. Anna Groendyk
Anna Groendyk is a senior from Kalamazoo, Michigan. At Calvin, Anna is
pursuing a Bachelor Degree of Science in Engineering with a concentration in
Civil and Environmental Engineering. Last summer, she had an internship under
the City Engineer with the City of St. Joseph, Michigan. After graduating in the
spring of 2011, Anna plans to pursue a career in civil/environmental engineering.

2 | P a g e
1.2.3. Josh Uitvlugt
Josh Uitvlugt is a Grand Rapids resident who will graduate from Calvin in the
spring of 2011 with a Bachelor Degree of Science in Engineering with a Civil and
Environmental concentration. He is also an artist who owns and operates his
own web-comic site, which he continues to update regularly. After graduation,
Josh hopes to pursue a career in civil and environmental engineering.

3 | P a g e
2. Background
2.1. Cambodian History
During the last century, Cambodia was overwhelmed with war and political chaos
that destroyed infrastructure and crippled progress. Since October 1887, Cambodia
was a French protectorate as part of French Indo-China.16 In 1941, France gave
Cambodian nationalist Prince Norodom Sihanouk the throne expecting to manipulate
him because he was only 18 years old. However, Sihanouk became very popular
among the Cambodian people, and in 1953, he petitioned the French government
for independence. Cambodia achieved independence from France on November 9,
1953.9
In 1955, Sihanouk stepped down as King to run for President, for which he was
elected. Sihanouk was very popular politically but he was worried about his country
since bordering countries Vietnam and Laos each were involved in civil wars and
cold war tension was rising in Cambodia. A communist group called the Khmer
Rouge, which means Red Cambodians, was a growing source of resistance to
Sihanouk. In a 1970 coup, Sihanouk’s advisor and Prime Minister Lon Nol removed
Sihanouk from power, leaving Lon Nol as the head of government. Sihanouk went
into exile in China and allied himself with the Khmer Rouge to try to overthrow Lon
Nol’s new government.9
During the next few years, the Khmer Rouge, led by Pol Pot, gained power and
eventually captured Phnom Penh on April 17, 1975. The Khmer Rouge slaughtered
many educated Cambodian people and destroyed many libraries, hospitals, schools,
and cultural sites. In 1978, Vietnam invaded Cambodia to overthrow the Khmer
Rouge. Vietnamese troops took control of Phnom Penh on January 7, 1979.
Vietnam occupied Cambodia for 10 years. The United Nations intervened to help
Cambodia with democratic elections. Sihanouk broke all ties to the Khmer Rouge,
thus ending their regime. In 1991, a UN peace agreement was signed in Paris.9

4 | P a g e
2.2. Cambodia Today
Cambodia’s government is a constitutional monarchy. The current leaders are
Norodom Sihamoni, the King and Head of State; Hun Sen, the Prime Minister and
Head of Government; Chea Sim, the President of the Senate; and Heng Samrin, the
President of National Assembly. Table 2 has some current Cambodian statistics
from the CIA World Factbook.
2.3. Weather Data Table 3 - Table 7 show historical weather data from the Phnom Penh Airport that
was compiled by the Weather Underground.22 These data was collected daily from
January 1, 2001 to November 30, 2010 and these charts show averages as well as
extremes. Temperature data is important for consideration in construction. The
humidity data is important for design when thinking about indoor climate control for
the building as well as concrete curing. The wind data is important for looking at the wind loads on the building. Table 7 contains the average number of precipitation
events which, when compared to the rainfall depth data in Table 14 in Section 5.1.3
shows that the depth of rainfall is proportional to the number of rainfall events over
the course of the year.
Table 2: Summary of Cambodian Statistics.10

5 | P a g e
Table 3: The Daily Average Temperatures (°C) Listed by Month for Phnom Penh, Cambodia22
Table 4: The Record High and Low Temperatures for Each Month from January 2001 to November 2010 22
Table 5: The Daily Average Humidity for Each Month 22
Table 6: The Daily Wind Data for Phnom Penh, Cambodia by Month22
Table 7: The Average Number of Precipitation Events in Phnom Penh22

6 | P a g e
2.4. Genesis Community of Transformation
Genesis Community of Transformation is headed by Navy Chann and her husband
Ly Chhay, Cambodian nationals who grew up during the Khmer Rouge. They
moved to Canada until 1998, when they returned to Cambodia. Navy worked for 10
years for the Christian Reformed World Relief Committee (CRWRC) as the Country
Director for Cambodia. Later she resigned and started her own NGO, GCT, in 2009.
GCT uses the CRWRC’s Community Organization (CO) process, in which they train
a few people in a vi llage to help their vi llage establish a leadership committee,
discover their own resources, and decide how to organize themselves to solve
important issues faced by the villagers. GCT also supports and collaborates with
other NGOs in the area that have similar goals, such as World Hope International,
whose employees were trained by GCT in the CO process. Although the villages
they serve are in the countryside of southern Cambodia, GCT’s offices are located in
Phnom Penh, Cambodia’s capital.17
GCT is distinct from CRWRC in that it is much smaller-scale and works more directly
with villages. GCT has also purchased farmland to use for experimenting with and
demonstrating new agricultural techniques. These techniques show potential for
improving yields and environmental sustainability for small-time farmers in local
villages. Eventually, GCT will bring farmers to their facility to teach them these
techniques. GCT also specifically focuses on education and job training for women
and youth, including education about the effects of environmental health on human
health.17

7 | P a g e
3. Problem Definition GCT is currently renting office space in Phnom Penh. However, they would like to own
their own building to house their offices, a residence for the director, and a variety of
spaces to rent out in order to expand their organization and help more people. GCT
already owns a vacant plot of land where this building could be built. They would also
like to promote the farming methods they teach by planting a vegetable garden and by
selling some of their farmers’ crops through a farmer’s market and restaurant.
GCT desires a bui lding that can house their offices and commercial interests. Their
initial idea was for a building that would be twelve stories high, fifteen meters wide, and
twenty-four meters long. In comparison, other buildings in the area are six stories high
at most, although there are buildings in other areas of Phnom Penh that are much taller
than twelve stories.
This bui lding will need to be built in stages as funding becomes available. GCT hopes
to begin by building the foundation and first two floors. GCT will need drawings of their
future building and other promotional material to raise the funds to bui ld it.
The building will include GCT’s commercial investments: a restaurant, a fitness center,
office space for other NGOs to rent out, a large hall with small breakout rooms for
organizations to rent during conferences, and hotel-style rooms. It will also include
GCT’s offices and the director’s residence. On the site, GCT plans to build a pool with
landscaping around it and a garden. Most of the rest of the land will be used for
parking.
GCT has already purchased a 30-m x 60-m piece of land in Phnom Penh, down the street from GCT’s current rental office building, as seen in Figure 2 and Figure 3. The
land is low in elevation and floods knee-deep during the rainy season. This is especially
a problem because there is an open dirt trench along the side of the property through
which the neighborhood’s sanitary sewage line runs.

8 | P a g e
Figure 2: GCT's Property in Phnom Penh, Marked with the Purple Pin20
Figure 3: Arial View of GCT's Land. Corners of the Property are Marked with
Blue Pins.20

9 | P a g e
The land is low because it used to be a pond. GCT and the previous owners have both
added soil to the land, as much as three or four meters deep. However, the soil has
settled significantly, and the land still floods. The soil type and origin of this soil fi ll is
unknown, as is the soil type beneath the fill and the depth of bedrock.
GCT can connect to the city power grid and water supply. However, water used for
drinking and cooking or washing food must be treated further. GCT is interested in
alternatives to releasing sanitary sewage into the trench along their property.

10 | P a g e
4. Project
4.1. Scope
This project focuses on the design of the building only, involving:
• Identifying an optimal height for the bui lding
• Designing floor plans for each level
• Creating a working model of the concrete design in STAAD.Pro
• Considering site weather, hydrology, and soil type
• Honoring local culture, including architectural style
• Meeting international building standards
• Accommodating plumbing, electrical wiring, and elevator installation
• Estimating an accurate cost of construction
• Creating detailed drawings that a licensed engineer could check and expand
upon, and from which a contractor could build
4.2. Timeline Table 8 shows a schedule of tasks for both semesters of Senior Design Class. In
addition to the due dates required by the class, the schedule includes estimated
completion dates for deadlines set internally by the team.

11 | P a g e
Table 8: Project Tasks for First and Second Semester.

12 | P a g e
4.3. Cost
4.3.1. Design Costs
Since the final product is composed of drawings and computer models, since
STAAD.Pro software, as seen in Section 8.2.1, is available to this team through
Calvin College, and since team members have volunteered their time, this
project’s budget is minimal. Team 11 has budgeted $200 for purchasing
codebooks and other research material, and constructing a physical model of the building. Table 9 gives the results of estimating the equivalent value of time
spent working on the feasibility study and design. A tally of total hours spent on
the project for both semesters came to each team member spending 400 hours
on the project.
4.3.2. Construction Costs
GCT’s building, with nine floors, each dimensioned at 24m x 15m, is a total of
3240-m2. Using this area, rough per-square-meter costs were estimated using
two separate methods and used to estimate total construction costs.
Table 9: Estimation of Fee an Engineering Consultation Firm Would Charge for This Project.

13 | P a g e
In the first method, Means Assemblies37 was used to estimate per-square-foot
US 2009 costs for each floor, which were then summed and converted to SI
units, yielding $3.1 million. Using the Consumer Price Indexes (CPI) for 1992
and 2009, found on the US Department of Labor’s website,42 the estimate was
brought up to a present-day US value of $4.8 million. Then, using a construction
cost index from Turner & Townsend, an average developing countries
construction index and a US construction index were found.19 These were used
to scale the 2009 US estimate to a 2009 Cambodia estimate of $2.5 million.
Purchasing Power Parity (PPP), a measure of the purchasing power was also
used to scale the 2009 US estimate to a 2009 Cambodia estimate, which came
to $1.8 million.14
Error in these calculations is due to the following assumptions in order of least to
most error:
• The DOL’s CPI is essentially the price index for construction. This is
estimated to be at least 15% error from comparing the DOL and MEANS
CPIs for years previous to 1992.
• GCT’s parking garage, fitness center, program space, and hotel rooms are
well represented by Means’ parking garage, gymnasium, high rise offices,
and high rise apartments, respectively.
• For the construction cost index method, that Cambodia’s construction cost
index resembles that of China, Indonesia, India, and South Africa, the
countries whose indexes were averaged to use as Cambodia’s
construction cost index.
• For the PPP method, the basket of prices used to calculate PPP
represents construction costs accurately. It is believed that the actual cost
is within 200% of these cost estimates.

14 | P a g e
The second method for estimating the building cost was by using an estimate
per-square-meter that was given to the director of GCT by a contractor in Phnom
Penh. The estimate given by the contractor is $300/m2 with up to a 30%
variation. This includes both labor and materials. This estimation also has the engineering feasibility study and design cost shown in Table 9 added to it. The
results from cost estimation using the information GCT and a contractor in
Phnom Penh are shown in Table 10.
The third method for estimating per-square-meter costs was to find costs for
similar bui ldings being constructed in Phnom Penh. The results of these
estimates are shown in Table 11.
Between these three methods of cost estimation, the cost of the nine-story-
building design through construction will be between 2 and 3.5 million USD.
Table 11: Building cost estimation based on buildings that have been built recently or are currently being built in Phnom Penh.23,24,33
Table 10: Project cost calculation from GCT’s cost-per-square-meter estimation.
15 | P a g e
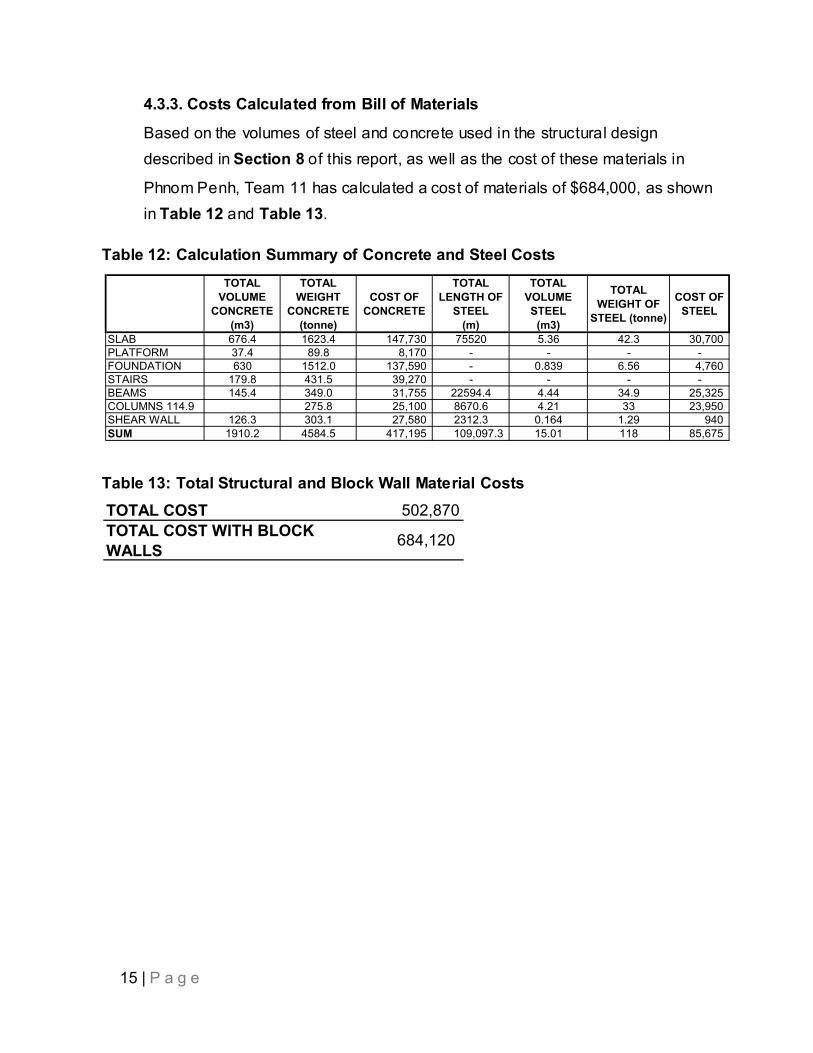
4.3.3. Costs Calculated from Bill of Materials
Based on the volumes of steel and concrete used in the structural design described in Section 8 of this report, as well as the cost of these materials in
Phnom Penh, Team 11 has calculated a cost of materials of $684,000, as shown in Table 12 and Table 13.
Table 12: Calculation Summary of Concrete and Steel Costs
Table 13: Total Structural and Block Wall Material Costs
TOTAL VOLUME
CONCRETE (m3)
TOTAL WEIGHT
CONCRETE (tonne)
COST OF CONCRETE
TOTAL LENGTH OF
STEEL (m)
TOTAL VOLUME STEEL
(m3)
TOTAL WEIGHT OF
STEEL (tonne)
COST OF STEEL
SLAB 676.4 1623.4 147,730 75520 5.36 42.3 30,700 PLATFORM 37.4 89.8 8,170 - - - -FOUNDATION 630 1512.0 137,590 - 0.839 6.56 4,760 STAIRS 179.8 431.5 39,270 - - - -BEAMS 145.4 349.0 31,755 22594.4 4.44 34.9 25,325 COLUMNS 114.9 275.8 25,100 8670.6 4.21 33 23,950 SHEAR WALL 126.3 303.1 27,580 2312.3 0.164 1.29 940 SUM 1910.2 4584.5 417,195 109,097.3 15.01 118 85,675
TOTAL COST 502,870
684,120 TOTAL COST WITH BLOCK WALLS

16 | P a g e
5. Design Considerations
5.1. Site
5.1.1. Site History
GCT’s property used to be a pond, which is why the elevation is so much lower
than the surrounding area. Over the course of many years, both GCT and the
property’s previous owner have tried to fill in the land with soil, in total of 2-m to
4-m deep, and they still hope to add another meter. For this reason, the soil on
their property may not be of the expected composition in that area.
5.1.2. Topography
At this time, the area several blocks around the site is low enough to flood
annually, but the site no longer acts as a pond during the rainy season. The
topography of most of Cambodia as a whole is relatively flat - to the extent that it
is possible for one of its main rivers, the Tonle Sap, to completely reverse its
direction of flow for a portion of the year.26
5.1.3. Hydrology
In Cambodia's rainy season, which generally occurs from May to October, the
Tonle Sap River reverses direction and floods the Tonle Sap Lake.6 During this
season, the area of the lake increases by almost 500%, as can be seen in Figure 4 on the next page. The city of Phnom Penh is located just outside of this
floodplain. However, parts of the neighborhood immediately around the site sti ll
flood to a depth of about 0.6-m during the rainy season. Table 14 lists the
average monthly rainfall in Cambodia.26
Table 14: Cambodian Rainfall26

17 | P a g e
5.1.4. Soil
According to the map “Soil Types of Phnom Penh” assembled by Josh Uitvlugt,
the soil in the area of the site is a Gleyi-plinthic Acrisol. This map was
constructed from the GIS file “Soil Map of the Lower Mekong Basin” published by the Mekong River Commission,41 and is shown in Figure 5. A gleyi soil is a type
of hydric soil, meaning that it has been saturated long enough to become
anaerobic, which allows it to store more organic carbon than other soils.18 An
acrisol is a soil with high content of red kaolinite clay.5 Therefore, Team 11
expects the original soil on GCT’s site to be an underconsolidated soil with high
kaolinite clay content and organic matter. This implies that loading the soil will
result in high levels of settlement.
Figure 4: Tonle Sap Floodplain39

18 | P a g e
Figure 5: Location of Building Site on Map of Soil Types of Phnom Penh, Cambodia41

19 | P a g e
The site has been filled, as described in Section 5.1.1, and the soil type of the fill
is unknown. It is unlikely that the filling was done in a controlled manner, by
compacting the soil after every 0.3 meters of soil added. If this type of
compaction was not done, significant settlement will occur over time as the fi ll
soil becomes more compacted, particularly if the fi ll soil is loaded.
Although little is known about the soi l on GCT’s site, it is expected that it will
experience significant amounts of settlement if loaded; therefore, any foundation
design will need to accommodate or limit this settlement.
5.2. Flooding & Flood Control Options
Because of the current hydrologic conditions of the site, the site regularly floods to a
depth of about 0.6-m during Cambodia’s rainy season, which occurs between the
months of May and October.26 The ground floor of the building will consist of
structural columns and serve as space for uses such as motorcycle parking or
hosting a farmers' market. This raises the elevation of the lowest finished floor so
that it will not be damaged by floodwaters during flood conditions.
This space cannot be used for car parking because of the narrow spacing between
columns. This would cause difficulty in placing traffic flows through the building, and
increase the danger of cars hitting and damaging structural components. However,
it may be used for motorcycle and bicycle parking when it is not flooded.

20 | P a g e
While the building site is in the lowest part of the surrounding area, it is possible that
a flood relief channel could be constructed to a nearby stream or pond. Construction
of this channel is not feasible until more information on local hydrology and
topography become available. A dike and pump system could be constructed to
reduce the water level in the site during flood conditions. This option would be
prohibitively expensive and implementation is not likely to occur at any time.
Because raising the first finished floor onto stilts will reduce or eliminate all flood
damage to the building and the difficulties associated with the dike and relief channel
systems, Team 11 recommends that the building be raised on stilts and no other
flood control options be implemented at this time.
5.3. Building code
Cambodia does not yet have a widely recognized standardized building code. To
ensure that the constructed building is safe, the International Building Code1 (IBC)
was used for design. Because the metric system is widely used in Cambodia, the
metric system editions of the IBC and Structural Concrete Building Code from the
American Concrete Institute4 (ACI) were used. To calculate the design loads that
would act on the building, Team 11 used the American Society of Civil Engineers
(ASCE) Minimum Design Loads for Building and Other Structures.28 These codes
provided the necessary strength for the calculated design loads to provide a
structurally sound building. The specific code editions used were ACI 318M-05,
ASCE 7-98 and ASCE 7-05, and IBC 2006.
5.4. Loading Factors
5.4.1. Wind load
Wind loads acting on the structure were calculated according to Chapter 6 of
ASCE 7. The calculations to be described below can be seen in Appendix C.
Section 6.5.10 of ASCE 7 states that the velocity pressure due to wind (qz)
evaluated at height z is found according to Equation 6-13:
𝑞𝑞𝑧𝑧 = 0.613 ∙ 𝐾𝐾𝑧𝑧 ∙ 𝐾𝐾𝑧𝑧𝑧𝑧 ∙ 𝐾𝐾𝑑𝑑 ∙ 𝑉𝑉2 ∙ 𝐼𝐼 (N/m2) (6-13)28

21 | P a g e
where Kd is the wind directionality factor defined in ASCE 7 Section 6.5.4.4, Kz is
the velocity pressure exposure coefficient defined in ASCE 7 Section 6.5.6.4, Kzt
is the topographic factor defined in ASCE 7 Section 6.5.7.2, I is the importance
factor of the building defined in ASCE 7 Section 6.5.5, and V is the basic wind
speed of the area. Wind speeds in Cambodia can be as great as 60m/s, and the
values of Kzt, Kd, and I were found to be 1.0. The value of qz is only used for the
wind load on the windward side; for the leeward and other sides of the buildings,
a value of qh, or the value of qz for z equal to the height of the building, is used.
ASCE 7 Section 6.5.12.2.1 defines the design wind pressure (p) according to
Equation 6-15:
𝑝𝑝 = 𝑞𝑞 ∙ 𝐺𝐺 ∙ 𝐶𝐶𝑝𝑝 − 𝑞𝑞𝑖𝑖(𝐺𝐺 ∙ 𝐶𝐶𝑝𝑝) (N/m2) (6-15)28
Where G is the gust factor defined in ACI Section 6.5.8, Cp is the external
pressure coefficient from ASCE 7 Figure 6-3, and qi is the positive internal
pressure. The value of qi is taken to be equal to qh. A plot of the value of the
design wind pressure for the windward bui lding side can be seen in Figure 6.
The wind loads acting on this structure were applied as point loads to the nodes
at the intersection of the beams and columns assuming that all wind force acting
on the wall would act on the node closest to where the wind met the wall. This
was accomplished by dividing each of the faces of the building by area and
multiplying by the design wind pressure acting in that area. A map of the area
cases for the 24-m side of the building can be seen in Figure 7, and a list of the
base wind loads used in the STAAD model can be seen in Table 15. According
to Figure 6-9 of ASCE 7, the wind load must be modeled using a set of ten load
combinations. In order to accomplish this in STAAD, each of the windward and leeward loads for each wall were divided in half, as can be seen in Figure 8 and
applied the appropriate factors as shown in Table 16.

22 | P a g e
Figure 6: Design Wind Pressure Acting on Exterior of Building by Elevation

23 | P a g e
Figure 7:Tributary Area Case of Each Node for the Wind Loads with Building in Side-View

24 | P a g e
Table 15: Wind Loads in Model

25 | P a g e
Figure 8: Orientation of Wind Load Mini-Cases for STAAD.Pro Model

26 | P a g e
Table 16: Wind Load Mini-Case Multiplier for STAAD Model

27 | P a g e
5.4.2. Earthquake Load
ACI code requires that buildings be constructed to withstand seismic loads in
combination with live and dead loads according to design strength loading cases
9-5 and 9-7 o f ACI Section 9.2. It was determined, however, that these loads
were applied along the same directions as and of lower magnitude than the
factored design wind loads also applied to the structure. Load cases 9-4 and 9-6
are similar to load cases 9-5 and 9-7 respectively except that 9-4 and 9-6 have a
wind load term in place of the earthquake load term. Because of this, the
building can be designed without specific application of separate earthquake
loads in the understanding that any forces or moments generated by design
earthquake loads could be handled by structural elements designed to handle
the wind loads.
Seismic design is divided up into 6 categories, A to F, with A having the lowest
amount of earthquake threat and F having the highest. Table 11.6-1 of ASCE 7
2005 shows a determination of seismic design categories A to D based on the
structure’s occupancy category and sort period response acceleration parameter
SDS. The seismic design category for this project was determined to be design
category A. This table is shown as Table 17 below.
The value of SDS is found using equation 11.4-3 of ASCE 7 Section 11.4.4, where
SMS is the design short period spectral response acceleration. The value of SDS
was found to be 0.05.
𝑆𝑆𝐷𝐷𝑆𝑆 = 23𝑆𝑆𝑀𝑀𝑆𝑆 (11.4-3)28
Table 17: ASCE 7 Table 11.6-128 Seismic Design Category Based on Short Period Response Acceleration Parameter

28 | P a g e
𝑆𝑆𝐷𝐷𝑆𝑆 = 23∙ 0.075
𝑆𝑆𝐷𝐷𝑆𝑆 = 0.05
The value of SMS is found using equation 11.4-1 of ASCE 7 Section 11.4.3,
where Fa is the design site coefficient from Table 11.4-1 of Section 11.4.3, shown
below as Table 18, and SS is the mapped short period spectral response
acceleration. The value of SMS was found to be 0.075 based on an Fa value of
2.5 and an SS value of 0.03, found using Figure D-1 of the United States
Geological Survey document “Documentation for the Southeast Asia Seismic
Hazard Maps”, shown in Appendix C.
𝑆𝑆𝑀𝑀𝑆𝑆 = 𝐹𝐹𝑎𝑎 ∙ 𝑆𝑆𝑆𝑆 (11.4-1)28
𝑆𝑆𝑀𝑀𝑆𝑆 = 2.5 ∙ 0.03
𝑆𝑆𝑀𝑀𝑆𝑆 = 0.075
The site class is determined using Table 20.3-1 in Section 20.3 of ASCE 7,
shown below as Table 19. Although specific data on the soil conditions at the
site are not available, the soil type is assumed to be a soft clay soil with the aid of the soil map in Figure 5.
Table 18: ASCE 7 Table 11.4-128 Site Coefficient, Fa

29 | P a g e
Because the site falls into design category A, it need only be designed to handle
the loads described by Equation 11.7-1 of Section 11.7.2 of ASCE 7, where Fx is
the lateral load applied at story x and wx is the portion of the total dead load D
assigned to level x.
𝐹𝐹𝑥𝑥 = 0.01𝑤𝑤𝑥𝑥 (11.7-1)28
Seismic loads were determined to be 8.93kN per column and 11.16kN per
column applied at each normal floor, acting on the 24-meter and 15-meter faces,
respectively, and 9.58kN per column and 11.97kN per column applied at the roof,
acting on the 24-meter and 15-meter faces, respectively. These loads are almost
universally two orders of magnitude less than the unfactored wind load, which
means that seismic loads can be ignored in the analysis of this structure.
5.4.3. Rainfall Load
Rainfall load is determined according to Equation 8-1 of Section 8.3 of ASCE 7.
𝑅𝑅 = 0.0098(𝑑𝑑𝑠𝑠+ 𝑑𝑑ℎ) (8-1)28
This is an empirical formula with dh representing the depth of water on the
undeflected roof above the inlet of secondary drainage system at design flow
(mm); ds represents the depth on the undeflected roof up to the inlet of the
secondary drainage system when the primary drainage system is blocked (mm);
and R is the rain load (kN/m2).
Table 19: ASCE 7 TABLE 20.3-128 SITE CLASSIFICATION

30 | P a g e
Design of the drainage system of the roof of this structure is beyond the scope of
this project, but the rain load will be 9.8 N/m2 per millimeter of rain depth spread
across the entire roof. Only load cases 9-2 and 9-3 from Section 9.2.1 of ACI
318M-05 use this load, and in both cases, the largest of the roof live load, the
snow load, and the rain load must be used. The roof live load is 4790 N/m2,
which is substantially larger than the rain load for any reasonable depth of
rainfall, so specific determination of the rain load is not necessary for this project.
5.4.4. Dead Loads
Dead load is the weight of the building and anything in the building that will not
move over the building’s lifetime. It was identical between all floors except the
roof, as shown in Table 20. More detailed dead load calculations appear in
Appendix C.
Table 20: Dead Loads

31 | P a g e
5.4.5. Live Load
Live load, the weight of people, furniture, and anything in the building that will
move over the building’s lifetime, was identical between all floors except floor 8,
shown in Table 21. More detailed live load calculations appear in Appendix C.
5.5. Materials and Building Style
5.5.1. Building Material
Concrete has been chosen as a construction material because of its relatively
low cost and high availability in Cambodia.
5.5.2. Traditional Building Styles
Traditionally, many buildings in Cambodia are built with wrap-around balconies
on every floor.7 Figure 9 below shows an example of this pattern in Phnom
Penh. However, GCT has decided not to have this feature on this building
because of concerns of thieves gaining access to higher floors by climbing up the
balconies.
Figure 9: Apartment Complex in Phnom Penh Featuring
Wrap-Around Balcony.7
Table 21: Live Loads

32 | P a g e
5.5.3. Alternate Building Materials
5.5.3.1. Wood
IBC1 Section 2308.12.1 states that wood structures of conventional light-
frame construction cannot exceed one story in height in Seismic Design
Category D or E: representing stiff soil and soft soil as defined in IBC Section
1613.5. In addition, wood is rather expensive in Cambodia, and the land is
experiencing heavy deforestation. Because of Cambodia's wet climate,
termites are a large problem facing all wood construction, and measures
would need to be taken to reduce this threat. Due to its high cost,
environmental impact, and the fact that it fails to meet structural requirements,
wood is not recommended for this design.
5.5.3.2. Steel
Structural steel allows buildings to be constructed with a lower weight than
buildings of a similar strength in concrete. However, steel is much more
expensive and not as widely available as concrete in Cambodia. In addition,
structural steel requires off-site prefabrication and shipping of completed
structural members to the site. Because of the higher cost and reduced
availability of structural steel, it is not recommended for this design.
5.5.3.3. Concrete
Structural concrete is of lower cost and is more widely available in Cambodia
than structural steel. Concrete forms are constructed on-site, meaning that
no off-site prefabrication or shipping is required. The construction of forms
requires a large amount of labor, but labor is low-cost in Cambodia. Floors
and columns constructed with concrete are extremely heavy and must be
strong enough to handle the self-weight of the structure. However, despite
the increased strength required to hold the weight, concrete construction is
still significantly less expensive than steel. Due to of the significantly lower
cost of concrete, it is the recommended material for design.
33 | P a g e
5.5.4. Deep Foundations
The soil of the site is likely to have low bearing capacity and significant settlement, as discussed in Section 5.1.4. Team 11 expects that typical shallow
footings will not provide sufficient stability for the amount of settlement that could
occur on the site. Therefore, some type of deep foundation will be necessary.
Pile foundations were initially researched as a possible foundation option.
Pile foundations transfer the loads of a structure to deeper soil that has a higher
bearing capacity. They are used in the presence of poor shallow soils with low
bearing capacity. The piles can be driven or bored into the ground and they are
usually made from wood, steel, concrete, or a combination of these materials.3
Due to costs and availability of materials in Phnom Penh, concrete piles would be
most appropriate.
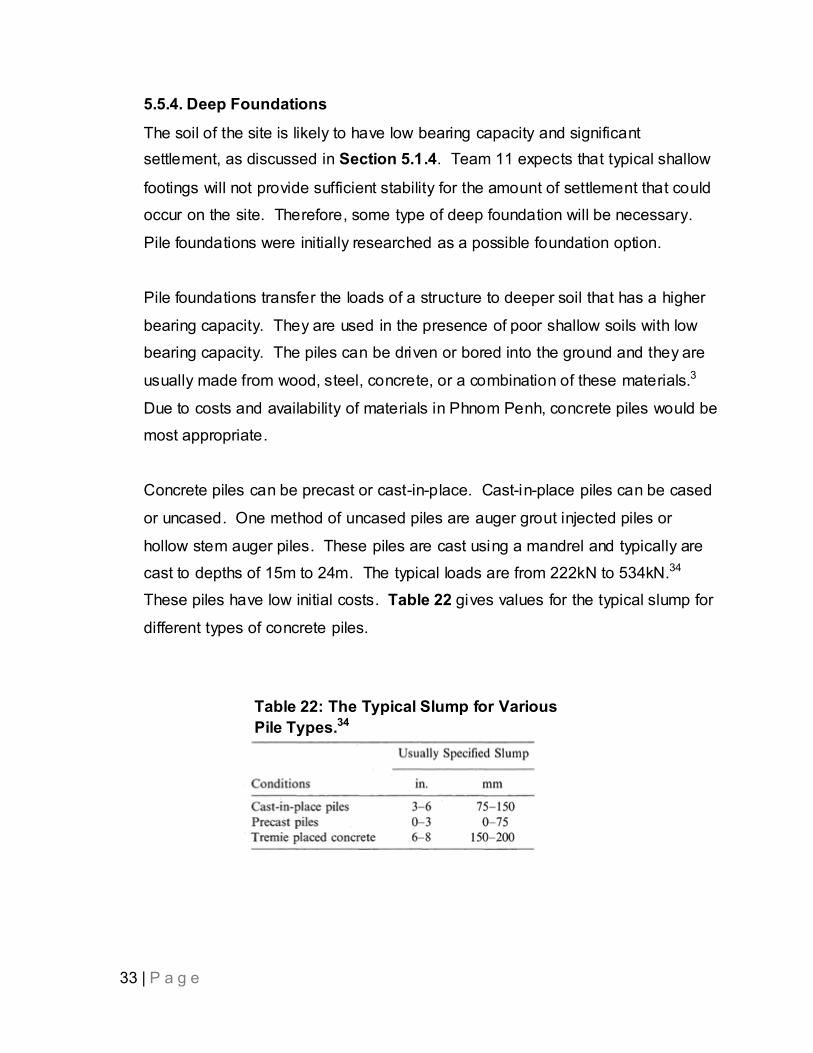
Concrete piles can be precast or cast-in-place. Cast-in-place piles can be cased
or uncased. One method of uncased piles are auger grout injected piles or
hollow stem auger piles. These piles are cast using a mandrel and typically are
cast to depths of 15m to 24m. The typical loads are from 222kN to 534kN.34
These piles have low initial costs. Table 22 gives values for the typical slump for
different types of concrete piles.
Table 22: The Typical Slump for Various Pile Types.34

34 | P a g e
The Menard pressure-meter values shown in Table 23 are good for estimating
soil conditions when experimental data is not available, and these values can be
used for preliminary design of pile foundations.34
Another type of deep foundations are caisson foundations. These are similar to
pile foundations, except that there is one large caisson beneath each column,
rather than several smaller piles. Caissons also must be bored rather than
driven. Foundation design was outside of the scope of this project, but it was
decided to do a cost-estimate design of a deep foundation, and to design it as a
caisson foundation for simplicity, and calculations are further explained in
Section 9.1. However, when GCT hires a geotechnical engineer to design the
foundation, the best option may be pile foundations or caisson foundations.
Table 23: The Typical Menard Pressure-Meter Values for Various Soil Types.34

35 | P a g e
6. Design Norms
6.1. Cultural Appropriateness
The building must use construction materials that are available in Cambodia. It must
also take into consideration the lower cost of labor in Cambodia in comparison to
building materials. GCT has requested that the outside design of the building look
traditionally Cambodian, although they want the inside to look more Western. The
design must also consider cultural expectations. For instance, since many
Cambodians ride motorcycles and bikes, parking should be available for these as
well as cars, and the number of car spaces should be modified accordingly.
Additionally, the final products, particularly the structural drawings, must also be
clear and specific enough to transcend culture and language barriers.
6.2. Stewardship
Some aspect of stewardship has guided most decisions in this project. Team 11
does want to design in a way that is responsible toward creation, particularly
because GCT is trying to raise environmental awareness. This comes into play
mainly through the recommendations for GCT’s sanitary sewage handling.
However, in most decisions, stewardship means making the best use of GCT’s
resources. GCT’s funding comes mainly from donations and grants, and while God
has graciously provided for GCT, these resources must be used wisely. The design
must take into consideration GCT’s limited land, and strive to use materials in the
most efficient way. One recommendation for efficient land use is for GCT to build
one taller building, rather than two shorter buildings. This allows more space to be
reserved for parking, which will be essential for GCT’s new business ventures to
thrive. Team 11 has also recommended a shorter building to cut down on GCT’s
foundation costs and worked hard to line up columns and plumbing from floor to
floor, avoiding the expenses of shifting columns or adding excessive connecting
pipes.

36 | P a g e
6.3. Integrity
Integrity in many ways combines the first two design norms. Similar to but more
broad than cultural appropriateness, integrity requires that the design be convenient
for users. Also similar to stewardship, the building must fit together in a harmonious
way. The rooms should be the most useful size and shape, and all the floor space
should be effectively used. Areas that people will use in conjunction should be
located close to one another. Mechanical rooms should be located in an area of the
building that can handle the extra noise, but is also easily accessible for
maintenance, and the elevator should be located in a convenient, wheelchair-
accessible area.
6.4. Trust
GCT must be able to trust this design. It must be structurally sound and dry during
seasonal flooding. The structure must be strong enough to resist all expected loads
and serve GCT reliably for many years. The design must also handle unexpected
situations, such as evacuation during a fire. Although Cambodia does not have a
required building code, Team 11 has designed the building to meet international
code. This will help to ensure that the design is trustworthy, taking advantage of the
foresight, experience, and modeling of many people over many years, rather than
only this team’s knowledge.

37 | P a g e
7. Alternative Solutions GCT wants this building to generate income for their organization. The original proposal
of a twelve-story building would be prohibitively expensive, so Team 11 looked into
alternative solutions. The first alternative Team 11 considered is a six-story building with
a larger footprint and comparable total area. This option is suboptimal because of the
limited space available to GCT. If the building were six stories, GCT would want to
have an additional building on their property, but due to space constraints, two buildings
would leave them with too little space left on the site for parking spaces. The building is
unable to house parking spaces on lower levels because the footprint is too small to fit a
parking ramp that meets IBC.1
Team 11 feels that in order for GCT’s facilities to be competitive with others in the area,
GCT needs to have more space for parking. Team 11 has chosen a second alternative:
a nine-story building with the recommendation of having only that building on this
property. This height was chosen because it was the minimum height that could fit all of
GCT’s requested components.
The ground level of the building is mostly open with columns so that the finished floors
are not damaged during the wet season when the site can flood. Because the first floor
of structural columns will be open, this area should not be used for car parking because
of the danger of cars hitting these columns and damaging the structure. Car parking will
be located away from the building and no routes of car traffic will travel under the
structure. However, when the land is dry, the space underneath the building can be
used for bicycle and motorcycle parking or GCT can use it for a farmer’s market.

38 | P a g e
8. Design
8.1. Design Modeling
8.1.1. STAAD.Pro
The system of structural design software that was used for this project was
STAAD.Pro, which stands for Structural Analysis and Design Professional, a
structural analysis and design suite by Bentley Systems, Incorporated. STAAD
enabled Team 11 to construct a 3-D representation of the structural components
and operational loads of the building and calculate the resultant moments, forces,
and displacements in the model. The model itself consists of over 10,000
individual nodes, beam members, and plates that represent all of the beams,
columns, floor slabs, and shear walls that make up the structure. Loads were
entered as sets of point loads, which act on nodes, and distributed loads, which
act along beams. ACI specifies loading factors that a structure must be designed
to withstand, resulting in a total of 105 unique combinations of loads acting on
the model. While STAAD does have capability to design steel reinforcement for
concrete members, Team 11 elected to design the reinforcement by hand,
because it allowed for more freedom and consistency in the design.

39 | P a g e
8.1.2. Model Verification
In order to check the moments calculated by STAAD.Pro, Team 11 used the
portal method of analysis to calculate rough moment values within a sample
section of the structure for a specific load case and compared these values to the
STAAD results. Most of the values were very close - within ten percent - but the
two sets of values became slightly more divergent at the lower floor where the
moments were highest. The moments that were calculated by hand were the
moments at each end of each beam span and the peak moment in the center of
the span.
The first step in calculating the moments was to establish a set of loads that act
on the structure. The load case used for this calculation set was load case
number 52, which features the dead load with a factor of 1.2, the full live load
with a factor of 1.0, the z-axis directional wind load with a factor of 1.6, and the
roof live load with a factor of 0.5. This set of forces was then used to calculate
the shear forces acting on the structure.
With all of the forces acting on the frame identified, the portal frame method was
used to calculate the moments due to horizontal forces, and a set of coefficients
was used to calculate the moments due to the vertical forces. Using the portal
frame method of analysis, a zero-moment hinge was assumed at the center of
each beam. From this assumption, free-body diagrams were drawn for each
node. These free-body diagrams list the forces acting on each beam and the
moments acting on the nodes from the horizontal forces, and are shown in Appendix C. The set of coefficients used to calculate moments due to vertical
forces were taken from an article in STRUCTURE magazine40 and ACI Section
8.3.3. These coefficients were used to determine the beam end and center span
maximum moments acting on each floor due to the uniform distributed loads
acting on the frame. Using the principle of superposition, the moments
calculated by both methods were added to produce the final checking. The
details of this calculation are shown in Appendix C.

40 | P a g e
8.1.3. Cracked Element Analysis
For structural concrete beams and columns subject to a bending moment, the
portion of the concrete that experiences a tension force due to the bending
moment may crack. These cracked sections have no effect on the structural
integrity of the building, but the presence of cracks can change the moment of
inertia of those sections and cause the bui lding to sway more in the wind.
According to Section 9.5.2.8 of ASCE 7, the maximum allowable deflection is
equal to 0.020hzx, where hzx is the height of the structure below Level x.
According to ACI Section 10.11.1, cracked sections are to be modeled by
multiplying the moment of inertia of members expected to crack by a reduction
factor: 0.35 for beams, 0.70 for columns, 0.35 for walls, and 0.25 for flat plates
and flat slabs. Although it is not expected that every member of the structure
would crack under operating conditions, the simplest way to evaluate a structure
using cracked element analysis is to first assume the worst-case scenario in
which all members are cracked. The cracked model must be refined if it fails to
meet deflection criteria. After ‘cracking’ all elements in STAAD, the maximum
horizontal deflection of nodes at a given floor were below the maximum vales
defined by the code. The model and allowable maximum deflections at each
floor can be seen in Table 24.
Table 24: Calculated and Allowable Maximum Deflection by Floor
Floor Model AllowedFloor 1 7.18 8Floor 2 11.82 14Floor 3 17.27 20Floor 4 23.53 26Floor 5 29.9 32Floor 6 36.22 38Floor 7 42.26 44Floor 8 48.21 50Roof 50.88 56
Deflection (mm)

41 | P a g e
8.1.4. Source™ Modeling
Team 11 created a 3-D interactive virtual model of this building in order to show
the final design in a more comprehensive and visual way. This was
accomplished using Valve® Software's Source™ Engine, a graphics and physics
engine used in popular modern computer games such as Portal™ and Half-Life®
2. The Source™ Engine can render near-photorealistic images in real time,
which was ideal for both generating still images and demonstrating the building
with a walk-through tour. The model was built using the Hammer World Editor, a
program created by Valve® to allow owners of Source™ games to construct their
own maps and levels. While the End User Licensing Agreement for Source™
games permits this use of Hammer and the Source™ Engine, images generated
with the Source™ Engine cannot be used by GCT to raise funds unless approval is granted by Valve®.42 A sample rendering of the building can be seen in Figure
10.
Figure 10: Rendering of Interior of Source™ Model

42 | P a g e
8.2. Beam Design
Beams within this structure are arranged along the edges of the 5m by 6m bays that
make up the structure of each floor, with eighteen beams 5m in length running
parallel to the shorter side of the building and sixteen beams 6m in length running
parallel to the longer side of the building. These beams were entered into the
STAAD.Pro model as sets of five or six beam members, each 1m in length and
connected rigidly end-to-end. Each of these beam members was identically sized at
200mm wide and 300mm deep for the first running of the STAAD model. This size
was chosen as a reasonable rough size simply to allow the STAAD model to
produce rough values for moments and forces acting within the beams. This first
iteration of the STAAD model was run with self-weight loads for members turned off.
The moments output by the first STAAD run were input into an Excel spreadsheet
that gave an approximate beam depth necessary for the beam to withstand its
maximum moment, assuming a specified beam width. This calculation was done
using the Whitney Stress Block Method assuming that the centroid of the beam was
also the neutral axis of the bending moment. The Whitney Stress Block Method is
described in ACI Section 10.2.7. An example of this method as well as the results of
the Excel spreadsheet can be seen in Appendix C.
The STAAD model was updated using these rough beam sizes, and STAAD-
calculated member self-weight was added to the dead load for all members except
the plates representing the floor slab. All loads caused by the self-weight of the floor
slab were calculated assuming a 180mm reinforced concrete slab and were already
included in the model as distributed loads along the beams. The moments output by
the second iteration of the STAAD model were put into Excel to find the maximum
absolute values of the moments within each beam.

43 | P a g e
These moments were then entered into a second, more complex Excel sheet that
calculated a more accurate beam size and flexural reinforcement based on the
Whitney Stress Block Method and tension-controlled conditions as defined in ACI
Section 10.3.4. ACI Section 10.3.4 defines a tension-controlled section as a section
in which the net tensile strain in the reinforcing steel is equal to or greater than 0.005
when the concrete in compression reaches its assumed strain limit of 0.003. A
sample of the operation of this second Excel document can be seen in Appendix C.
As additional changes were made to the STAAD model, including adding in the
designed column sizes, the beam sizes were continually updated using the method
described in the previous paragraph. After each small change, the model was
updated with adjusted beam sizes until the beam design no longer changed between
iterations.
It is important to note that, because the STAAD model is symmetrical, several wind
load cases were not included because they were directly rotationally symmetrical to
other wind loads that already existed in the STAAD model. Because of this, each
beam member was compared to its counterpart that would translate onto it if the
building were to be rotated 180 degrees at the center of the building. Both members
were designed based on the highest maximum moments felt by the two beams.
The beam design Excel document was then used to determine the necessary
reinforcement for the maximum positive and negative moments felt by each beam.
The beams were designed so that twelve configurations of size and reinforcement would be required. A list of the concrete sizes can be seen in Table 25, with a
schematic of cutoff lengths shown in Figure 11, and schematics showing the
locations of the different beam sizes are shown in Figure 12 and Figure 13.
Reinforcement in some of these beam sizes varies; these variations and their
placement are shown in the Design Drawing Set accompanying this report.

44 | P a g e
Table 25a: List of Beam Sizes and Strengths
Table 25b: List of Beam Sizes and Strengths
Table 25c: List of Beam Sizes and Strengths
BEAM TYPE
HEIGHT(mm)
WIDTH, bw
(mm)d
(mm)STIRRUP
SIZE
STIRRUP SPACING, S
(mm)
MAIN BAR SIZE
B101 400 300 340 10 167 19B102 400 300 340 10 167 19B201 500 450 440 10 215 19B202 500 450 440 10 215 19B203 500 450 440 10 215 19B301 500 450 440 10 215 19B302 500 450 440 10 215 19B401 500 450 437 13 215 19B402 500 450 437 13 215 19B403 500 450 437 13 215 19B501 560 500 497 13 240 19B502 560 500 497 13 240 19
BEAM TYPE
NUMBER OF BARS - TOP
STRENGTH REQUIRED - TOP
(kNm)
DESIGN STRENGTH -
TOP (kNm)
NUMBER OF CONTINUOUS BARS - TOP
BAR CUTOFF
LENGTH A (mm)
B101 2 50.6 68.41 2 0B102 4 112 129.7 4 2400B201 2 52 90.76 2 0B202 6 254 258.1 2 1950B203 5 197 218.0 2 1650B301 7 285 296.9 2 1550B302 7 284 296.9 2 1500B401 2 81 90.12 2 0B402 6 247 256.2 2 1750B403 5 209 216.4 2 1450B501 8 373 386.7 2 1250B502 8 367 386.7 2 1500
BEAM TYPE
NUMBER OF BARS -
BOTTOM
STRENGTH REQUIRED -
BOTTOM (kNm)
DESIGN STRENGTH -
BOTTOM (kNm)
NUMBER OF CONTINUOUS
BARS - BOTTOM
BAR CUTOFF
LENGTH B (mm)
B101 2 16.5 68.41 2 0B102 3 87 99.95 3 2400B201 2 11 90.76 2 0B202 3 101 134.4 2 1550B203 2 90 90.76 2 1250B301 4 148 176.8 2 1200B302 3 127 134.4 2 1200B401 2 10 90.12 2 0B402 4 140 175.5 2 1350B403 3 106 133.4 2 1200B501 6 254 296.4 2 1050B502 4 183 201.9 2 1150

45 | P a g e
Figure 12: Beam Size Schematic for Levels 1-8
Figure 13: Beam Size Schematic for Level 9
Figure 11: Length Guide for Table 25.

46 | P a g e
ACI Section 7.13.2 states that in order to prevent instantaneous structural collapse
in the event of catastrophic failure of concrete members, a fraction of flexural
reinforcement must run continuously through the entire length of the beam, even
where the bars are not needed to resist moments. According to ACI Sections
7.13.2.3 and 7.13.2.4, 1/6th of total negative moment reinforcement on the top of the
beam and 1/4th of total positive moment reinforcement on the bottom of the beam
must run the entire length of the beam, with a minimum of two bars in each case.
Because none of the beams in this structure have more than eight bars in any single
reinforcement layer, all of the beams will need only two bars on the top and two bars
on the bottom to meet this requirement.
According to ACI Section 12.1, reinforcement bars must extend a development
length, ld, past the relevant inflection point for that moment. That is, bars must
extend at least the length ld past the point at which the bar is no longer required to
act as tension reinforcement for that moment. The moment envelope for a beam is
the set of the highest positive and negative moments from all load cases at each
point along the length of the beam. Plots of moment envelopes for each of the
beams were made by STAAD.Pro and were used to determine the inflection points
for each beam. Figure 14 below shows the inflection points of a sample beam.
Figure 14: Method for Determining Inflection Points

47 | P a g e
See Appendix F for plots of the moment envelopes of each beam. ACI Section
12.2.2 defines ld as a function of the diameter of the bar based on the following
equations:
for bars ≤ No. 19
for bars ≥ No. 22
where Ψt represents the thickness factor, Ψe represents the reinforcement bar epoxy
coating factor, λ represents the lightweight concrete factor, and db is the bar
diameter. Because the reinforcement bars are not coated in epoxy and the beams
are not constructed out of lightweight concrete, Ψe and λ are both equal to 1.0. Ψt
equals 1.0 for normal beams, but 1.3 for beams in which the topmost layer of
reinforcement sits above 300mm or more of solid concrete.4 Bar diameter varies
from beam to beam. Using these equations, it was possible to find all relevant
values of a development length factor which could be multiplied by the bar diameter to provide the development length. Values are shown in Table 26 below:
Diagrams showing all beams with bars extended to their development lengths can
be seen in the Design Drawing Set. Shear reinforcement was designed to code. Sample calculations may be seen in Appendix C.
Table 26: Development Length Factors for Various Bar Conditions4

48 | P a g e
Several beams are placed within the shear wall and are intended to take all torsion
effects that would otherwise act on the wall. Designing these members for torsion is
beyond the scope of this project and would need to be done before this building
could be constructed. Torsional moment strength design is covered in ACI Section
11.6.3. According to ACI Section 11.6.3.8, any reinforcement required for torsion
shall be added to that required for shear, moment, and axial forces that act in
combination with the torsion.
8.3. Column Design
Column height was determined by floor-to-floor height, at 3m for each floor except
the bottom floor, which is 4m to allow for a meter of flooding without affecting the
elevator. These heights, along with a rough estimate of column cross-sectional
area, were entered into the STAAD.Pro model.
The STAAD.Pro model was run, after which the calculated axial loads were used to
roughly design the concrete cross-sectional area of several column designs, using a
safety factor of 0.65, as defined in ACI Section 9.3.2.2. The width and depth of the
column were set equal to limit the complexity of construction and design. The model
was run several times, and the area of the column was redesigned each time until
the areas became constant.
Next, three standard column designs for concrete size and reinforcement were
designed according to ACI code, accounting for the interaction of moment and axial
force and slenderness. One of these three column designs was assigned to each
column in the bui lding, as shown in Table 27.

49 | P a g e
Initially, five column sizes were used in the design of the structure. To avoid
slenderness, any column found to be slender was replaced with a column of the next
greater size, which resulted in the elimination of any column smaller than Column 1.
Maximum axial compressive force without moment was determined with the
standard ACI Equation 10.2 for tied, non-pre-stressed members:
𝑃𝑃𝑛𝑛 = 0.8 ∙ [0.85 ∙ 𝑓𝑓𝑐𝑐′�𝐴𝐴𝑔𝑔 − 𝐴𝐴𝑠𝑠𝑧𝑧 �+ 𝐴𝐴𝑠𝑠𝑧𝑧 ∙ 𝑓𝑓𝑦𝑦 ] (10.2)4
with an added safety factor of φ=0.65 for design strength, where fc ’ is the
compressive strength of concrete, Ag is the cross-sectional area of concrete, Ast is
the cross-sectional area of steel, and fy is the tensile strength of steel.
Next, to account for eccentric loading and moments, various values of axial strength
and moment resistance were calculated as the neutral axis moved through the depth
of the column. These points were plotted and connected to form a curve for each
column size.
Table 27: Column Placement: Four Cut Views Normal to X-Axis
x-coord 0 0 0 0 0 5 5 5 5 5 10 10 10 10 10 15 15 15 15 15 z-coord 0 6 12 18 22 0 6 12 18 22 0 6 12 18 22 0 6 12 18 22 Floor 8 1 1 1 1 1 1 1 1 1 1 1 1 1 1 1 1 1 1 1 1 Floor 7 1 1 1 1 1 1 1 1 1 1 1 1 1 1 1 1 1 1 1 1 Floor 6 1 1 1 1 1 1 1 1 1 1 1 1 1 1 1 1 1 1 1 1 Floor 5 1 1 1 1 1 1 2 2 2 1 1 2 2 2 1 1 1 1 1 1 Floor 2 1 1 1 1 1 1 2 2 2 1 1 2 2 2 1 1 1 1 1 1 Floor 1 1 1 2 2 1 1 2 2 2 1 1 2 2 2 1 1 2 2 1 1 Floor 2 1 1 2 2 1 1 3 3 3 1 1 3 3 3 1 1 2 2 1 1 Floor 1 1 1 2 2 1 1 3 3 3 2 2 3 3 3 1 1 2 2 1 1 Floor 0 2 2 2 2 2 2 3 3 3 2 2 3 3 3 2 2 2 2 2 2

50 | P a g e
Because of the relatively low values of moment in the columns according the
STAAD.Pro model, the minimum area of reinforcement (1% of concrete area) was initially used, though it was slightly increased as design continued (Table 28).
Cross-sectional area of steel was also checked to insure that it was great enough to
bear the tensi le axial forces calculated from STAAD.Pro.
For each column segment, the axial forces and moments from the STAAD.Pro
model for each load case were graphed alongside the column size curves to fit each
column segment to a standard column size. This can be seen in Figure 15. The
final column design dimensions appear in Table 28.
Figure 15: Moment (Mn) vs. Axial Force (Pn) Curves for Columns
-2.00E+03
0.00E+00
2.00E+03
4.00E+03
6.00E+03
8.00E+03
1.00E+04
0.0E+00 2.0E+02 4.0E+02 6.0E+02 8.0E+02 1.0E+03 1.2E+03
φPn
[N]
φMn [N-m]
Moment-Axial Force Column Diagram
Column 1 Maximum Compression
Column 1 M-P Curve
Column 2 Maximum Compression
Column 2 M-P Curve
Column 3 Maximum Compression
Column 3 M-P Curve

51 | P a g e
Finally, the new column sizes were entered into the STAAD.Pro model and the
resulting data was checked to insure that the column design was still appropriate to the axial forces and moments. See Appendix C for in-depth calculations.
Ties for the columns were determined according to ACI Section 7.10.5. The final tie design is shown in Table 29.
Table 28: Column Design Details
Table 29: Column Tie Design
Column Design
Number Width, b
[mm] Height, h
[mm] Bar Size
Number of Bars
Area of Steel [mm2]
Bar Cover [mm]
1 200 200 No. 29 8 5.2 50 2 550 550 No. 29 8 5.2 66 3 700 700 No. 29 8 5.2 71
Column Design Number
Compressive Design
Strength, φPn [kPa]
Tie Spacing
[mm] Tie
Sizes Tie
Cover [mm]
1 2996 150 No. 10 20 2 2728 250 No. 11 50 3 7007 250 No. 16 50

52 | P a g e
8.4. Slab Design
The floor slab system for this structure was designed to be a one-way system. The
floor slabs run parallel to the 15-meter wall and span 5m on center from beam to
beam. The minimum thickness of the slab based on deflection criteria is 𝑙𝑙/28 for
one-way slabs with both ends continuous, according to Table 9.5(a) of ACI Section
9.5.2.1. This gave a minimum slab thickness of 180mm. Analysis of the 180mm
thick floor slab as a 1m wide beam segment showed that this thickness of concrete
was sufficient to support the maximum factored moment (12.75kNm) when
reinforced with four No. 10 bars for a design moment of 15.2kNm, which is less than
the minimum reinforcement required by Equation 10-3 as described below.
Therefore, the floor slab design is deflection-controlled at 180mm thick, and the
reinforcement is controlled by the minimum area requirements.
Equation 10-3 of ACI Section 10.5.1 defines the minimum area of steel flexural
reinforcement for a floor slab. By assuming a beam of 1m width, a necessary steel
area per meter can be found.
𝐴𝐴𝑠𝑠,𝑚𝑚𝑖𝑖𝑛𝑛 = 0.25 ∙ �𝑓𝑓𝑐𝑐′𝑓𝑓𝑦𝑦
∙ 𝑏𝑏𝑤𝑤 ∙ 𝑑𝑑 (10-3)4
𝐴𝐴𝑠𝑠,𝑚𝑚𝑖𝑖𝑛𝑛 = 0.25 ∙ �27.5414
∙ 1000 ∙ (180− 25)
𝐴𝐴𝑠𝑠 ,𝑚𝑚𝑖𝑖𝑛𝑛 = 491.63𝑚𝑚𝑚𝑚2
Spacing of reinforcement bars in one-way slabs is governed by Equation 10-4 of ACI
Section 10.6.4, with calculated stress fs equal to 23fy, and cc representing the least
distance from surface of reinforcement steel to the tension face. The value of cc is
equal to 20mm as defined in ACI Section 7.7.1 - minimum cover for slab cast in
place not exposed to weather or in contact with ground.
𝑠𝑠 = 380�280𝑓𝑓𝑠𝑠� − 2.5𝑐𝑐𝑐𝑐 (10-4)4
𝑠𝑠 = 380 ∙ 280276
− 2.5 ∙ 20
𝑠𝑠 = 335.5𝑚𝑚𝑚𝑚

53 | P a g e
According to ACI Section 10.6.4, spacing must also be less than
𝑠𝑠 = 300 ∙ 280𝑓𝑓𝑠𝑠𝑚𝑚𝑚𝑚 = 304𝑚𝑚𝑚𝑚
This second value is less than the value from Equation 10-4, so the system is
controlled by this second value, and reinforcement must be spaced at closer than
304.4mm.
For the flexural reinforcement in the direction parallel to the slab’s span, the
minimum area requirement of 491.63mm2 may be met by eight No. 10 bars, each
with an area of 71mm2. Therefore, reinforcement of No. 10 bars every 125mm at the
top and bottom of the slab will be sufficient for flexural reinforcement. The final
flexural reinforcement is No. 10 bars every 120mm. Because this slab is intended to
operate as a one-way slab, minimum reinforcement will be sufficient in the direction
perpendicular to its span. The maximum allowable spacing from the above
calculations is 304mm, but Team 11 has decided to use a spacing of 300mm for
simplicity of construction and design.

54 | P a g e
8.5. Shear Wall Design
Shear walls were placed at opposing corners of the building, around the outside of stairwells, mechanical room, and elevator shaft, as shown in Figure 16. They
transfer shear in the floor slab diaphragms (caused by wind loads) to the foundation.
The shear walls run 5m in length on the shorter wall and 6m in length on the longer
wall. The shear walls span vertically from floor to floor, resulting in wall heights of
4m for the bottom floor and 3m for all other floors.
Using the total value of wind loads to determine necessary shear resistance, the
equation from ACI Section 11.10.3 was used to calculate the minimum shear wall
thickness: 𝑉𝑉𝑛𝑛 ≤ 0.83�𝑓𝑓𝑐𝑐 ′ℎ ∙ 𝑑𝑑 , where Vn is the factored shear force in the plane of the
wall, h is the wall thickness, and d is the wall length.
Figure 16: Location of Shear Walls

55 | P a g e
The minimum shear wall thickness for handling shear forces was found to be
0.129m and 0.060m for the east-west and north-south facing walls, respectively, but
was increased to 0.15m in both cases for ease of construction. The only exception
is the bottom floor, in which the shear wall was increased to 0.16m because of the
wall’s greater height. In accordance with ACI Section 14.5.3, the wall thickness
must equal or exceed 4% of the lesser of wall height or length, which increases the
thickness of the walls on the lowest level to 0.16m.
Columns will handle axial tension and moment in the plane of the wall. However,
the shear walls bear significant compressive axial forces. According to ACI Section
14.4, they must be designed as compression members. Shear walls in compression
may be designed empirically according to ACI Section 14.5 if the eccentricity of the
moment curling around the top of the wall is low enough that the resultant force falls
in the middle third of the wall’s thickness.
According to the STAAD.Pro model, this moment is too eccentric for the walls to be
empirically designed. Therefore, the beams within these walls wi ll be torsion-
reinforced to handle this moment, so that the walls can be empirically designed for
axial compression. See Section 8.2. Beam Design, for more information.
8.5.1. Shear Wall Reinforcement
Because the shear wall does not require reinforcement to handle the shear load,
and because all moments that would otherwise act on the shear wall are taken
up by adjacent members, the shear walls need only be designed to meet
minimum reinforcement requirements according to Section 14.3 of ACI. These
requirements are met by placing No. 10 bars in the spacing shown in Table 30.
Table 30: Spacing for Shear Wall Reinforcement

56 | P a g e
8 .6. Mechanical
8.6.1. Plumbing
Space has been left in this building to fit the plumbing; however, specific design
for plumbing is outside the scope of this project. See Appendix C for drainage
pipe details.
8.6.2. Air Conditioning
Window or wall mounted air conditioning units could be used in areas that require
air conditioning. Centralized air could also be used, but it is more expensive than
the individual air conditioning units are.
Due to the wide variety of use of the building, Team 11 recommends the use of
central air conditioning to provide a more comfortable environment for the
residents and clientele. Since the building will be built in stages, each floor shall
have its own air conditioning unit in the mechanical space on that floor. This
simplifies the ductwork since it will not need to go through the floor slabs. This
also is more efficient, since a single unit would initially need to be oversized in
anticipation for additional floors, or else the existing unit would need to be
replaced each time a floor is added.

57 | P a g e
8.7. Parking Design
A parking study was conducted to determine the minimum amount of parking that
the multi-purpose building should have. Using the “Parking Provision for New
Developments: Supplementary Planning Document,” a parking design guide from
England, Team 11 determined that there can be enough parking on GCT’s property.30 Table 31 shows the results of this investigation. This guide provides
standards for “central-areas” and “non-central-areas.” The central-areas require less
parking because things are closer together and because of the available public
transit. The non-central-areas require more parking because more people need to
drive to be to this location. Table 31 has the amount of parking required according
to this guide for both central- and non-central-areas. The parking required for
central-areas is 24-spaces.30
This initial analysis was done while condominiums were still planned as part of the
building. Although there will no longer be condominiums in the building, Team 11
believes that it is in GCT’s best interest to leave this space available for parking.
GCT has space for at least 26 car parking spaces, but there may be more parking
available that cannot be determined right now due to uncertainty with the sewage
channel. GCT’s property is in the capital of Cambodia where public transit is
available, so the site can be classified as a central-area with sufficient parking
available.

58 | P a g e
Table 31: The Results of Parking Needs Investigation Using the New Development Parking Planning Guide from England30

59 | P a g e
9. Suggestions The following are feasible options for GCT, though not part of design.
9.1. Foundation Cost Estimation
Many assumptions were made about the soil because not enough soil data was
available for foundation design. However, many assumptions were made, and a
basic caisson foundation was designed for cost estimate purposes. Table 32 and
Table 33 show the results of this design. See Appendix C for calculation details.
Assumptions Include:
• Soil is saturated, normally consolidated clay.
• Soil density = 19,600N/m3
• Friction angle = 0
• Nc = 7.5, 27
• Nq = 1, 27
• 𝑓𝑓𝑠𝑠 = 𝛼𝛼 ∙ 𝜎𝜎𝑣𝑣’
Where fs is the strength of soil for skin friction, α is a constant dealing with the
coefficient of friction between the soil and the caisson, and σv’ is the total
vertical stress at caisson midpoint.
• For concrete drilled shafts, α=0.55,36
• 𝑆𝑆𝑢𝑢 = 0.22𝜎𝜎𝑝𝑝 ’ ,44
• Where Su is undrained shear strength, and σp’ is maximum past compression.
Table 32: Caisson Placement Based on Soil Compression
Caisson Placement x\z 0 6 12 18 22 0 3 2 2 2 1 5 3 3 3 3 2
10 2 3 3 3 3 15 1 2 2 2 3

60 | P a g e
9.2. Drinking Water
9.2.1. Current Condition/Quality Needed
In Cambodia, there is no guarantee that city water pipes will not leak, allowing
infiltration of untreated groundwater and even sewage into drinking water pipes.
A high concentration of chlorine is used by the city’s water treatment plant to
combat this, but sometimes the water is still not potable. According to GCT,
about 10% of the city’s population drinks the city water without treatment, but
others use additional treatment. Therefore, GCT will require a system to reduce
chlorine content and insure that there are no pathogens in the water.
GCT uses city water for everything but drinking and washing food. Currently,
they are using the Research Development International (RDI) Ceramic Filtration
System, to treat their water.35 This is a simple filter made from clay mixed with
ground rice husks that burn away during firing, leaving tiny pores. Silver nitrate,
which kills any bacteria, coats the inside of the pot. The clay pot is set inside a
plastic container with a spout, shown in Figure 17. These filters are very
inexpensive, about $10 for a product that lasts two years. However, the flow
through one ceramic filter is only 2-L per hour. However, if GCT wanted to purify
all the water used by guests in their facility, they would need about five-hundred
of these pots. This is not feasible; therefore, it is necessary to purchase a
different system.
Table 33: Caisson Design Details
Caisson Type Number Radius
[m] Height
[m] Steel Area [mm]
Unit Cost [$]
Total Cost [$]
1 2 0.25 12.1 6.16 2275 2950 2 8 0.67 17 12.1 6615 52921 3 10 0.85 18.5 22.7 11587 115868
All 20 - 171721

61 | P a g e
Figure 17: RDI Ceramic Filtration35

62 | P a g e
9.2.2. Current/Future Water Use
GCT’s director gave the estimated current population, current water use, and
projected populations, from which the future water use was projected as shown
in Table 34. The current water use includes the water used in GCT’s office
space, as well as in the director’s residence. The projections of future water use
assume that per capita water use will be constant for the current and future
populations. For this reason, they are extremely rough, since they do not include
irrigation or pool maintenance.
9.2.3. GCT Drinking Water Possibilities/Alternatives
Extent of system:
• Filters for drinking water
• Filters for specific appliances
• Whole-building filtration system
• Water heating technology:
GCT mentioned the possibility of pumping water to a tank on the roof and
using a solar water heater. A Korean NGO in Cambodia has done this. Filtration technology alternatives are shown in Table 35.
Table 34: Future Water Use Projections.
Estimate Units
Current building
population14 Employees
20 m3/month
667 L/day
48 L/day/person
Low High Units
Projected building
population at 2 stories20 30
Employees and
guests
Projected water use at 2
stories952 1429 L/day
Projected building
population at 9 stories400 500
Employees and
guests
Projected water use at 9
stories19048 23810 L/day
Current water use

63 | P a g e
Table 35: Options for GCT’s Drinking Water Treatment.29, 31

64 | P a g e
9.3. Wastewater
9.3.1. Current/Future Water Use
It is assumed that the future wastewater production will be approximately the
same as the future drinking water use.
9.3.2. GCT Sewage Possibilities/Alternatives
• Sending waste down the current sewage stream is always an option.
• Must be a sewage system (that is, it wi ll include water and human waste)
because GCT would like to have western-style flush toilets.
• Separating human waste products makes composting more efficient, since
feces have the correct ratio of carbon to nitrogen, but urine adds too much
nitrogen.
• Composting of the feces needs to occur before use as fertilizer in order to kill
pathogens, but urine is useful as fertilizer with minimal treatment, since it is
sterile and high in nitrogen and phosphorus. Team 11 is proposing utilization
of Novaquatis NoMix Toilets for separation of urine for fertilizer and feces for
composting.29
• Composting on-site may be an option, even without separation, since
landscaping will provide carbon-rich material to balance out overly
nitrogenous human waste. Additionally, GCT can demonstrate composting
by land-applying the treated waste in the garden. GCT has expressed an
interest in composting waste.
• Aerobic vs. Anaerobic – Aerobic might work better for space constraints,
since it heats up faster, but would probably require stirring machinery – at a
greater expense. Anaerobic also produces methane (which is only beneficial
if it is captured).
• Space constraints and the high water table level rule out on-site infiltration of
liquids.
• It might also be possible to treat a fraction of the waste for composting, and
send the rest into the sewer.

65 | P a g e
• Consider using greywater from sinks for irrigation, though only if non-toxic
soaps and detergents are used.
• Find a company that will empty septic tanks and take care of the waste.
9.3.3. Sewage Trench/Trench Control Options
A pipe was constructed to transfer sewage across the site, but the neighbor on
the south side constructed a large wall directly over top of the buried pipe
resulting in the pipe being crushed. Sewage now flows along the edge of the site
in an open, unlined channel. This event took place before GCT came to own the
site. The government intended to construct a sewage pipe to replace the pipe
that was destroyed by the construction of the neighbor’s wall, but this has not
happened yet.
The sewage channel could be lined with concrete to contain the sewage and
reduce sewage exposure to ground water. This system would sti ll be vulnerable
to flooding, but a concrete cap could be added after main construction to
eliminate this problem. This, however, is outside the scope of the project. GCT
is in contact with the local authorities to have them replace the pipe as soon as
possible.
9.4. Utilities
Team 11 recommends that GCT connect to the available utilities.
9.4.1. Electricity
Connections can be made with help from Cambodian authorities.
9.4.2. City Water
Connections can be made with help from Cambodian authorities.
9.4.3. City Sanitary Sewer
Connection to sanitary sewer can be made at the open sewage trench running
along the edge of the property.
9.4.4. Gas
There are no natural gas pipelines in the area; gas tanks will need to be used.

66 | P a g e
10. Conclusion and Recommendations
10.1. Conclusion
Team 11 believes that it has established and accomplished substantial goals over
the course of this project. Through constant communication with GCT, they have
created a design that meets GCT’s needs and is much more feasible than GCT's
original suggestion. Their proposed 12-story structure next to a smaller residence
would be prohibitively expensive and would not make good use of the available land.
The 9-story structure described in this report will meet all of the usage needs that
GCT has expressed as well as providing a more reasonable cost and making better
use of the site. The set of drawings and schematics provided with this report detail
Team 11’s designs of the structural concrete beams, columns, walls, and floor slabs
that make up this structure. Because of time and manpower constraints, Team 11
decided to limit the scope of this project to the design of the building, with only
feasibility-level study on the site plan, water management, foundations, utilities, and
other topics. When this structure is built, additional design will need to be done on
each of these topics, and a licensed engineer will need to approve the structural
designs.
10.2. Recommendations for Further Design
A number of important elements that must be designed prior to construction were
outside the scope of this project. The following list is not exhaustive, but is meant as
a starting point for others who continue this work:
• Have a licensed engineer check and stamp design.
• Design torsion reinforcement in beams within shear walls, and ensure that
this will eliminate moments in shear walls.
• GCT should have the soil on their site tested, and foundations designed by a
licensed geotechnical engineer.
67 | P a g e
• Fully plan construction and excavation. The Design Drawing Set includes a
depiction of what areas would need to be excavated for the basic caisson
cost-estimate design, but once foundations are designed by a geotechnical
engineer, these plans will need to be edited. More thought must also be put
into the placement and movement of excess soil and construction equipment,
once it is determined how much excess soil and what type of equipment will
be in use. Care should be taken not to compact the soil in areas that will be
used for gardening and landscaping.
• Design construction joints if concrete in each level cannot be poured all at
once.
• Design stairs and wheelchair ramp on bottom level.
• A rubber membrane or other covering should be acquired to enable the top
floor slab to act as a roof between building projects.
• Other considerations for modular construction.
• Fire Considerations (sprinklers, structural protection): currently, the floor plans
are designed with the exits and seat spacing requirements required by fire
code.
• Decorative roof covering: the roof of the bui lding is expected to be used as a
restaurant, with a raised covering over it to protect from the elements. This
covering may be designed to evoke traditional Khmer architecture (upward
curving corners, etc.)
• Plan and design non-structural, finishing elements of building. This includes
carpet, insulation, doors, windows, etc.
• Fully design or choose pipe system, electric wiring, duct system, and elevator
(as well as emergency generator and sump pump for elevator).

68 | P a g e
Appendix A – References 1. 2006 International Building Code. International Code Counsel, 2006. Print. 2. 2009 International Plumbing Code. International Code Counsel. 4th Printing. 604.3:
604.5; 710.1. Web. 7 Apr. 2011. <http://publicecodes.citation.com/icod/ipc/2009/index.htm>
3. Abebe, Ascalew, and Dr. Ian GN. Smith. "Pile Foundation Design: A Student Guide.
"School of the Built Environment, Napier University, Edinburgh, May 1999. Web. 19 Nov. 2010. <http://www.sbe.napier.ac.uk/projects/piledesign/guide/index.htm>
4. ACI Committee 318. Bui lding Code Requirements for Structural Concrete and
Commentary –Metric (ACI 318M-05). 2005. Print. 5. "Acrisol." Encyclopedia Britannica Online. Encyclopedia Britannica, 2011. Web. 13
May. 2011. <http://www.britannica.com/EBchecked/topic/707275/Acrisol> 6. "Annual Mekong Flood Report 2006." Mekong River Commission, Mar. 2007. Web.
Nov. 2010. <www.mrcmekong.org> 7. "Architecture of Phnom Penh, The." Canby Publications Co., Ltd. Web. 2010.
<http://www.canbypublications.com/phnompenh/phnom-penh-architecture.htm> 8. "CAMBODIA COUNTRY REPORT ON FLOOD INFORMATION IN CAMBODIA."
Mekong River Commission, May 2006. Web. Nov. 2010. <http://www.mrcmekong.org/download/free_download/AFF-4/session1/Cambodia_country_report.pdf>
9. Cambodia. Europa World Plus Online. London, Routledge. Calvin College, Hekman
Library. Oct. 2010. <http://www.europaworld.com/entry?id=kh&go_country=GO> 10. "Cambodia." The World Factbook. CIA, Nov. 2010. Web. Nov. 2010.
<https://www.cia.gov/library/publications/the-world-factbook/geos/cb.html> 11. Charles, D. and D. Crocker. General Soil Map. Map. Ministry of Agriculture, 1963.
<http://eusoils.jrc.ec.europa.eu/esdb_archive/eudasm/asia/images/maps/download/kh2000_so.jpg>

69 | P a g e
12. "Disaster Risk Management Programs for Priority Counties." Country Programs for Disaster Risk Management & Climate Adaptation. Global Facility for Disaster Reduction and Recovery, 2009. Web. Nov. 2010. <http://gfdrr.org/ctrydrmnotes/Cambodia.pdf>
13. "Drainage Fixture Unit Values (DFU); Drainage Fixture Unit Loads for Sanitary
Piping."The Engineering Toolbox, 7 Apr. 2011. Web. 9 May 2011. <http://www.engineeringtoolbox.com>
14. Economy Watch: Economy, Investment, & Financial Reports. Stanley St Labs,
2009. Web. <http://www.economywatch.com/economic-statistics/country/Cambodia/>
15. Entrepreneur. Entrepreneur Media, Inc., Web. 2010.
<http://www.entrepreneur.com> 16. "French Indochina." Educational, Entertainment, and Research Material Relevant to
the Study of the Vietnam War. Dec. 2010. <http://www.vietnamwar.net/FrenchIndochina.htm>
17. Genesis Community of Transformation. Newsletter of Transformation. 2 Aug. 2010:
1-4. Print. 18. “Gley Soil.” Wikipedia. Wikipedia, 2011. Web. 13 May 2011.
<http://en.wikipedia.org/wiki/Gley_soil> 19. "Global Construction Costs." Turner and Townsend. Turner and Townsend, Sept.
2009. Web. <www.turnerandtownsend.com> 20. Google Maps. Google. Web. <maps.google.com> 21. Hazarika, Dr. M. K.; Bormudoi, A.; Kafle, T. P.; Samarkoon, Dr. L.; Noun, K.;
Savuth, Y.; and Narith, R. "FLOOD HAZARD MAPPING IN FOUR PROVINCES OF CAMBODIA UNDER THE MEKONG BASIN." Geo-Informatics Center. Asian Institute of Technology. May 2007. Web. Oct. 2010. <http://geoinfo.ait.ac.th/publications/paper_cambodia.pdf>
22. "History Data - Phnom Penh, Cambodia." Weather Underground.
<http://www.wunderground.com>

70 | P a g e
23. Invest in Cambodia. Web. Nov. 2010. <http://investincambodia.com/property.htm> 24. "Korean centre invests in closer relations." Khmer Property Magazine 2009. Web.
Nov. 2010. <http://www.khmerpropertynews.com/?inc=content.php&id=326> 25. "MCR Flood Management and Mitigation Programme Component 2: Structural
Measures and Flood Proofing." Mekong River Commission, Dec. 2009. Web. 13 Nov. 2010. <mcrmekong.org>
26. Mekong River Commission 2005. Overview of the Hydrology of the Mekong Basin.
Mekong River Commission, Vientiane, November 2005. 27. Meyerhoff, G.G., 1976, "Bearing Capacity and Settlement of Pile Foundations," J.
of Geot. Eng Div., Proc. ASCE, Vol. 102, GT3, pp. 197-227 28. Minimum Design Loads for Buildings And Other Structures (Asce Standard No. 7-
98, -05). Reston, VA: American Society of Civil Engineers, 1998, 2005. Print. 29. Novaquatis. Novaquatis, 5 Nov. 2010. Web.<http://www.novaquatis.eawag.ch> 30. "Parking Provision for New Developments: Supplementary Planning Document."
Stockton-on-Tees Borough Council, Nov. 2006. Web. Nov. 2010. <http://www.stockton.gov.uk/resources/transportstreets/48506/parkprov/parkingprov.pdf>
31. Perfect Web. Spectra Watermakers. Spectra Watermakers, 2008. Web
<http://www.spectrawatermakers.com/landbased/> 32. Petersen, Mark; Stephen Harmsen; Charels Mueller; Kathleen Haller; James
Dewey; Nicolas Luco; Anthony Crone; David Lidke; and Kenneth Rukstale. " Documentation for the Southeast Asia Seismic Hazard Maps." U.S. Geological Survey, 30 Sept. 2007. Web. 8 Mar. 2011.
<http://earthquake.usgs.gov/hazards/products/images/SEASIA_2007.pdf> 33. Phnom Penh Tower. HYUNDAI AMCO, 2010. Web. Nov. 2010. <http://office-cambodia.com/phnom-penh-tower-cambodia.html> 34. Prakash, Shamsher, and Hari D. Sharma. Pile foundations in Engineering Practice.
New York: John Wiley & Sons, Inc., 1990. Print.

71 | P a g e
35. RDI Cambodia: For a Hope and a Future. Research Development International. Web. <http://www.rdic.org/waterfiltrationsystems.htm>
36. "Reinforced Soil Structures: Training Course in Geotechnical and Foundation
Engineering: Earth Retaining Structures - Participants Manual." Federal Highway Administration, Geotechnical Engineering. US Department of Transportation, 1999. Web. 25 Apr. 2011. FHWA-NHI-99-025.
37. RS Means Assemblies. Reed Construction Data, 1992. Print. 38. Rybczynski, Witold, Chongrak Polprasert, and Michael McGarry. “Appropriate
Technology for Water Supply and Sanitation: Low-Cost Technology Options for Sanitation, a State-of-the-Art Review and Annotated Bibliography.” International Development Research Centre, Health Sciences Divisions and World Bank, 1982. Print.
39. Salidjanova, Nargiza. "ICE Case Study #218: Chinese Damming of Mekong and
Negative Repercussions for Tonle Sap." The Inventory of Conflict & Environment (ICE). American University, The School of International Service, 9 May 2007. Web. 13 Nov. 2010. <http://www1.american.edu/ted/ice/mekong-china.htm>
40. Silva, Pedro, and Sameh S. Badie. "Optimum Beam-To-Column Stiffness Ratio for
Portal Frames." STRUCTURE magazine. Mar. 2008. Web. 18 May 2011. <http://www.structuremag.org/article.aspx?articleID=560>
41. "Soil Map of the Lower Mekong Basin." Mekong River Commission, 23 Sept. 2005.
Web. <http://www.mrcmekong.org/spatial/meta_html/soil.htm#240976032> 42. "Steam Subscriber Agreement." Steampowered.com. Valve, Web. 2011.
<http://store.steampowered.com/subscriber_agreement/> 43. U.S. Department Of Labor, Bureau of Labor Statistics, Consumer Price Index <ftp://ftp.bls.gov/pub/special.requests/cpi/cpiai.txt> 44. Wotring, Donald. "ENGR 318: Soil Mechanics." Calvin College. Grand Rapids.
Spring 2011.

72 | P a g e
Appendix B – Cost Estimates
Table 36: Summary for the First Method of Total Cost Estimation.37
Table 37: Consumer Price Index.43

73 | P a g e
Table 38: Calculations of Construction Cost Indexes.19
Table 39: Purchasing Power Parity Index for Cambodia.14

74 | P a g e
Table 42 - Table 55 contain the information needed to estimate the cost of materials based on Team 11’s structural design. These tables contain the dimensions necessary to compute the weight of concrete and rebar needed and from this, the costs were estimated. The prices of materials in Phnom Penh were supplied by GCT. Steel costs $725/tonne and concrete is $91/tonne. The cost of blocks for the block walls was estimated to be $2/block.
Table 40: Cost of Concrete for Beams
BEAM LABEL
HEIGHT (mm)
HEIGHT MINUS SLAB
THICKNESS OF 180 mm
(mm)
WIDTH (mm)
AREA BELOW SLAB (mm2)
TOTAL LENGTH OF BEAM TYPE ON LEVEL (BUILDING
DIMENSION MINUS C2 AND C3, BEAMS LARGER THAN C1)
(mm)
AREA BASED ON NUMBER OF LEVELS
WITH CONFIGURATION (mm2)
VOLUME (mm3)
VOLUME (m3)
WEIGHT (tonne)
COST OF CONCRETE FOR BEAMS
LEVEL 0 1B100s 400 220 300 66000 65100 66000 4.30E+09 4.3 10.3 938 B200s 500 320 450 144000 43300 144000 6.24E+09 6.24 15.0 1,362 B300s 500 320 450 144000 42400 144000 6.11E+09 6.11 14.7 1,333
LEVEL 1, 2 2B100s 400 220 300 66000 65100 130200 8.48E+09 8.48 20.3 1,851 B200s 500 320 450 144000 48800 97600 4.76E+09 4.76 11.4 1,040 B300s 500 320 450 144000 42400 84800 3.60E+09 3.6 8.63 785
LEVEL 3-5 3B100s 400 220 300 66000 67400 198000 1.33E+10 13.3 32.0 2,915 B200s 500 320 450 144000 48800 432000 2.11E+10 21.1 50.6 4,604 B300s 500 320 450 144000 45500 432000 1.97E+10 19.7 47.2 4,293
LEVEL 6 AND 7 2B100s 400 220 300 66000 68000 132000 8.98E+09 8.98 21.5 1,960 B200s 500 320 450 144000 48800 288000 1.41E+10 14.1 33.7 3,069 B300s 500 320 450 144000 48800 288000 1.41E+10 14.1 33.7 3,069
ROOF BEAMS AND SLAB, COLUMNS FROM 8 TO 9 1B100s 400 220 300 66000 67500 66000 4.46E+09 4.46 10.7 973 B400s 500 320 450 144000 48800 144000 7.03E+09 7.03 16.9 1,535 B500s 560 380 500 190000 48800 190000 9.27E+09 9.27 22.3 2,025 SUM 1.45E+11 145.4 349.0 31,754

75 | P a g e
Table 41a: Length of Longitudnal Reinforcing Steel for Beams
Table 41b: Length of Longitudnal Reinforcing Steel for Beams
BEAM LABEL
TOTAL # TOP BARS
HOOK LENGTH (2 PER BAR)
(mm)
LENGTH OF CUT STEEL,
TOP (mm)
NUMBER OF CUT BARS,
TOP
LENGTH CONTINUOUS,
TOP (mm)
NUMBER OF CONTINUOUS,
TOP
TOTAL, TOP (mm)
NUMBER IN
BUILDING
TOTAL LENGTH OF
BARS IN BEAMS
(mm)B101 2 700 0 0 5000 2 11400 18 205,200 B102 4 700 0 0 5000 4 22800 117 2,667,600 B201 2 700 0 0 6000 2 13400 16 214,400 B202 6 700 5770 4 6000 2 39280 32 1,256,960 B203 5 700 5170 3 6000 2 31010 16 496,160 B301 7 700 4970 5 6000 2 41750 32 1,336,000 B302 7 700 4870 5 6000 2 41250 32 1,320,000 B401 2 700 0 0 6000 2 13400 2 26,800 B402 6 700 5370 4 6000 2 37680 4 150,720 B403 5 700 4970 3 6000 2 30410 2 60,820 B501 8 700 4370 3 6000 2 30710 4 122,840 B502 8 700 4870 6 6000 2 46820 4 187,280
SUM 8,044,780
BEAM LABEL
TOTAL # BOTTOM
BARS
HOOK LENGTH (2 PER BAR)
(mm)
LENGTH OF CUT STEEL,
BOTTOM (mm)
NUMBER OF CUT BARS, BOTTOM
LENGTH CONTINUOUS,
BOTTOM (mm)
NUMBER OF CONTINUOUS,
BOTTOM
TOTAL, BOTTOM
(mm)
NUMBER IN
BUILDING
TOTAL LENGTH OF
BARS IN BEAMS
(mm)B101 2 700 0 0 5000 2 11400 18 205,200 B102 3 700 0 0 5000 3 17100 117 2,000,700 B201 2 700 0 0 6000 2 13400 16 214,400 B202 3 700 4740 1 6000 2 18840 32 602,880 B203 2 700 4940 0 6000 2 13400 16 214,400 B301 4 700 5340 2 6000 2 25480 32 815,360 B302 3 700 5040 1 6000 2 19140 32 612,480 B401 2 700 0 0 6000 2 13400 2 26,800 B402 4 700 5140 2 6000 2 25080 4 100,320 B403 3 700 5040 1 6000 2 19140 2 38,280 B501 6 700 5940 4 6000 2 39960 4 159,840 B502 4 700 5140 2 6000 2 25080 4 100,320
SUM 13,135,760

76 | P a g e
Table 42: Cost of Longitudnal Reinforcing Steel for Beams
Table 43: Cost of Stirrups; The Shear Reinforcing for Beams
WEIGHT OF #19 BAR
(kg/m)
WEIGHT OF BAR (kg)
WEIGHT OF BAR
(tonne)2.235 29358.4 29.4
COST OF STEEL FOR LONGITUDNAL
REINFORCEMENT IN BEAMS21,284
TOTAL LENGTH OF BARS IN BEAMS
(m)13135.8
BEAM LABEL
STIRRUP SPACING, S
(mm)
STIRRUPS PER BEAM
NUMBER OF BEAMS IN BUILDING
BAR LENGTH
PER STIRRUP
(mm)
TOTAL LENGTH
(mm)
TOTAL LENGTH
(m)
STIRRUP BAR SIZE
WEIGHT OF BAR (kg/m)
WEIGHT (kg)
WEIGHT (tonne)
COST OF STEEL FOR
STIRRUPS IN BEAMS
B100s 167 30 135 990 4009500 4010 10 0.560 2245 2.25 1,628B200s 215 28 64 1350 2419200 2419 10 0.560 1355 1.35 982B300s 215 28 64 1350 2419200 2419 10 0.560 1355 1.35 982B400s 215 28 8 1380 309120 309 13 0.994 307 0.31 223B500s 200 25 8 1550 310000 310 13 0.994 308 0.31 223SUM 9467 5570 5.57 4,038

77 | P a g e
Table 44: Approximation of the Cost and Number of Blocks Needed For Walls
LEVELAREA (m2)
HEIGHT (m)
VOLUME OF BLOCK WALL
(m3)
APPROXIMATE NUMBER OF
BLOCKS
COST OF BLOCKS
LEVEL 0 18 4 72 4500 9,000 LEVEL 1 55.5 3 167 10438 20,875 LEVEL 2 51.6 3 155 9688 19,375 LEVEL 3 57.7 3 173 10813 21,625 LEVEL 4 64.1 3 193 12063 24,125 LEVEL 5 55.3 3 166 10375 20,750 LEVEL 6 55.3 3 166 10375 20,750 LEVEL 7 55.3 3 166 10375 20,750 LEVEL 8 60.8 3 182 11375 22,750 LEVEL 9 3.3 3 10 625 1,250
SUM 477 31 1450 90625 181,250

78 | P a g e
Table 45: Cost of Concrete for Columns
COLUMN LABEL
CROSS SECTION AREA OF COLUMN
(mm)
INITIAL LENGTH
(mm)
SLAB THICKNES OR BEAM DEPTH AT
COLUMN, WHICHEVER IS GREATER
(mm)
COLUMN HEIGHT MINUS SLAB
THICKNESS OR BEAM DEPTH
(mm)
VOLUME PER
COLUMN (mm3)
COULMNS PER LEVEL
VOLUME PER LEVEL
(mm3)
TOTAL VOLUME
(mm3)
TOTAL VOLUME
(m3)
WEIGHT (tonne)
COST OF CONCRETE
FOR COLUMNS
LEVEL 0 1C2 302,500 4000 180 3820 1.16E+09 14 1.62E+10 1.62E+10 16.2 38.8 3,533 C3 490,000 4000 180 3820 1.87E+09 6 1.12E+10 1.12E+10 11.2 27.0 2,453
LEVEL 1, 2 2C1 160,000 3000 500 2500 4.0E+08 10 4.0E+09 8.0E+09 8 19.2 1,747 C2 302,500 3000 180 2820 8.53E+08 4 3.41E+09 6.82E+09 6.82 16.38 1,490 C3 490,000 3000 180 2820 1.38E+09 6 8.29E+09 1.66E+10 16.6 39.8 3,621
LEVEL 3-5 3C1 160,000 3000 500 2500 4.0E+08 14 5.6E+09 1.68E+10 16.8 40.32 3,669 C2 302,500 3000 180 2820 8.53E+08 6 5.12E+09 1.54E+10 15.4 36.9 3,354
LEVEL 6 AND 7 2C1 160,000 3000 500 2500 4.0E+08 20 8.0E+09 1.6E+10 16 38.4 3,494
1C1 - B400 160,000 3000 500 2500 4.0E+08 10 4.0E+09 4.0E+09 4 9.60 874 C1 - B500 160,000 3000 560 2440 3.9E+08 10 3.9E+09 3.9E+09 3.90 9.37 853
SUM 1.15E+11 114.9 275.7 25,088
ROOF BEAMS AND SLAB (COLUMNS FROM LEVEL 8 TO 9)

79 | P a g e
Table 46: Cost of Longitudnal Reinforcing Steel for Columns
Table 47: Cost of Ties; The Shear Reinforcing for Columns
COLUMN HEIGHT
(mm)
NUMBER OF
COLUMNS
BARS PER COLUMN
AVERAGE LENGTH OF LAP
TO COLUMN ABOVE (mm)
LENGTH PER BAR
(mm)
TOTAL LENGTH
(mm)
TOTAL LENGTH
(m)
BAR SIZE
WEIGHT OF STEEL FOR BAR
(kg/m)
WEIGHT (kg)
TOTAL WEIGHT (tonne)
COST OF STEEL FOR LONGITUDNAL
REINFORCEMENT IN COLUMNS
4000 20 8 1130 5130 8.21E+05 820.8 29 5.060 4,153 4.15 3,011 3000 160 8 1130 4130 5 29E+06 5286 4 29 5 060 26 749 26 7 19 3933000 160 8 1130 4130 5.29E+06 5286.4 29 5.060 26,749 26.7 19,393
SUM 30.9 22,404
COLUMN LABEL
COLUMN HEIGHT
(mm)
NUMBER OF TIES PER COLUMN
LENGTH PER TIE
(mm)
TIE SIZE
NUMBER OF COLUMNS IN
BUILDING
TOTAL LENGTH
(mm)
TOTAL LENGTH
(m)
WEIGHT OF STEEL FOR TIES
(kg/m)
WEIGHT (kg)
WEIGHT (tonne)
COST OF STEEL FOR
TIES
C2 4000 10 1950 13 14 2.73E+05 273 0.994 271.4 0.271 197 C3 4000 10 2580 16 6 1 55E+05 154 8 1 552 240 2 0 240 174C3 4000 10 2580 16 6 1.55E+05 154.8 1.552 240.2 0.240 174 C1 3000 9 1350 10 122 1.48E+06 1482.3 0.560 830.1 0.830 602 C2 3000 8 1950 13 26 4.06E+05 405.6 0.994 403.2 0.403 292 C3 3000 8 2580 16 12 2.48E+05 247.68 1.552 384.4 0.384 279
SUM 2.13 1,544

80 | P a g e
Table 48: Cost of Concrete for Shear Walls
Table 49: Cost of the Steel Reinforcing for Shear Walls
SHEAR WALL LOCATION
LENGTH MINUS COLUMN WIDTH
(mm)
HEIGHT MINUS DEPTH OF BEAM
ABOVE (mm)
THICKNESS (mm)
VOLUME OF SHEAR WALLS
FOR ONE LEVEL (mm3)
VOLUME FOR NUMBER OF
LEVELS WITH CONFIGURATION
(mm3)
VOLUME FOR NUMBER OF
LEVELS WITH CONFIGURATION
(m3)
WEIGHT (tonne)
COST OF CONCRETE FOR SHEAR
WALLS
LEVEL 0 400,500 1SHEAR WALL (6m) 5375 4875 160 8.39E+09 8.39E+09 8.39 20.1 1,831 SHEAR WALL (5m) 4375 3975 160 5.57E+09 5.57E+09 5.57 13.4 1,215
LEVEL 1 AND 2 2SHEAR WALL (6m) 5375 4875 150 7.86E+09 1.57E+10 15.72 37.7 3,434 SHEAR WALL (5m) 4375 3975 150 5.22E+09 1.04E+10 10.43 25.0 2,279
LEVEL 3-9 6SHEAR WALL (6m) 5600 5100 150 8.57E+09 5.14E+10 51.41 123.4 11,228 SHEAR WALL (5m) 4600 4200 150 5.80E+09 3.48E+10 34.78 83.5 7,595
SUM 1.26E+11 126.3 303.1 27,582
WALL LOCATION
WALL LENGTH
(mm)
BAR DIRECTION
NUMBER OF
LEVELS
BAR SIZE
LENGTH (mm)
NUMBER OF BARS
LENGTH OF HOOKS
(ACCOUNTS FOR ONE ON EACH SIDE
OF BAR) (mm)
TOTAL LENGTH OF BARS
(mm)
TOTAL LENGTH OF BARS
(m)
WEIGHT OF STEEL FOR
BAR (kg/m)
WEIGHT (kg)
WEIGHT (tonne)
COST OF STEEL FOR
SHEAR WALL REINFORCE-
MENT(mm)
LEVEL 0 6000 VERTICAL 1 10 4000 16 250 6.8E+04 68 0.560 38.08 0.038 28LEVEL 0 6000 HORIZONTAL 1 10 5375 20 250 1.13E+05 112.5 0.560 63 0.063 46LEVEL 0 5000 VERTICAL 1 10 4000 13 250 5.53E+04 55.25 0.560 30.94 0.031 22LEVEL 0 5000 HORIZONTAL 1 10 4375 20 250 9.25E+04 92.5 0.560 51.8 0.052 38
LEVEL 1-8 6000 VERTICAL 8 10 3000 16 250 4.16E+05 416 0.560 232.96 0.233 169LEVEL 1-8 6000 HORIZONTAL 8 10 5375 15 250 6.75E+05 675 0.560 378 0.378 274LEVEL 1-8 5000 VERTICAL 8 10 3000 13 250 3.38E+05 338 0.560 189.28 0.189 137LEVEL 1-8 5000 HORIZONTAL 8 10 4375 15 250 5.55E+05 555 0.560 310.8 0.311 225
SUM 1.29 939

81 | P a g e
Table 50: Cost of Concrete for the Slab
Table 51: Cost of the Steel Reinforcing for the Slab
LENGTH (mm)
WIDTH (mm)
DEPTH (mm)
VOLUME PER SLAB
(mm3)
NUMBER OF SLABS
TOTAL VOLUME
(mm3)
TOTAL VOLUME
(m3)
WEIGHT (tonne) COST
24400 15400 180 6.7637E+10 10 6.764E+11 676.4 1623.4 147,729
COST OF CONCRETE FOR SLAB
24400 15400 180 6.7637E+10 10 6.764E+11 676.4 1623.4 147,729
STEEL REINFORCEMENT
FOR SLAB
BAR SIZE
BARS PER
SLAB
LENGTH PER BAR
(mm)
NUMBER OF SLABS
TOTAL LENGTH
(mm)
TOTAL LENGTH
(m)
WEIGHT OF
STEEL (kg/m)
WEIGHT (kg)
WEIGHT (tonne)
COST FOR STEEL REINFORCEMENT
OF SLAB
TOP MAIN BAR 10 204 15400 10 3.14E+07 31,416 0.560 17593 17.6 12,755BOTTOM MAIN BAR 10 204 15400 10 3.14E+07 31,416 0.560 17593 17.6 12,755TEMPERATURE BAR 10 52 24400 10 1.27E+07 12,688 0.560 7105 7.1 5,151SUM 42.3 30,661

82 | P a g e
Table 53: Cost of Concrete for the Stairs
Table 52: Cost of Concrete for the Elevator Platform
LENGTH (mm)
WIDTH (mm)
HEIGHT (mm)
VOLUME (mm3)
VOLUME (m3)
WEIGHT (tonne)
COST OF CONCRETE
6340 6000 1000 3.8E+10 38 91.2 8,299 CORNER CUTOUT: 1200 500 1000 6.0E+08 -0.6 -1.44 -131SUM 37.4 89.8 8,168
VOLUME OF CONCRETE FOR PLATFORM
STAIRSNUMBER
OF LEVELS
VOLUME PER STEP
(m3)
NUMBER OF STAIRS (BOTH STAIRWELLS)
VOLUME OF LANDING (BOTH STAIRWELLS)
(m3)
TOTAL VOLUME
(m3)
WEIGHT (tonne)
COST OF CONCRETE
LEVEL 0 1 0.559 44 1.33 25.94 62.3 5,669 OTHER LEVELS 8 0.559 32 1.33 153.82 369.2 33,597 SUM 179.8 431.5 39,267

83 | P a g e
Appendix C – Detailed Calculations
C.1. Load Calculations
C.1.1. Wind Calculations
The following calculations were performed for each height level:
Calculated by: JJU
Checked by: JACG, ALH

84 | P a g e
C.1.2. Seismic Loads
Figure 18: Figure D-1 fo USGS "Documentation for the Southeast Asia Seismic Hazard Maps"32

85 | P a g e
C.1.3. Dead Load Calculations
Dead Load calculations were based on ASCE-7. A more detailed calculation is shown in Table 56. These values were converted into kg/m using the
gravitational constant and the tributary width of the beams, then entered into
STAAD.Pro as lineal loads.
Table 54: Dead Load Calculations

86 | P a g e
C.1.4 Live Load Calculations
Live loads were based on ASCE-7 and estimated at 40psf for the residence floor
and at 100psf for all other floors. As shown in the table below, this was
converted into N/m2, and then into kg/m using the gravitational constant and the
tributary width of the beams. These values were entered into STAAD.Pro as
lineal loads.
Table 55: Live Load Calculations

87 | P a g e
C.2. Beam Design
C.2.1 Metric Concrete Excel Design Program Calculations

88 | P a g e

89 | P a g e
C.2.2. Stirrup Calculations
Calculated by: JACG, JJU
Checked by: ALH

90 | P a g e
C.2.3. Whitney Stress Block Method
The Whitney stress block method creates an approximation of the compressive
force in a section of beam under a bending moment in order to calculate the
appropriate tensile reinforcement of the beam. The compressive force is
approximated as a pressure of 0.85f’c acting the entire width of the beam
according to Figure 19.
Calculated by: JACG
Checked by: ALH

91 | P a g e
Figure 19: Whitney Stress Block Diagram
Figure 20: Beta Factor for Beams4

92 | P a g e
Where β1 is a factor dependent on f’c as seen in Figure 20 above, and c
represents the distance from the extreme compressive fiber to the centroid for
the reinforcement steel.
For safety reasons, these beams have been designed according to tension-
controlling conditions, which means that strain within the tension steel is greater
than or equal to 0.005 when the concrete reaches 0.003 in compressive strain.
The tensile strain of the steel when concrete strain reaches 0.003 is:
𝑧𝑧𝑠𝑠 = 0.003 𝑑𝑑−𝑐𝑐𝑐𝑐
.
The reinforcing ratio is:
𝜌𝜌 = 𝐴𝐴𝑠𝑠𝑏𝑏𝑑𝑑
Where As is the area of reinforcing steel and b is the width of the beam.
According to section 10.5.1 of ACI:
The minimum reinforcing ratio of steel is:
𝜌𝜌𝑚𝑚𝑖𝑖𝑛𝑛 = 𝑓𝑓 ’𝑐𝑐𝐹𝐹𝑦𝑦 ∗𝐴𝐴
,
The maximum reinforcing ratio is:
𝜌𝜌𝑚𝑚𝑎𝑎𝑥𝑥 = 0.75 ∙ 0.85 𝑓𝑓𝑐𝑐′ ∗𝛽𝛽1
𝐹𝐹𝑦𝑦∙ 600
600 +𝐹𝐹𝑠𝑠
Next, the maximum allowable moment must be calculated. The maximum design
moment of the beam is:
𝑀𝑀𝑛𝑛 = 𝐴𝐴𝑠𝑠 ∙ 𝑓𝑓𝑦𝑦 ∙ 𝑑𝑑.
If all of the above conditions are met, then the specified beam reinforcement
design is acceptable.
Figure 21 on the next page shows the initial resulting beam widths in meters
using the Whitney Stress Block Method for each floor, and Figure 22 on the
following page shows a screen shot of the more complex Excel sheet that
calculates beam size and flexural reinforcement based on ACE 10.3.4.

93 | P a g e
Figure 21: First Iteration Beam Width Calculator in Excel (m)

94 | P a g e
Figure 22: Detailed Calculator for Beam Sizes

Figure 23 to Figure 27 are the worst-case bending moment graphs for each of the beams. To design where the rebar can go in the beams, the locations of the moment inflection points need to be determined. The rebar must extend the development length of the bar past the inflection point.
Figure 23a: B101 Moment Graph
Figure 24a: B201 Moment Graph
-20
-10
0
10
20
30
40
50
60
0 1 2 3 4 5
BEN
DIN
G M
OM
ENT
(kN
m)
DISTANCE ALONG BEAM (m)
B101 BENDING MOMENT DIAGRAM
-100
-50
0
50
100
150
0 1 2 3 4 5
BEN
DIN
G M
OM
ENT
(kN
m)
DISTANCE ALONG BEAM (m)
B102 BENDING MOMENT DIAGRAM
-15
0
15
30
45
60
0 1 2 3 4 5 6
BEN
DIN
G M
OM
ENT
(kN
m)
DISTANCE ALONG BEAM (m)
B201 BENDING MOMENT DIAGRAM
-125
-100
-75
-50
-25
0
25
50
75
100
125
150
175
200
225
250
275
0 1 2 3 4 5 6
BEN
DIN
G M
OM
ENT
(kN
m)
DISTANCE ALONG BEAM (m)
B202 BENDING MOMENT DIAGRAM
95 | P a g e
Figure 23a: B101 Moment Graph
Figure 24b: B202 Moment Graph

95 | P a g e
96 | P a g e
Figure 25b: B302 Moment Graph
Figure 24c: B203 Moment Graph
Figure 26a: B401 Moment Graph
-100
-80
-60
-40
-20
0
20
40
60
80
100
120
140
160
180
200
0 1 2 3 4 5 6
BEN
DIN
G M
OM
ENT
(kN
m)
DISTANCE ALONG BEAM (m)
B203 BENDING MOMENT DIAGRAM
-150
-125
-100
-75
-50
-25
0
25
50
75
100
125
150
175
200
225
250
275
300
0 1 2 3 4 5 6
BEN
DIN
G M
OM
ENT
(kN
m)
DISTANCE ALONG BEAM (m)
B301 BENDING MOMENT DIAGRAM
-150
-125
-100
-75
-50
-25
0
25
50
75
100
125
150
175
200
225
250
275
300
0 1 2 3 4 5 6
BEN
DIN
G M
OM
ENT
(kN
m)
DISTANCE ALONG BEAM (m)
B302 BENDING MOMENT DIAGRAM
-25
0
25
50
75
100
0 1 2 3 4 5 6
BEN
DIN
G M
OM
ENT
(kN
m)
DISTANCE ALONG BEAM (m)
B401 BENDING MOMENT DIAGRAM
Figure 25a: B301 Moment Graph

97 | P a g e
Figure 26b: B402 Moment Graph
Figure 27b: B502 Moment Graph
-150
-125
-100
-75
-50
-25
0
25
50
75
100
125
150
175
200
225
250
0 1 2 3 4 5 6
BEN
DIN
G M
OM
ENT
(kN
m)
DISTANCE ALONG BEAM (m)
B402 BENDING MOMENT DIAGRAM
-125
-100
-75
-50
-25
0
25
50
75
100
125
150
175
200
225
0 1 2 3 4 5 6
BEN
DIN
G M
OM
ENT
(kN
m)
DISTANCE ALONG BEAM (m)
B403 BENDING MOMENT DIAGRAM
-300
-250
-200
-150
-100
-50
0
50
100
150
200
250
300
350
400
0 1 2 3 4 5 6BEN
DIN
G M
OM
ENT
(kN
m)
DISTANCE ALONG BEAM (m)
B501 BENDING MOMENT DIAGRAM
-200
-150
-100
-50
0
50
100
150
200
250
300
350
400
0 1 2 3 4 5 6
BEN
DIN
G M
OM
ENT
(kN
m)
DISTANCE ALONG BEAM (m)
B502 BENDING MOMENT DIAGRAM
Figure 27a: B501 Moment Graph
Figure 26c: B403 Moment Graph

98 | P a g e
C.2.4. Hand Calculations
Calculated by: JJU
Checked by: ALH, JACG

99 | P a g e
Factored moments were added to moments from free-body diagrams, shown
below, using consistent sign conventions to produce total moments in beams. Figure 28 shows the overall building cross-section that was used for the moment
hand calculations that verified the STAAD model. It has the loads and labels for the free body diagrams. Figures A1 – E9 are the free body diagrams used in the
hand calculations of the bending moments on the building.
Figure 28: Moment Hand Calculation Layout

100 | P a g e
FORCES IN kN
MOMENTS IN kNm

101 | P a g e
FORCES IN kN
MOMENTS IN kNm

102 | P a g e
FORCES IN kN
MOMENTS IN kNm

103 | P a g e
FORCES IN kN
MOMENTS IN kNm

104 | P a g e
FORCES IN kN
MOMENTS IN kNm

105 | P a g e
FORCES IN kN
MOMENTS IN kNm

106 | P a g e
FORCES IN kN
MOMENTS IN kNm

107 | P a g e
FORCES IN kN
MOMENTS IN kNm

108 | P a g e
FORCES IN kN
MOMENTS IN kNm

109 | P a g e
C.3. Column Design
The below calculations were done in an Excel spreadsheet for each column at seven
values different values of c. The geometric dimensions involved in the calculations
are depicted in Figure 29. In order to construct curves into which the factored axial
forces and moments from each column in the STAAD.Pro model must fit, the values
for design axial force were graphed verses the design moment, with a horizontal line
depicting the maximum axial load, as shown in Figure 15. Figure 30 shows a
screenshot of the above calculations in the Excel file “Exact Column Design.xlsx”:
Figure 29: Column Design Dimensions

110 | P a g e

111 | P a g e

112 | P a g e

113 | P a g e
Calculated by: ALH
Checked by: JJU

114 | P a g e

115 | P a g e
Figure 30: "Exact Column Design.xlsx" Calculations

116 | P a g e
C.3.1 Column Ties
Column ties were designed based on ACI 7.10.5.
7.10.5.1: Ties must be No. 10 or greater, with a diameter of not less than 2% of the column’s greatest dimension, as shown in Table 58.
7.10.5.2: Vertical spacing must not exceed the least of: a) the column’s least
dimension, b) 16 bar diameters, or c) 48 tie diameters, shown in Table 44.
The limiting spacing for column 1 is the least dimension, so tie spacing in column
1 shall not exceed 400mm. However, it was found that a smaller spacing worked
better in this column, so spacing for column 1 is one tie every 350mm. The
limiting spacing for columns 2 and 3 is 16 bar diameters, so tie spacing in these
columns shall not exceed 450mm.
Table 57: Calculating Tie Spacing Requirements
Table 56: Calculating Tie Bar Size Requirements
Column Least Dimension[mm]
Bar Diameter [mm]
16 Bar Diameters
Tie Diameter
[mm]
28 Tie Diameters
[mm] 1 200 28.7 259.2 10 280 2 550 28.7 259.2 11 622 3 700 28.7 259.2 16 768
Column Greatest Dimension[mm]
Minimum Tie Diameter [mm]
Minimum Bar Size
1 200 8 No. 10 2 550 11 No. 11 3 700 12 No. 16

117 | P a g e
C.4. Shear Wall Reinforcement
Because the shear wall does not require reinforcement to handle the shear load, and
because all moments that would otherwise act on the shear wall are taken up by
adjacent members, the shear walls need only be designed to meet minimum
reinforcement requirements:
ACI 14.3.2 Vertical Reinforcement
For reinforcement bars smaller than No. 16:
𝐴𝐴𝐴𝐴𝐴𝐴𝑎𝑎𝐴𝐴𝐴𝐴𝑖𝑖𝑛𝑛𝑓𝑓𝑟𝑟𝐴𝐴𝑐𝑐𝐴𝐴𝑚𝑚𝐴𝐴𝑛𝑛𝑧𝑧 ≥ 0.0012 ∗ 𝐴𝐴𝐴𝐴𝐴𝐴𝑎𝑎𝑐𝑐𝑟𝑟𝑛𝑛𝑐𝑐𝐴𝐴𝐴𝐴𝑧𝑧𝐴𝐴
𝐴𝐴𝐴𝐴𝐴𝐴𝑎𝑎𝑁𝑁𝑟𝑟 .10 𝑏𝑏𝑎𝑎𝐴𝐴 = 71𝑚𝑚𝑚𝑚2
For a 1-meter unit width at the bottom floor (wall thickness = 160mm):
𝐴𝐴𝐴𝐴𝐴𝐴𝑎𝑎𝐴𝐴𝐴𝐴𝑖𝑖𝑛𝑛𝑓𝑓𝑟𝑟𝐴𝐴𝑐𝑐𝐴𝐴𝑚𝑚𝐴𝐴𝑛𝑛𝑧𝑧 ≥ 0.0012 ∗ 160𝑚𝑚𝑚𝑚 ∗ 1000𝑚𝑚𝑚𝑚 = 192𝑚𝑚𝑚𝑚2
𝑆𝑆𝑝𝑝𝑎𝑎𝑐𝑐𝑖𝑖𝑛𝑛𝑔𝑔 𝑟𝑟𝑓𝑓 𝑁𝑁𝑟𝑟.10 𝑏𝑏𝑎𝑎𝐴𝐴 ≤ 360𝑚𝑚𝑚𝑚
For a 1-meter unit width at all other floors (wall thickness = 150mm):
𝐴𝐴𝐴𝐴𝐴𝐴𝑎𝑎𝐴𝐴𝐴𝐴𝑖𝑖𝑛𝑛𝑓𝑓𝑟𝑟𝐴𝐴𝑐𝑐𝐴𝐴𝑚𝑚𝐴𝐴𝑛𝑛𝑧𝑧 ≥ 0.0012 ∗ 150𝑚𝑚𝑚𝑚 ∗ 1000𝑚𝑚𝑚𝑚 = 180𝑚𝑚𝑚𝑚2
𝑆𝑆𝑝𝑝𝑎𝑎𝑐𝑐𝑖𝑖𝑛𝑛𝑔𝑔 𝑟𝑟𝑓𝑓 𝑁𝑁𝑟𝑟.10 𝑏𝑏𝑎𝑎𝐴𝐴 ≤ 390𝑚𝑚𝑚𝑚
ACI 14.3.3 Horizontal Reinforcement
𝐴𝐴𝐴𝐴𝐴𝐴𝑎𝑎𝐴𝐴𝐴𝐴𝑖𝑖𝑛𝑛𝑓𝑓𝑟𝑟𝐴𝐴𝑐𝑐𝐴𝐴𝑚𝑚𝐴𝐴𝑛𝑛𝑧𝑧 ≥ 0.0020 ∗ 𝐴𝐴𝐴𝐴𝐴𝐴𝑎𝑎𝑐𝑐𝑟𝑟𝑛𝑛𝑐𝑐𝐴𝐴𝐴𝐴𝑧𝑧𝐴𝐴
𝐴𝐴𝐴𝐴𝐴𝐴𝑎𝑎𝑁𝑁𝑟𝑟 .10 𝑏𝑏𝑎𝑎𝐴𝐴 = 71𝑚𝑚𝑚𝑚2
For a 1-meter unit height at the bottom floor (wall thickness = 160mm):
𝐴𝐴𝐴𝐴𝐴𝐴𝑎𝑎𝐴𝐴𝐴𝐴𝑖𝑖𝑛𝑛𝑓𝑓𝑟𝑟𝐴𝐴𝑐𝑐𝐴𝐴𝑚𝑚𝐴𝐴𝑛𝑛𝑧𝑧 ≥ 0.0012 ∗ 160𝑚𝑚𝑚𝑚 ∗ 1000𝑚𝑚𝑚𝑚 = 320𝑚𝑚𝑚𝑚2
𝑆𝑆𝑝𝑝𝑎𝑎𝑐𝑐𝑖𝑖𝑛𝑛𝑔𝑔 𝑟𝑟𝑓𝑓 𝑁𝑁𝑟𝑟.10 𝑏𝑏𝑎𝑎𝐴𝐴 ≤ 220𝑚𝑚𝑚𝑚
For a 1-meter unit height at all other floors (wall thickness = 150mm):
𝐴𝐴𝐴𝐴𝐴𝐴𝑎𝑎𝐴𝐴𝐴𝐴𝑖𝑖𝑛𝑛𝑓𝑓𝑟𝑟𝐴𝐴𝑐𝑐𝐴𝐴𝑚𝑚𝐴𝐴𝑛𝑛𝑧𝑧 ≥ 0.0012 ∗ 150𝑚𝑚𝑚𝑚 ∗ 1000𝑚𝑚𝑚𝑚 = 300𝑚𝑚𝑚𝑚2
𝑆𝑆𝑝𝑝𝑎𝑎𝑐𝑐𝑖𝑖𝑛𝑛𝑔𝑔 𝑟𝑟𝑓𝑓 𝑁𝑁𝑟𝑟.10 𝑏𝑏𝑎𝑎𝐴𝐴 ≤ 235𝑚𝑚𝑚𝑚

118 | P a g e
ACI 14.3.5 Maximum Spacing
𝑆𝑆𝑝𝑝𝑎𝑎𝑐𝑐𝑖𝑖𝑛𝑛𝑔𝑔 ≤ 450𝑚𝑚𝑚𝑚
or
𝑆𝑆𝑝𝑝𝑎𝑎𝑐𝑐𝑖𝑖𝑛𝑛𝑔𝑔 ≤ 3 ∗ 𝑧𝑧ℎ𝑖𝑖𝑐𝑐𝑖𝑖𝑛𝑛𝐴𝐴𝑠𝑠𝑠𝑠 (= 460𝑚𝑚𝑚𝑚 𝑓𝑓𝑟𝑟𝐴𝐴 𝑏𝑏𝑟𝑟𝑧𝑧𝑧𝑧𝑟𝑟𝑚𝑚 𝑓𝑓𝑙𝑙𝑟𝑟𝑟𝑟𝐴𝐴 𝑎𝑎𝑛𝑛𝑑𝑑 450𝑚𝑚𝑚𝑚 𝑓𝑓𝑟𝑟𝐴𝐴 𝑟𝑟𝑧𝑧ℎ𝐴𝐴𝐴𝐴 𝑓𝑓𝑙𝑙𝑟𝑟𝑟𝑟𝐴𝐴𝑠𝑠),
whichever is higher.
Therefore, the vertical spacing of 360mm and 390mm and the horizontal spacing of
220mm and 235mm for the bottom and other floors, respectively is acceptable.
Calculated by: JJU
Checked by: ALH

119 | P a g e
C.5. Water Usage Estimates
Table 58: Total Fixtures For Building, By Level
LEVEL FIXTURE TYPE QUANTITYLEVEL 0
SERVICE OR MOP BASIN 1
LEVEL 1TOILET 5URINAL 2BATHROOM SINK (LAVATORY) 7SHOWER 7DRINKING FOUNTAIN 2SERVICE OR MOP BASIN 1
LEVEL 2KITCHEN SINK 2TOILET 4URINAL 2BATHROOM SINK (LAVATORY) 4SHOWER 0DRINKING FOUNTAIN 2SERVICE OR MOP BASIN 1
LEVEL 3TOILET 4URINAL 2BATHROOM SINK (LAVATORY) 4DRINKING FOUNTAIN 2SERVICE OR MOP BASIN 1
LEVEL 4TOILET 9TOILET 9SHOWER 9BATHROOM SINK (LAVATORY) 9DRINKING FOUNTAIN 0BAR SINK 1SERVICE OR MOP BASIN 1
LEVEL 5, 6, AND 7TOILET 6BATHROOM SINK (LAVATORY) 6KITCHEN SINK 3DRINKING FOUNTAIN 6SERVICE OR MOP BASIN 3
LEVEL 8TOILET 3SHOWER 2BATHROOM SINK (LAVATORY) 5KITCHEN SINK 1DISHWASHER, DOMESTIC 1CLOTHES WASHER 1SERVICE OR MOP BASIN 1

120 | P a g e
Table 59a: Drainage Pipe Size Required for All Fixtures on Stack 1
LEVEL FIXTURE QUANTITYDRAINAGE
FIXTURE UNIT VALUES
TOTAL DFU
MINIMUM PIPE SIZE BASED ON TOTAL
DFU FOR HORIZONTAL
FIXTURE BRANCHFIXTURE BRANCH LEVEL 0
LEVEL 1 80mmTOILET 1 4 4URINAL 2 2 4URINAL 2 2 4BATHROOM SINK (LAVATORY) 3 1 3SHOWER 3 2 6DRINKING FOUNTAIN 0 0.5 0
17LEVEL 2 100mmLEVEL 2 100mm
KITCHEN SINK 2 2 4TOILET 4 4 16URINAL 2 2 4BATHROOM SINK (LAVATORY) 4 1 4SHOWER 0 2 0SHOWER 0 2 0DRINKING FOUNTAIN 2 0.5 1
29LEVEL 3 100mm
TOILET 4 4 16URINAL 2 2 4URINAL 2 2 4BATHROOM SINK (LAVATORY) 4 1 4DRINKING FOUNTAIN 2 0.5 1
25

121 | P a g e
LEVEL FIXTURE QUANTITYDRAINAGE
FIXTURE UNIT VALUES
TOTAL DFU
MINIMUM PIPE SIZE BASED ON TOTAL
DFU FOR HORIZONTAL
FIXTURE BRANCHFIXTURE BRANCH LEVEL 4 100mm
TOILET 4 4 16SHOWER 4 2 8BATHROOM SINK (LAVATORY) 4 1 4DRINKING FOUNTAIN 0 0 5 0DRINKING FOUNTAIN 0 0.5 0BAR SINK 1 1 1
29LEVEL 5, 6, AND 7 40mm
TOILET 0 4 0BATHROOM SINK (LAVATORY) 0 1 0BATHROOM SINK (LAVATORY) 0 1 0KITCHEN SINK 0 2 0DRINKING FOUNTAIN 2 0.5 1
1LEVEL 8 80mm
TOILET 1 4 4TOILET 1 4 4SHOWER 0 2 0BATHROOM SINK (LAVATORY) 1 1 1KITCHEN SINK 1 2 2DISHWASHER, DOMESTIC 1 2 2CLOTHES WASHER 1 3 3CLOTHES WASHER 1 3 3
12
Table 59b: Drainage Pipe Size Required for All Fixtures on Stack 1

122 | P a g e
LEVEL FIXTURE QUANTITYDRAINAGE
FIXTURE UNIT VALUES
TOTAL DFU
MINIMUM PIPE SIZE BASED ON TOTAL
DFU FOR HORIZONTAL
FIXTURE BRANCHFIXTURE BRANCH
115LEVEL 0 - LEVEL 4 100mmLEVEL 5 - LEVEL 8 80mm
TOTAL DFU OF STACK 1:
STACK SIZE CHOSEN BASED ON LARGEST SIZE REQUIRED BY A GIVEN LEVEL AND ALL THE LEVELS ABOVE IT BECAUSE STACK SIZE MAY NOT DECREASE AS GOING DOWN, IT MAY ONLY INCREASE.
Table 59c: Drainage Pipe Size Required for All Fixtures on Stack 1

123 | P a g e
Table 60a: Drainage Pipe Size Required for All Fixtures on Stack 2
LEVEL FIXTURE QUANTITYDRAINAGE
FIXTURE UNIT VALUES
TOTAL DFU
MINIMUM PIPE SIZE BASED ON TOTAL
DFU FOR HORIZONTAL
FIXTURE BRANCHFIXTURE BRANCH LEVEL 0 50mm
SERVICE OR MOP BASIN 1 3 33
LEVEL 1 100mmTOILET 4 4 16TOILET 4 4 16URINAL 0 2 0BATHROOM SINK (LAVATORY) 4 1 4SHOWER 4 2 8DRINKING FOUNTAIN 2 0.5 1SERVICE OR MOP BASIN 1 3 3SERVICE OR MOP BASIN 1 3 3
29LEVEL 2 40mm
KITCHEN SINK 0 2 0TOILET 0 4 0URINAL 0 2 0URINAL 0 2 0BATHROOM SINK (LAVATORY) 0 1 0SHOWER 0 2 0DRINKING FOUNTAIN 0 0.5 0SERVICE OR MOP BASIN 1 3 3
33LEVEL 3 40mm
TOILET 0 4 0URINAL 0 2 0BATHROOM SINK (LAVATORY) 0 1 0DRINKING FOUNTAIN 0 0 5 0DRINKING FOUNTAIN 0 0.5 0SERVICE OR MOP BASIN 1 3 3
3

124 | P a g e
LEVEL FIXTURE QUANTITYDRAINAGE
FIXTURE UNIT VALUES
TOTAL DFU
MINIMUM PIPE SIZE BASED ON TOTAL
DFU FOR HORIZONTAL
FIXTURE BRANCHFIXTURE BRANCH LEVEL 4 100mm
TOILET 5 4 20SHOWER 5 2 10BATHROOM SINK (LAVATORY) 5 1 5DRINKING FOUNTAIN 0 0 5 0DRINKING FOUNTAIN 0 0.5 0BAR SINK 0 1 0SERVICE OR MOP BASIN 1 3 3
38LEVEL 5, 6, AND 7 80mm
TOILET 2 4 8TOILET 2 4 8BATHROOM SINK (LAVATORY) 2 1 2KITCHEN SINK 1 2 2DRINKING FOUNTAIN 0 0.5 0SERVICE OR MOP BASIN 1 3 3
1515LEVEL 8 80mm
TOILET 2 4 8SHOWER 2 2 4BATHROOM SINK (LAVATORY) 4 1 4KITCHEN SINK 0 2 0KITCHEN SINK 0 2 0DISHWASHER, DOMESTIC 0 2 0CLOTHES WASHER 0 3 0SERVICE OR MOP BASIN 1 3 3
19
Table 60b: Drainage Pipe Size Required for All Fixtures on Stack 2

125 | P a g e
LEVEL FIXTURE QUANTITY
DRAINAGE FIXTURE UNIT
VALUES
TOTAL DFU
MINIMUM PIPE SIZE BASED ON TOTAL
DFU FOR HORIZONTAL
FIXTURE BRANCHFIXTURE BRANCH
140LEVEL 0 - LEVEL 4 100mmLEVEL 5 - LEVEL 8 80mm
TOTAL DFU OF STACK 2:
STACK SIZE CHOSEN BASED ON LARGEST SIZE REQUIRED BY A GIVEN LEVEL AND ALL THE LEVELS ABOVE IT BECAUSE STACK SIZE MAY NOT DECREASE AS GOING DOWN, IT MAY ONLY INCREASE.
Table 60c: Drainage Pipe Size Required for All Fixtures on Stack 2

126 | P a g e
C.6. Caisson Foundation Cost-Estimate Calculations
Below is an example calculation for Caisson Design 1. Calculations were done in Excel; a screenshot of this document is shown in Figure 31.

127 | P a g e

128 | P a g e
Calculated by: ALH
Checked by: JJU

129 | P a g e

130 | P a g e
Figure 31: Calculations from Excel Document "Foundation Design for Cost Estimate Only.xlsx"