final report 060611 logofix - port of tacoma area... · tideflats area transportation study final...
TRANSCRIPT

Prepared by:
1001 - 4th AvenueSuite 4120
Seattle, WA 98154206-576-4220
Teamed With:
June 2011
Prepared for:
Port of Tacoma
Washington State Department of Transportation
Freight Mobility Strategic Investment Board
City of Fife
City of Tacoma
Marine View Ventures (an entity of the Puyallup Tribe of Indians)
Pierce County
SSA Marine

Tideflats Area Transportation Study Final Report June 2011
i
TABLE OF CONTENTS Executive Summary .............................................................................................................................................................................. 1
Existing and Future Conditions Analysis ................................................................................................................................................... 1 Improvement Concepts ............................................................................................................................................................................ 2 Recommended Projects ............................................................................................................................................................................ 2
1. Introduction .................................................................................................................................................................................. 5 Overview ................................................................................................................................................................................................... 5 Purpose & Need ........................................................................................................................................................................................ 5 Goals & Objectives .................................................................................................................................................................................... 5 Stakeholder Outreach ............................................................................................................................................................................... 5 Operational Context ................................................................................................................................................................................. 6 Study Area ................................................................................................................................................................................................. 6
2. Existing Conditions ........................................................................................................................................................................ 8 Opportunities & Constraints ..................................................................................................................................................................... 8 Roadway Operations ................................................................................................................................................................................. 8 Freight Conditions ................................................................................................................................................................................... 12 Safety Conditions .................................................................................................................................................................................... 12 Non‐Motorized Conditions ..................................................................................................................................................................... 13
3. Future Conditions ........................................................................................................................................................................ 16 Travel Forecasts ...................................................................................................................................................................................... 16 SR 167 Extension and Other Baseline Projects ....................................................................................................................................... 17 Traffic Operations ................................................................................................................................................................................... 24
4. Alternatives Development & Analysis ......................................................................................................................................... 25 Evaluation Criteria .................................................................................................................................................................................. 25
5. Findings & Recommendations ..................................................................................................................................................... 27 Recommendations .................................................................................................................................................................................. 27 Performance Summary ........................................................................................................................................................................... 27 Transportation Analysis .......................................................................................................................................................................... 34 Cost Estimates ......................................................................................................................................................................................... 35 Funding Sources ...................................................................................................................................................................................... 35
6. Project Sequencing ...................................................................................................................................................................... 37 Sequencing Rationale ............................................................................................................................................................................. 39
Tideflats Area Transportation Study Final Report June 2011
ii
APPENDICES
Appendix A: Stakeholder Outreach Appendix B: Background Information Appendix C: Existing Conditions Technical Memorandum Appendix D: Existing Traffic, Transportation & Collision Data Appendix E: Methods & Assumptions for Transportation Analysis Technical Memorandum Appendix F: Travel Forecasts & Analysis Appendix G: Evaluation Results Appendix H: Conceptual Engineering & Cost Estimates Appendix I: Sequencing of Projects and 2020 Evaluation Appendix J: Miscellaneous
Note: Due to the large size, appendices are available on a CD.

Tideflats Area Transportation Study Final Report June 2011
iii
LIST OF FIGURES Figure 1. Study Area and Analysis Locations ..................................................................................................................................................... 7 Figure 2. Average Daily Traffic Volumes ......................................................................................................................................................... 10 Figure 3. Existing Roadway Operations .......................................................................................................................................................... 11 Figure 4. Existing Truck Routes ....................................................................................................................................................................... 14 Figure 5. Existing Rail Facilities & Grade Crossings ......................................................................................................................................... 15 Figure 6. Baseline Network Assumptions ....................................................................................................................................................... 19 Figure 7. Household Growth (2006‐2030) ...................................................................................................................................................... 20 Figure 8. Employment Growth (2006‐2030) ................................................................................................................................................... 21 Figure 9. PM Peak Hour Traffic Growth (2006‐2030) ..................................................................................................................................... 22 Figure 10. PM Peak Hour Truck Growth (2006‐2030) ..................................................................................................................................... 23 Figure 11. Level of Service Comparison: Existing and 2030 Baseline Roadway Operations ........................................................................... 24 Figure 12. Recommended Projects Tideflats Area Access .............................................................................................................................. 30 Figure 13. Recommended Projects Port Access ............................................................................................................................................. 31 Figure 14. Recommended Projects Industrial Access ..................................................................................................................................... 32 Figure 15. Recommended Projects Local Access ............................................................................................................................................ 33 Figure 16. Level of Service Comparison: Existing, 2030 Baseline and Recommended Plan Roadway Operations ........................................ 34 Figure 17. Project Definition Areas ................................................................................................................................................................. 38
LIST OF TABLES Table 1. Levels of Service Criteria for Signalized and Unsignalized Intersections ............................................................................................ 8 Table 2. Baseline Network Assumptions ......................................................................................................................................................... 18 Table 3. First Level Screening Criteria ............................................................................................................................................................. 25 Table 4. Second Level Evaluation Criteria ....................................................................................................................................................... 26 Table 5. User Groups ....................................................................................................................................................................................... 26 Table 6. Recommended Projects .................................................................................................................................................................... 28

Tideflats Area Transportation Study Final Report June 2011
1
Acknowledgements
EXECUTIVE SUMMARY The Tacoma Tideflats, the heart of the area’s industrial activity, also serves a diverse set of stakeholders and transportation modes. This convergence provides a unique opportunity for stakeholders to come together to produce a coordinated plan to help enhance the economic competitiveness of the area and increase mobility and accessibility by reducing traffic congestion. The Tideflats Area Transportation Study (TATS) is the result, providing a recommended package of transportation improvements to better serve truck freight traffic in the area.
The study covers the Port of Tacoma, Downtown Tacoma, the City of Fife, as well as portions of unincorporated Pierce County and Puyallup Indian Reservation. The study area contains the region’s largest north‐south highway, Interstate 5, which often is congested, as well as the port area’s high percentage of truck and train traffic. The TATS process included significant agency and stakeholder coordination with those listed, as well as terminal operators, trucking companies and others.
The study identifies multiple improvement projects that will be necessary to sustain growth over the next 20 years. Past traffic modeling indicates a need for at least Phase 1 of SR 167 from its current end in Puyallup to SR 509 at the Port of Tacoma, or the entire area will be highly congested by 2030 regardless of what other projects are completed. This study builds upon that work to identify additional improvements to
alleviate current conditions temporarily, then augment the completed SR 167 for further traffic improvement.
EXISTING AND FUTURE CONDITIONS ANALYSIS
The study began by evaluating the existing conditions of the transportation network during the afternoon peak period. This evaluation included all modes of transportation, including passenger vehicles, freight trucks, rail, transit, bicycle and pedestrians. It assessed freeway operations during the peak afternoon period and identified key truck routes between the Port and industrial centers.
Micro‐simulation was performed for much of the study area. This detailed analysis provides the basis for the projected operations described in this report as well as the list of Recommended Projects. Additional details may be found in the appendices of this report.
Traffic “hot spots” occur at numerous entry points to the Port, including Portland Avenue, Port of Tacoma Road and 54th Avenue E. During certain points of the day, queues form as trucks wait to enter the Port. In the southern part of the study area, the Meridian Avenue/SR 161 corridor is congested. Southbound I‐5 experiences congestion because of a bottleneck between I‐705 and SR 16, with queues back to Portland Avenue and onto the I‐705 ramps, as well as between 54th Avenue E and Port of Tacoma Road.

Tideflats Area Transportation Study Final Report June 2011
2
Following the existing conditions analysis, the project team forecasted traffic growth in 2030 for both passenger cars and freight trucks. The Baseline scenario included only those transportation improvements likely to be implemented by 2030 and/or necessary to prevent severe traffic congestion. These improvements include the Port of Tacoma Road interchange and completing at least Phase 1 of SR 167.
The Baseline assessment showed that future transportation operations will be poor, even with the Port of Tacoma Road Interchange and at least Phase 1 of SR 167 completed, without additional infrastructure investments. The number of intersections in the study operating at unacceptable levels of service increased from six under current conditions to 33 in the Baseline scenario. Although the reconfigured Port of Tacoma Road interchange would operate fairly well, the other main routes to the Port (Portland Avenue, Milwaukee Way and 54th Avenue E) would be severely congested. Operations along Pacific Avenue in downtown Tacoma would also deteriorate substantially.
IMPROVEMENT CONCEPTS
To lessen expected congestion throughout the study area by 2030, the project team developed improvement concepts, solicited ideas from stakeholders, and consulted various jurisdictions’ capital and transportation improvement programs. The result was a list of 85 candidate projects in addition to the Baseline projects already assumed to be in place by 2030.
The project team then conducted a two‐step evaluation process to determine which projects would provide the most benefit to the TATS area. The first level screened out projects that did not respond directly to the purpose and need of the study or had some other “fatal flaw.” Roughly one‐third of the non‐Baseline concepts were dismissed at this stage of the evaluation.
The remaining projects warranted more rigorous analysis using the micro‐simulation model. The project team tested various combinations of the improvement concepts and presented a preliminary plan to the TATS Advisory Committee. Using the Committee’s input, the plan was revised slightly to form the final Recommended Project, consisting of 38 projects.
RECOMMENDED PROJECTS
It bears repeating that the Baseline projects are considered essential to avoid traffic system failure by 2030. The Recommended Projects, in addition to the Baseline projects, would result in much better traffic operations. The number of intersections operating unacceptably would drop by 38 percent. The biggest improvements would occur near the Port with decreased delays along the key Port access corridors of Portland Avenue, Milwaukee Way, Port of Tacoma Road and 54th Avenue East. More moderate improvement would be seen in Downtown Tacoma, Fife and the Meridian Avenue/SR 161 corridor.

Tideflats Area Transportation Study Final Report June 2011
3
During the afternoon peak period, the overall vehicle hours of delay would decrease 38 percent over conditions with only the Baseline, and the number of highly congested intersections would be reduced from 33 to 10. Overall greenhouse gas emissions would decrease 2 percent.
Throughout the screening process, the projects were categorized according to the user group they most benefit: Tideflats area, port, industrial, or local access. Several significant projects under each category are highlighted here; the full list and maps showing each project’s location are presented in the report.
Tideflats Area Access
− Extend Canyon Road from Pioneer Way across the Puyallup River to 70th Avenue E.
− Rebuild I‐5 interchange at 54th Avenue E.
− Complete the Port of Tacoma Road interchange upgrade at I‐5.
Port Access
− On Port of Tacoma Road, add a truck lane southbound to I‐5 and a truck queuing lane for access to the Port.
− Construct slip ramps on SR 509 at D Street.
− At the Milwaukee Way and Marshall Street intersection, add a signal, railroad flashers, and gates with a traffic signal intertie.
− Extend the A/D rail line east to Taylor Way to remove train blockages of Milwaukee Way and E 11th Street.
Industrial Access
− Build overcrossings of I‐5 at Frank Albert Road and 62nd Avenue E between 20th Street E and Pacific Highway E.
− Upgrade intersections along Portland Avenue between SR 509 and I‐5.
− Implement an arterial Intelligent Transportation System to guide travelers to and from industrial sites and coordinate signals.
− Widen intersections of 54th Avenue E at Pacific Highway E and 20th Street E.
− Upgrade 12th Street E between 62nd Avenue E and 34th Avenue E.
− Upgrade 20th Street E between Port of Tacoma Road and 63rd Avenue E.
Local Access
− Construct a grade separation at the 54th Avenue E Union Pacific railroad crossing to re‐open the street.
− Make intersection improvements along Pacific Avenue in downtown Tacoma.
− Widen 20th Street E to three lanes between 70th Avenue E and Freeman Road.

Tideflats Area Transportation Study Final Report June 2011
4
Cost Estimates by User Group Tideflats Area Access: $140‐150M Port Access: $5‐10M
Industrial Access: $110‐130M
Local Access: $35‐45M
Cost Estimate
The cost of the improvements included in the list of Recommended Projects is $290‐335 million, as shown in the breakdown by user group at right. This does not include any baseline projects, which are essential to achieve the LOS benefits of the Recommended Projects.
Baseline projects, (not including additional HOV capacity on I‐5 or the SR 167 extension) total $485‐540 million. Funding for some baseline projects has already been secured. In total, $196 million has been committed to baseline projects, leaving a need of $579‐679 million.

Tideflats Area Transportation Study Final Report June 2011
5
Stakeholder interview summaries, Executive Committee meeting minutes and agendas may be found in Appendix A.
1. INTRODUCTION The Tideflats Area Transportation Study (TATS) examines the multimodal transportation network within an area including the Port of Tacoma, Downtown Tacoma, the City of Fife, Puyallup Tribal Lands and Pierce County. Complex transportation needs are present within the area due to the diversity of uses.
OVERVIEW
The study began by gathering input from stakeholders. Traffic and other data were collected and analyzed to assess the existing conditions. Future travel demand was projected for not only personal vehicles, but also the trucks which comprise a substantial amount of Tideflats area traffic. Micro‐simulation of the roadway network was used to analyze existing and future conditions. This detailed analysis provides the basis for the expected future operations described in this report. Finally, improvement options were evaluated to determine which projects are most likely to alleviate the transportation problems within the study area. Again, micro‐simulation was used to assess the benefit of proposed improvements. The culmination of this process is a set of improvement concepts called the Recommended Projects.
PURPOSE & NEED
The purpose of the study is to create a comprehensive plan that will enhance the economic benefits of the
Tideflats area, improve the traffic circulation, and reduce congestion. This plan should coordinate between all involved jurisdictions and entities to support existing improvement programs.
GOALS & OBJECTIVES
The goals and objectives for this project are:
Identify future transportation needs for the growth of freight related truck traffic to and from the Tideflats area
Increase mobility and accessibility by reducing traffic congestion
Promote regional economic competitiveness
Develop and execute a coordinated transportation plan
STAKEHOLDER OUTREACH
A key component of TATS was stakeholder outreach. The project team met individually with stakeholders to ascertain each group’s unique needs and opinions. Meetings were conducted with representatives from the Port of Tacoma, City of Tacoma, City of Fife, Washington Department of Transportation, Marine View Ventures (an entity of the Puyallup Tribe), SSA Marine, trucking companies, terminal operators, Union Pacific Railroad, and Tacoma Rail. Detailed interview summaries are included in Appendix A.

Tideflats Area Transportation Study Final Report June 2011
6
Background information including previous transportation studies and planned transportation improvements may be found in Appendix B.
In addition to the individual meetings, an Executive Committee was formed. The Committee met periodically throughout the TATS process to review findings of the project team and provide guidance on future steps. The Executive Committee had representatives from the following entities:
Washington Department of Transportation
Freight Mobility Strategic Investment Board
City of Fife
City of Tacoma
Marine View Ventures (an entity of the Puyallup Tribe)
Pierce County
Port of Tacoma
SSA Marine
Appendix A includes Executive Committee meeting minutes and agendas. A larger Advisory Committee included additional stakeholders such as Union Pacific Railroad, Burlington Northern Santa Fe, and Premier Transport.
OPERATIONAL CONTEXT
The Port of Tacoma covers 2,400 acres and is used for shipping terminal activity as well as warehousing, distributing, and manufacturing. The Port, the seventh largest in North America, handles more than $36 billion in annual trade and is surrounded by
Downtown Tacoma to the west, the City of Fife to the south. The high volume and variety of land uses within the area leads to a complex transportation system with competing needs. This study was undertaken to identify existing problems, forecast future travel needs, and set out a clear plan for future improvements.
STUDY AREA
The study area, shown in Figure 1, includes the Port of Tacoma, Downtown Tacoma, as well as parts of the City of Fife, Puyallup Tribal Lands, and unincorporated Pierce County. Figure 1 also displays the study intersections used for analysis.

!(
!(!(
!(
!(
!(
!(!(
!(
!(!(
!(!(
!(!(!(!(!(
!(!(!(
!(!( !(
!(!(
!(!(
!(!(
!(!( !(
!(!(!(
!(
!(
!(
!(
!(
!(!(
!(!(
!(
!(
!(!(
!(!(
!(
!(
!(
!(
!(
!(
!(
!(!(
!(
!(
!(
Taylor Way
EAlexander Ave
EP
ortlandA
ve
54th
Ave
E
70th
Ave
E
Marine ViewDr
Port of Tacoma
Rd
Linco
lnAve
Puyallup Ave
Marshall Ave
Industry Dr E
62nd
Ave
E
N Levee Rd E
River Rd E
E11
thSt
Paci
ficH
wy
S
Pacific Hwy E
20th St E
Fre
eman
Rd
E
52nd St E
Wal
ler
Rd
E
Pioneer Way E
Pac
ific
Ave
Me r
idia
nA
veE
W Stewart Ave
36th St E
S 356th St
ED
St
S t u d y A r e aS t u d y A r e a
509
509
99
§̈¦5
§̈¦5
167
§̈¦705
§̈¦5
16
167
7
B.N.S.F.
B.N.S.F.
B.N.S.F.
STUDY AREA AND ANALYSIS LOCATIONSTideflats Area Transportation Study
FIGURE 1
U.P.R.R.
B.N.S.F.
U.P.R.R.
Tacoma Rail
Tacoma Rail
Tacoma Rail
U.P.R.R.
U.P.R.R.
\\FPSE2\Data2\2010Projects\SE10-0190_Tideflats Area Transportation Study\Graphics\Draft\GIS\MXD\8x11\studyInts.mxd
161
N
NOT TO SCALE
LEGEND
!( Existing Intersection
!( Future Intersection
Micro-Simulation Network
A/D Tracks
Tacoma Rail

Tideflats Area Transportation Study Final Report June 2011
8
2. EXISTING CONDITIONS The existing conditions within the study area were assessed to provide a complete picture of current transportation operations, opportunities, and constraints. Truck volumes tend to peak in the early morning when the Port opens; however overall traffic volumes are highest during the PM peak period. Therefore, analysis was completed for the PM peak period when the transportation network is most congested. The Existing Conditions Technical Memorandum, which presents the transportation analysis in detail, may be found in Appendix C.
OPPORTUNITIES & CONSTRAINTS
The complex nature of the Tideflats area results in a variety of transportation opportunities and constraints that influence the need for improvements. These issues include bottlenecks with heavy congestion, interaction between rail and roads, bridge conditions, baseline projects that are currently underway or are anticipated to be implemented in the immediate term, and plans for roadway extensions, interchange improvements, and transit routes.
ROADWAY OPERATIONS
Figure 2 displays average daily traffic volumes on roadways within the study area which shows the current distribution of traffic. Intersection operations throughout the study area were analyzed to identify locations that require improvements. Each
intersection is assigned a level of service, ranging from A to F, based on the average delay experienced per vehicle. Table 1 displays the criteria for each level of service as well as a brief qualitative description.
Intersection Operations
Figure 3 shows existing traffic “hot spots” within the study area. The Port of Tacoma Road and 54th Avenue E corridors experience congestion, due in large part to the high truck volumes and close spacing of the intersections. These corridors provide critical access to I‐5 as well as destinations to the south. Other problematic operations occur along the Portland Avenue corridor between the SR 509 and I‐5 interchanges.
The Meridian Avenue/SR 161 corridor between Valley Avenue and River Road experiences congestion. Each
Table 1. Levels of Service Criteria for Signalized and Unsignalized Intersections
Level of Service
Delay per Vehicle (seconds) Description
Signalized Intersection Unsignalized Intersection
A 0‐10 0‐10 Little or no delay
B >10‐20 >10‐15 Short delays
C >20‐35 >15‐25 Average delays
D >35‐55 >25‐35 Long delays
E >55‐80 >35‐50 Very long delays
F >80 >50 Failure – extreme congestion
Source: Highway Capacity Manual 2000.

Tideflats Area Transportation Study Final Report June 2011
9
Additional information on the existing conditions analysis may be found in Appendices C and D.
of the five intersections along that stretch of Meridian Avenue show substantial peak hour congestion.
Excessive queues tend to form within the Port at the following locations:
Westbound E 15th Street and part of East ‘D’ Street
Northbound Port of Tacoma Road between Marshall Avenue and E 11th Street
Eastbound Lincoln Avenue at APM terminal entrance
Northbound Taylor Way at MacMillan‐Piper entrance in the early morning.
Freeway Operations
The study area includes several major freeways that serve both local and regional access. A bottleneck on southbound I‐5 between I‐705 and SR 16 causes congestion along I‐5 as well as queues stretching to Portland Avenue and on the ramps to I‐705. Another problematic stretch of southbound I‐5 occurs between 54th Avenue E and Port of Tacoma Road where high volumes converge from both the on‐ramp and the mainline.
SR 509 currently operates well, and I‐705 operates efficiently with the exception of moderate congestion near the 9th Street on‐ramp.

Taylor Way
EAlexander Ave
EP
ortlandA
ve
54th
Ave
E
70th
Ave
E
Marine ViewDr
Port of Tacoma
Rd
Linco
lnAve
Puyallup Ave
Marshall Ave
Industry Dr E
62nd
Ave
E
N Levee Rd E
River Rd E
E11
thSt
Paci
ficH
wy
S
Pacific Hwy E
20th St E
Fre
eman
Rd
E
52nd St E
Wal
ler
Rd
E
Pioneer Way E
Pac
ific
Ave
Me r
idia
nA
veE
W Stewart Ave
36th St E
S 356th St
ED
St
24.5
6.0
27.7
6.7
4.6
3.8
11.9
16.6
8.4
22.9
7.5
1.2
2 9.3
12.8
47.6
4.0
30.4
9.3
2.3
6.3
19.6
3.0
6.27.1
4.0
24.1
4.9
10.1
183.2
37.7
12.6
23.3
16.4
185.7
211.0
165.5
160.0 16.7
31.1
11.0
1.7
0.7
11.1
7.9
5.0
8.5
11.7
27.0
19.7
9.8
14.0
8.63.
2
13.8
13.4
12.3
11.3
38.3
18.4
12.8
4.9
6.7
7.9
13.3
12.2
1 .1
S t u d y A r e aS t u d y A r e a
509
99
§̈¦5
§̈¦5
167
§̈¦705
§̈¦5
16
7
509
167
B.N.S.F.
B.N.S.F.
B.N.S.F.
\\FPSE2\Data2\2010Projects\SE10-0190_Tideflats Area Transportation Study\Graphics\Draft\GIS\MXD\8x11\fig02_ADTtubeCounts.mxd
AVERAGE DAILY TRAFFIC VOLUMESTideflats Area Transportation Study
FIGURE 2
U.P.R.R.
B.N.S.F.
U.P.R.R.
Tacoma Rail
Tacoma Rail
Tacoma Rail
U.P.R.R.
U.P.R.R.
161
N
NOT TO SCALE
Traffic Volume (x 1,000)18.8
LEGEND
Average Traffic Volume
0 - 10,000
10,000 - 20,000
20,000 - 30,000
> 30,000
Note: Volumes are for illustrative purposes; someare Average Weekday Daily Traffic andothers are Annual Average Daily Traffic.
Tacoma Rail

!
Taylor Way
EAlexander Ave
EP
ortlandA
ve
54th
Ave
E
70th
Ave
E
Marine ViewDr
Port of Tacoma
Rd
Linco
lnAve
Puyallup Ave
Marshall Ave
Industry Dr E
62nd
Ave
E
N Levee Rd E
River Rd E
E11
thSt
Paci
ficH
wy
S
Pacific Hwy E
20th St E
Fre
eman
Rd
E
52nd St E
Wal
ler
Rd
E
Pioneer Way E
Pac
ific
Ave
Me r
idia
nA
veE
W Stewart Ave
36th St E
S 356th St
ED
St
S t u d y A r e aS t u d y A r e a
509
99
§̈¦5
§̈¦5
167
§̈¦705
§̈¦5
16
509
167
7
B.N.S.F.
B.N.S.F.
B.N.S.F.161
EXISTING TRAFFIC "HOT SPOTS"Tideflats Area Transportation Study
FIGURE 3
U.P.R.R.
B.N.S.F.
U.P.R.R.
Tacoma Rail
Tacoma Rail
Tacoma Rail
U.P.R.R.
U.P.R.R.
\\FPSE2\Data2\2010Projects\SE10-0190_Tideflats Area Transportation Study\Graphics\Draft\GIS\MXD\8x11\fig03_hotSpots.mxd
LEGEND
Roadway Congestion
Intersection Hot Spots
N
NOT TO SCALE
0
10
20
30
40
A-C D E F
Num
ber o
f Int
erse
c�on
s
Exis�ng Levels of Service
Tacoma Rail

Tideflats Area Transportation Study Final Report June 2011
12
FREIGHT CONDITIONS
The presence of the Port creates substantial freight activity (both trucks and rail) with unique operations and a key relationship to the economic vitality of the region.
Trucks
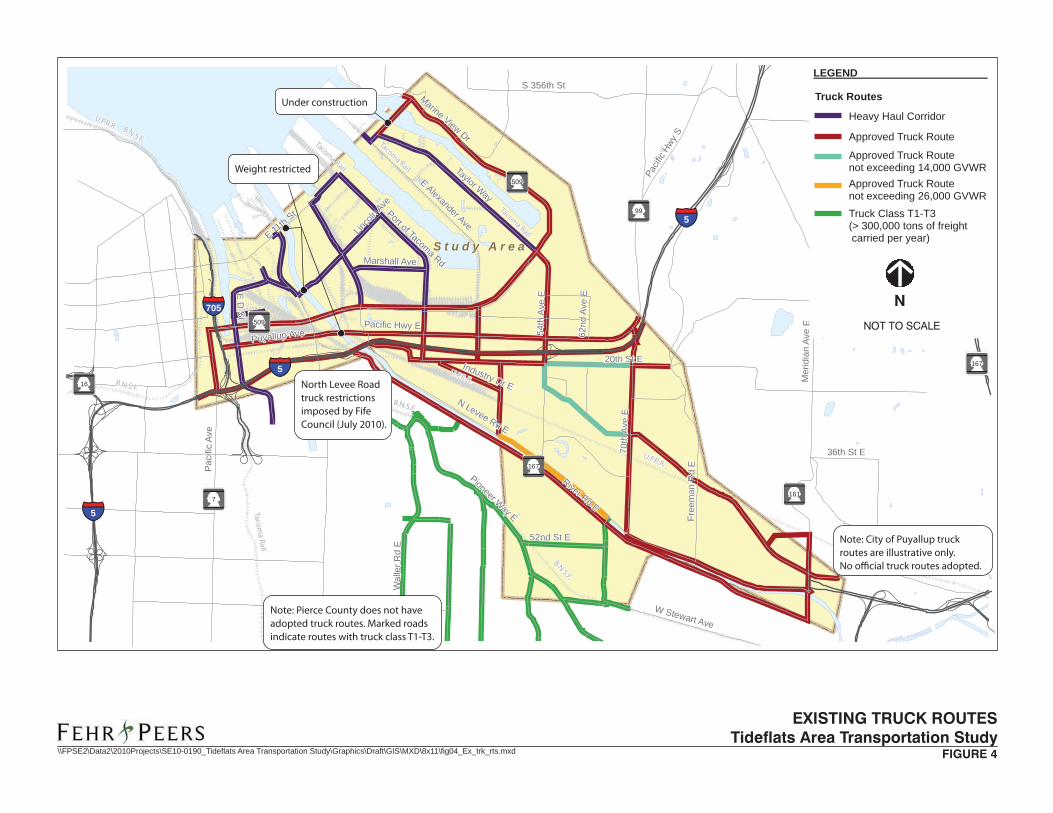
Trucks rely heavily on Portland Avenue, Port of Tacoma Road, and 54th Avenue E to access the shipping terminals within the Port. Much of the truck traffic is traveling between the Port and warehousing and distribution centers located in Kent Valley, Fife/Puyallup/Sumner, Tacoma, Frederickson, Dupont, Lacey/Olympia, and Centralia/Chehalis.
Figure 4 summarizes truck routes within the TATS study area. Most of the principal and minor arterials in the study area are approved truck routes, and are heavily used by Port‐related traffic. Truck traffic into and out of the Port of Tacoma is sustained throughout the day with trucks arriving before the terminals open at 8 AM, causing queues within the Tideflats area, mainly within the Port.
Rail
Figure 5 displays the rail facilities and grade crossings located within the study area. Burlington Northern Santa Fe (BNSF) and Union Pacific Railroad (UPRR) are the only long‐haul carriers for shipments originating from the Port of Tacoma, with BNSF
carrying the larger share. Tacoma Rail serves locally by switching containers from cargo ships to local businesses and assembling the long‐haul trains that are pulled by BNSF and UPRR. Figure 5 also shows the location of the major terminals within the Port.
Fourteen of the grade crossings were assessed in terms of level of activity, efficiency of operations, and safety. Crossings that are candidates for grade separation due to the constraints they impose on the transportation network include:
70th Avenue E
54th Avenue E
Port of Tacoma Road at Lincoln Avenue
Port of Tacoma Road southeast of Lincoln Avenue
Port of Tacoma Road crossing to KPAC
Milwaukee Way north of Lincoln Avenue
E 11th Street east of Milwaukee Way
Taylor Way at former Kaiser site
SAFETY CONDITIONS
Collision data from 2006 to 2008 were analyzed along freeways as well as local corridors to identify locations of concern. Source data are included in Appendix D.

Tideflats Area Transportation Study Final Report June 2011
13
Freeway Collisions
The predominant type of collision on I‐5, I‐705 and SR 509 were rear end collisions. The majority of collisions on each freeway caused property damage only. Over the three‐year study period, multiple fatalities have occurred on I‐5, one fatality has occurred on SR 509, and no fatalities have occurred on I‐705.
Local Corridors and Intersections
The highest corridor collision rates within the study area occurred on Pacific Highway E between Milwaukee Way and 54th Avenue E and on 54th Avenue E between 4th Street E and Valley Avenue E. High congestion levels contribute to the safety concerns. The highest intersection collision rates occurred along Portland Avenue and Bay Street in the vicinity of the I‐5 interchange.
NON‐MOTORIZED CONDITIONS
An inventory of pedestrian and bicycle facilities was completed to identify gaps in the network. Due to the industrial nature of much of the study area, non‐motorized facilities are limited, creating a challenging environment for pedestrians and bicyclists.
Taylor Way
EAlexander Ave
EP
ortlandA
ve
54th
Ave
E
70th
Ave
E
Marine ViewDr
Port of Tacoma
Rd
Linco
lnAve
Puyallup Ave
Marshall Ave
Industry Dr E
62nd
Ave
E
N Levee Rd E
River Rd E
E11
thSt
Paci
ficH
wy
S
Pacific Hwy E
20th St E
Fre
eman
Rd
E
52nd St E
Wal
ler
Rd
E
Pioneer Way E
Pac
ific
Ave
Me r
idia
nA
veE
W Stewart Ave
36th St E
S 356th St
ED
St
S t u d y A r e aS t u d y A r e a
509
99
§̈¦5
§̈¦5
167
§̈¦705
§̈¦5
16
509
167
7
B.N.S.F.
B.N.S.F.
B.N.S.F.161
EXISTING TRUCK ROUTESTideflats Area Transportation Study
FIGURE 4
U.P.R.R.
B.N.S.F.
U.P.R.R.
Tacoma Rail
Tacoma Rail
Tacoma Rail
U.P.R.R.
U.P.R.R.
\\FPSE2\Data2\2010Projects\SE10-0190_Tideflats Area Transportation Study\Graphics\Draft\GIS\MXD\8x11\fig04_Ex_trk_rts.mxd
N
NOT TO SCALE
LEGEND
Truck Routes
Heavy Haul Corridor
Approved Truck Route
Approved Truck Routenot exceeding 14,000 GVWR
Approved Truck Routenot exceeding 26,000 GVWR
Truck Class T1-T3(> 300,000 tons of freight carried per year)
North Levee Roadtruck restrictions imposed by Fife Council (July 2010).
Note: Pierce County does not haveadopted truck routes. Marked roadsindicate routes with truck class T1-T3.
Note: City of Puyallup truckroutes are illustrative only.
Under construction
Weight restricted
Tacoma Rail

¬
»
¬
»
¬
»
¬
»
¬
»
¬
»
¬
»
¬
»
¬
»
¬
»
¬
»
¬
»
¬
»
¬
»
¬
»
¬
»
¬
»
¬
»
Taylor Way
EAlexander Ave
EP
ortlandA
ve
54th
Ave
E
70th
Ave
E
Marine ViewDr
Port of Tacoma
Rd
Linco
lnAve
Puyallup Ave
Marshall Ave
Industry Dr E
62nd
Ave
E
N Levee Rd E
River Rd E
E11
thSt
Paci
ficH
wy
S
Pacific Hwy E
20th St E
Fre
eman
Rd
E
52nd St E
Wal
ler
Rd
E
Pioneer Way E
Pac
ific
Ave
Me r
idia
nA
veE
W Stewart Ave
36th St E
S 356th St
ED
St
S t u d y A r e aS t u d y A r e a
509
99
§̈¦5
§̈¦5
167
§̈¦705
§̈¦5
16
509
167
7
B.N.S.F.
B.N.S.F.
EXISTING RAIL FACILITIES AND GRADE CROSSINGSTideflats Area Transportation Study
FIGURE 5
U.P.R.R.
B.N.S.F.
U.P.R.R.
Tacoma Rail
Tacoma Rail
Tacoma Rail
Tacoma Rail
Mountain D
ivision
U.P.R.R.
U.P.R.R.
\\FPSE2\Data2\2010Projects\SE10-0190_Tideflats Area Transportation Study\Graphics\Draft\GIS\MXD\8x11\fig07_Ex_Rail.mxd
B.N.S.F.
161
N
NOT TO SCALE
Tacoma Rail
Union Pacific R.R.
Burlington Northern Santa Fe R.R.
Tacoma Rail Mountain Division
Marshall Avenue Auto Facility
Blair Terminal
EB1
Husky Terminal & Stevedoring
Pierce County Terminal
Totem Ocean Trailer Express Terminal
Washington United Terminals
APM Terminals
Olympic Container Terminal
LEGEND
¬
»
Grade Crossing
Tideflats Area Transportation Study Final Report June 2011
16
Additional information on the travel forecasts and analysis of future traffic conditions may be found in Appendices E and F.
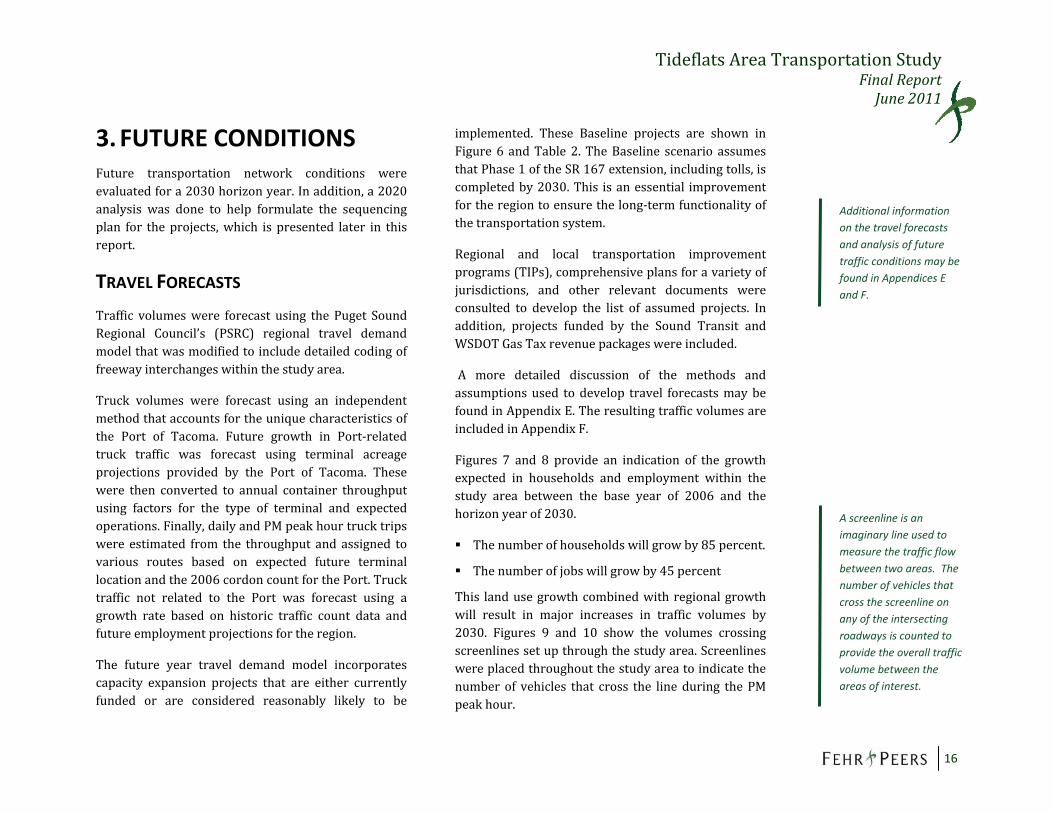
A screenline is an imaginary line used to measure the traffic flow between two areas. The number of vehicles that cross the screenline on any of the intersecting roadways is counted to provide the overall traffic volume between the areas of interest.
3. FUTURE CONDITIONS Future transportation network conditions were evaluated for a 2030 horizon year. In addition, a 2020 analysis was done to help formulate the sequencing plan for the projects, which is presented later in this report.
TRAVEL FORECASTS
Traffic volumes were forecast using the Puget Sound Regional Council’s (PSRC) regional travel demand model that was modified to include detailed coding of freeway interchanges within the study area.
Truck volumes were forecast using an independent method that accounts for the unique characteristics of the Port of Tacoma. Future growth in Port‐related truck traffic was forecast using terminal acreage projections provided by the Port of Tacoma. These were then converted to annual container throughput using factors for the type of terminal and expected operations. Finally, daily and PM peak hour truck trips were estimated from the throughput and assigned to various routes based on expected future terminal location and the 2006 cordon count for the Port. Truck traffic not related to the Port was forecast using a growth rate based on historic traffic count data and future employment projections for the region.
The future year travel demand model incorporates capacity expansion projects that are either currently funded or are considered reasonably likely to be
implemented. These Baseline projects are shown in Figure 6 and Table 2. The Baseline scenario assumes that Phase 1 of the SR 167 extension, including tolls, is completed by 2030. This is an essential improvement for the region to ensure the long‐term functionality of the transportation system.
Regional and local transportation improvement programs (TIPs), comprehensive plans for a variety of jurisdictions, and other relevant documents were consulted to develop the list of assumed projects. In addition, projects funded by the Sound Transit and WSDOT Gas Tax revenue packages were included.
A more detailed discussion of the methods and assumptions used to develop travel forecasts may be found in Appendix E. The resulting traffic volumes are included in Appendix F.
Figures 7 and 8 provide an indication of the growth expected in households and employment within the study area between the base year of 2006 and the horizon year of 2030.
The number of households will grow by 85 percent.
The number of jobs will grow by 45 percent
This land use growth combined with regional growth will result in major increases in traffic volumes by 2030. Figures 9 and 10 show the volumes crossing screenlines set up through the study area. Screenlines were placed throughout the study area to indicate the number of vehicles that cross the line during the PM peak hour.

Tideflats Area Transportation Study Final Report June 2011
17
PM peak hour truck traffic will increase by 120 percent
PM peak hour traffic will increase by 35 percent
Overall, the highest growth occurs within Fife, the Port, and approaching downtown Tacoma to and from the east. Between 2006 and 2030, nearly 5,000 more vehicles will travel on I‐5. As expected, the highest truck volume growth occurs near the Port, with more moderate increases in outlying areas.
The growth expected by 2030 will put a substantial strain on the already congested roadway network. Truck traffic, much of which is related to the Port, is expected to more than double between 2006 and 2030. These projections highlight the need for infrastructure investment within the study area.
SR 167 EXTENSION AND OTHER
BASELINE PROJECTS
The baseline projects assumed to be completed by 2030 are presented in Table 2 and shown in Figure 6. Total cost, as well as any committed funding, is also shown.
Although SR 167 is grouped with other baseline projects, its importance outweighs that of the smaller improvements. The SR 167 extension is a fundamental system improvement upon which the TATS operational analysis is based. It is not a requirement of this study, but rather a regional requirement to avoid failure of the transportation system.
However, the holistic impact of the other baseline projects should not be underestimated. None of the Study’s project functionality will be realized unless the Baseline is completed.

Tideflats Area Transportation Study Final Report June 2011
18
Table 2. Baseline Network Assumptions
Figure 6 ID
Project Description Funding and
Construction Status
Tideflats Area Access Projects
15 Port of Tacoma Road Interchange ‐ Reconstruct interchange between SR 509 and I‐5. Reconstruct 34th Avenue E and 12th Street E to a 3‐lane roadway. Include southbound truck lane on Port of Tacoma Road. (H14) Partially Funded
16 Canyon Road E from 72nd Street E to Pioneer Way E ‐ Widen roadway to provide additional lane(s). (H15) Partially Funded
17 I‐5 HOV lanes ‐ Extend from SR 18 to SR 16. (H16) Partially Funded and Under Construction
18 SR 167 extension ‐ Construct 2‐lane freeway between SR 509 and SR 161 (tolls assumed). (H17) Partially Funded
Port Access Projects
2 Lincoln Avenue grade separation ‐ Construct overpass on Lincoln Avenue between Marc Avenue and Thorne Road. (H2) Completed June 2011
3 Lincoln Avenue & Port of Tacoma Road ‐ Add traffic signal. (H3) Unfunded
4 Murray Morgan Bridge ‐ E 11th Street between A Street and D Street. Rehabilitate bridge. (H4) Partially Funded and Under Construction
5 11th Street Bridge ‐ Renovate to accommodate trucks. (H5) Unfunded
6 Lincoln Avenue Bridge ‐ Portland Avenue to Marc Avenue. Replace part of the bridge deck, bridge bearings, repair rails and sidewalks, re‐paint. (H6) Fully Funded and Under Construction
7 Hylebos Bridge ‐ Rehabilitate the bridge including a new deck, sidewalk, and guardrails. (H7) Under Construction
9 Extend A/D rail line east across Alexander Avenue to Taylor Way. The Port is planning to increase arrival/departure train lengths from 8,000 feet to 10,000 feet. (H18) Unfunded
1 SR 509 slip ramps at D Street ‐ Construct a half diamond interchange at D Street and SR 509. (W7) Partially Funded
Industrial Access Projects
8 Puyallup Avenue Bridge ‐ Replace 2 of 5 bridge structures, increasing total lanes to 4. Widen to 6 lanes at approach to Portland Avenue. (H8) Partially Funded
11 70th Avenue E corridor ‐ 20th Street East to UPRR. Widen existing two‐lane arterial to 5 lanes. (H10) Unfunded
12 70th Avenue E ‐ 20th Street E to Pacific Highway E. – Realign and reconstruct to 4‐lane roadway section. (H11) Unfunded
13 20th Street E ‐ Port of Tacoma Road to 63rd Avenue E. Reconstruct to a 3‐lane roadway. (H12) Unfunded
14 Valley Avenue ‐ Widen existing two‐lane arterial to 4 lanes between 70th Avenue E and Freeman Road E. Add fifth lane east of Freeman Road E and restripe the eastbound right‐turn lane to through/right‐turn. (H13) Unfunded
Local Access Projects
10 Freeman Road ‐ 20th Avenue E to N Levee Road. Reconstruct to 3‐lane roadway. (H9) Unfunded
Source: Fehr & Peers, 2011

Taylor Way
EAlexander Ave
EP
ortlandA
ve
54th
Ave
E
70th
Ave
E
Marine ViewDr
Port of Tacoma
Rd
Linco
lnAve
Puyallup Ave
Marshall Ave
Industry Dr E
62nd
Ave
E
N Levee Rd E
River Rd E
E11
thSt
Paci
ficH
wy
S
Pacific Hwy E
20th St E
Fre
eman
Rd
E
52nd St E
Wal
ler
Rd
E
Pioneer Way E
Pac
ific
Ave
Me r
idia
nA
veE
W Stewart Ave
36th St E
S 356th St
ED
St
S t u d y A r e aS t u d y A r e a
509
509
99
§̈¦5
§̈¦5
167
§̈¦705
§̈¦5
16
167
7
B.N.S.F.
B.N.S.F.
B.N.S.F.
BASELINE NETWORK ASSUMPTIONSTideflats Area Transportation Study
FIGURE 6
U.P.R.R.
B.N.S.F.
U.P.R.R.
Tacoma Rail
Tacoma Rail
Tacoma Rail
U.P.R.R.
U.P.R.R.
\\FPSE2\Data2\2010Projects\SE10-0190_Tideflats Area Transportation Study\Graphics\Draft\GIS\MXD\8x11\fig01_rdwy_improvements.mxd
161
!
!
1
2
3
4
6
5
7
8
9
D Street Ramps Lincoln Avenue Grade Separation
Lincoln Avenue/Port of
Murray Morgan Bridge -Reconstruct
E 11th Street Viaduct -Rebuild
Lincoln Avenue Bridge -Rehabilitate
Hylebos Bridge -Rebuild
Puyallup Avenue Bridges -Rebuild
Extend A/D Rail Line
Local Area Projects
11
10
12
15
13
14
Freeman Road - Widen to 3 Lanes 70th Avenue -Widen to 5 Lanes
70th Avenue -Realign and Widen to 4 Lanes 20th Street -Widen to 3 Lanes
Valley Avenue -Upgrade to 4 Lanes (2011)and Widen East Approach
I-5/Port of Tacoma Road Interchange - Rebuild
9
17. Add HOV Lanes(SR 16)
16. Widen South to 208th St E
18. SR 167 Extension Phase 1
17. Add HOV Lanes4
SSttttt5
7
PPPPPPPPPPPPoooooorrrrrrrttcocococolnn!!!!!!!!!!!!!!!!!!!!!!!!!!!!!!!!!!!nn
3
6
MM2
8
PPPPPPPPPPPPPPPPPPPPPPPPPPPPP!!!!!!!!!!!!!!!!!!!!!!!1
15
13
11
10PPPP.PPRRRR.RRRRRRRR.14
tt EEEE12
Tacoma
Fife
Tacoma Rail

Taylor Way
EAlexander Ave
EP
ortlandA
ve
54th
Ave
E
70th
Ave
E
Marine ViewDr
Port of Tacoma
Rd
Linco
lnAve
Puyallup Ave
Marshall Ave
Industry Dr E
62nd
Ave
E
N Levee Rd E
River Rd E
E11
thSt
Paci
ficH
wy
S
Pacific Hwy E
20th St E
Fre
eman
Rd
E
52nd St E
Wal
ler
Rd
E
Pioneer Way E
Pac
ific
Ave
Me r
idia
nA
veE
W Stewart Ave
36th St E
S 356th St
ED
St
S t u d y A r e aS t u d y A r e a
509
509
99
§̈¦5
§̈¦5
167
§̈¦705
§̈¦5
16
167
7
B.N.S.F.
B.N.S.F.
B.N.S.F.
HOUSEHOLD GROWTH (2006-2030)Tideflats Area Transportation Study
FIGURE 7
U.P.R.R.
B.N.S.F.
U.P.R.R.
Tacoma Rail
Tacoma Rail
Tacoma Rail
Tacoma
U.P.R.R.
U.P.R.R.
\\FPSE2\Data2\2010Projects\SE10-0190_Tideflats Area Transportation Study\Graphics\Draft\GIS\MXD\8x11\fig0x_TAZ_hhGrowth.mxd
161
N
NOT TO SCALE
LEGEND
Growth in Numberof Households (2006-2030)
< 250
250 - 500
500 - 1,000
> 1,000
20062006 20302030
RailRailRail

Taylor Way
EAlexander Ave
EP
ortlandA
ve
54th
Ave
E
70th
Ave
E
Marine ViewDr
Port of Tacoma
Rd
Linco
lnAve
Puyallup Ave
Marshall Ave
Industry Dr E
62nd
Ave
E
N Levee Rd E
River Rd E
E11
thSt
Paci
ficH
wy
S
Pacific Hwy E
20th St E
Fre
eman
Rd
E
52nd St E
Wal
ler
Rd
E
Pioneer Way E
Pac
ific
Ave
Me r
idia
nA
veE
W Stewart Ave
36th St E
S 356th St
ED
St
S t u d y A r e aS t u d y A r e a
509
509
99
§̈¦5
§̈¦5
167
§̈¦705
§̈¦5
16
167
7
B.N.S.F.
B.N.S.F.
B.N.S.F.
161
EMPLOYMENT GROWTH (2006-2030)Tideflats Area Transportation Study
FIGURE 8
B.N.S.F.
U.P.R.R.
Tacoma Rail
Tacoma Rail
Tacoma Rail
U.P.R.R.
U.P.R.R.
\\FPSE2\Data2\2010Projects\SE10-0190_Tideflats Area Transportation Study\Graphics\Draft\GIS\MXD\8x11\fig0x_TAZ_empGrowth.mxd
N
NOT TO SCALE
LEGEND
Growth in Number of EmployeesFull and Part-Time (2006-2030)
0 - 500
500 - 1,500
1,500 - 2,000
> 2,000
< 0
20062006 20302030
Tacoma Rail
RailRail

Taylor Way
EAlexander Ave
EP
ortlandA
ve
54th
Ave
E
70th
Ave
E
Marine ViewDr
Port of Tacoma
Rd
Linco
lnAve
Puyallup Ave
Marshall Ave
Industry Dr E
62nd
Ave
E
N Levee Rd E
River Rd E
E11
thSt
Paci
ficH
wy
S
Pacific Hwy E
20th St E
Fre
eman
Rd
E
52nd St E
Wal
ler
Rd
E
Pioneer Way E
Pac
ific
Ave
Me r
idia
nA
veE
W Stewart Ave
36th St E
S 356th St
ED
St
S t u d y A r e aS t u d y A r e a
509
99
§̈¦5
§̈¦5
167
§̈¦705
§̈¦5
16
509
167
7
B.N.S.F.
B.N.S.F.
B.N.S.F.161
PM PEAK HOUR TRAFFIC GROWTH (2006-2030)Tideflats Area Transportation Study
FIGURE 9
U.P.R.R.
B.N.S.F.
U.P.R.R.
Tacoma Rail
Tacoma Rail
Tacoma Rail
U.P.R.R.
U.P.R.R.
\\FPSE2\Data2\2010Projects\SE10-0190_Tideflats Area Transportation Study\Graphics\Draft\GIS\MXD\8x11\fig0x_PMPh_traff_grwth.mxd
5,800 8,380
+ 45%
3,070 5,010+60%
7,490 9,860
+30%
6,500 9,500
+45%
5,810 6,750
+15%4,010 5,970
+50%
+35%
19,04014,250
N
NOT TO SCALE
LEGEND
Screenline
PM Peak Hour Traffic Growth
2006 2030
+35%
19,04014,250
*
* A screenline is an imaginary line used to measure the traffic flow between two areas.The number of vehicles that cross the screenline on any of the intersecting roadwaysis counted to provide the overall traffic volume between the areas of interest.
Tacoma Rail
RailRail

Taylor Way
EAlexander Ave
EP
ortlandA
ve
54th
Ave
E
70th
Ave
E
Marine ViewDr
Port of Tacoma
Rd
Linco
lnAve
Puyallup Ave
Marshall Ave
Industry Dr E
62nd
Ave
E
N Levee Rd E
River Rd E
E11
thSt
Paci
ficH
wy
S
Pacific Hwy E
20th St E
Fre
eman
Rd
E
52nd St E
Wal
ler
Rd
E
Pioneer Way E
Pac
ific
Ave
Me r
idia
nA
veE
W Stewart Ave
36th St E
S 356th St
ED
St
S t u d y A r e aS t u d y A r e a
509
99
§̈¦5
§̈¦5
167
§̈¦705
§̈¦5
16
509
167
7
B.N.S.F.
B.N.S.F.
B.N.S.F.161
PM PEAK HOUR TRUCK GROWTH (2006-2030)Tideflats Area Transportation Study
FIGURE 10
U.P.R.R.
B.N.S.F.
U.P.R.R.
Tacoma Rail
Tacoma Rail
Tacoma Rail
U.P.R.R.
U.P.R.R.
\\FPSE2\Data2\2010Projects\SE10-0190_Tideflats Area Transportation Study\Graphics\Draft\GIS\MXD\8x11\fig0x_PMPh_trk_grwth2.mxd
520
1,160
+ 120%
150 220+ 45%
210490
+ 130%
9701,380
+ 40%130 190
+ 40%
170 360
+ 110%
0 420
*
* A screenline is an imaginary line used to measure the traffic flow between two areas.The number of vehicles that cross the screenline on any of the intersecting roadwaysis counted to provide the overall traffic volume between the areas of interest.
N
NOT TO SCALE
520
1,160
+ 120%
LEGEND
Screenline
PM Peak Hour Truck Growth
2006 2030
*
Tacoma Rail
RailRail
Tideflats Area Transportation Study Final Report June 2011
24
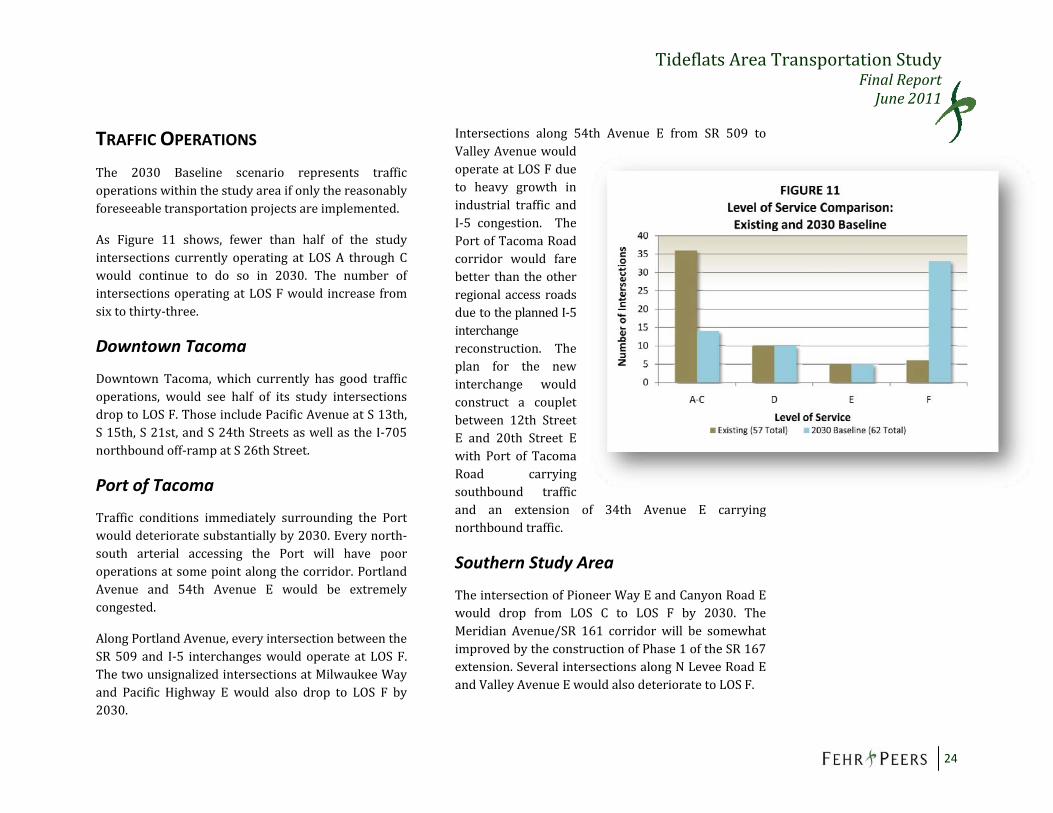
Figure 11. Level of Service Comparison: Existing and 2030 Baseline Roadway Operations
TRAFFIC OPERATIONS
The 2030 Baseline scenario represents traffic operations within the study area if only the reasonably foreseeable transportation projects are implemented.
As Figure 11 shows, fewer than half of the study intersections currently operating at LOS A through C would continue to do so in 2030. The number of intersections operating at LOS F would increase from six to thirty‐three.
Downtown Tacoma
Downtown Tacoma, which currently has good traffic operations, would see half of its study intersections drop to LOS F. Those include Pacific Avenue at S 13th, S 15th, S 21st, and S 24th Streets as well as the I‐705 northbound off‐ramp at S 26th Street.
Port of Tacoma
Traffic conditions immediately surrounding the Port would deteriorate substantially by 2030. Every north‐south arterial accessing the Port will have poor operations at some point along the corridor. Portland Avenue and 54th Avenue E would be extremely congested.
Along Portland Avenue, every intersection between the SR 509 and I‐5 interchanges would operate at LOS F. The two unsignalized intersections at Milwaukee Way and Pacific Highway E would also drop to LOS F by 2030.
Intersections along 54th Avenue E from SR 509 to Valley Avenue would operate at LOS F due to heavy growth in industrial traffic and I‐5 congestion. The Port of Tacoma Road corridor would fare better than the other regional access roads due to the planned I‐5 interchange reconstruction. The plan for the new interchange would construct a couplet between 12th Street E and 20th Street E with Port of Tacoma Road carrying southbound traffic and an extension of 34th Avenue E carrying northbound traffic.
Southern Study Area
The intersection of Pioneer Way E and Canyon Road E would drop from LOS C to LOS F by 2030. The Meridian Avenue/SR 161 corridor will be somewhat improved by the construction of Phase 1 of the SR 167 extension. Several intersections along N Levee Road E and Valley Avenue E would also deteriorate to LOS F.

Tideflats Area Transportation Study Final Report June 2011
25
Additional information on the evaluation results may be found in Appendix G.
4. ALTERNATIVES DEVELOPMENT & ANALYSIS
The project team developed improvement concepts, solicited ideas from stakeholders, and consulted various jurisdictions’ capital and transportation improvement programs. This effort resulted in a list of 85 improvement projects in addition to the 2030 Baseline projects.
EVALUATION CRITERIA
The evaluation of candidate projects was completed in two steps. The first level was a preliminary screening to identify projects that could be dismissed without intensive analysis. The second step was a more rigorous assessment including micro‐simulation. See Appendix G for the technical memorandum including the full results of this process.
First Level Screening Criteria
The first level screening criteria is shown in Table 3. The purpose of this step was to ensure that the team selected only projects that directly related to the purpose and need of the study.
Categories considered include transportation system performance, potential to improve safety, physical feasibility, cost, level of public and private support,
and consistency with existing plans. Each project was scored on a simple three‐tier basis.
There was no formal threshold needed to pass the screening process. Rather, the ratings were used as a tool for the project team to weigh the costs and benefits, and make a determination as to whether the project warranted further analysis.
Over a third of the non‐Baseline projects were dismissed during this screening process. Following the initial screening round, a handful of new projects were added to the candidate list.
Table 3. First Level Screening Criteria
Category Criteria
Transportation System Performance
• Potential to improve traffic “hot spots” • Potential to improve truck operations
Safety • Potential to improve high collision locations
Physical Feasibility • Ability to be constructed; environmental feasibility
Cost • Range of cost
Partnerships • Support by public and private sectors
Consistency with Plans • Addressed in local, regional, state plans
Source: Fehr & Peers, 2011
Tideflats Area Transportation Study Final Report June 2011
26
Second Level Screening Criteria
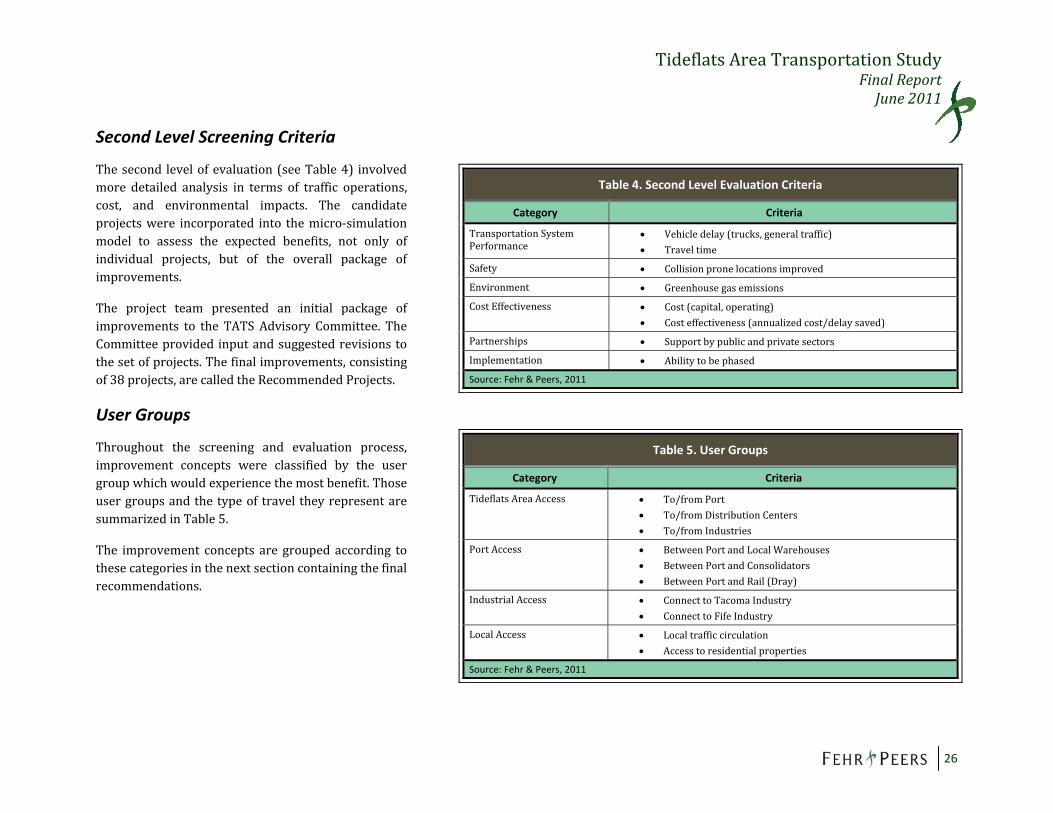
The second level of evaluation (see Table 4) involved more detailed analysis in terms of traffic operations, cost, and environmental impacts. The candidate projects were incorporated into the micro‐simulation model to assess the expected benefits, not only of individual projects, but of the overall package of improvements.
The project team presented an initial package of improvements to the TATS Advisory Committee. The Committee provided input and suggested revisions to the set of projects. The final improvements, consisting of 38 projects, are called the Recommended Projects.
User Groups
Throughout the screening and evaluation process, improvement concepts were classified by the user group which would experience the most benefit. Those user groups and the type of travel they represent are summarized in Table 5.
The improvement concepts are grouped according to these categories in the next section containing the final recommendations.
Table 4. Second Level Evaluation Criteria
Category Criteria
Transportation System Performance
• Vehicle delay (trucks, general traffic) • Travel time
Safety • Collision prone locations improved
Environment • Greenhouse gas emissions
Cost Effectiveness • Cost (capital, operating) • Cost effectiveness (annualized cost/delay saved)
Partnerships • Support by public and private sectors
Implementation • Ability to be phased
Source: Fehr & Peers, 2011
Table 5. User Groups
Category Criteria
Tideflats Area Access
• To/from Port • To/from Distribution Centers • To/from Industries
Port Access • Between Port and Local Warehouses • Between Port and Consolidators • Between Port and Rail (Dray)
Industrial Access • Connect to Tacoma Industry • Connect to Fife Industry
Local Access • Local traffic circulation • Access to residential properties
Source: Fehr & Peers, 2011

Tideflats Area Transportation Study Final Report June 2011
27
Additional information on conceptual engineering and cost estimates may be found in Appendix H.
5. FINDINGS & RECOMMENDATIONS
The result of this study is a set of Recommended Projects of transportation improvements in the Tideflats area. This section summarizes the recommended improvement package, the expected performance of the transportation system if the recommended package is implemented, and cost estimates of the improvement projects. Conceptual drawings and cost estimates are included in Appendix H.
RECOMMENDATIONS
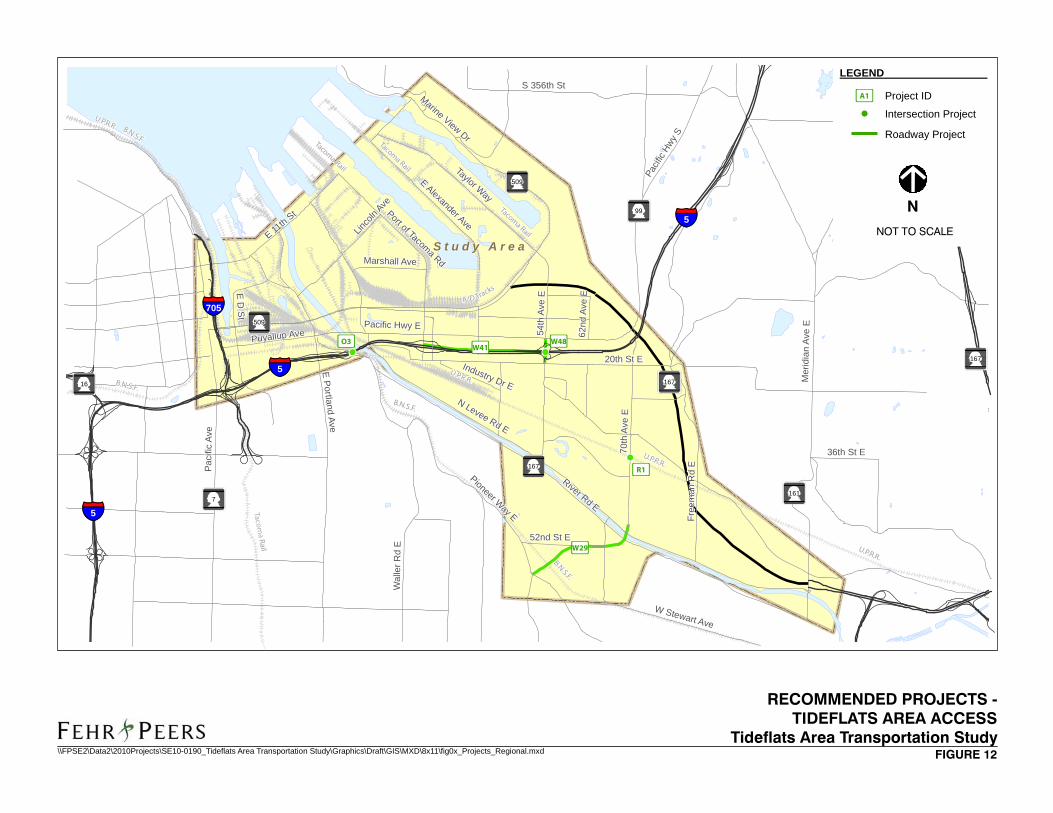
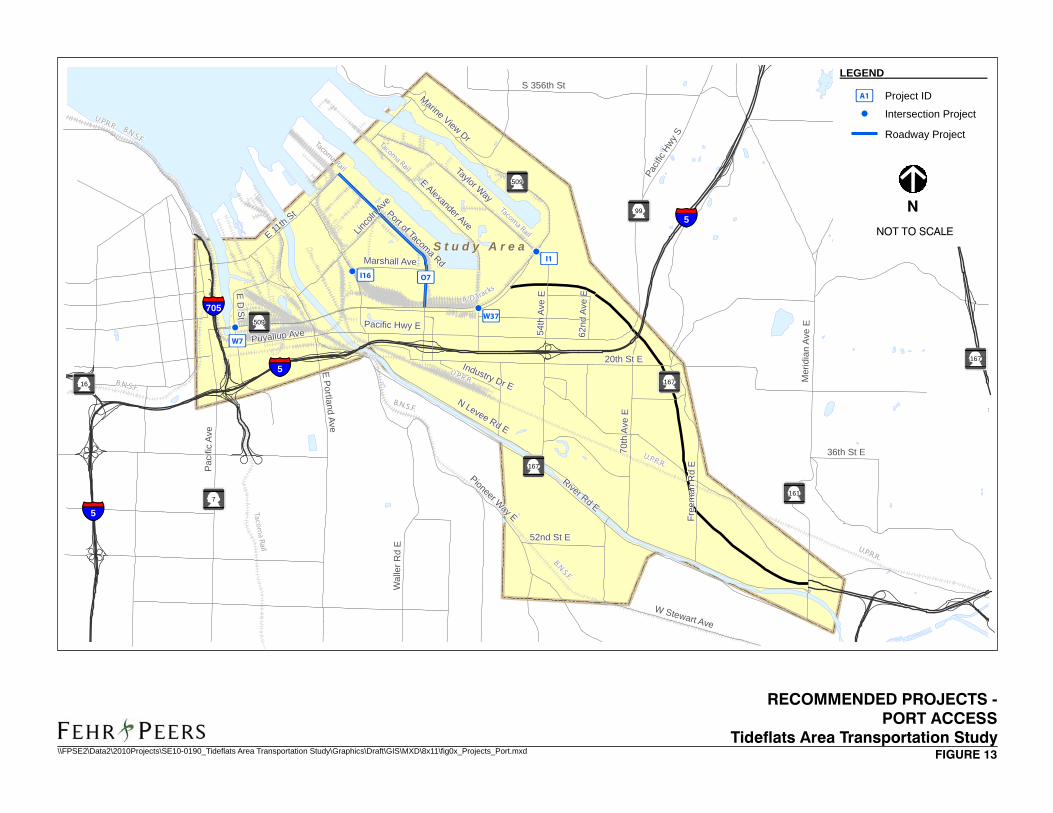
The project descriptions and costs of the recommended package of improvements are presented in Table 6. Figures 12 through 15 map the project locations according to the user groups presented in the previous section.
PERFORMANCE SUMMARY
The recommended projects were added to the 2030 baseline transportation network to evaluate its impacts. The following list highlights the main findings of that analysis. All statistics reflect performance during a single PM peak period:
92 percent of the PM peak period traffic demand would be served, an increase of 23 percent over that served by the Baseline network.
510,000 vehicle miles traveled (VMT), an increase of 15 percent compared to the Baseline network. The increase in VMT is due to the higher volumes able to travel through the roadway network.
8,500 vehicle hours of delay, a decrease of 38 percent compared to the Baseline network.
257 average seconds of delay per vehicle, a decrease of 46 percent compared to the Baseline network.
742,100 pounds of GHG emissions, a decrease of 2 percent compared to the Baseline network.
10 of the 63 study intersections operating at LOS F, a decrease of 70 percent compared to the Baseline network.

Tideflats Area Transportation Study Final Report June 2011
28
Table 6. Recommended Projects
ID Project Description Cost (in thousands of 2010 dollars1)
Tideflats Area Access Projects
O3 I‐5 ‐ Add variable message signs for access to port. 2,100
R1 70th Avenue E/UPRR Railroad ‐ Build railroad grade separation. 25,000
W29 Canyon Road Extension ‐ Extend Pioneer Way across Puyallup River to 70th Avenue E. 58,200
W41 I‐5 from 54th Avenue E to Port of Tacoma Road ‐ Add collector‐distributor/auxiliary lanes. 7,300
W48 54th Ave Interchange with I‐5 ‐ Rebuild interchange. 53,400
Port Access Projects
I1 SR 509, Taylor Way & 54th Avenue E ‐ Add a right turn lane on northbound 54th Avenue E; double left turn lanes on both directions of SR 509. 4,800
I16 Milwaukee Way/Marshall Street (East 4th Street) intersection ‐ Add signal, RR flashers and gates with a traffic signal intertie. 1,000
O7 Port of Tacoma Road ‐ Address truck queuing by making the outside northbound lane a truck queue lane and converting the inside southbound lane to reversible operations. 240
W37 Alexander Avenue/SR 509 intersection ‐ Add a free‐flow right turn lane on the northbound approach. 2,300
Industrial Access Projects
I2 54th Avenue E/Pacific Highway E intersection ‐ Reconstruct intersection and add turn lanes. Add southbound through lane from 12th Street E to Pacific Highway E. See W48
I5 St. Paul Avenue/ E 11th Street intersection ‐ Construct signal or roundabout. 2,800
I7 St. Paul Avenue/ Portland Avenue intersection ‐ Construct signal. 500
I10 20th Street E/Industry Drive intersection ‐ Add signal. 500
I15 Portland Avenue/Puyallup Avenue intersection ‐ Widen intersection with additional left turn/through lanes. 5,900
I18 Reconstruct curb returns for trucks at various locations within study area. 500
I19 S 26th Street/I‐705 northbound off‐ramp intersection ‐ Add signal. 500
I20 Portland Avenue on and off ramps at SR 509 ‐ Add traffic signals and modify channelization. 1000
I21 54th Avenue E/4th Street ‐ Add signal. 500
I22 54th Avenue E/12th Street E intersection ‐ Create an eight‐phase signal operation with protected left turns. 60
I27 54th Avenue E/20th Street E intersection ‐ Widen approach legs and rechannelize. See W48
I28 Portland Avenue/25th and 26th Streets ‐ Add traffic signals. Coordinate along Portland Avenue corridor. 820
M5 Pavement overlay program ‐ Improve pavement conditions throughout study area. 3,000

Tideflats Area Transportation Study Final Report June 2011
29
Table 6. Recommended Projects
ID Project Description Cost (in thousands of 2010 dollars1)
O1 SR 99 ‐ Interconnect signals. 100
W1 Frank Albert Road Overcrossing ‐ Build new bridge over I‐5 from 20th Street E to Pacific Highway E; new signals at Pacific Highway E and 20th Street E. 24,300
W13 Levee Road ‐ Reconstruct Frank Albert Road to Freeman Road. Add signals at two intersections. 31,200
W30 62nd Avenue E overpass ‐ Extend 62nd Avenue E over I‐5 from Pacific Highway E to 20th Street E; new traffic signals at Pacific Highway E and 20th Street E. 26,300
W54 54th Avenue E ‐ Access Management‐ Pacific Highway E to SR 509. See W48
W55 Arterial ITS Program ‐ Signal Coordination; traveler Information to/from industrial sites. 2,000
W56 12th Street E‐ Extend new street from Alexander Avenue E to 34th Avenue E. 18,400
W57 12th Street E ‐ Widen to 3 lanes from 62nd Ave E to Alexander Avenue E; extend new street from Alexander Avenue E to 34th Avenue E. See W56
W58 62nd Avenue E ‐ Pacific Highway E to 12th Street E ‐ Widen to 3 lanes. See W30
W59 Frank Albert Road‐ Pacific Highway E to 12th Street E ‐ Widen to 3 lanes. See W1
Local Access Projects
I4 East D Street/Puyallup Avenue intersection ‐ Change signal phasing. Add left turn pocket to southbound approach. 50
I23 Pacific Avenue/13th Street intersection ‐ Restripe the eastbound right turn lane as a shared through/right‐turn lane. 60
I24 Pacific Avenue/Tacoma Way/26th Street intersection ‐ Restripe the eastbound right‐turn lane as a shared through/right‐turn lane. 60
P1 Puyallup Avenue ‐ Add bike lane from Portland Avenue across Puyallup River. See H8
R2 54th Avenue E at UPRR rail crossing ‐ Construct a grade separation structure to re‐open the street. 35,800
W31 20th Street E ‐ Reconstruct from 70th Avenue E to Freeman Road to a 3‐lane section. 3,900
Total 312,6901Some cost estimates were provided by older studies, and are therefore not shown in 2010 dollars. Source: Fehr & Peers, 2011
!
!!
Taylor Way
EAlexander Ave
EP
ortlandA
ve
54th
Ave
E
70th
Ave
E
Marine ViewDr
Port of Tacoma
Rd
Linco
lnAve
Puyallup Ave
Marshall Ave
Industry Dr E
62nd
Ave
E
N Levee Rd E
River Rd E
E11
thSt
Paci
ficH
wy
S
Pacific Hwy E
20th St E
Fre
eman
Rd
E
52nd St E
Wal
ler
Rd
E
Pioneer Way E
Pac
ific
Ave
Me r
idia
nA
veE
W Stewart Ave
36th St E
S 356th St
ED
St
mmW41
mmW29
mmO3
mmR1
mmW48
S t u d y A r e aS t u d y A r e a
509
99
§̈¦5
§̈¦5
167
§̈¦705
§̈¦5
16
509
167
7
B.N.S.F.
B.N.S.F.
B.N.S.F.
167
RECOMMENDED PROJECTS -TIDEFLATS AREA ACCESS
Tideflats Area Transportation Study
U.P.R.R.
B.N.S.F.
U.P.R.R.
Tacoma Rail
Tacoma Rail
Tacoma Rail
U.P.R.R.
U.P.R.R.
\\FPSE2\Data2\2010Projects\SE10-0190_Tideflats Area Transportation Study\Graphics\Draft\GIS\MXD\8x11\fig0x_Projects_Regional.mxd
161
mmA1
N
NOT TO SCALE
LEGEND
Project ID
Intersection Project!
Roadway Project
FIGURE 12
167
A/D Tracks
Tacom
a RailRailRail
!
!
!
!
Taylor Way
EAlexander Ave
EP
ortlandA
ve
54th
Ave
E
70th
Ave
E
Marine ViewDr
Port of Tacoma
Rd
Linco
lnAve
Puyallup Ave
Marshall Ave
Industry Dr E
62nd
Ave
E
N Levee Rd E
River Rd E
E11
thSt
Paci
ficH
wy
S
Pacific Hwy E
20th St E
Fre
eman
Rd
E
52nd St E
Wal
ler
Rd
E
Pioneer Way E
Pac
ific
Ave
Me r
idia
nA
veE
W Stewart Ave
36th St E
S 356th St
ED
St
mmO7
mmI1
mmI16
mmW37
mmW7
S t u d y A r e aS t u d y A r e a
509
99
§̈¦5
§̈¦5
167
§̈¦705
§̈¦5
16
509
167
7
B.N.S.F.
B.N.S.F.
B.N.S.F.
RECOMMENDED PROJECTS -PORT ACCESS
Tideflats Area Transportation Study
U.P.R.R.
B.N.S.F.
U.P.R.R.
Tacoma Rail
Tacoma Rail
Tacoma Rail
U.P.R.R.
U.P.R.R.
\\FPSE2\Data2\2010Projects\SE10-0190_Tideflats Area Transportation Study\Graphics\Draft\GIS\MXD\8x11\fig0x_Projects_Port.mxd
161
mmA1
N
NOT TO SCALE
LEGEND
Project ID
Intersection Project!
Roadway Project
FIGURE 13
167
A/D Tracks
Tacom
a RailRailRail

!
!
!
!
!
!
!
!
!
!!!
Taylor Way
EAlexander Ave
EP
ortlandA
ve
54th
Ave
E
70th
Ave
E
Marine ViewDr
Port of Tacoma
Rd
Linco
lnAve
Puyallup Ave
Marshall Ave
Industry Dr E
62nd
Ave
E
N Levee Rd E
River Rd E
E11
thSt
Paci
ficH
wy
S
Pacific Hwy E
20th St E
Fre
eman
Rd
E
52nd St E
Wal
ler
Rd
E
Pioneer Way E
Pac
ific
Ave
Me r
idia
nA
veE
W Stewart Ave
36th St E
S 356th St
ED
St
mmI5
mmI7
mmI2
mmI19
mmI20
mmI21
mmI22
mmI27
mmI15
mmI10
mmW58mmW59mmW57
mmI28
mmH12
mmW56
mmO1
mmW13
mmW54
mmW1 mmW30
S t u d y A r e aS t u d y A r e a
509
99
§̈¦5
§̈¦5
167
§̈¦705
§̈¦5
16
509
167
7
B.N.S.F.
B.N.S.F.
B.N.S.F.
RECOMMENDED PROJECTS -INDUSTRIAL ACCESS
Tideflats Area Transportation Study
U.P.R.R.
B.N.S.F.
U.P.R.R.
Tacoma Rail
Tacoma Rail
Tacoma Rail
U.P.R.R.
U.P.R.R.
\\FPSE2\Data2\2010Projects\SE10-0190_Tideflats Area Transportation Study\Graphics\Draft\GIS\MXD\8x11\fig0x_Projects_Industrial.mxd
161
mmA1
N
NOT TO SCALE
LEGEND
! Intersection Project
Roadway Project
Project ID
FIGURE 14
167
A/D Tracks
Tacom
a RailRailRail

!
!
!
!
!
Taylor Way
EAlexander Ave
EP
ortlandA
ve
54th
Ave
E
70th
Ave
E
Marine ViewDr
Port of Tacoma
Rd
Linco
lnAve
Puyallup Ave
Marshall Ave
Industry Dr E
62nd
Ave
E
N Levee Rd E
River Rd E
E11
thSt
Paci
ficH
wy
S
Pacific Hwy E
20th St E
Fre
eman
Rd
E
52nd St E
Wal
ler
Rd
E
Pioneer Way E
Pac
ific
Ave
Me r
idia
nA
veE
W Stewart Ave
36th St E
S 356th St
ED
St
mmP1
mmW31
mmI4
mmR2
mmI23
mmI24
S t u d y A r e aS t u d y A r e a
509
99
§̈¦5
§̈¦5
167
§̈¦705
§̈¦5
16
509
167
7
B.N.S.F.
B.N.S.F.
B.N.S.F.
RECOMMENDED PROJECTS -LOCAL ACCESS
Tideflats Area Transportation Study
U.P.R.R.
B.N.S.F.
U.P.R.R.
Tacoma Rail
Tacoma Rail
Tacoma Rail
U.P.R.R.
U.P.R.R.
\\FPSE2\Data2\2010Projects\SE10-0190_Tideflats Area Transportation Study\Graphics\Draft\GIS\MXD\8x11\fig0x_Projects_Local.mxd
161
mmA1
N
NOT TO SCALE
LEGEND
Project ID
Intersection Project!
Roadway Project
FIGURE 15
167
A/D Tracks
Tacom
a RailRailRail

Tideflats Area Transportation Study Final Report June 2011
34
Figure 16. Level of Service Comparison: Existing, 2030 Baseline and Recommended Plan Roadway Operations
TRANSPORTATION ANALYSIS
The Recommended Projects would improve the transportation network performance compared with the Baseline scenario. As Figure 16 shows, the Recommended Projects would result in double the number of LOS A through D intersections when compared to the 2030 Baseline scenario. The number of LOS F intersections would drop from 33 LOS F intersections expected in the Baseline condition to 10 under the Recommended Projects.
It is important to note that these projected improvements are contingent upon the completion of the Baseline projects. The Recommended Projects alone would not achieve these results.
Downtown Tacoma
In Downtown Tacoma, operations would improve moderately compared to the 2030 Baseline scenario. However, four intersections would remain at LOS F: Pacific Avenue at S 15th, S 21st, and S 24th Streets and the I‐705 northbound off‐ramp at S 26th Street.
Port of Tacoma
The Recommended Projects would lead to better conditions near the Port than would be expected under the 2030 Baseline. The Portland Avenue corridor would have only one LOS F intersection between the SR 509 and I‐5 interchanges. Although that intersection, at Puyallup Avenue, would be LOS F,
the projected delay is still less than was forecast in the Baseline scenario.
The two unsignalized intersections at Milwaukee Way and Pacific Highway E would operate at LOS F as was the case under Baseline conditions, but the expected delay would decrease.
The conditions on the 54th Avenue E corridor from SR 509 to Valley Avenue E would improve substantially if the Recommended Projects were implemented. With the exception of 54th Avenue E at 12th Street E, all intersections along the corridor would improve from LOS F conditions. The intersection of Marine View Drive and E 11th Street would operate at LOS B rather than LOS F as under the Baseline. All intersections along Port of Tacoma Road would operate at LOS D or better if the Recommended Projects are implemented.

Tideflats Area Transportation Study Final Report June 2011
35
Overall, the area around the Port would operate far better under the Recommended Projects than under the Baseline conditions.
Southern Study Area
The intersection of Pioneer Way E and Canyon Road E would improve from LOS F to LOS E under the Recommended Projects. The Meridian Avenue/SR 161 corridor would operate slightly better, with shorter delays, although LOS would remain about the same as the 2030 Baseline.
COST ESTIMATES
The overall cost of the recommended improvements included in the preferred package is $290‐335 million. This total does not include baseline projects, which are essential to avoid failure of the transportation system by 2030. Costs are broken down to indicate the proportion of money being proposed for Tideflats area, industrial, port, and local access:
Tideflats area access: $140‐150 million
Port access: $5‐10 million
Industrial access: $110‐130 million
Local access: $35‐45 million
Baseline projects, (not including additional HOV capacity on I‐5 or the SR 167 extension) total $485‐540 million. Funding for some baseline projects has already been secured. In total, $196 million has been
committed to baseline projects, leaving a need of $579‐684 million.
FUNDING SOURCES
The amount of annual funds needed to implement the TATS plan is consistent with the levels of expenditures that have been made within the TATS area over the past ten years. The high level of agency coordination and joint funding commitments has led to the successful implementation of several high‐profile projects in the TATS area.
Funding for these projects has come from a variety of sources, including the following:
City and County transportation funds
Port of Tacoma funds
Private company funds
State grants, primarily through the Freight Mobility Strategic Investment Board (FMSIB) and the Transportation Improvement Board (TIB)
WSDOT funding authorizations
Federal grants, as part of ongoing Transportation Reauthorization programs and recently as part of the ARRA (“stimulus plan”) program
While many of these funding sources will continue to provide support for the TATS projects, additional funding sources will need to be explored. For example, the SR 167 extension is a state and regional priority. Partial funding for that project is expected to include

Tideflats Area Transportation Study Final Report June 2011
36
tolls, which could be extended to other regional facilities within the TATS area.
Operations and maintenance of the TATS projects will also be a priority. In particular, pavement and bridge maintenance is key to preserving the integrity of the TATS transportation network. Heavy truck loads place additional maintenance burden on the roadway facilities. Funding opportunities for maintenance could include a Transportation Benefit District and other local funding options under consideration within the State legislature.

Tideflats Area Transportation Study Final Report June 2011
37
Appendix I provides more details on the projects included within each sequencing group and performance results.
6. PROJECT SEQUENCING The recommended projects benefit the entire TATS system holistically. Recommendations from TATS are based on objective system analysis and provide a pool of candidate projects from which individual agencies, or agency partnerships can advocate for in local, regional, state and federal prioritization and/or funding processes.
To assist in this process, the Executive Committee requested suggestions for implementation sequencing of the recommended projects over the next 20 years. The sequencing does not imply priorities per se, since some high priority projects may take several years to implement. The suggested sequencing was developed by creating logical groupings of projects that could be implemented as packages. Most of these groupings are geographically based, but some are based on functionality (e.g. development‐driven projects). Refer to the technical memorandum in Appendix I for more details regarding project sequencing.
The following list and Figure 17 present the suggested sequencing. Note that SR 167 is an essential regional roadway connection and is assumed to be implemented during the next 20 years. Likewise, the other baseline projects must be completed to realize the benefits of the Recommended Projects.
Improvements to Portland and Puyallup Avenues will improve the bottleneck that currently hinders access to I‐5. This package of improvement
requires the completion of the Port access bridges’ reconstruction.
The Pacific Avenue corridor focuses on travel within Downtown Tacoma and could take place sooner.
The Canyon Road/70th Avenue E railroad crossing and bridge over the Puyallup River would complete access to the southern study area and tie into the completed 70th Avenue E corridor.
Local industrial street improvements such as Frank Albert Road, 62nd Avenue E, 12th Street E, 20th Street E, and N Levee Road E would reduce the congestion on 54th Avenue E and Pacific Highway E by providing alternate routes.
Corridor improvements along 54th Avenue E (multiple projects) are independent of any interchange redesign so they could take place sooner.
The I‐5/54th Avenue E interchange reconstruction can be accomplished independently.

!
!
Taylor Way
EAlexander Ave
EP
ortlandA
ve
54th
Ave
E
70th
Ave
E
Marine ViewDr
Port of Tacoma
Rd
Linco
lnAve
Puyallup Ave
Marshall Ave
Industry Dr E
62nd
Ave
E
N Levee Rd E
River Rd E
E11
thSt
Paci
ficH
wy
S
Pacific Hwy E
20th St E
Fre
eman
Rd
E
52nd St E
Wal
ler
Rd
E
Pioneer Way E
Pac
ific
Ave
Me r
idia
nA
veE
W Stewart Ave
36th St E
S 356th St
ED
St
S t u d y A r e aS t u d y A r e a
509
99
§̈¦5
§̈¦5
167
§̈¦705
§̈¦5
16
509
167
7
B.N.S.F.
B.N.S.F.
B.N.S.F.
PROJECT DEFINITION AREAS -Tideflats Area Transportation Study
U.P.R.R.
B.N.S.F.
U.P.R.R.
Tacoma Rail
Tacoma Rail
Tacoma Rail
U.P.R.R.
U.P.R.R.
\\FPSE2\Data2\2010Projects\SE10-0190_Tideflats Area Transportation Study\Graphics\Draft\GIS\MXD\8x11\fig0x_proj_highlights3.mxd
161
FIGURE 17
167
LEGEND
Port Access and Safety
Canyon Road
Portland/Puyallup Avenues
Pacific Avenue Corridor
54th Avenue
Local Industrial Streets
54th Avenue Interchange
Local Circulation Projects
Development Driven Projects
Tacom
a RailRailRail

Tideflats Area Transportation Study Final Report June 2011
39
SEQUENCING RATIONALE
The sequencing suggestions listed above reflect the following rationale and realities:
Baseline projects are being implemented as funding permits during the next few years, as described in section 3.Portland Avenue (tied to the Puyallup Avenue Bridge) is a key industrial corridor whose upgrading could be tied to the completion of the I‐5 HOV lane project.
The Canyon Road extension would complete the regional corridor connections to the south and provide a substantial freight mobility benefit for truck access between the TATS area, south Pierce County, and the Frederickson industrial area.
Local agencies can improve the local industrial streets between Port of Tacoma Road and 62nd Avenue E. These projects will provide alternative routes for local traffic and freight truck movements, reducing the impacts on the very congested Pacific Highway E and 54th Avenue E corridors. The Levee Road upgrade will allow trucks to resume using that route to access Frank Albert Road, which has an existing overcrossing of the UPRR.
There are upgrades that can take place along 54th Avenue prior to rebuilding the I‐5 interchange. These include access management and widening at the intersections of 54th Avenue E/Pacific Highway E and 54th Avenue E/20th Street E.
Independent of the SR 167 extension, the remaining major TATS State Route/Interstate improvement would be rebuilding the 54th Avenue E/I‐5 interchange.
Several other TATS projects can be implemented independently or contingent upon development plans. These include:
− Pacific Avenue intersections in Downtown Tacoma
− Intersection upgrades on the Thea Foss Waterway
TATS partners will assure that sequencing of key projects includes clear public information identifying alternate routes and considers the least possible negative impact on commercial movements.