final project term paper westminster bis
DESCRIPTION
MBA Data and Statistical Analysis Final Term PaperTRANSCRIPT

Westminster Kennel Club Best in Show 2012 Champion Breed
Predicting the 2012 Westminster Kennel Club Champion Breed
through Statistical Data Analysis,
Based Exclusively on the Ratings Percentage Index (RPI)
M. Scott Green
Golden Gate University, 2012 MBA Candidate
In Partial Fulfillment to
Meet the Requirements for the
Master of Business Administration Degree in Finance
Math 240: Data Analysis for Managers, 11SP.SF1
Professor William (Bill) Rhyne
Thursday, December 29, 2011

Westminster Kennel Club Best in Show 2012 Champion Breed
Table of Contents
TABLE OF CONTENTS ..................................................................................................................2
ABSTRACT .....................................................................................................................................3
I. RESEARCH THESIS, UTILITY, AND DEVELOPMENT METHODOLOGY ............................5
RESEARCH OBJECTIVE: .........................................................................................................5
DATA ANALYTICAL CONCEPTS, TECHNIQUES, AND APPLICATIONS USED: ...............5
RESOURCE MATERIAL DEVELOPMENTAL SCHEME: ........................................................5
STATISTICAL DATA TIMELINE: ..............................................................................................6
BASIC ASSUMPTIONS: ............................................................................................................6
II. HISTORICAL SYNOPSIS OF WESTMINSTER BEST IN SHOW COMPETITION ................6
III. TIMELINE OF PAST WINNERS .............................................................................................8
IV. RESEARCH COMPARATIVE ANALYTICS AND STATISTICAL RESULTS .......................9
DATA COLLECTION POOL FOR 168 AKC-APPROVED REGISTERED DOG BREEDS ........ 10
2010 U.S. METROPOLITAN POPULARITY RANKING CODED MATRIX COMPUTATIONAL
GRAPH .......................................................................................................................................... 13
V. CONCLUSION ........................................................................................................................ 33
SOURCE CITATIONS: .................................................................................................................. 35
LITERARY RESOURCES: ................................................................................................................... 35
WEB RESOURCES: .......................................................................................................................... 35
APPENDAGES: GRAPHS AND CHARTS ................................................................................... 36

Westminster Kennel Club Best in Show 2012 Champion Breed
“Deep within the pound, a hound will abound to challenge rival, fiend, and foe; to
showcase struts, demeanor, and tempo, becoming undeniably the Best in the
Show.” – MSG
Abstract
This past February, 2011, a long-shot by the name of Hickory became the first
hound since 1983 to win the most venerable and regal dog competition in the world at
the Westminster Kennel Club’s Best in Show competition at the world-famous Madison
Square Garden in New York City. Only the third hound in the 103-year history of the
event to become champion, this large Scottish deerhound bitch displayed poise and a
unique disposition which are notably identified and reserved for smaller group breeds,
such as the beagle, poodle, and terrier - a group breed whose combined total of wins at
the prestigious BIS competition is the largest by far of any other breed. It is these
smaller group breeds which have not only dominated the BIS competition since
inception but has exponentially increased, among other similar-sized breeds, in
popularity among the general populous as well, particularly in the United States.
For example, during the past decade, the French bulldog and the Cavalier King
Charles spaniel had a remarkable increase of 469 percent and 209 percent in popularity
in the US, respectively. Yet, the top dog ruling the canine world in popularity during this
ten-year period remained the Labrador Retriever, largely due to its even temperament
and docility and better-than-marginal intelligence and low maintenance, a characteristic
commonly desired among most dog owners. However, in spite of its lengthy prominent
reign as the America’s top-ranked dog in popularity and registration numbers, ironically
and mystifyingly, the Labrador Retriever has never been crowned Westminster’s Best in
Show champion in the organization’s 104-year history.

Westminster Kennel Club Best in Show 2012 Champion Breed
Henceforth, in light of this unusual phenomenon, a very important question is
juxtaposed, would it be possible to predict the outcome of a BIS winner through the
combinative use of various statistical analyses encumbering a litany of variables
associated with popular breeds? Would there be strong, near-irrefutable evidence of
central tendencies and indirect and direct correlations between the overall registration
ranking of the top 167 breeds and the cumulative percentage of wins per breed group -
based on historical trends and data (a priori) - to sufficiently design a probability-based
analytical model, a regression model, and a forecasting model to successfully predict
future BIS winners?
In this comparison analysis research paper, we will attempt to construct an
analytical statistical model (s), incorporating a network of various data statistical
concepts and employing many of the data analysis tools learned throughout the
academic term, to configure a functional model (s) that will illustrate and demonstrate,
first, the possibility and, then, the probability that those questions can properly be
addressed and an adequate conclusion can be drawn to determine whether the
predictability of future BIS winners can be scientifically and legitimately proven.

Westminster Kennel Club Best in Show 2012 Champion Breed
I. Research Thesis, Utility, and Development Methodology
Research Objective:
By implementing a three-pronged statistical methodology, the primary goal is to
identify key independent variables, mostly externalities, which may significantly
affect the outcome of future winners of the BIS competition.
Data Analytical Concepts, Techniques, and Applications Used:
Ratings Percentage Index (RPI), Basic Probability (Categorical and Numerical),
Predictive, Qualitative and Quantitative Analyses, Linear and Multiple Regressions,
Hypothesis Testing, ANOVA, Chi-Square Tests and Nonparametric Tests, and Time-
Series Forecasting methodologies – all including corresponding graphs and charts
Resource Material Developmental Scheme:
Statistical data, content, and information are retrieved primarily from three reputable
and well-established organization sources: American Kennel Club Association,
Westminster Kennel Club, and U.S. Bureau of Labor and Statistics. Utilizing DCOVA
methodology (Description, Collection, Observation, Visualization, and Analysis) as
the statistical schematic, the purpose for the various testing procedures is to
determine the highest probability level of significance between all dependent and
independent variables, systematically filter, process, and factor all dependent
variables that are viably pertinent for inclusion of scientifically-preferred potentialities
during final selection stages, and to arrive at a sufficiently best choice and most
likely outcome.

Westminster Kennel Club Best in Show 2012 Champion Breed
Statistical Data Timeline:
Categorical and numerical raw data and information collected exclusively from
AKC’s top 168 breeds by annual ranking (1998, 2000, 2003, 2005, 2007-’10) and
annual total registration (2001-2006) and from historical results (1907-2011) of the
Westminster BIS competition. Annual sales and sales-related figures are current.
Basic Assumptions:
All breeds are purebred and are certified by various regulatory-approved
associations and institutions worldwide, including the two entities for the basis of the
report, AKC and Westminster Kennel Club. Pricing and expenditures are
established at present market rates and values, which are also supported industry-
wide in whole part by approved governing bodies and agencies globally.
II. Historical Synopsis of Westminster Best in Show Competition
Started in 1877, the Westminster Kennel Club is the oldest club for purebred
dogs in America. Originally established as a high-end gathering hole at a Manhattan
hotel for hunting men to socialize, the organization in its very inception would soon host
the oldest and most venerable dog show in the world, a prestigious canine competition
held at another institution of world-renown prominence, New York’s Madison Square
Garden.
Over the next century and a quarter, this fabulous showcase of some of the
world’s finest and formidable purebreds would be on display before a panel of highly
competent and specialized judges whose sole purpose is to select the most gifted dog
and laud and award him and her and his breeder and handler the title of Best in Show,

Westminster Kennel Club Best in Show 2012 Champion Breed
the organization’s top prize for the best all-around dog. During this period, the
competition has seen a remarkable increase in the number of entrants for the event,
from 1,200 in 1877 to a current robust level of over 2,500 well-trained, meticulously
hygiene-centric canines from a 170 breeds, all vying to attain the throne as top dog.
Much like any high-intensive competitive sporting event in which the participants
are required to exhibit the fine-tuned nature of their athletic and artistic abilities in
multitudinous facets, in order to maintain a lifestyle catered specifically for world-class
competition, this standard of living usually involves enormous costs in nutrition,
education and both physical and mental training, personal care, and traveling expense:
These pets are bred to compete and nothing more. The following table on the ensuing
page provides past BIS winners for the Westminster event during its storied 104-year
history:

Westminster Kennel Club Best in Show 2012 Champion Breed
III. Timeline of Past Winners
1907 Fox Terrier (Smooth)
1938 Setter (English) 1967 Scottish Terrier 1994 Norwich Terrier
1908 Fox Terrier (Smooth)
1939 Doberman Pinscher
1968 Lakeland Terrier 1995 Scottish Terrier
1909 Fox Terrier (Smooth)
1940 Spaniel (Cocker)
Black 1969 Skye Terrier 1996
Spaniel (Clumber)
1910 Fox Terrier (Smooth)
1941 Spaniel (Cocker)
Black 1970 Boxer 1997
Standard Schnauzer
1911 Scottish Terrier 1942 West Highland White Terrier
1971 Spaniel (English
Springer) 1998 Norwich Terrier
1912 Airedale Terrier 1943 Poodle
(Miniature) 1972
Spaniel (English Springer)
1999 Papillon
1913 Bulldog 1944 Welsh Terrier 1973 Poodle (Standard) 2000 Spaniel (English
Springer)
1914 Old English Sheepdog
1945 Scottish Terrier 1974 Pointer (German
Shorthaired) 2001 Bichon Frise
1915 Fox Terrier
(Wire) 1946 Fox Terrier (Wire) 1975
Old English Sheepdog
2002 Poodle
(Miniature)
1916 Fox Terrier
(Wire) 1947 Boxer 1976 Lakeland Terrier 2003
Kerry Blue Terrier
1917 Fox Terrier
(Wire) 1948 Bedlington Terrier 1977 Sealyham Terrier 2004 Newfoundland
1918 Bull Terrier
(White) 1949 Boxer 1978 Yorkshire Terrier 2005
Pointer (German Shorthaired)
1919 Airedale Terrier 1950 Scottish Terrier 1979 Spaniel (Irish
Water) 2006
Bull Terrier (Colored)
1920 Fox Terrier
(Wire) 1951 Boxer 1980 Siberian Husky 2007
Spaniel (English Springer)
1921 Spaniel
(Cocker) Parti 1952
Doberman Pinscher
1981 Pug 2008 Beagle (15 Inch)
1922 Airedale Terrier 1953 Doberman Pinscher
1982 Pekingese 2009 Spaniel (Sussex)
1924 Sealyham
Terrier 1954
Spaniel (Cocker) A.S.C.O.B.
1983 Afghan Hound 2010 Scottish Terrier
1925 Pointer 1955 Bulldog 1984 Newfoundland 2011 Scottish
Deerhound
1926 Fox Terrier
(Wire) 1956 Poodle (Toy) 1985 Scottish Terrier 2012 ?
1927 Sealyham
Terrier 1957 Afghan Hound 1986 Pointer
1928 Fox Terrier
(Wire) 1958
Poodle (Standard)
1987 German Shepherd
Dog
1929 Collie (Rough) 1959 Poodle
(Miniature) 1988 Pomeranian
1930 Fox Terrier
(Wire) 1960 Pekingese 1989
Doberman Pinscher
1931 Fox Terrier
(Wire) 1961 Poodle (Toy) 1990 Pekingese
1932 Pointer 1962 West Highland White Terrier
1991 Poodle (Standard)
1933 Airedale Terrier 1963 Spaniel (English
Springer) 1992 Fox Terrier (Wire)

Westminster Kennel Club Best in Show 2012 Champion Breed
IV. Research Comparative Analytics and Statistical Results
Qualitative and Quantitative Peripherals:
In reiteration, to predict which of the 168 AKC certified breeds will become the
Best in Show overall champion for 2012, comparative analysis for determination was
performed on the basis of three main categorical subjects: 1) Westminster Best in Show
performance results, 2) American Kennel Club’s ratings and registration, and 3) current
annual expenditures (i.e., puppy’s sale price, pet care costs, etc.). Moreover, the
analytical process was further enhanced and streamlined by delineating from the
aforementioned primary source material into relative subgroups, or substrates, for the
purposes of variable expansion and increased data points and to provide a legitimate
and plausible environment closely within the natural structures of consistency,
uniformity, and conformity rules. Before continuing further, the following relational
diagram on the proceeding page will provide a complete detailed illustrative orientation
of the project and how it was used to arrive at a final conclusion:

Westminster Kennel Club Best in Show 2012 Champion Breed
Data Collection Pool for 168 AKC-Approved Registered Dog Breeds
As indicated in the table above, several of the key areas that were factored
throughout the various analyses were transposed into percentage-based figures to
ameliorate the reporting of centralized tendencies and improve standard error reduction
percentages, due to a wide range of intermittent temporal spacing concerns obtained
from certain secondary data sources. It was extremely important that a fluid structural
and procedural continuum was in place at the outset of the analytical testing processes
to ensure that the validity of outcomes was at its highest degree of efficiency and that a
Westminster Best in Show Performance
Resuts
Best in Show Place Winners (Breed Group Identity)
Total Percentage of Overall BIS Placing (per group)
Best in Show All-Around Winners
Best in Show All-Around Winners (% of Total Wins)
American Kennel Club Canine Ranking and
Registration
Annual Ranking (1998, 2000, 2003, 2005, 2007-2010)
Average Ranking for the Period
Average Ranking Percentage (Rank 1-168)
Breed Registration (2001-2006)
Total Registration (2001-2006)
Average Registration (2001-2006)
Total Registration Difference ± (2001-2006)
Total Registration Percentage Difference ± (2001-2006)
Current Price Points and Expenditures
Life Expectancy (average yrs.)
Average Sales Price (AKC Criteria)
Minimum Cost of Ownership (Lifetime Cost per Life Expectancy-
Average Years)
Minimum Cost of Ownership (Annual Cost Estimate)
Annual Minimum Cost to Average Sales Price (%)
Maximum Cost of Ownership (Lifetime Cost per Life Expectancy-
Average Years)
Maximum Cost of Ownership (Annual Cost Estimate)
Annual Maximum Cost to Average Sales Price (#)
Annual Maximum Cost to Average Sales Price (%)

Westminster Kennel Club Best in Show 2012 Champion Breed
proper conclusion could be made with relative success. Now that the tables are set, it is
time to give a step-by-step procedural breakdown of the entire analysis and explain how
a conclusion was derived from it.
Recapitulating briefly, the main objective for the research is to establish whether
or not future BIS champions can be predicted from relative independent variables that
are externalities, in other words, factors that are not directly associated with any of the
two major dependent variables in the Westminster competition – BIS overall winner and
BIS place winner per group. In order to establish a strong sense of integrity within the
reporting analysis, a percentage majority sampling was chosen from the list of 168
breeds to reflect purebreds that have either placed in
their respective groups or won the top prize as
Westminster BIS. Additionally, to effectively manage
the selection process, the last phases of the final
analyses were done according to breed group
classification (please see table no. 1). This method
not only proved to be highly pivotal in the final
outcome but it also helped offer a more concise and
precise roadmap for an effectively competent and
comprehensive trifurcated comparative analysis platform. There were 138 breeds out of
the 168 which met the specified criteria for the report analysis, based on this group
classification format.
Another categorical imperative crucial in the data analysis was extracted from a
2010 AKC report relating to the top 5 breeds in a select number of U.S.’s largest
Table No. 1
Dog Breed Classification List Group I - Hound/Sporting
Group II - Sport/Hound
Group III - Herding/Working
Group IV - NonSport/Toy
Group V - Terrier
Group VI - Toy/NonSport
Group VII - Working/Herd

Westminster Kennel Club Best in Show 2012 Champion Breed
metropolitan areas (see table no. 2).
Since dog preference among the populous
served as a key component in the
analysis, it became essential to gather this
information and transpose and convert its
ranking into an appropriate population
sampling category to diversify the
independent variable as a minor substrate
of one of the major subgroups shown
earlier in this report. The chart to the left
shows how one of the original (major)
subgroups, BIS Percentage of Placing (historical), is aligned directly with each
respective minor substrate under this U.S. popularity ranking externality. By coupling
and matching BIS percentage to popularity rank order, data analysis can be performed
by using both visual and numerical analytical tools such as single regression, graphs
and charts, etc., for these two variables and help assist with the observation and
assessment of the original hypothesis in this report.
For instance, according the graph below (chart no. 1), there is substantial
evidence to suggest that a strong correlation exist between the percentage BIS placing
for German Shepherd dogs (label code is GSD) at 101% and their regional ranking,
which secures a popularity ranking for the Southeast region between 1-3, but yet no
more than 3 on a scale of 1-5, with the strongest correlation occurring in the city of
Miami (Popularity Rank = 1; BIS Pct. Placing = 101%), followed closely by Raleigh, NC.,
Table No. 2 2010 U.S. Metropolitan Popularity Ranking Coded Matrix
Computational Example
Breed Label Code
Metro Label Code
Sectional Region
2010 Popularity Ranking
(1-5)
BIS Percentage of Placing (historical)
LR ALB NE 1 11%
GSD ALB NE 2 101%
GR ALB NE 3 26%
ST ALB NE 4 19%
YT ALB NE 4 24%
LR BAL SE 1 11%
GSD BAL SE 2 101%
YT BAL SE 3 24%
GR BAL SE 4 26%
RO BAL SE 5 6%
LR CHI MW 1 11%
GSD CHI MW 2 101%
GR CHI MW 3 26%
YT CHI MW 4 24%
BU CHI MW 5 46%

Westminster Kennel Club Best in Show 2012 Champion Breed
and Baltimore, MD (both at 2 and 101%). Although this report does not explore the
various reasons – largely cultural - the German Shepherd is one the most popular dogs
in the United States and also one of the most successfully awarded breed in its group
(Working/Herd) in the history of the Westminster BIS event. Yet, in spite of its domestic
popularity and success at BIS competition, it has only won the BIS top prize once in the
104-year of the event.
2010 U.S. Metropolitan Popularity Ranking Coded Matrix - Southeast
Conversely, when the rank and performance of German Shepherd dogs from the
Southeast are compared against the results displayed for the West Coast (refer to chart
no. 2), a remarkable observation is easily recognized. Despite the consistency of a
prevalent favoritism among dog owners and its solid 101% standard performance in the
BIS for the German Shepherd dogs for the western region - similar to the Southeast
with one exception: unranked in San Francisco – a surprisingly and alarmingly broad
1
2
3
4
5
1
2
3
4
5
1
2
3
4
5
1
2
3
4
5
1
2
3
4
5
11%
26%
101%
24%
57%
11%
101%
24% 26%
6%
101%
24%
6% 11%
22%
11%
24%
101%
6%
57%
11%
101%
24% 26% 24%
0%
20%
40%
60%
80%
100%
120%
0
1
2
3
4
5
6
ATL ATL ATL ATL ATL BAL BAL BAL BAL BAL MIA MIA MIA MIA MIA ORL ORL ORL ORL ORL RAL RAL RAL RAL RAL
LR GR GSD YT BO LR GSD YT GR RO GSD YT RO LR FRB LR YT GSD CH BO LR GSD BE GR YT
2010 Popularity Ranking (1-5) BIS Percentage of Placing (historical)
Chart No. 1

Westminster Kennel Club Best in Show 2012 Champion Breed
correlation spread occurs from the most dominant BIS performance group: Poodles,
eclipsing the German Shepherd’s BIS percentage of total placing of 101% by 168%.
However, the most startling difference is seen in the regional ranking numbers for
the Poodle group. Out of the six metro areas selected for the West region, three of
them (Portland, San Francisco, and Seattle) have recorded a ranking for the breed
group of no lower than 4. Yet, more astonishing, this breed has won the Westminster
BIS top prize (9 titles) more than nearly every other breed or breed group, only to be
surpassed by the Wire Fox Terrier at a phenomenal record 13 wins.
Simply and somewhat strictly based on these graphical analyses alone, this
comparative observation is the first indication that a popularity ranking to BIS overall
wins total may be the weakest correlation of all the independent variables in this report.
Additionally, later in this report, further exploratory work and investigation will divulge
clear evidence that this slight anomaly may be attributed to characteristics or relative
aspects such as physical size, degree of personal maintenance, and expenditure and
may serve as the precursor to predicting future individual, or their correlating group,
winners. (The following chart list all-around winners throughout the history of the
Westminster BIS event.)
BREED
Best in Show All-
Around Winners BREED
Best in Show All-
Around Winners BREED
Best in Show All-
Around Winners BREED
Best in Show All-
Around Winners BREED
Best in Show All-
Around Winners
Afghan Hounds 2 Whippets 1 Whippets 1
West Highland
White Terriers 2
Siberian Huskies 1
Scottish Deerhound
s 1 Airedale Terriers 4
Airedale Terriers 4
Wire Fox Terriers 13
Standard Schnauzers 1
Bichons Frises 1
Bedlington Terriers 1
Bedlington Terriers 1 Papillons 1 Collies 1
Bulldogs 2 Bull Terriers 2 Bull
Terriers 2 Pekingese 3
German Shepherd
Dogs 1
Clumber Spaniels 1
Kerry Blue Terriers 1
Kerry Blue 1
Pomeranians 1
Old English Sheepdogs 2

Westminster Kennel Club Best in Show 2012 Champion Breed
Terriers
Cocker Spaniels 4
Lakeland Terriers 2
Lakeland Terriers 2 Pugs 1
Siberian Huskies 1
English Setters 1
Norwich Terriers 2
Norwich Terriers 2
Yorkshire Terriers 1
Standard Schnauzers 1
English Springer Spaniels 6
Scottish Terriers 8
Scottish Terriers 8
West Highland
White Terriers 2 Collies 1
German Shorthaired
Pointers 2 Sealyham Terriers 4
Sealyham Terriers 4
Wire Fox Terriers 13
German Shepherd
Dogs 1
Irish Water Spaniels 1
Skye Terriers 1
Skye Terriers 1 Poodles 9
Pointers 3 Smooth Fox
Terriers 4
Smooth Fox
Terriers 4 Boxers 4
Sussex Spaniels 1
Welsh Terriers 1
Welsh Terriers 1
Doberman Pinschers 4
Beagles 1 Whippets 1 Whippets 1 Newfoundla
nds 2
2010 U.S. Metropolitan Popularity Ranking Coded Matrix - West
Now that a brief overview of the type of determinants, methodologies, and course
of actions that will be considered from this point forward in the data analysis to narrow
the field of probable prospects that ultimately composed the final group from which the
2012 BIS winner was predicted at the conclusion of this research project have been
made, the second phase of the project to conduct testing and empirical analysis was to
11%
101%
26% 46% 57%
11%
101%
19% 6%
26% 46%
101%
11% 24% 26%
11%
101%
26% 6%
168%
11% 26% 24% 22%
168%
11% 26%
46%
101%
168%
1
2
3
4
5
1
2
3
4
5
1
2
3
4
5
1
2
3
4
5
1
2
3
4
5
1
2
3 3
4
0%
20%
40%
60%
80%
100%
120%
140%
160%
180%
0
1
2
3
4
5
6
DEN
DEN
DEN
DEN
DEN
HO
N
HO
N
HO
N
HO
N
HO
N LA LA LA LA LA
PO
R
PO
R
PO
R
PO
R
PO
R
SFO
SFO
SFO
SFO
SFO
SEA
SEA
SEA
SEA
SEA
LRGSDGR BU BO LRGSD SI CH GR BUGSDLR YT GR LRGSDGR CH PO LR GR YTFRBPO LR GR BUGSDPO
BIS Percentage of Placing (historical) 2010 Popularity Ranking (1-5)
Chart No. 2

Westminster Kennel Club Best in Show 2012 Champion Breed
carefully disseminate and organize all data and information that would be used for
various testing procedures into the 7 separate dog breed subgroups, as indicated earlier
in table no. 1 of this report.
The brunt of the report’s findings revolved around these subgroups and permitted
the best reliable statistical methodology to effectively compute and calculate all data
points for a successful outcome. Nonetheless, each of the following procedures will
describe and explain how the final group was selected, yet, must be prefaced first by
rendering a visual account of various facts and figures to aid in the comprehension of
final conclusion. Therefore, the heart of the analytical process will begin by giving a
comparative group account representing the number of breeds BIS overall winners)
registered during a 6-year period from 2001-2006. These statistical graphs will serve as
backdrop and guide throughout the remainder of this report.
AKC Breed Registration Totals Comparison Graph for Group I – Hound/Sporting:
Selective Observable Findings and Brief Comment: The 2010 BIS champion breed,
the Scottish Deerhound, experienced very few fluctuations in enrollment numbers
throughout this time period, except for a significant proportional decrease in 2006.
2006 BreedRegistration
2005 BreedRegistration
2004 BreedRegistration
2003 BreedRegistration
2002 BreedRegistration
2001 BreedRegistration
Afghan Hounds H 782 673 854 707 696 684
Scottish Deerhounds H 140 194 149 154 163 191
0
100
200
300
400
500
600
700
800
900
Breed Registration Comparison Group I - Hound/Sporting ( BIS Champion Based)

Westminster Kennel Club Best in Show 2012 Champion Breed
Conversely, the Afghan Hound has experienced a significantly wider year-to-year
deviation form 2003-2006, with a noticeable uptick in 2006.
AKC Breed Registration Totals Comparison Graph for Group I – Sporting/Hound:
Selective Observable Findings and Brief Comment: The graph shows a steady
decline in registration numbers for the Beagle breed from 2001-2006 and slight increase
fluctuations to near flat-line totals for the Whippet breed during the same period stretch.
2006 BreedRegistration
2005 BreedRegistration
2004 BreedRegistration
2003 BreedRegistration
2002 BreedRegistration
2001 BreedRegistration
Beagles S,H 39,484 42,592 44,555 45,021 44,610 50,419
Whippets S,H 1,836 1,749 1,849 1,874 1,775 1,685
0
5,000
10,000
15,000
20,000
25,000
30,000
35,000
40,000
45,000
50,000
55,000
Breed Registration Comparison Group I - Sporting/Hound (BIS Champion Based)

Westminster Kennel Club Best in Show 2012 Champion Breed
AKC Breed Registration Totals Comparison Graph for Group II – Sporting:
Selective Observable Findings and Brief Comment: Every breed in this group has
held steady in registration totals from 2001 through to 2006 with the alarming exception
for the Cocker Spaniel breed, an astonishing 42% decline during this time period.
2006Breed
Registration
2005Breed
Registration
2004Breed
Registration
2003Breed
Registration
2002Breed
Registration
2001Breed
Registration
Clumber Spaniels S 266 266 235 239 196 166
Cocker Spaniels S 14,790 16,343 18,553 19,020 20,655 25,445
English Setters S 629 657 700 662 617 721
English Springer Spaniels S 8,205 8,749 9,376 8,859 9,128 10,180
German Shorthaired Pointers S 12,822 13,273 12,799 12,266 12,174 12,884
Irish Water Spaniels S 113 127 127 144 116 126
Pointers S 467 384 512 519 535 519
Sussex Spaniels S 79 78 45 92 108 56
0
2,500
5,000
7,500
10,000
12,500
15,000
17,500
20,000
22,500
25,000
27,500
Axi
s Ti
tle
Breed Registration Comparison Group II - Sporting (BIS Champion Based)

Westminster Kennel Club Best in Show 2012 Champion Breed
AKC Breed Registration Totals Comparison Graph for Group IV – NonSporting/Hound:
Selective Observable Findings and Brief Comment: A less than popular breed in
prior years, the Bichon Frise group has experienced a meteoric rise from 2001 to 2006,
with a noticeable and gradual leveling off between 2005 and 2006. Conversely, the
Bulldog, one of the more popular breeds not only America but worldwide as well, has
experienced a slow, laborious decline during stretch of time.
2006 BreedRegistration
2005 BreedRegistration
2004 BreedRegistration
2003 BreedRegistration
2002 BreedRegistration
2001 BreedRegistration
Bichons Frises NS 7,839 9,184 9,796 9,409 9,706 10,969
Bulldogs NS 21,037 20,556 19,396 16,732 15,810 15,501
0
5,000
10,000
15,000
20,000
25,000
Breed Registration Comparison Group IV - NonSporting (BIS Champion Based)

Westminster Kennel Club Best in Show 2012 Champion Breed
AKC Breed Registration Totals Comparison Graph for Group V – Terrier:
Selective Observable Findings and Brief Comment: The largest group of all seven
classifications of dog breeds, the Terrier group, in general, experienced variable
fluctuations throughout the course of this time period, except for a substantial and highly
recognizable increase from the Bull Terrier breed group, now vastly becoming one of
America’s canine rising stars.
2006 BreedRegistration
2005 BreedRegistration
2004 BreedRegistration
2003 BreedRegistration
2002 BreedRegistration
2001 BreedRegistration
Airedale Terriers T 2,243 2,670 2,820 2,770 2,841 3,055
Bedlington Terriers T 192 275 208 251 217 203
Bull Terriers T 1,765 1,744 1,548 1,357 1,190 1,072
Kerry Blue Terriers T 361 442 488 475 464 395
Lakeland Terriers T 193 178 221 160 161 157
Norwich Terriers T 678 741 652 549 507 522
Scottish Terriers T 3,545 3,795 3,853 3,559 3,516 3,958
Sealyham Terriers T 68 75 76 75 89 70
Skye Terriers T 76 76 63 103 59 84
Smooth Fox Terriers T 522 481 553 553 589 669
Welsh Terriers T 705 724 805 739 617 673
West Highland White Terriers T 6,572 7,597 7,744 7,407 7,814 8,716
Wire Fox Terriers T 937 1,141 1,205 1,220 1,328 1,536
01,0002,0003,0004,000
5,0006,0007,000
8,0009,000
10,000
Axi
s Ti
tle
Breed Registration Comparison Group V- Terrier (BIS Champion Based)

Westminster Kennel Club Best in Show 2012 Champion Breed
AKC Breed Registration Totals Comparison Graph for Group VI – Toy/NonSporting:
Selective Observable Findings and Brief Comment: Dipping earlier in registration
numbers between 2001 and 2004, the Yorkshire Terrier breed has steadily climbed to
forefront of the Toy group as one today’s most popular breeds. None other breed within
this group has gained improvements in registration totals than the Yorkie. Most of the
other breeds in the group have marginally struggled to attain an increase in popularity
from the previous years, except for the slight uptick from the Papillon breed.
2006 BreedRegistration
2005 BreedRegistration
2004 BreedRegistration
2003 BreedRegistration
2002 BreedRegistration
2001 BreedRegistration
Papillons TY 5,673 6,005 6,019 5,143 4,547 4,438
Pekingese TY 3,155 3,441 4,335 4,768 5,822 7,798
Pomeranians TY 18,218 19,511 21,269 20,802 23,061 28,495
Pugs TY 20,008 22,064 23,152 21,337 21,774 23,769
Yorkshire Terriers TY 48,346 47,238 43,522 38,246 37,277 42,025
Poodles TY,NS 29,939 31,638 32,671 32,162 33,917 40,550
0
10,000
20,000
30,000
40,000
50,000
60,000
Axi
s Ti
tle
Breed Registration Comparison Group VI - Toy/NonSporting Group (BIS Champion Based)

Westminster Kennel Club Best in Show 2012 Champion Breed
AKC Breed Registration Totals Comparison Graph for Group VII – Working/Herding:
Selective Observable Findings and Brief Comment: Literally and figuratively a
workhorse breed, it is not surprising to notice a steady equilibrium from year to year in
registration numbers from this highly popular breed group. Although one of the more
engaging and family-friendly breeds today, the group has received relatively little
success as a recipient of the Westminster Best in Show’s title as the overall top canine
in the 104-year history of the event.
Breed Expenditures and Other Related Pricings:
In 2010 in the United States, there were a reported 65,168,000 dogs, an increase
of .74% from a year earlier, costing $18,362,200,000 in both dog and cat food – an
increase of 3.75% from a year ago, as well. These are other independent numerical
variables which may have played some influential role in this predictive analysis report.
2006 BreedRegistration
2005 BreedRegistration
2004 BreedRegistration
2003 BreedRegistration
2002 BreedRegistration
2001 BreedRegistration
Boxers W 35,388 37,268 37,741 34,130 34,340 37,035
Doberman Pinschers W 11,546 11,662 11,724 11,549 11,829 12,570
Newfoundlands W 3,415 3,493 3,505 3,134 3,121 2,911
Siberian Huskies W 9,342 9,452 10,566 10,660 12,350 14,915
Standard Schnauzers W 584 585 590 614 512 597
Collies W,HE 4,711 5,098 5,485 5,679 6,252 7,340
German Shepherd Dogs W,HE 43,575 45,014 46,046 52,520 46,963 51,625
Old English Sheepdogs W,HE 1,403 1,460 1,494 1,466 1,501 1,590
0
10,000
20,000
30,000
40,000
50,000
60,000
Axi
s Ti
tle
Breed Registration Comparison Group VII - Working/Herding (BIS Champion Based)

Westminster Kennel Club Best in Show 2012 Champion Breed
Yet, however, for the purposes of this research report, the most relevant information
regarding expenditures and pricings are those with reference to sale price of purebred
puppies (less than 8 months to 1 year old) and expected lifespan range and those
expenditures associated with it. It is here at this juncture in which basis of the argument
and original hypothesis is established to determine if there is sufficient evidence for
significance of correlation between sales price and expenditures, BIS performance
results, and breed ranking and registration figures.
Both dependent and independent variables were categorized and arranged in the
following manner:
Life Expectancy
(average yrs.)
Average Sales
Price (AKC Criteria)
Minimum Cost of
Ownership (Lifetime Cost per
Life Expectancy-
Average Years)
Minimum Cost of
Ownership (Annual
Cost Estimate)
Annual Minimum Cost to Average
Sales Price (%)
Maximum Cost of
Ownership (Lifetime Cost per
Life Expectancy-
Average Years)
Maximum Cost of
Ownership (Annual
Cost Estimate)
Annual Maximum
Cost to Average
Sales Price (#)
Annual Maximum
Cost to Average
Sales Price (%)
After executing a series of descriptive analysis procedures for these categories,
the one area obtained from the reports that may have been a precept indicator towards
comprehensive discoveries for subsequent analytical work in defining any meaning
correlation between the three primary groups was found in the Kurtosis results (see
related graphs below), which, due to a positive percentage number, would result in a
sharper bell curve that indicates a heavier distributive concentration of data points
around the median. The primary matter that is the focus of this section is the slight rise
of .22 percent in the Kurtosis output data for the variable labeled “Annual maximum
Cost to Average Sales Price Percentage” which could ultimately have been, in part

Westminster Kennel Club Best in Show 2012 Champion Breed
and partial, an influence throughout further data analysis in the trifold relational
observation study.
Total Percentage of Overall BIS Placing (per group)
BIS Overall Champions to Total Wins per Group Ratio
Annual Maximum Cost to Average Sales Price (%)
Mean 0.09 Mean 0.326278723 Mean 14.73899097
Standard Error 0.019663842 Standard Error 0.075097742 Standard Error 1.755692177
Median 0.075 Median 0.272412085 Median 14.77098485
Mode 0.06 Mode #N/A Mode #N/A
Standard Deviation 0.048166378 Standard Deviation 0.183951149 Standard Deviation 4.300549979
Sample Variance 0.00232 Sample Variance 0.033838025 Sample Variance 18.49473012
Kurtosis 2.827734839 Kurtosis 1.4205948 Kurtosis 0.218983267
Skewness 1.643011864 Skewness 1.250134803 Skewness -0.717441065
Range 0.13 Range 0.511530857 Range 11.43387939
Minimum 0.05 Minimum 0.138664202 Minimum 7.705864198
Maximum 0.18 Maximum 0.650195059 Maximum 19.13974359
Sum 0.54 Sum 1.957672337 Sum 88.43394582
Count 6 Count 6 Count 6
Largest(1) 0.18 Largest(1) 0.650195059 Largest(1) 19.13974359
Smallest(1) 0.05 Smallest(1) 0.138664202 Smallest(1) 7.705864198
Confidence Level(95.0%)
0.050547514 Confidence Level(95.0%)
0.193044892 Confidence Level(95.0%)
4.513150419
The next data analytical tool used to locate any central tendencies or points of
significance that involved price and expenditures matters was to execute a correlation
analysis to evaluate any semblance of a relationship between the three groups with
price and expenditure serving as the dependent variable. After initiating the correlation
procedure, some interesting results materialize which gave a clear strength of
percentage account of which pairs showed any viable significance that could be further
exploited. The results are depicted in the following table:
Correlation Analysis
Total Percentage of Overall
BIS Placing (per group)
BIS Overall Champions
- Percentage
of Total Wins per
Group
BIS Overall Champions
to Total Wins per
Group Ratio
Average Ranking
Percentage (Rank 1-
168)
Total Registration Percentage Difference ± (2001-2006)
Annual Minimum Cost to Average
Sales Price (%)
Annual Maximum
Cost to Average
Sales Price (%)
Total Percentage of Overall BIS Placing (per group) 1
BIS Overall Champions - Percentage of Total Wins per Group 0.4071189 1
BIS Overall Champions to Total Wins per Group Ratio 0.473127399
-0.522164252 1
Best in Show All-Around Winners (% of Total 0.454858826 0.991666742
-0.429129651

Westminster Kennel Club Best in Show 2012 Champion Breed
Wins)
Average Ranking Percentage (Rank 1-168)
-0.088387473 0.000356056 0.309306084 1
Total Registration Percentage Difference ± (2001-2006)
-0.743295797 0.00081565
-0.665569158 0.118174844 1
Annual Minimum Cost to Average Sales Price (%)
-0.652546871
-0.749365623
-0.077331219
-0.302942229 0.538094802 1
Annual Maximum Cost to Average Sales Price (%)
-0.393967411
-0.795022242 0.206560134
-0.271362159 0.318859867 0.901648929 1
Although there is, once again, stronger relationship preponderance established
between price/expenditure and registration and ranking, the results also displays a
marginal relationship between annual maximum cost to average sales price and best in
show all-around winners percentage total wins, a relationship which may also be a mere
reflection of the slight increase in the Kurtosis results mentioned earlier. These
discoveries were later recalled as possible determinants of influence which precluded
the final predictive analysis and assessment.
The last series of major data analytical tools used confirm these findings and
determine whether enough sufficient evidence is present to proceed to the next stage of
narrowing the list of probabilities down to a select few were the Multiple Regression
Analysis model and Multiple Stepwise Regression model.
In all three reports located below, utilizing Annual Maximum Cost to Average
Sales Price (%), each one indicated that the all final results were caused by no less
than 80% of the variables used to generate the report. In other words, less than 20% of
the final results were caused by variables other those used in the analysis. Neither the
FSTAT regression (FSTAT = 164.2906 > Fα = 0.0000), P–value for the Average Ranking
Percentage (1-168) of 0.0135, nor the Annual Minimum Cost to Average Sales Price
(%) were not significant enough to bear any relational effect for the regression analysis I
report..

Westminster Kennel Club Best in Show 2012 Champion Breed
Regression Analysis I - Annual Maximum Cost to Average Sales Price (%)
Regression Statistics
Multiple R 0.9287
R Square 0.8625
Adjusted R Square 0.8572
Standard Error 2.4007
Observations 137
ANOVA
df SS MS F Significance F
Regression 5 4734.2980 946.8596 164.2906 0.0000
Residual 131 754.9952 5.7633
Total 136 5489.2932
Coefficients Standard Error
t Stat P-value Lower 95% Upper 95%
Intercept 1.2525 0.6699 1.8695 0.0638 -0.0728 2.5778
Total Percentage of Overall BIS Placing (per group)
-2.1426 1.1223 -1.9091 0.0584 -4.3628 0.0776
Best in Show All-Around Winners (% of Total Wins)
5.6358 13.8988 0.4055 0.6858 -21.8593 33.1310
Average Ranking Percentage (Rank 1-168)
2.1087 0.8422 2.5036 0.0135 0.4425 3.7748
Total Registration Percentage Difference ± (2001-2006)
-2.3115 2.0226 -1.1428 0.2552 -6.3127 1.6898
Annual Minimum Cost to Average Sales Price (%)
22.6559 0.8463 26.7701 0.0000 20.9817 24.3302
Calculations
b5 through b0 intercepts 22.6559 -2.3115 2.1087 5.63583 -2.142617918
1.25248761
b5 through b0 Standard Error 0.8463 2.0226 0.8422 13.8988 1.122324763 0.66994344
R Square, Standard Error 0.8625 2.4007 #N/A #N/A #N/A #N/A
F, Residual df 164.2906 131 #N/A #N/A #N/A #N/A
Regression SS, Residual SS 4734.297975 754.9951912 #N/A #N/A #N/A #N/A
Confidence level 95%
t Critical Value 1.9782
Half Width b0 1.3253
Half Width b1 2.2202
Half Width b2 27.4952
Half Width b3 1.6662
Half Width b4 4.0012
Half Width b5 1.6742
The last of the analytical tools used prior to reducing the general population to a
select few, based on previous data and statistical analysis, is the covariance method to
strategically locate strength of percentage tendencies among individual breed groups
for whom either won the all-around BIS or placed in the event, strictly for the purposes
of identifying certain relational patterns that may provide clear cut favorites for the final
phase of the project.
Listed below on the next page is a series of illustrated examples of centralized
covariance tendencies tables for the breed groups, starting with the Hound group. The

Westminster Kennel Club Best in Show 2012 Champion Breed
reason for this exercise was done to quickly draw to a conclusion the final five that
would be chosen for the predictive decision and the breed group and individual breed
who will become crowned as the Westminster Best in Show for 2012. Most of the tallies
leading to this point have been calculated and formulated and the final five results have
been made.
From the original list including all certified Hounds accepted and approved by
both the American Kennel Club Association and the Westminster Kennel Club, the
Scottish Deerhound and the Beagle had the highest covariance relationship within its
group than any other breed within their respective group (see chart I below). Also
recognize a serendipitous key element from last year’s competition and it was the fact
that the Westminster BIS champion breed to win the overall competition came from the
Hound group, and that canine was none other than a Scottish Deerhound named
Hickory.
Hound Group Covariance Analysis Chart I
Basenjis Basset Hounds Borzois
Dachshunds
English Foxhoun
ds Harriers
Norwegian
Elkhounds
Rhodesian
Ridgebacks Salukis
Scottish Deerhou
nds
Afghan Hounds
Scottish Deerhounds
1544.833333
17163.91667
120.7222222
52848.77778
210.1111111
120.2222222
894.5833333
855.6388889
-103.333
333 420.472
2222
Beagles 594362.
6667 4931576
.917 78168.6
1111 1418684
7.72 43994.0
5556 31610.1
1111 304203.
4167 47051.1
9444 93382.1
6667 36197.3
6111
Whippets -5483
-69641.8
3333
-594.111
1111
-216417.
0556
-852.888
8889
-221.777
7778 -4249
-737.611
1111
-465.333
333
-1151.94
4444
Herding/Working Group Covariance Analysis Chart II
Bearded Collies
Belgian Sheepdogs
Cardigan Welsh Corgis
Bouviers des Flandres Collies
German Shepherd Dogs
Collies 46337.02778 25248.72222 -18843.3056 62030.94444 726548.4722 German Shepherd Dogs 132304.3611 89494.38889 22934.69444 128050.1111 2001493.972 11018720.47
Old English Sheepdogs 3044.388889 1953.111111 -1063.44444 4368.722222 45900.11111 116595.2778

Westminster Kennel Club Best in Show 2012 Champion Breed
NonSporting/Toy Group Covariance Analysis Chart III Bichons
Frises Boston Terriers
Chinese Shar-Pei
Chow Chows
Dalmatians Finnish Spitz
Keeshonden Lhasa Apsos
Schipperkes Tibetan Spaniels
Poodles 2803325 3352502 2264811 1360694 1442669 22989 426012.6 3426842 878528.8 207181.7
Terrier Group Covariance Analysis Chart IV
Bedlington Terriers
Border Terriers Bull Terriers Kerry Blue Terriers
Lakeland Terriers
Bull Terriers 1766.833 10553.33 69050.33 Lakeland Terriers -182.444 1026.722 3829.833 131.8333 521.2222 Norwich Terriers 793.1111 3742.944 21620.5 -628.083 1254.444
For the Stepwise Regression Analysis report, once again the FSTAT was greater
than the level of significance (.05), which means that the original general hypothesis,
which stated that the performance results of the BIS competition would not be affected
by the compilation of both registration totals and sales price and expenditure had to be
rejected.
However, a closer look at both Stepwise Regression models (I & II) results,
indicated in the charts below, clearly indicates that the p-values for BIS All-Around
winners, Average Ranking Percentage, and BIS Overall Placing Percentage showed
some levels of significance, meaning that the one-to-one relationship between the
dependent and independent variables involved in the analysis had enough evidence of
a cause and effect correlation that could be further explored. These favorable results
were enough to legitimize a continuance of the project research study and move
expediently towards the last few stages of the predictive analysis report to determine
next year’s champion breed group and individual canine.

Westminster Kennel Club Best in Show 2012 Champion Breed
Stepwise Regression Analysis I: Annual Maximum Cost to Average Sales Price (%)
Regression Statistics
Multiple R 0.8560
R Square 0.7327
Adjusted R Square 0.5546
Standard Error 2.8702
Observations 6
ANOVA
df SS MS F Significance F
Regression 2 67.7598 33.8799 4.1127 0.1382
Residual 3 24.7139 8.2380
Total 5 92.4737
Coefficients Standard Error
t Stat P-value
Lower 95% Upper 95%
Intercept 25.6796 4.1118 6.2454 0.0083 12.5942 38.7651
Best in Show All-Around Winners (% of Total Wins)
-660.3708 242.7785 -2.7201 0.0725 -1433.0003 112.2587
Average Ranking Percentage (Rank 1-168)
-3.1504 5.1441 -0.6124 0.5836 -19.5214 13.2206
Calculations
b2, b1, b0 intercepts -3.1504 -660.3708 25.6796
b2, b1, b0 Standard Error 5.1441 242.7785 4.1118
R Square, Standard Error 0.7327 2.8702 #N/A
F, Residual df 4.1127 3 #N/A
Regression SS, Residual SS 67.75975045 24.71390014 #N/A
Confidence level 95%
t Critical Value 3.1824
Half Width b0 13.0855
Half Width b1 772.6295
Half Width b2 16.3710
Stepwise Regression Analysis II: Annual Maximum Cost to Average Sales Price (%)
Regression Statistics
Multiple R 0.7987
R Square 0.6380
Adjusted R Square 0.3966
Standard Error 3.3405
Observations 6
ANOVA
df SS MS F Significance F
Regression 2 58.9967 29.4984 2.6435 0.2178
Residual 3 33.4769 11.1590
Total 5 92.4737
Coefficients Standard Error
t Stat P-value
Lower 95% Upper 95%
Intercept 22.8378 3.9667 5.7574 0.0104 10.2141 35.4616
Total Percentage of Overall BIS Placing (per group)
-7.5237 33.9574 -0.2216 0.8389 -115.5912 100.5438
BIS Overall Champions - Percentage of Total Wins per Group
-23.9965 11.9972 -2.0002 0.1393 -62.1769 14.1839
Calculations
b2, b1, b0 intercepts -23.9965 -7.5237 22.8378

Westminster Kennel Club Best in Show 2012 Champion Breed
b2, b1, b0 Standard Error 11.9972 33.9574 3.9667
R Square, Standard Error 0.6380 3.3405 #N/A
F, Residual df 2.6435 3 #N/A
Regression SS, Residual SS 58.99672155 33.47692904 #N/A
Confidence level 95%
t Critical Value 3.1824
Half Width b0 12.6237
Half Width b1 108.0675
Half Width b2 38.1804
BIS Group Finalist Covariance Analysis Chart I Bull
Terriers Clumber Spaniels Lakeland
Terriers Norwich Terriers
Papillons Sussex Spaniels
Bull Terriers 19.52042
Clumber Spaniels 27.40469 38.532945
Lakeland Terriers 18.71792 26.30683292 17.98054
Norwich Terriers 10.95784 15.37920294 10.51083 6.154686
Papillons 22.83003 32.07241054 21.90946 12.81477 26.74682
Sussex Spaniels 27.65886 38.89631749 26.56139 15.523 32.37415 39.26762
BIS Group Finalist Time Series and Trend-line Analysis Charts for Breed Groups II, V, & VI:
0
50
100
150
200
250
300
2000 2002 2004 2006 2008 2010 2012
Y
X
Group II - Sport/Hound: Clumber Spaniels
0
500
1000
1500
2000
2500
2000 2002 2004 2006 2008 2010 2012
Y
X
Group V - Terrier: Bull Terriers

Westminster Kennel Club Best in Show 2012 Champion Breed
0
50
100
150
200
250
2000 2002 2004 2006 2008 2010 2012
Y
X
Group V - Terrier: Lakeland Terriers
Lakeland Terriers
Poly. (Lakeland Terriers)
0
200
400
600
800
1000
2000 2002 2004 2006 2008 2010 2012
Y
X
Group V - Terrier: Norwich Terriers
Norwich Terriers
Poly. (Norwich Terriers)
0
1000
2000
3000
4000
5000
6000
7000
2000 2002 2004 2006 2008 2010 2012
Y
X
Group VI - Toy/NonSport: Papillons

Westminster Kennel Club Best in Show 2012 Champion Breed
0
20
40
60
80
100
120
2000 2002 2004 2006 2008 2010 2012
Y
X
Group II - Sport/Hound: Sussex Spaniels

Westminster Kennel Club Best in Show 2012 Champion Breed
V. Conclusion
The subject of prediction is sometimes a compromisingly difficult task to
accomplish at any one given moment, and to dive into this area, and depending on the
severity of the circumstance involved, is not for the faint of heart. Yet, in this data
analysis report, attempting to determine whether sufficient raw data and information
obtained on purebred canines, would provide enough source material to formulate a
credible thesis on a number of correlating factors involving probability, quality and
quantity regression, covariance and correlation, and other closely-related data analytical
concepts, tools, and methodologies can be a tricky proposition to manipulate and
master.
Yet, from this report, it was sufficiently clear that the three primary sectional
variable groups – BIS performance results, AKC ranking and registration totals, and
breed price and expenditures - that would serve as a research platform to conduct
various analyses, perform a variety of testing/hypothesized procedures, build and create
a litany of statistical analytical models to address and test the hypothesis were
significant enough to fully complete the study with much success and provide a
plausible outcome, under a standard confidence interval of significance throughout the
report of 95%.
Much like the weather and epicurean splurge or two at one’s favorite resort
casino, choosing a winner is a 50/50 proposition and the chances of selecting the right
one, no matter how scientifically meticulously pure the process may be leading up to the
final selection phase, is simply just that: a 50/50 proposition, right or wrong.
Nonetheless, the leap of faith associated with this report to determine the predictive

Westminster Kennel Club Best in Show 2012 Champion Breed
outcome in the final analysis is based on some scrutinized degree of careful and
detailed research study and analysis, intuition, and last, but more importantly, an
educated guess.
So, who was chosen to become Westminster Best in Show top dog for 2012?
Only the final six hold the answer to this question as next year’s favorite. And yet one
sole individual breed will reign supreme and firmly stand prideful and tall, on all fours, of
course, to be elevated as the winner.
However, before the decision is rendered, it would be helpful to recapitulate and
review which group and breed emerged throughout the various processes in the report.
First, the BIS performance record one particular group has dominated the event
throughout the history of the event. Second, with regard to AKC breed registration
analysis, there was remarkable and unquestionable evidence, again under a confidence
interval of significance of 95%, that one breed did experience a sharp and
distinguishable rise in registration numbers from 2001 to 2006. And third, further data
analysis indicated the combination of life-expectancy, original sales price, and average
life-time expenditures were unmatched and undervalued the prospective breed for next
year’s throne.
Therefore, without further fanfare and delay, based on this report’s thorough
investigated research and statistical data analysis, next year’s Westminster’s Best in
Show champion breed will emerge among the Terriers, and the proverbial and symbolic
congratulatory paw to be extended to the one dog to take top prize will be the Bull
Terrier.

Westminster Kennel Club Best in Show 2012 Champion Breed
Source Citations:
Literary Resources:
American Kennel Club Gazette (1995- ). The Official Journal for Sport of Purebred
Dogs. New York: American Kennel Club
World Almanac Book of Facts (1923-). World Almanac: Book of Facts. New York: Press
Pub. Co. (The New York World).
Web Resources:
Anonymous. Dog Registration Statistics. (2009, March). AKC Gazette, 126(3), 84-
85. Retrieved March 15, 2011, from General Interest Module.
OECD/Eurostat (2011). Statistical Portal. Retrieved February 10, 2011, from
http://www.oecd.org/document/
PetStew.com© (2011). Pet Stew: Puppy Finder and Sales Listing. Retrieved February
10, 2011, from http://www.petstew.com/index.html
PuppyFinder.com© (2001-2008). Puppy Finder: Breed Locator. Retrieved February 10,
2011, from http://www.puppyfinder.com/AboutUs.php
U.S. Bureau of Labor and Statistics (2010- ).Databases, Tables, and Calculators by
Subject. Retrieved February 10, 2011, from http://www.bls.gov/data
Westminster Kennel Club (2011). The Westminster Kennel Club. Retrieved February
10, 2011, from http://www.westminsterkennelclub.org

Westminster Kennel Club Best in Show 2012 Champion Breed
Appendages: Graphs and Charts
0%
20%
40%
60%
80%
100%
120%
140%
160%
180%
0.00% 2.00% 4.00% 6.00% 8.00% 10.00% 12.00% 14.00%Tota
l Pe
rce
nta
ge o
f O
vera
ll B
IS P
laci
ng
(pe
r gr
ou
p)
Best in Show All-Around Winners (% of Total Wins)
Best in Show All-Around Winners (% of Total Wins) Line Fit Plot
Total Percentage of Overall BIS Placing (pergroup)
Predicted Total Percentage of Overall BISPlacing (per group)
0%
20%
40%
60%
80%
100%
120%
140%
160%
180%
0% 500% 1000% 1500% 2000% 2500% 3000% 3500% 4000%Tota
l Pe
rce
nta
ge o
f O
vera
ll B
IS P
laci
ng
(pe
r gr
ou
p)
Annual Maximum Cost to Average Sales Price (%)
Annual Maximum Cost to Average Sales Price (%) Line Fit Plot
Total Percentage of Overall BIS Placing (pergroup)
Predicted Total Percentage of Overall BISPlacing (per group)

Westminster Kennel Club Best in Show 2012 Champion Breed
-0.6
-0.4
-0.2
0
0.2
0.4
0.6
0.8
1
0% 20% 40% 60% 80% 100% 120% 140% 160%
Re
sid
ual
s
Annual Minimum Cost to Average Sales Price (%)
Annual Minimum Cost to Average Sales Price (%) Residual Plot
-0.6
-0.4
-0.2
0
0.2
0.4
0.6
0.8
1
0% 500% 1000% 1500% 2000% 2500% 3000% 3500% 4000%
Re
sid
ual
s
Annual Maximum Cost to Average Sales Price (%)
Annual Maximum Cost to Average Sales Price (%) Residual Plot

Westminster Kennel Club Best in Show 2012 Champion Breed
-0.6
-0.4
-0.2
0
0.2
0.4
0.6
0.8
1
0% 2% 4% 6% 8% 10% 12% 14%
Re
sid
ual
s
Best in Show All-Around Winners (% of Total Wins)
Best in Show All-Around Winners (% of Total Wins) Residual Plot
0%
20%
40%
60%
80%
100%
120%
140%
160%
180%
0% 1000% 2000% 3000% 4000%Tota
l Pe
rce
nta
ge o
f O
vera
ll B
IS
Pla
cin
g (p
er
gro
up
)
Annual Maximum Cost to Average Sales Price (%)
Annual Maximum Cost to Average Sales Price (%) Line Fit Plot
Total Percentage of Overall BISPlacing (per group)
Predicted Total Percentage ofOverall BIS Placing (per group)
0
0.5
1
1.5
2
0 20 40 60 80 100 120
Tota
l Pe
rce
nta
ge o
f O
vera
ll B
IS P
laci
ng
(pe
r gr
ou
p)
Sample Percentile
Normal Probability Plot
Westminster Kennel Club Best in Show 2012 Champion Breed
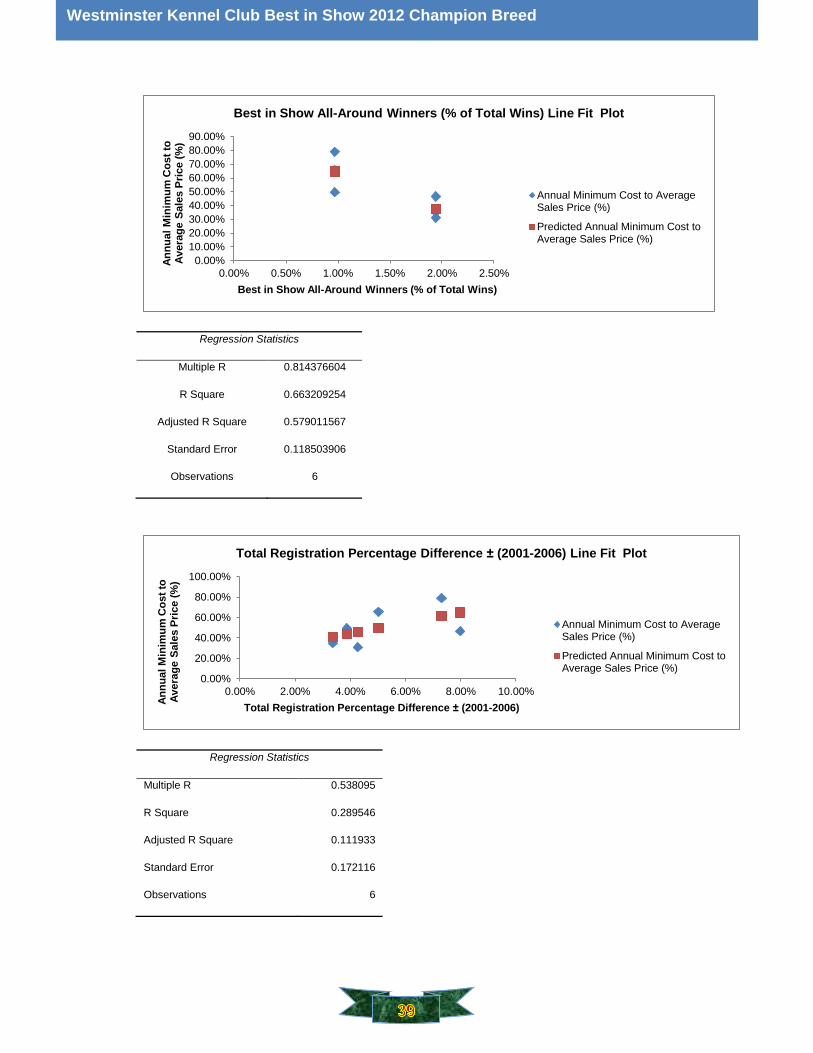
Regression Statistics
Multiple R 0.814376604
R Square 0.663209254
Adjusted R Square 0.579011567
Standard Error 0.118503906
Observations 6
Regression Statistics
Multiple R 0.538095
R Square 0.289546
Adjusted R Square 0.111933
Standard Error 0.172116
Observations 6
0.00%
10.00%
20.00%
30.00%
40.00%
50.00%
60.00%
70.00%
80.00%
90.00%
0.00% 0.50% 1.00% 1.50% 2.00% 2.50%
An
nu
al
Min
imu
m C
os
t to
A
vera
ge
Sale
s P
rice (
%)
Best in Show All-Around Winners (% of Total Wins)
Best in Show All-Around Winners (% of Total Wins) Line Fit Plot
Annual Minimum Cost to AverageSales Price (%)
Predicted Annual Minimum Cost toAverage Sales Price (%)
0.00%
20.00%
40.00%
60.00%
80.00%
100.00%
0.00% 2.00% 4.00% 6.00% 8.00% 10.00%
An
nu
al
Min
imu
m C
os
t to
A
vera
ge
Sale
s P
rice (
%)
Total Registration Percentage Difference ± (2001-2006)
Total Registration Percentage Difference ± (2001-2006) Line Fit Plot
Annual Minimum Cost to AverageSales Price (%)
Predicted Annual Minimum Cost toAverage Sales Price (%)