final project report on customer satisfaction on bsnl landline and mobile services
TRANSCRIPT

1.1 INTRODUCTION
Customer satisfaction, a business term is a measure of how products and
services supplied by a company meet or surpass customer expectation. It is seen
as a key performance indicator within business and is part of the four of a balanced
scorecard.
Increasing competition (whether for-profit or nonprofit) is forcing businesses
to pay much more attention to satisfying customers. In a competitive marketplace
where businesses compete for customers, customer satisfaction is seen as a key
differentiator and increasingly has become a key element of business strategy.
Organizations need to retain existing customers while targeting non-
customers. Measuring customer satisfaction provides an indication of how
successful the organization is at providing products and/or services to the
marketplace.
Customer satisfaction is an abstract concept and the actual
manifestation of the state of satisfaction will vary from person to person and
product/service to product/service. The state of satisfaction depends on a number
of both psychological and physical variables which correlate with satisfaction
behaviors such as return and recommend rate.
Customer satisfaction is the most common form of market research
in business-to-business markets and is often connected to quality and production
measurement, rather than as straight marketing based research. Before setting up
a customer satisfaction programmed, it is necessary to ensure that the
organization has the will to actually make changes for improvement; otherwise you
will simply be annoying customers by taking their time to collect information, then
not doing anything with it.
Customers or buyers are exposed to more of the world than ever before i.e
in the changing economy through cable and satellite television, the internet and
increased travel and as a result, their tastes and interests have broadened
dramatically. Moreover, the long economic dominance of the United States, Europe
and Japan is giving way, and economic power is increasingly shared with
developing economies.
Customer satisfaction survey further illuminates the relationship between
the customer experience and business performance. Around the world, consumers
1

expect better service quality. It confirms that consumers are more likely to leave a
provider because of poor service than for any other reason. It also reveals that
service quality is the most powerful factor, more influential than price in choosing
providers or to do business with them.
customer satisfaction ratings can have powerful effects. They focus
employees on the importance of fulfilling customers’ expectations. Furthermore,
when these ratings dip, they warn of problems that can affect sales and
profitability. These metrics quantify an important dynamic. When a brand has loyal
customers, it gains positive word-of-mouth marketing, which is both free and highly
effective. Therefore, it is essential for businesses to effectively manage customer
satisfaction. To be able do this, firms need reliable and representative measures of
satisfaction.
In researching satisfaction, firms generally ask customers whether their
product or service has met or exceeded expectations. Thus, expectations are a key
factor behind satisfaction. When customers have high expectations and the reality
falls short, they will be disappointed and will likely rate their experience as less
than satisfying. For this reason, a luxury resort, for example, might receive a lower
satisfaction rating than a budget motel—even though its facilities and service
would be deemed superior in 'absolute' terms.
Customer satisfaction provides a leading indicator of consumer purchase
intentions and loyalty. Customer satisfaction data are among the most frequently
collected indicators of market perceptions. Their principal use is twofold.
Within organizations, the collection, analysis and dissemination of these
data send a message about the importance of tending to customers and ensuring
that they have a positive experience with the company’s goods and services.
Although sales or market share can indicate how well a firm is performing
currently, satisfaction is perhaps the best indicator of how likely it is that the firm’s
customers will make further purchases in the future. Much research has focused on
the relationship between customer satisfaction and retention. Studies indicate that
the ramifications of satisfaction are most strongly realized at the extremes." On a
five-point scale, "individuals who rate their satisfaction level as '5' are likely to
become return customers and might even evangelize for the firm. (A second
important metric related to satisfaction is willingness to recommend. This metric is
defined as "The percentage of surveyed customers who indicate that they would
recommend a brand to friends." When a customer is satisfied with a product, he or
2

she might recommend it to friends, relatives and colleagues. This can be a powerful
marketing advantage.) "Individuals who rate their satisfaction level as '1,' by
contrast, are unlikely to return. Further, they can hurt the firm by making negative
comments about it to prospective customers. Willingness to recommend is a key
metric relating to customer satisfaction.
The BSNL, which is the Government origination, is successful because of
mass survey conducted through the sales force. By following different effective
strategies and planning procedures it is running its business successfully. So it is
enjoying high customer loyalty as there is high customer satisfaction. Hence
customer satisfaction is one of the key elements for achieving good results.
3

1.2 NEED FOR THE STUDY
In the modern era building customer satisfaction and loyalty is a key we say
to profitable business. The current trend for businesses is to become 'customer-
centric', that is, to put the customer at the center of our business in terms of our
strategies, actions and processes. Many organizations now approach the 'lifetime
value' of customers and seek to increase it.
The importance of customer satisfaction was a hot business topic in the
1980s, as customer satisfaction was considered the best window into loyalty. It
seems self-evident that companies should try to satisfy their customers. Satisfied
customers usually return and buy more, they tell other people about their
experiences.
A market trader has a continuous finger on the pulse of customer
satisfaction. Direct contact with customers indicates what he is doing right or
where he is going wrong. Such informal feedback is valuable in any company but
hard to formalize and control in anything much larger than a corner shop. For this
reason surveys are necessary to measure and track customer satisfaction.
In customer satisfaction research we seek the views of respondents on a
variety of issues that will show how the company is performing and how it can
improve. It is wise to cross check the internal views with a small number of depth
interviews with customers. In any customer satisfaction survey there will be quick
fixes – actions that can be taken today or tomorrow that will have immediate effect.
The purpose of customer satisfaction research is to improve customer
satisfaction and yet so often surveys sit collecting dust. Worse than that, customers
have generously given their time to assist in the survey believing that some
positive action will take place. Their expectations will have been raised. The
process of collecting the data seems easier than taking action to improve
satisfaction levels.
The key to customer retention is customer delightment. A highly satisfied
customer stays loyal longer, talks favorably about the organization and its
products; offers product or service ideas to the organization and costs less to serve
the new customers. Today more organizations are recognizing the importance of
satisfying and retaining current customers.
4
It is not enough to be skillful in attracting new customers, the organization
must keep them. Today’s organization must pay closer attention to the customer
defection rate (the rate at which they lose customer).
Here in case of BSNL thus the need for study on customer satisfaction is
important since it is highly depending on the customer opinions and expectations
there by using that information to change its strategies.
1.3 OBJECTIVES OF THE STUDY5

1. To study the overview of B.S.N.L
2. To determine customer preferences of landline and mobile
services.
3. To evaluate the customer satisfaction level for mobile services as well as
landline services.
4. To analyze the customer opinion and satisfaction with specific reference to
BSNL.
5. To suggest some guidelines for BSNL in order to provide better focused
services.
1.4 METHODOLOGY OF THE STUDY
6

Marketing research is the “Systematic design, collection, analysis, and
reporting of data and finding relevant to a specific Marketing situation facing the
company.”
Data collection is the most important task for a company to stay in the
market for long time. The accuracy of the collected data is of great significance for
drawing correct and valid conclusions from the investigation. Data can be collected
in territorial sources.
Primary data: The primary data are collected through the help of the
structured questionnaire prepared by the researcher.
Secondary data: The secondary data are usually of two types internal
and external.
o Internal records of the company are used as the point of the
marketing research. This includes information about the product
being researched, its history, company’s background, market share,
and competitors’ information. These types of information were
collected from the marketing department, sales department and
corporate cell for marketing intelligence in the company.
o External secondary data contains information available from public
sources such as business newspapers, business magazines. A
prominent source of data is the CMIE or Centre for Monitoring Indian
Economy, which publishes monthly reports on various aspects of
Indian economy and Industry.
Sample size:
A sample size of 200 people was taken by the researcher to accomplish the survey.
Allocation of the total sample size
Young people(18yrs to
25yrs)
Middle aged(25yrs to
45yrs)
Middle and old(above
45 yrs)
90 75 35
Methods used for collection of data:
Survey: This technique of data collection has already been discussed
about above in the report. It was conducted in person that is by meeting the
7

person personally, over telephone, and even my mail. The main disadvantage of
conducting surveys over telephone or mail is that the facial expression, body
language of the respondent can’t be observed. Moreover the level of reliability on
the results of such surveys is very less and is prone to incorrect results. So
approximately 80% of the surveys conducted were by meeting persons personally.
The questionnaire used for the survey is in the Annexure part of the report.
The field work was done by me at different places like homes, offices, shops, etc.
The surveys were done in the office time, so that it is possible to meet every one.
Observation: Observation is a technique where the consumer’s behavior
is recorded, usually without his/ her knowledge. So according to the definition it is
clear that in this technique of data collection they are more inclined towards BSNL
or any other like the main competitors of BSNL like the bharti Airtel , Vodafone,
TATA, Reliance, etc.
Qualitative technique: This technique included word association where
the respondent was asked for a word that comes to his / her mind after thinking
of the brand BSNL.
Experimentation: In this I measured the effect of one or more variables
by changing the level of some variables, and measuring the effects.
1.5 LIMITATIONS OF THE STUDY
1. We have collected only 200 samples due to shortage of time.
2. We weren’t able to get proper response from some samples.
8

3. Some of the information are difficult to gather due to professional
obligations.
4. Sample result may not resemble with population.
5. Study has been restricted to some areas of Visakhapatnam only.
9
2.1 History of Telecom Industry in India
The Indian Telecommunications industry is the world's fastest growing
telecommunications industry, with 962.82 Million telephone (landlines and mobile)
subscribers and 929.37 Million mobile phone connections as of May 2012. It is also
the second largest telecommunication network in the world in terms of number of
wireless connections after China. The Indian Mobile subscriber base has increased
in size by a factor of more than one hundred since 2001 when the number of
subscribers in the country was approximately 5 million to 962.82 million as on 30th
June, 2012.
As the fastest growing telecommunications industry in the world, it is
projected that India will have 1.159 billion mobile subscribers by 2013.
Furthermore, projections by several leading global consultancies indicate that the
total number of subscribers in India will exceed the total subscriber count in the
China by 2013. The industry is expected to reach a size of 344,921 crore
(US$74.85 billion) by 2012 at a growth rate of over 26 per cent, and generate
employment opportunities for about 10 million people during the same period.
According to analysts, the sector would create direct employment for 2.8 million
people and for 7 million indirectly. In 2008-09 the overall telecom equipments
revenue in India stood at 136,833 crore (US$29.69 billion) during the fiscal, as
against 115,382 crore (US$25.04 billion) a year before. Indian telecom operators
added a staggering 227.27 million wireless subscribers in the 12 months between
Mar 2010 and Mar 2011 averaging at 18.94 million subscribers every month. To put
this into perspective, China which currently possesses the world's largest
telecommunications network added 119.2 million wireless subscribers during the
same period (March 2010 - March 2011).
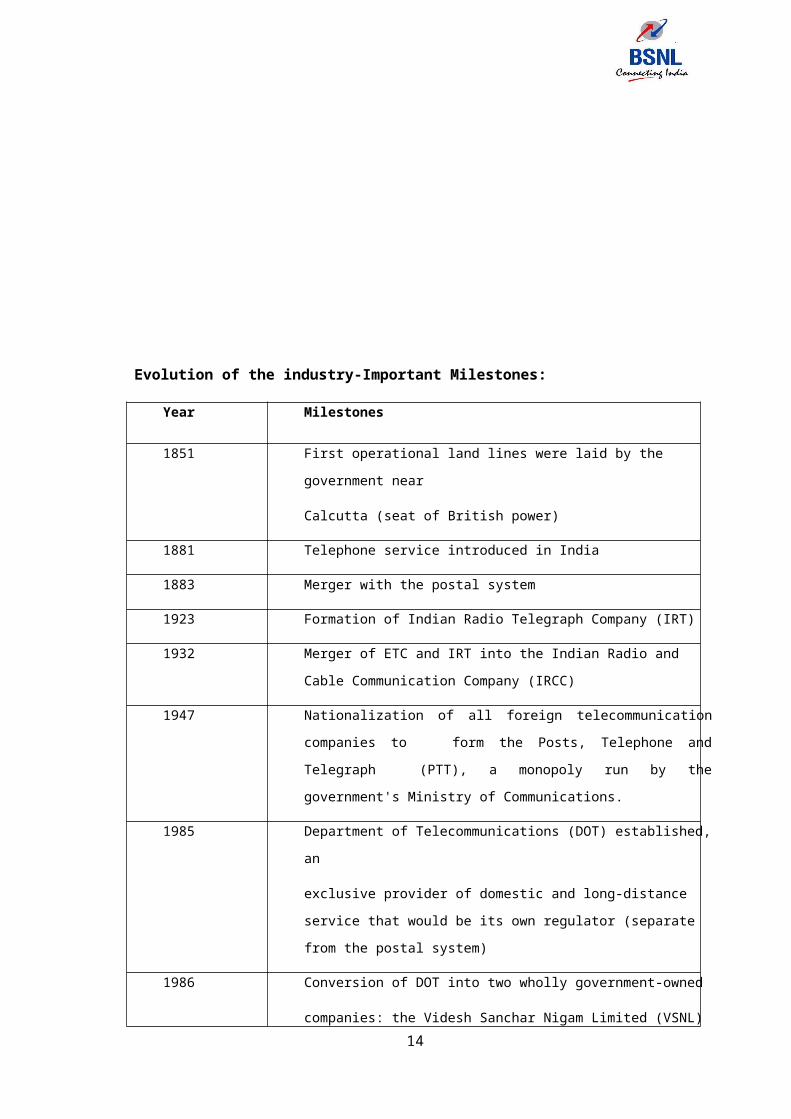
Evolution of the industry-Important Milestones:10

Year Milestones
1851 First operational land lines were laid by the government
near
Calcutta (seat of British power)
1881 Telephone service introduced in India
1883 Merger with the postal system
1923 Formation of Indian Radio Telegraph Company (IRT)
1932 Merger of ETC and IRT into the Indian Radio and Cable
Communication Company (IRCC)
1947 Nationalization of all foreign telecommunication companies
to form the Posts, Telephone and Telegraph (PTT), a
monopoly run by the government's Ministry of
Communications.
1985 Department of Telecommunications (DOT) established, an
exclusive provider of domestic and long-distance service
that would be its own regulator (separate from the postal
system)
1986 Conversion of DOT into two wholly government-owned
companies: the Videsh Sanchar Nigam Limited (VSNL) for
international telecommunications and Mahanagar Telephone
Nigam Limited (MTNL) for service in metropolitan areas.
1997 Telecom Regulatory Authority of India created.
1999 Cellular Services are launched in India. New National
Telecom Policy is adopted.
2000 DOT becomes a corporation, BSNL.
MAJOR PLAYERS:
11

There are three types of players in telecom services:
State owned companies (BSNL and MTNL)
Private Indian owned companies (Reliance Infocomm, Tata Teleservices)
Foreign invested companies (Hutchison-Essar, Bharti Tele-Ventures, Escotel,
Idea Cellular, BPL Mobile, and Spice Communication
Telecommunications Regulatory Environment in India:
LIRNEasia’ Telecommunications Regulatory Environment (TRE) index, which
summarizes stakeholders’ perception on certain TRE dimensions, provides insight
into how conducive the environment is for further development and progress. The
most recent survey was conducted in July 2008 in eight Asian countries, including
Bangladesh, India, Indonesia, Sri Lanka, Maldives, Pakistan, Thailand, and the
Philippines. The tool measured seven dimensions: i) market entry; ii) access to
scarce resources; iii) interconnection; iv) tariff regulation; v) anti-competitive
practices; and vi) universal services; vii) quality of service, for the fixed, mobile and
broadband sectors.
Modern growth:
A large population, low telephony penetration levels, and a rise in consumers'
income and spending owing to strong economic growth have helped make India the
fastest-growing telecom market in the world. The first operator is the state-owned
incumbent BSNL. BSNL was created by corporatization of the erstwhile Indian
Telecommunication Service, a government unit responsible for provision of telephony
services. Subsequently, after the telecommunication policies were revised to allow
private operators, companies such as Vodafone, Bharti Airtel, Tata Indicom, Idea
Cellular, Aircel and Loop Mobile have entered the space. See mobile operators in India.
In 2008-09, rural India outpaced urban India in mobile growth rate. Bharti Airtel now is
the largest telecom company in India.
India's mobile phone market is the fastest growing in the world, with
companies adding some 18.98 million new customers in June 2012.
The total number of telephones in the country crossed the 962.82 million
mark in June 2012. The overall tele-density has increased to 78.55% by June 2012.
In the wireless segment, 0.56 million subscribers were added in June 2012. The
total wireless subscribers (GSM, CDMA & WLL (F)) base is more than 931.42 million
now. The wireline segment subscriber base stood at 35.43 million with a decline of
0.14 million as of June 2012.
12

HISTORY:
Telecom in the real sense means transfer of information between two
distant points in space. The popular meaning of telecom always involves electrical
signals and nowadays people exclude postal or any other raw telecommunication
methods from its meaning. Therefore, the history of Indian telecom can be started
with the introduction of telegraph.
INTRODUCTION OF TELEGRAPH:
The postal and telecom sectors had a slow and uneasy start in India. In
1850, the first experimental electric telegraph Line was started between Kolkata
and Diamond Harbor. In 1851, it was opened for the British East India Company.
The Posts and Telegraphs department occupied a small corner of the Public Works
Department, at that time. Construction of 4,000 miles (6,400 km) of telegraph lines
connecting Kolkata (Calcutta) and Peshawar in the north along with Agra, Mumbai
(Bombay) through Sandra Ghats, and Chennai in the south, as well as Ootacamund
and Bangalore was started in November 1853. Dr. William O'Shaughnessy, who
pioneered telegraph and telephone in India, belonged to the Public Works
Department. He worked towards the development of telecom throughout this
period.
A separate department was opened in 1854 when telegraph facilities were
opened to the public.
INTRODUCTION OF THE TELEPHONE:
In 1880, two telephone companies namely The Oriental Telephone Company
Ltd. and The Anglo-Indian Telephone Company Ltd. approached the Government of
India to establish telephone exchanges in India. The permission was refused on the
grounds that the establishment of telephones was a Government monopoly and
that the Government itself would undertake the work. In 1881, the Government
later reversed its earlier decision and a license was granted to the Oriental
Telephone Company Limited of England for opening telephone exchanges at
Calcutta, Bombay, Madras and Ahmadabad and the first formal telephone service
was established in the country. 28 January 1882, is a Red Letter Day in the history
of telephone in India. On this day Major E. Baring, Member of the Governor General
of India's Council declared open the Telephone Exchanges in Calcutta, Bombay and
Madras. The exchange in Calcutta named "Central Exchange" was opened at third
floor of the building at 7, Council House Street.
13
FURTHER DEVELOPMENTS
A Mobile Phone Tower:
1902 - First wireless telegraph station established between Sagar Islands
and Sand heads.
1907 - First Central Battery of telephones introduced in Kanpur.
1913-1914 - First Automatic Exchange installed in Shimla.
23 July 1927 - Radio-telegraph system between the UK and India, with Imperial
Wireless Chain beam stations at Khadki and Daund, inaugurated by Lord Irwin
by exchanging greetings with King George
1933 - Radiotelephone system inaugurated between the UK and India.
1953 - 12 channel carrier system introduced.
1960 - First subscriber trunk dialing route commissioned between Lucknow
and Kanpur.
1975 - First PCM system commissioned between Mumbai City and Andheri
telephone exchanges.
1976 - First digital microwave junction introduced.
1979 - First optical fibre system for local junction commissioned at Pune.
1980 - First satellite earth station for domestic communications established at
Secunderabad, A.P..
1983 - First analog Stored Program Control exchange for trunk lines
commissioned at Mumbai.
1984 - C-DOT established for indigenous development and production of
digital exchanges.
1985 - First mobile telephone service started on non-commercial basis in
Delhi.
While all the major cities and towns in the country were linked with telephones during
the British period, the total number of telephones in 1948 was only around 80,000.
Even after independence, growth was extremely slow. The telephone was a status
symbol rather than being an instrument of utility. The number of telephones grew
leisurely to 980,000 in 1971, 2.15 million in 1981 and 5.07 million in 1991, the year
economic reforms were initiated in the country.
Emergence as a major player:
In 1975, the Department of Telecom (DoT) was separated from Indian Post &
Telecommunication Accounts and Finance Service. DoT was responsible for telecom
services in entire country until 1985 when Mahanagar Telephone Nigam Limited
14

(MTNL) was carved out of DoT to run the telecom services of Delhi and Mumbai. In
1990s the telecom sector was opened up by the Government for private
investment as a part of Liberalization-Privatization-Globalization policy. Therefore, it
became necessary to separate the Government's policy wing from its operations
wing. The Government of India corporatized the operations wing of DoT on 1
October 2000 and named it as Bharat Sanchar Nigam Limited (BSNL). Many
private operators, such as Reliance Communications, Tata Indicom, Vodafone, Loop
Mobile, Airtel, Idea etc., successfully entered the high potential Indian telecom
market.
Revenue and growth:
The total revenue in the telecom service sector was 86,720 crore (US$18.8
billion) in 2005-06 as against 71,674 crore (US$15.6 billion) in 2004-2005,
registering a growth of 21%. The total investment in the telecom services sector
reached 200,660 crore (US$43.5 billion) in 2005-06, up from 178,831 crore
(US$38.8 billion) in the previous fiscal.
Telecommunication is the lifeline of the rapidly growing Information
Technology industry. Internet subscriber base has risen to 100 million in 2010. Out
of this 10.52 million were broadband connections. More than a billion people use
the internet globally.
Under the Bharat Nirman Programme, the Government of India will ensure
that 66,822 revenue villages in the country, which have not yet been provided with
a Village Public Telephone (VPT), will be connected. However doubts have been
raised about what it would mean for the poor in the country.
It is difficult to ascertain fully the employment potential of the telecom
sector but the enormity of the opportunities can be gauged from the fact that there
were 3.7 million Public Call Offices in December 2005 up from 2.3 million in
December 2004.
The value added services (VAS) market within the mobile industry in India has
the potential to grow from US$500 million in 2006 to a whopping US$10 billion by
2009.
Next generation networks:
In the Next Generation Networks, multiple access networks can connect
customers to a core network based on IP technology. These access networks
15
include fiber optics or coaxial cable networks connected to fixed locations or
customers connected through Wi-Fi as well as to 3G networks connected to mobile
users. As a result, in the future, it would be impossible to identify whether the next
generation network is a fixed or mobile network and the wireless access broadband
would be used both for fixed and mobile services. It would then be futile to
differentiate between fixed and mobile networks – both fixed and mobile users will
access services through a single core network.
Indian telecom networks are not so intensive as developed country’s
telecom networks and India's teledensity is low only in rural areas. 670,000 route
kilometers (419,000 miles) of optical fibres has been laid in India by the major
operators, even in remote areas and the process continues. BSNL alone has laid
optical fibre to 30,000 Telephone Exchanges out of their 36 Exchanges. Keeping in
mind the viability of providing services in rural areas, an attractive solution appears
to be one which offers multiple service facility at low costs. A rural network based
on the extensive optical fibre network, using Internet Protocol and offering a variety
of services and the availability of open platforms for service development, viz. the
Next Generation Network, appears to be an attractive proposition. Fibre network
can be easily converted to Next Generation network and then used for delivering
multiple services at cheap cost.
Mobile Number Portability (MNP):
TRAI announced the rules and regulations to be followed for the
Mobile Number Portability in their draft release on 23 September 2009. Mobile
Number Portability (MNP) allows users to retain their numbers, while shifting to a
different service provider provided they follow the guidelines set by TRAI. Once a
customer changes his/her service provider & retaining the same mobile number
they are expected to hold Thiele number with a given provider for at least 90 days,
before they decide to move to another service provider. This restriction is set in
place to keep a check on exploitation of MNP services provided by the service
providers.
As per news reports, Government of India decided to implement MNP
from December 31, 2009 in Metros & category ‘A’ service areas and by March 20,
2010 in rest of the country.
It has been postponed to March 31, 2010 in Metros & category 'A'
service areas. However, time and time again, lobbying by the state-run firms, BSNL
and MTNL has resulted in innumerable delays in the implementation of Mobile
16

Number portability. The latest reports suggest BSNL and MTNL are finally ready to
implement the Mobile Number Portability by October 31, 2010.
A press release by the Department of Telecommunications on 30 June
2010 said "Keeping the complexity and enormity of the testing involved before MNP
is implemented and keeping in view the present status of implementation by
various operators, it has now been decided to extend the time line for
implementation of MNP to 31st October 2010."
The latest official report is that Mobile Number Portability will be
phased in slowly, starting with Haryana which will have MNP on or soon after
November 1, 2010.
A news report on 25 November 2010 said Mobile Number Portability
(MNP) was finally launched in Haryana. The MNP service inaugurate by the Union
Minister of Communications & IT Mr. Kapil Sibal by making the inaugural call to Shri
Bhupindrer Singh Hooda, the Chief Minister of Haryana from a ported mobile
number in function held at Rohtak city.
International:
Nine satellite earth stations - 8 Intelsat (Indian Ocean) and 1 Inmarsat (Indian
Ocean region).
Nine gateway exchanges operating from Mumbai, New Delhi, Kolkata,
Chennai, Jalandhar, Kanpur, Gandhinagar, Hyderabad and Ernakulam
Submarine cables:
LOCOM linking Chennai to Penang, Malaysia.
India-UAE cable linking Mumbai to Al Fujayrah, UAE.
SEA-ME-WE 2 (South East Asia-Middle East-Western Europe 2)
SEA-ME-WE 3 (South East Asia-Middle East-Western Europe 3) - Landing sites
at Cochin and Mumbai. Capacity of 960 Gbit/s.
SEA-ME-WE 4 (South East Asia-Middle East-Western Europe 4) - Landing sites
at Mumbai and Chennai. Capacity of 1.28 Tbit/s.
TIISCS (Tata Indicom India-Singapore Cable System), also known as TIC (Tata
Indicom Cable), Chennai to Singapore. Capacity of 5.12 Tbit/s.
i2i - Chennai to Singapore. Capacity of 8.4 Tbit/s.
SEACOM from Mumbai to the Mediterranean, via South Africa. It currently joins
with SEA-ME-WE 4 off the west coast of Spain to carry traffic onward to London
(2009). Capacity of 1.28 Tbit/s.
17

I-ME-WE (India-Middle East-Western Europe) with two landing sites at Mumbai
(2009). Capacity of 3.84 Tbit/s.
EIG (Europe-India Gateway), landing at Mumbai (due Q2 2010).
MENA (Middle East North Africa).
TGN-Eurasia (Announced) Landing at Mumbai (due 2010?), Capacity of 1.28
Tbit/s
TGN-Gulf (Announced) Landing at Mumbai (due 2011?), Capacity Unknown.
Telephone statistics:
Telephone subscribers (wireless and landline): 995.9 million
(May 2012)
Land lines: 31.53 million (May 2012)
Cell phones: 929.37 million (May 2012)
Monthly cell phone addition: 8.35 million (May 2012)
Teledensity: 79.28% (May 2012)
Annual cell phone addition: 227.27 million (March 2010 - 2011)
Projected teledensity: 1.159 billion, 97% of population by 2013.
18

ORGANIZATION PROFILE
Type Communication service provider
Availability Countrywide except Delhi& Mumbai
Owner The government of India
Key people S.D. Saxena (CFO);Dr. Ajay Data (CEO)
Founded 19th century, incorporated 2000
Website www.bsnl.in
19

2.2 GENESIS AND GROWTH
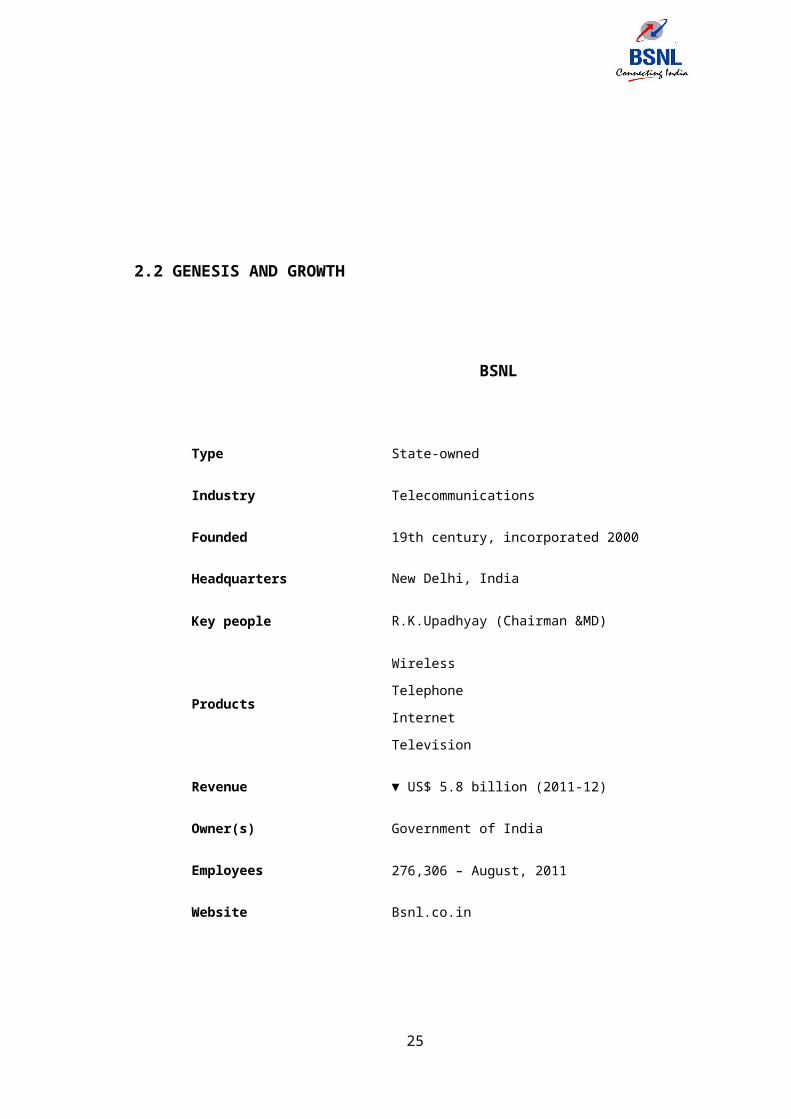
BSNL
Type State-owned
Industry Telecommunications
Founded 19th century, incorporated 2000
Headquarters New Delhi, India
Key people R.K.Upadhyay (Chairman &MD)
Products
Wireless
Telephone
Internet
Television
Revenue ▼ US$ 5.8 billion (2011-12)
Owner(s) Government of India
Employees 276,306 – August, 2011
Website Bsnl.co.in
INTRODUCTION20
BSNL is one of the largest Indian cellular service providers, with over 119.99
million subscribers as of June 2012, and the largest land line telephone provider in
India. However, in recent years the company's revenue and profit plunged into heavy
losses due to intense competition in the Indian telecommunications sector.
BSNL is India's oldest and largest communication service provider (CSP). It had a
customer base of 90 million as of June 2008. It has footprints throughout India except
for the metropolitan cities of Mumbai and New Delhi, which are managed by
Mahanagar Telephone Nigam Limited (MTNL). As of June, 2012, BSNL had a customer
base of 40.60 million wireline and 98.28 million wireless subscribers.
BSNL provides almost every telecom service, however following are the main Telecom
Services being provided by BSNL in India:-
1) BSNL Landline: BSNL is the largest telecom operator in India and is known to
everybody for Basic Telephony Services for over 100 years. Presently the Plain old,
Countrywide telephone service is being provided through 32,000 electronic
exchanges, 326 Digital Trunk Automatic Exchanges (TAX), Digitalized Public Switched
Telephone Network (PSTN) all interlinked by over 2.4 lakh km of Optical Fiber Cable,
with a host of Phone Plus value additions to our valued Customers. BSNL's
telephony network expands throughout the vast expanses of the country reaching to
the remotest part of the country.
2) BSNL Mobile: India's fastest growing cellular service, along with postpaid and
prepaid services brings cellular telephony to the masses, through innovative
technology and strategic pricing. This ambitious service uses state-of-the-art GSM
technology to attain global excellence and leadership in business. Our entry into this
sector has brought GSM cellular service at an affordable cost to the common man. All
serving a single objective, to provide better communication to millions across India.
Customers have reposed tremendous faith in BSNL and it has enrolled over 30 Lakh
Cellular customers within ten months of launch of Cellular service, an unprecedented
mark in Indian Cellular Market.
3) BSNL WLL-M: BSNL WLL-M is a communication system that connects customers
to the The BSNL Landline network using radio frequency signals instead of
conventional copper wires, for the full or part connection between the subscriber and
the exchange This comes with superior voice quality and high speed data capabilities.
CDMA is popular with more than 100 million subscribers worldwide, and the number
keeps on increasing exponentially.
21
4) Internet Services: BSNL is India's no. 1 Internet service provider with more
than 17 lakh subscribers, providing Internet service throughout the entire country
(except in New Delhi and Mumbai) under the brand name of "Sancharnet".
Sancharnet provides free all India roaming and enables it's users to access their
accounts, using the same access code (172233) and user ID from anywhere in the
Country. In order to make Internet available throughout the length and breadth of the
Country Internet Dhabas are being commissioned at all the Block Headquarters. BSNL
has also started DIAS and Account free internet access (CLI based) facility on few
select cities recently.
5) BSNL Broadband: BSNL is in the process of commissioning of a world class,
multi-gigabit, multi-protocol, convergent IP infrastructure through National Internet
Backbone-II (NIB-II), that will provide convergent services through the same backbone
and broadband access network. The Broadband service will be available on DSL
technology (on the same copper cable that is used for connecting telephone), on a
countrywide basis spanning 198 cities. In terms of infrastructure for broadband
services NIB-II would put India at par with more advanced nations. The services that
would be supported includes always-on broadband access to the Internet for
residential and business customers, Content based services, Video multicasting,
Video-on-demand and Interactive gaming, Audio and Video conferencing, IP
Telephony, Distance learning, Messaging: plain and feature rich, Multi-site MPLS VPNs
with Quality of Service (QoS) guarantees. The subscribe will be able to access the
above services through Subscriber Service Selection System (SSSS) portal.
6) Intelligent Network (IN): BSNL provides IN services offers value-added
services, such as Free Phone Service (FPH), India Telephone Card (Prepaid card),
Account Card Calling (ACC), Virtual Private Network (VPN), Tele-voting, Premium Rae
Service (PRM), Universal Access Number (UAN) and more.
7) 3G: BSNL offers the '3G' or the'3rd Generation' services which includes facilities
like video calling, live TV, 3G Video portal, streaming services like online full length
movies and video on demand etc.
8) FTTH: Fibre To The Home facility that offers a higher bandwidth for data transfer.
This idea was proposed on post-December 2009.
9) Helpdesk: BSNL's Helpdesk (Helpdesk) provide help desk support to their
customers for their services.
Future Plans:
22

Connect villages having 1,000 and above population
During the next 2 years (2010 – 2012), BSNL plans to provide large number
of phone connections and Broadband connections on ADSL as well as
Wireless technology. It also plans to increase its existing Optical Fibre Cable
network and TAX capacity.
Aggressive marketing to tap the demand for the 3G technology to enable
high speed data transfer applications.
Extending the coverage of 3G and WiMAX.
Introduce new value added services such as Mobile TV, E-Banking, Mobile
Broadband, MMS etc using new technology such as WiMAX.
Introduction of new services like FTTH, VOIP etc.
Upgradation of existing network to NGN
Contribute towards:
National Plan Target of 500 million subscriber base for the country by
December 2010.
Broadband customers base of 20 million in the country by 2010 as per
Broadband Policy 2004.
Providing telephone connection in villages as per government policy.
Implementation of Triple play as a regular commercial proposition.
23

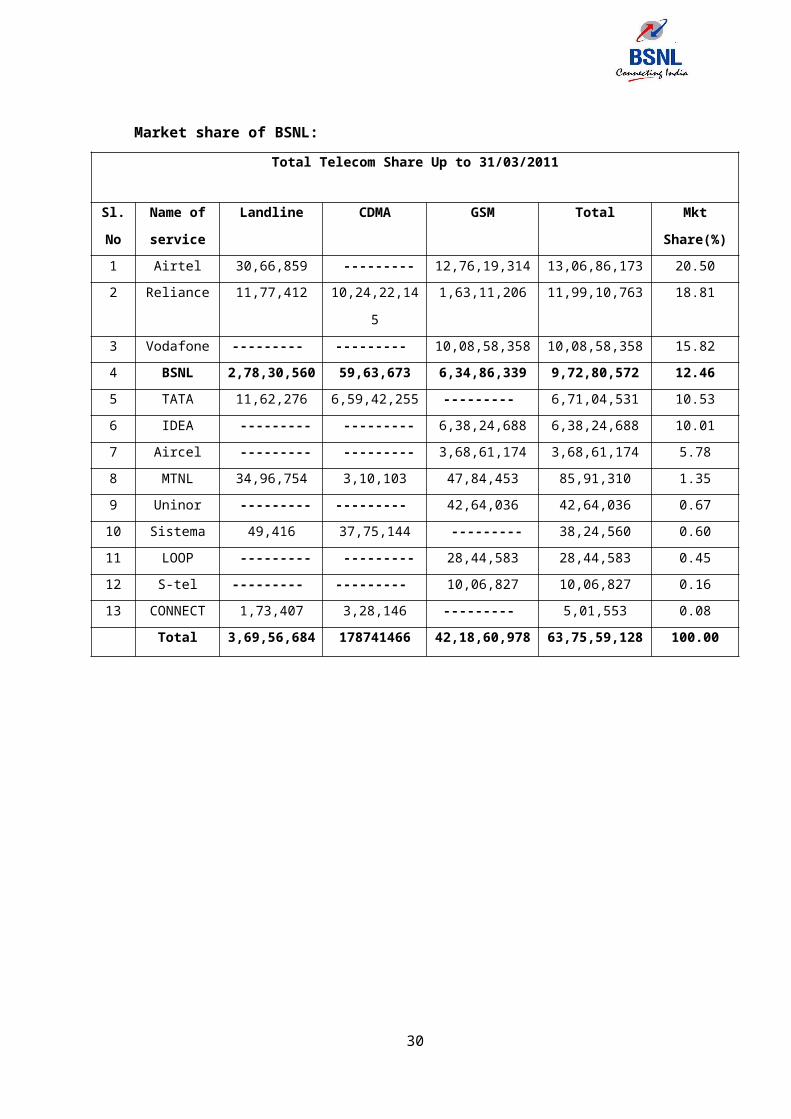
Market share of BSNL:
Total Telecom Share Up to 31/03/2011
Sl.
No
Name of
service
Landline CDMA GSM Total Mkt
Share(%)
1 Airtel 30,66,859 --------- 12,76,19,314 13,06,86,173 20.50
2 Reliance 11,77,412 10,24,22,145 1,63,11,206 11,99,10,763 18.81
3 Vodafone --------- --------- 10,08,58,358 10,08,58,358 15.82
4 BSNL 2,78,30,56
0
59,63,673 6,34,86,339 9,72,80,572 12.46
5 TATA 11,62,276 6,59,42,255 --------- 6,71,04,531 10.53
6 IDEA --------- --------- 6,38,24,688 6,38,24,688 10.01
7 Aircel --------- --------- 3,68,61,174 3,68,61,174 5.78
8 MTNL 34,96,754 3,10,103 47,84,453 85,91,310 1.35
9 Uninor --------- --------- 42,64,036 42,64,036 0.67
10 Sistema 49,416 37,75,144 --------- 38,24,560 0.60
11 LOOP --------- --------- 28,44,583 28,44,583 0.45
12 S-tel --------- --------- 10,06,827 10,06,827 0.16
13 CONNECT 1,73,407 3,28,146 --------- 5,01,553 0.08
Total 3,69,56,68
4
178741466 42,18,60,97
8
63,75,59,12
8
100.00
24
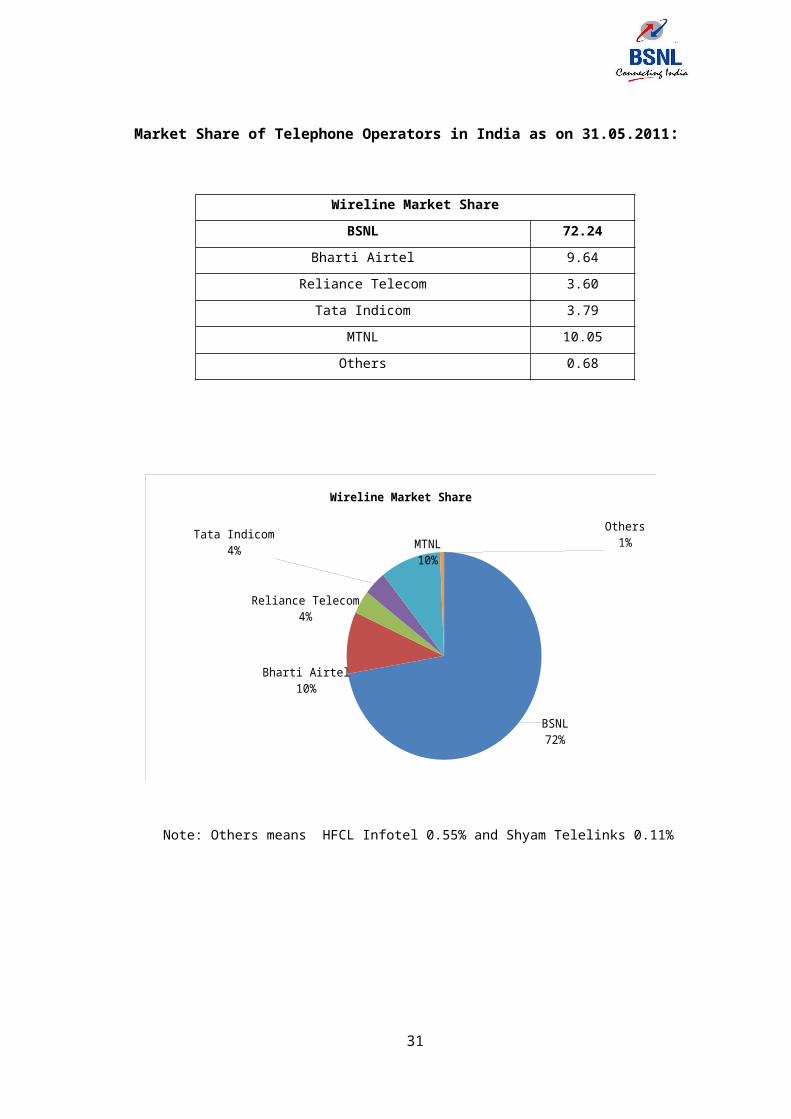
Market Share of Telephone Operators in India as on 31.05.2011:
BSNL72%
Bharti Airtel10%
Reliance Telecom4%
Tata Indicom4% MTNL
10%
Others1%
Wireline Market Share
Note: Others means HFCL Infotel 0.55% and Shyam Telelinks 0.11%
25
Wireline Market Share
BSNL 72.24
Bharti Airtel 9.64
Reliance Telecom 3.60
Tata Indicom 3.79
MTNL 10.05
Others 0.68

BSNL11%
Bharti Airtel21%
Reliance Telecom
17%
Vodaphone Essar17%
Tata Indicom11%
Idea12%
Aircel7%
MTNL1%
Others3%
Wireless Market Share
Note: Others means BPL 0.38%, HFCL Infotel 0.18%, Shyam Telelinks 1.29%, Uninor
2.95%, Stel 0.36%, Etisalat DB 0.15% and Vidiocon 0.88%
26
Wireless Market Share
BSNL 11.05
Bharti Airtel 19.88
Reliance Telecom 16.80
Vodaphone Essar 16.59
Tata Indicom 10.80
Idea 11.16
Aircel 6.79
MTNL 0.66
Others 2.83

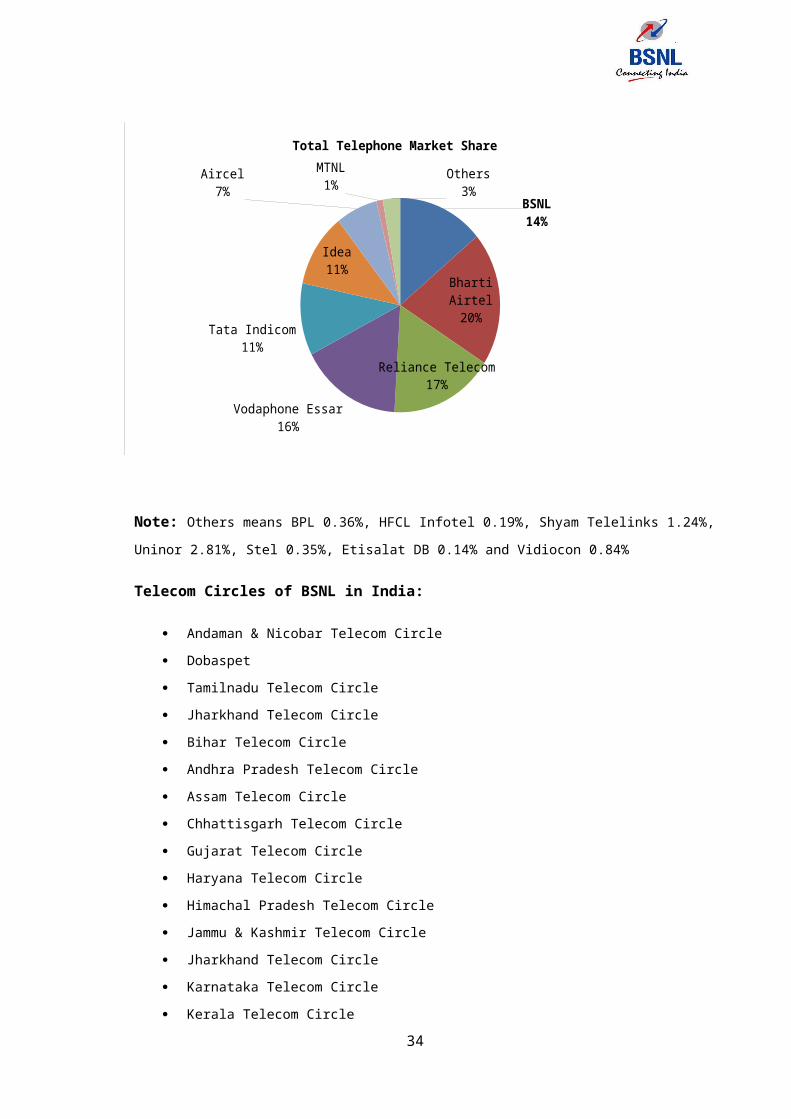
BSNL14%
Bharti Airtel20%
Reliance Telecom17%
Vodaphone Essar16%
Tata Indicom11%
Idea11%
Aircel7%
MTNL1%
Others3%
Total Telephone Market Share
Note: Others means BPL 0.36%, HFCL Infotel 0.19%, Shyam Telelinks 1.24%, Uninor
2.81%, Stel 0.35%, Etisalat DB 0.14% and Vidiocon 0.84%
Telecom Circles of BSNL in India:
Andaman & Nicobar Telecom Circle
27
Total Telephone Market Share
BSNL 13.45
Bharti Airtel 19.48
Reliance Telecom 16.28
Vodaphone Essar 15.94
Tata Indicom 10.53
Idea 10.72
Aircel 6.52
MTNL 1.03
Others 2.71
Dobaspet
Tamilnadu Telecom Circle
Jharkhand Telecom Circle
Bihar Telecom Circle
Andhra Pradesh Telecom Circle
Assam Telecom Circle
Chhattisgarh Telecom Circle
Gujarat Telecom Circle
Haryana Telecom Circle
Himachal Pradesh Telecom Circle
Jammu & Kashmir Telecom Circle
Jharkhand Telecom Circle
Karnataka Telecom Circle
Kerala Telecom Circle
Madhya Pradesh Telecom Circle
Maharashtra Telecom Circle
North East-I Telecom Circle
North East-II Telecom Circle
Orissa Telecom Circle, Rajasthan Telecom Circle
Punjab Telecom Circle, Uttranchal Telecom Circle
Metro Districts:
Kolkata
Chennai
Delhi
Mumbai
Project Circles:
Eastern Telecom Project Circle
Western Telecom Project Circle
Northern Telecom Project Circle
Southern Telecom Project Circle
IT Project Circle, Pune
Maintenance Regions:
Eastern Telecom Maintenance Region
Western Telecom Maintenance Region
28

Northern Telecom Maintenance Region
Southern Telecom Maintenance Region
Specialized Telecom Units:
Broad Band Networks (Data Networks)
National Centre For Electronic Switching
Technical & Development Circle
Production Units:
Telecom Factory, Mumbai
Telecom Factory, Jabalpur
Telecom Factory, Richhai
Telecom Factory, Kolkata
Present and future:
BSNL then known as Department of Telecom had been a near monopoly
during the socialist period of the Indian economy. During this period, BSNL was the
only telecom service provider in the country MTNL was present only in Mumbai
and New Delhi). During this period BSNL operated as a typical state-run
organization, inefficient, slow, bureaucratic, and heavily unionised. As a result
subscribers had to wait for as long as five years to get a telephone connection. The
corporation tasted competition for the first time after the liberalisation of Indian
economy in 1991. Faced with stiff competition from the private telecom service
providers, BSNL has subsequently tried to increase efficiencies itself. DoT veterans,
however, put the onus for the sorry state of affairs on the Government policies,
where in all state-owned service providers were required to function as mediums
for achieving egalitarian growth across all segments of the society.
The corporation (then DoT), however, failed miserably to achieve this and
India languished among the most poorly connected countries in the world. BSNL
was born in 2000 after the corporatisation of DoT. The efficiency of the company
has since improved little a bit. However, the performance level is nowhere near the
private players.
INDIA BROADBAND:
Year of Broadband 2007:
29
2007 has been declared as "Year of Broadband" in India and BSNL is in the
process of providing 5 million Broadband connectivity by the end of 2007. BSNL has
upgraded existing Data one (Broadband) connections for a speed of up to 2 Mbit/s
without any extra cost. This 2 Mbit/s broadband service is being provided by BSNL
at a cost of just US$ 11.7 per month (as of 21 July 2008 and at a limit of 2.5GB
monthly limit with 0200-0800 hrs as no charge period). Further, BSNL is rolling out
new broadband. BSNL is planning to increase its customer base to 108 million
customers by 2010. With the frantic activity in the communication sector in India,
the target appears achievable. BSNL is a pioneer of rural telephony in India. BSNL
has recently bagged 80% of US$ 580 m (INR 2,500 crores) Rural Telephony project
of Government of India.
On the 20th of March, 2009, BSNL advertised the launch of BlackBerry
services across its Telecom circles in India. The corporation has also launched 3G
services in select cities across the country. Presently, BSNL and MTNL are the only
players to provide 3G services, as the Government of India has completed auction
of 3G services for private players. BSNL shall get 3G bandwidth at lowest bidder
prices of Rs 18,500 crore, which includes Rs 10,186 crore for 3G and Rs 8313crore
for BWA.[One crore is 10 million.]BSNL management has paid this money under
protest seeking refund.
Challenges:
During the financial year 2008-2009 (from April 1, 2009 to March 31,
2009) BSNL has added 8.1 million new customers in various telephone services
taking its customer base to 75.9 million. BSNL's nearest competitor Bharti Airtel is
standing at a customer base of 62.3 million. However, despite impressive growth
shown by BSNL in recent times, the fixed line customer base of BSNL is declining. In
order to woo back its fixed-line customers BSNL has brought down long distance
calling rate under One India plan, however, the success of the scheme is not
known. However, BSNL faces bleak fiscal 2009-2010 as users flee.
Presently there is an intense competition in Indian Telecom sector and
various Telco’s are rolling out attractive schemes and are providing good customer
services.
Access Deficit Charges (ADC, a levy being paid by the private operators to
BSNL for provide service in non-lucrative areas especially rural areas) has been
slashed by 20% by Telecom Regulatory Authority of India (TRAI), w.e.f. April
1, 2009. The reduction in ADC may hit the bottomlines of BSNL.
30
BSNL has started 3G services in 290 cities and acquired more than 6 Lakh
customers. It has planned to roll out 3G services in 760 cities across the country in
2010-11.
Broadband services: The shift in demand from voice to data has
revolutionized the very nature of the network. BSNL is poised to cash on this
opportunity and has planned for extensive expansion of the Broadband services.
The Broadband customer base of 3.56 Million customers in March'2009 is planned
to be increased to 16.00 million by March 2014. Now BSNL is the under top five
telecom service provider company in India.
Major developments after formation of BSNL
Launching of Cellular services : 01-12-2002
Launching of WLL Services : 12-03-2004
Commissioning of OAN (Optical Fibre) network : 2005
Commission of Broadband services : March 2005
Commissioning of Cell MSC : 11-11-2005
Complete conversion of Landline connections to new technology2006
Commissioning of Optical Fiber Ring routes : 2006
Commissioning of WLL MSC : 08-06-2007
Commissioning of Wimax services : February 2009
PRBT Services commissioned : 22-04- 2009
Commissioning of 3G services (With 60 BTSs) : 31-03-2010
BSNL IN VISHAKAPATNAM
Visakhapatnam District comprises an area of 11,161 Sq.KMs.
Total Population of the District is 38, 32,336.(Urban: 15, 30,899; Rural: 23,
01,437).
The Visakhapatnam telecom division office telegraphs was formed during 1976 under
the control of Divisional Engineer telegraphs, Visakhapatnam with a less than 100
telephone connections in Visakhapatnam District. The DE telegraphs had maintained
the entire telegraph and telecom network including Defense Lines from
Visakhapatnam to Ichapuram. Later many telephone Exchanges were commissioned
31

at several places in the district and number of connections increased to more than
1000 and Divisional Engineer, telegraphs was formed and separated as Vizianagaram
and Srikakulam divisions during 1981. The office of Divisional Engineer,
Visakhapatnam is remained as Telecom. District Engineer, Visakhapatnam and it is
upgraded to the level of telecom district manager during 1993 after reaching its
capacity 10,000 connections and a Junior Administrative Grade Officers from Indian
Telecom. Service has been posted as Head of this Telecom District. 1996-1999 is the
golden period for history of telecommunications and its connectivity is increased.
During this period the telephone connections were increased to more than 10 times
and many new electronic exchanges were installed and the old technology was
removed and provided some more additional facilities to customers. The telecom wing
higher to under the department of telecommunications has been formed as Bharat
Sanchar Nigam Limited with effect from 01-10-2000 as a Corporate Sector. Due to the
vase development during this period, the status of this telecom district is upgraded to
the level of General Manager and a Senior Administrative Grade Officer from Indian
Telecom. Service has been posted as Head of this Telecom District in September
2000. Now the telephone connections are more than 1,50,000 the General Manager is
looking after development activities of the entire district. Engineering Officers and
Finance Officers is one Engineering Officer from Indian Telecom. Service is working as
Deputy General Manager looking after the Administration and Planning and one
Finance officer advisor. These two officers are assisting to the General Manager for
Development activities and to run the administration in smooth. Divisional Engineers,
Sub-Divisional Engineers and Chief Accounts Officers and Accounts Officers are
working under the control of above mentioned officers respectively. It is very difficult
to maintain the entire district at one point, for easy mice of the entire telecom district
has been divided into sub-divisions. The heads of sub divisions will look after the
development activities relate to that sub-division. Though the telephone density is
comparatively less than other developed districts, the department is providing good
services through out the district. Through services provided in the rural areas is not
economical to the department. It is still continued the services in the public interest.
One more happiest news to the Visakhapatnam District customers that the Bharat
Sanchar Nigam Limited,Visakhapatnam providing cell one services, WLL Services and
value added services to the public.
BSNL, Visakhapatnam is serving many Major Industries in
Visakhapatnam like……
HPCL (Hindusthan Petroleum).
Coromandel Fertilizers.
Hindustan Zinc Ltd.
32

Hindustan Ship Yard,
Ship Building Centre.
Visakha Dairy.
Indian Oil Corporation.
BHPV.
Essar Steel Pellatisation Plant.
L.G Polymers.
NALCO (National Aluminum Company).
DCI (Dredging Corporation of India).
INDIAN NAVY.
Educational Institutions like AU, GITAM etc.,
APEPDCL, GVMC etc., and many more ………
Visakhapatnam Telecom District is
Having 10 SDCAs consisting of 42 Mandals.
Having the New Technology switches like OCB and EWSD along with CDOT
technology.
Having 98 exchanges and 4 DLCs in the SSA
Urban exchanges : 28
Rural : 70
Working Lines as on 30-11-2010:
Land Line : 107725 (98 exges+4 DLCs).
WLL : 9160 (WLL BTSs: 59).
Cellular Connections :( Cell BTSs: 194).
Prepaid : 232539.
Postpaid : 8126.
Total : 240665.
Facilities offered to Customers
Year Facility offered
March 2003 Mobile van collections
May 2005 ECS facility
July 2005 Collection of bills by banks
May 2008 e-seva
October 2008 BSNL PORTAL & online transfer (e-payment)
July2009 AP online services
Penetration of Broadband connections against Landline connections:
33
Developments in Lands & Buildings
34
Year Land Line Brand Band Penetration %ge
2005 151208 4110 2.72
2006 146114 5439 3.72
2007 132335 14096 10.65
2008 118974 20609 17.32
2009 110202 27274 24.75
2010 107725 30829 28.62

2.3 ORGANIZATION STRUCTURE (CENTRAL)
35
Year Lands Acquisition
Construction of
buildings
Cell sites
acquired
2000 --- --- ---
2001 --- Vempadu ---
2002 Seethammadhara Seethammadhara 4
2003 --- Pendurthy 3
2004 Parawava --- 10
2005
Rambilli, Sabbavaram,
Atchutapuram, Tagarapuvalasa,
Anandapuram, Madhurawada,
Narsipatnam --- 24
2006 Kasimkota, Nathavaram --- 3
2007 Rolugunta --- 15
2008 ---
Dabagardens building
vertical expansion 13
2009 --- ---- 4
2010 ---
Mindi Tele exge bldg
horizontal expansion,
Dabagardens Admn bldg,
Narsipatnam Tele exge
bldg.
72 sites
under
Phase V.I

Chairman & Managing Director (Central)
Chief General Manager (Circle)
Chief General Manager (Circle)
Chief General Manager (Circle)
Chief General Manager (Circle)
HRD Operations Planning Marketing Finance
Director Director Director Director Director
Chief General Manager (Circle)
DGM
General Manager(District)
DGM DGM DGM DGM
General Manager(District)
General Manager(District)
General Manager(District)
General Manager(District)
36

2.3 ORGANIZATION STRUCTURE (STATE)
37
Head of the Circle Chief General Manager (A.P.)
Head of Visakhapatnam SSA
Dy. General Manager (Planning and
Marketing)
Divisonal Engineers
Sub-Divisonal Engineers
Junior Telecom Officers
General Manager
Dy. General Manager (Finance)
Chief Accounts Officer
Accounts Officer
Junior Accounts Officer

2.4 Marketing Functions
Marketing & Sales and often use it interchangeably without understanding the
difference in it. Marketing is everything we do to get and leverage a client
relationship.
Marketing process is broad and includes all of the following: -
Discovering what product, service or idea customers want.
Producing a product with the appropriate features and quality.
Pricing the product correctly.
Promoting the product; spreading the word about why customers should
buy it
Selling and delivering the product into the hands of the customer.
Selling is one activity of the entire marketing process. Selling is the
act of persuading or influencing a customer to buy (actually exchange something
of value for) a product or service.
Marketing functions includes
Estimate the customer tastes and preferences
Advertisements and promotional activities
Sales and distribution
Providing services to customers
Identifying the new market
New product development
Market segmentation
The ultimate objective of any marketing activity is to satisfy the customers
and today even a step ahead i.e. ‘delighting’ the customers, for which customers
are offered something beyond their expectations from the service or the product.
The objective being to acquire and retain the customers, who should continually
feel that they are getting more value of the money, they are departing with.
Marketing is the establishment, development, maintenance and
optimization of long-term mutually valuable relationships between consumers and
organisation. Successful Marketing focuses on understanding the needs and desires
of the customers and is achieved by placing these needs at the heart of business
by integrating them with the organization strategy, people, technology and
38

business processes. At its most basic, Marketing involves customers, organizations
and relationships and the combination creates the need for the management.
39
2.5 FINANCE FUNCTION
Bharat Sanchar Nigam Limited, the largest Public Sector Undertaking of the Nation, is
certainly on a financial ground that's sound. The Company has a net worth of Rs.
86,476 crores, Authorized Equity capital of Rs. 10,000 crores, Paid up Equity Share
Capital of Rs. 5,000 crores and Revenue is Rs. 32,045 crores in 2009-10.
Revenue
Revenue earned by BSNL during last five years
40

Capital outlay
BSNL has Gross Fixed Assets of over Rs. 132243 Crores as on 31.03.2009.
41
Gross investment in fixed assets:
The BSNL is making substantial investment year to year for its network
expansion and modernization. During the current financial year BSNL has made
the gross investment of Rs. 28,227 crore (US $ 6.28 billion) in Fixed Assets.

Corporate assets
Bharat Sanchar Nigam Limited has got net fixed assets valuing more than Rs. 54,321
Cores, which are in the form of Land, Buildings Cables, Apparatus & Plants etc. as on
31.03.2009.
Financial functions are includes
Raising funds and investing them in assets
Share holders wealth maximization
Working capital management and estimation of working capital
Profit maximization
Tax payments
Cash management
Inventory management
Capital budgeting decision
Investment decisions
Assets management
Hu
42

2.6 Human Resources Functions
HR development:
With a corporate philosophy that considers Human Resource as the most
prized assets of the organization, it's natural for BSNL to continually hone
employee skills, enhance their knowledge and their expertise and their aspirations
to fruition. Even as BSNL goes about conducting its business activities, it lays
emphasis on constant enhancement of knowledge and skills through regular
traininprogrammes.
Human resources functions includes
HR planning
Recruitment
Selection
Training & Development
Promotions & Depromotions
Transfers
Salary & Wage administration
Disciplinary activities
Attendance & Leave
Welfare
Industrial relations
43

Staff strength of BSNL, Visakhapatnam
SWOT Analysis:
Strengths:
Experienced telecom service provider
Huge Resources (financial & technical pool)
Most trusted telecom brand
Transparency in billing
Weaknesses:
44
Year Staff strength
2000 2041
2001 2041
2002 2008
2003 1997
2004 1982
2005 1955
2006 1903
2007 1843
2008 1805
2009 1682
2010 1640

Non-optimization of network capabilities
Poor marketing strategy
Bureaucratic organizational set up
Limited number of value added services
Opportunities:
Tremendous market growing at 20 lac customers per month
Untapped broadband services
Untouched international market
Can capitalize on public sector image to grab government’s ICT initiatives
Threats:
Competition from private operators
Keeping pace with fast technological changes
Market maturity in basic telephone segment
Manpower churning
2.7 VISION AND MISSION 0F THE COMPANY
45

Vision:
To become the largest telecom Service Provider in Asia.
Mission:
1. To provide world class state-of-art technology telecom services to its
customers on demand at competitive prices.
2. To provide world class telecom infrastructure in its area of operation and to
contribute to the growth of the country's economy.
Objectives:
1. To be a Lead Telecom Services Provider.
2. To provide quality and reliable fixed telecom service to our customer and
3. There by increase customer's confidence.
4. To provide mobile telephone service of high quality and become no. 1 GSM
5. Operator in its area of operation.
6. To provide point of interconnection to other service provider as per their
Requirement promptly.
3.1 INTRODUCTION
Customer is the king; this is all the more apt for today business environment
where, all other factors remaining more or less constant, it is the value addition to
46

the customer that is making all the difference. Customer satisfaction depends on
the performance relative to a expectations.
A key premise in customer satisfaction is understanding the needs and meeting or
exceeding the expectations of customers. Furthermore, this is done while optimally
using resources. While most companies have developed strategies to improve
quality and external customer service, internal customer satisfaction is a much
neglected component of quality improvement. To this end, it is important to
emphasize that total customer satisfaction can be attained only if all employees
devoted to external customer satisfaction can work together and assist each other
to achieve the common objective, when the internal customer isn’t satisfied;
Relationships with the external customer suffer. So, it suggested to adopt customer
oriented approach to keep the internal customer satisfied and motivated, who in
turn will focus their attention and energy upon meeting the requirements of their
customers, thereby maximizing the customer, thereby maximizing the customer
satisfaction.
Customer satisfaction survey is the process to monitor the satisfaction quotient of
their people. In internal satisfaction surveys therefore tracks the return on your
investments in keeping your people happy, high salaries, a quality culture, a
healthy work environment. Last, but not the least internal customer satisfaction
survey helps in finding the critical areas, which need further improvement.
Today’s companies are facing their toughest competition ever. These companies
can outdo their competition if they can move from product and sales philosophy to
a marketing philosophy. We spell out in detail how companies can go about winning
customers and outperforming competitors. The answer lies in doing a better job of
meeting and satisfying customers’ needs. Only customer- centered companies are
adept at building customers, not just building product. They are skilled in market
engineering, not just product engineering.
Too many companies think that it is the marketing/sales department’s job to
procure customers. If that department cannot, the company draws the conclusion
that its marketing people aren’t very good. But in fact, marketing is only one factor
in attracting and keeping customers. The best marketing department in the world
cannot spell products that are poorly made or fail to meet anyone’s need. The
marketing department can be effective only in companies whose various
departments and employees have designed and implemented a competitively
superior customer, value-delivery system.
47

Although the customer oriented firms seek to create high customer satisfaction, its
main goal is to maximize customer satisfaction, first the company can increase
customer satisfaction by lowering its prices, but results may be lower profits
second the company might be able to increase prices. Third the company has many
stake-holders including employees, dealers,
Suppliers and stock holders spending more to increase customer satisfaction might
divert funds from increasing the satisfaction of other partner. Estimate the
company must operate on the philosophy that it is trying to deliver a high level of
satisfaction to the other stake- holder within the constrains of its, Resources. From
the past studies of last three decades we observed that the company’s first task is
to create and satisfy customers. But today’s customers face a vast array of product
and brand choice prices and suppliers.
It is generally believed that customers estimate which offer will deliver the most
value customers are like value maximizes, within the bounds of search costs and
limited knowledge, mobility income, they form an expectation of value and act on
it, whether or not the offer lives up to the value expectations affects customer’s
satisfaction and their repurchase probability.
When we talk about customer satisfaction, we talk about creativity. Creativity
allows us to handle or diffuse problems at hand or later on in the process of
conducting the everyday We talk about how, or rather what, does the organization
have to do to gain not only the sale but also the loyalty of the customer. We want
to know the payoff of the transaction both in the short and long term. We want to
know what our customers want. We want to know if our customers are satisfied.
Satisfaction, of course, means that what we delivered to a customer met the
customer’s approval. We want to know if customers are delighted and willing to
comeback, and so on. Fleiss and Feldman present examples of that
delightfulness in their writings.
Fleiss has written about Ben and Jerry’s ice cream and Feldman has discussed
excellence in a cab ride. As important as delightfulness is, some of us minimize it,
or even totally disregard it. At this point, we fail. Some of the issues that will
guarantee failure in sales.
3.2 ROLE OF CUSTOMER SATISFACTION IN MARKETING
Customer satisfaction plays a huge role in the success (or failure) of your marketing
campaign. Creating a successful marketing strategy begins and ends with knowing
your target audience. If your target audience is leaving messages like the one to
48

the left - well no viral marketing messages can overcome a lack of customer
service.
In the days prior to the World Wide Web and the ensuing social media explosion -
the holy grail of marketing was advertising. In a nutshell, word of mouth marketing
depends upon customer satisfaction to generate “buzz” in the community. One
satisfied customer tells another and suddenly, a business would find its sales
growing without spending precious dollars on traditional advertising.
3.3 NEED OF INTERNAL CUSTOMER SATISFACTION:
o Rapidly growing organization
o High or growing turnover rate.
o Excessive rumor’s
o Highly competitive industry.
o Planned and recent organizational changes.
BENEFITS OF INTERNAL CUSTOMER SATISFACTION:
o It creates better teamwork and n improved work process.
o It leads to higher output and superior quality product.
o It decreases the turnover.
o Reduced overheads, and increase customer satisfaction level’s inter
departmental.
o It enhances communication and hence helped in team building, hence there
is less wasted effort caused by lack of common purpose and poor
communication.
o A good employee feedback survey improves employee attitude and boosts
morals.
3.4 IMPROVING CUSTOMER SATISFACTION:
Published standards exist to help organizations develop their current levels of
customer satisfaction. The International Customer Service Institute (TICSI)
has released The International Customer Service Standard (TICSS). TICSS
enables organizations to focus their attention on delivering excellence in the
management of customer service, whilst at the same time providing recognition of
success through a 3rd Party registration scheme. TICSS focuses an organization’s
49

Customer Grievances
Customer Property
Timely Supply
Special requirement of Customer
Customer Feedback
Customer Focus
Cu
sto
mer S
atis
factio
n
attention on delivering increased customer satisfaction by helping the organization
through a Service Quality Model.
TICSS Service Quality Model uses the 5 P’s - Policy, Processes, People, Premises,
Product/Services, as well as performance measurement. The implementation of a
customer service standard should lead to higher levels of customer satisfaction,
which in turn influences customer retention and customer loyalty.
50

3.5 TCS-TOTAL CUSTOMER SATISFACTION
The key to engineering high customer loyalty is to deliver high customer value
according to Michael learning, in this delivery profitable value, a company must
develop a competitively superior value proposition and superior value delivery
system. A company value proposition is much more then it’s positioning on a single
attribute; it is a statement about the resulting experience customer will have from
the offering and their relationship with the supplier. The brand must be
representing a promise about the total resulting experience the customer can
expect. Whether the promise is kept depends upon the company’s ability to
manage its value delivery system.
The value-delivery system includes all the communication and channel experiences
the customer will have on the way to obtaining the offering. Brand marketers try to
distinguish brand from others by a unique selling propositions. Whether customers
will actually receive the promised value proposition will depend upon the
marketer’s ability to influence various core processes.
For customer- centered companies, customer satisfaction is a both a goal and
marketing tool. Companies that achieve high customer satisfaction ratings make
sure it their target marketing knows it. With the globalization and technological
advances, and deregulation that is takes place in recent year’s endless
opportunities and in the market place. Giving more meaning to the phase “Behind
every problem is o brilliantly disguised opportunity but what marketing should do
with these issues.
With the above development marketing has taken major shifts in the past tow
decades from the traditional production concept to product concept. TO selling
concept because of the liberalization policies adopted by many nations the markets
or developing countries are flooded buy the wide variety of products giving both to
a new concept that is selling concept. This concept holds that “Consumers and
business, if -left above, will ordinarily not bay enough of the organizations products
the organizations must therefore, undertake an aggressive selling and promotion
effort.
According to this concept the consumers must be induced to bay products more
and more with the help of effective selling and promotional tools. This philosophy
worked for the companies seeking short run results, but not for the long run.
Because if gives more emphasis to pushing the products into the markets whether
they may or may not have the potential.
51

In recent years with the growing number of MNC’s and domestic companies a wide
assertion of products, and service were available to the consumers. This shift in
market place gave birth to a new concept what is called marketing concept.
According to this concept, the key to achieving its organizational, goals consists of
the company being more effective than competitors in creating, delivering and
communicating consumer value to its chosen target markets.
This concept gave more emphasis to customer needs, and marketing profits by
satisfying the customers, offering the highest customer delivered value. Whether
the customer is satisfied after purchase depends on the offers performance in
relation to the buyer’s expectations.
“Satisfaction” is a person’s feelings of pleasure of disappointment resulting from
comparing products perceived performance (or outcome) in relation to his or her
expectation. Many companies are aiming for high satisfaction because customers
who are just satisfied still find it easy to switch a better offer comes along those
who are highly satisfied are must less ready to switch satisfaction or delight creates
and emotional found with the brand, not just a rational preference. The result is
high customer loyalty. The key to generation high customer’s loyalty is to deliver
high customer value.
However, there are four methods companies use to track customer satisfaction.
3.6 SEVEN STEPS OF CUSTOMER SATISFACTION
1. Encourage Face-to-Face Dealings:
This is the most daunting and downright scary part of interacting with a customer.
If you’re not used to this sort of thing it can be a pretty nerve- wracking experience.
Rest assured, though, it does get easier over time. It’s important to meet your
customers face to face at least once or even twice during the course of a project.
My experience has shown that a client finds it easier to relate to and work with
someone they’ve actually met in person, rather than a voice on the phone or
someone typing into an email or messenger program. When you do meet them, be
calm, confident and above all, take time to ask them what they need. I believe that
if a potential client spends over half the meeting doing the talking, you’re well on
your way to a sale.
2. Respond to Messages Promptly & Keep Your Clients Informed:
52

This goes without saying really. We all know how annoying it is to wait days for a
response to an email or phone call. It might not always be practical to deal with all
customers’ queries within the space of a few hours, but at least email or call them
back and let them know you’ve received their message and you’ll contact them
about it as soon as possible. E if you’re not able to solve a problem right away let
the customer know you’re working on it. A good example of this is my Web host.
They’ve had some trouble with server hardware which has caused a fair bit of
downtime lately. At every step along the way I was emailed and told exactly what
was going on, why things were going wrong, and how long it would be before they
were working again. They also apologized repeatedly, which was nice. Now if they
server had just gone down with no explanation I think I’d have been pretty annoyed
and may have moved my business elsewhere. But because they took time to keep
me informed, it didn’t seem so bad, and I at least knew they were doing something
about the problems. That to me is a prime example of customer service.
3. Be Friendly and Approachable:
A fellow Site Pointer once told me that you can hear a smile through the phone.
This is very true. It’s very important to be friendly, courteous and to make your
clients feel like you’re their friend and you’re there to help them out. There will be
times when you want to beat your clients over the head repeatedly with a blunt
object - it happens to all of us. It’s vital that you keep a clear head, respond to your
clients’ wishes as best you can, and at all times remain polite and courteous.
4. Have a Clearly-Defined Customer Service Policy:
This may not be too important when you’re just starting out, but a clearly defined
customer service policy is going you a lot of time and effort in the long run. If a
customer has a problem, what should they do? If the first option doesn’t work, then
what? Should they contact different people for billing and technical enquiries? If
they’re not satisfied with any aspect of your customer service, who should they
tell?
There’s nothing more annoying for a client than being passed from person to
person, or not knowing who to turn to. Making sure they know exactly what to do at
each stage of their enquiry should be of utmost importance. So make sure your
customer service policy is present on your site and anywhere else it may be useful.
5. Attention to Detail also known as ‘The Little Niceties’:
Have you ever received a Happy Birthday email or card from a company you were
a client of? Have you ever had a personalized sign-up confirmation email for a
53
service that you could tell was typed from scratch? These little niceties can be time
consuming and aren’t always cost effective, but remember to do them.
Even if it’s as small as sending a Happy Holidays email to all your customers, it’s
something. It shows you care; it shows there are real people on the other end of
that screen or telephone; and most importantly, it makes the customer feel
welcomed, wanted and valued.
6. Anticipate Your Client’s Needs & Go Out Of Your Way To Help
Them Out:
Sometimes this is easier said than done! However, achieving this supreme level of
understanding with your clients will do wonders for your working relationship.
Take this as an example: you’re working oh the front-end for your client’s exciting
new ecommerce endeavor. You have all the images, originals and files backed up
on your desktop computer and the site is going really well. During a meeting with
your client he/she happens to mention a hard-copy brochure their internal
marketing people are developing. As if by magic, a couple of weeks later a CD-ROM
arrives on their doorstep complete with high resolution versions of all the images
you’ve used on the site. A note accompanies it which reads:
Your client is heartily impressed, and remarks to his colleagues and friends how
very helpful and considerate his Web designers are. Meanwhile, in your office, you
lay back in your chair drinking your 7th cup of coffee that morning, safe in the
knowledge this happy customer will send several referrals your way.
7. Honor Your Promises:
It’s possible this is the most important point in this article. The simple message:
when you promise something, deliver. The most common example here is project
delivery dates.
Clients don’t like to be disappointed. Sometimes, something may not get done, or
you might miss a deadline through no fault of your own. Projects can be late,
technology can fail and sub-contractors don’t always deliver on time. In this case a
quick apology and assurance it’ll be ready ASAP wouldn’t go amiss.
1. FOR WHICH PURPOSE YOU MOSTLY USE BSNL SERVICES?
Table-4.1
54

OPINION POOL NO OF RESPONDENTS PERCENTAGE
PERSONAL 110 55.0
BUSINESS 90 45.0
TOTAL 200 100.0
55
45PERSONALBUSINESS
As the Table depicts, a good majority of the respondent 55.0
percentage consumer’s using B.S.N.L for personal purpose. 45.0 percentage using
B.S.N.L for business purpose. We can conclude that majority were opinioned that,
the using B.S.N.L for personal purpose.
2. WHAT IS YOUR MONTHLY AVERAGE BILL?
Table-4.2
55

OPINION POOL NO OF RESPONDENTS PERCENTAGE
BELOW RS.500 80 40.0
RS. 500-1000 60 30.0
RS. 1000-1500 20 10.0
RS. 1500-2000 22 11.0
ABOVE 2000 18 9.0
TOTAL 200 100.0
40
30
10
11
9
BELOW RS.500RS. 500-1000RS. 1000-1500RS. 1500-2000ABOVE 2000
The total sample size was 200 outlets in our analysis we has been
40.0 percentage opinioned that their average bill is below 500, 30.0 percentage
opinioned that their average bill is bet 500-1000, 10.0 percentage opinioned that
their average bill is bet 1000-1500, 11.0 percentage opinioned that their average
bill is bet 1500-2000, 9.0 percentage opinioned that their average bill is above
2000. Most of the people opinioned that their average bills are above2000.
3. HOW SATISFIED ARE YOU WITH THE COVERAGE OF BSNL?
Table-4.3
56
OPINION POOL NO OF RESPONDENTS PERCENTAGE
HIGHLY SATISFIED 90 45.0
SATISFIED 68 34.0
NEUTRAL 20 10.0
DISSATISFIED 10 5.0
HIGHLY DISSATISFIED 12 6.0
TOTAL 200 100.0
45
34
10
56
HIGHLY SATISFIED SATISFIEDNEUTRALDISSATISFIEDHIGHLY DISSATISFIED
From the above table, it shows that 45.0 percentage of the respondents that
the coverage of B.S.N.L is highly satisfied, 34.0 percentage of the respondents that
the coverage of B.S.N.L is satisfied, 10.0 percentage of the respondents that the
coverage of B.S.N.L is neutral, 5.0 percentage of the respondents that the coverage
of B.S.N.L is dissatisfied, 6.0 percentage of the respondents that the coverage of
B.S.N.L is highly dissatisfied. We can conclude that majority were opinioned that,
the coverage of B.S.N.L is highly satisfied.
4. HOW SATISFIED ARE YOU WITH THE CONNECTIVITY OF BSNL?
Table-4.4
OPINION POOL NO OF RESPONDENTS PERCENTAGE
57
HIGHLY SATISFIED 90 45.0
SATISFIED 70 35.0
NEUTRAL 18 9.0
DISSATISFIED 10 5.0
HIGHLY DISSATISFIED 12 6.0
TOTAL 200 100.0
45
35
9
56
HIGHLY SATISFIEDSATISFIEDNEUTRALDISSATISFIEDHIGHLY DISSATISFIED
From the above table, it shows that 45.0 percentage of the respondents that
the connectivity of B.S.N.L is highly satisfied, 35.0 percentage of the respondents
that the connectivity of B.S.N.L is satisfied, 9.0 percentage of the respondents that
the connectivity of B.S.N.L is neutral, 5.0 percentage of the respondents that the
connectivity of B.S.N.L is dissatisfied, 6.0 percentage of the respondents that the
connectivity of B.S.N.L is highly dissatisfied. We can conclude that majority were
opinioned that, the connectivity of B.S.N.L is highly satisfied.
5. HOW SATISFIED ARE YOU WITH THE BILLING OF BSNL?
Table-4.5
OPINION POOL NO OF RESPONDENTS PERCENTAGE
58

HIGHLY SATISFIED 110 55.0
SATISFIED 70 35.0
NEUTRAL 10 5.0
DISSATISFIED 5 2.5
HIGHLY DISSATISFIED 5 2.5
TOTAL 200 100.0
5535
5
2.5 2.5
HIGHLY SATISFIEDSATISFIEDNEUTRALDISSATISFIEDHIGHLY DISSATISFIED
From the above table, it shows that 55.0 percentage of the respondents that
the billing of B.S.N.L is highly satisfied, 35.0 percentage of the 5respondents that
the billing of B.S.N.L is satisfied, 5.0 percentage of the respondents that the billing
of B.S.N.L is neutral, 2.5 percentage of the respondents that the billing of B.S.N.L is
dissatisfied, 2.5 percentage of the respondents that the billing of B.S.N.L is highly
dissatisfied. We can conclude that majority were opinioned that, the billing of
B.S.N.L is highly satisfied.
6. HOW SATISFIED ARE YOU WITH THE HANDSET OF BSNL?
Table-4.6
OPINION POOL NO OF RESPONDENTS PERCENTAGE
59

HIGHLY SATISFIED 120 60.0
SATISFIED 60 30
NEUTRAL 10 5.0
DISSATISFIED 6 3.0
HIGHLY DISSATISFIED 4 2.0
TOTAL 200 100.0
60
30
53 2
HIGHLY SATISFIEDSATISFIEDNEUTRALDISSATISFIEDHIGHLY DISSATISFIED
From the above table, it shows that 60.0 percentage of the respondents that
the handset of B.S.N.L l is highly satisfied, 30.0 percentage of the respondents that
the handset of B.S.N.L is satisfied, 5.0 percentage of the respondents that the
handset of B.S.N.L is neutral, 3 percentage of the respondents that the handset of
B.S.N.L is dissatisfied, 2.0 percentage of the respondents that the handset of
B.S.N.L is highly dissatisfied. We can conclude that majority were opinioned that,
the handset of B.S.N.L is highly satisfied.
7. HOW SATISFIED ARE YOU WITH THE QUALITY OF SERVICE OF
BSNL?
Table-4.7
OPINION POOL NO OF RESPONDENTS PERCENTAGE
HIGHLY SATISFIED 70 35.0
60

SATISFIED 60 30.0
NEUTRAL 10 5.0
DISSATISFIED 28 14.0
HIGHLY DISSATISFIED 32 16.0
TOTAL 100 100.0
35
30
5
14
16
HIGHLY SATISFIEDSATISFIEDNEUTRALDISSATISFIEDHIGHLY DISSATISFIED
From the above table, it shows that 35.0 percentage of the respondents that
the quality of services of B.S.N.L is highly satisfied, 30.0 percentage of the
respondents that the quality of services of B.S.N.L is satisfied, 5.0 percentage of
the respondents that the quality of services of B.S.N.L is neutral, 14 percentage of
the respondents that the quality of services of B.S.N.L is dissatisfied, 16.0
percentage of the respondents that the quality of services of B.S.N.L is highly
dissatisfied. We can conclude that majority were opinioned that, the quality of
services of B.S.N.L is highly satisfied.
8. HOW SATISFIED ARE YOU WITH THE INTERNET OF BSNL?
Table-4.8
OPINION POOL NO OF RESPONDENTS PERCENTAGE
61

HIGHLY SATISFIED 120 60.0
SATISFIED 30 15.0
NEUTRAL 30 15.0
DISSATISFIED 5 2.5
HIGHLY DISSATISFIED 5 2.5
TOTAL 200 100.0
60
15
15
2.5
2.5
HIGHLY SATISFIEDSATISFIEDNEUTRALDISSATISFIEDHIGHLY DISSATISFIED
From the above table, it shows that 60.0 percentage of the respondents that
the internet of B.S.N.L is highly satisfied, 15.0 percentage of the respondents that
the internet of B.S.N.L is satisfied, 15.0 percentage of the respondents that the
internet of B.S.N.L is neutral, 2.5 percentage of the respondents that the internet of
B.S.N.L is dissatisfied, 2.5 percentage of the respondents that the internet of
B.S.N.L is highly dissatisfied. We can conclude that majority were opinioned that,
the internet of B.S.N.L is highly satisfied.
9. HOW SATISFIED ARE YOU WITH THE CALL CHARGES OF BSNL?
Table-4.9
OPINION POOL NO OF RESPONDENTS PERCENTAGE
62
HIGHLY SATISFIED 30 15.0
SATISFIED 50 25.0
NEUTRAL 60 30.0
DISSATISFIED 35 17.5
HIGHLY DISSATISFIED 25 12.5
TOTAL 200 100.0
15
25
30
17.5
12.5
HIGHLY SATISFIEDSATISFIEDNEUTRALDISSATISFIEDHIGHLY DISSATISFIED
From the above table, it shows that 15.0 percentage of the respondents that
the call charges of B.S.N.L is highly satisfied, 25.0 percentage of the respondents of
B.S.N.L is satisfied, 30.0 percentage of the respondents of B.S.N.L is neutral, 17.0
percentage of the respondents of B.S.N.L is dissatisfied, 12.0 percentage of the
respondents of B.S.N.L is highly dissatisfied. We can conclude that majority were
opinioned that, the call charges of B.S.N.L are neutral.
10. HOW SATISFIED ARE YOU WITH THE VALUE ADDED SERVICE?
Table-4.10
OPINION POOL NO OF RESPONDENTS PERCENTAGE
63

HIGHLY SATISFIED 35 17.5
SATISFIED 60 30.5
NEUTRAL 30 15.0
DISSATISFIED 40 20.0
HIGHLY DISSATISFIED 35 17.0
TOTAL 200 100.0
17.5
30.5
15
20
17
HIGHLY SATISFIEDSATISFIEDNEUTRALDISSATISFIEDHIGHLY DISSATISFIED
From the above table, it shows that 17.0 percentage of the respondents that
the value added service of B.S.N.L is highly satisfied, 30.0 percentage of the
respondents of B.S.N.L is satisfied, 15.0 percentage of the respondents that of
B.S.N.L is neutral, 20.0 percentage of the respondents that of B.S.N.L is dissatisfied,
17.0 percentage of the respondents that B.S.N.L is highly dissatisfied. We can
conclude that majority were opinioned that, the value added service of B.S.N.L is
satisfied.
11. HOW SATISFIED ARE YOU WITH THE OVERALL?
Table-4.11
OPINION POOL NO OF RESPONDENTS PERCENTAGE
64
HIGHLY SATISFIED 30 15.0
SATISFIED 65 32.0
NEUTRAL 30 15.0
DISSATISFIED 40 20.0
HIGHLY DISSATISFIED 36 18
TOTAL 200 100.0
15
32
15
20
18
HIGHLY SATISFIEDSATISFIEDNEUTRALDISSATISFIEDHIGHLY DISSATISFIED
From the above table, it shows that 15.0 percentage of the respondents that
the overall of B.S.N.L is highly satisfied, 32.0 percentage of the respondents that
the overall of B.S.N.L is satisfied, 15.0 percentage of the respondents that the
overall of B.S.N.L is neutral, 20.0 percentage of the respondents that the overall of
B.S.N.L is dissatisfied, 18.0 percentage of the respondents that the overall of
B.S.N.L is highly dissatisfied. We can conclude that majority were opinioned that,
the overall of B.S.N.L is satisfied.
12. DOES THE BILL SPECIFY ALL THE DETAILS ABOUT THE USAGE
OF THE BSNL?
Table-4.12
65

OPINION POOL NO OF RESPONDENTS PERCENTAGE
YES 3 1.5
NO 197 98.5
TOTAL 200 100.0
1.5
98.5
YESNO
The total sample size was 200 outlets in our analysis we has been 1.5
percentage opinioned that the bill specify all the details about the usage of the
B.S.N.L and 98.5 percentage opinioned that have doesn’t specify all the details
about usage of the B.S.N.L. we can conclude that majority were opinioned that,
have doesn’t specify all the details about usage of the B.S.N.L.
13. DO YOU RECEIVE YOUR BILL ON TIME?
Table-4.13
OPINION POOL NO OF RESPONDENTS PERCENTAGE
REGULAR 130 65.0
66

MOSTLY 50 25.0
NEUTRAL 6 3.0
RARELY 10 5.0
IRREGULAR 4 2.0
TOTAL 200 100.0
65
25
35 2
REGULARMOSTLYNEUTRALRARELYIRREGULAR
From the above table, it shows that 65.0 percentage of the respondents that
receives the bill on time is regular, 25.0 percentage of the respondents that
receives the bill on time is mostly, 3.0 percentage of the respondents that receives
the bill on time is neutral, 20.0 percentage of the respondents that the overall of
B.S.N.L is dissatisfied, 18.0 percentage of the respondents that the overall of
B.S.N.L is highly dissatisfied. We can conclude that majority were opinioned that,
the overall of B.S.N.L is satisfied.
14. PLEASE RANK YOUR PREFERENCE TO PAY YOUR BSNL BILL?
Table-4.14
OPINION POOL NO OF RESPONDENTS PERCENTAGE
NEAREST BANK 3 1.5
67
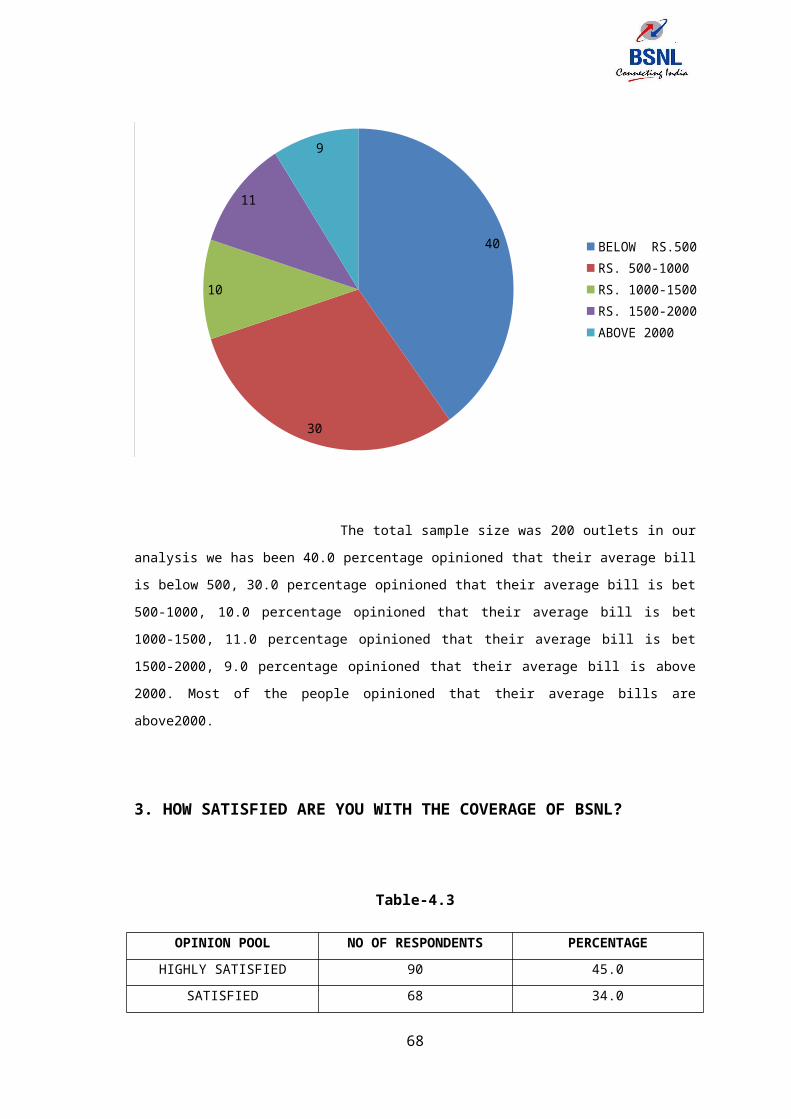
PICKUP BOY 6 3.0
COLLECTION CENTER 180 90.0
DROP BOXES 1 0.5
OTHERS 10 5.0
TOTAL 200 100.0
1.5
3
90
0.55
NEAREST BANKPICKUP BOYCOLLECTION CENTERDROP BOXESOTHERS
From the above table, it shows that 1.5 percentage of the respondent that
they pay his bills through nearest banks, 3.0 percentages of the respondents that
they pay his bills through pickup boys, and 90.0 percentages of the respondents
that they pay receives the bills through collection centers, 0.5 percentages of the
respondents that they pay his bills through others. We can conclude that majority
were opinioned that, pay their bills through collection centers.
15. ARE YOU AWARE OF THE INTERNET FACILITY AVAILABLE IN
THE BSNL?
Table-4.15
OPINION POOL NO OF RESPONDENTS PERCENTAGE
68
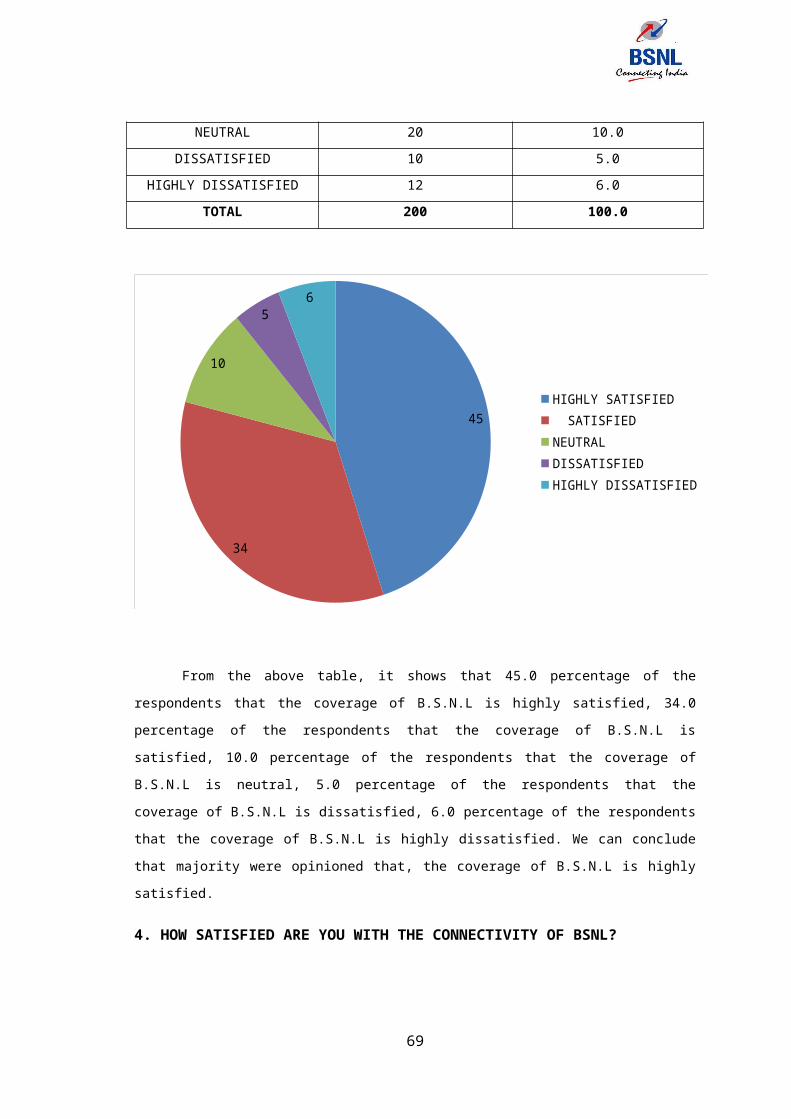
YES 200 100.0
NO 0 0
TOTAL 200 100.0
100
YESNO
The total sample size was 200 outlets in our analysis we has been 100
percentage opinioned that, they aware of internet facility available in B.S.N.L, 0.0
percentage opinioned that, they didn’t aware of internet facility available in
B.S.N.L. We can conclude that majority were opinioned that, aware of the internet
facility available in the B.S.N.L.
16. IF YES, WHICH INTERNET CONNECTION OF BSNL DO YOU
PREFER MOST?
Table-4.16
OPINION POOL NO OF RESPONDENTS PERCENTAGE
DIAL-UP(SANCHAR NET) 8 4.0
69

DIAL-UP(NET ONE) 7 3.5
BROADBAND 160 80.0
OTHERS 25 12.5
TOTAL 200 100.0
43.5
80
12.5
DIAL-UP(SANCHAR NET)DIAL-UP(NET ONE)BROADBANDOTHERS
From the above table, it shows that 80 percentage of the respondents
opinioned that, they using broadband, 4.0 percentage of the respondents opinioned
that, they using dial-up (sanchar net), 3.5 percentage of the respondents opinioned
that. Hence we can conclude that, majority of people using broadband connection
of B.S.N.L.
17. DOES THE BANDWIDTH PROVIDED FOR THE INTERNET IS
ENOUGH FOR YOUR USAGE?
Table-4.17
OPINION POOL NO OF RESPONDENTS PERCENTAGE
YES 110 55.0
NO 90 45.0
70
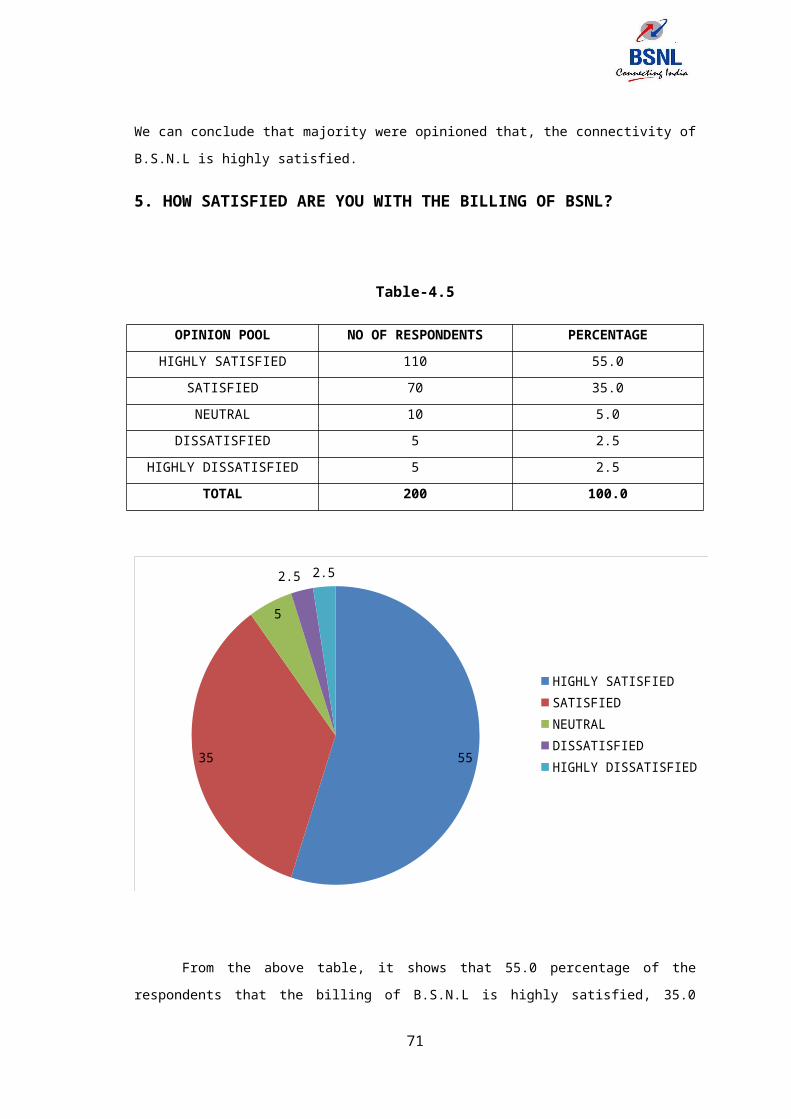
TOTAL 200 100.0
55
45YESNO
The total sample size was 200 outlets in our analysis we has been 55
percentage opinioned that ,the bandwidth provided for the internet is enough for
usage, 45.0 percentage opinioned that, the bandwidth provided for the internet is
not enough for usage. We can conclude that majority were opinioned that,
bandwidth provided for the internet is enough for usage.
18. HOW WOULD YOU RATE THE INTERNET CHARGES IN BSNL WHEN
COMPARED TO OTHER INTERNET SERVICE PROVIDERS?
Table-4.18
OPINION POOL NO OF RESPONDENTS PERCENTAGE
VERY HIGH 80 40.0
HIGH 70 35.0
MEDIUM 20 10.0
71

LOW 14 7.0
VERY LOW 16 8.0
TOTAL 200 100.0
40
35
10
7
8
VERY HIGHHIGHMEDIUMLOWVERY LOW
From the above table, it shows that 40 percentage of the respondents that,
the internet charges in B.S.N.L is very high, 35.0 percentage of the respondents
that, the internet charges in B.S.N.L is high, 10.0 percentage of the respondents
that, the internet charges in B.S.N.L is medium, 7.0 percentage of the respondents
that , the internet charges in B.S.N.L is low,8.0% of the respondents that , the
internet charges in B.S.N.L is very low. We can conclude that majority were
opinioned that, the internet charges B.S.N.L is very high.
19. HOW DO YOU FEEL ABOUT THE CUSTOMER CARE IN BSNL?
Table-4.19
OPINION POOL NO OF RESPONDENTS PERCENTAGE
HIGHLY SATISFIED 55 27.5
SATISFIED 63 31.5
NEUTRAL 15 7.5
DISSATISFIED 34 17.0
HIGHLY DISSATISFIED 33 16.5
TOTAL 200 100.0
72

27.5
31.5
7.5
17
16.5
HIGHLY SATISFIEDSATISFIEDNEUTRALDISSATISFIEDHIGHLY DISSATISFIED
From the above table, it shows that, 27.5 percentage of the respondents
that, the customer care in B.S.N.L is highly satisfied, 31.5 percentage of the
respondents that, the customer care in B.S.N.L is satisfied, 7.5 percentage of the
respondents that, the customer care in B.S.N.L is neutral, 17.0 percentage of the
respondents that, the customer care in B.S.N.L is dissatisfied, 16.5 percentage of
the respondents that, the customer care in B.S.N.L is highly dissatisfied. We can
conclude that majority were opinioned that, the customer care in B.S.N.L is
satisfied.
20. HOW DO YOU FEEL ABOUT THE CALL CHARGES OF BSNL WHEN
COMPARED TO OTHER SERVICE PROVIDERS?
Table-4.20
OPINION POOL NO OF RESPONDENTS PERCENTAGE
VERY HIGH 30 15.0
HIGH 25 12.5
MEDIUM 120 60.0
LOW 20 10.0
VERY LOW 5 2.5
TOTAL 200 100.0
73

15
12.5
60
10
2.5
VERY HIGHHIGHMEDIUMLOWVERY LOW
From the above table, it shows that, 15.0 percentage of the respondents
that, the call charges of B.S.N.L is very high, 12.5 percentage of the respondents
that, the call charges of B.S.N.L is high, 60.0 percentage of the respondents that,
the call charges of B.S.N.L is medium, 10.0 percentage of the respondents that, the
call charges of B.S.N.L is low, 2.5 percentage of the respondents that, the call
charges of B.S.N.L is very low. We can conclude that majority were opinioned that,
call charges of B.S.N.L is medium.
21. IN WHICH ARE OF BSNL DO YOU FREQUENTLY ENCOUNTER
PROBLEMS?
Table-4.21
OPINION POOL NO OF RESPONDENTS PERCENTAGE
BILLING 10 5.0
CONNECTIVITY 77 38.5
CUSTOMER CARE 45 22.5
SERVICE QUALITY 68 34.0
TOTAL 200 100.0
74
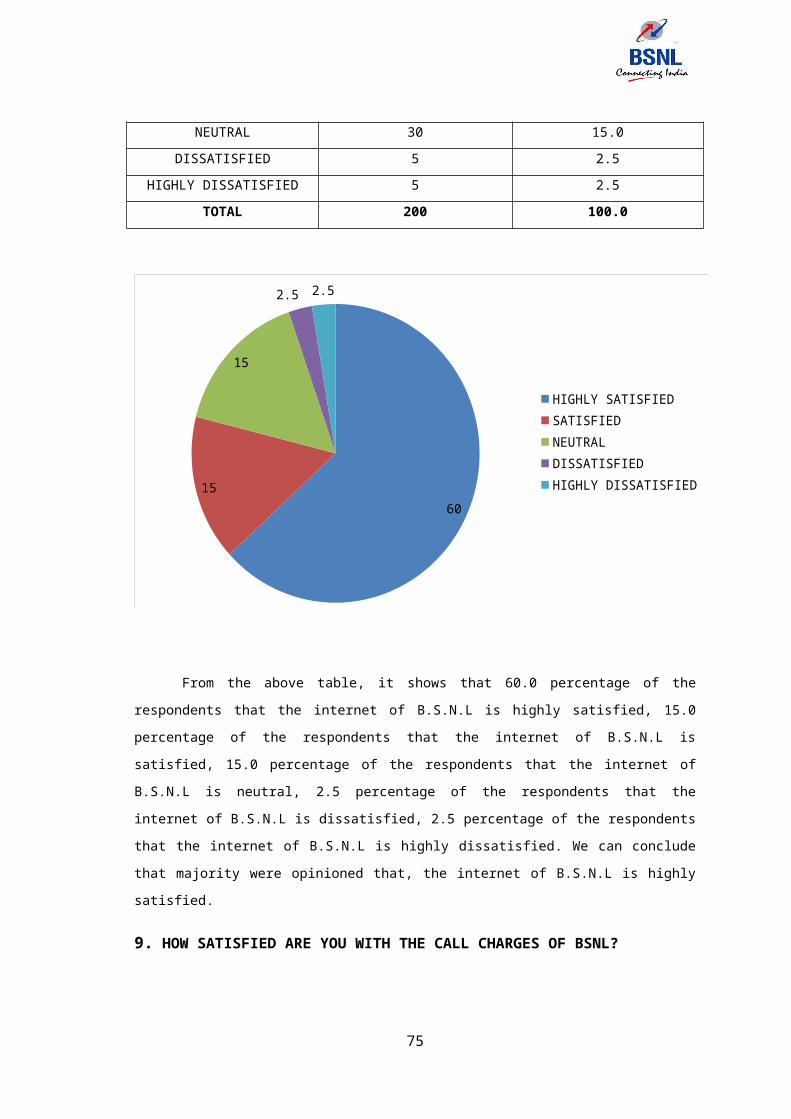
5
38.5
22.5
34
BILLINGCONNECTIVITYCUSTOMER CARESERVICE QUALITY
From the above table it shows that, 5.0 percentage of the respondents that,
the B.S.N.L frequently encounter problem is billing, 38.5 percentage of the
respondents that, the B.S.N.L frequently encounter problem is connectivity, 22.5
percentage of the respondents that, the B.S.N.L frequently encounter problem is
customer care, 34.0 percentage of the respondents that, the B.S.N.L frequently
encounter problem is service quality. We can conclude that majority were
opinioned that, the B.S.N.L frequently encounter problem is connectivity.
5.1 SUMMARY
In this chapter the overall summary was given briefly to understand the
total project at glance. The project entitled “A Study on Customer Satisfaction for
b.s.n.l landline and mobile services” with reference to” BHARAT SANCHAR NIGAM
LIMITED, Visakhapatnam” has been divided into five chapters to arrange the total
information in perfect manner.
First chapter includes the introduction, need for the study, objectives of the
study and limitations of the study. Through this chapter we can know the overview
of the BHARATH SANCHAR NIGAM LIMITED i.e. detailed manner. In the Introduction
(1.1). The details of the products and services supplied by a company meet or
surpass customer expectation. Industry, growth of the industry and the major
players of the industry and total details of the B.S.N.L. After giving the topic the
75

details of the company, the topic introduction was given like the definition of the
topic collected from different sources and the definition, the importance of the
study and use of the study to the company were clearly explained. This help to
understand why the researcher has chosen the topic as his project.
Customer satisfaction survey further illuminates the relationship between
the customer experience and business performance. Around the world, consumers
expect better service quality. It confirms that consumers are more likely to leave a
provider because of poor service than for any other reason. It also reveals that
service quality is the most powerful factor, more influential than price in choosing
providers or to do business with them.
Customer satisfaction ratings can have powerful effects. They focus
employees on the importance of fulfilling customers’ expectations. Furthermore,
when these ratings dip, they warn of problems that can affect sales and
profitability. These metrics quantify an important dynamic. When a brand has loyal
customers, it gains positive word-of-mouth marketing, which is both free and highly
effective. Therefore, it is essential for businesses to effectively manage customer
satisfaction. To be able do this, firms need reliable and representative measures of
satisfaction.
In researching satisfaction, firms generally ask customers whether their
product or service has met or exceeded expectations. Thus, expectations are a key
factor behind satisfaction. When customers have high expectations and the reality
falls short, they will be disappointed and will likely rate their experience as less
than satisfying. For this reason, a luxury resort, for example, might receive a lower
satisfaction rating than a budget motel—even though its facilities and service
would be deemed superior in 'absolute' terms.
Customer satisfaction provides a leading indicator of consumer purchase
intentions and loyalty. Customer satisfaction data are among the most frequently
collected indicators of market perceptions. Their principal use is twofold.
Within organizations, the collection, analysis and dissemination of these
data send a message about the importance of tending to customers and ensuring
that they have a positive experience with the company’s goods and services.
Although sales or market share can indicate how well a firm is performing
currently, satisfaction is perhaps the best indicator of how likely it is that the firm’s
customers will make further purchases in the future. Much research has focused on
the relationship between customer satisfaction and retention. Studies indicate that
the ramifications of satisfaction are most strongly realized at the extremes." On a
76
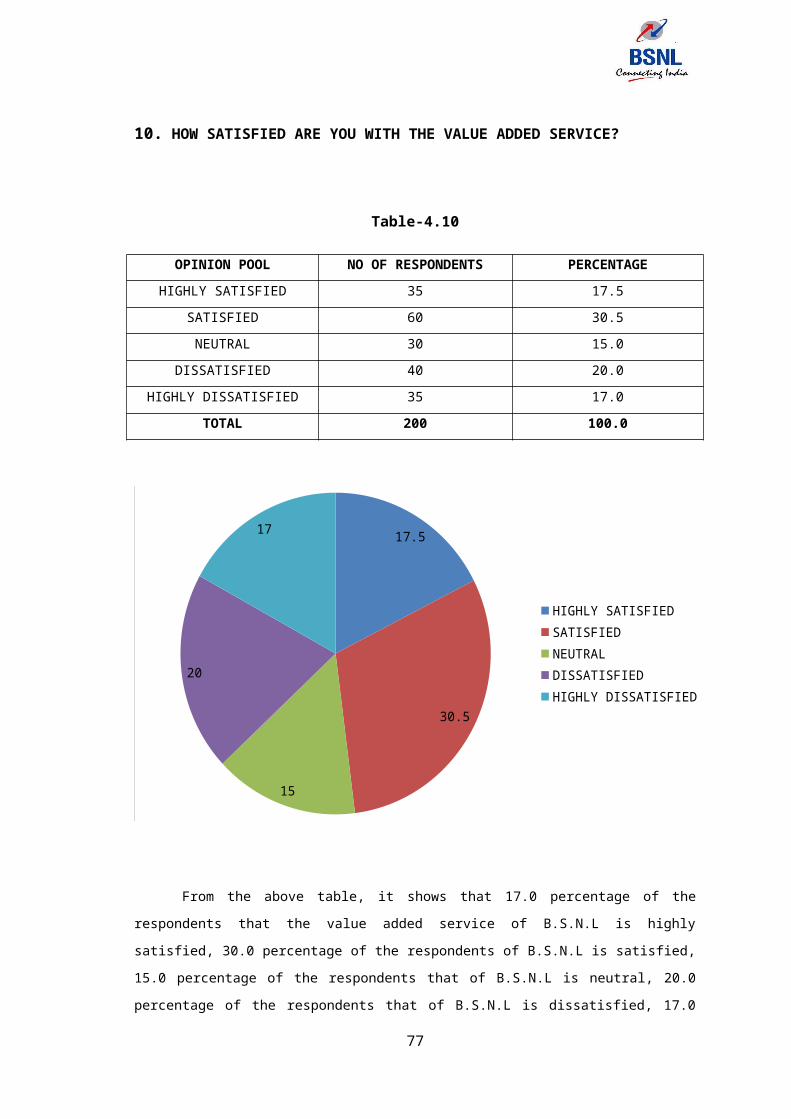
five-point scale, "individuals who rate their satisfaction level as '5' are likely to
become return customers and might even evangelize for the firm. (A second
important metric related to satisfaction is willingness to recommend. This metric is
defined as "The percentage of surveyed customers who indicate that they would
recommend a brand to friends." When a customer is satisfied with a product, he or
she might recommend it to friends, relatives and colleagues. This can be a powerful
marketing advantage.) "Individuals who rate their satisfaction level as '1,' by
contrast, are unlikely to return. Further, they can hurt the firm by making negative
comments about it to prospective customers. Willingness to recommend is a key
metric relating to customer satisfaction.
The BSNL, which is the Government origination, is successful because of
mass survey conducted through the sales force. By following different effective
strategies and planning procedures it is running its business successfully. So it is
enjoying high customer loyalty as there is high customer satisfaction. Hence
customer satisfaction is one of the key elements for achieving good results.
After the introduction the “Need for the Study (1.2)” has been explained
briefly. In this, why the investigator has chosen that the topic and what can she
gets from that study and how it is useful to him is explained briefly. Because
without any need the study will not be conducted. In the modern era building
customer satisfaction and loyalty is a key we say to profitable business. The current
trend for businesses is to become 'customer-centric', that is, to put the customer at
the center of our business in terms of our strategies, actions and processes. Many
organizations now approach the 'lifetime value' of customers and seek to increase
it.
The importance of customer satisfaction was a hot business topic in the
1980s, as customer satisfaction was considered the best window into loyalty. It
seems self-evident that companies should try to satisfy their customers. Satisfied
customers usually return and buy more, they tell other people about their
experiences.
A market trader has a continuous finger on the pulse of customer
satisfaction. Direct contact with customers indicates what he is doing right or
where he is going wrong. Such informal feedback is valuable in any company but
hard to formalize and control in anything much larger than a corner shop. For this
reason surveys are necessary to measure and track customer satisfaction.
77
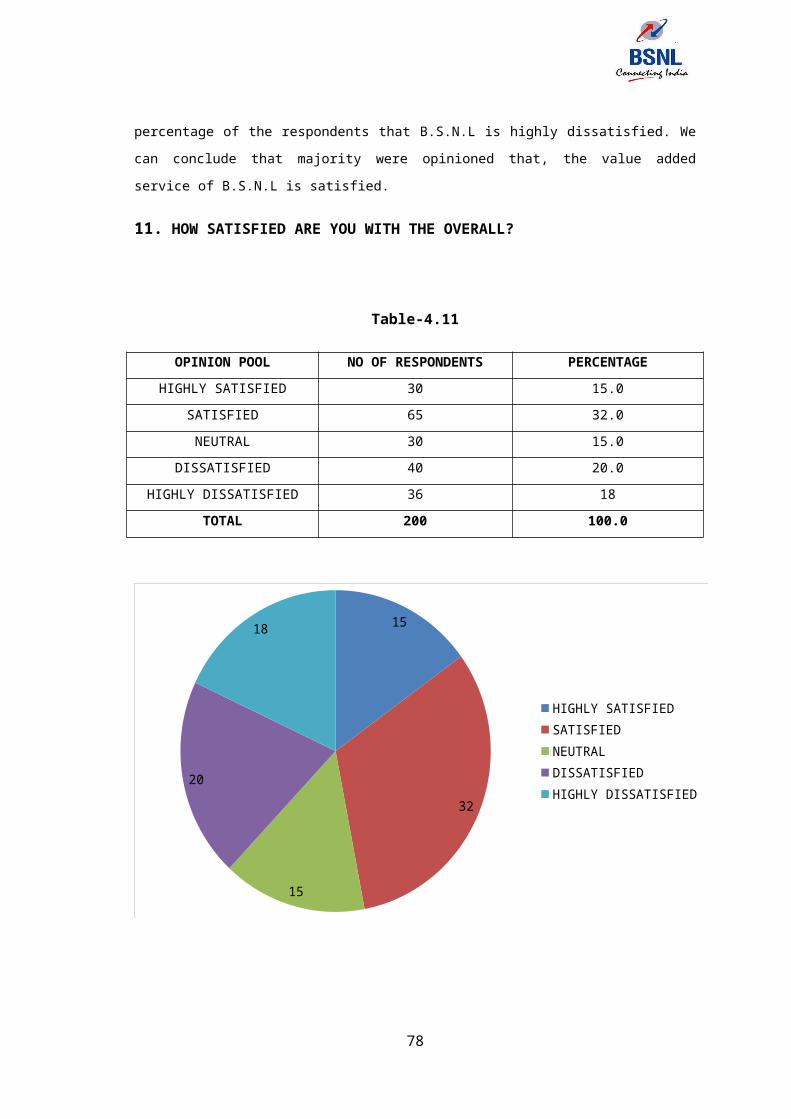
In customer satisfaction research we seek the views of respondents on a
variety of issues that will show how the company is performing and how it can
improve. It is wise to cross check the internal views with a small number of depth
interviews with customers. In any customer satisfaction survey there will be quick
fixes – actions that can be taken today or tomorrow that will have immediate effect.
The purpose of customer satisfaction research is to improve customer
satisfaction and yet so often surveys sit collecting dust. Worse than that, customers
have generously given their time to assist in the survey believing that some
positive action will take place. Their expectations will have been raised. The
process of collecting the data seems easier than taking action to improve
satisfaction levels.
The key to customer retention is customer delightment. A highly satisfied
customer stays loyal longer, talks favorably about the organization and its
products; offers product or service ideas to the organization and costs less to serve
the new customers. Today more organizations are recognizing the importance of
satisfying and retaining current customers.
It is not enough to be skillful in attracting new customers, the organization
must keep them. Today’s organization must pay closer attention to the customer
defection rate (the rate at which they lose customer).
Here in case of BSNL thus the need for study on customer satisfaction is
important since it is highly depending on the customer opinions and expectations
there by using that information to change its strategies.
After explaining the need of the study the ‘Objectives of the Study (1.3)’ was
given. In this part, what information the investigator wanted collect and why she
wanted to the project in that particular company and what goal she wanted to
reach though this project has been clearly explained.
To study the overview of B.S.N.L
To determine customer preferences of landline and mobile services.
To evaluate the customer satisfaction level for mobile services as well as
landline services.
To analyze the customer opinion and satisfaction with specific reference to
BSNL.
78
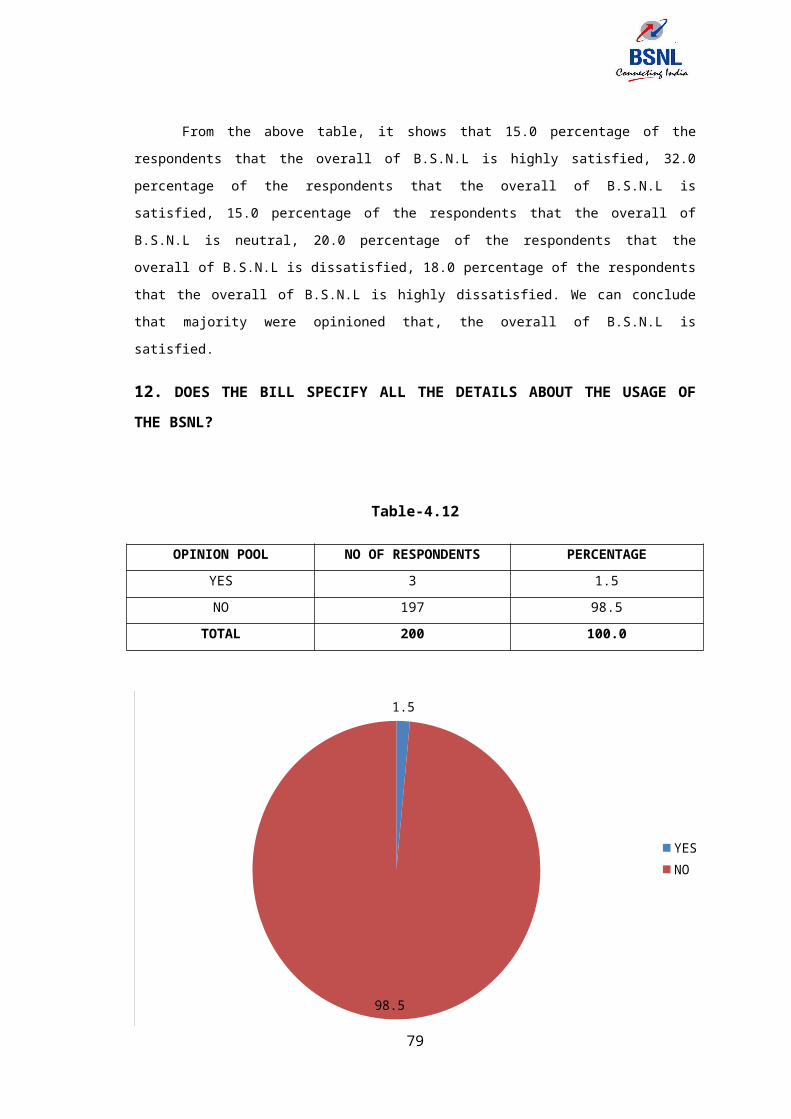
To suggest some guidelines for BSNL in order to provide better .
Focused services.
After explaining the objectives of the study ‘methodology’ was given in1.4.
How the total information was collected from the customers was explained in this
chapter. How the primary data and the secondary data were collected and what are
the sources are like what are the books referred and what are the websites
browsed were explained in this chapter. The information about questionnaire, how
many customers were taken as sample size, what type of sample techniques and
what are techniques used for analysis of the data also explained in this
chapter.This clearly explains the data that we are considering. Finally the
‘Limitations of the Study (1.5)’ were given in the next part. Forever study there will
be some limitation and we may call those as hurdles for the study. The limitations
may call those as hurdles for the study. The limitations may be the time limits,
financial limits or troubles from the environment. In this study environment means
the markets and the lack of awareness in the retailer.
Second Chapter includes history of telecom industry in india, genesis and growth
of the company, organization structure of the company, all the functional areas like
marketing, HR, finance and production, finally the future trends of the company.
All these functions are explained. In ‘History of telecom industry in India
(2.1) The second chapter deals with introduction of the industry. Indian telecom
sector is more than 165 years old. Telecommunications was first introduced in India
in 1851 when the first operational land lines were laid by the government near
Kolkata (then Calcutta), although telephone services were formally introduced in
India much later in 1881. Further, in 1883, telephone services were merged with
the postal system. In 1947, after India attained independence, all foreign
telecommunication companies were nationalised to form the Posts, Telephone and
Telegraph (PTT), a body that was governed by the Ministry of Communication. The
Indian telecom sector was entirely under government ownership until 1984, when
the private sector was allowed in telecommunication equipment manufacturing
only. The government concretised its earlier efforts towards developing R&D in the
sector by setting up an autonomous body – Centre for Development of Telematics
(C-DOT) in 1984 to develop state-of-the-art telecommunication technology to meet
the growing needs of the Indian telecommunication network. The actual evolution
of the industry started after the Government separated the Department of Post and
Telegraph in 1985 by setting up the Department of Posts and the Department of
Telecommunications (DoT).
79

The Second Chapter includes genesis and growth of the company,
organization structure of the company, all the functional areas like marketing,
finance, HR and finally the future trends of the company.
All these functions are explained. In ‘Genesis and Growth of the Company,
the origin of the telecom industry and BSNL and its gradually growth of the
company has been explained. The growth of the company has shown year by year.
After the explanation genesis and growth of the company the Organization
Structure of the company and its importance and the use has been explained with
the organization chart of the company. By using the organization chart we can
understand the position of the management. In that company and the relation
between the superiors and subordinates in the company. The organization
structure can decided the future of the company whether it is going to be
successful or a failure one. After this ‘The Marketing Function of the company has
been explained in a very detailed manner. In the marketing strategies of the
company and the technique of the company has been explained. After the
marketing function the ‘Finance Functions of the company has been explained in a
very detailed manner. In the Financial Functions of the company and the Financial
technique of the company has been explained. After the Finance function the HR
Functions of BSNL Services has been explained. BSNL was providing health and
welfare activities. After the HR Functions the future plans of the company was
explained very clearly point by point.
BSNL should change its very strategy of acting as follower to that of
leader.
Instead of reacting to other operators move it should start acting
proactively
The overall strategy of BSNL can be of concentrating on the mobile
and broadband business in near future and to immediately phase out
loss making businesses like telegraph.
BSNL can leverage on its pan India reach and economies of scale to
achieve overall cost leadership.
At the same time capital investments can be made in next
generation networks where stress should be on Wi-Max, content
based data service and VOIP
Emphasis on organizational restructuring coupled with customer
Orientation and operational efficiency can help BSNL find place in
Asian Telecom market.
80

BSNL provides a wide range of services including landline, cellular (GSM and
CDMA), Managed Services Network, MPLS VPN, VSAT, VoIP, VAS, audio, video and
web conferencing, internet and broadband services among others. The company
provides Internet services, under the brand name Sancharnet, through various
modes that include Wi-Fi, Broadband, Direct Internet Access (DIAS), ISDN and PSTN
dial-up services. The company also carries on activities of planning, installing,
network integration and maintenance of switching and transmission networks.
In ‘Genesis and Growth of the Company (2.2)’, the origin of the BSNL and its
gradually growth of the company has been explained. The growth of the company
has shown year by year. After the explanation genesis and growth of the company
the ‘Organization Structure (2.3)’ of the company and its importance and the use
has been explained with the organization chart of the company. By using the
organization chart we can understand the position of the management. In that
company and the relation between the superiors and subordinates in the company.
The organization structure can decided the future of the company whether it is
going to be successful or a failure one.
Third chapter includes the theoretical framework. In this chapter, detail
information of the customer satisfaction. In this chapter, it clearly shows that what
is satisfaction, need of internal customer satisfaction, benefits of internal customer
satisfaction, external customer-supplier relationship, satisfactions, customer value,
delivering customer value and satisfaction, internal record system, the marketing
intelligence system (MIS),customer experience, customers analysis, customer
perceived value, Measuring customer satisfaction, Seven Steps Of Customer
Satisfaction, Encourage Face-to-Face Dealings, Respond to Messages Promptly &
Keep Your Clients Informed, Be Friendly and Approachable, Have a Clearly-Defined
Customer Service Policy, Attention to Detail also known as ‘The Little Niceties,
Anticipate Client’s Needs & Go Out Of Your Way to Help Them Out, Honor Your
Promises, Role of Customer satisfaction in Marketing, it creates better teamwork
and an improved work process. The benefits of internal customer satisfaction are
as follows:
o It leads to higher output and superior quality product.
o It decreases the turnover.
o Reduced overheads, and increase customer satisfaction level’s inter
departmental.
o It enhances communication and hence helped in team building, hence there
is less wasted effort caused by lack of common purpose and poor
communication.
81

o A good employee feedback survey improves employee attitude and boosts
morals
With the above development marketing has taken major shifts in the past tow
decades from the traditional production concept to product concept. TO selling
concept because of the liberalization policies adopted by many nations the markets
or developing countries are flooded buy the wide variety of products giving both to
a new concept that is selling concept. This concept holds that “Consumers and
business, if -left above, will ordinarily not bay enough of the organizations products
the organizations must therefore, undertake an aggressive selling and promotion
effort.
According to this concept the consumers must be induced to bay products more
and more with the help of effective selling and promotional tools. This philosophy
worked for the companies seeking short run results, but not for the long run.
Because if gives more emphasis to pushing the products into the markets whether
they may or may not have the potential. In recent years with the growing number
of MNC’s and domestic companies a wide assertion of products, and service were
available to the consumers. This shift in market place gave birth to a new concept
what is called marketing concept. According to this concept, the key to achieving
its organizational, goals consists of the company being more effective than
competitors in creating, delivering and communicating consumer value to its
chosen target markets.
Fourth chapter includes the Analysis and Interpretation of the Study. It contains
lot of valuable information regarding the company and also the customer has been
collected from the survey, which helped me to clearly understand the customer
satisfaction on B.S.N.L.
Fifth chapter includes the summary, findings of the study, suggestions and
conclusion which were given to the company. Summary is a tool to understand the
total study of the investigator at a glance very briefly. In this summary the details
of each and every chapter were kept to make the observer understood the total
project clearly. After the summary part the findings from the study were given. All
the findings are picked out from the interpretations of the collected data. After the
findings of the study part, the suggestions were given to observations that we have
observed through the whole project. These suggestions may be useful to rectify to
the faults of the company. Finally the conclusion that we have established through
project. Finally appendix of the analysis and data interpretation and the
bibliography were attached to the project work, which were used to complete the
project successfully.
82
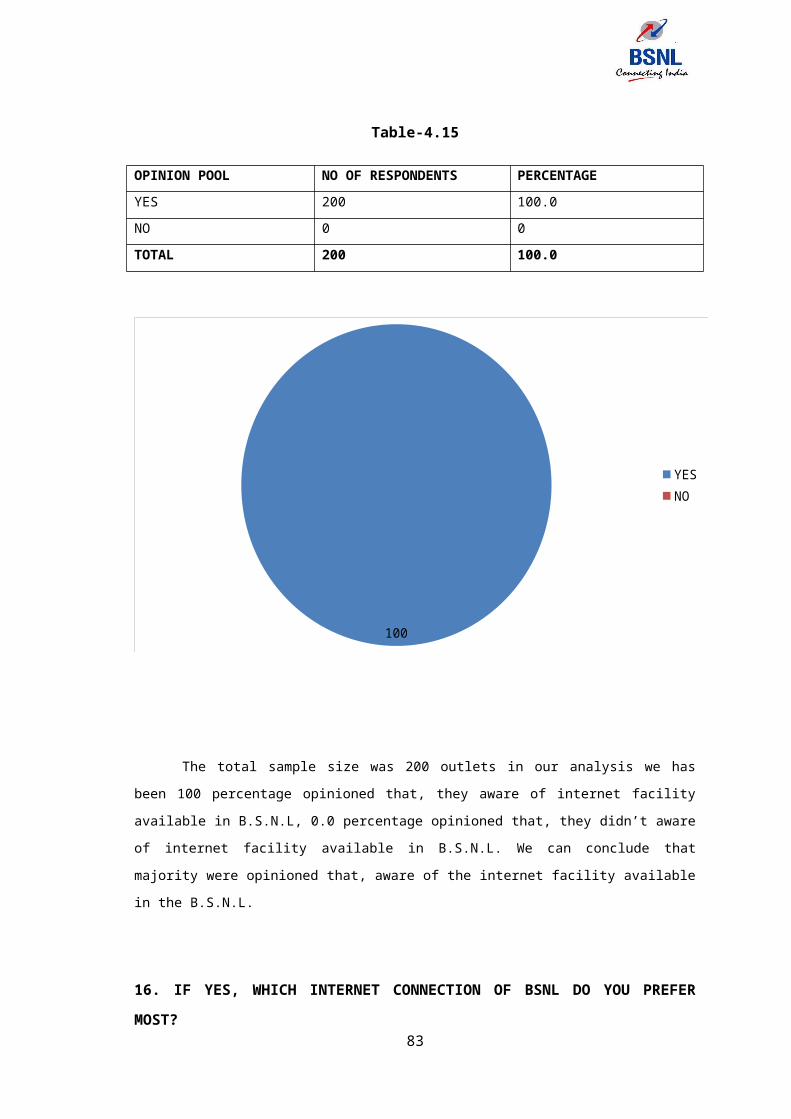
83
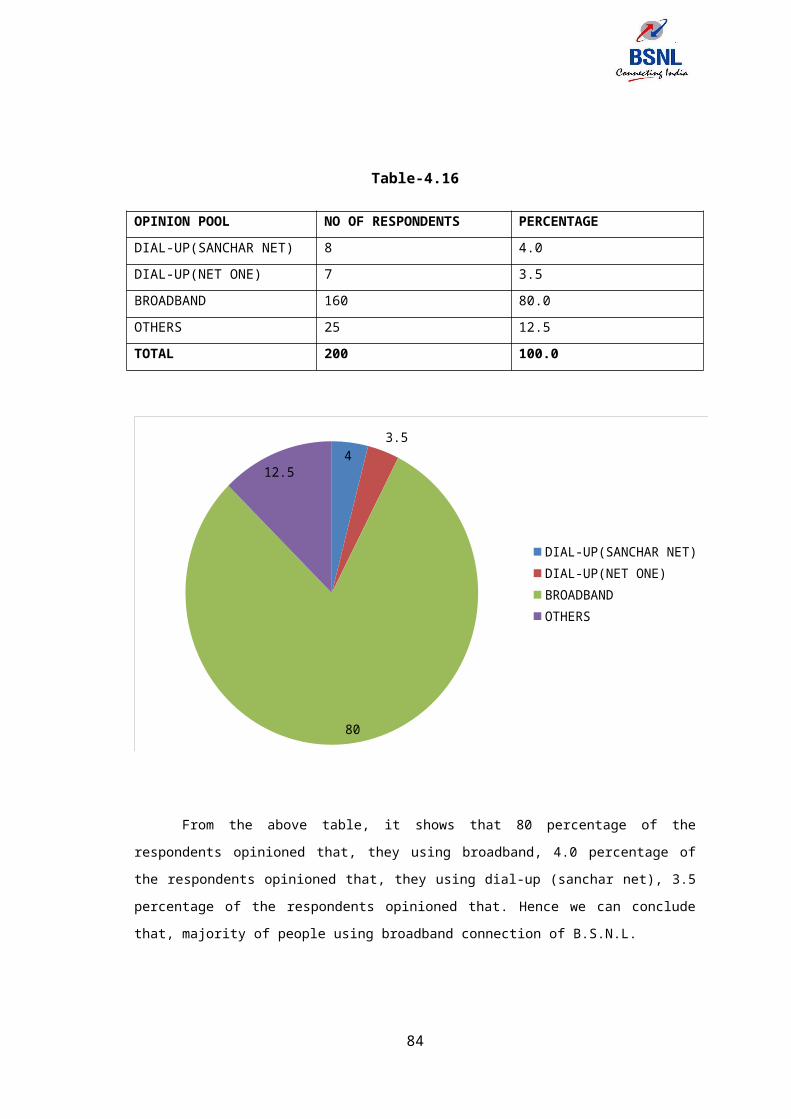
5.2 FINDINGS
1. A good majority of respondents (55.0%) were using B.S.N.L for personal
purpose while (45.0%) while using B.S.N.L for business purpose.
2. A good majority of respondents (30.5.0%) where “Satisfied” with the value
added services of B.S.N.L, while the least (5.0%) where “Neutral” with the
value added services of B.S.N.L.
3. A good majority of respondents (45.0%) where “Highly Satisfied” with the
Connectivity of B.S.N.L, while the least (5.0%) where “Dissatisfied” with the
connectivity of B.S.N.L.
4. A good majority of respondents (55.0%) where “Highly Satisfied” with the
billing of B.S.N.L, while the least (2.5%) where “Dissatisfied” and “Highly
Dissatisfied” with the billing of B.S.N.L.
5. A good majority of respondents (60.0%) where “Highly Satisfied” with the
handset of B.S.N.L, while the least (2.0%) where “Highly Dissatisfied” with
the handset of B.S.N.L.
6. A good majority of respondents (35.0%) where “Highly Satisfied” with the
quality of service of B.S.N.L, while the least (5.0%) where “Neutral” with the
c quality of service of B.S.N.L.
7. A good majority of respondents (60.0%) where “Highly Satisfied” with the
internet of B.S.N.L, while the least (2.5%) where “Dissatisfied” and ‘Highly
Dissatisfied’ with the internet of B.S.N.L.
8. A good majority of respondents (30.0%) where “Neutral” with the call
charges of B.S.N.L, while the least (12.0%) where “Highly Dissatisfied” with
the call charges of B.S.N.L.
9. A good majority of respondents (30.5.0%) where “Satisfied” with the value
added services of B.S.N.L, while the least (5.0%) where “Neutral” with the
value added services of B.S.N.L.
10. A good majority of respondents (32.5.0%) where “Satisfied” with the overall
of B.S.N.L, while the least (15.0%) where “Neutral” with the overall of
B.S.N.L.
11. It can be observed that majority of respondents says B.S.N.L doesn’t specify
all the details about the usage of the B.S.N.L.
12. A good majority of respondents (65.5.0%) where “Regular” with the receive
the bill on time, while the least (2.0%) where “Irregular” to receiving the
bills on time.
13. It can be observed mostly respondents should pay the bill through
collection centers some respondents only pay the bills through nearest
banks, pickup boys, drop boxes.
14. All are respondents aware of the internet facility available in the B.S.N.L.
84

15. In internet connections most of the people using broadband connections
some people only using dial-up (sanchar net) and dial-up (net one).
16. Majority of people bandwidth provide for the internet is enough for usage
17. It can be observed that very high of internet charges in B.S.N.L compared to
other internet service providers.
18. A good majority of respondents satisfied with the customer care in B.S.N.L.
19. Compared with other networks call charges of B.S.N.L medium.
20. It can be observed that 38.5% opinioned, the frequently encounter problem
is connectivity, while the next 34.0% opinioned, the problem is in service
quality.
85

5.3 SUGGESTIONS
1. From the research study, it has been found out that the customers are very
particular about the quality of the Telecom services and hence they want
BSNL to increase the quality of BSNL services by providing the customers an
attractive instrument with new wiring connections.
2. BSNL may also introduce some sales promotion such as cash discounts;
quality offers hence the promotional activities would further strengthen the
market share of the Company.
3. BSNL may reduce the monthly rentals and also the service tax.
4. Caller Id’s should be provided immediately after the customer’s requisition.
5. Customer care of BSNL needs improvement with respect to the call handling
management.
6. BSNL may reduce the internet charges.
86
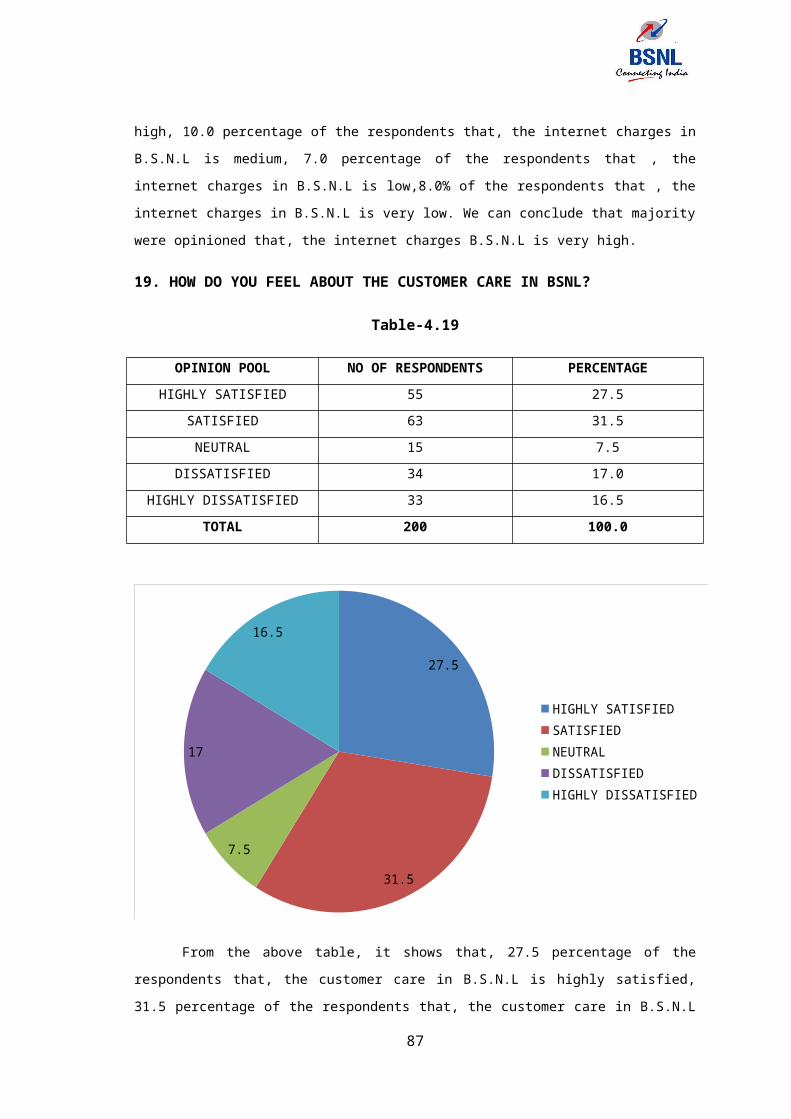
5.4 CONCLUSION
BSNL being a public sector, in order to thrive and excel, I had understood about the
customer’s expectations. I also understood about their competitors and their
nuances in understanding their customers. Since communication industry is very
competitive one it is high time for BSNL to understand about their customers in
landline as well as Mobile services.
APPENDIX
87

Respected Sir/madam,
I am TADI DILEEP studying M.B.A, 3rd semester with HR
specialization in AITAM SCHOOL OF COMPUTER SCIENCES AND
MANAGEMENT (ASCAM), Tekkali. I will sure that the information provided by
you can be kept as confidentially and it is only for my academic purpose. So
please cooperate with me.
A. BASIC INFORMATION
1. Name of the Respondent:
2. Sex:
3. Age:
4. Occupation:
5. What is your average monthly income?
B. SPECIFIC INFORMATION
6. For which purpose you mostly use BSNL services?
Personal Business
7. What is your monthly average bill?
Below Rs.500 Rs. 500-1000 Rs. 1000-1500 Rs. 1500-2000 Above 2000
8. Rate the services offered by BSNL according to your satisfaction level
Services Highly
Satisfied
Satisfi
ed
Neutr
al
Dissatis
fied
Highly
Dissatisfied
Coverage
Connectivity
Billing
Handset
Quality of
Service
Internet
Call charges
Value added
service
88

Overall
9. Does the bill specify all the details about the usage of the BSNL?
Yes No
10. Do you receive your bill on time?
Regular Mostly Neutral Rarely Irregular
11. Please rank your preference to pay your BSNL bill?
Nearest Bank Pickup boy Collection Center Drop Boxes Others
12. Are you aware of the internet facility available in the BSNL?
Yes No
13. If yes, which internet connection of BSNL do you prefer most?
Dial-Up (Sanchar Net) Dial-Up (Net One) Broadband Others
14. Does the bandwidth provided for the internet is enough for your usage?
Yes No
15. How would you rate the internet charges in BSNL when compared to other
internet service providers?
Very High High Medium Low Very Low
16. How do you feel about the customer care in BSNL?
Highly Satisfied Satisfied Neutral Dissatisfied Highly Dissatisfied
17. How do you feel about the call charges of BSNL when compared to other
service providers?
Very High High Medium Low Very Low89
18. In which are of BSNL do you frequently encounter problems?
Billing Connectivity Customer Care Service quality
90

BIBLIOGRAPHY
Books:
Kotler, P (2002),”Marketing Management”, Millennium Edition, Tenth Edition,
Prentice Hall, Inc, A Pearson Education Company, Upper Saddle River, New
Jersey ,pp.
Biplab S.Bose(2007),” Marketing Management”, First Addition, Himalaya
Publishing House.
Dr.S.L.Guptha “Brand management” (An Indian Perspective),Himalaya
publishing house
Journals:
Indian Journal of Marketing, Vol. XXXVIII. May 2008
The ICFAI Journal of Marketing Vol. I. February 2007
Reports:
Annual records and reports of the BSNL Company.
Previous project records at the company.
Websites:
www.bsnlindia.com
www.bsnl.in
91