final press release 30 june 2013 - altii fondsportal release 2 august 2013 interim results for the...
TRANSCRIPT

1
Press Release 2 August 2013
INTERIM RESULTS FOR THE SIX MONTHS ENDED 30 JUNE 2013 Key points • Funds under management (FUM) at 30 June 2013 of $52.0 billion (31 December 2012:
$57.0 billion), reflecting sales of $6.5 billion, redemptions of -$11.5 billion, investment movement of
$2.5 billion, FX translation effects of -$2.4 billion and other movements of -$0.1 billion
• Mixed performance in the six months to 30 June 2013: AHL Diversified Programme -3.2%; GLG Multi-
Strategy +5.1%; FRM Diversified II strategy +3.1%; Japan CoreAlpha strategy +41.4%
• Adjusted profit before tax (PBT) of $134 million, comprising adjusted net management fee PBT of $64
million and net performance fee PBT of $70 million
• Statutory profit before tax for the six months ended 30 June 2013 of $122 million
• Adjusted EBITDA of $237 million, with a margin of 41%
• Cost saving programmes remain on track with further efficiencies identified bringing total cost savings
to $270 million in aggregate to be delivered by the end of 2015
• Surplus regulatory capital of $990 million at 30 June 2013 (up to $550 million pro-forma for remaining
debt buybacks, restructuring charges and interim dividend), subject to ICAAP review by FCA
• Interim dividend of 2.6 cents per share in line with revised dividend policy
Summary financials Page
ref. Six months
Ended30 June
2013
Year ended31 December
20121
Six months ended
30 June 20121
$ $ $
Funds under management (end of period) 9 52.0bn 57.0bn 52.7bn Gross management and other fees 24 529m 1,209m 629m
Performance fees 24 90m 90m 28m
Gains on investments and other financial instruments 23m 23m 4m
Share of after tax profit of associates 6m 10m 5m
External distribution costs 24 (80m) (203m) (114m)
Net revenues 568m 1,129m 552m
Compensation (including internal distribution costs) 25 (239m) (475m) (234m)
Other costs (including asset servicing) 26 (150m) (338m) (174m)
Net finance expense2 26 (45m) (41m) (22m)
Adjusted profit before tax 23 134m 275m 122m
Adjusting items 23 (12m) (1,023m) (285m)
Statutory profit/(loss) before tax 122m (748m) (163m)
Diluted statutory EPS 27 5.3c (45.8)c (10.7)c
Adjusted diluted EPS 27 5.7c 11.6c 4.8c
Adjusted diluted management fee EPS 27 2.6c 9.2c 4.3c
1 Restated for the impact of IAS 19 (Revised). Refer to Note 1 to the financial statements (page 22). 2 Includes one-off costs related to the debt buy-backs of $28 million in the six months to 30 June 2013. Refer to Note 9 in the financial statements (page 26).

2
Manny Roman, Chief Executive Officer of Man, said: “While the first quarter of the year benefited from a more stable environment in financial markets, the
second quarter was characterised by renewed volatility.
Against this background, Man’s investment performance was varied: good in discretionary and
challenging in trend following. In terms of flows, investor appetite remained muted as renewed market
volatility tempered investors’ willingness to put their money to work. A sustained improvement in
investment performance, particularly from AHL, remains the key prerequisite for an improvement in net
flows.
Management remains focused on running the business efficiently. The operating cost savings announced
in 2012 have now been executed and during the process further savings have been identified, including
some relating to the lower level of the guaranteed book. At the same time, we have continued to invest in
people and products, for example building the fixed income and macro platform at GLG and developing
successful, high-performing quantitative products, such as Evolution.
Looking forward, trading conditions remain tough and we do not see any improvement in the near-term
outlook. However our focus on investment performance, together with the actions we have taken to
diversify the Group’s investment management activities, enhance distribution, de-risk our balance sheet
and reduce our infrastructure costs mean we are better placed to cope with such circumstances. We
intend to continue with this approach but it will take time.”
Dividend
As announced in March 2012, Man’s dividend policy going forward is to pay at least 100% of adjusted
management fee earnings per share in each financial year by way of ordinary dividend. In addition, the
Group expects to generate significant surplus capital over time, primarily from net performance fee
earnings. Available surpluses, after taking into account required capital, potential strategic opportunities
and a prudent buffer, will be distributed to shareholders over time, by way of higher dividend payments
and/or share repurchases. Whilst the Board continues to consider dividends as the primary method of
returning capital to shareholders, it will continue to execute share repurchases when advantageous.
In line with this policy the Board has declared an interim dividend for the year to 31 December 2013 of 2.6
cents per share, being the adjusted management fee earnings per share for the six months to 30 June
2013 (refer to Note 11 to the financial statements (page 27)). The interim dividend will be paid at the rate
of 1.72 pence per share.
Dates for the 2013 interim dividend
Ex dividend date 14 August 2013 Record date 16 August 2013 Dividend paid 4 September 2013

3
Results presentation, audio webcast and dial in details
There will be a presentation by the management team at 8.30am (UK time) and there will be a live audio webcast available on https://www.man.com/GB/results and video.merchantcantos.com which will also be available on demand from later in the day. The dial-in and replay telephone numbers are as follows:
Live Conference Call Dial in Numbers: UK Toll Number: 0203 426 2887 UK Toll-Free Number: 0808 237 0035 US Toll Number: +13473291282 US Toll-Free Number: 18778414558 30 Day Replay Dial in Numbers: UK Toll: 020 3426 2807 UK Toll Free Number: 0808 237 0026 US Toll Free Number: 18665358030 Playback Pin Code: 640861#
Enquiries
Fiona Smart Head of Investor Relations +44 20 7144 2030 [email protected] David Waller Head of Communications +44 20 7144 2121 [email protected] RLM Finsbury James Bradley Ryan O’Keeffe +44 20 7251 3801 About Man Man is a world-leading alternative investment management business. It has expertise in a wide range of
liquid investment styles including managed futures, equity, credit and convertibles, emerging markets,
global macro and multi-manager, combined with powerful product structuring, distribution and client
service capabilities. As at 30 June 2013, Man managed $52.0 billion.
The original business was founded in 1783. Today, Man is listed on the London Stock Exchange and is a
member of the FTSE 250 Index with a market capitalisation of around £1.5 billion. Man is a signatory to
the United Nations Principles for Responsible Investment (PRI). Man also supports many awards,
charities and initiatives around the world, including sponsoring the Man Booker literary prizes. Further
information can be found at www.man.com.
Forward looking statements and other important information This document contains forward-looking statements with respect to the financial condition, results and
business of Man Group plc. By their nature, forward-looking statements involve risk and uncertainty and
there may be subsequent variations to estimates. Man Group plc's actual future results may differ
materially from the results expressed or implied in these forward-looking statements.
The content of the websites referred to in this announcement is not incorporated into and does not form
part of this announcement. Nothing in this announcement should be construed as or is intended to be a
solicitation for or an offer to provide investment advisory services.

4
CHIEF EXECUTIVE’S REVIEW
The six months to 30 June 2013 have been challenging, in terms of trading conditions, investor appetite and the fundamentals of our business. In a difficult environment we have made good progress against our key priorities particularly in relation to cost reduction and balance sheet efficiency, but as set out on page 7, have fallen behind in respect of other key performance indicators.
Market overview
The first half of the year broadly divided into two distinct investment phases. Up until the end of April we saw reduced correlation between asset classes and the reassertion of trends, off the back of the risk rally triggered by the US ‘fiscal cliff’ being averted, some positive key data points in the US and China and a significant shift of investors from bonds to equities.
By contrast the period from mid-May to the end of June proved to be very a volatile and difficult one for most markets, as news that the Fed’s assets purchase programme could be reduced as early as mid-2013 dominated sentiment. Markets viewed the announcement as a signal that the climate of historically low rates and Federal support was likely to end earlier than was previously expected. Investors reacted negatively and the bond market sold-off as investors de-levered and de-risked fixed income portfolios. Investment performance Against this backdrop performance across our three investment managers was varied. AHL performance in 2013 started on a positive note, with long positions in bonds and stocks contributing the most to performance to the end of April. May and June proved to be difficult months for CTAs, with bond markets pulling back sharply as the Federal Reserve announced it may taper monetary stimulus, hurting long positions. Risk exposures to fixed income were systematically reduced in response to the sell-off and rise in volatility. Short positions in gold and base metals helped mitigate some of these losses, as prices fell in response to the comments made by the Federal Reserve and credit tightening in China. The result was that performance for the AHL Diversified Programme was down 3.2% to 30 June 2013, ahead of Bluetrend1 (down 10.4%) but behind Aspect2 (down 0.9%). AHL Alpha, the lower-volatility strategy, was down 2.6% while Winton3 was up 2.7%. Performance for the newer Quant strategies was better with the AHL Evolution strategy up 4.6% and the AHL Dimension strategy up 1.4% for the period. MSS’s Europe Plus strategy was up 7.1% year to date in line with benchmark, whilst TailProtect was down 7.3%, some 10.8% ahead of its benchmark. Discretionary hedge fund performance over the first half was strong and broad based, with almost all strategies delivering positive absolute returns. Some of the stronger performers included Atlas Macro (+7.2%), Euro Distressed (+5.1%) and European long short (+4.7%), with GLG Multi-Strategy which allocates across a range of internal styles finishing the period up 5.1%. It was particularly pleasing that many strategies performed well during a volatile month for markets in June, and by illustration, GLG Multi-Strategy achieved positive performance for the month (+0.6%). Performance was also strong within some of our key long only strategies, in both absolute and relative terms. In particular our Japan CoreAlpha strategy outperformed by 8.1% and our global equity strategy built on strong recent performance and outperformed by 1.3% in the last six months. This strong performance resulted in GLG recording $59 million of performance fees in the first half. FRM had a broadly positive first six months of the year, as market conditions improved for hedge funds from 2012; dispersion between assets, both intra and inter market, increased and equity markets were fundamentally priced on strong investor inflows. Equity Long-Short managers made good use of this; strong stock picking helped them to be among the top performing styles over the six months. Relative Value strategies also worked well, with Event arbitrage strategies profiting despite the perceived lack of corporate activity. Global Macro strategies were amongst the worst performing strategies, with Managed Futures allocations particularly struggling through May and June. As a result investment movement across
1 Bluetrend: Represented by Bluecrest Capital Management Ltd: Bluetrend Managed Futures
2 Aspect: Represented by Aspect Capital Limited: Aspect Diversified program.
3 Winton: Represented by Winton Capital Management Ltd: Diversified Trading Program

5
the FRM assets was flat. Actively managed flagship diversified portfolios with exposure across styles, such as FRM Diversified II and Man Absolute Return Strategies performed well, with year to date returns of +3.1% and +2.8% respectively. However, exposure to Managed Futures strategies lost money, with the FRM Sigma strategy returning -3.1% and the Man Managed Futures strategy returning -6.0%. There were also generally negative returns from portfolios in wind-down, and from non-discretionary relationships in which the clients have full control of asset allocation. Growth opportunities On the quantitative side, we announced on 10 July the launch of an alternative fixed income fund in UCITS format in conjunction with Nomura. The marketing of the Evolution strategy is progressing well and there have been sales of $400 million to date in 2013. Work is also on-going to launch a series of long only products similar to the Europe Plus strategy which has $1.4 billion of assets, with a focus on Asia and Emerging Markets. On the discretionary side a value-driven total return fund launched on 29 July. The Fund is managed by the Macro and Relative Value Team headed up by Jamil Baz and Sudi Mariappa. James Ind joined recently to lead the portfolio management of that strategy, having previously held similar positions at Russell, Merrill Lynch and Mercury Asset Management. Marketing will initially start in the UK retail space, before extending more broadly as the track record builds up. A global rates fund will launch during the second half of 2013. This fund will pursue a Fixed Income Absolute Return Strategy and will be managed by Sudi Mariappa, Mohit Kumar and the Macro and Relative Value Team. During the first half, FRM held a series of successful seminars with pension schemes in Japan which led to an inflow of $300 million and the outlook for further flows from Japan remains positive. FRM’s seeding business continues to see interest through potential joint ventures on asset raising, with products set to launch later in the year. The strategic partnership with OFI which we entered into at the beginning of the year to provide alternative multi-manager capabilities to the French market led to $200 million of inflows in the half. This type of outsourced research process is gaining significant traction in both Europe and the US. We continue to look at other possible bolt-on acquisitions (particularly in the fund of funds and long only space) ensuring that we remain disciplined on price, structure and cultural fit. Distribution effectiveness The flow picture is still disappointing with net outflows of $5.0 billion in the half. Gross sales were $6.5 billion with 40% of the sales achieved in the first quarter and 60% in the second quarter. The majority of the increase in sales between the first and second quarters came from strong sales of the Japan CoreAlpha strategy which raised $1.2 billion in the second quarter. The majority of demand continues to come from institutions with institutional sales constituting 64% of total sales in the first half. Redemptions were $11.5 billion, reflecting fragile investor sentiment and mixed levels of absolute investment performance across the product range. As we explained in our May update there were some lumpy redemptions which came through in the first quarter including $1.0 billion of long only institutional mandates and $0.9 billion of redemptions from managed account mandates due to an asset allocation decision made by the relevant client.
Following Christoph Möller’s retirement, we have split the role of Head of Sales: Tim Rainsford (previously Head of European Sales) is now in charge of all regions outside the US, whilst Tim Gullickson has assumed the function of Head of Sales in the US, with a focus on institutional clients. Eric Burl (COO of the US business) is looking after US retail channels.
A number of other changes have also been made throughout the sales team, with the overall objective of making it leaner and increasingly focused on institutional clients. We continue to work hard on our consultant relationships and since the beginning of the year we have received an additional four strong buy ratings and positive momentum on seven additional strategies. Consultant coverage of Man has increased from 35 products in January 2010 to 116 today and we have maintained 20 strong buy ratings.
We continue to restructure our retail distribution infrastructure without losing meaningful optionality. The recent drawdown at AHL has meant that some offices have become uneconomic and as a result we will

6
be closing further satellite offices including Miami and Singapore. In addition we are re-focusing other operations which grew around our guaranteed product business to target institutional business, for example in Australia where Jamie Douglas, previously with JPM and Moore Capital, has been hired to head up the office. Despite this it is important that we maintain a foothold in the retail market and we are still represented on over 9 global private banking platforms covering 80 funds.
The new marketing incentive programme is now in place, providing improved alignment with shareholders by rewarding our sales people based on annual fees earned, net of expenses, rather than gross sales. Internal commission payments in H1 2013 are 29% lower than H1 2012; by comparison gross sales are down 10% half on half.
Cost reduction
We continue to be on track with the implementation of the cost saving programmes announced in 2012. Fixed compensation costs were $105 million, $210 million annualised versus the $211 million target for 2013. H1 other cash costs were $107 million, $214 million annualised versus the $219 million target for 2013.
Our main priority in implementing these programmes was to ensure we are running the business as efficiently as possible. As such the $100 million of cost savings announced in July last year did not necessarily represent the full extent of what could be achieved. We also highlighted that further reductions in the guaranteed product book would lead us to consider the scale of some offices that support a substantial back book of guaranteed products. The recent drawdown at AHL which resulted in guaranteed products being reduced by a third, from over $6bn to $4bn, and the subsequent loss of run rate revenues means that some of these offices have become uneconomic and we will therefore be reducing our global footprint in some regions. The investment engines remain largely unaffected by these cost reductions.
The combination of these two factors has led us to identify further efficiencies which will result in total cost savings of $270 million, ie. $75 million more than the $195 million announced in 2012. These savings will phase in over the next 18 months with $50 million of the additional savings coming through in 2014 and the remaining $25 million coming through in 2015.
Balance Sheet efficiency Our balance sheet remains strong and liquid and we have made significant progress in the last six months to improve our capital position and balance sheet efficiency. In April we announced a change in regulatory status from being a Full Scope group to a Limited Licence group. This increased our surplus capital by $550 million. Surplus capital at 30 June 2013 was $990 million. In May we announced that we were using some of this surplus capital to repay all of our debt and hybrid instruments resulting in annualised interest and coupon savings of $78 million. This repayment programme is on schedule with all of the debt having been repaid with the exception of the perpetual Tier 1 hybrid which will be repaid on 7 August. Pro-forma surplus capital taking into account the impact of the repayment of this hybrid instrument, payment of the interim dividend as well as the one off charge in relation to the additional cost savings is up to $550 million. The Group’s regulatory capital requirement remains subject to the FCA review of the Group’s ICAAP which will be completed by the end of the year. Net tangible assets stood at $1.3 billion at 30 June 2013 or 72 cents per share. Gross cash was $1.1 billion and net cash was $944 million compared to $1.1 billion at the end of 2012. In line with its terms, we have recently requested a 1-year extension of the $1,525 million revolving credit facility to July 2018 and banks representing $1,335 million have consented.

7
KEY PERFORMANCE INDICATORS (KPIs) Our financial KPIs, as presented on page 11 of our Annual Report for the year ended 31 December 2012, illustrate and measure the relationship between the investment experience of our fund investors, our financial performance and the creation of shareholder value over time. The KPIs are used on a regular basis to evaluate progress against our five key priorities: investment performance; creating options for growth; distribution effectiveness; cost reduction; and balance sheet efficiency. Our KPIs in the six month period to 30 June 2013 reflect mixed investment performance across our three investment engines. FUM flows have remained disappointing, and we will likely need a more sustained period of performance, particularly from AHL, before we see a return to net inflows. The recent further de-gearing of the guaranteed products, combined with the continued fragile investor sentiment, has resulted in a decline in FUM and revenues in the period, which has impacted our profitability and EPS growth. Investment performance The investment performance KPI measures net investment performance for our three managers (AHL, GLG, and FRM), represented by key funds, against relevant benchmarks. The target for this KPI is to exceed the relevant benchmarks. The key funds and the relevant benchmarks are AHL Diversified vs. three key peer asset managers for AHL (the target being to beat two of the three peers), GLG Multi Strategy vs. HFRX for GLG, and FRM Diversified II vs. HFRI Fund of Funds for FRM. The performance of the key funds compared to the benchmarks gives an indication of the competitiveness of our investment performance against similar alternative investment styles offered by other investment managers. This measures our ability to deliver superior long term performance to investors. For the six months to 30 June 2013, we are achieving one out of the three performance targets as GLG’s performance of 5.1% is exceeding the relevant benchmark of 3.2%. AHL’s performance of -3.2% is exceeding one out of the three key peer asset managers (-10.4%), which means they are not meeting the target of exceeding two of the peers (2.7% and -0.9%), and FRM has positive performance of 3.1% but is below the relevant benchmark of 3.5%, primarily as their portfolios generally carry less equity market beta than the broader indices. Net flows This KPI measures net FUM flows for the period as a percentage of opening FUM, with net flows defined as gross sales less gross redemptions. The target for this KPI is 0% to 10% net inflows each year. Net flows are the measure of our ability to attract and retain investor capital. FUM drives our financial performance in terms of our ability to earn management fees. Net flows are below target for the six months to 30 June 2013 with an annualised net outflow of 17.5%, compared to a net outflow of 11.1% for the year to 31 December 2012, reflecting the difficult trading environment, in particular for AHL, and continued fragile investor sentiment.
Adjusted management fee EBITDA margin This KPI measures adjusted management fee EBITDA as a percentage of net revenues (gross management fee revenue and income from associates less external cash distribution costs). The target for this KPI is 25% to 40%. Our adjusted management fee EBITDA margin is a measure of our underlying profitability. The adjusted management fee EBITDA margin of 35.5% is within the target range for the six months to 30 June 2013, compared to 42.2% for the year to 31 December 2012. This margin has declined with the decrease in FUM for our higher margin guaranteed and open-ended products.
Adjusted management fee EPS growth This KPI measures our adjusted management fee EPS growth, where adjusted management fee EPS is calculated using post-tax profits excluding net performance fees and including the cost of the dividend on the Perpetual Subordinated Capital Securities, divided by the diluted number of shares. The target is growth of 0% to 20% plus RPI each year. Adjusted management fee EPS growth measures the overall effectiveness of our business model, and drives both our dividend policy and the value generated for shareholders. The adjusted management fee EPS growth is below target for the six months to 30 June 2013 at -43%, which is lower than the -23% for the year to 31 December 2012, primarily as a result of the decline in management fee revenue and overall gross margin, partly offset by reduced costs.

8
RISK MANAGEMENT It is a key objective of Man to remain a leader in risk management, governance and business sustainability. As such, risk management is an essential component of our approach, both to the management of investment funds on behalf of investors, and the management of Man’s business on behalf of shareholders. Our reputation is fundamental to our business, and maintaining our corporate integrity is the responsibility of everyone at Man. Our approach is to identify, quantify and manage risk throughout the Group, in accordance with the Board’s risk appetite. We continue to maintain a strong emphasis on having an adequate quantity of excess capital and liquidity to give us strategic and tactical flexibility, both in terms of corporate and fund management. The principal risks faced by Man are set out on pages 22 to 25 of our 2012 Annual Report. These remain our principal risks for the second half of the financial year – below we set out some highlights and specific activities that have taken place since 31 December 2012. The risk of the underperformance of the funds is a principal risk to Man shareholders. Persistent underperformance would reduce levels of funds under management and may result in lower subscriptions and higher redemptions. Consequently, this will lower management fees, as well as reduce performance fees. In mitigation of this risk, we maintain a high quality, diversified range of investment styles and products, principally across quantitative (AHL), discretionary (GLG) and fund of funds (FRM) strategies. This diversity gives us protection against concentrated underperformance from any one sector. In H1 2013, the AHL funds performed well up until the end of April. In May and June, like most of its peers in quantitative trend-following strategies, AHL was affected by volatile markets driven by central bank decisions. The consequent effect on de-gears for the guaranteed products has resulted in lower fee revenues for these products. Away from AHL, the firm was supported by the strong absolute and relative performance seen across most of the GLG strategies for H1 2013. A key mitigation against the risk of poor performance/negative fund flows reducing fee income and thereby lowering profitability is the flexibility in the firm’s cost base and the ability to adjust in line with revenue. The successful implementation of cost cutting plans over the last 12 months has demonstrated the effectiveness of this approach. We have taken significant steps to optimise the efficiency of the Group’s capital and liquidity structure. Following the firm’s move in regulatory status from Full Scope to Limited Licence in Q1, we formed a plan at that time to use our strong capital and cash position to buy back all outstanding debt and hybrid securities. We are increasingly focused on outsourcing risk, given the move of several functions to external providers and the integration and simplification of operational processes and technological infrastructure. This risk is mitigated by the robust methodology used, and the experienced team put in place for the selection, appointment and monitoring of our third party service providers, which ensures that they carry out their services as required. We remain focused on regulatory risk as we see continuous evolvement in the landscape, such as the implementation of the Alternative Investment Fund Managers Directive (AIFMD), the proposed EU financial transaction tax and new rules on central clearing of OTC derivatives. It is one of our top priorities that we keep abreast of new regulations and understand the implications these will have to the Group.

9
FUNDS UNDER MANAGEMENT (FUM), FLOWS AND GROSS AND NET MANAGEMENT FEE
MARGINS
The breakdown of FUM by product has been updated to reflect the changes in the organisation of the business (in particular the combining of AHL and MSS) and both gross and net management fee margins are now being disclosed on this basis. FUM and gross margins under the old product categorisation can be found on pages 12 and 13. The basis for calculating FUM has also been aligned to bring all managers onto the same basis of investment exposure as opposed to a mixture of investment exposure and fee base. The impact of this change is an increase in FUM of $0.3 billion and has been included in other movements. In the six months to 30 June 2013, FUM declined from $57.0 billion to $52.0 billion with $5.0 billion of net outflows, $2.4 billion of FX losses and other movements of negative $0.1 billion being partially offset by positive performance of $2.5 billion. In aggregate, our total gross margin has decreased from 209 basis points for the year ended 31 December 2012 to 191 basis points for the six months ended 30 June 2013. Our total net margin has decreased from 169 basis points to 157 basis points over the same period. These reductions are due to reduced guaranteed product FUM as well as a mix shift towards institutional money, particularly in the alternatives quant category. This product mix shift and consequent reduction in overall margin is likely to continue as we sell more open ended alternative product, particularly to institutions, and sales of guaranteed product remains negligible.
Six months to 30 June 2013
$bn
FUM at 31 December
2012 Sales Redemptions
Net
inflows / (outflows)
Investment movement FX Other
FUM at 30 June
2013
Alternative 39.9 4.0 (7.2) (3.2) 0.3 (1.2) (0.2) 35.6
Quant (AHL / MSS) 11.2 1.0 (2.0) (1.0) (0.3) (0.3) (0.2) 9.4 Discretionary (GLG) 14.6 2.2 (3.1) (0.9) 0.7 (0.3) - 14.1 Fund of funds (FRM) 14.1 0.8 (2.1) (1.3) (0.1) (0.6) - 12.1
Long only 11.4 2.5 (3.7) (1.2) 2.3 (0.8) - 11.7 Quant (AHL / MSS) 1.7 0.1 (0.4) (0.3) - - - 1.4 Discretionary (GLG)
9.7 2.4 (3.3) (0.9) 2.3 (0.8) - 10.3
Guaranteed 5.7 - (0.6) (0.6) (0.1) (0.4) 0.1 4.7
Total 57.0 6.5 (11.5) (5.0) 2.5 (2.4) (0.1) 52.0
Gross and net management fee margins
Six months ended 30 June 2013 Year ended 31 December 2012
$bn
Total gross margin
(bps)
Total net margin (gross margin net of external
distribution costs) (bps)
Total gross margin
(bps)
Total net margin (gross margin net of external
distribution costs) (bps)
Alternative 166 140 187 159
Quant (AHL / MSS) 289 232 315 254
Discretionary (GLG) 135 118 132 117
Fund of funds (FRM) 103 91 120 108
Long only 90 62 85 59
Quant (AHL / MSS) 34 31 36 33
Discretionary (GLG) 100 67 91 63
Guaranteed 522 432 500 378
Total 191 157 209 169
10
Alternatives Funds under management in alternative strategies reduced by 11% in the period to $35.6 billion. The 16% reduction in quant alternatives (AHL/MSS) FUM was driven by a combination of negative investment movement, muted sales and redemptions. Sales of $1.0 billion in the six months to 30 June 2013 were mainly to institutional clients, particularly in Japan and redemptions totalled $2.0 billion, the majority of which were from retail investors. The AHL Diversified strategy was down 3.2% in the period which was the main driver of the negative investment movement of $0.3 billion in the half. FX movements (mainly related to the weakening of the Euro and Japanese Yen against the US dollar) reduced FUM in this category by $0.3 billion. Other movements mainly relate to the change of FUM basis (as explained above). As at 30 June 2013, AHL open ended FUM was 14.2% below peak on a weighted average basis. The quant alternatives (AHL/MSS) gross and net margin has reduced by 26 basis points and 22 basis points respectively compared to the year ended 31 December 2012. This is due to the fact that the majority of redemptions have been retail where the margin is 3% to 4% whereas the majority of the sales have been institutional where the margin is 1% to 2%. While we saw this flow trend occurring during 2012 the impact on the margin was less pronounced due to the fact that a significant proportion of the retail redemptions were from Nomura Global Trend where the margin was around 1.8%. Looking forward, we would expect this mix shift towards institutional money to continue and hence we would expect the margin to decline further. Funds under management in discretionary alternatives (GLG) fell by 3% in the period to $14.1 billion. Sales for the six months were $2.2 billion with strong flows into the European long short style in particular, as it continued its strong run of performance. There was also demand for the macro, Euro distressed and global convertibles strategies. Discretionary alternatives redemptions totalled $3.1 billion. Within this $0.9 billion came from European equity long short strategies ($350 million of which was from one large institutional client), $0.6 billion from emerging markets strategies and $0.5 billion from North American equity strategies. Investment performance across the GLG alternatives range was positive in the six months and added $0.7 billion to FUM in this category and FX movements (mainly due to the weakening of the Euro against the US dollar) reduced FUM by $0.3 billion. Other movements mainly relate to the change of FUM basis (as explained above). 79% of GLG performance fee eligible funds were at peak at 30 June 2013 and 13% were within 5% of peak. Gross and net margins in the discretionary alternatives category remained stable compared to the year ended 31 December 2012. Funds under management in the alternatives fund of fund (FRM) category reduced to $12.1 billion. Alternative fund of fund sales were $0.8 billion with a significant proportion of the sales coming from Japanese clients. Redemptions totalled $2.1 billion and included $0.9 billion of redemptions from managed account mandates, where FRM provides risk assessment only, due to asset allocation decisions made by the relevant clients. Performance in the six months was broadly flat and FX movements (mainly in relation to the weakening of the Japanese Yen against the US dollar) reduced FUM by $0.6 billion. Notified quarterly redemptions for 1 July were $0.4 billion. The net margin in the alternatives fund of fund category reduced by 17 basis points due to the impact of including FRM assets for the full six months whereas they were only included for half of the year in 2012.
Long only Long only funds under management rose 3% to $11.7 billion, driven by strong performance from Japan CoreAlpha which was up 41.4% in the six month period. The impact of investment performance added $2.3 billion to FUM in this category. Long only sales were $2.5 billion in the half with 77% of the sales coming from the Japan CoreAlpha strategy and redemptions totalled $3.7 billion split roughly equally between Japan CoreAlpha and other long only strategies. The Japan CoreAlpha redemptions included $1.0 billion from two large lower margin institutional mandates which led to a slight rise in the gross and net revenue margins in the period. FX movements reduced FUM by $0.8 billion due to the weakening of the Japanese Yen and sterling against the US dollar.

11
Guaranteed products Guaranteed product funds under management reduced by 18% in the six months to 30 June 2013, from $5.7 billion to $4.7 billion. Redemptions were $0.6 billion and the net re-gear in the period was $100 million with a re-gear of $500 million in the first quarter being offset by a de-gear of $400 million in the second quarter. There were further de-gears of $600 million on 1 July and $400 million on 1 August. FX movements reduced FUM by $0.4 billion mainly due to the weakening of the Australian dollar against the US dollar. The guaranteed product net margin has increased by 54 basis points compared to the year ended 31 December 2012. Over a third of the increase is at a gross level and is due to the impact of some fees which are based on net asset value as opposed to FUM. As the margin calculation is based on FUM, and FUM has fallen lower than the total net asset value of the product set, this has pushed the margin up by 22 basis points compared to last year. The lower level of placement fee amortisation compared to 2012 due to placement fee write offs has pushed the net margin up by an additional 32 basis points. While the guaranteed product book continues to de-gear we would expect this margin to remain high.

12
Three months to 31 March 2013 – New view
$bn
FUM at 31 December
2012 Sales Redemptions
Net inflows /
(outflows) Investment movement FX Other
FUM at 31 March
2013
Alternative 39.9 1.7 (4.0) (2.3) 1.0 (0.9) (0.2) 37.5 Quant (AHL / MSS) 11.2 0.4 (1.0) (0.6) 0.3 (0.2) (0.1) 10.6 Discretionary (GLG) 14.6 1.1 (1.7) (0.6) 0.5 (0.3) (0.1) 14.1 Fund of funds (FRM) 14.1 0.2 (1.3) (1.1) 0.2 (0.4) - 12.8
Long only 11.4 0.8 (1.9) (1.1) 1.6 (0.6) - 11.3 Quant (AHL / MSS) 1.7 - (0.3) (0.3) - - - 1.4 Discretionary (GLG)
9.7 0.8 (1.6) (0.8) 1.6 (0.6) - 9.9
Guaranteed 5.7 - (0.3) (0.3) 0.2 (0.1) 0.5 6.0
Total 57.0 2.5 (6.2) (3.7) 2.8 (1.6) 0.3 54.8 Three months to 30 June 2013 – New view
$bn
FUM at 31 March
2013 Sales Redemptions
Net inflows /
(outflows) Investment movement FX Other
FUM at 30 June
2013
Alternative 37.5 2.3 (3.2) (0.9) (0.7) (0.3) - 35.6 Quant (AHL / MSS) 10.6 0.6 (1.0) (0.4) (0.6) (0.1) (0.1) 9.4 Discretionary (GLG) 14.1 1.1 (1.4) (0.3) 0.2 - 0.1 14.1 Fund of funds (FRM) 12.8 0.6 (0.8) (0.2) (0.3) (0.2) - 12.1
Long only 11.3 1.7 (1.8) (0.1) 0.7 (0.2) - 11.7 Quant (AHL / MSS) 1.4 0.1 (0.1) - - - - 1.4 Discretionary (GLG)
9.9 1.6 (1.7) (0.1) 0.7 (0.2) - 10.3
Guaranteed 6.0 - (0.3) (0.3) (0.3) (0.3) (0.4) 4.7
Total 54.8 4.0 (5.3) (1.3) (0.3) (0.8) (0.4) 52.0 Three months to 31 March 2013 – Old view
Guaranteed
Open ended Institutional FoF
and other Alternatives
total
AHL GLG Long only Total
FUM at 31 December 2012 5.7 10.1 10.9 18.9 45.6 11.4 57.0 Sales - 0.4 0.9 0.4 1.7 0.8 2.5 Redemptions (0.3) (1.0) (1.5) (1.5) (4.3) (1.9) (6.2)
Net inflows/(outflows) (0.3) (0.6) (0.6) (1.1) (2.6) (1.1) (3.7) Investment movement 0.2 0.3 0.3 0.4 1.2 1.6 2.8 FX (0.1) (0.2) (0.2) (0.5) (1.0) (0.6) (1.6) Other 0.5 (0.1) - (0.1) 0.3 - 0.3
FUM at 31 March 2013 6.0 9.5 10.4 17.6 43.5 11.3 54.8
Three months to 30 June 2013 – Old view
Open ended Institutional FoF
and other Alternatives
total
Guaranteed AHL GLG Long only Total
FUM at 31 March 2013 6.0 9.5 10.4 17.6 43.5 11.3 54.8 Sales - 0.7 1.0 0.6 2.3 1.7 4.0 Redemptions (0.3) (1.0) (1.2) (1.0) (3.5) (1.8) (5.3)
Net inflows/(outflows) (0.3) (0.3) (0.2) (0.4) (1.2) (0.1) (1.3) Investment movement (0.3) (0.6) 0.1 (0.2) (1.0) 0.7 (0.3) FX (0.3) (0.2) - (0.1) (0.6) (0.2) (0.8) Other (0.4) (0.3) (0.3) 0.6 (0.4) - (0.4)
FUM at 30 June 2013 4.7 8.1 10.0 17.5 40.3 11.7 52.0
13
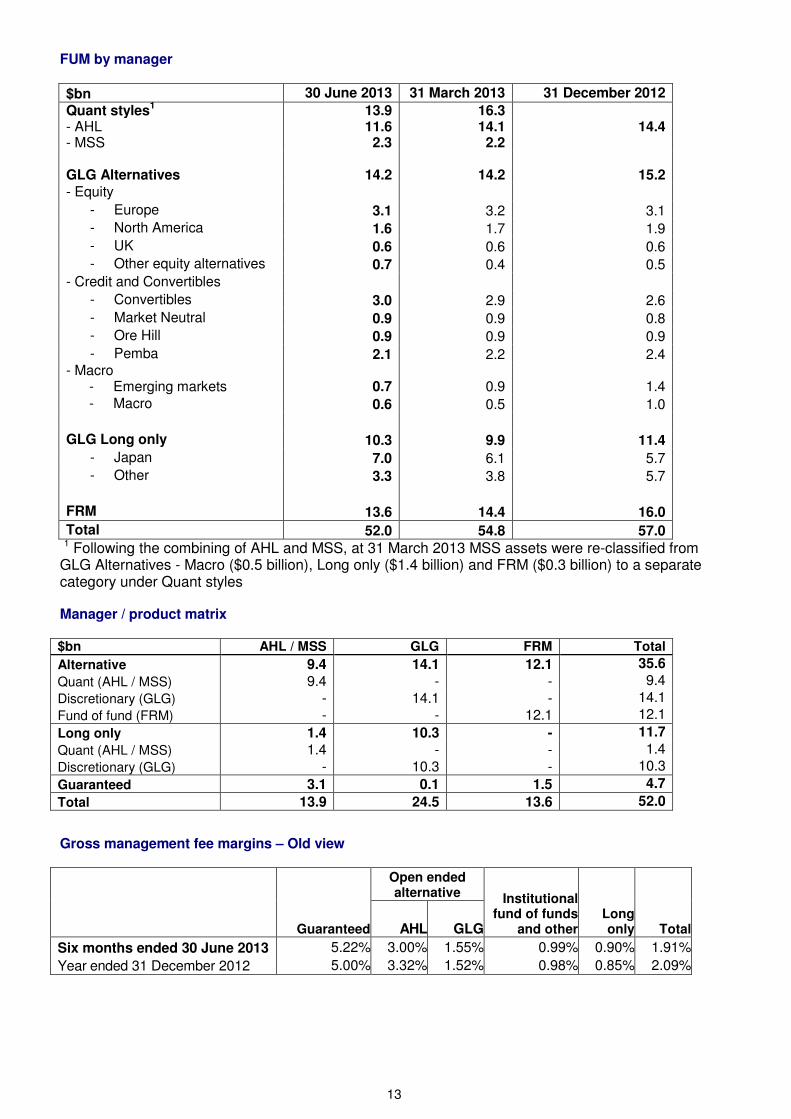
FUM by manager
$bn 30 June 2013 31 March 2013 31 December 2012
Quant styles1 - AHL - MSS
13.9 11.6 2.3
16.3 14.1 2.2
14.4
GLG Alternatives 14.2 14.2 15.2 - Equity
- Europe 3.1 3.2 3.1 - North America 1.6 1.7 1.9 - UK 0.6 0.6 0.6 - Other equity alternatives 0.7 0.4 0.5
- Credit and Convertibles - Convertibles 3.0 2.9 2.6 - Market Neutral 0.9 0.9 0.8 - Ore Hill 0.9 0.9 0.9 - Pemba 2.1 2.2 2.4
- Macro - Emerging markets 0.7 0.9 1.4 - Macro 0.6 0.5 1.0 GLG Long only 10.3 9.9 11.4
- Japan 7.0 6.1 5.7 - Other 3.3 3.8 5.7
FRM 13.6 14.4 16.0
Total 52.0 54.8 57.0
1 Following the combining of AHL and MSS, at 31 March 2013 MSS assets were re-classified from GLG Alternatives - Macro ($0.5 billion), Long only ($1.4 billion) and FRM ($0.3 billion) to a separate category under Quant styles Manager / product matrix $bn AHL / MSS GLG FRM Total
Alternative 9.4 14.1 12.1 35.6
Quant (AHL / MSS) 9.4 - - 9.4
Discretionary (GLG) - 14.1 - 14.1
Fund of fund (FRM) - - 12.1 12.1
Long only 1.4 10.3 - 11.7
Quant (AHL / MSS) 1.4 - - 1.4
Discretionary (GLG) - 10.3 - 10.3
Guaranteed 3.1 0.1 1.5 4.7
Total 13.9 24.5 13.6 52.0
Gross management fee margins – Old view
Guaranteed
Open ended alternative Institutional
fund of funds and other
Long only TotalAHL GLG
Six months ended 30 June 2013
Year ended 31 December 2012 5.22%
5.00%
3.00%
3.32%
1.55%
1.52%
0.99%
0.98%
0.90%
0.85%
1.91%
2.09%

14
Investment performance
Total return Annualised return
3 months to 30 Jun 2013
6 months to 30 Jun 2013
3 years to 30 Jun 2013
5 years to 30 Jun 2013
AHL
AHL Diversified1 -6.8%* -3.2%* -0.2%* -1.1%*
AHL Alpha2 -5.3%* -2.6%* 0.5%* 0.2%*
Man AHL Diversity3 -5.1% -2.4% -1.0% n/a
Man AHL Trend4 -7.5% -4.2% -2.4% n/a
MAN SYSTEMATIC STRATEGIES
TailProtect5 -1.5% -7.3% n/a n/a
GLG ALTERNATIVES
Equity
Europe
GLG European Long Short Fund6 2.2% 4.7% 9.8% 5.4%
GLG European Equity Alternative UCITS Fund7 2.4% 5.0% n/a n/a
GLG European Alpha Alternative UCITS Fund8 2.0% 4.5% 4.3% n/a
North America
GLG North American Opportunity Fund9 -3.7% 0.8% 0.9% 2.9%
GLG North American Equity Alternative UCITS Fund10
-4.2% -0.6% n/a n/a
UK
GLG Alpha Select Fund11
5.1% 8.2% 1.4% 4.9%
GLG Alpha Select UCITS Fund12
4.7% 7.5% 0.7% n/a
Other equity alternatives
GLG Global Opportunity Fund13
1.6% 3.0% 0.1% -0.1%
Credit and convertibles
Convertibles
GLG Global Convertible Fund14
0.7% 3.8% 4.5% 4.2%
GLG Global Convertible UCITS Fund15
1.3% 4.9% 6.1% 3.7%
Market Neutral
GLG Market Neutral Fund16
0.6% 3.9% 12.4% 9.4%
GLG European Distressed Fund17
0.8% 5.1% 9.4% n/a
Ore Hill
GLG Ore Hill Fund18
1.3% 2.9% 7.5% 5.4%
Emerging markets
GLG Emerging Markets Fund19
0.6% -0.4% -1.5% -0.1%
GLG Emerging Markets UCITS Fund20
0.4% -0.5% -2.9% n/a
Macro and special situations
GLG Atlas Macro Fund21
6.3% 7.2% 2.2% n/a
GLG Atlas Macro Alternative UCITS Fund22
5.6% 6.8% n/a n/a
GLG LONG ONLY
GLG Japan Core Alpha Equity Fund23
14.0% 41.4% 12.1% 2.9%
GLG Global Equity UCITS Fund24
2.5% 12.9% 11.4% -0.9%

15
Investment performance continued
Total return Annualised return
3 months to 30 Jun 2013
6 months to 30 Jun 2013
3 years to 30 Jun 2013
5 years to 30 Jun 2013
FRM
AA Diversified25
-0.4% 2.2% 2.1% -1.7%
FRM Diversified II26
0.1% 3.1% 3.0% -0.8%
Man Dynamic Selection27
-0.9% 1.2% 1.3% 0.0%
Man GLG Multi-Strategy Fund28
2.1% 5.1% 4.5% 1.8%
Indices
World stocks29
1.7% 11.6% 13.2% 3.8%
World bonds30
-1.5% -0.6% 3.0% 4.5%
Corporate bonds31
-5.7% -8.0% 7.0% 9.4%
Hedge fund indices
HFRI Fund Weighted Composite Index32
-0.1% 3.6% 4.9% 2.5%
HFRI Fund of Funds Composite Index32
0.0% 3.5% 3.0% -0.5%
HFRX Global Hedge Fund Index 0.0% 3.2% 1.2% -2.1%
Style indices
Barclay BTOP 50 Index33
-1.4% 0.6% 0.9% 0.2%
HFRI Equity Hedge (Total) Index32
0.6% 6.1% 5.7% 1.9%
HFRX Equity Hedge Index -0.5% 4.6% 0.0% -3.8%
HFRI Event Driven (Total) Index32
1.6% 5.5% 6.4% 4.4%
HFRX Event Driven Index 1.9% 7.4% 3.6% 0.9%
HFRI Macro (Total) Index32
-1.7% -0.2% 1.4% 1.1%
HFRX Macro/CTA Index -1.1% -1.1% -2.1% -5.0%
HFRI Relative Value (Total) Index32
-0.2% 3.1% 7.0% 5.8%
HFRX Relative Value Arbitrage Index -0.3% 1.4% 2.3% 0.4%

16
Source: Man database, Bloomberg and MSCI. There is no guarantee of trading performance and past or projected performance is not a reliable indicator of future performance. Returns may increase or decrease as a result of currency fluctuations. 1) Represented by Man AHL Diversified plc from 26 March 1996 to 29 October 2012, and by Man AHL Diversified (Guernsey) USD Shares – Class A from 30 October 2012 to date. The representative product was changed at the end of October 2012 due to legal and/or regulatory restrictions on Man AHL Diversified plc preventing the product from accessing the Programme’s revised target allocations. Both funds are valued weekly; however, for comparative purposes, statistics have been calculated using the best quality price that is available at each calendar month end, using estimates where a final price is unavailable. Where a price, either estimate or final is unavailable on a calendar month end, the price on the closest date prior to the calendar month end has been used. 2) Represented by AHL Alpha plc from 17 October 1995 to 24 September 2012, and by AHL Strategies PCC Limited: Class Y AHL Alpha USD Shares from 25 September 2012 to date. The representative product was changed at the end of September 2012 due to the provisioning of fund liquidation costs in October 2012 for AHL Alpha plc, which resulted in tracking error compared with other Alpha Programme funds. Both funds are valued weekly; however, for comparative purposes, statistics have been calculated using the best quality price that is available at each calendar month end, using estimates where a final price is unavailable. Where a price, either estimate or final is unavailable on a calendar month end, the price on the closest date prior to the calendar month end has been used. 3) Represented by Man AHL Diversity GBP DB. Please note that Man AHL Diversity GBP DB was valued weekly until 2 May 2011. Prior to this date, the last weekly valuation of the month has been used. 4) Represented by Man AHL Trend EUR I. Please note that Man AHL Trend EUR I was valued weekly until 2 May 2011. Prior to this date, the last weekly valuation of the month has been used. 5) Represented by TailProtect Limited Class B. 6) Represented by GLG European Long Short Fund - Class D Unrestricted – EUR. 7) Represented by GLG European Equity Alternative IN EUR. 8) Represented by GLG European Alpha Alternative IN EUR. 9) Represented by GLG North American Opportunity Fund - Class A Unrestricted – USD. 10) Represented by GLG North American Equity Alternative IN USD. 11) Represented by GLG Alpha Select Fund - Class C – EUR. 12) Represented by GLG Alpha Select Alternative IN H EUR. 13) Represented by GLG Global Opportunity Fund - Class Z – USD. 14) Represented by GLG Global Convertible Fund - Class A – USD. 15) Represented by GLG Global Convertible UCITS Fund - Class IL T USD to Class IM USD (08/06/2009). 16) Represented by GLG Market Neutral Fund - Class Z Unrestricted – USD. 17) Represented by GLG European Distressed Fund - Class A – USD. 18) Represented by Ore Hill International Fund II Ltd. 19) Represented by GLG Emerging Markets Fund - Class A Unrestricted – USD. 20) Represented by GLG EM Diversified Alternative IN H USD. 21) Represented by GLG Atlas Macro Fund - Class A – USD. 22) Represented by GLG Atlas Macro Alternative IN USD. 23) Represented by GLG Japan CoreAlpha Equity Fund - Class C to Class I JPY (28/01/2010). 24) Represented by GLG Global Equity Fund - Class I T USD to Class I USD (13/05/2011). 25) Represented by Absolute Alpha Fund PCC Ltd Diversified – USD. 26) Represented by FRM Diversified II Fund SPC - Class A USD. 27) Represented by Man Dynamic Selection USD I. 28) Represented by Man GLG Multi-Strategy Fund – Class A – USD Shares, adjusted to reflect a standard institutional fee rebate of 1% until 31 December 2012. From 1 January 2013, the actual performance of Man GLG Multi-Strategy Fund – Class G – USD Shares is displayed which is gross. 29) Represented by MSCI World Net Total Return Index hedged to USD. 30) Represented by Citigroup World Government Bond Index hedged to USD (total return). 31) Represented by Citigroup High Grade Corp Bond TR. 32) HFRI index performance over the past 4 months is subject to change. 33) The historic Barclay BTOP 50 Index data is subject to change. Please note that the dates in brackets represent the date of the join in the linked track records. *Estimated calendar month performance.

17
STATEMENT OF DIRECTORS’ RESPONSIBILITIES
The Directors confirm that this condensed set of financial statements in respect of Man Group plc for the period ended 30 June 2013 has been prepared in accordance with IAS 34 as adopted by the European Union, and that the six month review herein includes a fair review of the information required by the Financial Conduct Authority’s Listing Rules, including the Disclosure and Transparency Rules 4.2.7 and 4.2.8, namely:
• an indication of important events that have occurred during the six months ended 30 June
2013 and their impact on the condensed interim financial statements, and a description of the principal risks and uncertainties for the remaining six months of the year ending 31 December 2013; and
• material related party transactions in the six months ended 30 June 2013 and any material changes in the related party transactions described in the last annual report.
The Directors of Man Group plc are as listed in the Annual Report for the year ended 31 December 2012, subject to the following change:
• Alison Carnwath retired as a Non-Executive Director on 3 May 2013.
By order of the Board
Emmanuel Roman Chief Executive Officer 2 August 2013
Jonathan Sorrell Chief Financial Officer 2 August 2013

18
INTERIM FINANCIAL STATEMENTS
Group income statement
Six months to 30 June
Six months to 30 June
$m Note
2013 2012 (restated)
Revenue: Gross management and other fees 4 529 629 Performance fees 4 90 28
619 657 Gains on investments and other financial instruments 30 4 Distribution costs 5 )80 ( )114 ( Asset services 6 )15 ( )14 ( Amortisation of acquired intangible assets 12 )33 ( )32 ( Compensation 7 )239 ( )250 ( Other costs 8 )135 ( )164 ( Share of after tax profit of associates 6 5 Gain on disposal of Lehman claims 2 5 -
Gain on disposal of interest in Nephila and other interests 2 11 -
Impairment of GLG and legacy Man Multi-Manager goodwill 2 - )233 ( Finance expense 9 )54 ( )51 ( Finance income 9 7 29
Profit/(loss) before tax 122 )163 ( Taxation 10 )13 ( )12 (
Profit/(loss) for the period attributable to owners of the parent 109 )175 (
Earnings per share 11 Basic (cents) 5.4 )10.7 ( Diluted (cents) 5.3 )10.7 (
Adjusted profit before tax 2 134 122
Group statement of comprehensive income
Six months to 30 June
Six months to 30 June
$m 2013 2012
(restated)
Profit/(loss) for the period attributable to owners of the parent 109 )175 (
Other comprehensive (expense)/income:
Items that will be reclassified to profit or loss: )26 ( 16
Available-for-sale investments:
Valuation losses taken to equity )1( 16
Cash flow hedges:
Valuation (losses)/gains taken to equity )5 ( 8
Transfer to income statement on sale or impairment - )5 (
Net investment hedge 18 2
Foreign currency translation )38 ( )1 (
Tax charged - )4 (
Items that will not be reclassified to profit or loss: 13 )12 (
Remeasurements of defined benefit plans 17 )15 (
Tax (charged)/credited )4 ( 3
Total comprehensive income/(expense) attributable to owners of the parent 96 )171 (
19
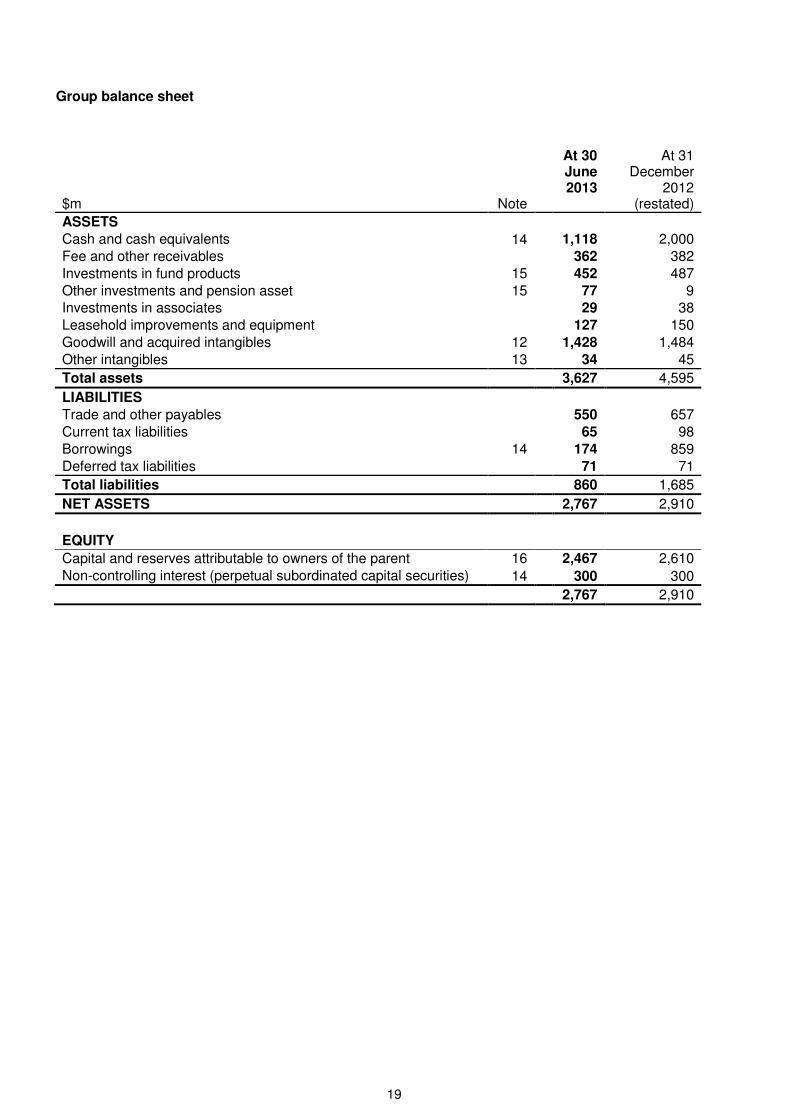
Group balance sheet
At 30 June
At 31 December
$m Note 2013 2012
(restated)
ASSETS Cash and cash equivalents 14 1,118 2,000 Fee and other receivables 362 382 Investments in fund products 15 452 487 Other investments and pension asset 15 77 9 Investments in associates 29 38 Leasehold improvements and equipment 127 150 Goodwill and acquired intangibles 12 1,428 1,484 Other intangibles 13 34 45
Total assets 3,627 4,595
LIABILITIES Trade and other payables 550 657 Current tax liabilities 65 98 Borrowings 14 174 859 Deferred tax liabilities 71 71
Total liabilities 860 1,685
NET ASSETS 2,767 2,910
EQUITY
Capital and reserves attributable to owners of the parent 16 2,467 2,610 Non-controlling interest (perpetual subordinated capital securities) 14 300 300
2,767 2,910

20
Group statement of changes in equity
Equity attributable to owners of the parent
Six months to 30 June 2013 $m Note
Share capital and
capital reserves
Revaluation reserves
and retained
earnings
Non-controlling
interest Total
At 1 January 2013 1,187 1,507 300 2,994 Impact of adoption of IAS 19 (revised) - )84 ( - )84 (
As restated 1,187 1,423 300 2,910 Profit for the period - 109 - 109 Other comprehensive expense - )13 ( - )13 (
Total comprehensive income for the period - 96 - 96
Perpetual capital securities coupon - )13 ( - )13 ( Share-based payments 4 - - 4 Dividends* - )230 ( - )230 (
At 30 June 2013 16 1,191 1,276 300 2,767
Equity attributable to owners of the parent
Six months to 30 June 2012 $m
Share capital and
capital reserves
Revaluation reserves
and retained earnings
Non-controlling
interest Total At 1 January 2012 3,364 696 - 4,060 Impact of adoption of IAS 19 (revised) - )71 ( - )71 (
As restated 3,364 625 - 3,989 Loss for the period - )175 ( - )175 ( Other comprehensive income - 4 - 4
Total comprehensive income for the period - )171 ( - )171 ( Perpetual capital securities coupon - )12 ( - )12 ( Share-based payments 6 38 - 44 Movement in close period buyback obligations - 3 - 3 Dividends* - )126 ( - )126 (
At 30 June 2012 3,370 357 - 3,727
*Relates to the final dividend paid for the year ended 31 December 2012 of 12.5 cents per share (six months to 30 June 2012: final dividend paid for year ended 31 December 2011 of 7 cents).

21
Group cash flow statement
Six months
to 30 June
Six months
to 30 June
$m 2013 2012
Cash flows from operating activities Profit/(loss) for the period 109 )175 ( Adjustments for: Income tax 13 12 Net finance expense 47 22 Share of after tax profit of associates )6 ( )5 ( Gain on disposal of interest in Nephila and other interests )11 ( - Depreciation and impairment of leasehold improvements and equipment 22 21 Amortisation of other intangible assets 44 90 Share-based payments expense 22 48 Impairment of goodwill and other intangibles - 233 Difference between pension contributions and pension cost charged )19 ( )12 ( Other non-cash movements )9 ( )9 (
212 225 Changes in working capital: Decrease in receivables 17 78 Decrease in other financial assets 19 103 Decrease in payables )79 ( )158 (
Cash generated from operations 169 248 Interest paid )65 ( )61 ( Income tax paid )48 ( )38 (
Cash flows from operating activities 56 149
Cash flows from investing activities Purchase of leasehold improvements and equipment - )13 ( Payment of placement fees and purchase of capitalised computer software
)3 ( )24 (
Purchase of investments, including those used to hedge fund product awards
)48 ( )16 (
Net proceeds from sale of other investments, including those held for fund product awards
27 11
Interest received 6 29 Dividends received from associates and other investments 7 6 Proceeds from sale of interest in Nephila and other interests 21 -
Cash flows from investing activities 10 (7)
Cash flows from financing activities Proceeds from issue of ordinary shares 4 6 Purchase of own shares by ESOP trust )20 ( )7 ( Repurchase of own shares - )7 ( Repayment of borrowings )685 ( )219 ( Dividends paid to Company shareholders )230 ( )126 ( Dividend payments in respect of perpetual subordinated capital securities )17 ( )17 (
Cash flows from financing activities (948) (370)
Net decrease in cash )882 ( )228 ( Cash at the beginning of the period 2,000 1,639
Cash at the end of the period 1,118 1,411

22
1. Basis of preparation
The interim financial statements for the six months ended 30 June 2013 have been prepared on a going concern basis and in accordance with IAS 34 ‘Interim Financial Reporting’ and the Disclosure and Transparency Rules of the Financial Conduct Authority.
The financial information contained herein is unaudited and does not constitute statutory accounts as defined by Section 434 of the Companies Act 2006. Statutory accounts for the year ended 31 December 2012, which were prepared in accordance with International Financial Reporting Standards (IFRS) and relevant IFRIC interpretations issued by the International Accounting Standards Board (IASB) and IFRIC Committee respectively and adopted by the European Union (EU) and upon which the auditors have given an unqualified and unmodified report and which contained no statement under Section 498 of the Companies Act 2006, have been delivered to the Registrar of Companies and were posted to shareholders on 15 March 2013.
The accounting policies applied in these interim financial statements are consistent with those set out and applied in Man’s Annual Report for the year ended 31 December 2012, except for adjustments resulting from the adoption of IAS 19 (revised) ‘Employee benefits’ which have been applied retrospectively in accordance with IAS 8 ‘Accounting Policies, Changes in Accounting Estimates and Errors’ in these financial statements, and hence the prior period has been restated. The impact of the adoption of IAS 19 (revised) ‘Employee benefits’ as at 31 December 2012 resulted in a decrease in net pension assets of $110 million (31 December 2011: $94 million) and in deferred tax liabilities of $26 million (31 December 2011: $23 million), with a corresponding debit to equity of $84 million (31 December 2011: $71 million). The comparative statement of other comprehensive income for the prior period has been restated to reflect remeasurements in relation to defined benefit plans of $15 million, offset by related tax effects. The presentation of internal commission costs has been changed in the income statement in the current period, and the prior period has been restated accordingly, to include these costs as compensation costs rather than distribution costs. This reflects the way the business is now managed, providing more relevant information to the readers of the financial statements, and brings the treatment in line with industry practice. Internal commission costs for the six months ended 30 June 2013 were $17 million (H1 2012: $24 million). The impact of improvements to existing international accounting and financial reporting standards during the period has not been significant.
The areas of significant judgement are: the evaluation of goodwill and intangible assets; and the determination of fair values for investments, contingent consideration, deferred compensation awards, and pension obligations.
The income statement and cash flow statement presentation in these interim financial statements shows the six months ended 30 June 2013 together with the six months ended 30 June 2012 (H1 2012). The balance sheet is presented as at 30 June 2013 together with comparatives as at 31 December 2012.

23
2. Adjusted profit before tax
Profit/(loss) before tax is adjusted to give a fuller understanding of the underlying profitability of the business.
Six months to 30 June
Six months to 30 June
2013 2012
$m Note (restated)
Profit/(loss) before tax 122 )163 ( Adjusting items: Gain on disposal of interest in Nephila and other interests )11 ( - Impairment of GLG and legacy Man Multi-Manager 12 - 233 Compensation - restructuring 7 - 16 Other costs - restructuring 8 - 1 FRM acquisition costs 8 - 3 Gain on disposal of Lehman claims )5 ( - Revaluation of contingent consideration )7 ( - Unwind of contingent consideration discount 9 2 - Amortisation of acquired intangible assets 12 33 32
Adjusted profit before tax 134 122
Tax )18 ( )22 (
Adjusted net income 116 100
The gain on disposal of interest in Nephila and other interests relates primarily to the disposal of a 6.25% stake in Nephila on 23 January 2013, reducing our stake to 18.75%.
3. Net management and performance fee income
Six months to 30 June
Six months to 30 June
2013 2012 $m (restated) Gross management and other fees 529 629 Share of after tax profit of associates 6 5 Less: Distribution costs )80 ( )114 ( Asset services )15 ( )14 ( Compensation )196 ( )216 ( Other costs )135 ( )159 (
Net management fees 109 131 Net finance expense )45 ( )22 (
Adjusted net management fees 64 109
Performance fees 90 28 Gains on investments and other financial instruments 23 4 Less: Compensation - variable )39 ( )12 ( Compensation - deferral amortisation )4 ( )6 (
Other costs - charitable donations - )1 (
Net performance fees 70 13
Adjusting items (see Note 2) )12 ( )285 (
Profit/(loss) before tax 122 )163 (

24
Net management fees Net management fees for the six months ended 30 June 2013 were $109 million (H1 2012: $131 million), calculated as gross management fees plus the share of profits from associates less distribution costs, fixed compensation and discretionary bonus compensation and all other costs. The decrease in net management fees compared to the comparative period primarily relates to: a fall in gross management fees of $100 million; offset by a reduction in distribution, compensation and other costs of $78 million.
Net performance fees Net performance fees for the six months ended 30 June 2013 were $70 million (H1 2012: $13 million), calculated as gross performance fees plus gains on investments at fair value less related performance based compensation. The increase in net performance fees compared to H1 2012 is as a result of stronger investment performance from performance fee eligible funds, particularly in GLG.
4. Revenue
Revenue for the six months to 30 June 2013 was $619 million, which is 6% lower than the $657 million in H1 2012.
Management fee revenue for the period was $529 million, compared to $629 million in H1 2012, as a result of a decrease in the overall average gross margin from the further decline in FUM for higher margin guaranteed and alternative quant products. Revenue from performance fees has increased from $28 million in H1 2012 to $90 million in the six months to 30 June 2013, as a result of positive investment performance from performance fee eligible funds, particularly for GLG.
5. Distribution costs
Distribution costs were $80 million for the period (H1 2012: $114 million), comprising placement fees of $9 million (H1 2012: $31 million) and servicing fees of $71 million (H1 2012: $83 million).
Placement fees relate to the amortisation of prior placement fees ($5 million), redeemed products ($3 million) and fees expensed upfront ($1 million). The capitalised placement fees at 30 June 2013 were $27 million (31 December 2012: $32 million) with a weighted average remaining amortisation period of 2.8 years (31 December 2012: 2.9 years). Placement fees are lower this period as a result of the significant write-offs recognised in 2012. Servicing fee expense was lower as a result of lower retail funds under management. Distribution costs relating to employees (internal commissions) are now presented as compensation costs and the prior period has been restated accordingly. Refer to Note 1 for further details. 6. Asset services
Asset services include valuation, fund accounting and registrar functions performed by third parties under contract to Man, on behalf of the funds. Total asset services costs for the period were $15 million (H1 2012: $14 million).

25
7. Compensation
Six months to 30 June
Six months to 30 June
$m 2013 2012
Salaries – fixed 87 99 Salaries – variable 81 51 Share-based payment charge 22 45 Fund product based payment charge 15 6 Internal commission costs 11 15 Social security costs 15 12 Pension costs 8 6
Compensation costs – before adjusting items 239 234 Restructuring (Note 2) - 16
Total compensation costs 239 250
Compensation costs were $239 million (H1 2012: $250 million). Fixed compensation has decreased as a result of the cost saving initiatives. Variable compensation has increased as a result of increased performance fee related bonus accruals in the period, primarily for GLG. The increase in social security costs to $15 million from $12 million in H1 2012 is due to higher variable compensation in the current period.
Internal commission costs are presented in the current period as compensation costs, rather than distribution costs, and the prior period has been restated accordingly. Total internal commission costs for
the period were $17 million (H1 2012: $24 million), with $3 million (H1 2012: $8 million) included in the share-based payment charge line and $3 million (H1 2012: $1 million) included in the fund product based payment charge line. Refer to Note 1 for further details.
The unamortised deferred compensation at 30 June 2013 was $49 million (31 December 2012: $54 million), which has a weighted average remaining vesting period of 1.7 years (31 December 2012: 1.2 years).
In the prior period, restructuring costs relate mostly to redundancy costs associated with our cost saving initiatives.

26
8. Other costs
$m
Six months Six months
to 30 to 30
June June
2013 2012
Occupancy 25 27
Professional services 21 19
Technology and communication 18 22
Temporary staff 18 22
Travel and entertainment 5 9
Marketing and sponsorship 4 6
Benefits and insurance 12 17
Other 4 1
Other costs - before depreciation and amortisation 107 123
Depreciation and amortisation 28 37
Other costs - before adjusting items 135 160
Restructuring (Note 2) - 1
FRM acquisition costs (Note 2) - 3
Total other costs 135 164
Other costs before adjusting items were $135 million, compared to $160 million in H1 2012 and $147 million for H2 2012, which reflects the impact of the various cost saving initiatives to reduce the cost base of the firm as previously announced.
9. Finance expense and finance income
$m
Six months to 30 June
Six months to 30 June
2013 2012 Finance income: Interest on cash deposits 7 14 Other - gain recognised on the repayment of loan notes issued by BlueCrest - 15
Total finance income 7 29
Finance expense:
Interest payable on borrowings )20 ( )26 ( Premium paid on debt buyback and other )32 ( )25 (
Total finance expense - before adjusting items )52 ( )51 ( Unwind of contingent consideration discount )2 ( -
Total finance expense - after adjusting items )54 ( )51 (
Finance income has decreased to $7 million, compared to $29 million in H1 2012, as a result of the $15 million gain on the repayment of the BlueCrest loan notes in H1 2012, interest no longer being earned on the BlueCrest loan note in 2013, and the move from deposits to treasuries. Finance expense includes $28 million of charges relating to the debt buy backs during the period (H1 2012: $21 million).
27
10. Taxation
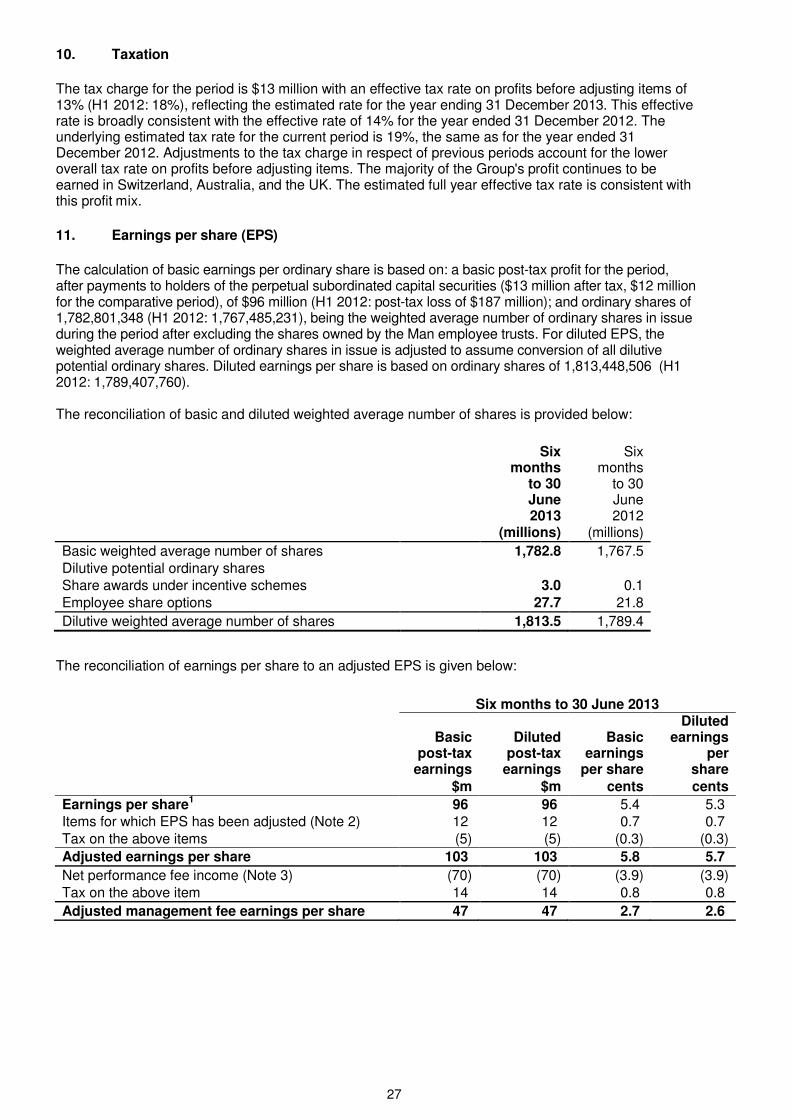
The tax charge for the period is $13 million with an effective tax rate on profits before adjusting items of 13% (H1 2012: 18%), reflecting the estimated rate for the year ending 31 December 2013. This effective rate is broadly consistent with the effective rate of 14% for the year ended 31 December 2012. The underlying estimated tax rate for the current period is 19%, the same as for the year ended 31 December 2012. Adjustments to the tax charge in respect of previous periods account for the lower overall tax rate on profits before adjusting items. The majority of the Group's profit continues to be earned in Switzerland, Australia, and the UK. The estimated full year effective tax rate is consistent with this profit mix.
11. Earnings per share (EPS)
The calculation of basic earnings per ordinary share is based on: a basic post-tax profit for the period, after payments to holders of the perpetual subordinated capital securities ($13 million after tax, $12 million for the comparative period), of $96 million (H1 2012: post-tax loss of $187 million); and ordinary shares of 1,782,801,348 (H1 2012: 1,767,485,231), being the weighted average number of ordinary shares in issue during the period after excluding the shares owned by the Man employee trusts. For diluted EPS, the weighted average number of ordinary shares in issue is adjusted to assume conversion of all dilutive potential ordinary shares. Diluted earnings per share is based on ordinary shares of 1,813,448,506 (H1 2012: 1,789,407,760). The reconciliation of basic and diluted weighted average number of shares is provided below:
Six months
to 30 June 2013
Six months
to 30 June 2012
(millions) (millions)
Basic weighted average number of shares 1,782.8 1,767.5 Dilutive potential ordinary shares Share awards under incentive schemes 3.0 0.1 Employee share options 27.7 21.8
Dilutive weighted average number of shares 1,813.5 1,789.4
The reconciliation of earnings per share to an adjusted EPS is given below:
Six months to 30 June 2013
Basic
post-tax earnings
Diluted post-tax
earnings
Basic earnings
per share
Diluted earnings
per share
$m $m cents cents
Earnings per share1 96 96 5.4 5.3 Items for which EPS has been adjusted (Note 2) 12 12 0.7 0.7 Tax on the above items )5 ( )5 ( )0.3 ( )0.3 (
Adjusted earnings per share 103 103 5.8 5.7
Net performance fee income (Note 3) )70 ( )70 ( )3.9 ( )3.9 ( Tax on the above item 14 14 0.8 0.8
Adjusted management fee earnings per share 47 47 2.7 2.6

28
Six months to 30 June 2012
Basic
post-tax earnings
Diluted post-tax
earnings
Basic earnings
per share
Diluted earnings
per share
$m $m cents cents
Earnings per share1 )187 ( )187 ( )10.7 ( )10.7 ( Effect of potential ordinary shares2 - - - 0.1 Items for which EPS has been adjusted (Note 2) 285 285 16.1 15.9 Tax on the above items )10 ( )10 ( )0.5 ( )0.5 (
Adjusted earnings per share 88 88 4.9 4.8
Net performance fee income (Note 3) )13 ( )13 ( )0.7 ( )0.7 ( Tax on the above item 3 3 0.2 0.2
Adjusted management fee earnings per share 77 77 4.4 4.3
1 The difference between profit/(loss) after tax and basic and diluted post-tax earnings is the adding back of the expense in the period of $13 million (post-tax) relating to the perpetual subordinated capital securities (H1 2012: $12 million). 2 Potential ordinary shares have not been treated as dilutive and therefore have been excluded from the diluted statutory earnings per share calculation as their conversion would decrease the loss per share.
12. Goodwill and acquired intangibles
$m Goodwill
Investment management
contracts and other acquired
intangibles Total
Net book value at 1 January 2013 898 586 1,484 Currency translation difference )13 ( - )13 ( Amortisation - )33 ( )33 (
Other adjustment )10 ( - )10 (
Net book value at 30 June 2013 875 553 1,428
Made up as follows: GLG 201 524 725 FRM 204 29 233 AHL 470 - 470
The other adjustment of $10 million to goodwill in the six months to 30 June 2013 relates to an adjustment to the calculation for the FRM contingent consideration at the date of acquisition (July 2012), reducing goodwill and the contingent consideration creditor. Allocation of goodwill to cash generating units The Group has three identified cash-generating units for impairment review purposes: GLG, FRM, and AHL. The goodwill and other intangible assets acquired on the acquisition of FRM in July 2012 has been allocated to the FRM cash generating unit as the acquired FRM business has been fully integrated with the previous Man Multi-Manager business, which will benefit from all of the synergies from the acquisition. The Man Systematic Strategies business (MSS) was integrated into the AHL business on 1 January 2013, which was previously reported within the GLG and FRM cash-generating units. The goodwill associated with the MSS business of $71 million has been transferred from the GLG cash generating unit ($61 million) and the FRM cash generating unit ($10 million) to the AHL cash generating unit.

29
GLG cash generating unit (CGU) The recoverable amount of the GLG CGU was assessed at 31 December 2012 using a value in use calculation. At 31 December 2012, the value in use calculation suggested a value of $867 million for the GLG CGU, resulting in a goodwill impairment of $746 million. This impairment was recognised accordingly at 31 December 2012, with a total impairment charge of $837 million for the year ended 31 December 2012 including the $91 million recognised at 30 June 2012. GLG’s goodwill must be tested for impairment annually at the same time each year, as well as earlier if there are any indications or triggers of impairment. For the six months to 30 June 2013, GLG’s funds under management (FUM) are higher than the modelled FUM in the value in use calculation at 31 December 2012 as a result of better than forecast investment performance, particularly for long only. As growth in FUM for the year to date is higher than anticipated, with margins and costs as expected, there were no indicators of impairment for the GLG goodwill during the six months to 30 June 2013. As a result, no impairment test of GLG’s goodwill has been undertaken at 30 June 2013. FRM cash generating unit In 2012, as a result of the challenging economic environment, the recoverable amount of the FRM CGU was assessed at both 30 June and 31 December using a value in use calculation. At 30 June 2012, the recoverable amount for the FRM CGU consisted of the previous Man Multi-Manager business only as the FRM business was acquired in July 2012. A goodwill impairment charge of $142 million was deemed necessary at 30 June 2012 and was recognised in the interim financial statements. At 31 December 2012, the recoverable amount of the FRM CGU was again assessed, which included the previous Man Multi-Manager and the acquired FRM business. The value in use calculation followed the same methodology as for the GLG CGU, and suggested a value for the FRM CGU with significant headroom over the carrying value of the business. Therefore, no impairment charge was deemed necessary. As with the GLG goodwill, the FRM goodwill must be tested annually for impairment at the same time each year, as well as earlier if there are any indications or triggers of impairment. For the six months to 30 June 2013, FRM’s growth in FUM is slightly lower than that modelled in the value in use calculation at 31 December 2012. However, as FRM had significant headroom at 31 December 2012, and FRM’s margins and costs are as expected, the lower growth in FUM is not significant enough to be deemed an indicator of impairment. As a result, no impairment test of FRM’s goodwill has been undertaken at 30 June 2013. AHL cash generating unit The recoverable amount of the AHL CGU was assessed at 31 December 2012 using a value in use calculation. The value in use calculation indicated a value for the AHL CGU with significant headroom over the carrying value of the AHL business. As with the GLG and FRM goodwill, the AHL goodwill must be tested annually for impairment at the same time each year, as well as earlier if there are any indications or triggers of impairment. For the six months to 30 June 2013, AHL’s growth in FUM is slightly lower than that modelled in the value in use calculation at 31 December 2012. However, as AHL had significant headroom at 31 December 2012, and AHL’s margins and costs are as expected, the lower growth in FUM is not significant enough to be deemed an indicator of impairment. As a result, no impairment test of AHL’s goodwill has been undertaken at 30 June 2013.

30
13. Other intangibles
Other intangible assets
Placement fees
Capitalised
Computer
$m Software Total
Net book value at 1 January 2013 32 13 45 Amortisation )5 ( )6 ( )11 ( Additions 3 - 3 Redemptions/disposals )3 ( - )3 (
Net book value at 30 June 2013 27 7 34
14. Cash, liquidity and borrowings
Total liquidity resources aggregated to $2,643 million at 30 June 2013 (31 December 2012: $3,525 million) and comprised cash and cash equivalents of $1,118 million (31 December 2012: $2,000 million) and the undrawn committed revolving credit facility of $1,525 million (31 December 2012: $1,525 million). Cash and cash equivalents at period end comprises $228 million (31 December 2012: $268 million) of cash at bank available on demand, $526 million (31 December 2012: $1,153 million) in treasury bills, and $364 million (31 December 2012: $579 million) in short term deposits. Net of borrowings and issued debt the net cash position at 30 June 2013 was $944 million, compared to $1,141 million as at 31 December 2012. The movement in cash is analysed in the cash flow statement. The decrease of $197 million in Man’s net cash position during the period is primarily the result of dividends on ordinary shares and capital securities of $247 million, offset partially by cash flows from operating activities. On 7 May 2013, the €216 million ($285 million) Senior 2015 fixed rate bonds were repurchased at a premium of $23 million. This premium, along with an accelerated unwind of issue costs and fees of $2 million have been included in finance expense for the period. In addition, the $231 million Tier 2 subordinated 2017 fixed rate bonds were repurchased at a premium of $3 million on 14 June 2013. There were no fees payable on the repurchase of the $170 million Tier 2 subordinated 2015 floating rate notes, which took place on 24 June 2013. The following table summarises Man’s available liquidity at the end of the period.
$m
At 30 June
At 31 December
2013 2012
Senior 2013 fixed rate bonds 174 173 Senior 2015 fixed rate € bonds - 285 Tier 2 subordinated 2015 floating rate notes - 170 Tier 2 subordinated 2017 fixed rate bonds - 231
Borrowings 174 859
Tier 1 perpetual subordinated capital securities 300 300
Cash and cash equivalents 1,118 2,000 Undrawn committed revolving credit facility 1,525 1,525
Total available liquidity (cash plus undrawn committed facilities) 2,643 3,525

31
15. Investments in fund products and other investments
At 30 June
At 31 December
$m 2013 2012
Investments in fund products comprise:
Loans to fund products 257 274 Other investments in fund products 195 213
452 487
At 30
June At 31
December
2013 2012
Other investments comprise: (restated)
Pension asset 62 - Other 15 9
77 9
‘Other investments in fund products’ relate to our on-going business to build our product breadth and to trial investment research developments before we market the products to investors. This includes $60 million (31 December 2012: $51 million) of fund products which are held against outstanding deferred compensation arrangements.
The pension asset has increased, changing from a pension liability to an asset during the period, due to pension contributions and positive remeasurements in the net pension asset.
16. Share capital and reserves
$m
At 30 June
At 31 December
2013 2012
Share capital 63 63 Share premium account 5 1 Merger reserve 491 491 Reorganisation reserve 632 632 Revaluation Reserves and retained earnings 1,276 1,423
2,467 2,610
17. Related party transactions
The related party transactions during the period are consistent with the categories disclosed in the Annual Report for the year ended 31 December 2012. Total revenue from fund entities deemed to be associates was $26 million (H1 2012: $117 million), which relate to the investment management agreements with fund products in which we also hold an investment. Total fee receivables and loan balances with fund entities deemed to be associates totalled $25 million (31 December 2012: $15 million). In addition, Man had entered into committed purchase agreements totalling $20 million (31 December 2012: $6 million) with fund entities deemed to be associates.

32
18. Fair value hierarchy of financial assets/liabilities The fair value hierarchy of financial assets and liabilities held at fair value as at 30 June 2013 can be analysed as follows: 30 June 2013
$m Level 1 Level 2 Level 3 Total
Financial assets held at fair value:
Investments in fund products (Note 15) - 96 99 195
Other investments and other receivables 4 21 2 27
4 117 101 222
Financial liabilities held at fair value:
Other payables - 8 46 54
31 December 2012
$m Level 1 Level 2 Level 3 Total
Financial assets held at fair value: Investments in fund products (Note 15) - 96 117 213
Other investments and other receivables 4 14 5 23
4 110 122 236
Financial liabilities held at fair value:
Other payables - 2 60 62
During the period, there were no significant changes in the business or economic circumstances that affected the fair value of Man’s financial assets and no significant transfers of financial assets or liabilities held at fair value between categories. For investments in funds, Level 2 investments comprise holdings primarily in unlisted open-ended, active and liquid funds, such as seeding investments, which have weekly or daily pricing. A transfer into Level 3 would be deemed to occur where the level of prolonged activity, as evidenced by subscriptions and redemptions, is deemed insufficient to support a Level 2 classification. This, as well as other factors such as a deterioration of liquidity in the underlying investments or inability to redeem the investment within a reasonable time frame, would also result in a Level 3 classification. Liquidity premium adjustments of $6 million (31 December 2012: $8 million) have been applied for gated, suspended, sidepocketed or otherwise illiquid Level 3 investments. These adjustments are calculated using a discounted cash flow where the main assumptions are the discount rate and expected timing of cash flows. Reasonable changes in the liquidity premium assumptions would not have a significant impact on the fair value.
The basis of measuring the fair value of investments in fund products is outlined in Note 15 in the Annual Report for the year ended 31 December 2012. Movement in Level 3 financial assets and financial liabilities, measured at fair value, during the period can be analysed as follows:

33
$m
Financial assets at fair value
through profit or
loss
Available -for-sale
financial assets Total
Financial liabilities at
fair value through profit or
loss Total Level 3 financial assets/(liabilities) held at fair value At beginning of the period 117 5 122 )60 ( 62 Total gains in comprehensive income
12 - 12 4 16
Included in profit for the period* 12 - 4 Included in other comprehensive income
- - -
Purchases 29 - 29 - 29 Settlements )48 ( )3 ( )51 ( - )51 ( Transfers out of Level 3 )11 ( - )11 ( - )11 ( Other adjustments - - - 10 10 At period end 99 2 101 )46 ( 55 Total gains for the period included in the statement of comprehensive income for assets/liabilities held at period end
12 - 12 4 16
*primarily classified in ‘Gains on investments and other financial instruments’ The financial liabilities in Level 3 relate to the contingent consideration payable to former shareholders of FRM Holdings Limited. The fair value is based primarily on the expected run rate management fee level for the legacy FRM business up to 3 years after the original acquisition date of July 2012, and is determined using a combination of inputs, such as weighted average cost of capital, high water mark levels, performance and net management fee margins and net flow assumptions. The most significant input relates to the expectations of the weighted average net management fee margin over this future period. If the net management fee margin as a percentage of funds under management for FRM legacy funds was 0.8% at period end, instead of the current level of 0.85%, a further gain of $9 million would have been recorded. 19. Post balance sheet events
On 1 August 2013, Man redeemed all of the $174 million senior 2013 fixed rates bonds at par and intends to redeem all of the $300 million Tier 1 perpetual subordinated capital securities at the next call date on 7 August 2013.
On 2 August 2013, it was announced that additional cost savings have been identified, which will be achieved by the end of 2015. These additional cost savings will result in a one off charge, which will be recognised in the second half of 2013.

34
Independent review report to Man Group plc
Introduction We have been engaged by the company to review the Interim Financial Statements in the Interim Results for the six months ended 30 June 2013, which comprises the Group Income Statement, the Group Statement of Comprehensive Income, the Group Balance Sheet, the Group Statement of Changes in Equity and the Group Cash Flow Statement and related notes. We have read the other information contained in the Interim Results and considered whether it contains any apparent misstatements or material inconsistencies with the information in the Interim Financial Statements. Directors’ responsibilities The Interim Results are the responsibility of, and has been approved by, the directors. The directors are responsible for preparing the Interim Results in accordance with the Disclosure and Transparency Rules of the United Kingdom's Financial Conduct Authority. As disclosed in note 1, the annual financial statements of the group are prepared in accordance with IFRSs as adopted by the European Union. The Interim Financial Statements included in these Interim Results have been prepared in accordance with International Accounting Standard 34, "Interim Financial Reporting", as adopted by the European Union. Our responsibility Our responsibility is to express to the company a conclusion on the Interim Financial Statements in the Interim Results based on our review. This report, including the conclusion, has been prepared for and only for the company for the purpose of the Disclosure and Transparency Rules of the Financial Conduct Authority and for no other purpose. We do not, in producing this report, accept or assume responsibility for any other purpose or to any other person to whom this report is shown or into whose hands it may come save where expressly agreed by our prior consent in writing. Scope of review We conducted our review in accordance with International Standard on Review Engagements (UK and Ireland) 2410, ‘Review of Interim Financial Information Performed by the Independent Auditor of the Entity’ issued by the Auditing Practices Board for use in the United Kingdom. A review of interim financial information consists of making enquiries, primarily of persons responsible for financial and accounting matters, and applying analytical and other review procedures. A review is substantially less in scope than an audit conducted in accordance with International Standards on Auditing (UK and Ireland) and consequently does not enable us to obtain assurance that we would become aware of all significant matters that might be identified in an audit. Accordingly, we do not express an audit opinion. Conclusion Based on our review, nothing has come to our attention that causes us to believe that the Interim Financial Statements in the Interim Results for the six months ended 30 June 2013 are not prepared, in all material respects, in accordance with International Accounting Standard 34 as adopted by the European Union and the Disclosure and Transparency Rules of the United Kingdom's Financial Conduct Authority.
PricewaterhouseCoopers LLP Chartered Accountants 2 August 2013 London The maintenance and integrity of the Man Group plc website is the responsibility of the directors; the work carried out by the auditors does not involve consideration of these matters and, accordingly, the auditors accept no responsibility for any changes that may have occurred to the financial statements since they were initially presented on the website. Legislation in the United Kingdom governing the preparation and dissemination of financial statements may differ from legislation in other jurisdictions.