final paper capstone
TRANSCRIPT
1 | Page
ACME Shoe Distribution Project
Project Report
April 11, 2016
Clarkson University
Advisor: Dr. Yu
Team Leader: Clint Hobbs
Anthony Bruni
J.R. Campbell
Austin Florian
2 | Page
Table of Contents
Executive Summary ................................................................................................................ 3
Background ............................................................................................................................. 3
Problem ................................................................................................................................... 4
Previous Solutions to the Problem .......................................................................................... 4
Operations ............................................................................................................................... 5
Infrastructure ........................................................................................................................... 6
Storage .................................................................................................................................... 9
Outbound and Shipping ........................................................................................................ 14
Inbound and Receiving ......................................................................................................... 16
Labor Schedule ..................................................................................................................... 17
Financial Analysis................................................................................................................. 21
Schedule ................................................................................................................................ 25
References ............................................................................................................................. 27
Appendices............................................................................................................................ 28
............................................................................................................................................... 30
3 | Page
Executive Summary
ACME is a wholesale athletic footwear distributor based out of Arizona. The lease for
their current distribution center expires in 2017 and they also need to upgrade this facility, which
is currently at capacity. Our report will be outlining our solution for how we will go about
upgrading this facility to account for growth over the next five years. The use of cross-docking
and also a larger warehouse square footage will allow ACME to store their expanding inventory
for at least the next five years.
Background
ACME’s shoes can be broken up into five different “velocity categories” based on how
fast the shoes move through the warehouse on a yearly basis: A, B, C, D & E. We plan to put
into effect a system that will require a small amount of movement for the units through the
facility. Our plan is to organize all of the storage and unit procurement based upon their velocity
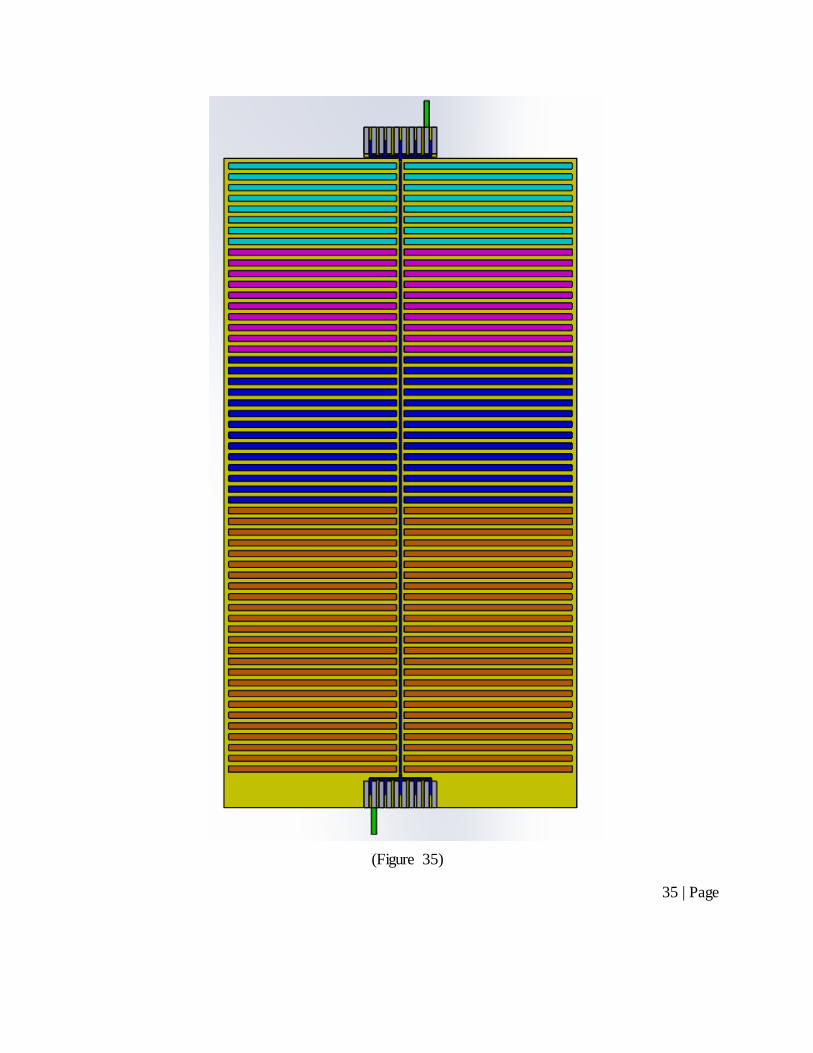
category. We will organize in a linear fashion so that the velocities that move the most (A’s) are
closest to shipping and vice versa (represented by the different colors in Figure 35 of the
Appendix). Of the five velocity categories, we will be discarding any E units during the move
due to their lack of relevance in the market. On one side of the distribution center, we will have
the receiving section of the facility, where all of the SKU’s will come in on pallets and then be
disassembled into cartons for storage. We then have decided to design the plant with an upper
central conveyor system throughout the facility, which will bring the units to their respective
sections (D first, A last) for storage, which is based on their velocity category using a scanner
that can identify each carton as it travels over the belt. Once each carton reaches the end of the
line in its section, it will be hand sorted and stored on the shelving system. However, if a unit
will be moving in and out in the same day (such as an A or B unit), the system will have those
units travel straight through to the end of the line towards shipping (cross docked) where they
will be placed on pallets again and shipped out to their respective customers. We feel that this
system can and will increase the speed of unit procurement and shipping as well as the fact that it
4 | Page
will be able to handle the increasing number of SKU’s that will be traveling through this facility
in the coming years.
Problem
As of right now the ACME company is growing in size while their current facilities, such
as their distribution center, are becoming too small to handle the larger capacity of units being
sold and processed. For growing companies it is very important that they recognize their growth
and adapt to be able to fulfill their customer’s needs. The current distribution center will soon be
at full capacity as far as what they are able to store, and what they are able to move through the
facility. We are currently proposing a plan to build a new distribution center and make it suitable
for the future growth of the ACME Company. They are currently seeking a distribution center
for a constant 7% growth until at least 2021. This 7% growth is based upon previous trend data
and forecasts suggesting such growth for the future. We plan to put enough space and put the
correct operations in effect to thoroughly accommodate this figure.
Previous Solutions to the Problem
Currently, ACME owns a warehouse that is not large enough to account for their growth
over the next five years. Their inability to expand upon this current warehouse is partially what is
driving them into a new warehouse. Also, the company is not currently utilizing their ability to
cross-dock SKU’s that move rapidly through the warehouse. Cross-docking allows for the units
to bypass having to be stored onto shelves, and can more efficiently move units to their next
destination. On the contrary, the company’s willingness to store E units is also an unnecessary
cost, which we will eliminate. We see no reason to store units within the warehouse if they do
not ever move.
5 | Page
Operations
When we were considering how to have our flow of operations throughout the
warehouse, we wanted things to run efficiently as possible. Our goal is that a unit would be
checked in at our inbound dock and will be able to flow smoothly throughout the warehouse to
the correct destination that it is supposed to be stored in. While this is happening we will also be
able to know where all of our inventory is throughout the warehouse, through our use of scanners
and sorters. We also wanted to be able to utilize crossdocking in this warehouse in order to be
able to effectively move our orders as fast as possible. While the previous warehouse had
crossdocking capabilities they didn’t correctly run their operations in order to utilize it. In order
for our operations to be the most effective, but also fall within our pricing limitations, we felt it
was necessary to have a good balance between manual labor and automation. While we do use
manual labor for the majority of the warehouse, there is also some automation that we needed to
include in order to meet our efficiency goals.
Our inventory will come delivered in pallets to one of our ten different inbound docks,
where our receiving employees will open the doors and begin to unload the pallets from the
trucks utilizing steel hand trucks. Once all the pallets are unloaded and in our central receiving
area, the pallets will be broken down into cartons and placed onto our first central conveyer belt,
where the cartons will each be scanned and their SKU will be recorded. We purposely made our
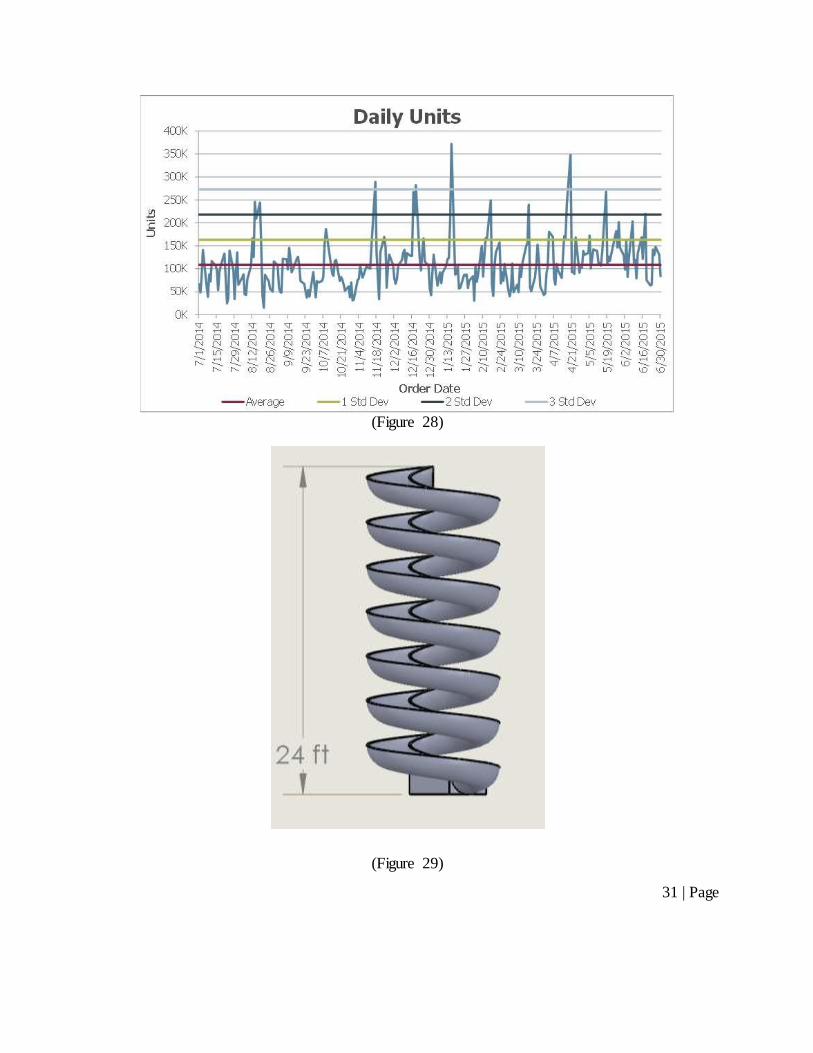
receiving station higher in height than the rest of the warehouse so that we could utilize gravity
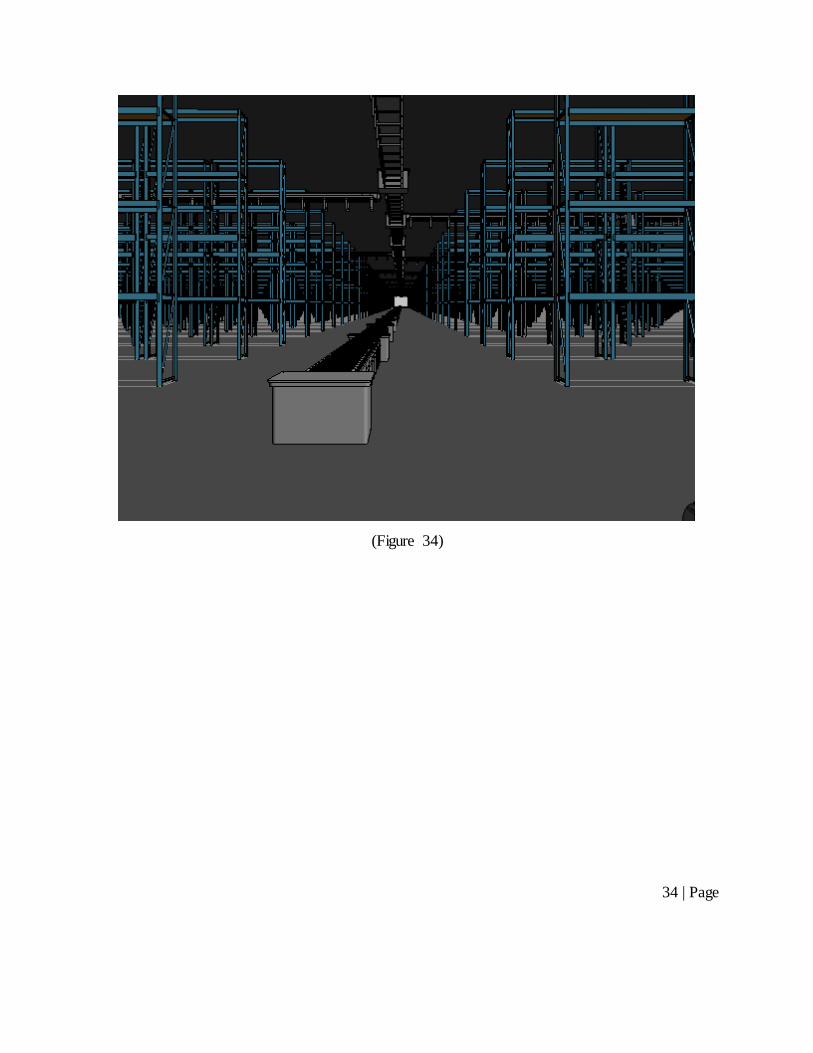
chutes (Figure 29 in Appendix) while sorting our inventory. Our inbound conveyer belts will be
running above the rest of the warehouse so that it allows free movement on the ground level for
our employees to operate equipment (Figure 34). Once the cartons are on the central conveyer
belt, they will run elevated down the middle of the warehouse until they reach their respective
SKU classification (A, B C, or D). If some of our orders are ones that we are crossdocking, then
the order will go down to the bottom floor conveyer belt via a gravity chute. Then the package
will run the whole length of the warehouse on our ground conveyer belt until it reaches the
outbound dock. If it is not an order that we are crossdocking it will run normally along the
elevated conveyer belts. Once a carton reaches its area the push sorter that we have installed on
6 | Page
the central conveyer belt will push the carton off the belt into a spiral chute. Our chute will
transfer our cartons down to the floor level to a pick up storage area, where the cartons will be
waiting for our stocking employees to take them. Our employees will use a platform truck to take
the cartons and bring them to their correct storage location within the rows of our warehouse.
Once they are at their correct destination, depending on the height of their storage location, our
employees will either manually stack the cartons in the correct area, or use a forklift to stack the
cartons.
Once an order is received we will scan it in our system and figure out the location of the
product in our warehouse. From there, we will have one of our picking employees locate the
correct product and pick it off of the shelving using either a forklift or manually picking.
Depending on the size of the order our pickers will use a platform truck to bring the inventory to
the central conveyer belt, which in turn will bring the order to the shipping department. Once the
order are on the conveyer belt heading outbound, they will again be scanned on the way out. For
each carton a receipt and shipping label will be printed and applied to the cartons. Once our
orders reach the end of the conveyer belt leading to the outbound docks they will be picked off
by our shipping employees, who will identify which orders go together in an order and place
them into their correct and respective pallets. Once a pallet is completely full or has its correct
combination of cartons in it, the pallet will be closed and will have shipping labels applied to it
in order to ensure the pallet ends up in the right destination and gets put on the correct truck to be
shipped. After the pallet is closed we will load it onto our docks using steel hand trucks until
everything is loaded, at which point the trucks will leave and we will close our outbound doors.
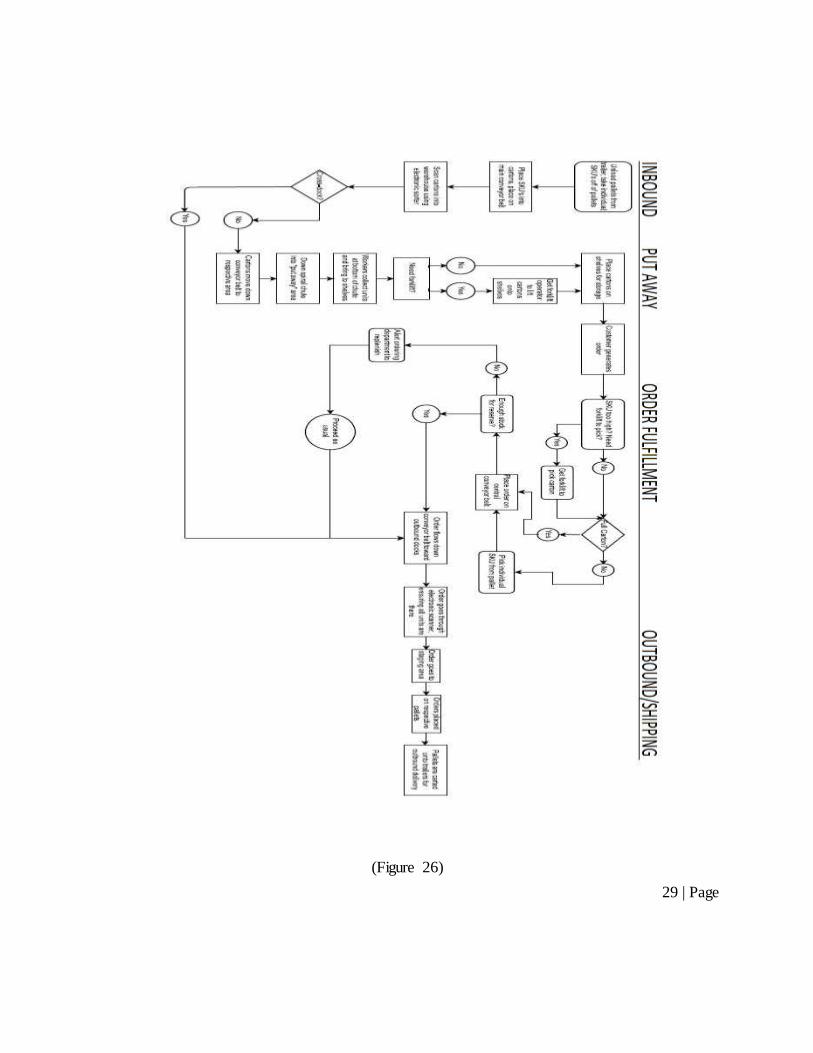
Please refer to figure 26 of the Appendix to better understand with the operations layout.
Infrastructure
To make sure that we had the correct equipment that would allow us to be able to
properly handle all of our incoming and outgoing units, our general idea was that we would get
the equipment that would allow us to move and store all of our inventory in a timely fashion
7 | Page
while also staying under a certain budget. A lot of this boiled down to what could be done with
manual labor against what we needed automation for.
For our recommended design one of the most crucial components was our conveyer belts.
We knew that no matter what we were going to need some type of belts throughout our
warehouse, so this was something that we were going to have to end up paying for no matter
what. In our warehouse design, we used conveyer belts on the ground floor to transfer everything
from the rows to the outbound station. We also have a conveyer belt elevated that runs from our
inbound station and separates our cartons by their SKU classification. We are also utilizing a
small bit of conveyer belts at our inbound and outbound docks used for sorting. The next thing
we identified needing was forklifts. We needed these in order to stack and pick cartons that we
cannot manually reach. Since our shelving runs twenty four feet high forklifts were another thing
that we could not do without. The next thing we wanted to address was how to transport our
cartons throughout the warehouse. When examining the rule of thumb documents provided to us,
we identified platform trucks as one piece of equipment that would allow us to easily move
cartons while still at a reasonable price.
In order to run our conveyer belts, we needed a control system, which was also on the
rule of thumb. We knew that we were also going to need two sorters, one for the inbound dock
and one for the outbound in order to separate all of our inventory and ensure it ends up in the
correct area. We also needed scanners and metering belts for each one of our sorters. The last
thing we wanted as far as infrastructure goes was rails for our inbound and outbound docks, in
order to make it easier on the drivers when backing up to our doors. We deemed we would need
two rails for each door we had. While there were a lot of other things we could have bought and
installed inside our warehouse, when considering the tradeoffs between cost and efficiency, the
combination of materials that we chose was the most cost effective while still allowing us to run
our warehouse at optimal efficiency.
When going over the pricing for all of our infrastructure materials we referred to the rule
of thumb for the pricing. Overall in our warehouse we had roughly 13,100 feet of conveyer belts
which were priced at $217.50 per feet, resulting in roughly 2.85 million dollars in conveyer belts
8 | Page
inside our warehouse. We will need 30 total chutes in the warehouse at $2500 per chute resulting
in $75,000 dollars in chutes. We determined we will need 55 total forklifts, which are valued at
$20,000 each for a total of $1.1 million dollars of forklifts. As far as platform trucks, we decided
to get 60 of them so that they could be spaced all throughout the warehouse and easily
accessible. Valued at $400 each we spent a total of $24,000 on platform trucks. Our steel hand
trucks are valued at $337.50 each, and when buying 20 for the warehouse, totals $6,750 in steel
hand trucks. Our scanners cost $105,000 each, so with two of them our total scanner cost was
$210,000. Along with scanners, we need a control system that cost $50,000. We also bought 2
sorters for a total of $17,520. 20 sets of rails are needed for our loading docks, with each set
costing $102.50 for a total cost of $2,050 for guard rails. When we factored in the total cost of
our storage rows ($10,024,875) we were able to come up with the total price of the infrastructure
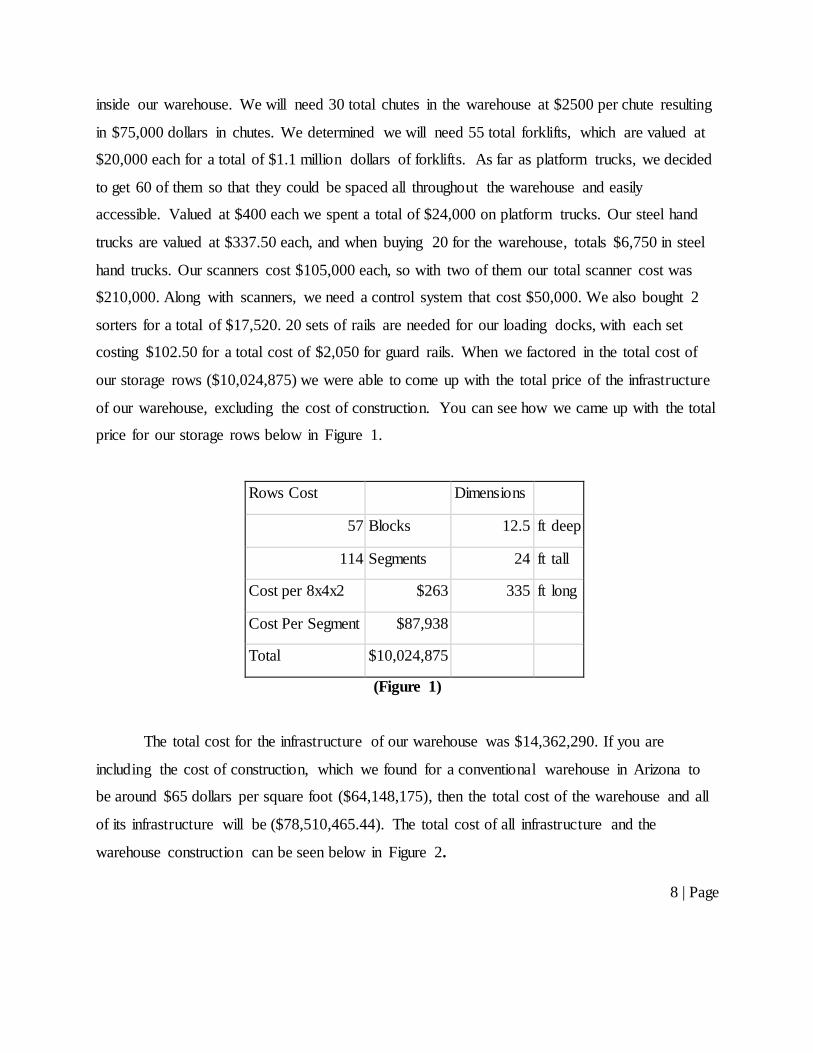
of our warehouse, excluding the cost of construction. You can see how we came up with the total
price for our storage rows below in Figure 1.
Rows Cost
Dimensions
57 Blocks 12.5 ft deep
114 Segments 24 ft tall
Cost per 8x4x2 $263 335 ft long
Cost Per Segment $87,938
Total $10,024,875
(Figure 1)
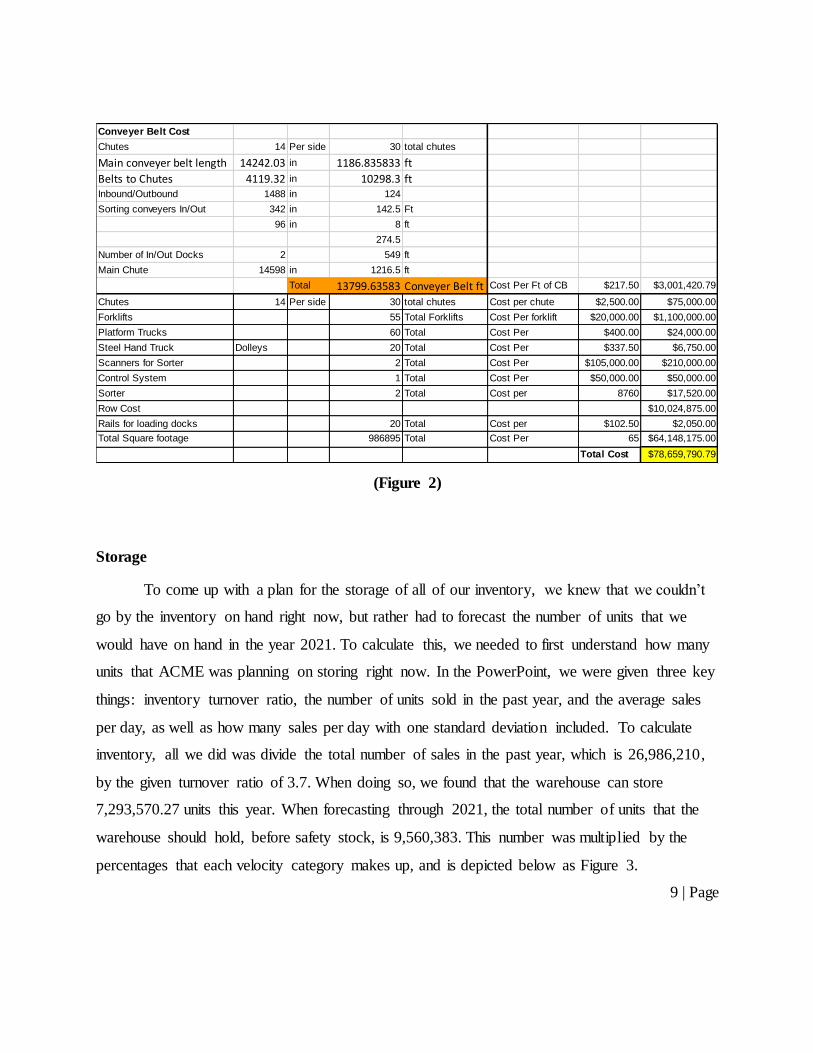
The total cost for the infrastructure of our warehouse was $14,362,290. If you are
including the cost of construction, which we found for a conventional warehouse in Arizona to
be around $65 dollars per square foot ($64,148,175), then the total cost of the warehouse and all
of its infrastructure will be ($78,510,465.44). The total cost of all infrastructure and the
warehouse construction can be seen below in Figure 2.
9 | Page
(Figure 2)
Storage
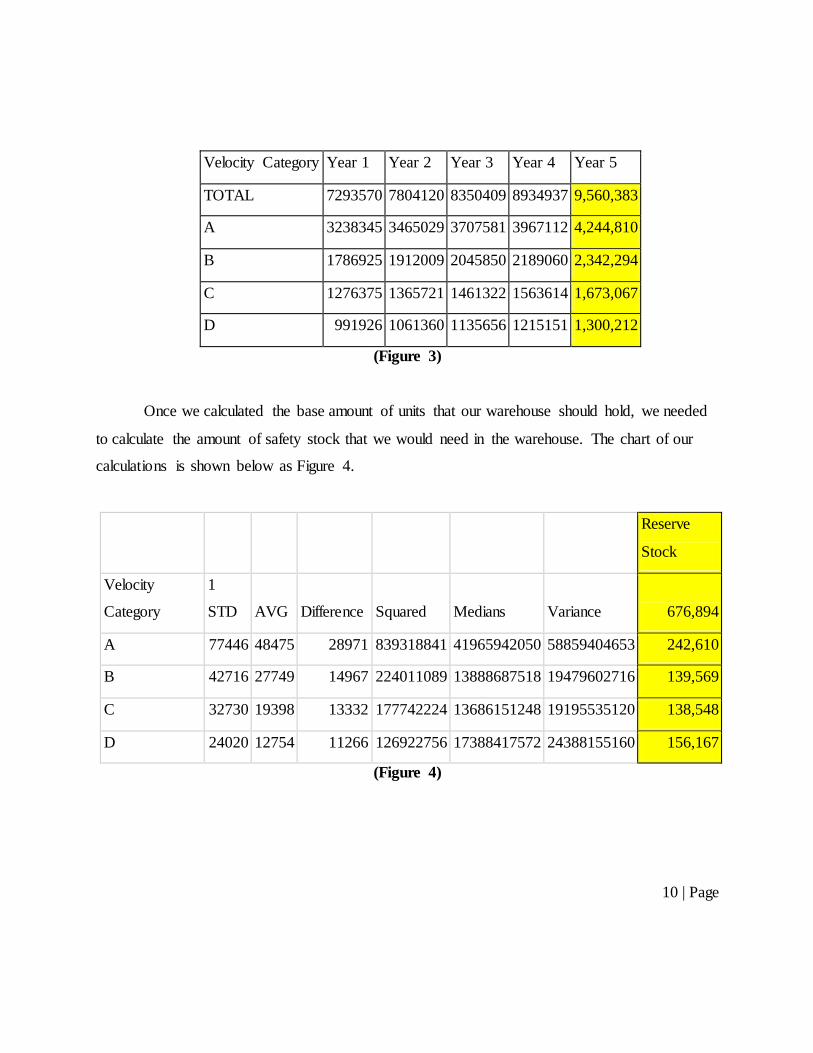
To come up with a plan for the storage of all of our inventory, we knew that we couldn’t
go by the inventory on hand right now, but rather had to forecast the number of units that we
would have on hand in the year 2021. To calculate this, we needed to first understand how many
units that ACME was planning on storing right now. In the PowerPoint, we were given three key
things: inventory turnover ratio, the number of units sold in the past year, and the average sales
per day, as well as how many sales per day with one standard deviation included. To calculate
inventory, all we did was divide the total number of sales in the past year, which is 26,986,210,
by the given turnover ratio of 3.7. When doing so, we found that the warehouse can store
7,293,570.27 units this year. When forecasting through 2021, the total number of units that the
warehouse should hold, before safety stock, is 9,560,383. This number was multiplied by the
percentages that each velocity category makes up, and is depicted below as Figure 3.
Conveyer Belt Cost
Chutes 14 Per side 30 total chutes
Main conveyer belt length 14242.03 in 1186.835833 ft
Belts to Chutes 4119.32 in 10298.3 ftInbound/Outbound 1488 in 124
Sorting conveyers In/Out 342 in 142.5 Ft
96 in 8 ft
274.5
Number of In/Out Docks 2 549 ft
Main Chute 14598 in 1216.5 ft
Total 13799.63583 Conveyer Belt ft Cost Per Ft of CB $217.50 $3,001,420.79
Chutes 14 Per side 30 total chutes Cost per chute $2,500.00 $75,000.00
Forklifts 55 Total Forklifts Cost Per forklift $20,000.00 $1,100,000.00
Platform Trucks 60 Total Cost Per $400.00 $24,000.00
Steel Hand Truck Dolleys 20 Total Cost Per $337.50 $6,750.00
Scanners for Sorter 2 Total Cost Per $105,000.00 $210,000.00
Control System 1 Total Cost Per $50,000.00 $50,000.00
Sorter 2 Total Cost per 8760 $17,520.00
Row Cost $10,024,875.00
Rails for loading docks 20 Total Cost per $102.50 $2,050.00
Total Square footage 986895 Total Cost Per 65 $64,148,175.00
Total Cost $78,659,790.79
10 | Page
Velocity Category Year 1 Year 2 Year 3 Year 4 Year 5
TOTAL 7293570 7804120 8350409 8934937 9,560,383
A 3238345 3465029 3707581 3967112 4,244,810
B 1786925 1912009 2045850 2189060 2,342,294
C 1276375 1365721 1461322 1563614 1,673,067
D 991926 1061360 1135656 1215151 1,300,212
(Figure 3)
Once we calculated the base amount of units that our warehouse should hold, we needed
to calculate the amount of safety stock that we would need in the warehouse. The chart of our
calculations is shown below as Figure 4.
Reserve
Stock
Velocity
Category
1
STD AVG Difference Squared Medians Variance 676,894
A 77446 48475 28971 839318841 41965942050 58859404653 242,610
B 42716 27749 14967 224011089 13888687518 19479602716 139,569
C 32730 19398 13332 177742224 13686151248 19195535120 138,548
D 24020 12754 11266 126922756 17388417572 24388155160 156,167
(Figure 4)
11 | Page
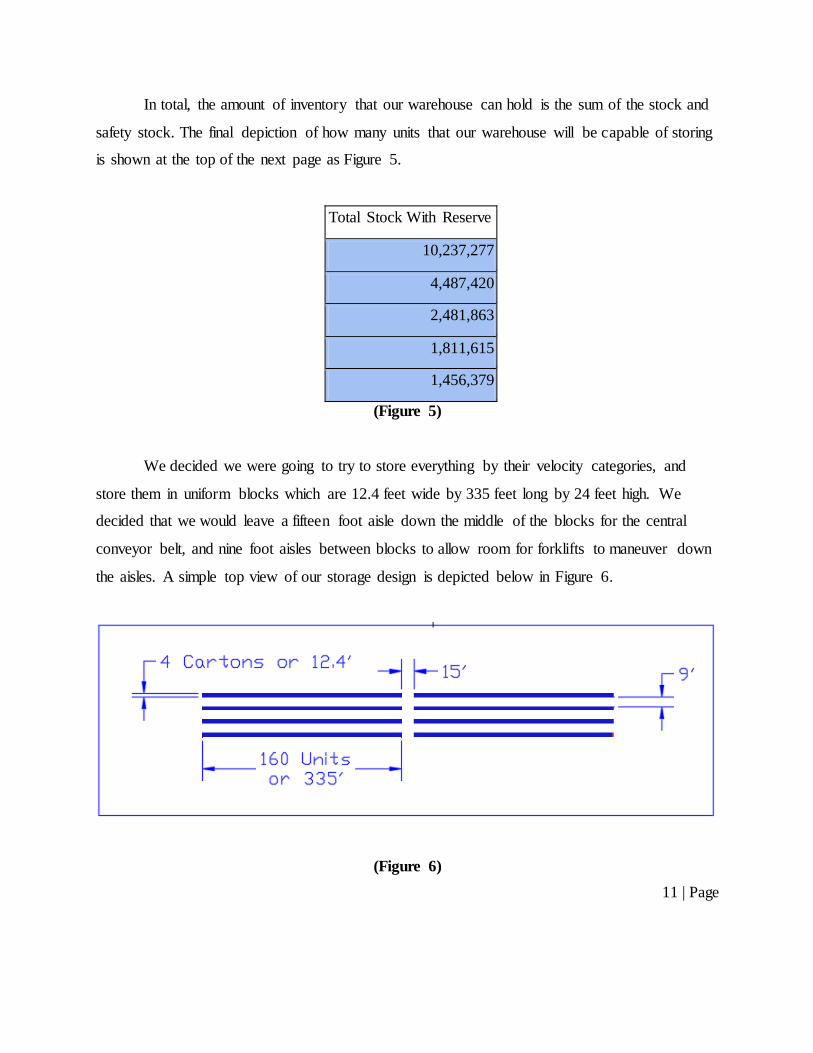
In total, the amount of inventory that our warehouse can hold is the sum of the stock and
safety stock. The final depiction of how many units that our warehouse will be capable of storing
is shown at the top of the next page as Figure 5.
Total Stock With Reserve
10,237,277
4,487,420
2,481,863
1,811,615
1,456,379
(Figure 5)
We decided we were going to try to store everything by their velocity categories, and
store them in uniform blocks which are 12.4 feet wide by 335 feet long by 24 feet high. We
decided that we would leave a fifteen foot aisle down the middle of the blocks for the central
conveyor belt, and nine foot aisles between blocks to allow room for forklifts to maneuver down
the aisles. A simple top view of our storage design is depicted below in Figure 6.
(Figure 6)
12 | Page
Once we computed average number of units we will have on hand in 2021, we broke that
down into how much inventory would be in each velocity section. This was based on carton
velocity SKU class. We wanted to keep everything in cartons because we felt that would allow
us to operate more efficiently and move things faster. Once we figured out how many cartons
were in each velocity category in 2021, we could start to find how many blocks that would need
for each of the velocity categories.
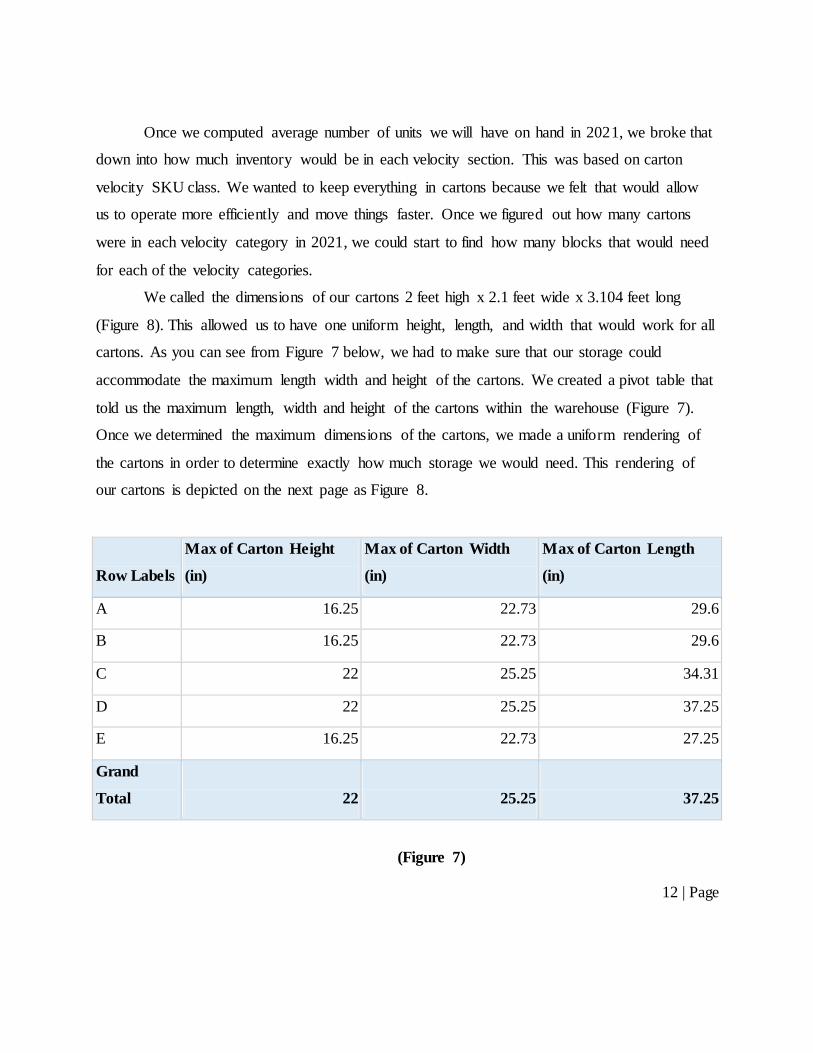
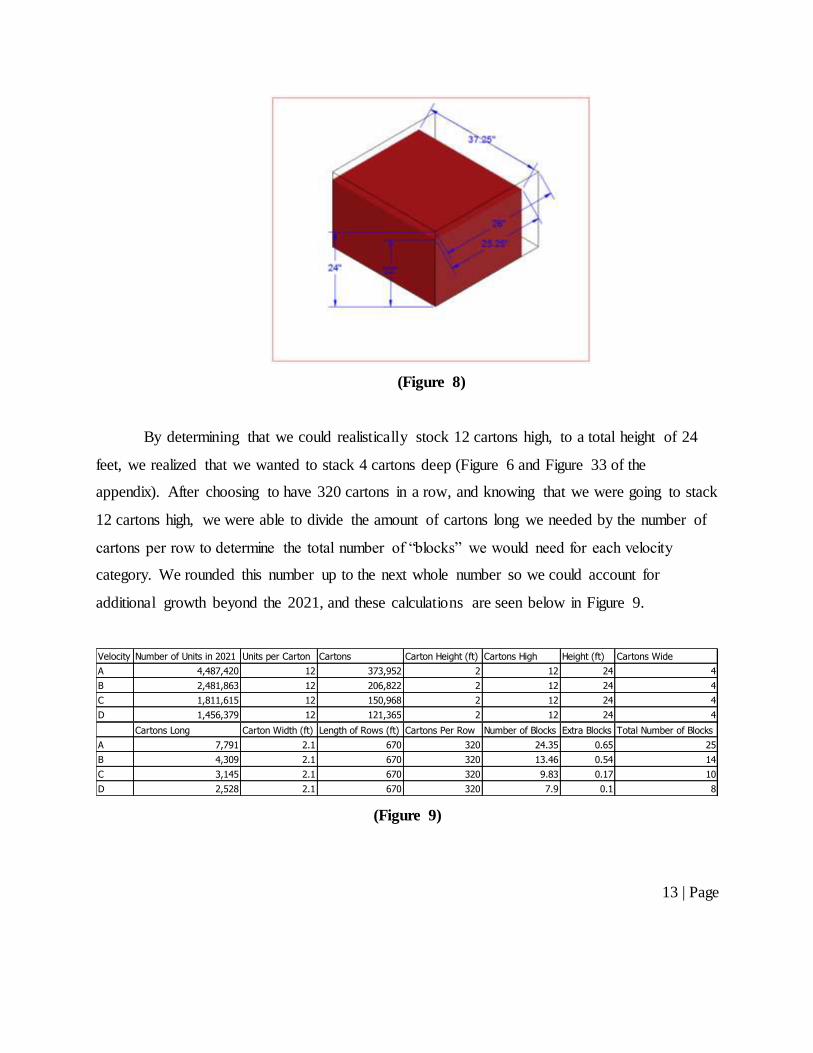
We called the dimensions of our cartons 2 feet high x 2.1 feet wide x 3.104 feet long
(Figure 8). This allowed us to have one uniform height, length, and width that would work for all
cartons. As you can see from Figure 7 below, we had to make sure that our storage could
accommodate the maximum length width and height of the cartons. We created a pivot table that
told us the maximum length, width and height of the cartons within the warehouse (Figure 7).
Once we determined the maximum dimensions of the cartons, we made a uniform rendering of
the cartons in order to determine exactly how much storage we would need. This rendering of
our cartons is depicted on the next page as Figure 8.
Row Labels
Max of Carton Height
(in)
Max of Carton Width
(in)
Max of Carton Length
(in)
A 16.25 22.73 29.6
B 16.25 22.73 29.6
C 22 25.25 34.31
D 22 25.25 37.25
E 16.25 22.73 27.25
Grand
Total 22 25.25 37.25
(Figure 7)
13 | Page
(Figure 8)
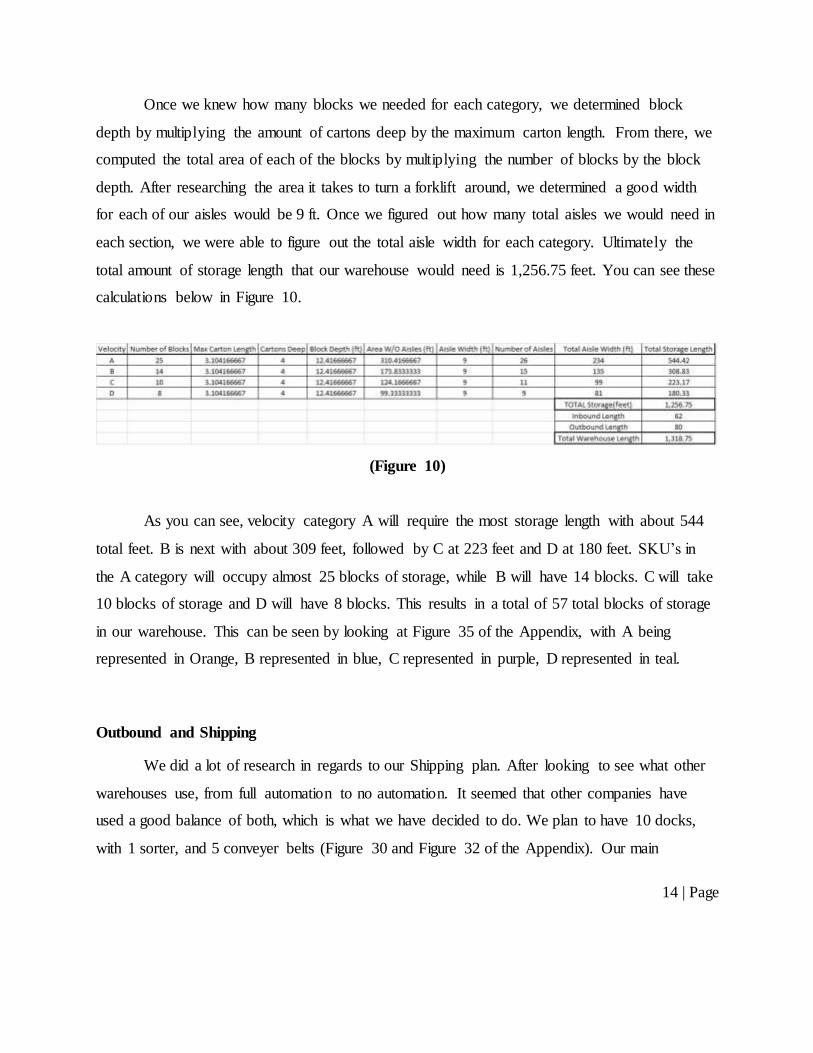
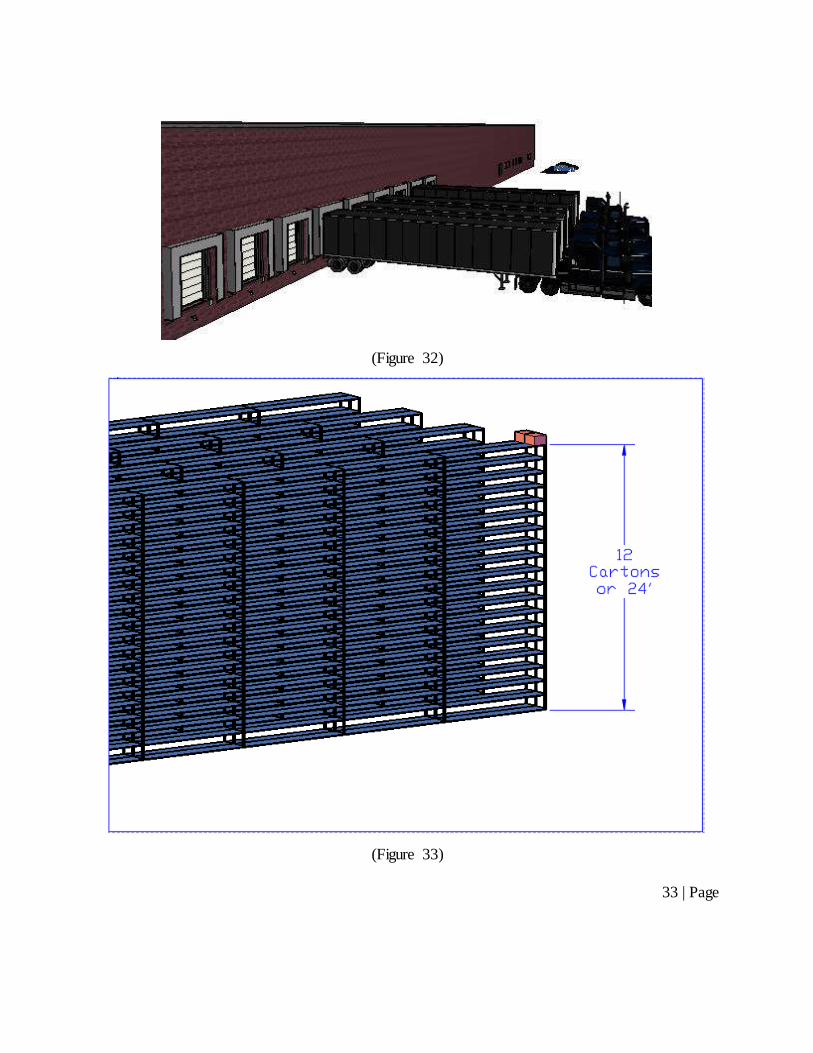
By determining that we could realistically stock 12 cartons high, to a total height of 24
feet, we realized that we wanted to stack 4 cartons deep (Figure 6 and Figure 33 of the
appendix). After choosing to have 320 cartons in a row, and knowing that we were going to stack
12 cartons high, we were able to divide the amount of cartons long we needed by the number of
cartons per row to determine the total number of “blocks” we would need for each velocity
category. We rounded this number up to the next whole number so we could account for
additional growth beyond the 2021, and these calculations are seen below in Figure 9.
(Figure 9)
Velocity Number of Units in 2021 Units per Carton Cartons Carton Height (ft) Cartons High Height (ft) Cartons Wide
A 4,487,420 12 373,952 2 12 24 4
B 2,481,863 12 206,822 2 12 24 4
C 1,811,615 12 150,968 2 12 24 4
D 1,456,379 12 121,365 2 12 24 4
Cartons Long Carton Width (ft) Length of Rows (ft) Cartons Per Row Number of Blocks Extra Blocks Total Number of Blocks
A 7,791 2.1 670 320 24.35 0.65 25
B 4,309 2.1 670 320 13.46 0.54 14
C 3,145 2.1 670 320 9.83 0.17 10
D 2,528 2.1 670 320 7.9 0.1 8
14 | Page
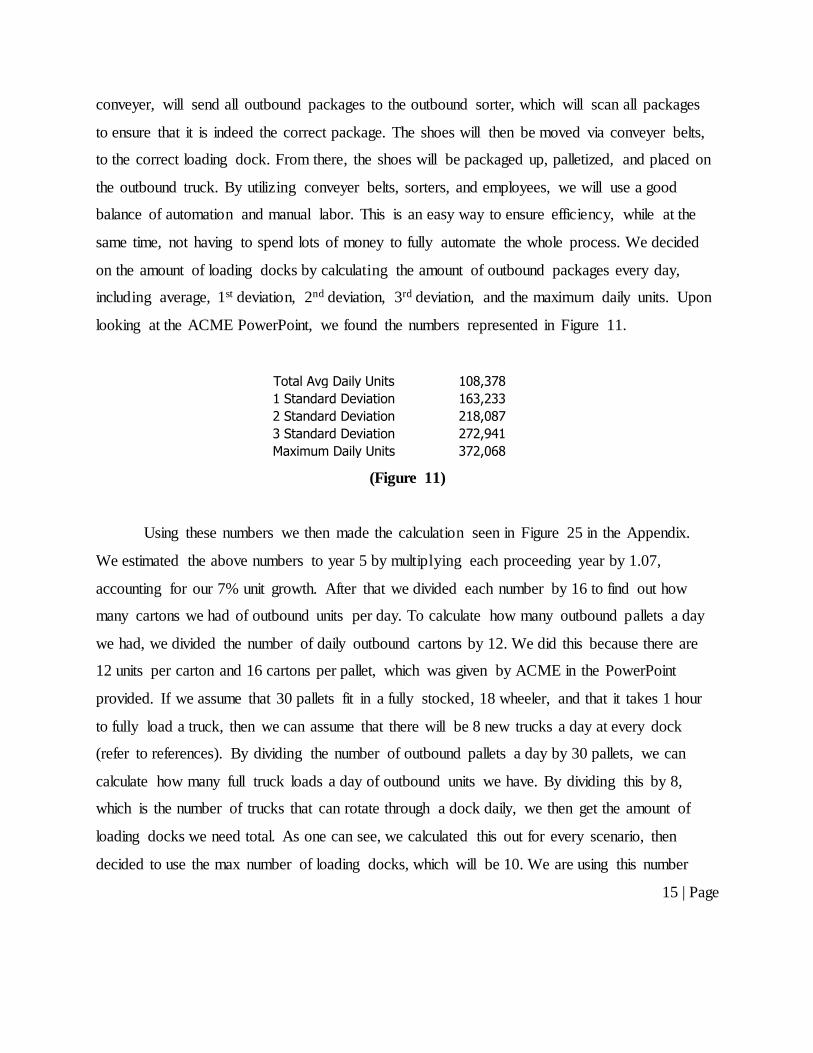
Once we knew how many blocks we needed for each category, we determined block
depth by multiplying the amount of cartons deep by the maximum carton length. From there, we
computed the total area of each of the blocks by multiplying the number of blocks by the block
depth. After researching the area it takes to turn a forklift around, we determined a good width
for each of our aisles would be 9 ft. Once we figured out how many total aisles we would need in
each section, we were able to figure out the total aisle width for each category. Ultimately the
total amount of storage length that our warehouse would need is 1,256.75 feet. You can see these
calculations below in Figure 10.
(Figure 10)
As you can see, velocity category A will require the most storage length with about 544
total feet. B is next with about 309 feet, followed by C at 223 feet and D at 180 feet. SKU’s in
the A category will occupy almost 25 blocks of storage, while B will have 14 blocks. C will take
10 blocks of storage and D will have 8 blocks. This results in a total of 57 total blocks of storage
in our warehouse. This can be seen by looking at Figure 35 of the Appendix, with A being
represented in Orange, B represented in blue, C represented in purple, D represented in teal.
Outbound and Shipping
We did a lot of research in regards to our Shipping plan. After looking to see what other
warehouses use, from full automation to no automation. It seemed that other companies have
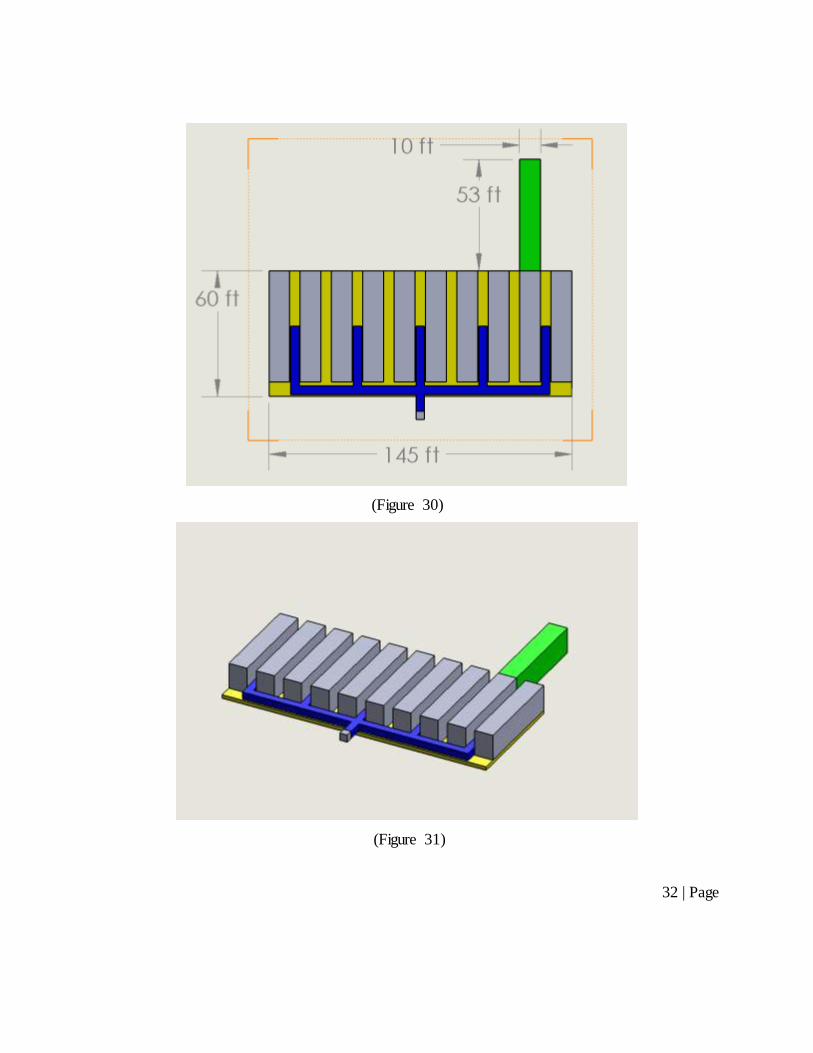
used a good balance of both, which is what we have decided to do. We plan to have 10 docks,
with 1 sorter, and 5 conveyer belts (Figure 30 and Figure 32 of the Appendix). Our main
15 | Page
conveyer, will send all outbound packages to the outbound sorter, which will scan all packages
to ensure that it is indeed the correct package. The shoes will then be moved via conveyer belts,
to the correct loading dock. From there, the shoes will be packaged up, palletized, and placed on
the outbound truck. By utilizing conveyer belts, sorters, and employees, we will use a good
balance of automation and manual labor. This is an easy way to ensure efficiency, while at the
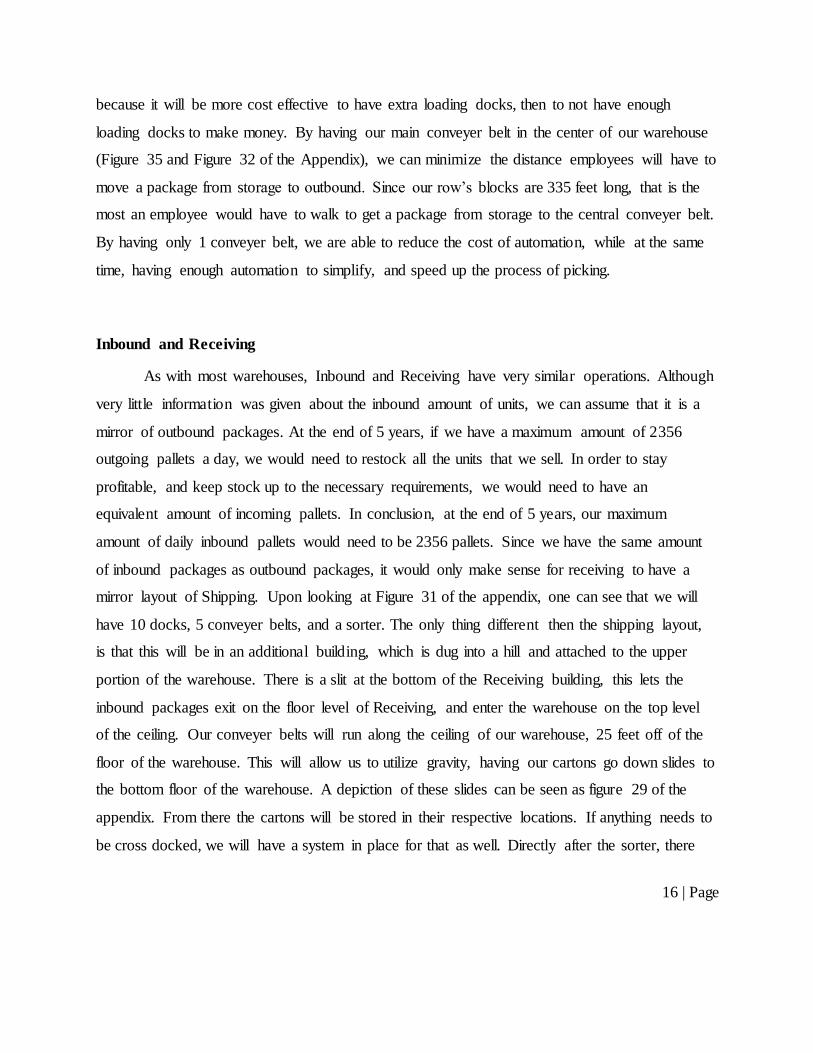
same time, not having to spend lots of money to fully automate the whole process. We decided
on the amount of loading docks by calculating the amount of outbound packages every day,
including average, 1st deviation, 2nd deviation, 3rd deviation, and the maximum daily units. Upon
looking at the ACME PowerPoint, we found the numbers represented in Figure 11.
Total Avg Daily Units 108,378
1 Standard Deviation 163,233
2 Standard Deviation 218,087
3 Standard Deviation 272,941
Maximum Daily Units 372,068
(Figure 11)
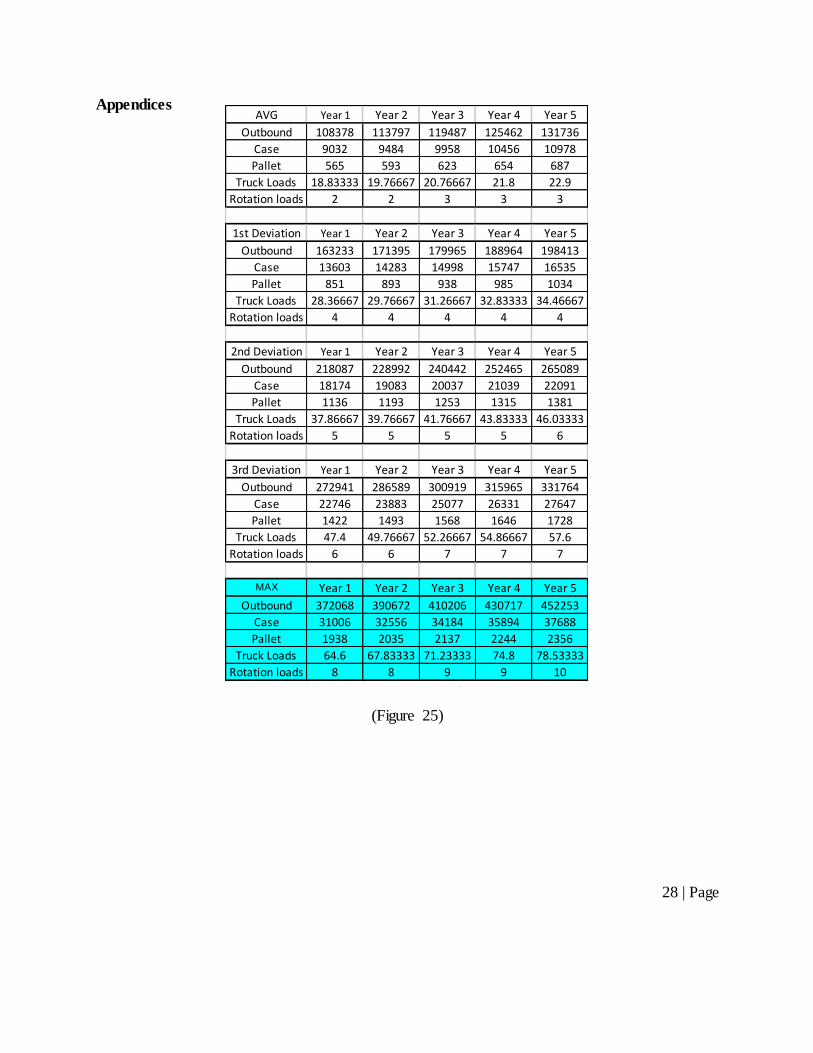
Using these numbers we then made the calculation seen in Figure 25 in the Appendix.
We estimated the above numbers to year 5 by multiplying each proceeding year by 1.07,
accounting for our 7% unit growth. After that we divided each number by 16 to find out how
many cartons we had of outbound units per day. To calculate how many outbound pallets a day
we had, we divided the number of daily outbound cartons by 12. We did this because there are
12 units per carton and 16 cartons per pallet, which was given by ACME in the PowerPoint
provided. If we assume that 30 pallets fit in a fully stocked, 18 wheeler, and that it takes 1 hour
to fully load a truck, then we can assume that there will be 8 new trucks a day at every dock
(refer to references). By dividing the number of outbound pallets a day by 30 pallets, we can
calculate how many full truck loads a day of outbound units we have. By dividing this by 8,
which is the number of trucks that can rotate through a dock daily, we then get the amount of
loading docks we need total. As one can see, we calculated this out for every scenario, then
decided to use the max number of loading docks, which will be 10. We are using this number
16 | Page
because it will be more cost effective to have extra loading docks, then to not have enough
loading docks to make money. By having our main conveyer belt in the center of our warehouse
(Figure 35 and Figure 32 of the Appendix), we can minimize the distance employees will have to
move a package from storage to outbound. Since our row’s blocks are 335 feet long, that is the
most an employee would have to walk to get a package from storage to the central conveyer belt.
By having only 1 conveyer belt, we are able to reduce the cost of automation, while at the same
time, having enough automation to simplify, and speed up the process of picking.
Inbound and Receiving
As with most warehouses, Inbound and Receiving have very similar operations. Although
very little information was given about the inbound amount of units, we can assume that it is a
mirror of outbound packages. At the end of 5 years, if we have a maximum amount of 2356
outgoing pallets a day, we would need to restock all the units that we sell. In order to stay
profitable, and keep stock up to the necessary requirements, we would need to have an
equivalent amount of incoming pallets. In conclusion, at the end of 5 years, our maximum
amount of daily inbound pallets would need to be 2356 pallets. Since we have the same amount
of inbound packages as outbound packages, it would only make sense for receiving to have a
mirror layout of Shipping. Upon looking at Figure 31 of the appendix, one can see that we will
have 10 docks, 5 conveyer belts, and a sorter. The only thing different then the shipping layout,
is that this will be in an additional building, which is dug into a hill and attached to the upper
portion of the warehouse. There is a slit at the bottom of the Receiving building, this lets the
inbound packages exit on the floor level of Receiving, and enter the warehouse on the top level
of the ceiling. Our conveyer belts will run along the ceiling of our warehouse, 25 feet off of the
floor of the warehouse. This will allow us to utilize gravity, having our cartons go down slides to
the bottom floor of the warehouse. A depiction of these slides can be seen as figure 29 of the
appendix. From there the cartons will be stored in their respective locations. If anything needs to
be cross docked, we will have a system in place for that as well. Directly after the sorter, there
17 | Page
will be a slide that drops cross docked packages down to the ground floor, where they can then
be put directly on the outbound conveyer belt, and taken to shipping.
Labor Schedule
In Acme’s current distribution center, automation is used very little, therefore the Labor
Schedule costs are high. Multiple employees have to be hired to do the job of one machine. Our
approach to tackle the problem is as follows: utilize automation to save time, money and
efficiency. Instead of having 6 employees trying to sort through cartons of shoes, we plan on
having a machine do it. This is not only faster and more effic ient, but also a more cost effective
alternative. We want to maximize the number of cartons our employees can move at once, while
still minimizing effort, and strength. In order to do this we plan to utilize platform trucks, and
steel hand trucks, which allow our employees to move multiple cartons at once with minimal
strain on the body. Instead of using automated guided vehicles, and automated picking vehicles,
we plan on using a Forklift and operator to pick each outbound carton, and put away our inbound
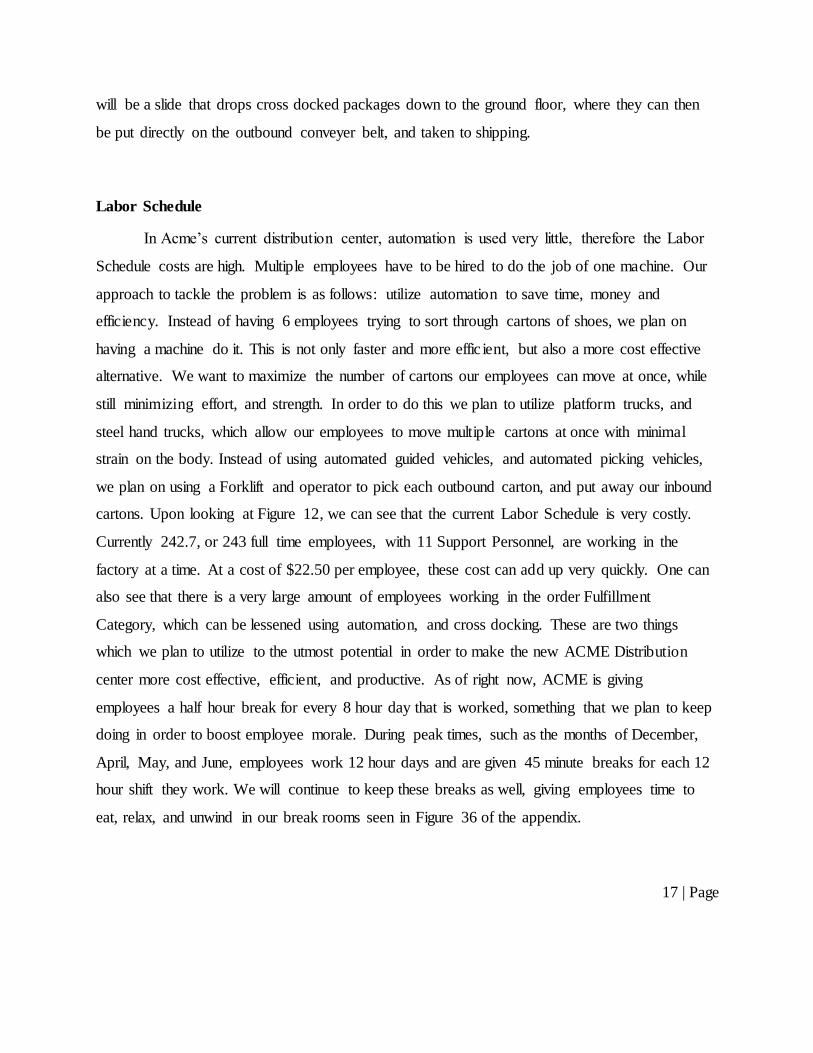
cartons. Upon looking at Figure 12, we can see that the current Labor Schedule is very costly.
Currently 242.7, or 243 full time employees, with 11 Support Personnel, are working in the
factory at a time. At a cost of $22.50 per employee, these cost can add up very quickly. One can
also see that there is a very large amount of employees working in the order Fulfillment
Category, which can be lessened using automation, and cross docking. These are two things
which we plan to utilize to the utmost potential in order to make the new ACME Distribution
center more cost effective, efficient, and productive. As of right now, ACME is giving
employees a half hour break for every 8 hour day that is worked, something that we plan to keep
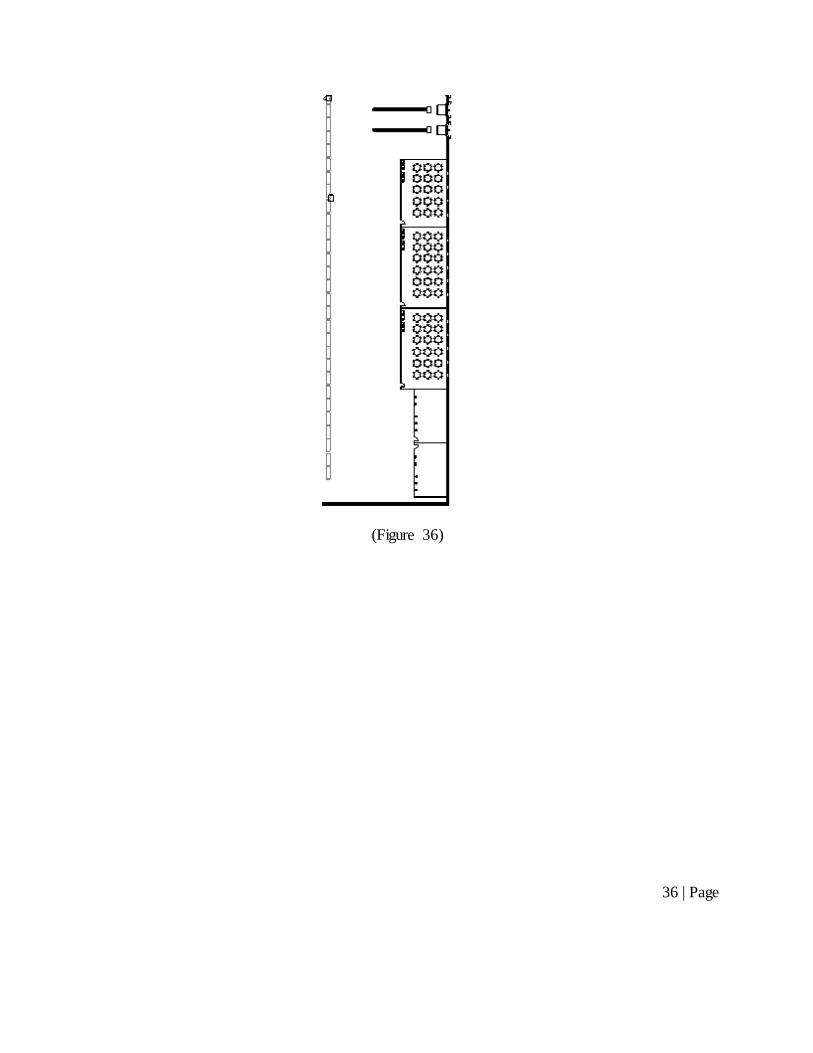
doing in order to boost employee morale. During peak times, such as the months of December,
April, May, and June, employees work 12 hour days and are given 45 minute breaks for each 12
hour shift they work. We will continue to keep these breaks as well, giving employees time to
eat, relax, and unwind in our break rooms seen in Figure 36 of the appendix.
18 | Page
(Figure 12)
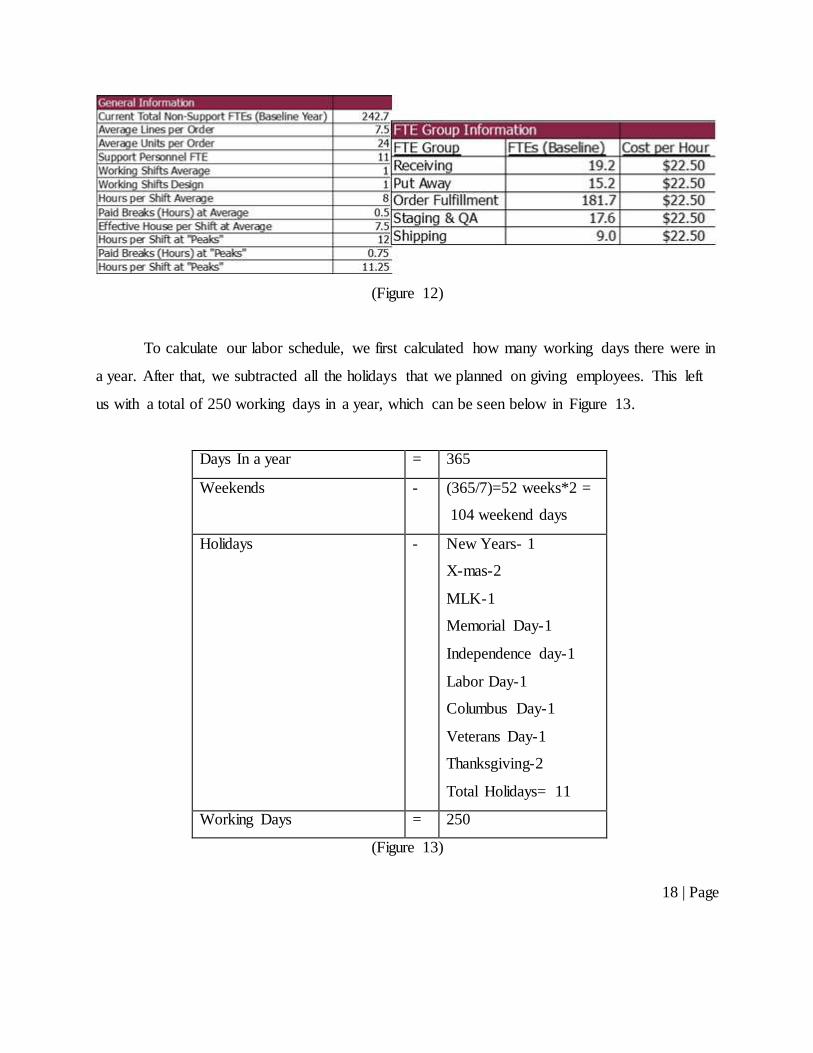
To calculate our labor schedule, we first calculated how many working days there were in
a year. After that, we subtracted all the holidays that we planned on giving employees. This left
us with a total of 250 working days in a year, which can be seen below in Figure 13.
Days In a year = 365
Weekends - (365/7)=52 weeks*2 =
104 weekend days
Holidays - New Years- 1
X-mas-2
MLK-1
Memorial Day-1
Independence day-1
Labor Day-1
Columbus Day-1
Veterans Day-1
Thanksgiving-2
Total Holidays= 11
Working Days = 250
(Figure 13)
19 | Page
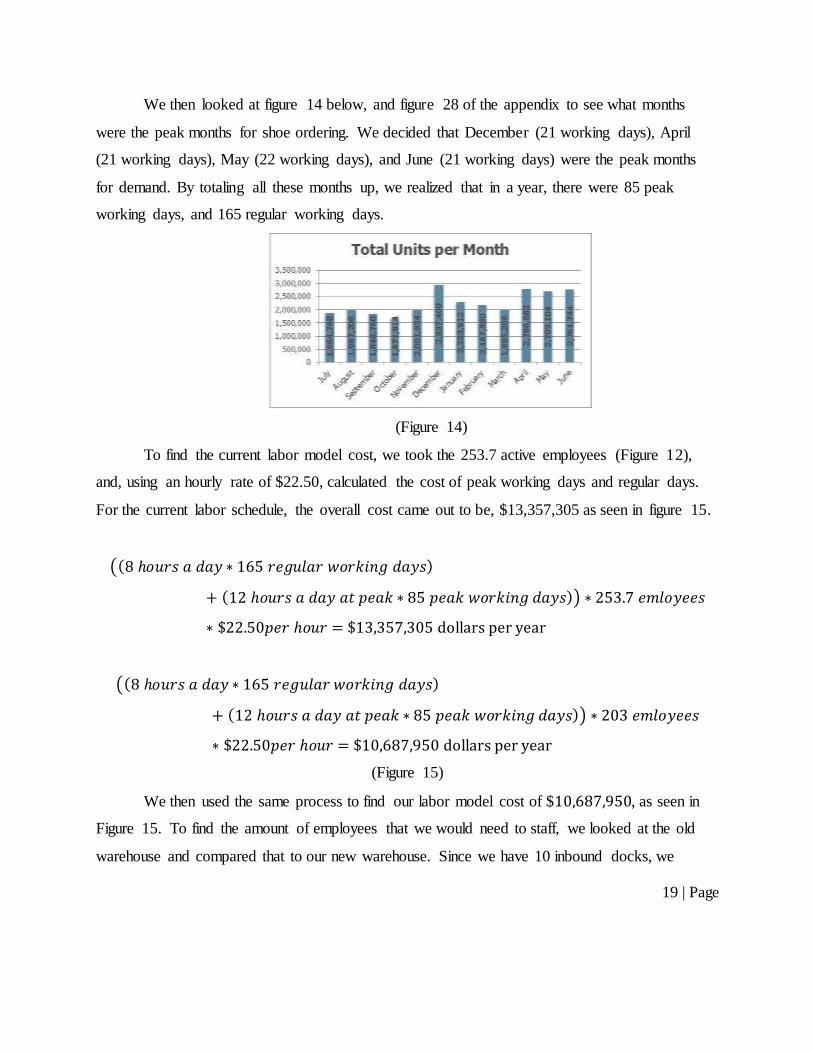
We then looked at figure 14 below, and figure 28 of the appendix to see what months
were the peak months for shoe ordering. We decided that December (21 working days), April
(21 working days), May (22 working days), and June (21 working days) were the peak months
for demand. By totaling all these months up, we realized that in a year, there were 85 peak
working days, and 165 regular working days.
(Figure 14)
To find the current labor model cost, we took the 253.7 active employees (Figure 12),
and, using an hourly rate of $22.50, calculated the cost of peak working days and regular days.
For the current labor schedule, the overall cost came out to be, $13,357,305 as seen in figure 15.
((8 ℎ𝑜𝑢𝑟𝑠 𝑎 𝑑𝑎𝑦 ∗ 165 𝑟𝑒𝑔𝑢𝑙𝑎𝑟 𝑤𝑜𝑟𝑘𝑖𝑛𝑔 𝑑𝑎𝑦𝑠)
+ (12 ℎ𝑜𝑢𝑟𝑠 𝑎 𝑑𝑎𝑦 𝑎𝑡 𝑝𝑒𝑎𝑘 ∗ 85 𝑝𝑒𝑎𝑘 𝑤𝑜𝑟𝑘𝑖𝑛𝑔 𝑑𝑎𝑦𝑠)) ∗ 253.7 𝑒𝑚𝑙𝑜𝑦𝑒𝑒𝑠
∗ $22.50𝑝𝑒𝑟 ℎ𝑜𝑢𝑟 = $13,357,305 dollars per year
((8 ℎ𝑜𝑢𝑟𝑠 𝑎 𝑑𝑎𝑦 ∗ 165 𝑟𝑒𝑔𝑢𝑙𝑎𝑟 𝑤𝑜𝑟𝑘𝑖𝑛𝑔 𝑑𝑎𝑦𝑠)
+ (12 ℎ𝑜𝑢𝑟𝑠 𝑎 𝑑𝑎𝑦 𝑎𝑡 𝑝𝑒𝑎𝑘 ∗ 85 𝑝𝑒𝑎𝑘 𝑤𝑜𝑟𝑘𝑖𝑛𝑔 𝑑𝑎𝑦𝑠)) ∗ 203 𝑒𝑚𝑙𝑜𝑦𝑒𝑒𝑠
∗ $22.50𝑝𝑒𝑟 ℎ𝑜𝑢𝑟 = $10,687,950 dollars per year
(Figure 15)
We then used the same process to find our labor model cost of $10,687,950, as seen in
Figure 15. To find the amount of employees that we would need to staff, we looked at the old
warehouse and compared that to our new warehouse. Since we have 10 inbound docks, we
20 | Page
estimate that, on a normal day, it will take 5 employees in receiving (Figure 30 of the appendix ),
to keep up with the 131736 ( Figure 25 of the appendix ) inbound packages. To calculate the
amount of Shipping and Quality Assurance employees we would need, we decided that we
would use 10 employees on a normal day. By using 10 employees, we can have two sets of eyes
on every package, ensuring that we ware shipping the right packages to the right people. We will
have 5 people working in Quality Assurance while we have 5 other people working in the
Shipping department. These two departments will work hand in hand, with Quality assurance
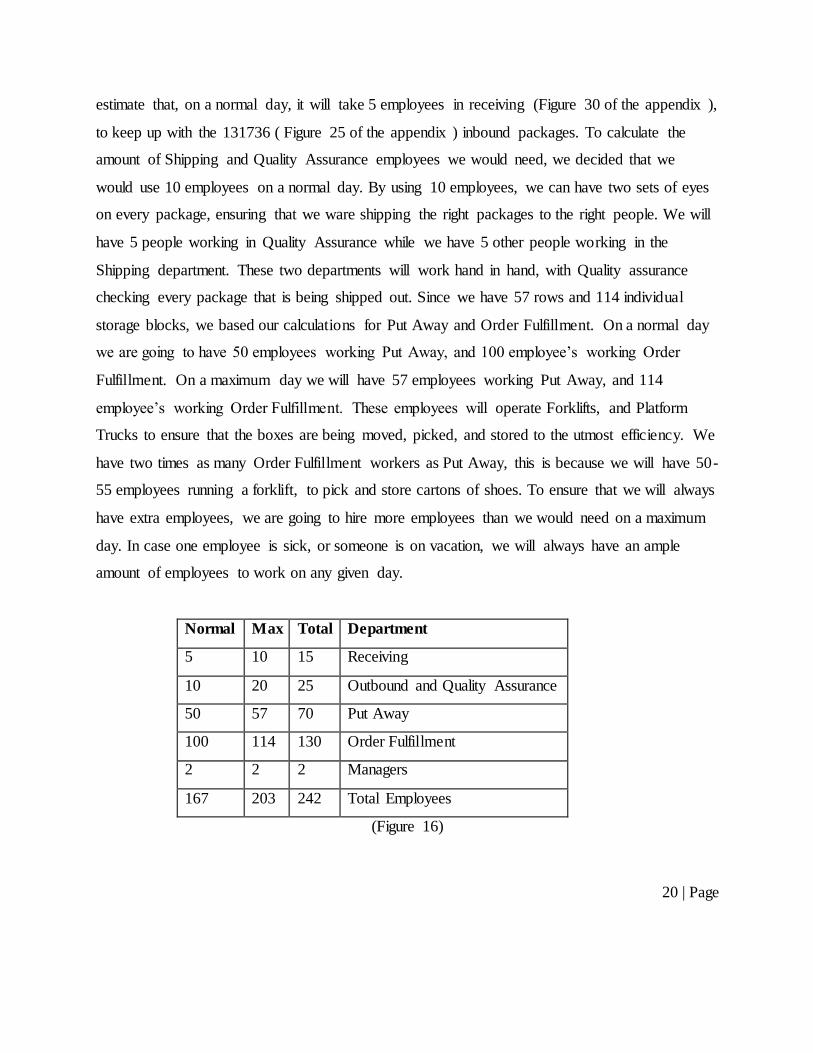
checking every package that is being shipped out. Since we have 57 rows and 114 individual
storage blocks, we based our calculations for Put Away and Order Fulfillment. On a normal day
we are going to have 50 employees working Put Away, and 100 employee’s working Order
Fulfillment. On a maximum day we will have 57 employees working Put Away, and 114
employee’s working Order Fulfillment. These employees will operate Forklifts, and Platform
Trucks to ensure that the boxes are being moved, picked, and stored to the utmost efficiency. We
have two times as many Order Fulfillment workers as Put Away, this is because we will have 50-
55 employees running a forklift, to pick and store cartons of shoes. To ensure that we will always
have extra employees, we are going to hire more employees than we would need on a maximum
day. In case one employee is sick, or someone is on vacation, we will always have an ample
amount of employees to work on any given day.
Normal Max Total Department
5 10 15 Receiving
10 20 25 Outbound and Quality Assurance
50 57 70 Put Away
100 114 130 Order Fulfillment
2 2 2 Managers
167 203 242 Total Employees
(Figure 16)
21 | Page
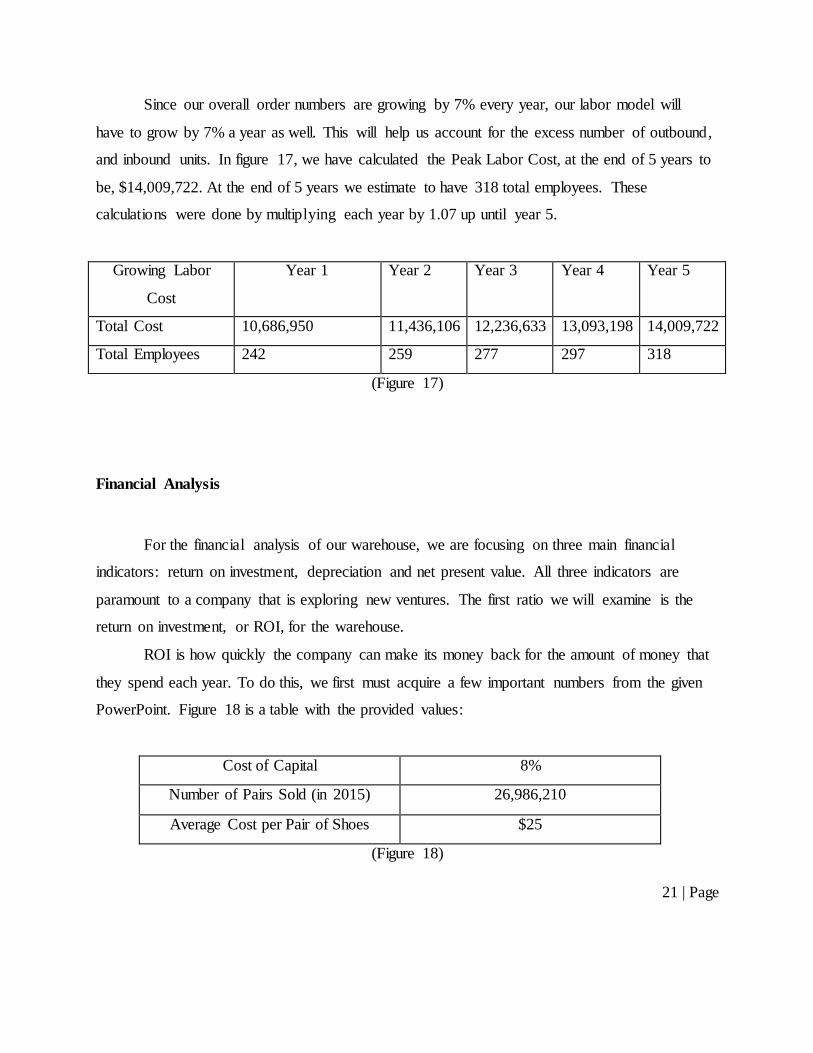
Since our overall order numbers are growing by 7% every year, our labor model will
have to grow by 7% a year as well. This will help us account for the excess number of outbound,
and inbound units. In figure 17, we have calculated the Peak Labor Cost, at the end of 5 years to
be, $14,009,722. At the end of 5 years we estimate to have 318 total employees. These
calculations were done by multiplying each year by 1.07 up until year 5.
Growing Labor
Cost
Year 1 Year 2 Year 3 Year 4 Year 5
Total Cost 10,686,950 11,436,106 12,236,633 13,093,198 14,009,722
Total Employees 242 259 277 297 318
(Figure 17)
Financial Analysis
For the financial analysis of our warehouse, we are focusing on three main financial
indicators: return on investment, depreciation and net present value. All three indicators are
paramount to a company that is exploring new ventures. The first ratio we will examine is the
return on investment, or ROI, for the warehouse.
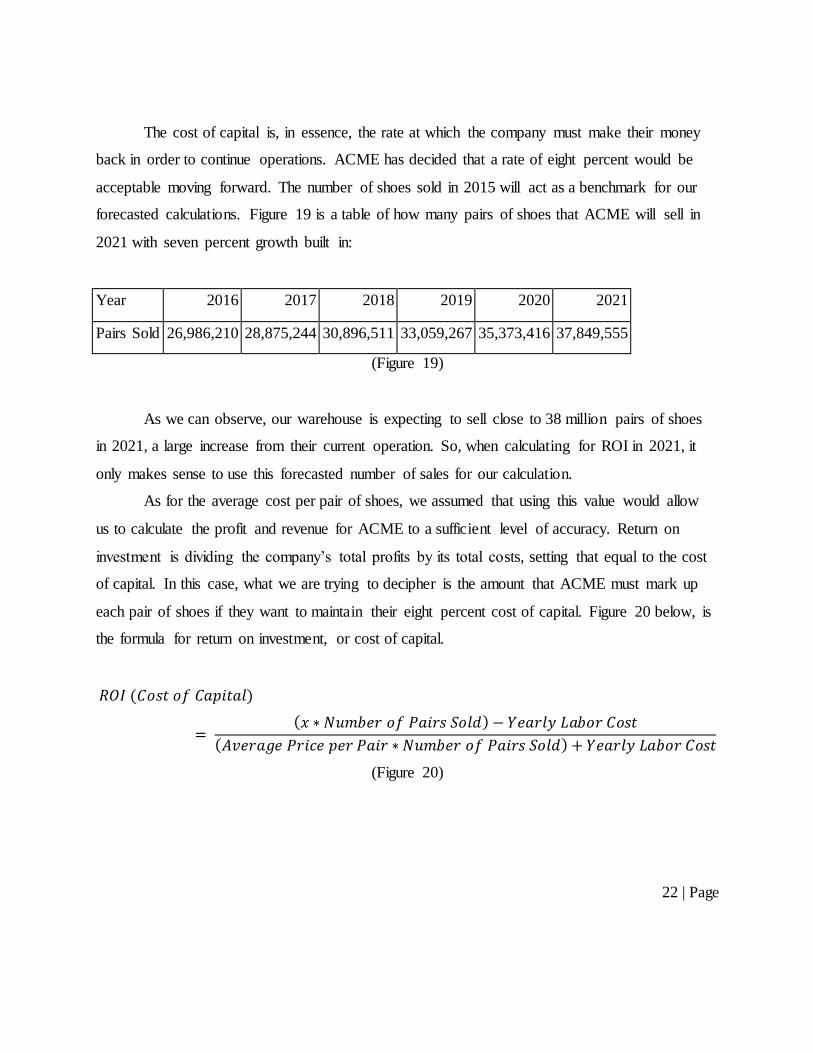
ROI is how quickly the company can make its money back for the amount of money that
they spend each year. To do this, we first must acquire a few important numbers from the given
PowerPoint. Figure 18 is a table with the provided values:
Cost of Capital 8%
Number of Pairs Sold (in 2015) 26,986,210
Average Cost per Pair of Shoes $25
(Figure 18)
22 | Page
The cost of capital is, in essence, the rate at which the company must make their money
back in order to continue operations. ACME has decided that a rate of eight percent would be
acceptable moving forward. The number of shoes sold in 2015 will act as a benchmark for our
forecasted calculations. Figure 19 is a table of how many pairs of shoes that ACME will sell in
2021 with seven percent growth built in:
Year 2016 2017 2018 2019 2020 2021
Pairs Sold 26,986,210 28,875,244 30,896,511 33,059,267 35,373,416 37,849,555
(Figure 19)
As we can observe, our warehouse is expecting to sell close to 38 million pairs of shoes
in 2021, a large increase from their current operation. So, when calculating for ROI in 2021, it
only makes sense to use this forecasted number of sales for our calculation.
As for the average cost per pair of shoes, we assumed that using this value would allow
us to calculate the profit and revenue for ACME to a sufficient level of accuracy. Return on
investment is dividing the company’s total profits by its total costs, setting that equal to the cost
of capital. In this case, what we are trying to decipher is the amount that ACME must mark up
each pair of shoes if they want to maintain their eight percent cost of capital. Figure 20 below, is
the formula for return on investment, or cost of capital.
𝑅𝑂𝐼 (𝐶𝑜𝑠𝑡 𝑜𝑓 𝐶𝑎𝑝𝑖𝑡𝑎𝑙)
= (𝑥 ∗ 𝑁𝑢𝑚𝑏𝑒𝑟 𝑜𝑓 𝑃𝑎𝑖𝑟𝑠 𝑆𝑜𝑙𝑑) − 𝑌𝑒𝑎𝑟𝑙𝑦 𝐿𝑎𝑏𝑜𝑟 𝐶𝑜𝑠𝑡
(𝐴𝑣𝑒𝑟𝑎𝑔𝑒 𝑃𝑟𝑖𝑐𝑒 𝑝𝑒𝑟 𝑃𝑎𝑖𝑟 ∗ 𝑁𝑢𝑚𝑏𝑒𝑟 𝑜𝑓 𝑃𝑎𝑖𝑟𝑠 𝑆𝑜𝑙𝑑) + 𝑌𝑒𝑎𝑟𝑙𝑦 𝐿𝑎𝑏𝑜𝑟 𝐶𝑜𝑠𝑡
(Figure 20)
23 | Page
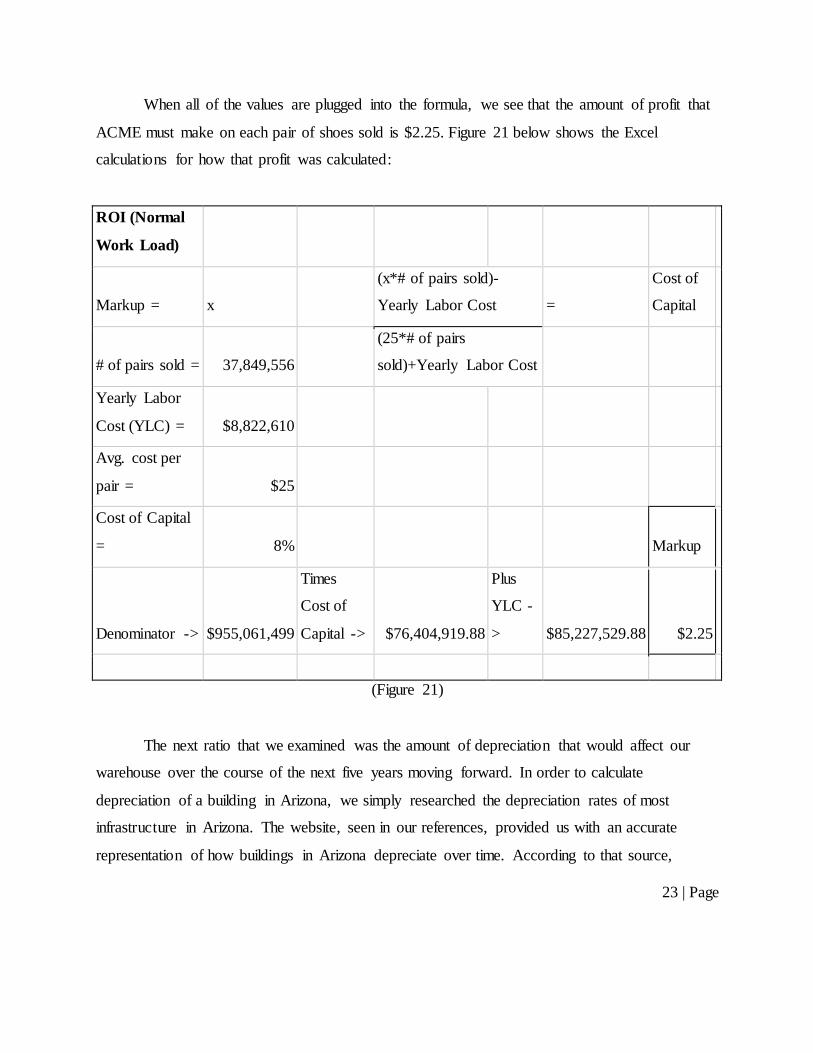
When all of the values are plugged into the formula, we see that the amount of profit that
ACME must make on each pair of shoes sold is $2.25. Figure 21 below shows the Excel
calculations for how that profit was calculated:
ROI (Normal
Work Load)
Markup = x
(x*# of pairs sold)-
Yearly Labor Cost =
Cost of
Capital
# of pairs sold = 37,849,556
(25*# of pairs
sold)+Yearly Labor Cost
Yearly Labor
Cost (YLC) = $8,822,610
Avg. cost per
pair = $25
Cost of Capital
= 8%
Markup
Denominator -> $955,061,499
Times
Cost of
Capital -> $76,404,919.88
Plus
YLC -
> $85,227,529.88 $2.25
(Figure 21)
The next ratio that we examined was the amount of depreciation that would affect our
warehouse over the course of the next five years moving forward. In order to calculate
depreciation of a building in Arizona, we simply researched the depreciation rates of most
infrastructure in Arizona. The website, seen in our references, provided us with an accurate
representation of how buildings in Arizona depreciate over time. According to that source,
24 | Page
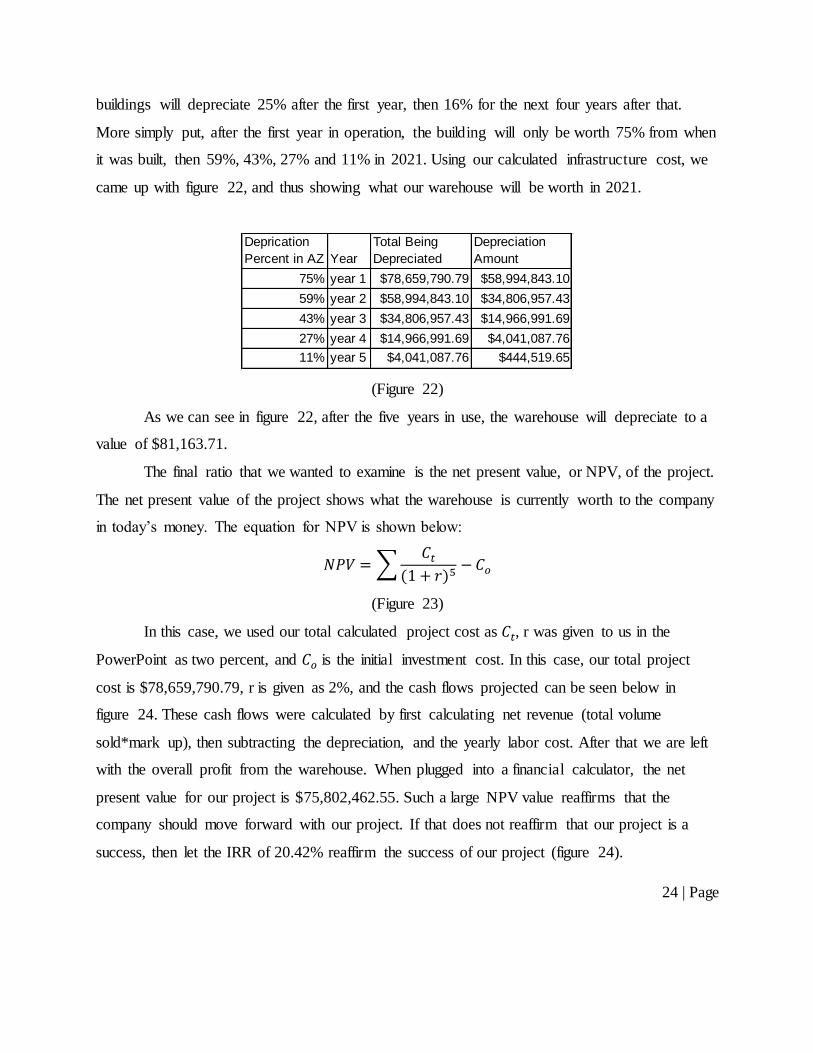
buildings will depreciate 25% after the first year, then 16% for the next four years after that.
More simply put, after the first year in operation, the building will only be worth 75% from when
it was built, then 59%, 43%, 27% and 11% in 2021. Using our calculated infrastructure cost, we
came up with figure 22, and thus showing what our warehouse will be worth in 2021.
(Figure 22)
As we can see in figure 22, after the five years in use, the warehouse will depreciate to a
value of $81,163.71.
The final ratio that we wanted to examine is the net present value, or NPV, of the project.
The net present value of the project shows what the warehouse is currently worth to the company
in today’s money. The equation for NPV is shown below:
𝑁𝑃𝑉 = ∑𝐶𝑡
(1 + 𝑟)5− 𝐶𝑜
(Figure 23)
In this case, we used our total calculated project cost as 𝐶𝑡, r was given to us in the
PowerPoint as two percent, and 𝐶𝑜 is the initial investment cost. In this case, our total project
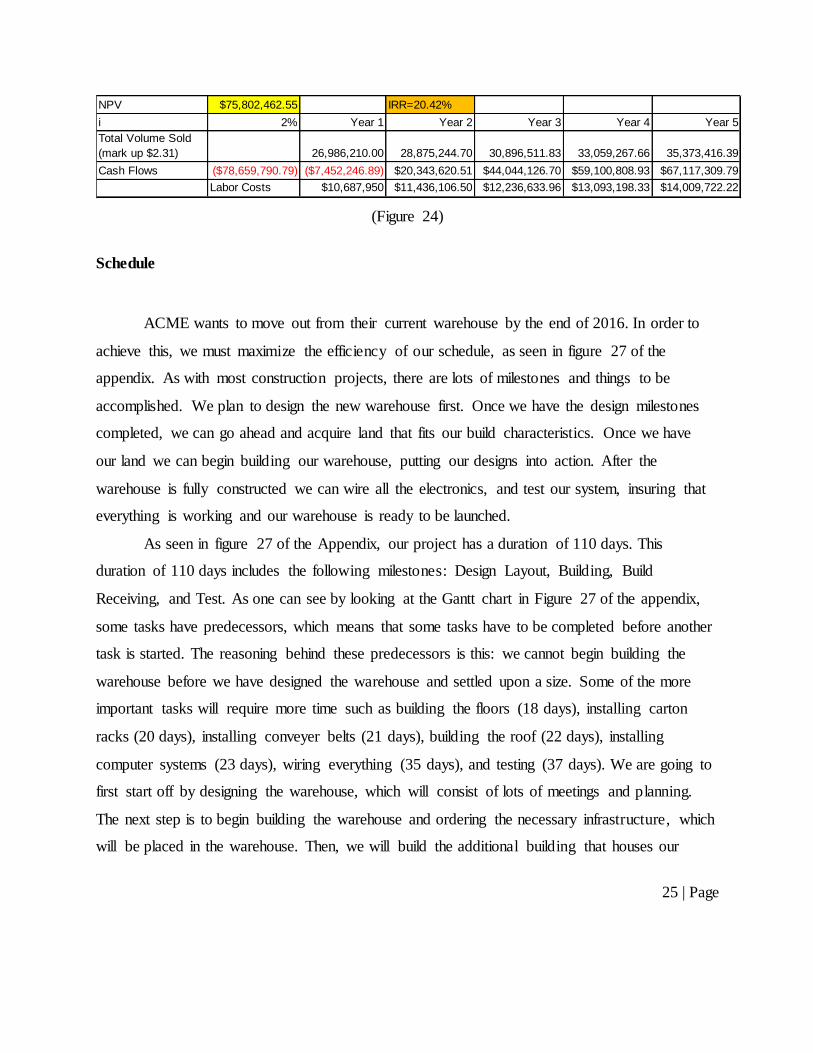
cost is $78,659,790.79, r is given as 2%, and the cash flows projected can be seen below in
figure 24. These cash flows were calculated by first calculating net revenue (total volume
sold*mark up), then subtracting the depreciation, and the yearly labor cost. After that we are left
with the overall profit from the warehouse. When plugged into a financial calculator, the net
present value for our project is $75,802,462.55. Such a large NPV value reaffirms that the
company should move forward with our project. If that does not reaffirm that our project is a
success, then let the IRR of 20.42% reaffirm the success of our project (figure 24).
Deprication
Percent in AZ Year
Total Being
Depreciated
Depreciation
Amount
75% year 1 $78,659,790.79 $58,994,843.10
59% year 2 $58,994,843.10 $34,806,957.43
43% year 3 $34,806,957.43 $14,966,991.69
27% year 4 $14,966,991.69 $4,041,087.76
11% year 5 $4,041,087.76 $444,519.65
25 | Page
(Figure 24)
Schedule
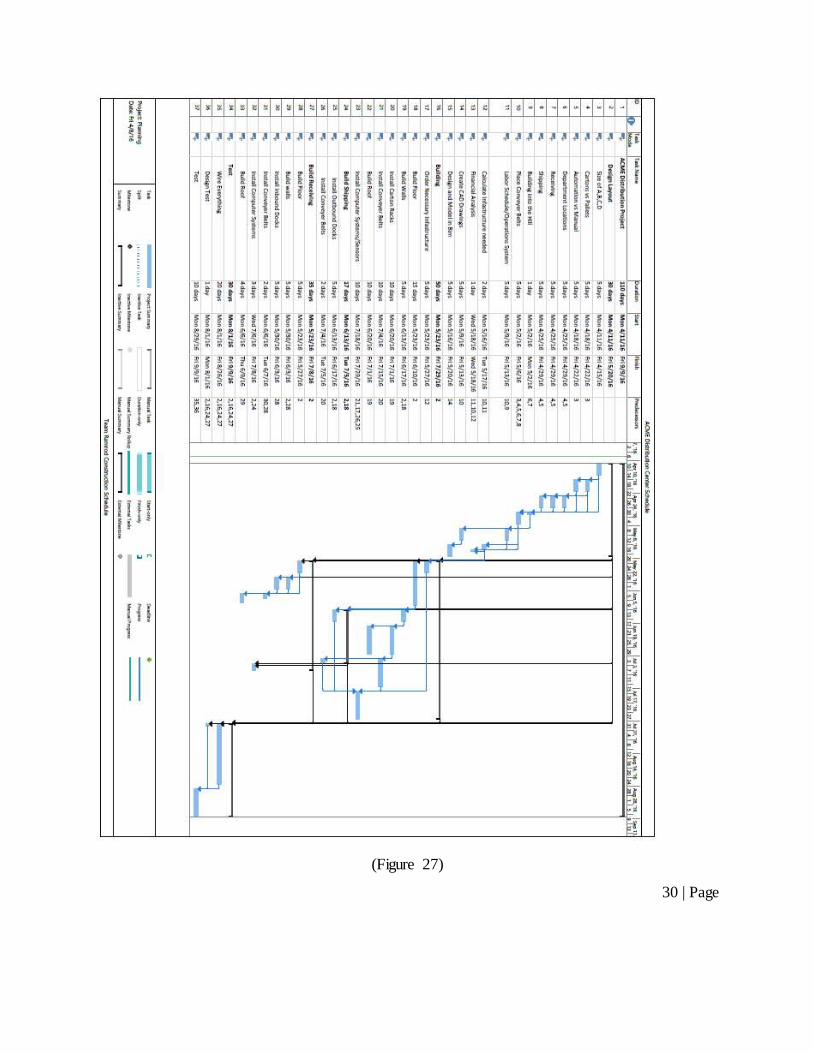
ACME wants to move out from their current warehouse by the end of 2016. In order to
achieve this, we must maximize the efficiency of our schedule, as seen in figure 27 of the
appendix. As with most construction projects, there are lots of milestones and things to be
accomplished. We plan to design the new warehouse first. Once we have the design milestones
completed, we can go ahead and acquire land that fits our build characteristics. Once we have
our land we can begin building our warehouse, putting our designs into action. After the
warehouse is fully constructed we can wire all the electronics, and test our system, insuring that
everything is working and our warehouse is ready to be launched.
As seen in figure 27 of the Appendix, our project has a duration of 110 days. This
duration of 110 days includes the following milestones: Design Layout, Building, Build
Receiving, and Test. As one can see by looking at the Gantt chart in Figure 27 of the appendix,
some tasks have predecessors, which means that some tasks have to be completed before another
task is started. The reasoning behind these predecessors is this: we cannot begin building the
warehouse before we have designed the warehouse and settled upon a size. Some of the more
important tasks will require more time such as building the floors (18 days), installing carton
racks (20 days), installing conveyer belts (21 days), building the roof (22 days), installing
computer systems (23 days), wiring everything (35 days), and testing (37 days). We are going to
first start off by designing the warehouse, which will consist of lots of meetings and planning.
The next step is to begin building the warehouse and ordering the necessary infrastructure, which
will be placed in the warehouse. Then, we will build the additional building that houses our
NPV $75,802,462.55 IRR=20.42%
i 2% Year 1 Year 2 Year 3 Year 4 Year 5
Total Volume Sold
(mark up $2.31) 26,986,210.00 28,875,244.70 30,896,511.83 33,059,267.66 35,373,416.39
Cash Flows ($78,659,790.79) ($7,452,246.89) $20,343,620.51 $44,044,126.70 $59,100,808.93 $67,117,309.79
Labor Costs $10,687,950 $11,436,106.50 $12,236,633.96 $13,093,198.33 $14,009,722.22

26 | Page
Receiving, while at the same time finishing up the building of shipping. After all of the building
is complete, infrastructure installed, and the electronics placed, we will wire everything, and then
begin testing. For our testing phase, we will run a rigorous mock test, which will simulate a peak
demand day for two weeks straight. This will ensure that our warehouse is capable of running at
a peak demand day, and to ensure that all conveyer belts and sorting systems are running
smoothly. This testing period will also allow our employees to familiarize themselves with their
jobs and to report any errors to the managers so that everything can be fixed before we begin
using the actual warehouse. With our duration of 110 days, we will be done well before the end
of 2016. As a matter of fact we will be done on the 9th of September, 2016, which will give us
three months of cushion time to assure that all the problems are fixed. Although this schedule is
very accurate, there are always unexpected errors that are encountered upon all construction
processes. This is the reason why we plan to finish so early, so that if unknown errors do happen,
we can have a large time cushion to fix them, and ensure that the warehouse is ready to perform
at a Peak level.
27 | Page
References
CICMHE Material Handling Student Design Competition (August 23, 2015).
Yu, D. (2016, February). ACME Warehouse Design Ideas. (T. Ramrod, Interviewer)
How many pallets fit into 18 wheeler?- http://andrewg-
crabtreeanalytics.blogspot.com/2012/10/truckload-transportation-are-you-paying.html
Arizona Depreciation- http://www.azcommerce.com/incentives/additional-depreciation
Platform truck Costhttp://www.uline.com/Product/Detail/H-1824/Platform-Trucks/Welded-
Platform-Truck-36-x-72
Construction Costs-http://www.brownwegher.com/cost-of-construction-chart/
Asics- https://www.youtube.com/watch?v=Wvg5ogSSCig
Sketchers- https://www.youtube.com/watch?v=FrsJqtsRTvs
Converse- https://www.youtube.com/watch?v=q1-mzwOjkaU
Automatic Forklifts- https://www.youtube.com/watch?v=lDyi9Yipt7c
Automatic Pickers- https://www.youtube.com/watch?v=lJdqXAltxgc
28 | Page
AVG Year 1 Year 2 Year 3 Year 4 Year 5
Outbound 108378 113797 119487 125462 131736
Case 9032 9484 9958 10456 10978
Pallet 565 593 623 654 687
Truck Loads 18.83333 19.76667 20.76667 21.8 22.9
Rotation loads 2 2 3 3 3
1st Deviation Year 1 Year 2 Year 3 Year 4 Year 5
Outbound 163233 171395 179965 188964 198413
Case 13603 14283 14998 15747 16535
Pallet 851 893 938 985 1034
Truck Loads 28.36667 29.76667 31.26667 32.83333 34.46667
Rotation loads 4 4 4 4 4
2nd Deviation Year 1 Year 2 Year 3 Year 4 Year 5
Outbound 218087 228992 240442 252465 265089
Case 18174 19083 20037 21039 22091
Pallet 1136 1193 1253 1315 1381
Truck Loads 37.86667 39.76667 41.76667 43.83333 46.03333
Rotation loads 5 5 5 5 6
3rd Deviation Year 1 Year 2 Year 3 Year 4 Year 5
Outbound 272941 286589 300919 315965 331764
Case 22746 23883 25077 26331 27647
Pallet 1422 1493 1568 1646 1728
Truck Loads 47.4 49.76667 52.26667 54.86667 57.6
Rotation loads 6 6 7 7 7
MAX Year 1 Year 2 Year 3 Year 4 Year 5
Outbound 372068 390672 410206 430717 452253
Case 31006 32556 34184 35894 37688
Pallet 1938 2035 2137 2244 2356
Truck Loads 64.6 67.83333 71.23333 74.8 78.53333
Rotation loads 8 8 9 9 10
Appendices
(Figure 25)
29 | Page
(Figure 26)
30 | Page
(Figure 27)
31 | Page
(Figure 28)
(Figure 29)
32 | Page
(Figure 30)
(Figure 31)
33 | Page
(Figure 32)
(Figure 33)
34 | Page
(Figure 34)
35 | Page
(Figure 35)
36 | Page
(Figure 36)