fina ncial stability r eport - bank of england
TRANSCRIPT

Financial Stability ReportJune 2017 | Issue No. 41


Financial Stability Report
Presented to Parliament pursuant to Section 9W(10) of the Bank of England Act 1998 as amended by the Financial Services Act 2012.
June 2017
BANK OF ENGLAND

© Bank of England 2017ISSN 1751-7044

BANK OF ENGLAND
Financial Stability ReportJune 2017 | Issue No. 41
The primary responsibility of the Financial Policy Committee (FPC), a committee of the Bank of England, isto contribute to the Bank of England’s objective for maintaining financial stability. It does this primarily byidentifying, monitoring and taking action to remove or reduce systemic risks, with a view to protecting andenhancing the resilience of the UK financial system. Subject to that, it supports the economic policy of Her Majesty’s Government, including its objectives for growth and employment.
This Financial Stability Report sets out the FPC’s view of the outlook for UK financial stability, including itsassessment of the resilience of the UK financial system and the current main risks to financial stability, andthe action it is taking to remove or reduce those risks. It also reports on the activities of the Committeeover the reporting period and on the extent to which the Committee’s previous policy actions havesucceeded in meeting the Committee’s objectives. The Report meets the requirement set out in legislationfor the Committee to prepare and publish a Financial Stability Report twice per calendar year.
In addition, the Committee has a number of duties, under the Bank of England Act 1998. In exercisingcertain powers under this Act, the Committee is required to set out an explanation of its reasons fordeciding to use its powers in the way they are being exercised and why it considers that to be compatiblewith its duties.
The Financial Policy Committee:Mark Carney, GovernorJon Cunliffe, Deputy Governor responsible for financial stabilityBen Broadbent, Deputy Governor responsible for monetary policySam Woods, Deputy Governor responsible for prudential regulationAndrew Bailey, Chief Executive of the Financial Conduct AuthorityAlex Brazier, Executive Director for Financial Stability Strategy and RiskAnil KashyapDonald KohnRichard SharpMartin TaylorCharles Roxburgh attends as the Treasury member in a non-voting capacity.
This document was delivered to the printers on 26 June 2017 and, unless otherwise stated, uses data availableas at 16 June 2017. This page was revised on 11 April 2018.
The Financial Stability Report is available in PDF at www.bankofengland.co.uk.

Foreword
Executive summary i
Box 1 The FPC’s 2017 Q2 UK countercyclical capital buffer rate decision viBox 2 Possible financial stability implications of the United Kingdom’s withdrawal from the European Union vii
Part A: Main risks to financial stability
The FPC’s approach to addressing risks from the UK mortgage market 1Box 3 PRA Supervisory Statement on underwriting standards for buy-to-let mortgages 11Box 4 Powers of Direction over LTV limits 12Box 5 The affordability test Recommendation 13
UK consumer credit 14Box 6 Overview of the UK consumer credit market 18
Global environment 20
Asset valuations 23
Part B: Resilience of the UK financial system
Banking sector resilience 27Box 7 Building cyber resilience in the UK financial system 32
Market-based finance 34Box 8 The UK High-Value Payment System 39
The FPC’s medium-term priorities 41
Annex 1: Previous macroprudential policy decisions 42
Annex 2: Core indicators 45
Index of charts and tables 49
Glossary and other information 51
Contents


Executive summary i
Executive summary
The Financial Policy Committee (FPC) aims to ensure the UK financial system is resilient to the wide range of risks itfaces.
The FPC assesses the overall risks from the domestic environment to be at a standard level: most financial stabilityindicators are neither particularly elevated nor subdued.
As is often the case in a standard environment, there are pockets of risk that warrant vigilance. Consumer credit hasincreased rapidly. Lending conditions in the mortgage market are becoming easier. Lenders may be placing undueweight on the recent performance of loans in benign conditions.
Exit negotiations between the United Kingdom and the European Union have begun. There are a range of possibleoutcomes for, and paths to, the United Kingdom’s withdrawal from the EU.
Some possible global risks have not crystallised, though financial vulnerabilities in China remain pronounced.Measures of market volatility and the valuation of some assets — such as corporate bonds and UK commercial realestate — do not appear to reflect fully the downside risks that are implied by very low long-term interest rates.
To ensure that the financial system has the resilience it needs, the FPC is:
• Increasing the UK countercyclical capital buffer rate to 0.5%, from 0%. Absent a material change in theoutlook, and consistent with its stated policy for a standard risk environment and of moving gradually, the FPCexpects to increase the rate to 1% at its November meeting.
• Bringing forward the assessment of stressed losses on consumer credit lending in the Bank’s 2017 annual stresstest. This will inform the FPC’s assessment at its next meeting of any additional resilience required in aggregateagainst this lending. The FPC further supports the intentions of the Prudential Regulation Authority and FinancialConduct Authority to publish, in July, their expectations of lenders in the consumer credit market.
• Clarifying its existing insurance measures in the mortgage market, designed to prevent excessive growth in thenumber of highly indebted households. This will promote consistency across lenders in their application of tests toassess whether new mortgage borrowers can afford repayments.
• Consistent with its previous commitment, restoring the level of resilience delivered by its leverage ratiostandard to the level it delivered in July 2016 before the FPC excluded central bank reserves from the leverage ratioexposure measure. The FPC intends to set the minimum leverage requirement at 3.25% of non-reserve exposures,subject to consultation.
• Overseeing contingency planning to mitigate risks to financial stability as the United Kingdom withdraws fromthe European Union.
• Building on the programme of cyber resilience testing it instigated in 2013, by setting out the essential elementsof the regulatory framework for maintaining cyber resilience. It will now monitor that each element is beingfulfilled by the relevant UK authorities.

ii Financial Stability Report June 2017
The Financial Policy Committee (FPC) assesses the overallrisks from the domestic environment to be at a standardlevel: most financial stability indicators are neitherparticularly elevated nor subdued.
As is often the case in a standard environment, there arepockets of risk that warrant vigilance. Consumer credit hasincreased rapidly. Lending conditions in the mortgagemarket are becoming easier. Lenders may be placing undueweight on the recent performance of loans in benignconditions.
The FPC is increasing the UK countercyclical capital buffer(CCyB) rate to 0.5%, from 0% (see Box 1). Absent amaterial change in the outlook, and consistent with itsstated policy for a standard risk environment and of movinggradually, the FPC expects to increase the rate to 1% at itsNovember meeting.
• The action will supplement banks’ already substantialability to absorb losses (Chart A).
• At its November meeting, the FPC will have the full set ofresults from the 2017 stress test of major UK banks.
• In line with its published policy, the FPC stands ready to cutthe UK CCyB rate, as it did in July 2016, if a risk materialisesthat could lead to a material tightening of lendingconditions. Banks’ capital buffers exist to be used asnecessary to allow banks to support the real economy in adownturn.
The FPC supports the intentions of the PrudentialRegulation Authority (PRA) and Financial ConductAuthority (FCA) to publish, in July, their expectations oflenders in the consumer credit market. Firms remain thefirst line of defence. Effective governance at firms shouldensure that risks are priced and managed appropriately andbenign conditions do not lead to complacency by lenders.
The Bank’s annual stress test assesses banks’ resilience torisks in consumer credit. Given the rapid growth inconsumer credit over the past twelve months, the FPC isbringing forward the assessment of stressed losses onconsumer credit lending in the Bank’s 2017 annual stresstest. This will inform the FPC’s assessment at its nextmeeting of any additional resilience required in aggregateagainst this lending.
• Consumer credit grew by 10.3% in the twelve months toApril 2017 (Chart B) — markedly faster than nominalhousehold income growth. Credit card debt, personal loansand motor finance all grew rapidly.
5
0
5
10
15
20
25
2013 14 15 16 17
Percentage points
Total consumer credit(b)
Credit card(b)
Dealership car finance(a)
Other (non-credit card and non-dealership car finance)(b)(d)Nominal household income growth(c)
+
–
Chart B Consumer credit has been growing much fasterthan household incomesAnnual growth rates of consumer credit products and householdincome
Sources: Bank of England, ONS and Bank calculations.
(a) Identified dealership car finance lending by UK monetary financial institutions (MFIs) andother lenders.
(b) Sterling net lending by UK MFIs and other lenders to UK individuals (excluding studentloans). Non seasonally adjusted.
(c) Percentage change on a year earlier of quarterly nominal disposable household income.Seasonally adjusted.
(d) Other is estimated as total consumer credit lending minus dealership car finance and creditcard lending.
2
4
6
8
10
12
14
16
18
20
0
2
4
6
8
10
12
14
16
2001 02 03 04 05 06 07 08 09 10 11 12 13 14 15 16 17
Per centPer cent
Basel III common equity Tier 1 (CET1) weighted average(c)(d) (right-hand scale)
Basel II core Tier 1 weighted average(a)(b)(c) (left-hand scale)
CET1 ratio adjusted for 2016 stress-test losses(e) (right-hand scale)Basel III definition of capital
Chart A Major UK banks have continued to strengthentheir capital positionsMajor UK banks’ capital ratios
Sources: PRA regulatory returns, published accounts and Bank calculations.
(a) Major UK banks’ core Tier 1 capital as a percentage of their risk-weighted assets. Major UKbanks are Banco Santander, Bank of Ireland, Barclays, Co-operative Banking Group, HSBC,Lloyds Banking Group, National Australia Bank, Nationwide, RBS and Virgin Money. Dataexclude Northern Rock/Virgin Money from 2008.
(b) Between 2008 and 2011, the chart shows core Tier 1 ratios as published by banks, excludinghybrid capital instruments and making deductions from capital based on FSA definitions.Prior to 2008 that measure was not typically disclosed; the chart shows Bank calculationsapproximating it as previously published in the Report.
(c) Weighted by risk-weighted assets. (d) From 2012, the ‘Basel III common equity Tier 1 capital ratio’ is calculated as common equity
Tier 1 capital over risk-weighted assets, according to the CRD IV definition as implemented inthe United Kingdom. The Basel III peer group includes Barclays, Co-operative Banking Group,HSBC, Lloyds Banking Group, Nationwide, RBS and Santander UK.
(e) CET1 ratio less the aggregate percentage point fall projected under the Bank of England’s2016 annual cyclical stress scenario for the six largest UK banks.

Executive summary iii
• Loss rates on consumer credit lending are low at present.Partly as a result, banks’ net interest margins on newlending have fallen and major lenders are using lower riskweights to calculate the capital they need to hold. Thecurrent environment is also likely to have improved thecredit scores of borrowers.
• Other things equal, these developments mean lenders haveless capacity to absorb losses, either with income or capitalbuffers. In this context, a review by the PRA has foundevidence of weaknesses in some aspects of underwritingand a reduction in resilience.
• The short maturity of consumer credit means that thecredit quality of the stock of lending can deterioratequickly. Lenders expect to continue to grow their portfoliosthis year, at the same time as real household incomegrowth is expected to remain particularly weak.
The FPC has clarified its existing insurance measures in themortgage market, designed to prevent excessive growth inthe number of highly indebted households. Lenders shouldtest affordability at their mortgage reversion rate —typically their standard variable rate — plus 3 percentagepoints. This will promote consistency across lenders in theirapplication of tests to assess whether new mortgageborrowers can afford repayments.
• Historically, the build-up of mortgage debt has been asignificant risk to financial and economic stability. Becausehighly indebted borrowers need to cut spending sharply in adownturn, recessions become deeper. And looserunderwriting standards expose banks to bigger losses.
• The FPC put policies in place to guard against these risks in 2014. These Recommendations were: a limit on lending at loan to income multiples at 4.5 or above; and guidanceto lenders to assess whether new borrowers would be able to afford their repayments if interest rates were to rise.
• Following a review (see The FPC’s approach to addressingrisks from the UK mortgage market chapter), the FPCexpects its measures to remain in place for the foreseeablefuture.
• Mortgage lending at high loan to income ratios is increasingand the spreads and fees on mortgage lending have fallen.If lenders were to weaken underwriting standards tomaintain mortgage growth, the FPC’s measures would limit growth in the number of highly indebted households.This would have material benefits for economic andfinancial stability by mitigating the further cutbacks inspending that highly indebted households make indownturns.
Consistent with its previous commitment, the FPC isrestoring the level of resilience delivered by its leverageratio standard to the level it delivered in July 2016, beforethe FPC excluded central bank reserves from the leverageratio exposure measure. The FPC therefore intends to setthe minimum leverage requirement at 3.25% of non-reserve exposures, subject to consultation.
• In July 2016, the FPC excluded central bank reserves fromthe measure of banks’ exposures used to assess theirleverage. This change reflected the special nature of centralbank reserves and was designed to avoid a situation inwhich the Committee’s leverage standards impeded thetransmission of monetary policy.
• The FPC committed last year that it would make anoffsetting adjustment to ensure that the amount of capitalneeded to meet the UK leverage ratio standard would notdecline. The FPC did not intend for there to be apermanent loosening of the standard.
• By raising the minimum leverage standard from 3% to3.25%, the FPC intends to ensure that the original standardof resilience is restored, while also preserving the benefitsof excluding central bank reserves from the exposuremeasure.
Exit negotiations between the United Kingdom and theEuropean Union have begun. There are a range of possibleoutcomes for, and paths to, the United Kingdom’swithdrawal from the EU. The FPC will oversee contingencyplanning to mitigate risks to financial stability as thewithdrawal process evolves (see Box 2).
Irrespective of the particular form of the United Kingdom’sfuture relationship with the European Union, and consistentwith its statutory responsibility, the FPC will remaincommitted to the implementation of robust prudentialstandards in the UK financial system. This will require alevel of resilience to be maintained that is at least as greatas that currently planned, which itself exceeds that requiredby international baseline standards.
• The United Kingdom’s position as the leadinginternationally active financial centre, with a financialcentre that is, by asset size, around ten times GDP, meansthat the FPC’s statutory responsibility of protecting andenhancing the resilience of the UK financial system isparticularly important for both the domestic and globaleconomies.
• Absent consistent implementation of standardsinternationally and appropriate supervisory co-operation,the FPC would need to assess how best to protect theresilience of the UK financial system.

iv Financial Stability Report June 2017
Some possible global risks have not crystallised, thoughfinancial vulnerabilities in China remain pronounced.Measures of market volatility and the valuation of someassets — such as corporate bonds and UK commercial realestate — do not appear to reflect fully the downside risksthat are implied by very low long-term interest rates.Banks’ ability to withstand these risks is being tested in the2017 stress test scenario.
• Euro-area sovereign bond spreads have fallen as somepolitical uncertainties have been resolved. Further progresshas been made in strengthening European bank capitalpositions, and a domestically significant bank in Spain wasresolved in an orderly fashion.
• In China, capital outflows have stabilised, but economicgrowth continues to be accompanied by rapid creditexpansion (Chart C).
• Measures of uncertainty implied by options prices are low(see Asset valuations chapter). Often in periods of lowvolatility, risks are building and later become apparent.
• In the United Kingdom, ten-year real government bondyields are at around -2% (Chart D). Long-term real ratesare low across the G7. These levels are consistent withpessimistic growth expectations and high perceived tailrisks.
• Some asset valuations, particularly for some corporatebonds and UK commercial real estate assets, appear tofactor in a low level of long-term market interest rates butdo not appear to be consistent with the pessimistic anduncertain outlook embodied in those rates (Chart E).
0
10
20
30
40
50
0
50
100
150
200
250
300
2006 08 10 12 14 16
Non-financial sector(a) (right-hand scale)
Adjusted total social financing(b) (left-hand scale)
Headline total social financing(c) (left-hand scale)
Percentage changes on a year earlier Per cent of GDP
Chart C Credit continues to grow rapidly in ChinaChina non-financial sector debt and growth of total socialfinancing
Sources: BIS total credit statistics, CEIC and Bank calculations.
(a) Non-financial sector debt data are to 2016 Q4. Includes lending by all sectors at marketvalue as a percentage of GDP, adjusted for breaks.
(b) Total social financing adjusted for net issuance of local government bonds.(c) The People’s Bank of China stock of total social financing used from December 2014
onwards. Prior to this the stock of total social financing is estimated using monthly ‘newlyincreased’ total social financing flows.
3
2
1
0
1
2
3
4
2006 07 08 09 10 11 12 13 14 15 16 17
United Kingdom
United States
Euro area
Per cent
+
–
Chart D Advanced-economy risk-free real interest ratesremain close to historically low levels International ten-year real government bond yields(a)
Sources: Bloomberg and Bank calculations.
(a) Zero-coupon bond yields derived using inflation swap rates. UK real rates are definedrelative to RPI inflation, whereas US and euro-area real rates are defined relative to CPI andHICP inflation respectively.
40
50
60
70
80
90
100
110
120
130
140
150
03 05 07 09 11 13 15 17
Indices: 2007 Q2 = 100
2001
London West End office pricesAggregate
CRE prices
Ranges of sustainable valuations(a)
Upper part of ranges: low rental yields persist. Lower part of ranges: rental yields rise, consistent with a fall in rental growth expectations or a rise in risk premia.
Chart E UK commercial real estate prices look stretchedbased on ranges of sustainable valuationsCommercial real estate prices in the United Kingdom and rangesof sustainable valuations
Sources: Bloomberg, Investment Property Forum, MSCI Inc. and Bank calculations.
(a) Sustainable valuations are estimated using an investment valuation approach and are basedon an assumption that property is held for five years. The sustainable value of a property isthe sum of discounted rental and sale proceeds. The rental proceeds are discounted using a5-year gilt yield plus a risk premium, and the sale proceeds are discounted using a 20-year,5-year forward gilt yield plus a risk premium. Expected rental value at the time of sale isbased on Investment Property Forum Consensus forecasts. The range of sustainablevaluations represents varying assumptions about the rental yield at the time of sale: eitherrental yields remain at their current levels (at the upper end), or rental yields revert to their15-year historical average (at the lower end). For more details, see Crosby, N and Hughes, C(2011), ‘The basis of valuations for secured commercial property lending in the UK’, Journal ofEuropean Real Estate Research, Vol. 4, No. 3, pages 225–42.

Executive summary v
• These asset prices are therefore vulnerable to a repricing,whether through an increase in long-term interest rates oran adjustment of growth expectations, or both. The impactof this could be amplified given reduced liquidity in somemarkets.
Progress has been made in building resilience to cyberattack, but the risk continues to build and evolve.Regulators are nearing completion of a first round of cyberresilience testing for all firms at the core of the UK financialsystem, in line with the Recommendation from the FPC in2015.
• The FPC’s concern is to mitigate systemic risk — the risk ofmaterial disruption to the economy.
• With 31 out of 34 firms at the core of the UK financialsystem, including banks representing more than 80% of theoutstanding stock of PRA-regulated banks’ lending to theUK real economy, so far having completed penetrationtesting and having action plans in place, the FPC is satisfiedthat its 2015 Recommendation has been met.
• Consistent with that, the FPC is also setting out theessential elements of the regulatory framework formaintaining cyber resilience and will now monitor that eachelement is being fulfilled by the relevant UK authorities.
• Alongside the Bank, PRA and FCA, the FPC will nowconsider its tolerance for the disruption to importanteconomic functions of the financial system in the event ofcyber attack.
The FPC has updated its medium-term priorities (see The FPC’s medium-term priorities chapter).
• The FPC’s primary responsibility is to identify, monitor andtake action to remove or reduce systemic risks, with a viewto protecting and enhancing the resilience of the UKfinancial system. It aims to ensure the financial systemdoes not cause problems for the rest of the economy and, ifand when problems arise in the economy, the financialsystem can absorb rather than amplify them.
• To help to meet its objectives, alongside its ongoingassessment of the risk environment, the FPC is prioritisingthree initiatives over the next two to three years:
• Finalising, and refining if necessary, post-crisis bankcapital and liquidity reforms.
• Completing post-crisis reforms to market-based financein the United Kingdom, and improving the assessment ofsystemic risks across the financial system.
• Preparing for the United Kingdom’s withdrawal from theEuropean Union.
Part A of this Report sets out in detail the Committee’sanalysis of the major risks and action it is taking in the light ofthose risks. Part B summarises the Committee’s analysis ofthe resilience of the financial system.

vi Financial Stability Report June 2017
Box 1The FPC’s 2017 Q2 UK countercyclical capitalbuffer rate decision
The FPC is increasing the UK countercyclical capital buffer(CCyB) rate from 0% to 0.5%, with binding effect from 27 June 2018. Absent a material change in the outlook, andconsistent with its stated policy for a standard riskenvironment and of moving gradually, the FPC expects toincrease the rate to 1% at its November meeting, withbinding effect a year after that. At that point, it will have thefull set of results from the 2017 stress test of major UK banks.
The increase to 0.5% will raise regulatory buffers of commonequity Tier 1 capital by £5.7 billion. This will provide a bufferof capital that can be released quickly in the event of anadverse shock occurring that threatens to tighten lendingconditions. The increase in the CCyB rate will also lead to aproportional increase in major UK banks’ leveragerequirements via the countercyclical leverage buffer (CCLB).
The Committee’s decision to increase the UK CCyB rate to0.5% — with an expectation of a further increase to 1% inNovember — reflects its assessment of the current riskenvironment and its intention to vary the buffer in gradualsteps.
In its published strategy for setting the CCyB, the FPCsignalled that it expects to set a UK CCyB rate in the region of1% in a standard risk environment. The FPC assesses theoverall risks from the domestic environment to be at astandard level: most financial stability indicators are neitherparticularly elevated nor subdued. Domestic credit has grownbroadly in line with nominal GDP over the past two years(Chart A). Within the overall risk environment, someindicators are more benign. For example, despite high levels ofindebtedness, private sector debt-servicing costs are low,supported by the low level of interest rates. In contrast, risklevels in some sectors are more elevated, notably so in theconsumer credit market (see UK consumer credit chapter).Global risks — which could influence the risks on UK exposuresindirectly via their potential effects on UK economic growth —are also judged to be material, as are risks from some assetvaluations.
The FPC’s measured approach is likely to decrease the risk thatbanks adjust by tightening credit conditions, therebyminimising the cost to the economy of making the bankingsystem more resilient.
In line with its published policy, the FPC stands ready to cutthe UK CCyB rate, as it did in July 2016, if a risk materialisesthat could lead to a material tightening of lending conditions.
The cut in the CCyB rate in July 2016 was a response togreater uncertainty around the UK economic outlook and anincreased possibility that material domestic risks couldcrystallise in the near term. The FPC’s action served to ensurebanks did not hoard capital and restrict lending in thoseconditions. Banks’ capital buffers exist to be used as necessaryto allow banks to support the real economy in a downturn.
Under EU law, the UK CCyB rate applies automatically (up to a2.5% limit, and currently subject to a transition timetable) tothe UK exposures of firms incorporated in other EuropeanEconomic Area (EEA) states. The FPC expects it to apply alsoto internationally active banks in jurisdictions outside the EEAthat have implemented the Basel III regulatory standards.Consistent with this, recent CCyB actions by Czech Republic,Hong Kong and Norway have been reciprocated.
5
0
5
10
15
2000 02 04 06 08 10 12 14 16
Nominal GDP growth rate(b)
Bank credit(a)
Per cent
+
–
Chart A Credit directly financed by the banking systemhas grown broadly in line with nominal GDP over thepast two yearsGrowth in credit to households and firms compared with nominalGDP growth
Sources: ONS and Bank calculations.
(a) Quarterly twelve-month growth rate of monetary financial institutions’ sterling net lendingto private non-financial corporations and households (in per cent) seasonally adjusted.
(b) Twelve-month growth rate of nominal GDP.

Executive summary vii
Box 2Possible financial stability implications of theUnited Kingdom’s withdrawal from theEuropean Union
In March 2017, the UK Government notified the EuropeanCouncil of the United Kingdom’s intention to withdraw fromthe European Union. This initiated, under Article 50 of theTreaty on European Union, a two-year period for the United Kingdom and the European Union to negotiate andconclude a withdrawal agreement. The exit negotiations havenow begun.
As the FPC stated in September 2016, irrespective of theparticular form of the United Kingdom’s future relationshipwith the European Union, and consistent with its statutoryresponsibility, the FPC will remain committed to theimplementation of robust prudential standards in the UKfinancial system. This will require a level of resilience to bemaintained that is at least as great as that currently plannedand which itself exceeds that required by internationalbaseline standards.(1)
In addition, consistent with its statutory duty, the FPC willcontinue to identify and monitor UK financial stability risks,so that preparations can be made and action taken tomitigate them.
There are a range of possible outcomes for the United Kingdom’s future relationship with the European Unionand possible paths to that relationship. Consistent with itsremit, the FPC is focused on scenarios that, even if they maybe the least likely to occur, could have most impact on UK financial stability. This includes a scenario in which there isno agreement in place at the point of exit. Such scenarios arewhere contingency planning and preparation will be mostvaluable.
The Bank, FCA and PRA are working closely with regulatedfirms and financial market infrastructures (FMIs) to ensurethey have comprehensive contingency plans in place. The FPCwill oversee contingency planning to mitigate risks to financialstability as the withdrawal process unfolds.
Through this work, the FPC is aiming to promote an orderly adjustment to the new relationship between theUnited Kingdom and the European Union.
Without contingency plans that can be executed in theavailable time, effects on financial stability could arise boththrough direct effects on the provision of financial services,and indirectly, through macroeconomic shocks that could testthe resilience of the financial system.
(1) Direct effects on the provision of financial services
A very large part of the United Kingdom’s legal and regulatoryframework for financial services is directly or indirectly derivedfrom EU law. The United Kingdom’s financial services lawmust therefore become domestic at the point ofwithdrawal. The Government plans to execute this throughthe Repeal Bill. Once enacted, this will ensure there is no legalor regulatory vacuum in respect of financial services when theUnited Kingdom leaves the European Union.
The European Union’s framework for financial servicesestablishes the right of financial companies within theEuropean Economic Area (EEA) to provide services acrossnational borders and to establish local branches in otherMember States without local authorisation.
This promotes substantial cross-border provision of a widerange of financial services. Around £40 billion of UK financialservices revenues relate to EU clients and markets.(2) These cross-border connections have resulted in more efficientfinancial services for businesses and households across theEuropean Union.
There is no generally applicable institutional framework forcross-border provision of financial services outside theEuropean Union. Globally, liberalisation of trade in serviceslags far behind liberalisation of trade in goods. So without anew bespoke agreement, UK firms could no longer provideservices to EEA clients (and vice versa) in the same manner asthey do today, or in some cases not at all. This creates twobroad risks. First, services could be dislocated as clients andproviders adjust. Second, the fragmentation of serviceprovision could increase costs and risks.
In the United Kingdom, the flow of new banking andinsurance services to UK customers could be disrupted ifEEA firms are unable to operate in the United Kingdom in the same manner as they do today. Around 10% of theoutstanding stock of loans to private non-financialcorporations in the United Kingdom is extended by UK branches of EEA banks.(3)
Around 7% of general insurance contracts undertaken in theUnited Kingdom and 3% of life insurance contracts arewritten by EEA insurers.(4) As well as disrupting new businessfrom these providers, fragmentation could require the existingcontracts to be transferred to a UK-authorised firm in order toaddress any legal uncertainties as to the status of, and abilityto perform, such contracts.
(1) www.bankofengland.co.uk/publications/Pages/news/2016/033.aspx.(2) Source: Oliver Wyman, 2016.(3) Source: Bank of England calculations.(4) Sources: Firms’ published accounts, regulatory data and Bank calculations. Based on
premiums relating to insurance contracts.

viii Financial Stability Report June 2017
There could also be material dislocation of some servicessupplied from the United Kingdom to the European Union.EU clients would need to source substitute services from banksand FMIs established in the EEA or other countries recognisedby the European Commission as ‘equivalent’. This isparticularly relevant to new debt and equity issuance andderivatives business. These dislocations could also disrupt the provision of services to UK clients who rely on EUcounterparties.
UK-located banks underwrite around half of the debt andequity issued by EU companies.(1) EU companies could needto find alternative providers of this service to sustain theircapital market issuance.
UK-located banks are counterparty to over half of the over-the-counter (OTC) interest rate derivatives traded by EU companies and banks.(2) To support EU-based derivativestrading, substantial operational capacity may need to beestablished in the European Union and additional capital andbalance sheet capacity would probably be needed.
Central counterparties (CCPs) located in the United Kingdom provide services to EU clients in a range ofmarkets. The United Kingdom houses some of the world’slargest CCPs. For example, LCH handles over 90% ofcleared interest rate swaps globally.
In addition to the potential disruption to new clearing businessfor EU firms, if EU firms are unable to move their existingderivatives contracts to EU authorised or recognised CCPs,they would face capital charges that are up to ten timeshigher. Moreover, to move a large stock of existing trades willpose substantial and complex operational and legalchallenges.
In addition to the dislocation of services, fragmentation ofmarket-based finance could result in higher costs andgreater risks for both EU and UK companies and households.
Separation of derivatives clearing would reduce the benefits ofcentral clearing. It would impair the ability to diversify risksacross borders and, by increasing costs, reduce incentives forfirms to hedge risks. Industry estimates suggest that a singlebasis point increase in cost resulting from splitting clearing ofinterest rate swaps could cost EU firms €22 billion per yearacross all of their business.
Delegation of asset management across borders is a well-established practice. For example, 40% of the assetsmanaged in the United Kingdom are managed for overseasclients; around half of this activity is on behalf of clientsoutside Europe.(3) UK-located asset managers account for37% of all assets managed in Europe.(4) If asset management
were to fragment between the United Kingdom and Europe,material economies of scale and scope that are currentlyachieved by pooling of funds and their management would bereduced.
Together, these effects could increase the reliance of boththe UK and EU economies on their banking systems andreduce the diversification and resilience of finance.
(2) Macroeconomic shocks that could test the resilience of the financial system
To maintain consistent provision of financial services to theUK economy, the financial system must be able to absorb the impacts on their balance sheets of any adverse economic shocks that could arise in some scenarios for theUnited Kingdom’s withdrawal from the European Union.
The Bank of England’s regular stress testing aims to ensurethat the banking system has the strength to withstand, andcontinue to lend in, a broad and severe economic and marketshock.
The United Kingdom’s withdrawal from the European Unionhas the potential to affect the economy through supply,demand and exchange rate channels.(5)
The supply side of the economy could be disrupted by abruptincreases in the costs of, or obstacles to, cross-border trade.Demand could be impacted by the abrupt introduction ofrestrictions on exports of financial and other services andtariffs on trade in goods with the European Union. A reductionin economic activity in high tax-paying sectors could affectpublic finances and spending.
In some scenarios, heightened uncertainty could also reinforcethe existing risk of a fall in appetite of foreign investors for UK assets. The United Kingdom relies on inflows of overseascapital to finance its current account deficit — the excess ofinvestment over domestic saving. That deficit, which stood at4.4% of GDP in 2016, is financed largely through directinvestment and portfolio investment in the form of long-termdebt and equity (Chart A).
A material reduction in the appetite of foreign investors toprovide finance to the United Kingdom would tightenfinancing conditions for UK borrowers and reduce asset prices
(1) Based on Bank analysis of UK-located investment banks’ revenues in 2015 for M&Aand debt/equity issuance activities, using multiple sources.
(2) Based on Bank calculations and multiple sources, including Bank for InternationalSettlements triennial survey data (2016) which show UK-based dealers account for82% of European trading in OTC single currency interest rate derivatives.
(3) Sources: Investment Association Annual Survey (2015–2016) and Bank calculations.(4) Source: Investment Association Annual Survey (2015–2016).(5) See the May 2017 Inflation Report;
www.bankofengland.co.uk/publications/Documents/inflationreport/2017/may.pdf.

Executive summary ix
and investment. The effect could be most pronounced inmarkets that have recently had greater reliance on access tooverseas capital, such as commercial real estate (CRE).Around half of the investment in UK CRE since 2015 has beenfinanced by overseas investors (Chart B).
All else equal, economic shocks like these would probablydepress the exchange rate, putting upward pressure oninflation. The combination of shocks could therefore possiblycreate a more challenging trade-off for monetary policy. TheMonetary Policy Committee would have to make carefuljudgements about the net effect of these influences ondemand, supply and inflation.
In these circumstances, the maintenance of financial stabilitywould require banks to be able to withstand, and continuelending in, an environment of higher loan impairments,increased risk of default on other assets, and lower asset pricesand collateral values.
Mitigating risks to financial stabilityThe FPC will continue to assess the resilience of the UKfinancial system to adverse economic shocks that could arise.The FPC will use the information from its regular stress testingof major UK banks and building societies. These test banks’resilience to a range of relevant scenarios, including a snapback of interest rates, sharp adjustment in UK propertymarkets, and severe stress in the euro area.
The FPC will continue to assess the suitability of firms’contingency plans for emerging risks, in the context ofprogress on agreements and the continuity of the domesticregulatory framework. This will draw on reviews by the Bank,PRA and FCA of firms’ plans, including responses from banks,insurers and designated investment firms to the PRA’s April 2017 letter requesting that they summarise theircontingency plans for the full range of possible scenariosfollowing the United Kingdom’s withdrawal from the European Union.
20
10
0
10
20
30
2011 12 13 14 15 16
Portfolio investment(b)
Foreign direct investment (FDI)
Other investment(c)
Reserves and net derivatives
Total net inward financing flow(d)
Current account deficit
+
–
Per cent of GDP
Chart A The United Kingdom has relied on materialinflows of portfolio investment and FDI to finance itscurrent account deficit in recent yearsNet inward financing flows(a)
Sources: ONS and Bank calculations.
(a) This is the change in UK foreign liabilities, less the change in UK foreign assets, for eachcategory of investment. These data are presented as annual series using four-quarteraverages.
(b) Portfolio investment consists of debt securities (including government debt), equities andinvestment fund shares.
(c) Other investment consists mostly of loans and deposits.(d) The total net inward financing flow is equal in magnitude to the current account deficit
(plus errors and omissions).
0
5
10
15
20
25
2003 04 05 06 07 08 09 10 11 12 13 14 15 16 17
By overseas investors
By domestic investors
Total United Kingdom £ billions
Chart B Overseas investors have accounted for aroundhalf of total investment in UK CRE since 2015UK CRE transactions (gross quarterly flows)(a)
Sources: The Property Archive and Bank calculations.
(a) Final data points are the sum of three months to May 2017.


The FPC’s approach to addressing risksfrom the UK mortgage market
Part A The FPC’s approach to addressing risks from the UK mortgage market 1
SummaryBuying a house is the biggest investment that many peoplewill make in their lives, and it is typically financed by debt.
In the United Kingdom, mortgages are households’ largestliability and lenders’ largest loan exposure.
The FPC’s concern is with risks to the resilience of bothborrowers and lenders that arise from high levels of householddebt. While a significant factor contributing to high levels ofhouse prices relative to incomes in the United Kingdom hasbeen the relatively limited growth in the stock of housing, themain drivers of housing supply are not under the control of theBank of England or the FPC. Consumer protection, meanwhile,remains the responsibility of the FCA.
Historically, the build-up of mortgage debt has been a keysource of risk to financial and economic stability:
• Highly indebted households are more vulnerable tounexpected falls in their incomes or increases in theirmortgage repayments.
• In an economic downturn, they do all they can to pay theirmortgages, but — as a result — may have to cut spendingsharply, making the downturn worse.
• In doing so, they also increase the risk of losses to lenders,not just on mortgages, but on other lending too.
Build-ups of mortgage debt can be self-reinforcing. Lenders’underwriting standards can turn quickly from responsible toreckless:
• Housing is the main source of collateral in the real economy,so higher house prices tend to lead to higher levels ofmortgage lending, feeding back into higher valuations.
• In an upturn, when risks are perceived to be low, lenders’underwriting standards can loosen quickly, as they seek tomaintain or build market share. This increases the supply ofcredit further.
To insure against these risks, in June 2014 the FPC introduceda policy package, designed to prevent a significant increase inthe number of highly indebted households and a markedloosening in underwriting standards. The two FPCRecommendations were to:
• limit the proportion of mortgages extended at high loan to income ratios; and
• promote minimum standards for how lenders testaffordability for borrowers.
These measures were not expected to restrain housing marketactivity unless lenders’ underwriting standards eased. Theywere put in place as insurance and complement the annualstress tests of major lenders, which test that lenders canwithstand sharp economic downturns, including large falls inhouse prices, while also continuing to lend.
The FPC views its Recommendations as likely to remain inplace for the foreseeable future. It judges that their benefitswould increase if they became more binding relative tolenders’ underwriting standards. The FPC will continue toreview their calibration on a regular basis.
The FPC has clarified its affordability test Recommendation toensure consistency in its application across lenders. TheCommittee has recommended that:
• When assessing affordability, mortgage lenders should applyan interest rate stress test that assesses whether borrowerscould still afford their mortgages if, at any point over thefirst five years of the loan, their mortgage rate were to be3 percentage points higher than the reversion rate specifiedin the mortgage contract at origination.
This Recommendation can alternatively be interpreted asintroducing a ‘safety margin’ between current mortgagepayments and current income, also ensuring that thehousehold sector as a whole is better able to withstandadverse shocks to income and employment.
The housing market can be a key source of risk tofinancial stabilityHousing accounts for nearly half of the total assets ofUK households. And around two thirds of house purchases arefinanced by mortgage debt.
Housing has been at the heart of many financial crises. Sincethe 1950s, there has been a material rise in mortgage debtacross advanced economies, driving a major expansion of thebalance sheet of the financial sector. More than two thirds ofthe 46 systemic banking crises for which house price data are

2 Financial Stability Report June 2017
available were preceded by housing boom-bust cycles.(1)
Mortgage booms have also tended to be followed by periodsof considerably slower economic growth than non-mortgagecredit booms, irrespective of whether a financial crisisoccurred or not.(2)
Mortgages are the largest liability of UK households.They can be a source of risk for borrowers’ resilience andbroader economic activity.Over the past 20 years, house prices have risen significantlyrelative to incomes, so households have to borrow more tobuy a house. The resulting high levels of household debtexpose the UK economy to the risk of sharp cuts inconsumption in the face of shocks to income or interestrates.
A significant factor contributing to high levels of house pricesrelative to incomes in the United Kingdom (Chart A.1)(3) hasbeen the relatively limited growth in the stock of housing. Theabsolute level of house prices may further reflect a protracteddecline in interest rates.
Over the past 50 years, the number of new houses built eachyear in the United Kingdom has more than halved, from a peakof 426,000 in 1968 (Chart A.2). Since 1982, this number hasaveraged less than 190,000, while the UK population hasincreased by around 265,000 per year.(4) Partly as a result, thecost of renting a property — as well as buying it — can be highrelative to household incomes in parts of the country. In the2016 NMG survey, around one third of respondents who livedin rented accommodation reported that their rental paymentswere 30% or more of their pre-tax incomes. The main driversof housing supply are not under the control of the Bank ofEngland or the FPC, and are partly related to the planningsystem.(5)
Long-term real interest rates have been declining acrossadvanced economies for several decades. Global structuralfactors — such as demographics — are likely to have been theprimary driver of these falls, which have contributed to a risein the level of house prices.(6) In recent months, annual houseprice inflation has weakened; in May 2017 house prices rose atthe slowest annual rate since May 2013.(7) But whilerespondents to the RICS survey in May 2017 expected theslowdown to continue in the near term, they expected pricesto rise over the next year.
Building up a deposit to buy a house has become moredifficult. The average house price for first-time buyersincreased from around £50,000 in 1997 to over £200,000 in2016. Over the same period, the size of a typical deposit for afirst-time buyer increased from less than £5,000 to over£30,000. The Wealth and Assets Survey(8) suggests that only
(1) Crowe, C, Dell’Ariccia, G, Igan, D and Rabanal, P (2011), ‘How to deal with real estatebooms: lessons from country experiences’, IMF Working Paper 11/91;www.imf.org/external/pubs/ft/wp/2011/wp1191.pdf.
(2) See Jordà, O, Schularick, M and Taylor, A M (2014), ‘The great mortgaging: housingfinance, crises and business cycles’, Federal Reserve Bank of San Francisco WorkingPaper 2014–23; www.frbsf.org/economic-research/publications/working-papers/wp2014-23.pdf.
(3) The national average masks regional differences. At end-2015, the house price tohousehold income ratio was 3.5 in the North of England and 6.2 in London, andaveraged 4.2 for the United Kingdom.
(4) Over 1981–2016, the size of the average UK household has also fallen, incrementingthe pressure from population growth. For evidence on the impact of supply onaffordability, see Hilber, C A L and Vermeulen, W (2015), ‘The impact of supplyconstraints on house prices in England’;http://onlinelibrary.wiley.com/doi/10.1111/ecoj.12213/abstract.
(5) For more details see Barker, K (2004), Review of housing supply;https://web.archive.org/web/20080513212848/http:/www.hm-treasury.gov.uk/consultations_and_legislation/barker/consult_barker_index.cfm#report and Hilber, C A L and Vermeulen, W (2015), op cit.
(6) See the box ‘Explaining the long-term decline in interest rates’ on pages 8–9 of theNovember 2016 Inflation Report; www.bankofengland.co.uk/publications/Documents/inflationreport/2016/nov.pdf and the box ‘The long-term outlook forinterest rates’ on pages 6–7 of the May 2017 Inflation Report;www.bankofengland.co.uk/publications/Documents/inflationreport/2017/may.pdf.
(7) Based on the average of the Halifax and Nationwide house price indices.(8) The Wealth and Assets Survey is a household survey that gathers information on,
among other things, level of savings and debt, saving for retirement, how wealth isdistributed across households and factors that affect financial planning.
0
1
2
3
4
5
6
1973 78 83 88 93 98 2003 08 13
House price to household income
Ratio
Chart A.1 UK house prices have risen significantlyrelative to households’ incomesUK house price to household income ratio(a)(b)
Sources: Department for Communities and Local Government, Halifax, Nationwide, ONS andBank calculations.
(a) The ratio is calculated as average UK house price divided by the four-quarter moving sum ofgross disposable income of the UK household and non-profit sector per household.Aggregate household disposable income is adjusted for financial intermediation servicesindirectly measured (FISIM) and changes in pension entitlements.
(b) House price is an average of the Halifax and Nationwide indices.
0
50
100
150
200
250
300
350
400
450
1952 62 72 82 92 2002 12
Completions of new dwellings
Thousands
Chart A.2 Over the past 50 years, the number of housesbuilt each year has more than halvedCompletions of new dwellings in the United Kingdom(a)
Sources: Department for Communities and Local Government and Bank calculations.
(a) Total number of permanent dwellings completed in the United Kingdom per calendar year.Includes completions from private enterprises, housing associations and local authorities.Data for 2016 Q4 and 2017 Q1 assume that completions of new dwellings in theUnited Kingdom as a whole have grown in line with those in England. The diamond showsthe 2017 Q1 outturn on an annualised basis for 2017. Data are seasonally adjusted.

Part A The FPC’s approach to addressing risks from the UK mortgage market 3
around 6% of renters aged 45 or younger have financial assetsworth £30,000 or more, and that only 11% have £15,000 ormore.
The increase in house prices relative to incomes in recentdecades has contributed to a rise in UK householdindebtedness, which is currently high by historicalstandards. Since the late 1980s, the outstanding stock ofmortgage debt has nearly doubled and represents the majorityof the aggregate household debt to income (DTI) ratio(Chart A.3).
During the financial crisis, countries that had initially higherlevels of household debt relative to income saw larger falls inaggregate consumption (Chart A.4), putting downwardpressure on broader economic activity. Analysis ofhousehold-level data also suggests that individual householdswith higher mortgage debt relative to income adjust spendingmore sharply in response to shocks. For example, data fromthe Living Costs and Food Survey show that, during thefinancial crisis, the fall in consumption relative to incomeamong UK households with loan to income (LTI) ratios abovefour was around three times larger than the fall for those withratios between one and two (Chart A.5). Econometric studiesconfirm these results, even after controlling for otherhousehold characteristics.(1)
Given the ‘full-recourse’ nature of UK mortgage contracts,borrowers in the United Kingdom typically do all they canto pay their mortgages rather than default, includingcutting back sharply on spending. In the United Kingdom, if
a borrower defaults on a mortgage and the value of the housedoes not cover the outstanding mortgage, the lender has aclaim against other assets of the debtor. This contrasts withsome other jurisdictions, such as the United States, where‘non-recourse’ mortgages are more widespread.
(1) See Bunn, P and Rostom, M (2015), ‘Household debt and spending in theUnited Kingdom’, Bank of England Staff Working Paper No. 554;www.bankofengland.co.uk/research/Documents/workingpapers/2015/swp554.pdf.
0
20
40
60
80
100
120
140
160
91 95 99 2003 07 11 15
Per cent
1987
Household debt to income ratio (excluding mortgages)
Household debt to income ratio (of which mortgages)
Total household debt to income ratio
Chart A.3 UK household indebtedness is high byhistorical standardsUK household debt to income ratio(a)(b)(c)(d)
Sources: ONS and Bank calculations.
(a) Total household debt to income ratio is calculated as gross debt as a percentage of afour-quarter moving sum of gross disposable income of the UK household and non-profitsector. Includes all liabilities of the household sector except for unfunded pension liabilitiesand financial derivatives of the non-profit sector.
(b) Mortgage debt to income ratio is calculated as total debt secured on dwellings as apercentage of a four-quarter moving sum of disposable income.
(c) Non-mortgage debt is the residual of mortgage debt subtracted from total debt.(d) The household disposable income series is adjusted for FISIM and changes in pension
entitlements.
10
8
6
4
2
0
2
4
6
8
10
0 100 200 300 400Household debt to income ratio in 2007, per cent
United Kingdom
Adjusted consumption growth 2007–12, per cent
+
–
Chart A.4 Countries with higher levels of householddebt relative to income saw larger consumption falls in the crisisHousehold debt to income ratio and consumption growth over2007–12(a)
Sources: Flodén (2014) and OECD National Accounts.
(a) Change in consumption is adjusted for the pre-crisis change in total debt, the level of total debtand the current account balance. See Flodén, M (2014), ‘Did household debt matter in theGreat Recession?’, available at http://martinfloden.net/files/hhdebt_supplement_2014.pdf.
25
20
15
10
5
0
0 to 1 1 to 2 2 to 3 3 to 4 ≥4
Percentage point change in consumption to income ratio
Mortgage LTI ratio
–
Chart A.5 UK households with higher levels of mortgagedebt relative to income adjusted spending more sharplyduring the crisisChange in consumption relative to income among mortgagorswith different LTI ratios between 2007 and 2009(a)(b)(c)
Sources: Living Costs and Food (LCF) Survey, ONS and Bank calculations.
(a) Change in average non-housing consumption as a share of average post-tax income (net ofmortgage interest payments) among households in each mortgage LTI category between2007 and 2009.
(b) LCF Survey data scaled to match National Accounts (excluding imputed rental income,income received by pension funds on behalf of households and FISIM). LTI ratio is calculatedusing secured debt only as a proportion of gross income.
(c) Repeat cross-section methodology used, with no controls for other factors, or howhouseholds may have moved between LTI categories between 2007 and 2009.

4 Financial Stability Report June 2017
Given the prevalence of short-term fixed-rate mortgagecontracts, UK households are also particularly exposed tothe risk of unexpected changes in interest rates.(1) Almost80% of new mortgage lending in 2016 was either on a fixedrate for a period of less than five years or on a floating rate.
In summary, mortgage debt can be a source of risk forborrowers’ ability to weather downturns without substantialcutbacks in their spending. UK household indebtedness ishigh, which can be a threat to the wider economy. Highlyindebted households can cut back sharply on spending inresponse to adverse shocks to incomes or interest rates,putting downward pressure on economic activity and reducingthe resilience of the financial system.
Mortgages are the largest loan exposure for UK lenders.They can be a source of risk for lenders’ resilience,impairing the provision of credit.In a severe downturn, some borrowers will be unable torepay their mortgages even after cutting back on spending,for example, in the event of a rise in unemployment. Theresulting defaults can affect lenders’ resilience, withmortgages accounting for around two thirds of majorUK banks’ loans to UK borrowers.(2)
The proportion of households experiencing repaymentdifficulties can rise sharply as the share of income spent onservicing mortgage debt — also known as the mortgagedebt-servicing ratio (DSR) — increases beyond a certain level(Chart A.6). Both the average DSR of the UK householdsector as a whole and the proportion of households with highmortgage DSRs have fallen since the crisis, supported by thelow level of interest rates. But households’ ability to servicetheir mortgage debt could be challenged by either a rise inmortgage rates or a fall in incomes. As an illustration, Bankstaff estimate that in the event of a rise in unemployment to8%, the proportion of households with high DSRs woulddouble, reaching a level close to that seen in 2007 (Chart A.7).
During the global financial crisis, loss rates on mortgages werecontained, reflecting the sharp fall in interest rates and a risein unemployment that was relatively modest given the fall ineconomic activity.(3) But in the 1990s recession, which wasmarked by a significant rise in interest rates andunemployment, loss rates were more material.(4) And resultsfrom stress tests of major UK banks suggest that they couldreach similar levels in future periods of severe stress (ChartA.8), particularly if house prices were to fall significantly,increasing lenders’ losses in the event of borrower default.
Significant falls in house prices are highly correlated witheconomic downturns, when borrowers are also more likely tobecome unemployed and default on their mortgages. In sucha severe stress, lenders are likely to incur larger losses onlending originally extended at high LTV ratios. This is because
such mortgages are more likely to experience ‘negative equity’in the event of a fall in house prices, meaning that the value ofthe housing collateral will be less likely to cover the mortgageloan.
0
4
8
12
16
20
0–5 5–10 10–15 15–20 20–25 25–30 30–35 35–40 40–50 50+
NMG survey (2014–15, arrears 2 months+)
Wealth and Assets Survey (2010–12, arrears 2 months+)
Percentage of mortgagors in arrears(a)
Mortgage DSR, per cent
Chart A.6 Households with high debt-servicing ratios(DSRs) are more likely to experience repayment difficultiesHouseholds in two-month arrears by mortgage DSR
Sources: NMG Consulting survey, Wealth and Assets Survey and Bank calculations.
(a) The share of mortgagors who have been in arrears for at least two months. The mortgageDSR is calculated as total mortgage payments (including principal repayments) as apercentage of pre-tax income. Calculation excludes those whose DSR exceeds 100%.Reported repayments may not account for endowment mortgage premia.
(1) This has been a feature of the UK mortgage market for many years and was discussedin Miles, D (2004), The UK mortgage market: taking a longer-term view;http://webarchive.nationalarchives.gov.uk/20071204181447/hm-treasury.gov.uk/consultations_and_legislation/miles_review/consult_miles_index.cfm.
(2) Unless otherwise stated, ‘banks’ or ‘lenders’ refer to all UK banks and buildingsocieties.
(3) The distribution of unemployment was also skewed towards younger households,among whom the owner-occupier rate is lower.
(4) Less developed credit scoring and credit risk management practices relative to todayalso help explain the high loss rates in the early 1990s.
0.0
0.5
1.0
1.5
2.0
2.5
3.0
1991 96 2001 06 11 16
Percentages of households
Households with mortgage DSR ≥ 40% — unemployment at 8%
Households with mortgage DSR ≥ 40% (BHPS/US)
Households with mortgage DSR ≥ 40% (NMG)
Chart A.7 An increase in unemployment could double theproportion of vulnerable householdsPercentage of households with mortgage debt-servicing ratios of40% or greater(a)(b)(c)
Sources: British Household Panel Survey (BHPS), NMG Consulting survey, ONS, UnderstandingSociety (US) and Bank calculations.
(a) Mortgage DSR calculated as total mortgage payments as a percentage of pre-tax income.(b) Percentage of households with mortgage DSR above 40% is calculated using British
Household Panel Survey (1991 to 2008), Understanding Society (2009 to 2013), andNMG Consulting survey (2011 to 2017).
(c) A new household income question was introduced in the NMG survey in 2015. Data from2011 to 2014 surveys have been spliced on to 2015 data to produce a consistent time series.Data for 2017 come from the spring survey, while data from previous years come from theautumn survey.

Part A The FPC’s approach to addressing risks from the UK mortgage market 5
The provision of high LTV lending has increased from itspost-crisis lows recently, but both the annual average totalvolume of high LTV lending and its share of total mortgagelending remain lower than at any point between 1982 and2008 (Chart A.9). At the same time, LTV ratios foroutstanding loans have fallen as a result of house price growthand mortgagors repaying existing debt. As a result, forexample, only 2% of the major six lenders’ stock of mortgageshad an LTV above 90% at end-2016 (Chart A.10).
High mortgage debt can also affect lenders’ resilienceindirectly. In a downturn, highly indebted householdsprioritising mortgage payments may default on their othercredit commitments, such as credit cards or personal loans.Sharp cuts in consumption that amplify the downturn can alsolead to credit losses on other types of lending, for exampleloans to businesses.
Overall, in a severe stress, high levels of mortgage debt couldlead to significant losses (both directly and indirectly) andreduce the resilience of lenders, impairing the provision ofcredit to the real economy and further intensifying aneconomic downturn.
Self-reinforcing feedback loops between levels ofmortgage lending and house prices can amplify risks toboth borrowers and lenders.Housing is the main source of collateral in the realeconomy, so higher house prices tend to lead to higherlevels of mortgage lending, feeding back into higher
valuations. As valuations increase, rising wealth for existinghomeowners and higher collateral values for lenders canincrease both the demand for, and supply of, credit, leading toa self-reinforcing loop between levels of mortgage lending andhouse prices. Expectations of future house price increases canalso prompt prospective buyers to bring forward housepurchases. The resulting rapid growth in mortgage lending canamplify risks to both lenders and borrowers.
0.0
0.5
1.0
1.5
2.0
2.5
3.0
1991–95 2009–13 2014 stresstest
2015 stresstest
2016 stresstest
Per cent
Cumulative five-year loss rates
Estimated loss rates incurred by insurers
Chart A.8 Loss rates on UK mortgages could reachmaterial levels in a severe stressCumulative five-year loss rates on UK mortgages in pastdownturns and in stress tests(a)(b)(c)(d)(e)
Sources: Acadametrics, Bank of England, lenders’ stress-testing submissions andBank calculations.
(a) Cumulative loss rates are calculated as cumulative losses divided by average balances.(b) Losses defined as write-offs for the 1991–95 and 2009–13 periods and impairment charges
for stress-test results.(c) 1991–95 write-offs include all banks and building societies and an estimate of the losses
borne by the UK insurance industry on loans originated by banks and building societies.Based on data published by MIAC-Acadametrics.
(d) Losses in 2009–13 and stress tests include the six major lenders. (e) Impairments in the 2014 stress test are cumulative over three years.
0
50
100
150
200
250
300
350
400
10
20
30
40
50
60
83 87 91 95 99 2003 07 11 15
Percentage of mortgages Number of mortgages (thousands)
19790
Completions <90% LTV (right-hand scale)
Completions ≥90% LTV(d) (right-hand scale)
Proportion ≥90% LTV (left-hand scale)
(e)
Chart A.9 High LTV mortgage lending remains lowerthan at any point between 1982 and 2008New mortgage lending by LTV at origination(a)(b)(c)
Sources: Council of Mortgage Lenders (CML), FCA Product Sales Database (PSD) andBank calculations.
(a) Data are shown as a four-quarter moving average.(b) Data include loans to first-time buyers, council/registered social tenants exercising their right
to buy and home movers. (c) The PSD includes regulated mortgage contracts only.(d) The number of mortgage loans with ≥90% LTV is calculated using the aggregate number of
mortgages from the CML and the proportion of mortgages with ≥90% LTV from the PSD.(e) PSD data are only available since 2005 Q2. Data from 1993 to 2005 are from the Survey of
Mortgage Lenders, which was operated by the CML, and earlier data are from the 5% SampleSurvey of Building Society Mortgages. The data sources are not directly comparable: thePSD covers all regulated mortgage lending whereas the earlier data are a sample of themortgage market. Data for the first three quarters of 1992 are missing, chart values areinterpolated for this period.
0
10
20
30
40
50
60
70
80
90
100
10 11 12 13 14 15 16
Per cent of mortgage book
2009
0% < LTV ≤ 50%
50% < LTV ≤ 75%
75% < LTV ≤ 90%
90% < LTV ≤ 95%
95% < LTV ≤ 100%
100% and above
Chart A.10 The LTV distribution of the stock ofmortgages has improved since the crisisUK mortgage books by indexed LTV(a)
Sources: PRA regulatory returns and Bank calculations.
(a) Peer group accounts for around 74% of total UK mortgages and includes the majorUK lenders.

6 Financial Stability Report June 2017
In an upturn, when risks from credit losses are perceived tobe low, the underwriting standards lenders apply to decideon what terms to lend can deteriorate quickly as they seekto maintain or build market share. This increases thesupply of credit further. Underwriting standards onUK mortgages weakened in the lead-up to the financial crisis,contributing to the growth in mortgage lending and houseprices. Across a range of metrics, underwriting standards arenow more robust relative to the period before the crisis. Butmarket contacts suggest that lending conditions in themortgage market are becoming easier and competitivepressures in the mortgage market remain. Mortgage spreadsover risk-free rates have fallen materially since their peakin 2012 (Chart A.11). Lenders are also extending an increasingproportion of mortgages without fees. Forty-six per centof mortgages were extended without fees in the first partof 2017, compared to 37% in 2016 and just 12% in 2011(Chart A.12).
A similar feedback loop between house prices and credit alsoarises in a downturn. An economic slowdown can reducehouse prices. Due to the role of housing as collateral, lowerhouse prices reduce the demand for, and supply of, credit.Expectations of further price reductions, which can result insales of houses at heavily discounted prices (‘fire sales’), canfurther amplify house price falls, reinforcing the adversefeedback loop. The resulting deterioration in borrowers’ and lenders’ resilience will intensify a downturn (Figure A.1).
Growth in the private rental sector in recent years mayhave led to growing risks of amplified house price cyclesfrom leveraged buy-to-let investors.(1) The share ofhouseholds in the private rental sector rose from around 10%in 2002 to 20% in 2016. Buy-to-let investors do not live inthe house that they rent out and their behaviour is more likelyto be driven by their expected returns on their housinginvestment than that of owner-occupiers. But if either houseprices or the income received from rental payments were tofall materially, there is a risk that some leveraged investorsmay look to sell their properties quickly, reinforcing houseprice falls in a downturn.
The size of the buy-to-let segment of the mortgage markethas almost doubled since the period before the crisis(Chart A.13). So the impact of a growing share of leveragedinvestors on the dynamics of the broader market in a stress
Expectations of further pricereductions and ‘fire sales’
Collateral effect
Adverseshock
Houseprice fall
Reduction indemand for andsupply of credit
Figure A.1 Feedback loops between mortgage credit andhouse prices can amplify a downturn
0
5
10
15
20
25
30
35
40
45
50
2011 12 13 14 15 16 17
Per cent
Proportion of £0 fee new mortgages
Chart A.12 The proportion of mortgages with no feeshas increasedProportion of new mortgages with no fees(a)
Sources: Moneyfacts and Bank calculations.
(a) The proportion of £0 fee products in each year is calculated relative to the total number ofnew mortgages offered during the year. The proportion in 2017 is calculated based on datafrom January to April 2017.
0
50
100
150
200
250
300
350
400
450
05 06 07 08 09 10 11 12 13 14 15 16 17
Basis points
2004
Mortgage spreads — owner-occupier(a) Mortgage spreads
— buy-to-let(b)(c)
Chart A.11 Mortgage spreads have fallenMortgage rates on owner-occupier and buy-to-let lending relativeto risk-free rates
Sources: Bank of England, Bloomberg, Council of Mortgage Lenders, FCA Product SalesDatabase, Moneyfacts and Bank calculations.
(a) The overall spread on residential mortgage lending is a weighted average of quotedmortgage rates over risk-free rates, using 90% LTV two-year fixed-rate mortgages and 75%LTV tracker, two and five-year fixed-rate mortgages. Spreads are taken relative to gilt yieldsof matching maturity for fixed-rate products. Spreads are taken relative to Bank Rate for thetracker product. Weights are based on relative volumes of new lending. The Product SalesDatabase includes regulated mortgages only.
(b) The spread on new buy-to-let mortgages is the weighted average effective spread chargedon new floating and fixed-rate non-regulated mortgages over risk-free rates. Spreads aretaken relative to Bank Rate for the floating-rate products. The risk-free rate for fixed-ratemortgages is calculated by weighting two-year, three-year and five-year gilts by the numberof buy-to-let fixed-rate mortgage products offered at these maturities.
(c) Buy-to-let data are only available from 2007 as they are sourced from the Bank of England’sMortgage Lenders and Administrators Return (MLAR) which started being collected in 2007.
(1) See Section 3.3 of Bank of England (2016), ‘The Financial Policy Committee’s powersover housing policy instruments’, A draft Policy Statement;www.bankofengland.co.uk/financialstability/Documents/fpc/draftpolicystatement181116.pdf.

Part A The FPC’s approach to addressing risks from the UK mortgage market 7
has yet to be tested. But there is evidence of this channeloperating in the United States in the financial crisis. In thoseUS states that experienced the largest housing booms andbusts, at the peak of the market almost half of mortgageoriginations were associated with investors.(1)
The FPC has taken action to mitigate risks to bothborrowers’ and lenders’ resilienceGiven the importance of the UK mortgage market forfinancial stability, the FPC and the Bank have taken actionin recent years to mitigate risks to both borrowers’resilience, where this can impact broader economic activity,and to lenders’ resilience.
In June 2014, the FPC introduced two Recommendations,which: limit the proportion of mortgages with high LTI ratios;and promote minimum standards for how banks testaffordability for borrowers.
Also in 2014, following a Recommendation by the FPC,the Bank introduced annual stress tests of the UK bankingsystem.
In September 2016, the PRA published a SupervisoryStatement setting out its expectations for minimumunderwriting standards on buy-to-let mortgages, in particularon how lenders test affordability.
Parliament has also given the FPC powers of Direction,(2)
which can cover both owner-occupier and buy-to-letmortgage lending.
Table A.1 summarises the Bank’s toolkit to deal with risksfrom the UK mortgage market.
Insuring against risks to borrowers’ resilienceThe FPC’s Recommendations insure against a furthersignificant rise in the number of highly indebted householdsand a marked loosening in underwriting standards.
The ‘affordability test’ Recommendation was designed toinsure against a loosening in lenders’ standards for assessingmortgage affordability. It builds on the FCA’s rules thatrequire lenders to assess whether prospective borrowers couldafford their mortgage, taking into account their income,spending patterns and potential future interest rate increases.
At the time of the original Recommendation in 2014, mostmajor lenders tested whether prospective borrowers couldafford their mortgages assuming a stressed mortgage rate ofaround 7%. That compared with prevailing mortgagereversion rates(3) in the region of 4%–4½%. In order to insureagainst a relaxation of those standards, the FPC recommendedthat all mortgage lenders should assess whether borrowerscould still afford their mortgages if Bank Rate were to increaseby 3 percentage points — the idea being that this increasewould feed through to lenders’ reversion rates, to result in astressed mortgage rate in the region of 7%.
The affordability test can alternatively be interpreted asintroducing a ‘safety margin’ between current mortgagepayments and current incomes. This margin seeks to ensurethat the household sector is better able to withstandfluctuations in income and employment. Bank staff estimatethat the margin of safety created by assessing affordability
(1) See Haughwout, A, Lee, D, Tracy, J and van der Klaauw, W (2011), ‘Real estateinvestors, the leverage cycle, and the housing market crisis’, Federal Reserve Bank ofNew York Staff Report No. 514;www.newyorkfed.org/medialibrary/media/research/staff_reports/sr514.pdf.
(2) The FPC has two main powers. It can make Recommendations to anybody, includingto the PRA and FCA. It can also, where the Government has given the FPC a power ofDirection, direct the regulators to implement a specific measure to further the FPC’sobjectives.
(3) The reversion interest rate is the (typically floating) rate to which a mortgage revertsafter an initial contractual period that is often based on a fixed interest rate.
0.0
0.2
0.4
0.6
0.8
1.0
1.2
1.4
0
2
4
6
8
10
12
14
16
18
20
2000 01 02 03 04 05 06 07 08 09 10 11 12 13 14 15 16 17
£ trillionsPer cent
Owner-occupiers (right-hand scale)
Buy-to-let (right-hand scale)
Buy-to-let share (left-hand scale)
Chart A.13 The size of the buy-to-let segment of themortgage market has almost doubled since the periodbefore the crisisComposition of the outstanding mortgage stock(a)
Sources: Bank of England, Council of Mortgage Lenders and Bank calculations.
(a) Lending to owner-occupiers is calculated as outstanding lending to individuals secured ondwellings less outstanding lending secured on buy-to-let properties.
Table A.1 The Bank has an extensive toolkit to address risks fromthe UK mortgage market
Owner-occupier Buy-to-let
Loan to value policies Loan to value limit Loan to value limit
Affordability policies Loan to income limit* Affordability test* Affordability test* Interest coverage ratio limit Debt to income limit
Capital policies Stress-testing framework* UK countercyclical capital buffer (CCyB) rate*(a)
Sectoral capital requirements
* Policies marked with an asterisk are currently in place.(a) The CCyB is not a power of Direction, but the FPC is the designated authority to set the UK CCyB rate.
Colour scheme: FPC’s power of Direction FPC’s Recommendation PRA’s Supervisory Statement The Bank’s annual stress test is conducted under the guidance of the FPC and
the PRC.

8 Financial Stability Report June 2017
against a 300 basis point rise in Bank Rate is equivalent to thatneeded by the household sector to be better able to withstanda 2–3 percentage point rise in unemployment.(1)
The ‘LTI flow limit’ Recommendation limits the number ofmortgages extended at LTI ratios of 4.5 or higher to 15% of alender’s new mortgage lending. The 4.5 multiple wascalibrated to ensure that, at a stressed mortgage rate of 7%and a typical mortgage term of around 25 years, mortgagors’stressed DSRs would not exceed 35%–40%. That is the pointbeyond which the proportion of mortgagors that startexperiencing repayment difficulties can rise sharply(Chart A.6). The 15% flow at or above the 4.5 thresholdensures that access to high LTI mortgages remains for thoseborrowers who can afford it.
The affordability test and the LTI flow limit complementeach other in protecting households’ ability to service theirdebt. The affordability test effectively sets an LTI cap for eachborrower that depends primarily on the term of the mortgage,or ‘tenor’, and the borrower’s spending commitments. Therelationship between the effective LTI cap and the mortgageterm is illustrated in Chart A.14. The swathe reflectsvariations in the effective cap, depending on the borrower’sspending commitments and the precise stressed interest rateused by lenders to assess affordability.
For borrowers seeking a relatively short mortgage term, theaffordability test effectively places a lower cap on LTIs thanthe threshold implied by the LTI flow limit. This is because,at short tenors, a given loan amount will have higherdebt-servicing costs due to higher capital repayments.In 2016, less than 20% of new mortgages had a tenor offifteen years or less.
Chart A.14 also shows that the LTI flow limit can act as asimple backstop to the more complex affordability test: theLTI flow limit would be more likely to bind if mortgage termsincreased, or if lenders loosened the standards through whichthey assess affordability (eg the approach to accounting forother spending commitments). Other things equal, suchchanges would move the effective LTI cap implied by theaffordability test towards the top of the swathe.
The FPC judges that its Recommendations have hadonly a modest impact on mortgage lending to date.In November 2016, the FPC reviewed the twoRecommendations. The Committee assessed that, sincetheir introduction in June 2014, they had had only a modestimpact on mortgage lending, as lenders’ own underwritingstandards had not loosened. The Committee also judged thatthe Recommendations continued to insure against adeterioration in underwriting standards.(2) The Committeeretains both of these judgements.
LTI flow limit. In aggregate, lenders are advancing around 10%of new mortgages at LTIs at or above 4.5 (Chart A.15). Sothere remains headroom for further high LTI lending inaggregate. In February 2017, the PRA changed the relevantmeasure from a fixed quarterly limit to a four-quarter rollinglimit, which should further help lenders manage their businesspipeline.(3)
One feature of recent lending has been a ‘bunching’ of loansjust below the FPC’s 4.5 LTI limit. In part, this is likely torepresent some individuals being constrained to smaller loansthan they would have otherwise obtained. Bank staff estimatethe size of this impact to be small in aggregate: for example, ifthe share of borrowers with an LTI between 4 and 4.5 were tobe returned to its level before the FPC Recommendations weremade, and the remaining borrowers in that category were toobtain an LTI of 5 instead, the value of total mortgage lendingwould increase by less than 1%.
Affordability test. The impact of the FPC’s affordability test ismore difficult to assess because the total number ofprospective borrowers who fail the test is not directlyobservable. Nevertheless, in November 2016 the FPC judgedthat the Recommendation had not been excluding asignificant number of borrowers. This was based on an
0
1
2
3
4
5
6
7
0 5 10 15 20 25 30 35
Maximum LTI implied by FPC affordability test
FPC LTI flow limit
LTI
Mortgage term
Chart A.14 The affordability test and LTI flow limitcomplement each other in protecting householdsRelationship between the affordability test and the LTI flow limitin constraining lending(a)(b)
Source: Bank of England.
(a) Swathe for affordability test assumes borrowers have 30% to 50% of gross income availableto support mortgage repayments, and lenders assess affordability at stress interest rates of6.75% to 7%.
(b) The FPC flow limit restricts the share of new mortgages at LTIs of 4.5 or greater to 15%.(1) For example, analysis by Bank staff suggests that the proportion of households that
would have a DSR greater than 40% in the face of an interest rate shock of 300 basispoints is broadly equivalent to the proportion of households that would have a DSRgreater than 40% in the face of an unemployment shock of around 3 percentagepoints. And empirical relationships between aggregate arrears and macroeconomicvariables suggest that the proportion of households that would be in arrears ifinterest rates were to rise by 300 basis points is broadly equivalent to the proportionof households that would be in arrears if unemployment increased by just under 2%.
(2) See the November 2016 Report for a more detailed discussion of the impact of thepolicies; www.bankofengland.co.uk/Pages/reader/index.aspx?pub=fsrnov16&page=1.
(3) For further details on the PRA’s change, see Bank of England (2017), ‘Amendments tothe PRA’s rules on loan to income ratios in mortgage lending’, PRA Policy StatementPS5/17; www.bankofengland.co.uk/pra/Documents/publications/ps/2017/ps517.pdf.

Part A The FPC’s approach to addressing risks from the UK mortgage market 9
analysis of trends in mortgage applications and informationreceived from a sample of lenders, suggesting that thecalibration of the affordability test was not resulting in amaterial proportion of mortgage enquiries being rejected, evenprior to the formal application stage. Two further pieces ofevidence support this conclusion:
• First, while there has been a long-run trend towards longermortgage terms since the crisis, there has been noacceleration in that trend since the introduction of theaffordability test (Chart A.16). Were the policy to beexcluding a large number of prospective mortgagors,borrowers could seek to pass the test by lengtheningmortgage tenor, which lowers monthly repayments.
• Second, first-time buyers, who might have been expected tobe most affected by any measure that restricts loan sizerelative to income, have maintained their share of totalmortgage lending at around a third since 2014.
The FPC has further considered the possible impact of itsRecommendations in different hypothetical scenarios.The Committee judges that, in the event that they were tobecome more binding relative to lenders’ own underwritingstandards, their benefits would also increase. The FPCexpects them to remain in place for the foreseeable future.
As an example, in a hypothetical ‘upside’ scenario where aloosening of underwriting standards pushes mortgage lendinghigher and leads to an increase in the aggregate house price toincome ratio, the absence of policies would lead toa significant increase in the number of highly indebtedhouseholds. Specifically, the share of new mortgagesextended at an LTI multiple at or above 4.5 would be 40% bythe end of the scenario, compared with 13% if the policieswere in place (Chart A.17). Over time, this would lead to asignificant deterioration in the distribution of the stock ofhousehold debt.
The benefits of the FPC’s Recommendations under thisscenario include:
• By limiting the number of highly indebted households, thepolicies reduce the potential for cuts in consumption inresponse to adverse shocks. There are significantuncertainties around the relationship between householdindebtedness and cuts in consumption. But mappingestimates based on international evidence (Table A.2) ontothe distribution of debt with and without policies suggests
0
2
4
6
8
10
12
14
16
18
2005 06 07 08 09 10 11 12 13 14 15 16
Per cent of new mortgages
4 ≤ LTI < 4.5
LTI ≥ 4.5
LTI ≥ 5
Chart A.15 There remains headroom for further high LTIlending in aggregateFlow of new mortgages by LTI(a)(b)
Sources: FCA Product Sales Database and Bank calculations.
(a) The Product Sales Database includes regulated mortgages only.(b) LTI ratio calculated as loan value divided by the total reported gross income for all named
borrowers. Chart excludes lifetime mortgages, advances for business purposes andremortgages with no change in the amount borrowed.
0
10
20
30
40
50
60
70
2005 06 07 08 09 10 11 12 13 14 15 16 17
Per cent of new mortgages
Mortgage term ≥ 35
30 ≤ Mortgage term < 35
25 ≤ Mortgage term < 30
Chart A.16 There has been a long-run trend towardslonger mortgage terms, but no acceleration morerecentlyShare of new mortgages by mortgage term(a)(b)
Sources: FCA Product Sales Database and Bank calculations.
(a) The Product Sales Database includes regulated mortgages only.(b) Chart excludes lifetime mortgages, advances for business purposes and remortgages with no
change in the amount borrowed.
2016 Q4
0 2 4Loan to income ratio (LTI)
60.0
0.2
0.4
0.6Share of new mortgage lending
LTI = 4.5 (FPC flow limit)
2023 Q4 (no policy)
2023 Q4 (with policy)
Chart A.17 In an ‘upside’ scenario, the flow of mortgagelending would be skewed towards higher LTIs withoutFPC policies in placeLTI distribution of new mortgage lending(a)(b)
Sources: FCA Product Sales Database and Bank calculations.
(a) The Product Sales Database includes regulated mortgages only.(b) LTI distribution of new mortgage lending in 2016 Q4 and at the end of an ‘upside’ seven-year
scenario, with or without FPC Recommendations in place.

10 Financial Stability Report June 2017
that the fall in aggregate consumption in the event of anadverse shock could, in this scenario, be up to around 20%larger.
• By limiting the deterioration in the stock of household debt,the policies further reduce the probability that householdsdefault on their mortgages.
• Finally, the Recommendations can also reduce the size ofsome adverse shocks in the future. For example, bypreventing a marked loosening in underwriting standards,they reduce the risk of a self-reinforcing feedback loopbetween mortgage lending and house prices, which couldamplify any fall in house prices.
The macroeconomic costs of the FPC’s Recommendationsarise from their impact on housing market activity — andtherefore broader economic activity — in these scenarios.
• Because they constrain mortgage approvals in scenarios inwhich underwriting standards loosen, the FPC’s policies mayalso have some effect on consumer spending. For example,moving house is often associated with a greater propensityto purchase durable goods, such as furniture and householdappliances.(1) In the hypothetical ‘upside’ scenario, theRecommendations are estimated to reduce the level ofnominal GDP by around 0.2% by the end of the scenario.
• The Committee further judges that it is unlikely that arestriction on mortgage credit supply would have a materialeffect on the economy’s longer-term growth rate orproductive capacity. So the costs of the policies would betemporary, while the benefits of increased resilience wouldpersist.
In reaching its judgement, the FPC considered differentscenarios constructed by staff. These pointed to the benefitsof policy rising as it became increasingly binding relative tolenders’ own underwriting standards.
The FPC’s existing Recommendations cover theowner-occupier mortgage market. The FPC also has apower of Direction over interest coverage ratio (ICR)limits on buy-to-let mortgages. It has not yet used thispower as it judges that the PRA Supervisory Statementcurrently provides adequate insurance against aloosening of underwriting standards in the buy-to-letmarket (Box 3).
Insuring against risks to lenders’ resilienceThe FPC’s Recommendations protect the resilience oflenders by reducing the probability that new borrowers willdefault on their mortgages. They complement theframework of bank capital requirements, which seeks toensure that lenders can withstand sharp economicslowdowns, including large falls in house prices, whilecontinuing to lend.
Banks are required to hold more capital against riskier loans.(2)
For example, lenders allocate more capital to mortgages withhigher LTV ratios (Chart A.18) because, in the event of asevere house price fall, higher LTV ratios would result in largerlosses on defaulted mortgages.
The Bank’s stress-testing framework assesses whether bankshold enough capital to withstand a severe stress and continueto lend to the real economy. The ‘annual cyclical scenario’includes sharp falls in house prices (eg a 33% fall in the 2017scenario). These stress scenarios are more severe if risks fromthe housing and mortgage market are judged to haveincreased, other things equal.(3) And, for a givenmacroeconomic shock, losses in the stress test will increasewith the riskiness of lenders’ portfolios (eg due to more highLTV lending). Taken together, this leads to a countercyclicalcapitalisation of the banks, strengthening their resilienceagainst risks from the mortgage market.
Where stress tests show banks need bigger buffers of capitalto absorb the stress scenarios, the FPC can take action byraising the UK countercyclical capital buffer rate, and the
Table A.2 More highly indebted mortgagors made largerspending cuts during the crisisCuts in consumption between 2007 and 2009 among mortgagors withdifferent LTI ratios
LTI ratio United Kingdom(a) Denmark(b)(c) Norway(b)(d) (per cent) (per cent) (per cent)
0 to 1 -1.4 1.2 1.9
1 to 2 -4.2 1.9 -6.3
2 to 3 -7.0 1.0 -11.5
3 to 4 -9.8 -2.3 -21.3
4 to 5 -12.6 -5.8 -28.9
5 to 6 n.a. -7.9 n.a.
Sources: Andersen, Duus and Jensen (2014), Bunn and Rostom (2015), Fagereng and Halvorsen (2016) andBank calculations.
(a) Predicted change in non-housing consumption between 2006–07 and 2009–10 associated with mortgageLTI ratio in 2006–07. Estimated using a synthetic panel approach with a range of control variables. SeeTable 2 in Bunn, P and Rostom, M (2015), ‘Household debt and spending in the United Kingdom’,Bank of England Staff Working Paper No. 554;www.bankofengland.co.uk/research/Documents/workingpapers/2015/swp554.pdf.
(b) Average predicted change in consumption between 2007 and 2009 as a share of income in 2007 forhouseholds. LTI calculated using total mortgagor debt, including unsecured loans. Estimated usingeconometric analysis of household-level administrative data featuring a range of control variables.
(c) See Chart 4 in Andersen, A L, Duus, C and Jensen, T L (2014), ‘Household debt and consumption during thefinancial crisis’, Danmarks Nationalbank Monetary Review, 1st Quarter;www.nationalbanken.dk/en/publications/Documents/2014/03/Household_MON1_2014.pdf.
(d) See Fagereng, A and Halvorsen, E (2016), ‘Debt and household consumption responses’, Norges Bank StaffMemo No. 1; http://static.norges-bank.no/contentassets/1dae87a5ddd94b4d871712bcf8791196/staff_memo_1_2016.pdf. Figures provided by the author to allow comparison with Andersen, Duus andJensen (2014).
(1) See the box ‘The housing market and household spending’ on pages 18–19 of theNovember 2016 Inflation Report; www.bankofengland.co.uk/publications/Documents/inflationreport/2016/nov.pdf.
(2) Lenders have to be funded by capital in proportion to the risks they take. To computethe required amount of capital, lenders ‘risk weight’ their loans. They calculate riskweights either by using a ‘standardised approach’ set internationally or, if allowed bytheir national supervisor, by using their own risk parameters — the ‘internal ratingsbased’ (IRB) approach’.
(3) See Bank of England (2015), ‘The Bank of England’s approach to stress testing theUK banking system’; www.bankofengland.co.uk/financialstability/Documents/stresstesting/2015/approach.pdf.

Part A The FPC’s approach to addressing risks from the UK mortgage market 11
Prudential Regulation Committee (which is responsible forpromoting the safety and soundness of individual banks)(1)
can raise the regulatory capital buffers of individual lenders.
The FPC has not yet used its powers of Direction overLTV limits. The Committee judges that the measures inplace are proportionate to current risks (Box 4).
The FPC regularly reviews the calibration andimplementation of its Recommendations The FPC has withdrawn and replaced the affordability testRecommendation in order to promote consistency ofimplementation across lenders, with the aim of insuringagainst a future loosening in underwriting standards(Box 5). The new Recommendation states that:
When assessing affordability, mortgage lenders should apply aninterest rate stress test that assesses whether borrowers couldstill afford their mortgages if, at any point over the first five yearsof the loan, their mortgage rate were to be 3 percentage pointshigher than the reversion rate specified in the mortgage contractat the time of origination (or, if the mortgage contract does notspecify a reversion rate, 3 percentage points higher than theproduct rate at origination). This Recommendation is intendedto be read together with the FCA requirements aroundconsidering the effect of future interest rate rises as set out in
(1) On 1 March 2017, as the PRA ceased to be a subsidiary of the Bank and its functionswere fully transferred to the Bank, the PRA Board became the Prudential RegulationCommittee.
0
10
20
30
40
50
60
70
0–50 50–60 60–70 70–80 80–90 90–100 100+Mortgage LTV (per cent)
IRB weighted average ± 1 standard deviation(b)
IRB weighted average(c)
Per cent
Chart A.18 Lenders allocate more capital to mortgageswith higher LTV ratiosRisk weights on UK ‘prime’ mortgages by LTV(a)
Sources: PRA regulatory returns and Bank calculations.
(a) Chart shows risk weights on ‘prime’ mortgages calculated under the internal ratings based(IRB) approach; it excludes buy-to-let mortgages, which tend to have higher risk weights.Non-defaulted mortgages only.
(b) Shows ± 1 standard deviation based on the sample of lenders.(c) Average of UK lenders that use the IRB approach to calculate mortgage risk weights
(ten UK lenders including the six major lenders) weighted by exposure.
Box 3PRA Supervisory Statement on underwritingstandards for buy-to-let mortgages(1)
In 2016 the PRA undertook a review of lenders’ underwritingstandards in the buy-to-let market.(2) The review revealedthat some lenders were applying standards that weresomewhat weaker than those prevailing in the market as awhole. A number of lenders and other firms planned to growtheir gross buy-to-let lending significantly, so there was a riskthat competitive conditions would lead more firms to relaxunderwriting standards to implement their plans.
In response, the PRA Board issued a Supervisory Statementto clarify its expectations for underwriting standards in thebuy-to-let market. It set the baseline minimum stressedinterest rate to be used in the affordability test at the higher of5.5% or a 2 percentage point increase in buy-to-let mortgageinterest rates.
Although the stressed interest rate is lower than that appliedto owner-occupier mortgages in the FPC’s Recommendation,lenders tend to test affordability using ICR thresholds of atleast 125% (and, more recently, industry standards have beenmoving to 145% due to tax changes). So, effectively, theseaffordability assessments require borrowers’ expected
monthly rental income from the buy-to-let property toinclude at least a 25% buffer over the monthly mortgageinterest payment estimated using the stressed interest rateabove.
In addition, LTV ratios at origination in excess of 75% aremuch less common in buy-to-let than in owner-occupiermortgages; in 2016, they accounted for around 10% and 45%of new mortgages respectively. Buy-to-let loans thereforetypically start with a larger equity cushion, providing greaterresilience to credit risk for lenders.
The FPC considers that no action beyond the PRA SupervisoryStatement is warranted at this stage for macroprudentialpurposes. The growth of buy-to-let mortgage lending slowedsignificantly in April 2016 and has been weak since, due to thecombination of changes to stamp duty land tax, changes tomortgage interest tax relief and the implementation of thePRA Supervisory Statement. The FPC will continue to monitordevelopments in the buy-to-let market and any potentialthreats to financial stability.
(1) Bank of England (2016), ‘Underwriting standards for buy-to-let mortgage contracts’,PRA Supervisory Statement SS13/16; www.bankofengland.co.uk/pra/Documents/publications/ss/2016/ss1316.pdf. See the Record of the FPC meeting on 23 March 2016for more details on the FPC’s reaction to the PRA’s review; www.bankofengland.co.uk/publications/Documents/records/fpc/pdf/2016/record1604.pdf.
(2) The review assessed the lending plans of the top 31 lenders in the industry, whichrepresented over 90% of buy-to-let lending.

12 Financial Stability Report June 2017
Box 4Powers of Direction over LTV limits
The FPC has not yet used its powers of Direction overLTV limits, either for owner-occupier or buy-to-let mortgages.
High LTV lending primarily poses risks to lenders. Resilience oflenders to these risks is afforded by the Bank’s stress-testingframework, the broader capital regime and the FPC’s existingRecommendations.
The Committee is also mindful that the LTI flow limit caneffectively constrain the proportion of high LTV lending insome instances. An individual borrower’s LTI and LTV aremechanically linked through the house price to income ratio:
Mortgage loan =
Mortgage loan X
Value of house Income Value of house Income
So for a given house price to income ratio, the greater aborrower’s LTI, the greater their LTV.
Due to substantial variation in the ratio of house prices toincomes across different regions of the country, the LTI flowlimit will not constrain high LTV lending in all circumstances.For example, in the South East, where house prices are higherrelative to incomes, borrowers tend to have higher LTI ratios.Limits on high LTI lending effectively constrain high LTVlending too. In other regions, where house prices are lowerrelative to incomes, underwriting standards on LTI ratios areless constraining. This is illustrated in Chart A, which showsthat more mortgagors in London and the South East havehigher LTI ratios.
The FPC will keep under review the risks to lenders stemmingfrom high LTV mortgage lending. It could in future consider
employing LTV limits to insure against risks on owner-occupieror buy-to-let mortgages, as other macroprudential authoritieshave done in a number of countries.(1) However, the FPCjudges that the combination of stress testing and bank capitalrequirements, alongside its existing Recommendations in themortgage market, build a degree of lender resilience that isproportionate to current risks.
MCOB 11.6.18(2). This Recommendation applies to all lenderswhich extend residential mortgage lending in excess of£100 million per annum.
The FPC will continue to review the calibration of boththe affordability test and the LTI flow limit regularly.While the current policy package is likely to remain in place forthe foreseeable future, the FPC will continue to review thecalibration of the affordability test and LTI flow limit on aregular basis.(1) The following principles will guide its approachto considering the calibration of the policies in the future.
The FPC will review the calibration of the twoRecommendations together. The affordability test and theLTI flow limit complement one another. For a given mortgageterm and stressed mortgage rate, the two provide a broadly
equivalent constraint on the amount of borrowing prospectivemortgagors could take on relative to their incomes(Chart A.14). As Bank Rate rises in the future, the affordabilitytest could become more constraining on lending relative tothe LTI flow limit. The Committee therefore intends toconsider the balance between the two policies if and whenBank Rate rises to a level close to 1%.
The calibration of the policies will depend on the FPC’sjudgement around risks to both interest rates and incomes.Increases in Bank Rate lead to higher mortgage rates and, so,higher mortgage payments. Higher unemployment raises the
(1) For international evidence on the impact of macroprudential measures in the housingmarket, see Box 1 in Bank of England (2016), ‘The Financial Policy Committee’spowers over housing policy instruments’, A draft Policy Statement;www.bankofengland.co.uk/financialstability/Documents/fpc/draftpolicystatement181116.pdf.
LTV (per cent)
0
30
60
90
120Other UK regionsLondon and South East
0 5 10House price to income ratio
15 20
LTI = 4.5
LTIs increase with higher LTV and higher HPI
Chart A There is greater scope for an increase in mortgageLTVs in regions outside London and the South EastMortgages’ LTV ratio and house price to income ratio(a)(b)
Sources: FCA Product Sales Database and Bank calculations.
(a) The Product Sales Database includes regulated mortgages only.(b) The chart shows the house price to income ratio (HPI) and LTV combinations for a
representative sample of new mortgages (excluding remortgages) in 2016. It splits off Londonand the South East (red dots) from other UK regions (blue dots). Each dot represents amortgage. It also shows a constant-LTI line (LTI = 4.5) for various HPI and LTV combinations,reflecting their relationship: LTI = HPI * LTV. In London and the South East, where HPIs arehigher, limits on high LTI lending effectively constrain LTVs.
(1) The FPC has a duty to review its Recommendations at regular intervals and considerwhether they should remain in place or be withdrawn.

Part A The FPC’s approach to addressing risks from the UK mortgage market 13
probability that borrowers suffer a reduction to their income,reducing the available resources to meet mortgage costs.Both types of shock increase mortgagors’ DSRs, other thingsequal, and high DSRs have historically been associated withincreases in arrears rates and falls in consumption.
The FPC will draw upon a range of indicators to inform itsjudgements around risks to interest rates and incomes.These include, but are not limited to: the distance betweenvariables’ current values and their estimated equilibriumvalues; and historical and international evidence on the scaleof potential shocks. When assessing potential futurechanges to interest rates, the Committee is more likely tobe guided by slow-moving, ‘structural’ measures of interestrates than by market expectations of future interest rates.Given the long-term nature of mortgage contracts, it judges
that it would be imprudent to rely too heavily on potentiallyvolatile market-implied measures.
The FPC will consider the overall volume of mortgagelending in calibrating the LTI flow limit. The LTI flow limit isexpressed as a share of new mortgage lending. If the totalvolume of mortgage lending were to increase materially, theFPC could consider recalibrating the LTI flow limit to ensurethat the overall number of highly indebted households doesnot become excessively high.
Box 5The affordability test Recommendation
The new Recommendation states that lenders should testaffordability by considering a 3 percentage point increase intheir current reversion rate (for many lenders this is thestandard variable rate, or ‘SVR’), while the previousRecommendation stated that lenders should consider a3 percentage point increase in Bank Rate.
So far, lenders have been using a range of approaches tocalculate the stressed interest rate at which they testaffordability — so there has been a lack of consistency acrossthe market. Because the previous Recommendation wasexpressed as a 3 percentage point change in Bank Rate, it wasopen to different interpretations by lenders. For example,lenders could make different assumptions about whether theappropriate rate to use was the one at origination or thereversion rate. Indeed, there has been significant variationacross lenders on the stressed mortgage rate used to assessaffordability compared to their current SVRs. Around half ofthe mortgages extended in 2016 Q4 were tested using astressed interest rate of SVR plus 2.75–3.25 percentage points.About 30% of mortgages were tested at a lower rate, andabout 20% at a higher rate.
Lending conditions in the mortgage market are becomingeasier and competitive pressures in the market remain. Sothere is a risk that lenders loosen the standard at which theytest affordability, especially if there is significant scope forinterpretation of the policy.
The new Recommendation promotes consistency ofimplementation across lenders and insures against the risk ofloosening underwriting standards. It also ensures that
borrower affordability is tested in the event that the borroweris unable to refinance their mortgage at the end of thefixed-rate period, which is appropriate given that — in times ofstress — some borrowers may be unable to do.
Although the new Recommendation will require some lendersto increase the stressed interest rate at which they testaffordability, the aggregate impact on current mortgagelending is expected to be small. The amendment reinforcesthe insurance role of the FPC’s measures.
• In 2016 Q4, the average stressed rate (weighted by thevolume of new lending) was just over 6.8%. Bank staffestimate that with the new Recommendation it would havebeen just over 7%.(1)
• Bank staff’s central estimate is that, had the newRecommendation been in place in 2016, it would havereduced mortgage approvals by less than 0.5% relative tothe previous Recommendation, with a slightly larger impacton smaller lenders than on the major lenders.
• The aggregate impact on actual lending is estimated to besmall because, even if a lender increases its stressed interestrate, borrowers whose mortgage payments (calculated atthe stressed rate) are low relative to their incomes will stillpass the test.
Consistent with the LTI flow limit, the new affordability testRecommendation includes a ‘de minimis’ threshold (set at£100 million of mortgage lending per annum) that exemptssome lenders, to ensure proportionality.(2)
(1) The 2016 Q4 quarter has been chosen rather than the whole of 2016 to avoidcomparability issues due to the Bank Rate cut in August 2016.
(2) The FPC will monitor lending done by firms below this threshold.

14 Financial Stability Report June 2017
UK consumer credit
Consumer credit has been growing rapidly in recent years…Lending to individuals in the form of consumer credit grew by10.3% in the twelve months to April 2017. Though a littleslower than in 2016 Q4, this was close to its fastest annualgrowth rate since 2005.
Consumer credit has been growing much faster thanhousehold incomes in recent years (Chart A.19). During thatperiod, dealership car finance has seen the fastest expansion,though other forms of consumer credit (mainly credit cardsand personal loans) accounted for more than half of consumercredit growth in the past year. Around half of net consumercredit lending in the twelve months to April 2017 was frombanks, with major UK banks and smaller banks making broadlyequal aggregate contributions to the annual growth rate.Lenders expect to continue to grow their portfolios through2017, at the same time as real household income growth isexpected to remain particularly weak. For an overview of theconsumer credit market, see Box 6.
…reflecting a shift in the supply of credit…Strong consumer credit growth in recent years partly reflectsstructural changes in the provision of consumer finance,including a shift towards the use of dealership car finance.Technological changes, such as online shopping andcontactless cards, have also encouraged greater credit card usefor transactional purposes, with transactional credit cardbalances growing at broadly the same rate as overall creditcard balances between 2012 and 2016.
UK consumer credit has been growing rapidly. Loss rates on consumer credit lending are low atpresent. Partly as a result, banks’ net interest margins on new lending have fallen and major lendersare using lower risk weights to calculate the capital they need to hold. Other things equal, thesedevelopments mean lenders have less capacity to absorb losses. In this context, a review by the PRAhas found evidence of weaknesses in some aspects of underwriting and a reduction in resilience.
The FPC supports the intentions of the PRA and FCA to publish, in July, their expectations of lendersin the consumer credit market. Firms remain the first line of defence. Effective governance at firmsshould ensure that risks are priced and managed appropriately and benign conditions do not lead tocomplacency by lenders. The Bank’s annual stress test assesses banks’ resilience to risks in consumercredit. Given the rapid growth in consumer credit over the past twelve months, the FPC is bringingforward the assessment of stressed losses on consumer credit lending in the Bank’s 2017 annualstress test. This will inform the FPC’s assessment at its next meeting of any additional resiliencerequired in aggregate against this lending.
5
0
5
10
15
20
25
2013 14 15 16 17
Percentage points
Total consumer credit(b)
Credit card(b)
Dealership car finance(a)
Other (non-credit card and non-dealership car finance)(b)(d)Nominal household income growth(c)
+
–
Chart A.19 Consumer credit has been growing muchfaster than household incomesAnnual growth rates of consumer credit products and householdincome
Sources: Bank of England, ONS and Bank calculations.
(a) Identified dealership car finance lending by UK monetary financial institutions (MFIs) andother lenders.
(b) Sterling net lending by UK MFIs and other lenders to UK individuals (excluding studentloans). Non seasonally adjusted.
(c) Percentage change on a year earlier of quarterly nominal disposable household income.Seasonally adjusted.
(d) Other is estimated as total consumer credit lending minus dealership car finance and creditcard lending.

Part A UK consumer credit 15
Respondents to the Bank’s quarterly Credit Conditions Surveyreported a loosening of unsecured credit availability tohouseholds in every quarter from end-2012 to end-2016. Thispartly reflects intense competition among lenders, as reportedby market contacts, including those of the Bank’s Agents, andby major lenders in the Credit Conditions Survey.
Interest rates on new personal loans have fallen since 2013(Chart A.20), squeezing interest margins. Credit card lendershave been offering longer interest-free periods. The averageinterest-free period offered to new credit card customers onbalance transfer offers has doubled since 2011 (Chart A.21).
…and relatively benign economic conditions recently.The fall in pricing may also reflect lenders incorporating arelatively benign macroeconomic environment in theirassessment of risk. Loss rates on consumer credit lending arelow at present, with arrears rates on UK banks’ consumercredit books in 2016 materially lower than their post-crisisaverage. If lenders place undue weight when assessing risk onthe recent performance of loans, this could mask a build-up ofvulnerabilities in the consumer credit market.
These developments leave lenders more vulnerable to lossesin a stress…All else equal, falling interest margins mean that less interestincome is available for lenders to absorb losses on consumercredit lending. Average risk weights for consumer credit havealso fallen in recent years, reducing the loss-absorbing capitalrequired to fund these exposures (Chart A.22).(1)
Falling margins do not appear to have been accompanied by acorresponding improvement in the underlying credit quality ofnew lending. For example, qualitative responses to the Bank’sCredit Conditions Survey indicate that lenders have beenloosening their credit scoring criteria for non-credit cardunsecured lending since 2013. All else equal, this makes iteasier for households with lower credit scores to accessconsumer credit.
Joint Bank/FCA analysis of data from credit reference agenciesfurther shows a slight deterioration in credit scores on newconsumer credit lending between 2015 and 2017. Thisdeterioration has occurred despite the fact that credit scores— which are used as an input to underwriting decisions by anumber of lenders — can display elements of procyclicality. Ina benign macroeconomic environment, more borrowers canaccess credit and are able to make regular payments, leadingto an improvement in credit scores, all else equal.
The effects of any loosening in underwriting standards couldbe exacerbated by the rapid turnover of lenders’ consumercredit portfolios. As a result of short payment terms, the stock
0
2
4
6
8
10
12
14
2004 06 08 10 12 14 16
Percentage points
Personal loans cross-subsidised by PPI income in this period(c)
Chart A.20 Interest rates on new personal loans havebeen falling relative to risk-free ratesSpread between effective interest rates on new personal loans andBank Rate(a)(b)
Sources: Bank of England and Bank calculations.
(a) The Bank’s effective interest rate series are currently compiled using data from up to19 UK MFIs. Data are non seasonally adjusted.
(b) Effective rates are sterling-only monthly averages.(c) Income from cross-selling of payment protection insurance (PPI) substantially offset low
margins on personal loans during this period. For more details seewww.bankofengland.co.uk/publications/Documents/quarterlybulletin/qb100301.pdf.
5
10
15
20
25
30
35
40
45
2011 12 13 14 15 16 17
Maximum 0% balance transfer offer(b)
Average 0% balance transfer offer(c)
Number of months
0
Chart A.21 Credit card lenders are offering longerinterest-free periodsInterest-free periods of credit card balance transfer offers(a)
Sources: Moneyfacts and Bank calculations.
(a) Whole market end-month data, excluding values of zero and nil returns.(b) The maximum 0% balance transfer term available across all lenders.(c) The average 0% balance transfer term is the average of the maximum 0% balance transfer
term available for each lender.
(1) Risk weights have not fallen for firms using the standardised approach to risk weights.

16 Financial Stability Report June 2017
of most forms of consumer credit turns over much faster thanmortgages: at end-2016, around 75% of the major UK banks’outstanding personal loans had been issued in the previoustwo years, compared with about 30% of their mortgages(Chart A.23). The credit quality of the stock of lending cantherefore deteriorate quickly.
…and could pose a risk to lenders’ resilience.Consumer credit accounts for less than 10% of majorUK banks’ stock of lending to UK real-economy borrowers,compared with around 70% for mortgage lending. But losseson consumer credit are far higher than for mortgages. That isbecause, in the face of adverse shocks, borrowers are muchmore likely to default on their consumer credit loans thantheir mortgages. And as the majority of consumer creditlending is unsecured, lenders cannot rely on the value ofcollateral to cushion their losses. Over the past ten years,UK banks’ total write-offs on UK consumer credit lending havebeen ten times higher than on mortgages (Chart A.24).
Losses on consumer credit lending are highly correlated withchanges in unemployment (Chart A.25). In the 2016 stresstest, which included a 4.5 percentage point increase in theUK unemployment rate, stressed impairments onUK consumer credit exposures totalled around £18.5 billion.This compared with £11.8 billion of impairments forUK mortgages. Aggregate cumulative impairments onconsumer credit were 19% of total exposures in the five yearsof the stress scenario, compared with 1% for mortgages.
In this context, vigilance is warranted.The PRA has undertaken a targeted review into the creditquality of consumer credit lending, and the FCA has beenundertaking a review of its rules and guidance oncreditworthiness assessments used in the consumer creditmarket. The PRA review has found evidence of weaknesses insome aspects of underwriting and a reduction in resilience.The FPC supports the intentions of the PRA and FCA topublish, in July, their expectations of lenders in theconsumer credit market. Firms remain the first line ofdefence. Effective governance at firms should ensure thatrisks are priced and managed appropriately and benignconditions do not lead to complacency by lenders.
The Bank’s annual stress-test exercise assesses banks’resilience to risks in consumer credit. Given the rapidgrowth in consumer credit over the past twelve months, theFPC is bringing forward the assessment of stressed losseson consumer credit lending in the Bank’s 2017 annual stresstest. This will inform the FPC’s assessment at its nextmeeting of any additional resilience required in aggregateagainst this lending.
0
20
40
60
80
100
120
Credit card Other consumer credit
2014
2015
2016 Per cent
Chart A.22 Average consumer credit risk weights havefallen since 2014Major UK banks’ average risk weights on consumer creditexposures(a)
Source: Bank of England.
(a) Risk-weighted assets include both IRB and standardised exposures and are measured as apercentage of drawn balances for end-year periods 2014 to 2016.
0
25
50
75
100
Personal loans Mortgages
Pre-2015
2015
2016 Per cent
Chart A.23 The stock of consumer credit turns overquicklyEnd-2016 mortgage and personal loan portfolios of majorUK banks, by year of issuance(a)(b)(c)
Source: Bank of England.
(a) Personal loan calculations have been made using vintaged data.(b) Peer group for personal loan data is made up of the major UK banks, representing around
75% of the total UK market.(c) Peer group for mortgage data represents around 74% of the total UK market, and includes
the major UK banks.

Part A UK consumer credit 17
0
2
4
6
2 1 0 1 2
Annual write-off rate (per cent)(a)(b)
Percentage point change in the annual unemployment rate(twelve-month lag)
+–
Chart A.25 Consumer credit losses are highly correlatedwith changes in unemploymentHistorical relationship between changes in unemployment andwrite-offs on non-credit card consumer credit exposures
Sources: Bank of England, ONS and Bank calculations.
(a) Write-offs by UK MFIs on all currency other unsecured loans to UK individuals, expressed insterling. Write-offs are net of recoveries. Non seasonally adjusted.
(b) These series are calculated as annualised quarterly write-offs divided by the correspondingloans outstanding at the end of the previous quarter. These data are presented as annualseries using four-quarter averages.
0
10
20
30
40
50
60
70
80
90
100
1993 96 99 2002 05 08 11 14 17
Consumer credit(b)
Mortgages(c)Percentage share
Chart A.24 Consumer credit losses are far higher thanfor mortgagesUK banks’ sterling write-offs on lending to individuals(a)
Sources: Bank of England and Bank calculations.
(a) Write-offs of sterling lending by UK MFIs to UK individuals. Write-offs are net of recoveries.Non seasonally adjusted.
(b) Consumer credit consists of credit card lending and other unsecured lending (other loans andadvances) and excludes student loans.
(c) Lending secured on dwellings.

18 Financial Stability Report June 2017
Box 6Overview of the UK consumer credit market
In April 2017, the total stock of UK consumer credit was£198 billion. By comparison, the total amount of outstandingmortgage debt is around seven times larger at £1.3 trillion.Consumer credit accounts for less than 10% of UK banks’ stockof lending to UK real-economy borrowers, compared witharound 70% for mortgage lending. But it accounts for a muchhigher proportion of losses: since 2007, UK banks’ totalwrite-offs on UK consumer credit have been ten times higherthan on mortgages.
The consumer credit market can be divided into three broadcategories:
• Credit cards (34% of the stock of consumer credit).
• Dealership car finance (30% of the stock).
• ‘Other’ (36% of the stock), which is mainly made up ofpersonal loans. This category also includes overdrafts,peer-to-peer lending, store credit, and lending from creditunions and small non-bank money lenders such aspawnbrokers and payday lenders.(1)
The consumer credit market is highly diverse, with a widerange of products and lenders. But there are some commonfeatures across product types:
• Short terms: most consumer credit lending is at maturities offive years or less (apart from revolving facilities such ascredit cards or overdrafts).
• Higher interest rates: while interest rates vary considerablyacross product types, they are typically materially higherthan for mortgages. This reflects a lack of collateral for mostconsumer credit products, and is intended to compensatethe lender for the higher risk of losses.
• Fixed rates: most consumer credit products have interestrates that are fixed for the entire term of the loan.
Banks provide around 80% of lending in the credit card and‘other’ categories, but less than half of dealership car finance(Chart A).
Credit cardsThere are two main ways of using credit cards: ‘transactional’and ‘revolving’. Transactional credit card users repay their fullbalances at the end of the month, and so incur no interestpayments. Users with revolving balances roll over some oftheir debt from month to month, typically paying a relativelyhigh interest rate (around 20%) on this borrowing.
Some revolving credit card balances incur no interest. Under atypical ‘balance transfer’ offer, borrowers move existing debtonto a new card, in some cases paying an upfront fee. For a setperiod they then pay 0% interest on this balance, while payingdown a proportion of the outstanding balance (typically aminimum of 1% per month, plus nominal fees). At the end ofthe 0% offer period, interest is charged on any outstandingdebt at a standard rate. Other interest-free offers allowcustomers to accrue new debt at 0% interest for a period onnew purchases or money transfers.
The major UK banks have around £42 billion of outstandingcredit card lending — around 19% of their common equityTier 1 (CET1) capital.
Other consumer creditThe bulk of this category is made up of unsecured personalloans, which typically have a three to five-year maturity at afixed interest rate. Just over a quarter of personal loans aretaken out for the purposes of debt consolidation, with most ofthe remainder funding large purchases such as homeimprovements.
The major UK banks have around £41 billion of ‘other’consumer credit lending — around 19% of their CET1.
Dealership car finance‘Dealership car finance’ refers to loans offered to car buyers atthe point of sale. Traditionally, this takes the form of a hirepurchase agreement. Under a standard hire purchase, thecustomer pays a fraction of the car’s purchase price as adeposit, and takes out a loan to cover the rest, which is paid offwith interest in regular monthly instalments, amortising fully.
(1) The Bank’s headline measure of consumer credit excludes income-contingent studentloans.
Banks £24 billionNon-banks£34 billion
Banks £52 billion
Banks £62 billion
Personal loans,overdrafts andother lending£72 billion
Dealership carfinance£58 billion
Credit cards£67 billion
Non-banks£14 billion
Non-banks£10
billion
Chart A Composition of the stock of consumer credit,end-March 2017(a)(b)(c)
Sources: Bank of England, Finance & Leasing Association, published accounts andBank calculations.
(a) Banks include monetary financial institutions (MFIs) and, where identified, non-banksubsidiaries of UK MFIs.
(b) Excludes income-contingent student loans.(c) Numbers may not sum to totals because of rounding.

Part A UK consumer credit 19
‘Personal contract purchase’ (PCP) agreements are a type ofhire purchase agreement with lower monthly payments. Atthe end of the loan period customers have the option to makea pre-agreed ‘balloon payment’ or return the vehicle to thedealer. The size of this balloon payment is set when the loanis issued, based on the estimated value of the vehicle in theused car market at the end of the loan period.
Dealership car finance has been growing rapidly in recentyears, with an average annual growth rate of around 20%since 2012. The total stock of dealership car finance increasedby more than £30 billion over that period, representing threequarters of total growth in the stock of consumer credit.
This growth partly reflects a recovery in the car market: totalnew car registrations in 2016 were 30% higher than in 2012.It also reflects a structural shift in how cars are purchased.Around 85% of new car purchases used dealership car financein 2016, compared with about half in 2009. In particular, useof PCP agreements has grown rapidly (Chart B).
A significant share of dealership car finance is provided bysubsidiaries of global car manufacturers. Around half of thedebt funding for these subsidiaries comes from their parentcompanies, around a quarter from securitisation, with theremainder from bank lending.
Bank staff estimate major UK banks’ total exposures to UK carfinance to be around £20 billion, or 9% of CET1, comprising:
• Direct exposures — around £17 billion, or 8% of CET1. Thislargely represents lending by banks’ asset financesubsidiaries, which make loans to car buyers, arrangedthrough dealerships.
• Indirect exposures via lending to UK finance subsidiariesof car manufacturers — around £2 billion, less than 1% ofCET1.(1)
• Indirect exposures via holdings of asset-backed securitiesin banks’ liquid asset buffers — around £1 billion, less than0.5% of CET1.
Arrears rates on dealership car finance tend to be lower thanfor other forms of consumer credit. Unlike most otherconsumer credit, this lending is secured, with the vehicleacting as collateral. But the value of this collateral declinesover time, and is dependent on conditions in the used carmarket.
Exposures to PCP lending may be particularly sensitive tomarket conditions: if the borrower chooses to return the carat the end of the loan, and the value of the used car is lessthan the outstanding loan amount, the lender will make a loss.Lenders can seek to mitigate these risks by makingconservative assumptions about the future value of used cars,though these assumptions are inherently uncertain.
In a hypothetical scenario where car values at the end ofcontracts turn out to be 20% lower than expected by lendersat origination — and all PCP borrowers returned their vehicles— Bank staff estimate that market-wide PCP losses could be3%–6% of the total outstanding stock of car finance. Otherthings equal, if these loss rates were experienced on the majorUK banks’ dealership car finance portfolios, it would imply areduction of 2–7 basis points in major UK banks’ aggregateCET1 ratio.(2) That is, from a starting point of 13.92%, theratio would fall to 13.85%–13.90%. Market-wide losses wouldrise to 7%–10% of the outstanding stock in a more severescenario where car values at the end of contracts turn out tobe 30% lower than originally expected. If these loss rateswere applied to major UK banks’ portfolios, they would implya reduction of 7–11 basis points in their aggregate CET1 ratio.
0
10
20
30
40
50
60
70
80
90
100
0
2
4
6
8
10
12
14
16
18
20
2008 09 10 11 12 13 14 15 16
Personal contract purchase(a) (left-hand scale)Other dealership car finance lending (left-hand scale)Proportion of new car sales funded with dealership car finance(b)
(right-hand scale)
£ billions Per cent
Chart B Value of annual dealership car finance for newcar purchases, and proportion of private new carpurchases funded with dealership car finance
Sources: Finance & Leasing Association, Society of Motor Manufacturers and Traders (SMMT)and Bank calculations.
(a) Annual sterling gross lending to individuals on dealership car finance for new car purchasesprovided by Finance & Leasing Association members, attributed to personal contractpurchase (PCP).
(b) Annual transactions on dealership car finance for new car purchases provided byFinance & Leasing Association members, as a proportion of SMMT new car registrations.
(1) Major UK banks also have over £10 billion of lending to global car manufacturers, butthese exposures are less directly linked to the UK car market.
(2) Given direct exposures of £17 billion, a 5% loss rate implies a loss of £0.85 billion.

20 Financial Stability Report June 2017
Global environment
Near-term prospects for the global economy have improvedslightly…Since the November 2016 Report, the near-term globaleconomic outlook has improved slightly. In April, for the firsttime since 2011, the International Monetary Fund (IMF)revised up its forecast for world GDP growth in 2017, to 3.5%from 3.4% (Chart A.26). In May, the Monetary PolicyCommittee’s projection for average annual global GDPgrowth, weighted by countries’ share in UK exports, was 2½%in 2017–19. This is up from 2¼% in November, partly due tostronger growth prospects in the euro area.
The US Federal Open Market Committee raised its policy rateby 25 basis points in December, March and again in June.These increases were in line with market expectations andyields on US ten-year Treasury bonds have fallen by close to20 basis points since the November Report,(1) offsettingaround a third of the rise in US bond yields that followedimmediately after the US election. These developments havehelped to ease external financing pressures on emergingmarket economies (EMEs), though vulnerabilities from highlevels of debt remain.
…though geopolitical and policy uncertainties remain high.While uncertainty about the outlook for US fiscal policyremains, some other aspects of the new US administration’seconomic policy have become clearer. In particular, theagreement between the United States and China to liberalisebilateral trade in certain food products and financial services,and signs that the United States will seek to renegotiate,rather than withdraw from, the North American Free TradeAgreement have eased some immediate concerns about thefuture of the global trading system. Nevertheless, politicaland policy uncertainties, in particular about the prospects for alonger-term shift towards protectionism or for a weakening inglobal co-operation in financial regulation, remain high.
As home to the leading international financial centre, theresilience of the UK financial system depends in part on
Near-term growth prospects for the global economy have improved slightly and some possible riskshave not crystallised. But financial vulnerabilities in China remain pronounced as, although capitaloutflows have stabilised, economic growth continues to be accompanied by rapid credit expansion.In the euro area, bank equity prices have risen, reflecting expectations of stronger economic growthand further progress in strengthening banks’ capital positions.
(1) The data cut-off for the November Report was 18 November 2016.
0
2
4
6
8
10
12
1999
–200
7 17 18 17 18 17 18 17 18 17 18
1999
–200
7
1999
–200
7
1999
–200
7
1999
–200
7
World Emergingmarket anddevelopingeconomies
China Euro area United States
October 2016
April 2017
Pre-crisis averagePercentage changes on a year earlier
Chart A.26 Global growth projections have been revisedup slightly, though they are still below pre-crisis levelsInternational annual GDP growth projections
Sources: IMF World Economic Outlook (WEO) and Bank calculations.

Part A Global environment 21
standards applied in other jurisdictions. Absent consistentimplementation of standards internationally and appropriatesupervisory co-operation, the FPC will need to assess how bestto protect the resilience of the UK financial system.
In China, foreign reserves have stabilised and capitaloutflows have fallen…Pressure from persistent capital outflows from China haseased. The Institute of International Finance (IIF) estimatesthat the net outflow of capital from China was aroundUS$42 billion in the first four months of 2017, down fromaround US$250 billion in the previous four months. China’sofficial foreign exchange reserves were broadly stable in thefirst five months of 2017. This stabilisation appears to reflect acombination of tighter controls on capital movements by theChinese authorities, higher policy rates in China and aweakening in expectations of an appreciation in the US dollar.
…but credit has continued to grow rapidly.However, underlying vulnerabilities remain pronounced. Totalsocial financing, a broad measure of domestic private sectorcredit, rose by 15.4% in the year to May 2017;(1) totalnon-financial sector debt was estimated to be just under260% of GDP (Chart A.27). In addition to raising policy rates,the Chinese authorities have tightened bank regulation inorder to reduce leverage in the financial sector. This will pushup market rates further, making it more difficult for borrowersto service their debts. The authorities have also set a targetfor economic growth of ‘around 6.5% or higher’ in 2017, andcontinued credit growth is expected to be an important toolfor achieving this, making their task of reducing medium-termrisks to financial stability more challenging. If these risks wereto crystallise, economic growth in China would slow sharply,leading to a sharp fall in Chinese imports and weaker growthin its trading partners. This could have a larger effect globallythan previously, given that China is becoming a moreimportant trading partner for many economies (Chart A.28).
UK banks’ exposures to China and the closely linked economyof Hong Kong are large (around US$535 billion, 183% ofcommon equity Tier 1 capital, Chart A.29).
Other EMEs have seen a resumption of portfolio inflows.After a brief period of outflows in late 2016, there have beensubstantial inflows of non-resident portfolio capital to otherEMEs. Credit-GDP gaps and current account deficits in manyEMEs have also continued to narrow. However, external debt,often taken out by the private sector and denominated inUS dollars, remains high in many individual EMEs. This mayleave some countries like Turkey with weaker credit ratingsand high borrowing needs (the IMF projects that maturingexternal debt in Turkey will be nearly 20% of GDP each year in2017–19) exposed to a shift in risk appetite away from EMEs, a
0
10
20
30
40
50
0
50
100
150
200
250
300
2006 08 10 12 14 16
Non-financial sector(a) (right-hand scale)
Adjusted total social financing(b) (left-hand scale)
Headline total social financing(c) (left-hand scale)
Percentage changes on a year earlier Per cent of GDP
Chart A.27 Credit continues to grow rapidly in ChinaChina non-financial sector debt and growth of total socialfinancing
Sources: BIS total credit statistics, CEIC and Bank calculations.
(a) Non-financial sector debt data are to 2016 Q4. Includes lending by all sectors at marketvalue as a percentage of GDP, adjusted for breaks.
(b) Total social financing adjusted for net issuance of local government bonds.(c) The People’s Bank of China stock of total social financing used from December 2014
onwards. Prior to this the stock of total social financing is estimated using monthly ‘newlyincreased’ total social financing flows.
0 5 10 15 20
TaiwanHong Kong
MalaysiaKorea
SingaporeAustralia
South AfricaIndonesia
BrazilIndia
MexicoTurkey
JapanGermany
United StatesUnited Kingdom
2005
2011
Per cent of GDP
Chart A.28 Exports to China account for an increasingshare of value added in many countriesDomestic value added in exports to China
Sources: OECD Trade in Value Added database and Bank calculations.
(1) After adjusting for the statistical effect of replacing local government borrowingthrough financing vehicles with the issuance of municipal bonds.

22 Financial Stability Report June 2017
faster-than-expected rise in US interest rates or a renewedstrengthening in the US dollar.
UK banks’ exposures to non-China EMEs have fallen in recentyears and broadly matched those to China and Hong Kong in2017 Q1 (Chart A.29).
Pressures on the European banking system have eased butconcerns about profitability remain.Bank equity prices in continental Europe have continued torecover since the November Report. The improved economicoutlook is expected to increase the demand for credit and alsoto lead to lower provisions for non-performing loans; bothwill tend to raise bank earnings. In addition, successfulcapital-raising exercises by three major European banks,progress towards recapitalising some smaller Italian banks andthe orderly resolution of a domestically significant Spanishbank, have eased some immediate concerns about theresilience of the banking sector.
Euro-area banks’ common equity Tier 1 capital ratios aresignificantly higher than before the crisis. However,non-performing loans remain at high levels in severalEuropean countries (Chart A.30) and concerns about thelonger-term viability of some European banks’ businessmodels remain. In particular, the profitability of someEuropean banks appears to be lower than the cost of raisingnew capital, which could make it difficult for them to rebuildtheir capital positions if they were to be hit by adverse shocks.
Sovereign bond spreads in the euro area have fallen butgovernment debt is still high in several economies.Sovereign bond spreads in several euro-area Member Statesrose in early 2017, reflecting heightened uncertainty ahead ofelections in a range of countries. They have since fallen backas the parliamentary election in the Netherlands (March 2017)and the presidential election in France (May 2017) passedwithout major shocks to markets. However, government debtis still high in several euro-area economies. Italy, wheregovernment debt was 133% of GDP in 2016, remains aparticular concern. Risks from the euro area may also emergeas a consequence of the United Kingdom’s withdrawal fromthe European Union (see Box 2).
The FPC continues to assess UK banks’ ongoing resilience tothe risks stemming from China and the euro area in itsannual stress test. The 2017 stress test includes anextremely severe scenario for China in which Chinesegrowth slows from just under 7% at the end of 2016to -1.2% by the end of 2017, reflecting the scale of riskscreated by rapid credit expansion.
0
100
200
300
400
500
600
700
800
900
2005 07 09 11 13 15 17
Non-China emerging markets
China and Hong Kong
US$ billions
Chart A.29 UK banks’ claims on non-China EMEs havefallen back to broadly match those on China andHong KongUK-owned banking groups’ consolidated exposures to selectedcountries and regions
Sources: Bank of England and Bank calculations.
0 5 10 15 20
Core excludingGermany(c)
Peripheryexcluding Italy(b)
Scandinavia(a)
Germany
Italy
United Kingdom
Per cent
Chart A.30 Non-performing loan ratios are still high forbanks in some European countriesRatio of non-performing loans and advances to total loans andadvances (2016 Q4)
Sources: European Banking Authority and Bank calculations.
(a) ‘Scandinavia’ refers to banks in Denmark, Norway and Sweden.(b) ‘Periphery excluding Italy’ refers to banks in Ireland, Portugal and Spain.(c) ‘Core excluding Germany’ refers to banks in Austria, Belgium, France and the Netherlands.

Asset valuations
Part A Asset valuations 23
Long-term risk-free interest rates are at levels consistentwith pessimistic growth expectations and high perceivedtail risks…In the United Kingdom, ten-year real government bond yieldsare at around -2% (Chart A.31), and long-term real interestrates remain low across the G7. While reflecting, in part,monetary policy actions over most of the past decade, theselow interest rates — which are adjusted for compensation forinflation — also appear to be consistent with pessimisticgrowth expectations (despite recent improvements to thenear-term outlook), and high perceived tail risks. Thoseperceptions may in part be associated with a high degree ofgeopolitical uncertainty (see Global environment chapter). Ifsevere, but plausible, downside risks were to materialise, theycould lead to a sharp reduction in growth, increasing theattractiveness of longer-term government bonds relative tomore risky assets, such as equities and corporate bonds.(1)
…but measures of uncertainty implied by options prices arelow…Market-based measures of perceived risks in the near term —or implied volatilities — have been low by historical standardsacross a number of markets (Chart A.32). These measures arederived from the options used to insure against asset pricemoves. The current low level of these measures may suggestthat there is a relatively low expectation that geopolitical riskswill actually materialise, at least over short horizons. In June,the VIX measure of implied equity volatility, derived fromS&P 500 stock index option prices, reached its lowest levelsince 1993.
Long-term risk-free interest rates are at levels consistent with pessimistic growth expectations andhigh perceived tail risks. In contrast, measures of uncertainty implied by options prices are low.Some asset valuations, particularly for some corporate bonds and UK commercial real estate,appear to factor in a low level of long-term market interest rates but do not appear consistent withthe pessimistic and uncertain outlook embodied in these rates.
These asset prices are therefore vulnerable to a repricing, whether through an increase in long-terminterest rates or adjustment of growth expectations, or both. A sudden fall in asset prices could beamplified given reduced liquidity in some markets, particularly if some types of investors increasesales in response to price falls. The resilience of the UK banking system to these repricing risks isbeing assessed through the 2017 stress test.
(1) See Broadbent, B (2014), ‘Monetary policy, asset prices and distribution’;www.bankofengland.co.uk/publications/Pages/speeches/2014/770.aspx.
3
2
1
0
1
2
3
4
2006 07 08 09 10 11 12 13 14 15 16 17
United Kingdom
United States
Euro area
Per cent
+
–
Chart A.31 Advanced-economy risk-free real interestrates remain close to historically low levels International ten-year real government bond yields(a)
Sources: Bloomberg and Bank calculations.
(a) Zero-coupon bond yields derived using inflation swap rates. UK real rates are definedrelative to RPI inflation, whereas US and euro-area real rates are defined relative to CPI andHICP inflation respectively.

24 Financial Stability Report June 2017
These very low levels of market volatility could be supportedby improvements in the near-term economic outlook, andexpectations that the pace of monetary policy normalisation,which is already under way in the United States, will begradual. Increased use by investors of strategies that sellinsurance against a rise in volatility, for which they get paid apremium, may have further contributed to the most recentreduction in measures of volatility.
The low volatility environment could incentivise behaviourthat leads to risk-taking and higher leverage, which wouldbuild up risks and fragilities in the financial system.
…and some asset valuations appear inconsistent with thepessimistic and uncertain outlook embodied in long-termmarket interest rates. In corporate bond markets, returns appear low relative to therisk borne by investors, offering little compensation fordownside risks. For example, corporate bond spreads arecompressed, most notably in the riskier high-yield sector(Chart A.33). In the United States, this compression inspreads has been accompanied by elevated levels of corporateleverage. Non-price terms for corporate borrowing have alsoeased: in both Europe and the United States, the share ofleveraged lending deals with weaker covenants — whereinvestors accept fewer safeguards in the event of adeterioration in the debtor company’s finances — hasincreased to over 70% in the first five months of 2017, fromless than 5% in 2010.
In the United Kingdom, real interest rates have fallen further,which does not appear to be reflected in some risky assetprices…In the United Kingdom, long-term risk-free real interest rateshave fallen by 26 basis points since the previous Report,compared with a smaller fall in euro-area rates, and broadlyunchanged US real rates (Chart A.34). These developmentssuggest investors may be factoring in a higher probability of anadverse outcome for the UK economy.
That probability of an adverse outcome does not, however,appear to be reflected in some risky asset prices. Spreads onsterling investment-grade corporate bonds, for example, arecompressed relative to historical averages and high-yieldspreads are close to post-crisis lows.
…including in the UK commercial real estate market…Valuations in some segments of the UK commercial real estate(CRE) sector also continue to appear stretched. Aggregateprices rose by 0.9% on the quarter in 2017 Q1, leaving thembroadly flat on a year earlier, despite a sharp fall in the quarterfollowing the UK referendum on EU membership. CRE rentalyields remain low by historical standards, suggesting thatfuture rental income expectations embody growth prospects
0
500
1,000
1,500
2,000
2,500
3,000
2000 02 04 06 08 10 12 14 16
US dollar
Euro
Sterling
Basis points
Dashed lines: averages since 2000
Chart A.33 Spreads on high-yield corporate bonds arecompressed relative to past averages High-yield corporate bond spreads(a)
Sources: Bank of America Merrill Lynch Global Research and Bank calculations.
(a) Option-adjusted spreads. The US dollar series refers to US dollar-denominated bonds issuedin the US domestic market, while the sterling and euro series refer to bonds issued indomestic or eurobond markets in the respective currencies.
3
2
1
0
1
2
3
4
5
6
7
8
US$/€ FTSE 100 S&P 500 UK rates US rates
Interquartile range since 2000
Data for 16 June 2017
Standard deviations from averages since 2000
Historical range since 2000
US$/£
+–
Chart A.32 Implied volatilities are low across a range offinancial marketsDispersion in implied volatilities in foreign exchange, interest rateand equity markets(a)
Sources: Barclays Live, BBA, Bloomberg, Chicago Mercantile Exchange, NYSE ICE andBank calculations.
(a) Three-month implied volatilities for exchange rates, equities and ten-year interest rates.

Part A Asset valuations 25
that are inconsistent with those embodied in the low risk-freerates by which they are being discounted.
…which is therefore vulnerable to repricing.A range of sustainable valuations in the CRE market can begenerated using a valuation model based on a number ofassumptions, including about CRE rental yields.
Based on this approach, current prices lie at the top end of therange of sustainable valuations (the blue range in Chart A.35),which is consistent with persistently low rental yields.
Were rental yields to return to their historical averages, thiswould suggest that current prices are above estimatedsustainable valuation levels (the lower bound of the blue rangein Chart A.35). This would be consistent with either anincrease in long-term risk-free interest rates or an adjustmentof risk premia and medium-term rental growth expectations,or both.
Some segments of the CRE market appear more stretchedthan the aggregate picture. For example, current LondonWest End office prices are well above the range of estimatedsustainable valuation levels (the orange range in Chart A.35).Consensus forecasts from the Investment Property Forum,published in March, point to average price falls of around0.7% for aggregate UK CRE and 6.0% for London West Endoffices by end-2018.
An adjustment in asset prices could be amplified by thebehaviour of some investors, which would affect the supplyof credit to the real economy.Any adjustment in asset prices could be amplified, givenreduced liquidity in some markets, particularly if someinvestors behave procyclically — that is, if they sell risky assetsin large quantities purely in response to a reduction in theperformance of their portfolios. A range of assets, includingUK CRE, are held in open-ended investment funds, some ofwhich allow investors to redeem their investments on a dailybasis. The structure of these funds could create incentives forinvestors to redeem ahead of others, for example if investorsremaining in a fund were to bear some of the costs of meetingredemptions.(1) This could test market liquidity (seeMarket-based finance chapter).
In corporate bond markets, the amount held by open-endedinvestment funds has increased substantially in recent years,outpacing growth in the global market. Firms have also beenissuing longer-term bonds. While this locks in financing for alonger period of time, it can mean that bondholders areexposed to larger movements in prices in the event of a sharprise in interest rates. In addition, at low interest rates, the
(1) For further discussion see pages 23–25 of the December 2015 Financial StabilityReport; www.bankofengland.co.uk/publications/Documents/fsr/2015/dec.pdf.
40
50
60
70
80
90
100
110
120
130
140
150
03 05 07 09 11 13 15 17
Indices: 2007 Q2 = 100
2001
London West End office pricesAggregate
CRE prices
Ranges of sustainable valuations(a)
Upper part of ranges: low rental yields persist. Lower part of ranges: rental yields rise, consistent with a fall in rental growth expectations or a rise in risk premia.
Chart A.35 UK commercial real estate prices lookstretched based on ranges of sustainable valuationsCommercial real estate prices in the United Kingdom and rangesof sustainable valuations
Sources: Bloomberg, Investment Property Forum, MSCI Inc. and Bank calculations.
(a) Sustainable valuations are estimated using an investment valuation approach and are basedon an assumption that property is held for five years. The sustainable value of a property isthe sum of discounted rental and sale proceeds. The rental proceeds are discounted using a5-year gilt yield plus a risk premium, and the sale proceeds are discounted using a 20-year,5-year forward gilt yield plus a risk premium. Expected rental value at the time of sale isbased on Investment Property Forum Consensus forecasts. The range of sustainablevaluations represents varying assumptions about the rental yield at the time of sale: eitherrental yields remain at their current levels (at the upper end), or rental yields revert to their15-year historical average (at the lower end). For more details, see Crosby, N and Hughes, C(2011), ‘The basis of valuations for secured commercial property lending in the UK’, Journal ofEuropean Real Estate Research, Vol. 4, No. 3, pages 225–42.
0.5
0.4
0.3
0.2
0.1
0.0
0.1
United Kingdom United States Euro area
Percentage points
Real
Inflation
Nominal
+
–
Chart A.34 The causes of changes in nominalgovernment bond yields differ across economiesChanges in nominal ten-year interest rates since theNovember Report(a)(b)
Sources: Bloomberg and Bank calculations.
(a) Zero-coupon rates derived from government bonds. The contribution of real rates andimplied inflation to the change in nominal rates is calculated using inflation swaps, whichreference RPI for the United Kingdom, CPI for the United States and HICP for the euro area.
(b) Shows changes in interest rates between 18 November 2016 and 16 June 2017.

26 Financial Stability Report June 2017
0
100
200
300
400
500
600
700
2000 02 04 06 08 10 12 14 16
US$ billions
Chart A.36 Interest rate risk related to corporate bondmarkets has increasedEstimated losses in global corporate bond markets following a100 basis point increase in interest rates(a)
Sources: Barclays Live, Thomson Reuters Datastream and Bank calculations.
(a) The chart is a measure of how aggregate risk exposures to corporate bond markets globallyhave risen over time. It is calculated based on the Barclays Global Aggregate CorporateBond Index, which can be used as a representative measure of global investment-gradecorporate bond markets. However, the index does not capture all investment-gradecorporate bonds. The measure has been inflation-adjusted, with prices indexed toJanuary 2017.
responsiveness of corporate bond prices to shocks will tend tobe higher. Together, these factors mean that the losses thatwould be incurred given a 100 basis point rise in interest ratesin global corporate bond markets, all else equal, haveincreased markedly over the past few years (Chart A.36).Such higher losses could increase the likelihood of investorsexhibiting procyclical behaviour and therefore magnifyingprice falls.
In the limit, the supply of credit to the real economy, andtransfer of risk to those who are best placed to manage it,could be impaired. CRE is widely used as collateral forcorporate borrowing. An amplified downturn in the CREmarket could be transmitted to the real economy by reducingcompanies’ access to bank loans and their ability to undertakenew investment. Research by Bank staff suggests that every10% fall in UK CRE prices is associated with a 1% decline ineconomy-wide investment.(1)
A sharp fall in asset prices could further adversely impact thebalance sheets of banks and other financial institutions at thecore of the financial system.
UK banks have more than halved their stock of CRE lendingsince the crisis (Chart A.37). The total stock of UK banks’ CRElending fell from around £160 billion at end-2008 to around£77 billion at end-2016. For large UK banks involved in the2017 stress test,(2) their exposures to the CRE sector averagedaround 50% of common equity Tier 1 capital at end-2016.And the 2016 stress test demonstrated that they have becomemore resilient to stresses in the CRE market.
The Bank’s 2017 annual cyclical stress-test scenario willassess the resilience of the banking system to an increase involatility, a reduction in market participants’ appetite forrisk, and falls in asset prices, including a 40% fall in UK CREprices.
The FPC continues to emphasise the importance of marketparticipants recognising the distribution of risks in differentasset classes, managing them prudently, and pricing themaccordingly.
(1) Bahaj, S, Foulis, A and Pinter, G (2016), ‘The residential collateral channel’, Centre forMacroeconomics Discussion Paper CFM-DP2016-07.
(2) The figure includes gross on balance sheet exposures as well as committed creditlines, and exposures booked in Jersey and Guernsey. Standard Chartered Bank isexcluded, as it has minimal UK CRE exposures.
UK banks and building societies
International banks
Insurance companies
Other non-bank lenders
0
50
100
150
200
250
300
2004 05 06 07 08 09 10 11 12 13 14 15 16
£ billions
Chart A.37 UK banks’ stock of CRE lending has morethan halved since the crisis UK CRE debt reported to De Montfort University survey(a)
Sources: De Montfort University and Bank calculations.
(a) The composition of the survey sample was altered as follows: a category for insurancecompanies was created in 2007, and another one for non-bank lenders in 2012. Thecategory of insurance companies includes only UK insurers from 2007 to 2011, and allinsurers from 2012 onwards. Data exclude commercial mortgage-backed securities.

Banking sector resilience
Part B Banking sector resilience 27
The UK banking system remains resilient. The aggregate Tier 1 capital position of major UK bankswas 15.7% of risk-weighted assets in March 2017. The FPC intends to set the minimum leveragerequirement for major UK banks at 3.25% of non-reserve exposures, subject to consultation. This isintended to offset the impact of removing central bank reserves from the leverage ratio exposuremeasure, and restore the original level of resilience delivered by the leverage ratio standard. TheUnited Kingdom is on course to ensure that, by 2022, any remaining barriers to the resolvability ofthe largest UK banks have been removed, and to implement ring-fencing requirements by 2019.Work is also ongoing to build resilience to cyber risks.
UK banks’ funding costs remain low, and equity prices have recovered over the past year. However,price to book ratios remain low, reflecting continued headwinds from misconduct costs and lowinvestment banking returns. Weak profitability diminishes banks’ future ability to rebuild capitalfollowing a shock that incurs losses. The exploratory scenario in the 2017 stress test will considerhow the resilience of the UK banking system might evolve if recent headwinds to bank profitabilitypersist and intensify.
The UK banking system remains resilient.UK banks have continued to strengthen their capital positions.In aggregate, the major UK banks had a common equity Tier 1 (CET1) ratio of 13.9% of risk-weighted assets in March 2017 (Chart B.1), and a total Tier 1 capital ratio of15.7%. This CET1 ratio is 40 basis points higher than at thetime of the November 2016 Report, when the FPC judged that,as a consequence of the 2016 stress test, the UK bankingsystem was, in aggregate, capitalised to support the realeconomy in a severe macroeconomic stress. On a non risk-weighted basis, the major UK banks’ aggregate leverageratio was 5.3% of total exposures in March 2017, comparedwith total requirements and buffers of 3.3% (Chart B.2).
UK banks’ liquidity and funding positions are also robust. Formajor UK banks, the aggregate ratio of liquid assets topotential net outflows under stressed conditions (known asthe Liquidity Coverage Ratio) was 128% in March 2017. Andall major UK banks have sufficient stable funding to meet theproposed Net Stable Funding Ratio (NSFR) requirement.(1)
Since 2014, the FPC has been contributing to the Bank’sannual review of the Sterling Monetary Framework (SMF),with members giving views on whether the SMF’s liquidityinsurance facilities remained fit for purpose from a
(1) The implementation date for the NSFR in the European Union is still to be confirmed.
2
4
6
8
10
12
14
16
18
20
0
2
4
6
8
10
12
14
16
2001 02 03 04 05 06 07 08 09 10 11 12 13 14 15 16 17
Per centPer cent
Basel III common equity Tier 1 (CET1) weighted average(c)(d) (right-hand scale)
Basel II core Tier 1 weighted average(a)(b)(c) (left-hand scale)
CET1 ratio adjusted for 2016 stress-test losses(e) (right-hand scale)Basel III definition of capital
Chart B.1 Major UK banks have continued to strengthentheir capital positionsMajor UK banks’ capital ratios
Sources: PRA regulatory returns, published accounts and Bank calculations.
(a) Major UK banks’ core Tier 1 capital as a percentage of their risk-weighted assets. Major UKbanks are Banco Santander, Bank of Ireland, Barclays, Co-operative Banking Group, HSBC,Lloyds Banking Group, National Australia Bank, Nationwide, RBS and Virgin Money. Dataexclude Northern Rock/Virgin Money from 2008.
(b) Between 2008 and 2011, the chart shows core Tier 1 ratios as published by banks, excludinghybrid capital instruments and making deductions from capital based on FSA definitions.Prior to 2008 that measure was not typically disclosed; the chart shows Bank calculationsapproximating it as previously published in the Report.
(c) Weighted by risk-weighted assets. (d) From 2012, the ‘Basel III common equity Tier 1 capital ratio’ is calculated as common equity
Tier 1 capital over risk-weighted assets, according to the CRD IV definition as implemented inthe United Kingdom. The Basel III peer group includes Barclays, Co-operative Banking Group,HSBC, Lloyds Banking Group, Nationwide, RBS and Santander UK.
(e) CET1 ratio less the aggregate percentage point fall projected under the Bank of England’s2016 annual cyclical stress scenario for the six largest UK banks.

28 Financial Stability Report June 2017
macroprudential perspective. As part of the Bank’s 2017review, at its March meeting the FPC reviewed developmentsin the SMF over the previous year. These included theadditional indexed long-term repo operations that the Bankhad announced prior to the EU referendum, and the increasednumber of SMF participants over the course of the year. In theFPC’s view, and given developments in the SMF since theBank’s 2016 review, the SMF remained fit for purpose from amacroprudential perspective. The Bank’s 2017 annual reviewof the SMF will be published alongside the Bank’s forthcomingAnnual Report.(1)
Consistent with its previous commitment, the FPC isrestoring the level of resilience delivered by its leverage ratiostandard…In July 2016, the FPC excluded central bank reserves from themeasure of banks’ exposures used to assess their leverage.This change reflected the special nature of central bankreserves and was designed to avoid a situation in which theCommittee’s leverage standards impeded the transmission ofmonetary policy. The FPC committed last year that it wouldmake an offsetting adjustment to ensure that the amount ofcapital needed to meet the UK leverage ratio standard wouldnot decline. The FPC did not intend for there to be apermanent loosening of the standard. At its June 2017meeting, the FPC therefore agreed to consult on a draftRecommendation to the PRA that it amend its rules on theleverage ratio to:
(i) exclude from the calculation of the total exposure measurethose assets constituting claims on central banks, wherethey are matched by deposits accepted by the firm that aredenominated in the same currency and of identical orlonger maturity; and
(ii) require a minimum leverage ratio of 3.25%.
By raising the minimum leverage standard from 3% to 3.25%on the revised exposure measure, the FPC intends to ensurethat the original level of resilience is restored, while alsopreserving the benefits of excluding central bank reserves fromthe exposure measure. The FPC and PRA consultations onthese proposals will run from 27 June to 12 September 2017.
The Committee will further consider the impact of changes tointernational standards on the calibration of the UK capitaland leverage framework. These changes include:
• the finalisation of Basel III; and• the implementation of IFRS 9, due to come into effect in
2018.
(1) A ‘Concordat’ between the FPC and the Bank’s Executive, describing the role of theFPC in relation to the SMF, was first published in 2013. At its 2017 Q2 meeting, theFPC agreed a small number of updates to the Concordat, designed to clarify the FPC’sinvolvement in SMF decision-making. The MPC SMF Concordat is being updated inparallel. The updated concordats will replace the 2013 versions published on theBank’s website.
1
2
3
4
5
6
7
0
1
2
3
4
5
6Per centPer cent
2001 02 03 04 05 06 07 08 09 10 11 12 13 14 15 16 17
Weighted average Basel III definition(b)(c) (right-hand scale)
Weighted average(a)(b)
(left-hand scale)Adjusted leverage ratio(d) (right-hand scale)Basel III definition of capital
Chart B.2 Leverage ratios have strengthenedMajor UK banks’ leverage ratios
Sources: PRA regulatory returns, published accounts and Bank calculations.
(a) Prior to 2012, data are based on the simple leverage ratio defined as the ratio ofshareholders’ claims to total assets based on banks’ published accounts (note a discontinuitydue to introduction of IFRS accounting standards in 2005, which tends to reduce leverageratios thereafter). The peer group used in Chart B.1 also applies here.
(b) Weighted by total exposures.(c) The Basel III leverage ratio corresponds to aggregate peer group Tier 1 capital over aggregate
leverage ratio exposure. Up to 2013, Tier 1 capital includes grandfathered capitalinstruments and the exposure measure is based on the Basel 2010 definition. From 2014 H1,Tier 1 capital excludes grandfathered capital instruments and the exposure measure is basedon the Basel 2014 definition. The Basel III peer group used in Chart B.1 also applies here.
(d) Estimated leverage ratio for the major UK banks excluding central bank reserves from theexposure measure. Data are 2017 Q1 for all firms except Co-operative Banking Group(2016 Q4).

Part B Banking sector resilience 29
…and the United Kingdom is on course to ensure that, by2022, any remaining barriers to the resolvability of thelargest UK banks have been removed… A core element of global regulatory reform has been ensuringthat banks can fail safely, without interrupting the provision offinancial services or requiring publicly funded bailouts.Significant progress has been made to remove barriers toresolvability but there is still more to do. The United Kingdomnow has a comprehensive and effective bank resolutionregime, under which the Bank has a wide toolkit, including thepower to ‘bail in’ the shareholders and creditors of failedbanks. This requires banks to maintain a minimum amount ofloss-absorbing resources known as ‘minimum requirements forown funds and eligible liabilities’ (MREL). In May 2017, theBank published estimates of the amount of MREL that thelargest UK banks and building societies will be required tomaintain when requirements are implemented in full in2022.(1)
Based on these indicative estimates, the largest UK banks willbe required by 2022 to have aggregate loss-absorbingresources of 28% of risk-weighted assets on average.(2)
Around half of this will be in the form of Tier 1 capital that canabsorb losses before resolution. Large UK banks have issuedaround £70 billion of senior unsecured holding company debtover the past two years, which can readily be bailed in. TheBank estimates that these banks will need to issue around anadditional £150 billion of MREL-eligible instruments to meetthe indicative 2022 requirements.(3) With a view to furtherincreasing transparency about the resolvability of firms, theBank intends to provide summaries of major UK banks’resolution plans and its assessment of their effectiveness,including any further steps that need to be taken, by 2019.(4)
…while firms are on track to implement their ring-fencingplans by 2019. The largest UK banks are in the process of separating their coreretail banking activities into ‘ring-fenced banks’ (RFBs), withinvestment and international banking activities situatedoutside the ring-fence. Ring-fencing will deliver significantfinancial stability benefits, by protecting core retail bankingactivities from risks associated with activities such asinvestment banking, and by enhancing the resolvability oflarge banking groups.
(1) Refers to the four UK global systemically important banks (G-SIBs) — Barclays, HSBC,RBS and Standard Chartered — plus Lloyds Banking Group, Nationwide andSantander UK.
(2) This includes Basel III capital buffers, and assumes a 1% countercyclical capital buffer.(3) As a firm’s MREL will depend upon its going concern requirements in a particular year,
the 2022 MRELs are simply indicative and are based on the calibration methodologyset out in the Bank’s Statement of Policy, with reference to the firms’ minimumcapital requirements and balance sheets as at December 2016.
(4) For more details on the UK bank resolution framework, see the Bank’s response to theTreasury Committee’s inquiry into capital, available atdata.parliament.uk/writtenevidence/committeeevidence.svc/evidencedocument/treasury-committee/capital-and-resolution/written/69208.pdf.

30 Financial Stability Report June 2017
All relevant firms are already implementing their plans tomeet the statutory deadline of 1 January 2019, thoughsignificant further work remains to be done.
Implementation of ring-fencing carries operational risks. Firms will need to ensure customers are served, and productsand services provided, from separate legal entities. This willinvolve some major reorganisations and transfers, includingmoving a large number of customers to new sort codes overthe next year. Some IT systems will be separated and directaccess will need to be established for RFBs to financialinfrastructure, such as clearing and payment systems. Firmshave plans in place to mitigate the risk of disruption toessential financial services during this process, and the PRA ismonitoring the implementation of ring-fencing closely.
Work is also ongoing to build cyber resilience. Cyber attacks pose a serious threat to the resilience of the UK financial system. At its June 2017 meeting, the FPCreviewed progress by the UK authorities and financial sector in building cyber resilience, and decided to withdraw its June 2015 Recommendation on CBEST vulnerability testing.The FPC has also set out its approach to assessing cyberresilience in the future. These assessments are set out in Box 7.
Market indicators support a view that UK banks areresilient…Reflecting the overall resilience of the UK banking sector, bankfunding costs have remained low since the November Report(Table B.1). Credit default swap (CDS) premia, which measurethe cost of insuring against bank default, are now close topost-crisis lows, at just under 60 basis points. And spreads onadditional Tier 1 (AT1) instruments — bonds that convert toequity if a bank’s capital ratio falls below a certain level — areat their lowest level on record. The market for European(including UK) banks’ AT1 instruments has made a strongrecovery following turbulence in February 2016; marketcontacts attribute this to an improving economicenvironment, a perceived fall in European political risks andchanges in the regulatory treatment of AT1 in Europe.
…and the Bank's Term Funding Scheme has helped to ensure lending rates have fallen in line with Bank Rate since July 2016…In August 2016, the Monetary Policy Committee (MPC) cutBank Rate to 0.25%, and launched a Term Funding Scheme(TFS) to provide funding for banks at interest rates close toBank Rate. The TFS was intended to reinforce thetransmission of the cut in Bank Rate to the real economy. In addition, the TFS provides participants with a cost-effectivesource of funding to support additional lending to the realeconomy, insuring against the risk that conditions tighten in bank funding markets.
Domestically focused banks(c)
Internationally focused banks(b)
FTSE All-Share
40
60
80
100
120
140
160
Jan. Apr. July Oct. Jan. Apr.2016 17
EU referendum
Indices: 1 January 2016 = 100
Chart B.4 Share prices have recovered since their mid-2016 lowsUK banks’ share prices and FTSE All-Share index since 1 January 2016(a)
Sources: Thomson Reuters Datastream and Bank calculations.
(a) Bank indices use weighted averages by market capitalisation.(b) International banks: HSBC and Standard Chartered.(c) UK domestic banks: Barclays, Lloyds Banking Group and RBS.
£10,000 unsecured loan (household)(a)
Bank Rate
Two-year fixed-rate mortgage(a)(b)
0.0
0.5
1.0
1.5
2.0
2.5
3.0
3.5
4.0
4.5
5.0
Jan. Apr. July Oct. Jan. Apr.2016 17
Per cent
Chart B.3 Quoted rates on new real-economy lendinghave fallen broadly in line with Bank RateAverage interest rates on new lending and Bank Rate
Sources: Bank of England and Bank calculations.
(a) Sterling-only end-month quoted rates. (b) On mortgages with a loan to value ratio of 75%.
Table B.1 Funding costs have fallenSelected measures of UK banks’ funding costs(a)(b)
Global Pre-crisis financial July 2016 Nov. 2016 (1 Jan. 2007) crisis Report Report Latest
Additional Tier 1(c) – – 737 660 350
Covered bond(d) -24 218 11 3 -1
Senior unsecured bond(e) – 368 96 59 42
Senior CDS(f) 5 222 134 97 56
Sources: Bloomberg, Markit Group Limited and Bank calculations.
(a) UK banks are Barclays, HSBC, Lloyds Banking Group and RBS. (b) Funding spreads are measured in basis points. (c) Simple average of secondary market spreads over government bonds. (d) Constant-maturity simple average of secondary market spreads to swaps for five-year euro-denominated
covered bonds or a suitable proxy. (e) Constant-maturity simple average of secondary market spreads to mid-swaps for five-year
euro-denominated senior unsecured bonds, or a suitable proxy when unavailable. (f) Simple average of five-year senior CDS premia.

Part B Banking sector resilience 31
When the TFS was launched, the MPC stated that the value of funding provided by the TFS would be determined by usageof the scheme. As of June 2017, aggregate outstanding TFSdrawings by UK banks and building societies were £65 billion.As set out in the Bank’s 2017 Q1 Credit Conditions Review,most major UK lenders reported that the TFS had contributedto recent falls in bank funding spreads. As a result, since theTFS was introduced, quoted rates on new real-economylending have, overall, fallen broadly in line with the reductionin Bank Rate as intended (Chart B.3).
…but low profitability may pose a risk to resilience in future.UK banks’ equity prices have recovered from their mid-2016lows (Chart B.4). While aggregate return on equity for thelargest UK banks was just below zero in 2016, ‘underlying’returns, which strip out misconduct costs and one-timecharges such as restructuring costs, remained positive, ataround 6%. 2017 Q1 results showed material improvement inprofits, driven by a partial recovery in investment bankingreturns (Chart B.5).
Price to book ratios, which measure the market value of equityrelative to the value of equity recorded on banks’ balancesheets, remain persistently below one (Chart B.6). The FPCcontinues to judge that the low equity prices of UK banks canlikely be explained by anticipated misconduct redress costsand weak expected operating profitability of investmentbanking services in particular, rather than by market concernsabout asset quality. For major global banks generally, thecorrelation between price to book ratios and expected returnson equity is currently above 90% (Chart B.7), and muchhigher than the correlation between price to book ratios andmeasures of asset quality. This means that low price to bookratios for UK banks do not signify that their ability to absorblosses is diminished.
Weak profitability does affect banks’ future ability to rebuildcapital following any shock that results in losses while alsomaintaining credit supply. The exploratory scenario in the2017 stress test will consider how the resilience of the UKbanking system might evolve if recent headwinds to bankprofitability persist and intensify. The purpose of this scenariois to explore the impact of banks’ actions on both the realeconomy and the future resilience of the system to shocks.The aggregate results of the test will be published inNovember 2017.(1)
Statutory RoE (year-end)
Underlying RoE (year-end)
Statutory RoE (2017 Q1)
Underlying RoE (2017 Q1)
+
–
15
10
5
0
5
10
15
20
2005 06 07 08 09 10 11 12 13 14 15 16 2017Q1
Per cent
Chart B.5 Bank profitability remains weakUK banks’ statutory and underlying return on equity(a)(b)(c)(d)
Sources: Published accounts and Bank calculations.
(a) Weighted average by shareholders’ equity. (b) Statutory return on equity (RoE) is defined as net income attributable to shareholders divided
by average shareholders’ equity. Underlying RoE strips out misconduct costs as well as one-time charges such as restructuring costs.
(c) UK banks are Barclays, HSBC, Lloyds Banking Group and RBS. (d) 2017 Q1 results are annualised and may display seasonality. They are not directly
comparable to full-year results.
0.0
0.2
0.4
0.6
0.8
1.0
1.2
1.4
1.6
1.8
2.0
2.2
2.4
2007 08 09 10 11 12 13 14 15 16 17
Price to book ratio
Chart B.6 Price to book ratios have improved butremain below oneUK banks’ average price to book ratio(a)(b)(c)
Sources: Thomson Reuters Datastream and Bank calculations.
(a) UK banks are Barclays, HSBC, Lloyds Banking Group and RBS.(b) Relates the share price with the book, or accounting, value of shareholders’ equity per share.(c) HSBC price to book ratio adjusted for currency movements.
UK banks
Other global banks
0
2
4
6
8
10
12
14
16
18
0.0 0.5 1.0 1.5 2.0 2.5
Expected 2018 RoE (per cent)
Price to book ratio
Chart B.7 Price to book ratios are broadly in line withexpected return on equityPrice to book ratios for major global banks compared withexpected returns on equity
Sources: Bloomberg, Thomson Reuters Datastream and Bank calculations.
(1) The Bank does not intend to publish individual bank results under the exploratoryscenario, based on considerations around the possible commercial sensitivity of theprojections banks will provide.

32 Financial Stability Report June 2017
Box 7Building cyber resilience in the UK financialsystem
Cyber attacks pose a threat to the stability of the provision ofUK financial services. There has been a growing number ofhigh-profile cyber incidents in recent years, some of whichhave involved financial sector firms. These incidents highlightthe importance of firms developing capabilities to protectagainst, respond to and recover from cyber attacks.
Progress made towards building cyber resilience in thefinancial systemSince 2013, the FPC has made two Recommendations toregulators regarding cyber resilience (Table 1). This boxdescribes how these Recommendations have beenimplemented, and sets out the FPC’s future approach.
Since the 2013 Recommendation, the organisation ofauthorities who have a role in strengthening the resilienceof the financial system to cyber risks has been improved.
The National Cyber Security Centre (NCSC) has beenestablished as the main technical authority for UK cybersecurity in order to share knowledge and address systemicvulnerabilities. UK financial authorities, together with theNCSC and the industry, have since improved informationsharing across the financial sector.
A response framework allows the UK authorities to co-ordinate their response to cyber attacks that have affected,or have the potential to affect, the financial sector. It nowincludes the NCSC and, if appropriate, the National CrimeAgency.
At the international level, the G7 Cyber Expert Group haspublished guidance on cyber security for the financial sector.(1)
The group is now developing guidance for effective cybersecurity assessment; identifying and treating cyber risk arisingfrom third parties; and co-ordinating with other criticalsectors such as telecommunications and energy.
The FPC’s Recommendations have catalysed testing of theresilience of core financial companies to cyber attack.
The 2015 FPC Recommendation called for financial servicesfirms and financial market infrastructures at the core of the UK financial system (‘core firms’) to complete so-called CBESTtests. These tests subject firms to simulated cyber attacks,and are tailored to each firm, drawing on government,intelligence agency and private sector expertise. Since 2014,31 out of 34 firms have finished testing, and two further firmsare close to completion. This includes banks representingmore than 80% of the outstanding stock of PRA-regulatedbanks’ lending to the UK real economy. The first round ofCBEST testing is therefore materially complete.
The results of testing, together with the actions taken toaddress weaknesses, demonstrate that core firms have madesignificant progress in building cyber resilience.
The first round of tests served its intended purpose byidentifying weaknesses in core firms’ cyber resilience. Forobvious security reasons, these results will not be detailed.But where shortcomings were identified, firms areimplementing action plans to remedy the issues, overseen bysupervisors. In some cases, controls on the integrity ofsystems and confidentiality of data needed to bestrengthened. In others, the tests identified the need forfurther investment in capabilities to detect, mitigate andrespond to attacks. And in general, the tests highlighted theimportance of firms continuing to invest in their people,processes and technology in order to counter the risks of cyber attack.
Consistent with the FPC’s Recommendation, CBEST willbecome a regular component of supervisory assessment offirms. Core firms will be expected to conduct their ownregular tests of cyber resilience. They will also be subject tosupervisor-led CBEST testing at regular intervals. Thefrequency of these tests will be proportionate to firms’importance for financial stability. CBEST is also being adoptedin other jurisdictions and sectors.
Based on the progress made, the FPC judges that its 2015 Recommendation has been implemented, and that it is appropriate to withdraw its Recommendation.
Table 1 The FPC’s Recommendations on cyber resilience
In June 2013, the FPC recommended that:‘HM Treasury, working with the relevant government agencies, the PRA, theBank’s financial market infrastructure supervisors and the FCA should workwith the core UK financial system and its infrastructure to put in place aprogramme of work to improve and test resilience to cyber attack.’
In July 2015, the June 2013 Recommendation was replaced with thefollowing Recommendation:‘The FPC recommends that the Bank, the PRA and the FCA work with firms atthe core of the UK financial system to ensure that they complete CBEST testsand adopt individual cyber resilience action plans. The Bank, the PRA and theFCA should also establish arrangements for CBEST tests to become onecomponent of regular cyber resilience assessment within the UK financialsystem.’
Source: Bank of England.
(1) ‘G7 fundamental elements for cyber security’, October 2016,www.gov.uk/government/publications/g7-fundamental-elements-for-cyber-security.

Part B Banking sector resilience 33
The next phase in building and maintaining resilienceGiven the progress made and the lessons from work to date,the FPC is now moving to the next stage.
Its focus is on systemic risk, rather than risk to individualcompanies or consumers. That is, the risk of cyber attackcausing disruption to critical financial services on a scale thatcauses material disruption to the UK economy.
The FPC is setting out the elements of the framework ofregulation for the UK financial system’s cyber resilience thatare necessary to mitigate systemic risk. The FPC’s future rolewill be to check that each element is being fulfilled by therelevant authorities.
The FPC judges that effective regulation requires:
(1) Clear baseline expectations for firms’ resilience thatreflect their importance for the financial system.Working with the Bank, PRA and FCA, the FPC will considerits tolerance for the disruption to important economicfunctions provided by the financial system. Supervisorswill set clear expectations for firms consistent with thistolerance.
(2) Regular testing of resilience by firms and supervisors. This will build on the first round of CBEST testing andensure the most systemic firms are subject to regularchecks, with the frequency and scope of the tests set inline with supervisory strategy. This will allow supervisorsto keep pace with the evolving nature of the risk.
Assessment of the system’s resilience will also be informedby sector-wide simulation exercises, which test theindustry’s response and recovery capabilities. The FPC hasasked for regular reports from supervisors on the systemicrisks exposed by these regular tests and exercises.
(3) Identification of firms that are outside the financialregulatory perimeter, but which may be important forregulated firms. Cyber attacks that result in disruption to third-partyproviders outside the regulatory scope could still haveeffects on the financial system. The FPC has thereforerequested annual updates from the financial authorities,which include HM Treasury, the Bank, PRA and FCA, on thecyber resilience of firms that are outside the regulatoryperimeter, but which are important for the UK financialsector.
(4) Clear and tested arrangements to respond to cyberattacks when they occur.UK authorities co-ordinate their response to cyber attacksthat may potentially affect the financial system. Thefinancial authorities regularly test and review thesearrangements, in line with evolving threats and experiencegained from managing incidents. Co-operation with theindustry can also enhance the sector’s capacity to respondto threats and share information during an incident.
The FPC has requested an annual update on theeffectiveness of the response framework from financialauthorities, to check that the system has the capacity torespond to and recover from a cyber attack.
Where the FPC receives reports that demonstrateshortcomings in the regulatory framework, it will considerusing its statutory powers to make Recommendations tothe relevant authorities that these be remedied.

Market-based finance
34 Financial Stability Report June 2017
Market-based finance accounts for almost half of the UK financial system’s total assets, andsupports the provision of financial services to the real economy. The provision of market-basedfinance relies on core financial intermediaries, such as dealers, which remain resilient. But there isevidence that conditions in some markets, such as the repo market, have declined in recent years,as dealers are less willing to act as intermediaries. High demand for market liquidity in stresses,including from open-ended funds, also remains a risk. Life insurance companies, meanwhile,continue to support market-based finance through increased holdings of illiquid assets.
Market-based finance is an increasingly important source offinancing for the UK real economy.The importance of market-based finance as a means ofproviding finance to the real economy has grown over thepast few years. Non-bank financial institutions represent keysources of market-based finance and account for almosthalf of the UK financial system’s total assets, up by10 percentage points since 2009. These institutions providefinancial services to the real economy, including by investingin capital markets, such as equity and corporate bond markets(Chart B.8).
On a cumulative basis, capital markets account for almost allnet finance raised by UK private non-financial corporations(PNFCs) since the global financial crisis, primarily in the formof bond issuance. In 2017 to date, sterling investment-gradeissuance by UK companies has been broadly in line with its2010–16 average.
In April, the Bank completed its purchase of £10 billion ofinvestment-grade corporate bonds under the Corporate BondPurchase Scheme (CBPS), announced as part of the MonetaryPolicy Committee’s policy package in August 2016.
Due to its importance for the UK real economy, the FPC hasestablished a medium-term priority of completing post-crisisreforms to market-based finance in the United Kingdom, andimproving the assessment of systemic risks across the financialsystem (see The FPC’s medium-term priorities chapter).
The provision of market-based finance relies on corefinancial intermediaries, such as dealers, which remainresilient…Some financial markets, such as cash fixed-income markets,rely on dealers to intermediate between clients, including bybuilding and releasing inventories as part of theirmarket-making activity. Measures of dealer resilience remain
15
10
5
0
5
10
15
20
2010 11 12 13 14 15 16 17
Loans
Market-based finance(b)
Total(c)£ billions
+
–
Chart B.8 Market-based finance is an important sourceof financing for UK companiesNet finance raised by UK private non-financial corporations(PNFCs)(a)
Sources: Bank of England and Bank calculations.
(a) Finance raised by PNFCs from UK MFIs and from capital markets. Data cover funds raised inboth sterling and foreign currency, converted to sterling. Seasonally adjusted. Bonds andcommercial paper are not seasonally adjusted.
(b) Market-based finance is composed of bonds, equities and commercial paper.(c) Owing to the seasonal adjustment methodology, the total series may not equal the sum of
its components.

Part B Market-based finance 35
robust. The aggregate leverage ratio of the world’s largestdealers was 5.2% at end-December (Chart B.9). Since theNovember 2016 Report, market perceptions of UK dealers’credit risk, as measured by the cost of default protection(CDS premia), have decreased.
…while reforms to over-the-counter (OTC) derivativesmarkets are ongoing.Through OTC derivatives markets, dealers and other financialinstitutions are exposed to counterparty credit risk related toclients, one another and — for those markets that are cleared— central counterparties (CCPs). In March 2017 new ruleswere introduced to implement international requirements forthe margining of non-cleared OTC derivatives, which aim toimprove the mitigation of counterparty credit risk in thosetransactions. These rules are one element of the G20 reformsto derivatives markets agreed in 2009. In November 2016, theFPC asked the Bank to conduct an in-depth assessment toexamine progress towards the implementation of thepost-crisis reforms in derivatives markets and the implicationsfor the resilience of the financial system. This assessmentcontinues to feed into broader work by the Financial StabilityBoard (FSB).
But there is evidence that conditions in some markets, suchas the repo market, have declined over recent years, wheredealers are less willing to act as intermediaries.Market liquidity refers to the ability of investors to buy andsell assets in reasonable size, and within a reasonable timeframe, without having a large impact on prevailing prices.When market liquidity is reliable, it encourages participation infinancial markets, by providing confidence both for issuers(who want to be able to borrow when required at competitiveterms) and for investors (who want to be able to movesmoothly in and out of positions).(1) The provision ofmarket-based finance is more likely to be stable when financialmarkets are liquid and function smoothly. The resilience ofmarket liquidity remains uneven across markets.
Repo markets contribute to effective market functioning byenabling market makers, such as dealers, to finance theirinventories, and leveraged investors, such as hedge funds, totransact in securities, thus supporting market liquidity. TheJuly 2016 Report noted that there has been a decline in theavailability of, and increase in the cost of, repo financing insome jurisdictions. This is consistent with findings from across-jurisdiction study of developments in repo marketsconducted by the Committee on the Global Financial System(CGFS), published in April 2017.(2)
(1) Fair and Effective Markets Review, Final Report, June 2015;www.bankofengland.co.uk/publications/Pages/news/2015/055.aspx.
(2) www.bis.org/publ/cgfs59.htm.
0
1
2
3
4
5
6
7
2000 02 04 06 08 10 12 14 16
Interquartile range
Weighted averagePer cent
Chart B.9 Aggregate dealer leverage ratios haveremained high in the second half of 2016Dealers’ leverage ratios(a)(b)
Sources: Banks’ published accounts, SNL Financial, The Banker Database and Bank calculations.
(a) Leverage ratio defined as reported Tier 1 capital (or common equity where not available)divided by total assets, adjusted for accounting differences on a best-endeavours basis. Thisaccounting measure differs from regulatory leverage ratios.
(b) Dealers included are Bank of America Merrill Lynch, Barclays, BNP Paribas, Citigroup,Credit Agricole, Credit Suisse, Deutsche Bank, Goldman Sachs, HSBC, JP Morgan,Mitsubishi UFJ, Morgan Stanley, RBS, Société Générale and UBS. Pre-crisis data also includeBear Stearns, Lehman Brothers and Merrill Lynch.

36 Financial Stability Report June 2017
The CGFS report noted that in some jurisdictions there isevidence of dealers being less willing or able to undertake repomarket intermediation in recent years. In some cases, this hasled to other financial institutions finding it difficult to placecash. One example cited is that only four of the elevencounterparties that had offered repo facilities to a majorEuropean asset manager in 2014 were still willing to do so in2016 (Chart B.10). The CGFS report also provides evidence ofincreased costs faced by end-users borrowing in the repomarket; for example, repo rates (relative to expectations ofpolicy interest rates) paid by pension funds to borrow cash inthe UK gilt repo market increased around fourfold between2014 and 2016 (Chart B.11). At the same time, the reportnotes that the rate at which end-users place cash in repo hasremained broadly constant since late 2014.
One indicator of reduced repo market liquidity is the volatilityin repo rates that has started to occur around reporting datesas dealers reduce their repo activity (Chart B.12). Dislocationsin European government bond repo markets at end-2016 wereparticularly acute, with gilt repo rates falling to -0.5%, thelowest level reached in the past decade. The fall in rates at theend of 2017 Q1 was more muted, which market contactsattribute in part to participants improving their preparationsfollowing the challenging year-end.
The CGFS report identifies several drivers behind thesechanges in repo market conditions. One driver has beenchanges in the economic environment, such as those driven bycentral banks. Exceptional monetary policy measures reducethe demand for central bank reserves to meet daily liquidityneeds while increasing the supply, including through assetpurchases, of those reserves. Changes in the regulatoryenvironment have also played a role — particularly those thatact on the size, as well as the composition, of banks’ balancesheets, such as the introduction of leverage ratiorequirements. In this context, the FPC will consider theimpact of changes to international standards on thecalibration of the UK capital and leverage framework (seeBanking sector resilience chapter).
High demand for market liquidity, including fromopen-ended funds invested in less liquid assets, remainsa risk.The functioning of some markets could be tested by highdemand for liquidity, including from open-ended investmentfunds. These funds offer short-term redemptions to investorswhile investing in some cases in longer-dated and potentiallyilliquid assets. Assets under management in such fundsincreased by 80% between 2008 and 2015.
Large-scale redemptions could result in sales of assets byfunds that exceed the ability of dealers and other investors toabsorb them, potentially impairing market liquidity. Theseeffects could be amplified if resulting falls in prices lead to
0
10
20
30
40
50
60
70
Jan. July
Per cent
2014 15 16 17Jan. July Jan. July Jan.
Chart B.10 Dealers, who act as counterparties in repotrades, appear to be less willing to offer repo facilitiesProportion of cash balance placed in repo of a major Europeanasset manager, split by counterparty(a)
Source: A European asset manager.
(a) Each colour represents one repo counterparty, with eleven in total.
0.0
0.1
0.2
0.3
0.4
0.5
0.6
2014 15 16
Per cent
One-monthThree-month or four-month
Five-monthSix-month
Chart B.11 For UK pension funds, the cost of borrowingcash through repo has increased fourfold since 2014Gilt repo rates paid by a group of pension fund asset managers inexcess of expectations of policy interest rates(a)
Source: Bloomberg, data collected from a number of asset managers and Bank calculations.
(a) As implied by overnight index swap for the relevant term.
1000
800
600
400
200
0
200
Oct. Jan. Apr.
United Kingdom
FranceGermany
Indices: 1 Oct. 2016 = 100
+
–
2016 17
Chart B.12 Overnight repo rates in Europe showedyear-end volatilityUK, French and German repo rates
Sources: Bloomberg and Bank calculations.
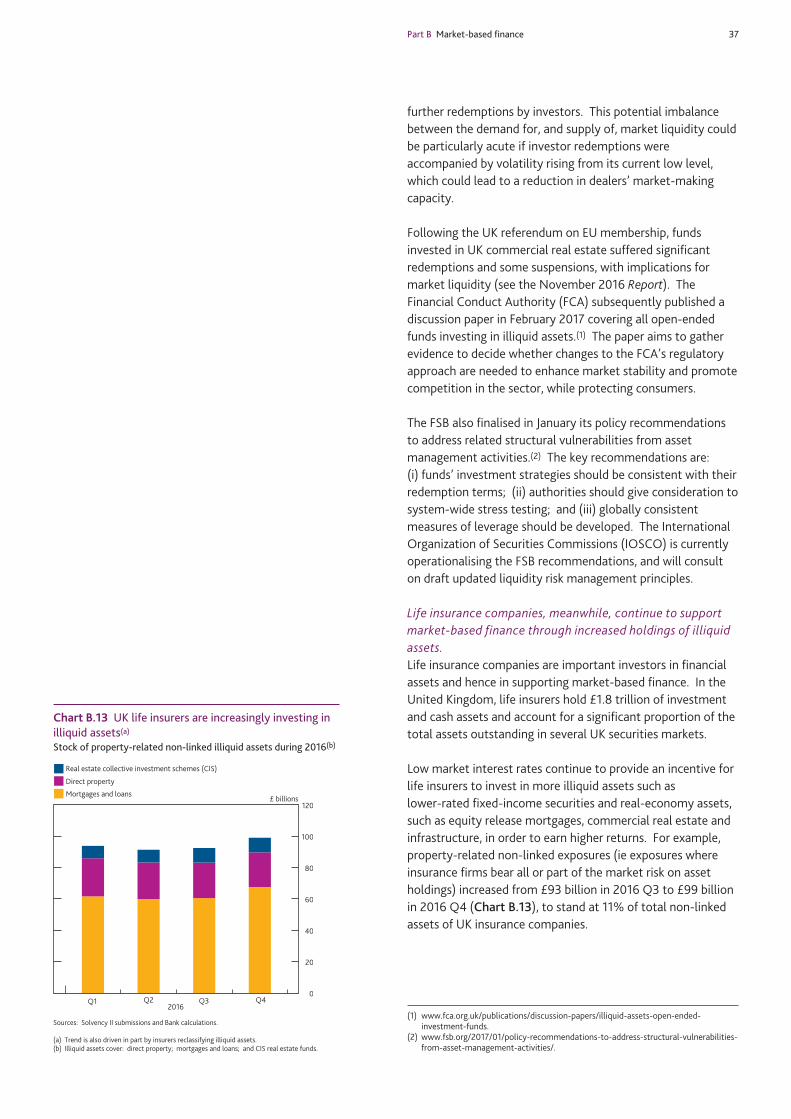
Part B Market-based finance 37
further redemptions by investors. This potential imbalancebetween the demand for, and supply of, market liquidity couldbe particularly acute if investor redemptions wereaccompanied by volatility rising from its current low level,which could lead to a reduction in dealers’ market-makingcapacity.
Following the UK referendum on EU membership, fundsinvested in UK commercial real estate suffered significantredemptions and some suspensions, with implications formarket liquidity (see the November 2016 Report). TheFinancial Conduct Authority (FCA) subsequently published adiscussion paper in February 2017 covering all open-endedfunds investing in illiquid assets.(1) The paper aims to gatherevidence to decide whether changes to the FCA’s regulatoryapproach are needed to enhance market stability and promotecompetition in the sector, while protecting consumers.
The FSB also finalised in January its policy recommendationsto address related structural vulnerabilities from assetmanagement activities.(2) The key recommendations are:(i) funds’ investment strategies should be consistent with theirredemption terms; (ii) authorities should give consideration tosystem-wide stress testing; and (iii) globally consistentmeasures of leverage should be developed. The InternationalOrganization of Securities Commissions (IOSCO) is currentlyoperationalising the FSB recommendations, and will consulton draft updated liquidity risk management principles.
Life insurance companies, meanwhile, continue to supportmarket-based finance through increased holdings of illiquidassets.Life insurance companies are important investors in financialassets and hence in supporting market-based finance. In theUnited Kingdom, life insurers hold £1.8 trillion of investmentand cash assets and account for a significant proportion of thetotal assets outstanding in several UK securities markets.
Low market interest rates continue to provide an incentive forlife insurers to invest in more illiquid assets such aslower-rated fixed-income securities and real-economy assets,such as equity release mortgages, commercial real estate andinfrastructure, in order to earn higher returns. For example,property-related non-linked exposures (ie exposures whereinsurance firms bear all or part of the market risk on assetholdings) increased from £93 billion in 2016 Q3 to £99 billionin 2016 Q4 (Chart B.13), to stand at 11% of total non-linkedassets of UK insurance companies.
(1) www.fca.org.uk/publications/discussion-papers/illiquid-assets-open-ended-investment-funds.
(2) www.fsb.org/2017/01/policy-recommendations-to-address-structural-vulnerabilities-from-asset-management-activities/.
0
20
40
60
80
100
120Mortgages and loans
Direct property
Real estate collective investment schemes (CIS)
£ billions
Q1 Q2 Q3 Q42016
Chart B.13 UK life insurers are increasingly investing inilliquid assets(a)Stock of property-related non-linked illiquid assets during 2016(b)
Sources: Solvency II submissions and Bank calculations.
(a) Trend is also driven in part by insurers reclassifying illiquid assets.(b) Illiquid assets cover: direct property; mortgages and loans; and CIS real estate funds.

38 Financial Stability Report June 2017
Insurers are further incentivised to invest in illiquid assets tomatch long-dated stable liabilities, such as annuities; underSolvency II, the ‘matching adjustment’ allows insurers to lookthrough the impact of short-term market movements onassets when valuing such liabilities.(1) In the November 2016Report, the FPC concluded that the matching adjustment isbeneficial from a macroprudential perspective by reducingpotential instability across the financial system. UK annuitywriters are well-matched between their assets and liabilitiesversus their European counterparties, as evidenced in theEuropean Insurance and Occupational Pensions Authority(EIOPA) 2016 stress test.
Matching long-dated illiquid liabilities with suitablelong-dated illiquid assets can help ensure availability offinance to the wider economy, but can also present riskswhere firms may not have adequate systems and controls tomanage the risks associated with these assets. The PRA issueda consultation on this topic in December 2016.(2)
The FPC supports ongoing work by the Bank and otherauthorities to strengthen the regulatory framework for, andoversight of, non-bank financial institutions. Following efforts by the G20 and the FSB to strengthen theoversight and regulation of the ‘shadow banking’ system, inApril the European Parliament agreed reforms to moneymarket funds, likely to come into force in 2018. The reformsare aimed at making these funds more robust, in order tomaintain the essential role that money market funds play infinancing the real economy.
The FCA has continued to review the regulatory framework forpeer-to-peer platforms in light of the sector’s rapid growthand developments in firms’ business models. In their interimfeedback report on this work, the FCA raised a number ofconcerns including around information quality, inconsistentdisclosures and insufficient wind-down procedures for somefirms. The FCA has further set out expectations of firms thatoperate loan-based crowdfunding platforms that provide loansto businesses. The Bank has also contributed to a CGFS andFSB report on FinTech credit.(3) The report concludes that infuture FinTech could improve financial stability by providingan alternative source of finance. But it may also give rise tosystemic concerns, for example by lowering lending standards,procyclical credit provision, and by posing challenges to theregulatory perimeter. The FPC supports this work and willcontinue to monitor the sector.
(1) The matching adjustment replaces the so-called ‘liquidity premium’ under the formerIndividual Capital Adequacy Standards regime.
(2) ‘Solvency II: matching adjustment — illiquid unrated assets and equity releasemortgages’, Prudential Regulation Authority Consultation Paper CP48/16;www.bankofengland.co.uk/pra/Pages/publications/cp/2016/cp4816.aspx.
(3) www.bis.org/publ/cgfs_fsb1.pdf.

Part B Market-based finance 39
Box 8The UK High-Value Payment System
Electronic payments are essential to the functioning ofmodern economies. Most electronic payments are made via‘payment systems’ in which financial institutions participate toexchange money on behalf of their customers. Each paymentsystem maintains: (a) a set of rules and procedures thatgovern the transfer of funds between these institutions; and(b) an infrastructure to facilitate those transfers. The largestand most critical payments in the United Kingdom are madeover CHAPS, the country’s High-Value Payment System(HVPS).
The scale, type and sophistication of potential threats to thestability of payment systems are rising. Risks such ascyber attack are increasingly capable of striking at any part ofthe payments chain. It is essential that payment systems areable to take an end-to-end view of these risks. Havingidentified constraints in the existing structure, the Bankdecided in April, with the FPC’s endorsement, to move to‘direct delivery’ of the HVPS. The Bank is now working closelywith CHAPS Co, the current operator of the HVPS and withindustry to ensure a smooth and timely transition to the newstructure this calendar year.
This box explains the rationale for the decision to move todirect delivery. It then places it in the broader context of theBank’s programme for renewal of its Real-Time GrossSettlement (RTGS) infrastructure. The Bank’s aim is for thisprogramme to deliver a materially stronger, more resilient,flexible and highly innovative sterling settlement system forthe United Kingdom’s high-value payments. Moving to directdelivery of the HVPS is a vital part of that vision.
Current delivery of HVPSThe current delivery model for the UK HVPS involves a split inresponsibilities across two institutions. The core infrastructureis provided by the Bank, as part of its RTGS system.CHAPS Co, a small private sector company owned by itsmembers is responsible for operating the system’s governanceand rulebook and managing risks across the HVPS as a whole;CHAPS Co is supervised by the Bank of England. This split isunusual internationally. The norm in most countries is for thecentral bank to deliver all aspects of the HVPS.
There are structural deficiencies in this model that pose risksto financial stability. The RTGS system has several policyfunctions, including the implementation of monetary policy.For security reasons therefore CHAPS Co cannot be given thefull range of information on, or contractual control over, RTGSthat it needs to identify and manage risks across the wholepayment system. This includes in important areas of
operational risk such as cyber risk and fraud. The IMFhighlighted these constraints in its past two Financial StabilityAssessment Programmes on the United Kingdom, mostrecently in 2016. Such risks are increasingly important andcomplex. Their potential impact is further amplified as newtypes of users have sought access to payment systems. At thesame time, the tolerance for even short periods of systemoutage has fallen.
CHAPS Co had made a number of important enhancements tothe existing model in recent months to reflect some of theseconcerns. But these enhancements could not fully address thestructural constraints described above. As such, CHAPS Cowas unable to fully meet regulatory expectations.
On this basis, the FPC concluded at its 27 April meeting thatthere were financial stability risks arising from the currentstructure for delivery of the HVPS, including from the growingthreat from cyber attack.
Direct delivery model for HVPSUnder a direct delivery model, the Bank would be responsiblefor both the operation of the HVPS scheme and the RTGSinfrastructure. This would allow the Bank to carry outend-to-end risk management, identifying and responding toemerging risks in the HVPS in a holistic way, using the fullrange of tools at its disposal. The Bank would maintain its roleas the supervisor of the HVPS.
The FPC welcomed the Bank’s plan to mitigate the financialstability risks through a move to the proposed direct deliverymodel for operating the HVPS.
The move towards a direct delivery model is an opportunityfor the Bank to provide the FPC with more comprehensiveinformation on the HVPS. This is particularly important giventhe growing risk environment. The FPC will be given regularreports on the extent of systemic risks arising from theoperation of the HVPS. In addition, where the Bank proposesmaterial changes to the delivery of the HVPS in future thataffect risks to financial stability, it will consult the FPC.
The Bank has designed a model for the operation andsupervision of the HVPS that will involve transparency, uservoice and independent challenge. The Bank, CHAPS Co andtheir stakeholders expect to complete the transition to directdelivery by the end of the calendar year.
The RTGS renewal programmeThe move to direct delivery of the HVPS is part of a widerprogramme to reshape both the infrastructure and governanceof the RTGS system. The Bank published a blueprint for thenew generation of its RTGS system in May 2017 (Table 1).

On 27 April, the FPC met to discuss the current structure fordelivering the UK High-Value Payment System (HVPS), in thecontext of evolving risks to systemically important financialmarket infrastructure. It agreed that there were financialstability risks arising from the current structure for delivery ofthe UK HVPS and welcomed the Bank’s plan to mitigate theserisks through a move to the proposed direct delivery model(see Box 8).
40 Financial Stability Report June 2017
The renewed RTGS service will be delivered through amulti-year programme of work. This includes theprocurement of a new central infrastructure.
RTGS is vital UK infrastructure. It supports both theUK economy and the Bank’s own balance sheet. At the sametime the renewal programme is complex, unique and large. Itwill require co-ordinated changes across the paymentsindustry. It is critical that there are no disruptions to the RTGSservice. The Bank has planned accordingly; new features willbe introduced in phases. The Bank’s current intention is forthe majority of new functionality to be live by end-2020.
Table 1 Service characteristics of the renewed RTGS service
Service characteristic Objective
Resilience Strengthen resilience of RTGS and flexibility to respond to emerging threats.
Access Facilitate greater direct access to central bank money settlement for financial institutions and infrastructures.
Interoperability Promote harmonisation and convergence with critical domestic and international payment systems.
User functionality Support emerging user needs in a changing payment environment.
End-to-end risk Strengthen capacity to respond to evolvingmanagement system-wide risks.
Source: ‘A blueprint for a new RTGS service for the United Kingdom’; www.bankofengland.co.uk/markets/Documents/paymentsystem/rtgsblueprint.pdf.

Part B The FPC’s medium-term priorities 41
To help to meet its objectives, alongside its ongoingassessment of the risk environment, the FPC is prioritisingthree initiatives over the next two to three years:
(1) Finalising, and refining if necessary, post-crisis bankcapital and liquidity reforms
Over the past three years, in line with international reformsfollowing the global financial crisis, the FPC has focused on establishing the medium-term capital framework for UK banks and has reviewed the Bank’s work to stop banksbeing ‘too big to fail’.
The FPC will now take stock of these reforms and will developmore ways to assess how resilient the banking system wouldbe to shocks. It will:
• Review the judgements underlying its overall calibration ofthe risk-weighted capital framework for UK banks, includingtaking into account progress towards ensuring banks areresolvable, changes in accounting standards and reforms to the measurement of risk-weighted assets. The naturalpoint for a full review will be in 2019, in light of theoutcome of negotiations to finalise Basel III standards; the FPC has already started reviewing some of thesejudgements.
• Review the UK leverage ratio framework, in light ofprogress towards an international standard for a leveragerequirement, and its scope of application.
• Take stock of overall liquidity and funding standards for UK banks and consider the case for a time-varyingmacroprudential liquidity standard.
• Input to the Bank’s work to develop its stress tests of thebanking system, to capture better the interactions betweenbanks in a stress.
(2) Completing post-crisis reforms to market-based financein the United Kingdom, and improving the assessment ofsystemic risks across the financial system
Firms other than banks play an important role in providingfinance to the economy and a means of sharing risk. Their
activities can also be a source of systemic risk. Since 2014, the FPC has completed an annual review of risks from, andregulation of, market-based finance, with an in-depth look sofar at the activities of open-ended investment funds andinsurers, and on changes in market liquidity. The FPC will now:
• Continue its annual review and programme of in-depthreviews on specific market-based finance activities. Thiswill include an assessment of the financial stability risksassociated with derivatives transactions, including progresstowards implementation of the mandated move to the useof central clearing and other post-crisis reforms.
• Support the Bank’s work to develop a system-wide stresssimulation, to help understand how the financial system asa whole is likely to respond to shocks.
• Consider whether macroprudential tools for market-basedfinance might be needed to address systemic risksoriginating from outside the banking system.
(3) Preparing for the United Kingdom’s withdrawal from theEuropean Union
Exit negotiations between the United Kingdom and theEuropean Union have begun. There are a range of possibleoutcomes for, and paths to, the United Kingdom’s withdrawalfrom the European Union.
The FPC will oversee contingency planning to mitigate risks tofinancial stability as the withdrawal process evolves.
Irrespective of the particular form of the United Kingdom’sfuture relationship with the European Union, and consistentwith its statutory responsibility, the FPC will remaincommitted to the implementation of robust prudentialstandards in the UK financial system. This will require a levelof resilience to be maintained that is at least as great as thatcurrently planned, which itself exceeds that required byinternational baseline standards.
Across its priorities, the FPC remains committed to workingwith relevant authorities domestically and internationally, toprotect and enhance the resilience of the UK financial system.
The FPC’s medium-term priorities

42 Financial Stability Report June 2017
Recommendations implemented or withdrawn since the previous Report
14/Q2/1 FPC Recommendation on mortgage affordability tests Superseded by 17/Q2/1 — see below
When assessing affordability, mortgage lenders should apply an interest rate stress test that assesses whether borrowerscould still afford their mortgages if, at any point over the first five years of the loan, Bank Rate were to be 3 percentagepoints higher than the prevailing rate at origination. This Recommendation is intended to be read together with the FCArequirements around considering the effect of future interest rate rises as set out in MCOB 11.6.18(2).
This Recommendation has been superseded by 17/Q2/1, to clarify the rate to which the 3 percentage points stress should beapplied, following a review by the FPC. Details of the review and the reasons for the clarification are set out in a chapter of thisReport: ‘The FPC’s approach to addressing risks from the UK mortgage market’.
This annex lists FPC Recommendations from previous periods that have been implemented sincethe previous Report, as well as Recommendations and Directions that are currently outstanding. It also includes those FPC Policy decisions that have been implemented by rule changes and aretherefore still in force.
Each Recommendation or Direction has been given an identifier to ensure consistent referencing over time. For example, theidentifier 14/Q2/1 refers to the first Recommendation made at the 2014 Q2 Committee meeting.
Annex 1: Previous macroprudential policy decisions
14/Q3/1 Powers of Direction over housing instruments Implemented
The FPC recommends that HM Treasury exercise its statutory power to enable the FPC to direct, if necessary to protect andenhance financial stability, the PRA and FCA to require regulated lenders to place limits on residential mortgage lending,both owner-occupied and buy-to-let, by reference to: (a) loan to value ratios; and (b) debt to income ratios, includinginterest coverage ratios in respect of buy-to-let lending.
Legislation granting the FPC powers of Direction over loan to value and debt to income limits in respect of mortgages on owner-occupied properties came into force in April 2015.
Over 2015 and 2016, HM Treasury consulted on granting the FPC powers of Direction over buy-to-let lending. It published aconsultation response document and laid the final legislation before Parliament on 16 November. These powers were approvedin December and are now in place.
The FPC therefore decided to consider this Recommendation as implemented at its meeting on 22 March 2017.
Annex 1 Previous macroprudential policy decisions 43
Recommendations and Directions currently outstanding
17/Q2/1 FPC Recommendation on mortgage affordability tests Action under way
When assessing affordability, mortgage lenders should apply an interest rate stress test that assesses whether borrowerscould still afford their mortgages if, at any point over the first five years of the loan, their mortgage rate were to be3 percentage points higher than the reversion rate specified in the mortgage contract at the time of origination (or, if themortgage contract does not specify a reversion rate, 3 percentage points higher than the product rate at origination). ThisRecommendation is intended to be read together with the FCA requirements around considering the effect of futureinterest rate rises as set out in MCOB 11.6.18(2). This Recommendation applies to all lenders which extend residentialmortgage lending in excess of £100 million per annum.
This Recommendation was made at the FPC’s meeting on 21 June 2017. Relative to the previous Recommendation on mortgageaffordability tests (14/Q2/1), it clarified the rate to which the 3 percentage points stress should be applied and introduced a de minimis threshold. The explanation for this Recommendation is set out in a chapter of this Report: ‘The FPC’s approach toaddressing risks from the UK mortgage market’.
16/Q2/1 Distribution of capital to meet ‘fair shares’ of systemic buffers Implemented
The FPC recommends to the PRA that it should seek to ensure that, where systemic buffers apply at different levels ofconsolidation, there is sufficient capital within the consolidated group, and distributed appropriately across it, to addressboth global systemic risks and domestic systemic risks.
This Recommendation was made at the FPC’s May 2016 meeting to agree the final systemic risk buffer (SRB) framework.
Following a consultation in 2016 H2, the PRA published on 1 February 2017 its Policy Statement on the implementation ofringfencing.(1) This outlined how it would implement the FPC’s Recommendation. The FPC therefore decided at its meeting on22 March 2017 to consider this Recommendation as implemented, given that the PRA’s Policy Statement was in place.
(1) www.bankofengland.co.uk/pra/Pages/publications/ps/2017/ps317.aspx.
15/Q2/3 CBEST vulnerability testing Implemented
The FPC recommends that the Bank, the PRA and the FCA work with firms at the core of the UK financial system to ensurethat they complete CBEST tests and adopt individual cyber resilience action plans. The Bank, the PRA and the FCA shouldalso establish arrangements for CBEST tests to become one component of regular cyber resilience assessment within theUK financial system.
Since 2014, 31 out of 34 firms have finished testing, and two further firms are close to completion. The first round of CBESTtesting is therefore materially complete. Consistent with the FPC’s Recommendation, CBEST will become a regular componentof supervisory assessment of firms. Financial services firms and market infrastructures at the core of the UK financial system willbe expected to conduct their own regular tests of cyber resilience. They will also be subject to supervisor-led CBEST testing atregular intervals. The frequency of these tests will be proportionate to firms’ importance for financial stability. CBEST is alsobeing adopted in other jurisdictions and sectors.
Based on the progress made, the FPC judged at its meeting on 21 June 2017 that its 2015 Recommendation has beenimplemented. The summary of the review is set out in a box in this Report: ‘Building cyber resilience in the UK financial system’.

44 Financial Stability Report June 2017
Other FPC policy decisions which remain in place
Set out below are previous FPC decisions, which remain in force, on the setting of its policy tools. The calibration of these toolsis kept under review.
Countercyclical capital buffer (CCyB)
The FPC is increasing the UK CCyB rate to 0.5%, from 0%, with binding effect from 27 June 2018. Absent a material change inthe outlook, and consistent with its stated policy for a standard risk environment and of moving gradually, the FPC expects toincrease the rate to 1% at its November meeting, with binding effect a year after that. This rate is reviewed on a quarterly basis.
The United Kingdom has also previously reciprocated a number of foreign CCyB decisions — for more details see the Bank ofEngland website.(1) Under PRA rules, foreign CCyB rates applying from 2016 onwards will be automatically reciprocated up toand including 2.5%.
Recommendation on loan to income ratios
In June 2014, the FPC made the following Recommendation (14/Q2/2):
The Prudential Regulation Authority (PRA) and the Financial Conduct Authority (FCA) should ensure that mortgage lendersdo not extend more than 15% of their total number of new residential mortgages at loan to income ratios at or greaterthan 4.5. This Recommendation applies to all lenders which extend residential mortgage lending in excess of £100 millionper annum. The Recommendation should be implemented as soon as practicable.
The PRA and the FCA have published their respective approaches to implementing this Recommendation: the PRA has issued aPolicy Statement, including rules,(2) and the FCA has issued general guidance.
The FPC reviewed this Recommendation in November 2016 and decided not to amend the calibration. The explanation for thisis set out in the November 2016 Financial Stability Report.
(1) www.bankofengland.co.uk/financialstability/Pages/fpc/ccbrates.aspx. (2) www.bankofengland.co.uk/pra/Pages/publications/ps/2014/ps914.aspx.
Other FPC activities since the previous Report
The Bank of England’s financial stability objective is to ‘protect and enhance the stability of the financial system of theUnited Kingdom’. This is defined by Parliament, through the Bank of England Act 1998. The Court of Directors of the Bank has astatutory responsibility to determine the Bank’s strategy in relation to this objective and to review it at least every three years.Court has delegated the review of the strategy to the FPC, as permitted by the Act; but Court retains ultimate responsibility forthe strategy.
At its 2017 Q2 meeting, the FPC agreed the Bank’s financial stability strategy, following its review of the strategy that was set byCourt in 2014, and following consultation, as required by statute, with HM Treasury. The strategy will be published in the Bank’sforthcoming Annual Report.

Annex 2 Core indicators 45
Annex 2: Core indicators
Table A.1 Core indicator set for the countercyclical capital buffer(a)
Indicator Average, Average Minimum Maximum Previous Latest value 1987–2006(b) 2006(c) since 1987(b) since 1987(b) value (oya) (as of 16 June 2017)
Non-bank balance sheet stretch(d)
1 Credit to GDP(e)
Ratio 117.1% 152.1% 86.9% 172.2% 140.6% 145.2% (2016 Q4)
Gap 6.4% 6.2% -25.6% 20.8% -22.5% -15.6% (2016 Q4)
2 Private non-financial sector credit growth(f) 10.1% 9.8% -3.1% 22.8% 2.5% 4.5% (2016 Q4)
3 Net foreign asset position to GDP(g) -2.3% -10.3% -22.4% 24.2% -4.6% 24.2% (2016 Q4)
4 Gross external debt to GDP(h) 183.0% 309.9% 114.2% 398.0% 295.0% 313.7% (2016 Q4)
of which bank debt to GDP 120.9% 195.0% 78.6% 267.6% 161.0% 177.2% (2016 Q4)
5 Current account balance to GDP(i) -1.7% -2.2% -6.0% 0.8% -5.5% -2.4% (2016 Q4)
Conditions and terms in markets
6 Long-term real interest rate(j) 1.45% 1.23% -2.05% 2.18% -1.17% -1.54% (16 June 2017)
7 VIX(k) 19.1 12.8 10.5 65.5 15.5 10.6 (16 June 2017)
8 Global corporate bond spreads(l) 84 bps 84 bps 74 bps 482 bps 150 bps 113 bps (16 June 2017)
9 Spreads on new UK lending
Household(m) 480 bps 352 bps 285 bps 850 bps 656 bps 636 bps (Apr. 2017)
Corporate(n) 104 bps 97 bps 82 bps 392 bps 234 bps 225 bps (Dec. 2016)
Bank balance sheet stretch(o)
10 Capital ratio
Basel II core Tier 1(p) 6.6% 6.3% 6.1% 12.3% n.a. n.a.
Basel III common equity Tier 1(q) n.a. n.a. n.a. n.a. 12.3% 13.9% (2017 Q1)
11 Leverage ratio(r)
Simple 4.7% 4.1% 2.9% 6.6% 6.6% 6.6% (2016 H2)
Basel III (2014 proposal) n.a. n.a. n.a. n.a. 4.9% 4.9% (2016 H2)
12 Average risk weights(s) 53.6% 46.4% 33.4% 65.4% 36.5% 33.4% (2016 H2)
13 Return on assets before tax(t) 1.0% 1.1% -0.2% 1.5% 0.4% 0.3% (2016 H2)
14 Loan to deposit ratio(u) 114.5% 132.4% 93.3% 133.3% 97.1% 93.3% (2016 H2)
15 Short-term wholesale funding ratio(v) n.a. 24.6% 10.1% 26.7% 10.5% 10.1% (end-2016)
of which excluding repo funding n.a. 15.8% 4.5% 15.8% 4.5% 4.9% (end-2016)
16 Overseas exposures indicator: countries to which UK banks have ‘large’ and ‘rapidly growing’ In 2006 Q4: AU, BR, CA, CH, CN, DE, In 2016 Q1: KY In 2017 Q1: CH, DE, JP, total exposures(w)(x) ES, FR, IE, IN, JP, KR, KY, LU, NL, US, ZA KY, NL, TW
17 CDS premia(y) 12 bps 8 bps 6 bps 298 bps 132 bps 58 bps (June 2017)
18 Bank equity measures
Price to book ratio(z) 2.13 1.94 0.49 2.86 0.57 0.84 (June 2017)
Market-based leverage ratio(aa) 9.7% 7.8% 1.9% 15.7% 3.5% 5.5% (June 2017)

46 Financial Stability Report June 2017
Table A.2 Core indicator set for sectoral capital requirements(a)
Indicator Average, Average Minimum Maximum Previous Latest value 1987–2006(b) 2006(c) since 1987(b) since 1987(b) value (oya) (as of 16 June 2017)
Bank balance sheet stretch(o)
1 Capital ratio
Basel II core Tier 1(p) 6.6% 6.3% 6.1% 12.3% n.a. n.a.
Basel III common equity Tier 1(q) n.a. n.a. n.a. n.a. 12.3% 13.9% (2017 Q1)
2 Leverage ratio(r)
Simple 4.7% 4.1% 2.9% 6.6% 6.6% 6.6% (2016 H2)
Basel III (2014 proposal) n.a. n.a. n.a. n.a. 4.9% 4.9% (2016 H2)
3 Average mortgage risk weights(ab) n.a. n.a. 12.6% 22.4% 14.2% 12.6% (2016 H2)
UK average mortgage risk weights(ac) n.a. n.a. 10.5% 15.8% 11.0% 10.5% (2016 H2)
4 Balance sheet interconnectedness(ad)
Intra-financial lending growth(ae) 12.0% 13.0% -18.4% 45.5% -18.4% 5.2% (2016 H2)
Intra-financial borrowing growth(af) 14.1% 13.7% -21.5% 33.1% -16.9% 33.1% (2016 H2)
Derivatives growth (notional)(ag) 37.7% 34.2% -25.9% 52.0% -19.1% 12.1% (2016 H2)
5 Overseas exposures indicator: countries to which UK banks have ‘large’ and ‘rapidly growing’ non-bank In 2006 Q4: AU, CA, DE, In 2016 Q1: KY In 2017 Q1: KYprivate sector exposures(ah)(x) ES, FR, IE, IT, JP, KR, KY, NL, US, ZA
Non-bank balance sheet stretch(d)
6 Credit growth
Household(ai) 10.3% 11.2% -0.6% 19.6% 3.7% 4.5% (2016 Q4)
Commercial real estate(aj) 15.3% 18.5% -9.7% 59.8% 0.0% 0.7% (2017 Q1)
7 Household debt to income ratio(ak) 100.1% 141.8% 78.2% 150.5% 132.2% 135.0% (2016 Q4)
8 PNFC debt to profit ratio(al) 237.0% 297.0% 157.0% 407.4% 272.8% 294.3% (2016 Q4)
9 NBFI debt to GDP ratio (excluding insurancecompanies and pension funds)(am) 56.4% 122.0% 14.0% 176.8% 126.3% 125.6% (2016 Q4)
Conditions and terms in markets
10 Real estate valuations
Residential price to rent ratio(an) 100.0 151.1 66.9 160.6 139.6 142.9 (2017 Q1)
Commercial prime market yields(ao) 5.4% 4.1% 3.8% 7.1% 4.1% 4.0% (2017 Q1)
Commercial secondary market yields(ao) 8.5% 5.6% 5.1% 10.2% 5.8% 6.0% (2017 Q1)
11 Real estate lending terms
Residential mortgage LTV ratio(mean above the median)(ap) 90.6% 90.6% 81.6% 90.8% 86.7% 87.3% (2017 Q1)
Residential mortgage LTI ratio(mean above the median)(ap) 3.8 3.8 3.6 4.2 4.1 4.2 (2017 Q1)
Commercial real estate mortgage LTV(average maximum)(aq) 77.6% 78.3% 57.5% 79.6% 62.6% 57.5% (2016 H2)
12 Spreads on new UK lending
Residential mortgage(ar) 80 bps 51 bps 35 bps 379 bps 176 bps 161 bps (Apr. 2017)
Commercial real estate(as) 137 bps 135 bps 119 bps 422 bps 264 bps 254 bps (2016 Q4)

Annex 2 Core indicators 47
(a) A spreadsheet of the series shown in this table is available at www.bankofengland.co.uk/financialstability/Pages/fpc/coreindicators.aspx.(b) If the series starts after 1987, the average between the start date and 2006 end and the maximum/minimum since the start date are used.(c) 2006 was the last year before the start of the global financial crisis.(d) The current vintage of ONS data is not available prior to 1997. Data prior to this and beginning in 1987 have been assumed to remain unchanged since The Blue Book 2013.(e) Credit is defined as debt claims on the UK private non-financial sector. This includes all liabilities of the household and not-for-profit sector except for the unfunded pension liabilities and financial derivatives of the not-for-profit
sector, and private non-financial corporations’ (PNFCs’) loans and debt securities excluding direct investment loans and loans secured on dwellings. The credit to GDP gap is calculated as the percentage point difference betweenthe credit to GDP ratio and its long-term trend, where the trend is based on a one-sided Hodrick-Prescott filter with a smoothing parameter of 400,000. See Countercyclical Capital Buffer Guide atwww.bankofengland.co.uk/financialstability/Pages/fpc/coreindicators.aspx for further explanation of how this series is calculated. Sources: BBA, ONS Revell, J and Roe, A (1971); ‘National balance sheets and national accounting— a progress report’, Economic Trends, No. 211 and Bank calculations.
(f) Twelve-month growth rate of nominal credit (defined as the four-quarter cumulative net flow of credit as a proportion of the stock of credit twelve months ago). Credit is defined as above. Sources: ONS and Bank calculations.(g) As per cent of annual GDP (four-quarter moving sum). Sources: ONS and Bank calculations.(h) Ratios computed using a four-quarter moving sum of GDP. Monetary financial institutions (MFIs) cover banks and building societies resident in the United Kingdom. Sources: ONS and Bank calculations.(i) As per cent of quarterly GDP. Sources: ONS and Bank calculations.(j) Five-year real interest rates five years forward, implied from inflation swaps and nominal fitted yields. Data series runs from October 2004. Sources: Bloomberg and Bank calculations.(k) Measure of market expectations of 30-day volatility. Conveyed by S&P 500 stock index option prices (one-month moving average). Sources: Bloomberg and Bank calculations.(l) Global corporate bond spreads’ refers to a one-month moving average of the global aggregate market non-financial corporate bond spread. This tracks the performance of investment-grade corporate debt publicly issued in the
global and regional markets from both developed and emerging market issuers. Index constituents are weighted based on market value. Spreads are option-adjusted (ie they show the number of basis points the matched-maturity government spot curve needs to be shifted in order to match a bond’s present value of discounted cash flows). Prior to 2016, published versions of this indicator showed the BofA Merrill Lynch Global Industrial Index. Sources: Barclays and Bank calculations.
(m) The household lending spread is a weighted average of mortgage and unsecured lending spreads, with weights based on relative volumes of new lending. The mortgage spread is a weighted average of quoted mortgage rates overrisk-free rates, using 90% LTV two-year fixed-rate mortgages and 75% LTV tracker, two and five-year fixed-rate mortgages. Spreads are taken relative to gilt yields of matching maturity for fixed-rate products. Spreads are takenrelative to Bank Rate for the tracker product. The unsecured component is a weighted average of spreads on credit cards, overdrafts and personal loans. Spreads on unsecured lending are taken relative to Bank Rate. FCAProduct Sales Data includes regulated mortgage contracts only but is used to weight all mortgage products. Series starts in 1997. Sources: Bank of England, Bloomberg, Council of Mortgage Lenders, FCA Product Sales Data andBank calculations.
(n) The UK corporate lending spread is a weighted average of: SME lending rates over Bank Rate; CRE average senior loan margins over Bank Rate; and, as a proxy for the rate at which banks lend to large, non-CRE corporates,UK investment-grade company bond spreads over maturity-matched government bond yields (adjusted for any embedded option features such as convertibility into equity). Weights are based on relative amounts outstandingof loans. Series starts in October 2002. Sources: Bank of America Merrill Lynch Global Research, Bank of England, Bloomberg, British Bankers’ Association, De Montfort University, Department for Business, Energy and IndustrialStrategy and Bank calculations.
(o) Unless otherwise stated, indicators are based on the major UK bank peer group defined as: Abbey National (until 2003); Alliance & Leicester (until 2007); Bank of Ireland (from 2005); Bank of Scotland (until 2000); Barclays;Bradford & Bingley (from 2001 until 2007); Britannia (from 2005 until 2008); Co-operative Banking Group (from 2005); Halifax (until 2000); HBOS (from 2001 until 2008); HSBC (from 1992); Lloyds TSB/Lloyds BankingGroup; Midland (until 1991); National Australia Bank (from 2005); National Westminster (until 1999); Nationwide; Northern Rock (until 2011); Royal Bank of Scotland; Santander (from 2004); TSB (until 1994); Virgin Money(from 2012) and Woolwich (from 1990 until 1997). Accounting changes, eg the introduction of IFRS in 2005 result in discontinuities in some series. Restated figures are used where available.
(p) Major UK banks’ aggregate core Tier 1 capital as a percentage of their aggregate risk-weighted assets. The core Tier 1 capital ratio series starts in 2000 and uses the major UK banks peer group as at 2014 and their constituentpredecessors. Data exclude Northern Rock/Virgin Money from 2008. From 2008, core Tier 1 ratios are as published by banks, excluding hybrid capital instruments and making deductions from capital based on PRA definitions.Prior to 2008, that measure was not typically disclosed and Bank calculations approximating it as previously published in the Financial Stability Report are used. The series are annual until end-2012, half-yearly until end-2013and quarterly afterwards. Sources: PRA regulatory returns, published accounts and Bank calculations.
(q) The Basel II series was discontinued with CRD IV implementation on 1 January 2014. The ‘Basel III common equity Tier 1 capital ratio’ is calculated as aggregate peer group common equity Tier 1 levels over aggregaterisk-weighted assets, according to the CRD IV definition as implemented in the United Kingdom. The Basel III peer group includes Barclays, Co-operative Banking Group, HSBC, Lloyds Banking Group, Nationwide, RBS andSantander UK. Sources: PRA regulatory returns and Bank calculations.
(r) A simple leverage ratio calculated as aggregate peer group equity (shareholders’ claims) over aggregate peer group assets over aggregate Basel 2010 leverage ratio exposure. The Basel III (2014) series corresponds to aggregatepeer group CRD IV end-point Tier 1 capital over aggregate Basel 2014 exposure measure. Note that the simple series excludes Northern Rock/Virgin Money from 2008. The Basel III series consists of Barclays, Co-operativeBanking Group, HSBC, Lloyds Banking Group, Nationwide, RBS and Santander UK. The latest value uses latest published figures, in the case of Nationwide these relate to 2016 H1. The series are annual until end-2012 and half-yearly afterwards. On 25 July 2016, the FPC recommended to the PRA that, when applying its rules on the leverage ratio, it considers allowing firms to exclude from the calculation of the total exposure measure those assetsconstituting claims on central banks where they are matched by deposits accepted by the firm that are denominated in the same currency and of identical or longer maturity. No adjustment has been made to the calculatedleverage ratio reported here for this policy. Sources: PRA regulatory returns, published accounts and Bank calculations.
(s) Aggregate end-year peer group risk-weighted assets divided by aggregate end-year peer group published balance sheet assets. Data for 2014 H1 onwards are on a CRD IV basis. Series begins in 1992 and is annual until end-2012and half-yearly afterwards. Latest published figures have been used, in the case of Nationwide, these relate to 2016 H1. Sources: Published accounts and Bank calculations.
(t) Calculated as major UK banks’ annual profit before tax as a proportion of total assets, averaged over the current and previous year. When banks in the sample have merged, aggregate profits for the year are approximated bythose of the acquiring group. Series is annual until 2015 when it becomes semi-annual. The latest value uses latest published figures, in the case of Nationwide these relate to 2016 H1. Sources: Published accounts and Bankcalculations.
(u) Major UK banks’ loans and advances to customers as a percentage of customer deposits, where customer refers to all non-bank borrowers and depositors. Repurchase agreements are excluded from loans and deposits wheredisclosed. One weakness of the current measure is that it is not possible to distinguish between retail deposits from households and deposits placed by non-bank financial corporations on a consolidated basis. Additional datacollections would be required to improve the data in this area. The series begins in 2000 and is annual until end-2012 and half-yearly afterwards. The latest value uses latest published figures, in the case of Nationwide theserelate to 2016 H1. Sources: Published accounts and Bank calculations.
(v) Share of total funding (including capital) accounted for by wholesale funding with residual maturity of under three months. Wholesale funding comprises deposits by banks, debt securities, subordinated liabilities and repo.Funding is proxied by total liabilities excluding derivatives and liabilities to customers under investment contracts. Where underlying data are not published estimates have been used. Repo includes repurchase agreements andsecurities lending. The series starts in 2005. In the latest value, Nationwide’s 2015 data are used as these are the latest published full-year results. Sources: Published accounts and Bank calculations.
(w) This indicator highlights the countries where UK-owned monetary financial institutions’ (MFIs’) overall exposures are greater than 10% of UK-owned MFIs’ tangible equity on an ultimate risk basis and have grown by more than1.5 times nominal GDP growth in that country. Foreign exposures as defined in BIS consolidated banking statistics. Uses latest data available, with the exception of tangible equity figures for 2006–07, which are estimated usingpublished accounts. Sources: Bank of England, ECB, IMF World Economic Outlook (WEO), Thomson Reuters Datastream, published accounts and Bank calculations.
(x) Abbreviations used are: Australia (AU), Brazil (BR), Canada (CA), Switzerland (CH), People’s Republic of China (CN), Germany (DE), Spain (ES), France (FR), Ireland (IE), Italy (IT), India (IN), Japan (JP), Republic of Korea (KR),Cayman Islands (KY), Luxembourg (LU), Netherlands (NL), Taiwan (TW), United States (US) and South Africa (ZA).
(y) Average of major UK banks’ five-year senior CDS premia, weighted by total assets until 2014 and by half-year total assets from 2015. Series starts in 2003. In the latest value Nationwide’s senior CDS is weighted by 2016 H1total assets as the latest published figures relate to 2016 H1. Sources: Markit Group Limited, published accounts and Bank calculations.
(z) Relates the share price with the book, or accounting, value of shareholders’ equity per share. Averages of the ratios in the peer group, weighted by end-year total assets. The sample comprises the major UK banks and NationalAustralia Bank between 2005 and 2015 H2, excluding Britannia, Co-operative Banking Group, and Nationwide. Northern Rock/Virgin Money is excluded from 2008. Series starts in 2000. Sources: Thomson Reuters Datastream,published accounts and Bank calculations.
(aa) Total peer group market capitalisation divided by total peer group assets (note a discontinuity due to introduction of IFRS accounting standards in 2005, which tends to reduce leverage ratios thereafter). The sample comprisesthe major UK banks, excluding Britannia, Co-operative Banking Group and Nationwide. National Australia Bank is included between 2005 and 2015 H2. Northern Rock/Virgin Money is excluded from 2008. Series starts in 2000.Sources: Thomson Reuters Datastream, published accounts and Bank calculations.
(ab) Sample consists of Barclays Group, Co-operative Banking Group, HSBC Holdings Group, Lloyds Banking Group, Nationwide Building Society Group, RBS Group, Santander UK Group and excludes Nationwide for 2008 H2 only.Average risk weights for residential mortgages (exposures on the Retail IRB method only) are calculated as total risk-weighted assets divided by total exposure value for all banks in the sample. Calculated on a consolidated basis,except for Nationwide for 2014 H2/2015 H1 where only solo data were available. Series starts in 2009 and is updated half-yearly. Sources: PRA regulatory returns and Bank calculations.
(ac) Sample consists of Bank of Scotland, Barclays Bank, HSBC Bank, Lloyds Bank, National Westminster Bank, Nationwide, Santander UK, Co-operative Bank, Royal Bank of Scotland, Ulster Bank and excludes Nationwide for2008 H2 only. Average risk weights for residential mortgages (exposures on the Retail IRB method only) are calculated as total risk-weighted assets divided by total exposure value for all banks in the sample. Calculated on anunconsolidated basis, Royal Bank of Scotland data includes National Westminster, Ulster Bank and RBS. Historical data updated as of June 2016 to improve data series consistency. Series starts in 2009 and is updated half-yearly. Sources: PRA regulatory returns and Bank calculations.
(ad) The disclosures the series are based on are not currently sufficient to ensure that all intra-financial activity is included in these series, nor is it possible to be certain that no real-economy activity is included. Additional datacollections would be required to improve the data in this area. The intra-financial lending and borrowing growth series are adjusted for the acquisitions of Midland by HSBC in 1992, and of ABN AMRO by RBS in 2007 to avoidreporting large growth rates resulting from step changes in the size and interconnectedness of the major UK bank peer group. Series exclude National Australia Bank.
(ae) Lending to other banks and other financial corporations. Growth rates are year on year. Latest value shows growth rate for year to 2016 H2. Data point excludes National Australia Bank. Sources: Published accounts andBank calculations.
(af) Wholesale borrowing, composed of deposits from banks and non-subordinated securities in issue. Growth rates are year-on-year. Latest value shows growth rate for year to 2016 H2. Data point excludes National AustraliaBank. One weakness of the current measure is that it is not possible to distinguish between retail deposits and deposits placed by non-bank financial institutions on a consolidated basis. Sources: Published accounts and Bankcalculations.
(ag) Based on notional value of derivatives (some of which may support real economy activity). The sample includes Barclays, HSBC and RBS who account for a significant share of UK banks’ holdings of derivatives, though the samplecould be adjusted in the future should market shares change. Series starts in 2002. Growth rates are year on year. Latest value shows growth rate for year to 2016 H2. Sources: Published accounts and Bank calculations.
(ah) This indicator highlights the countries where UK-owned MFIs’ non-bank private sector exposures are greater than 10% of UK-owned MFIs’ tangible equity on an ultimate risk basis and have grown by more than 1.5 times nominalGDP growth in that country. Foreign exposures as defined in BIS consolidated banking statistics. Overseas sectoral exposures cannot currently be broken down further at the non-bank private sector level. The intention is todivide them into households and corporates as new data become available. Uses latest data available, with the exception of tangible equity figures for 2006–07, which are estimated using published accounts. Sources:Bank of England, ECB, IMF World Economic Outlook (WEO), Thomson Reuters Datastream, published accounts and Bank calculations.
(ai) The twelve month growth rate of nominal credit. Defined as the four quarter cumulative net flow of credit divided by the stock of credit twelve months ago. Credit is defined as all liabilities of the household and not-for-profitsector except for the unfunded pension liabilities and financial derivatives of the not-for-profit sector. Sources: ONS and Bank calculations.
(aj) Four-quarter growth rate of UK-resident MFIs’ loans to the real estate sector. The real estate sector is defined as: buying, selling and renting of own or leased real estate; real estate and related activities on a fee or contractbasis; and development of buildings. Non seasonally adjusted. Quarterly data. Data cover lending in both sterling and foreign currency from 1998 Q4. Prior to this period, data cover sterling only. Source: Bank of England.
(ak) Gross debt as a percentage of a four-quarter moving sum of gross disposable income of the UK household and non-profit sector. Includes all liabilities of the household sector except for the unfunded pension liabilities andfinancial derivatives of the non-profit sector. Disposable income is adjusted for financial intermediation services indirectly measured (FISIM) and changes in pension entitlements. Sources: ONS and Bank calculations.
(al) Gross debt as a percentage of a four-quarter moving sum of gross operating surplus. Gross debt is measured as loans and debt securities excluding derivatives, direct investment loans and loans secured on dwellings. Thecorporate gross operating surplus series is adjusted for FISIM. Sources: ONS and Bank calculations.
(am) Gross debt as a percentage of four-quarter moving sum of nominal GDP. The NBFI sector includes all financial corporations apart from monetary financial institutions (ie deposit taking institutions). This indicator additionallyexcludes insurance companies and pension funds. Sources: ONS and Bank calculations.
(an) Ratio between an average of the seasonally adjusted Halifax and Nationwide house price indices and RPI housing rent. The series is rebased so that the average between 1987 and 2006 is 100. Sources: Halifax/Markit,Nationwide, ONS and Bank calculations.
(ao) The prime (secondary) yield is the ratio between the weighted averages, across the lowest (highest) yielding quartile of commercial properties, of MSCI Inc.’s measures of rental income and capital values. Sources: MSCI Inc. andBank calculations.
(ap) Mean LTV (respectively LTI) ratio on new advances above the median LTV (LTI) ratio, based on loans to first-time buyers, council/registered social tenants exercising their right to buy and homemovers, and excluding lifetimemortgages and advances with LTV above 130% (LTI above 10x). FCA Product Sales Data includes regulated mortgage contracts only. Series starts in 2005. Sources: FCA Product Sales Data and Bank calculations.
(aq) Average of the maximum offered loan to value ratios across major CRE lenders. Series starts in 2002. Sources: De Montfort University and Bank calculations.(ar) The residential mortgage lending spread is a weighted average of quoted mortgage rates over risk-free rates, using 90% LTV two-year fixed-rate mortgages and 75% LTV tracker, two and five-year fixed-rate mortgages. Spreads
are taken relative to gilt yields of matching maturity for fixed-rate products. Spreads are taken relative to Bank Rate for the tracker product. Weights based on relative volumes of new lending. Series starts in 1997. FCA ProductSales Data includes regulated mortgage contracts only. Sources: Bank of England, Bloomberg, Council of Mortgage Lenders, FCA Product Sales Data and Bank calculations.
(as) The CRE lending spread is the average of senior loan margins across major CRE lenders relative to Bank Rate. Series starts in 2002. Sources: Bank of England, Bloomberg, De Montfort University and Bank calculations.

48 Financial Stability Report June 2017
Table A.3 Core indicator set for LTV and DTI limits(a)
Indicator Average, Average Minimum Maximum Previous Latest value 1987–2006(b) 2006(c) since 1987(b) since 1987(b) value (oya) (as of 16 June 2017)
Lender and household balance sheet stretch
1 LTI and LTV ratios on new residential mortgages
Owner-occupier mortgage LTV ratio 90.6% 90.6% 81.6% 90.8% 86.7% 87.3% (2017 Q1)(mean above the median)(d)
Owner-occupier mortgage LTI ratio 3.8 3.8 3.6 4.2 4.1 4.2 (2017 Q1)(mean above the median)(d)
Buy-to-let mortgage LTV ratio (mean)(e) n.a. n.a. 63.8% 75.4% 65.9% 63.8% (2016 Q4)
2 Household credit growth(f) 10.3% 11.2% -0.6% 19.6% 3.7% 4.5% (2016 Q4)
3 Household debt to income ratio(g) 100.1% 141.8% 78.2% 150.5% 132.2% 135.0% (2016 Q4)
of which: mortgages(h) 70.8% 103.8% 50.7% 113.2% 101.0% 101.0% (2016 Q4)
of which: owner-occupier mortgages(i) 80.6% 95.0% 67.2% 100.0% 84.3% 83.6% (2016 Q4)
Conditions and terms in markets
4 Approvals of loans secured on dwellings(j) 97,922 119,045 26,702 134,710 66,182 64,645 (Apr. 2017)
5 Housing transactions(k) 129,508 139,039 51,660 221,978 83,050 99,910 (Apr. 2017)
Advances to homemovers(l) 48,985 59,342 14,300 93,500 22,000 25,700 (Apr. 2017)
% interest only(m) 53.3% 31.0% 1.8% 81.3% 1.8% 2.3% (Apr. 2017)
Advances to first-time buyers(l) 39,179 33,567 8,500 55,800 24,800 25,400 (Apr. 2017)
% interest only(m) 52.1% 24.0% 0.0% 87.9% 0.0% 0.0% (Apr. 2017)
Advances to buy-to-let purchasers(l) 10,128 14,113 3,600 29,100 4,200 5,300 (Apr. 2017)
% interest only(n) n.a. n.a. 50.0% 74.3% 74.3% 72.4% (2017 Q1)
6 House price growth(o) 1.8% 2.2% -5.6% 7.0% 1.4% -0.2% (May 2017)
7 House price to household disposable income ratio(p) 3.0 4.6 2.2 4.8 4.4 4.6 (2016 Q4)
8 Rental yield(q) 5.8% 5.1% 4.8% 7.6% 5.0% 4.8% (Apr. 2017)
9 Spreads on new residential mortgage lending
All residential mortgages(r) 80 bps 51 bps 35 bps 379 bps 176 bps 161 bps (Apr. 2017)
Difference between the spread on high and 18 bps 25 bps 1 bps 293 bps 84 bps 101 bps (May 2017)low LTV residential mortgage lending(r)
Buy-to-let mortgages(s) n.a. n.a. 61 bps 397 bps 259 bps 253 bps (2017 Q1)
(a) A spreadsheet of the series shown in this table is available at www.bankofengland.co.uk/financialstability/Pages/fpc/coreindicators.aspx.(b) If the series start after 1987, the average between the start date and 2006 end and the maximum/minimum since the start date are used.(c) 2006 was the last year before the global financial crisis.(d) Mean LTV (respectively LTI) ratio on new advances above the median LTV (LTI) ratio, based on loans to first-time buyers, council/registered social tenants exercising their right to buy and homemovers, and excluding lifetime
mortgages and advances with LTV ratio above 130% (LTI above 10x). FCA Product Sales Data includes regulated mortgage contracts only. Series starts in 2005. Sources: FCA Product Sales Data and Bank calculations.(e) Estimated mean LTV ratio of new non-regulated lending advances, of which buy-to-let is 88% by value. The figures include further advances and remortgages. The raw data is categorical: the share of mortgages with LTV ratio
less than 75%; between 75% and 90%; between 90% and 95%; and greater than 95%. An approximate mean is calculated by giving these categories weights using the average LTV in equivalent buckets in loan level buy-to-let data gathered by the Council of Mortgage Lenders. Series starts in 2007. Council of Mortgage Lenders data available from 2014; weights prior to this date are average LTVs across the respective buckets using all datagathered in 2014. The share of mortgages with LTV ratio at 75% from 2014 onwards used are adjusted to estimate the LTV of each loan before any fees or charges are added. This approximates the LTV at which the loan wasoriginated. Source: Bank of England, Council of Mortgage Lenders and Bank calculations.
(f) The twelve month growth rate of nominal credit. Defined as the four-quarter cumulative net flow of credit divided by the stock of credit twelve months ago. Credit is defined as all liabilities of the household and not-for-profitsector except for the unfunded pension liabilities and financial derivatives of the not-for-profit sector. Sources: ONS and Bank calculations.
(g) Gross debt as a percentage of a four-quarter moving sum of gross disposable income of the UK household and non-profit sector. Includes all liabilities of the household sector except for the unfunded pension liabilities andfinancial derivatives of the non-profit sector. Disposable income is adjusted for financial intermediation services indirectly measured (FISIM) and changes in pension entitlements. Sources: ONS and Bank calculations.
(h) Total debt secured on dwellings as a percentage of a four-quarter moving sum of gross disposable income of the UK household and non-profit sector. Disposable income is adjusted for FISIM and changes in pension entitlements.Sources: ONS and Bank calculations.
(i) Total debt associated with owner-occupier mortgages divided by the four-quarter moving sum of gross disposable income of the UK household and non-profit sector. Disposable income is adjusted for FISIM and changes inpension entitlements. Owner-occupier mortgage debt estimated by multiplying aggregate household debt secured on dwellings by the share of mortgages on lender balances that are not buy-to-let loans. Series starts in 1999.Sources: Council of Mortgage Lenders, ONS and Bank calculations.
(j) Data are for monthly number of house purchase approvals covering sterling lending by UK MFIs and other lenders to UK individuals. Approvals secured on dwellings are measured net of cancellations. Seasonally adjusted. Series starts in 1993. Source: Bank of England.
(k) The number of houses sold/bought in the current month is sourced from HMRC’s Land Transaction Return. From 2008 the Return excluded properties priced at less than £40,000 (2006 and 2007 data have also been revised byHMRC to correct for this). Data prior to 2005 comes from the Survey of Property Transactions; the UK total figure is computed by assuming that transactions in the rest of the United Kingdom grew in line with England, Walesand Northern Ireland. Seasonally adjusted. Sources: Council of Mortgage Lenders, HMRC and Bank calculations.
(l) The number of new mortgages advanced for house purchase in the current month. Buy-to-let series starts in 2001. There are structural breaks in the series in April 2005 where the Council of Mortgage Lenders switches source.Data prior to 2002 are at a quarterly frequency. Sources: Council of Mortgage Lenders and Bank calculations.
(m)The share of new owner-occupied mortgages advanced for house purchase that are interest only. Interest-only mortgages exclude mixed capital and interest mortgages. There are structural breaks in the series in April 2005where the Council of Mortgage Lenders switches source. Data prior to 2002 are at a quarterly frequency. Sources: Council of Mortgage Lenders and Bank calculations.
(n) The share of non-regulated mortgages that are interest only. The data include all mortgages, not just those for house purchase. Interest-only mortgages exclude mixed capital and interest mortgages. Sources: Bank of Englandand Bank calculations.
(o) House prices are calculated as the mean of the average UK house price as reported in the Halifax and Nationwide house price indices. Growth rate calculated as the percentage change three months on three months earlier.Series starts in 1991. Seasonally adjusted. Sources: Halifax/Markit, Nationwide and Bank calculations.
(p) The ratio is calculated using a four-quarter moving sum of gross disposable income of the UK household and non-profit sector per household as the denominator. Disposable income is adjusted for FISIM and changes in pensionentitlements. Historical UK household population estimated using annual GB data assuming linear growth in the Northern Ireland household population between available data points. Series starts in 1990. Sources:Department for Communities and Local Government, Halifax/Markit, Nationwide, ONS and Bank calculations.
(q) Using Association of Residential Letting Agents (ARLA) data up until 2014. From 2015 onwards, the series uses LSL Property Services plc data normalised to the ARLA data over 2008 to 2014, when both series are available.Series starts in 2001. Sources: Association of Residential Letting Agents, LSL Property Services plc and Bank calculations.
(r) The overall spread on residential mortgage lending is a weighted average of quoted mortgage rates over risk-free rates, using 90% LTV two-year fixed-rate mortgages and 75% LTV tracker, two and five-year fixed-rate mortgages.Spreads are taken relative to gilt yields of matching maturity for fixed-rate products. Spreads are taken relative to Bank Rate for the tracker product. Weights are based on relative volumes of new lending. The difference inspread between high and low LTV lending is the rate on 90% LTV two-year fixed-rate mortgages less the 75% LTV two-year fixed-rate. Series starts in 1997. FCA Product Sales Data includes regulated mortgage contracts only.Sources: Bank of England, Bloomberg, Council of Mortgage Lenders, FCA Product Sales Data and Bank calculations.
(s) The spread on new buy-to-let mortgages is the weighted average effective spread charged on new floating and fixed-rate non-regulated mortgages over safe rates. Spreads are taken relative to Bank Rate for the floating-rateproducts. The safe rate for fixed-rate mortgages is calculated by weighting two-year, three-year and five-year gilts by the number of buy-to-let fixed-rate mortgage products offered at these maturities. Series starts in 2007.Sources: Bank of England, Bloomberg, Moneyfacts and Bank calculations.

Index of charts and tables 49
Index of charts and tables
Charts
Executive summary iA Major UK banks’ capital ratios iiB Annual growth rates of consumer credit products and
household income iiC China non-financial sector debt and growth of total
social financing ivD International ten-year real government bond yields ivE Commercial real estate prices in the United Kingdom
and ranges of sustainable valuations ivBox 1A Growth in credit to households and firms compared
with nominal GDP growth viBox 2A Net inward financing flows ixB UK CRE transactions (gross quarterly flows) ix
Part AThe FPC’s approach to addressing risks from the UK mortgage market 1A.1 UK house price to household income ratio 2A.2 Completions of new dwellings in the United Kingdom 2A.3 UK household debt to income ratio 3A.4 Household debt to income ratio and consumption
growth over 2007–12 3A.5 Change in consumption relative to income among
mortgagors with different LTI ratios between 2007 and 2009 3
A.6 Households in two-month arrears by mortgage DSR 4A.7 Percentage of households with mortgage debt-servicing
ratios of 40% or greater 4A.8 Cumulative five-year loss rates on UK mortgages in past
downturns and in stress tests 5A.9 New mortgage lending by LTV at origination 5A.10 UK mortgage books by indexed LTV 5A.11 Mortgage rates on owner-occupier and buy-to-let
lending relative to risk-free rates 6A.12 Proportion of new mortgages with no fees 6Fig. A.1 Feedback loops between mortgage credit and house
prices can amplify a downturn 6A.13 Composition of the outstanding mortgage stock 7A.14 Relationship between the affordability test and the
LTI flow limit in constraining lending 8A.15 Flow of new mortgages by LTI 9A.16 Share of new mortgages by mortgage term 9A.17 LTI distribution of new mortgage lending 9A.18 Risk weights on UK ‘prime’ mortgages by LTV 11Box 4A Mortgages’ LTV ratio and house price to income ratio 12
UK consumer credit 14A.19 Annual growth rates of consumer credit products
and household income 14A.20 Spread between effective interest rates on new
personal loans and Bank Rate 15A.21 Interest-free periods of credit card balance transfer
offers 15
A.22 Major UK banks’ average risk weights on consumer credit exposures 16
A.23 End-2016 mortgage and personal loan portfolios of major UK banks, by year of issuance 16
A.24 UK banks’ sterling write-offs on lending to individuals 17A.25 Historical relationship between changes in
unemployment and write-offs on non-credit card consumer credit exposures 17
Box 6A Composition of the stock of consumer credit,
end-March 2017 18B Value of annual dealership car finance for new car
purchases, and proportion of private new carpurchases funded with dealership car finance 19
Global environment 20A.26 International annual GDP growth projections 20A.27 China non-financial sector debt and growth of total
social financing 21A.28 Domestic value added in exports to China 21A.29 UK-owned banking groups’ consolidated exposures to
selected countries and regions 22A.30 Ratio of non-performing loans and advances to total
loans and advances (2016 Q4) 22
Asset valuations 23A.31 International ten-year real government bond yields 23A.32 Dispersion in implied volatilities in foreign exchange,
interest rate and equity markets 24A.33 High-yield corporate bond spreads 24A.34 Changes in nominal ten-year interest rates since the
November Report 25A.35 Commercial real estate prices in the
United Kingdom and ranges of sustainable valuations 25A.36 Estimated losses in global corporate bond markets
following a 100 basis point increase in interest rates 26A.37 UK CRE debt reported to De Montfort University
survey 26
Part BBanking sector resilience 27B.1 Major UK banks’ capital ratios 27B.2 Major UK banks’ leverage ratios 28B.3 Average interest rates on new lending and Bank Rate 30B.4 UK banks’ share prices and FTSE All-Share index since
1 January 2016 30B.5 UK banks’ statutory and underlying return on equity 31B.6 UK banks’ average price to book ratio 31B.7 Price to book ratios for major global banks compared
with expected returns on equity 31
Market-based finance 34B.8 Net finance raised by UK private non-financial
corporations (PNFCs) 34B.9 Dealers’ leverage ratios 35B.10 Proportion of cash balance placed in repo of a
major European asset manager, split by counterparty 36

50 Financial Stability Report June 2017
B.11 Gilt repo rates paid by a group of pension fundasset managers in excess of expectations of policy interest rates 36
B.12 UK, French and German repo rates 36B.13 Stock of property-related non-linked illiquid
assets during 2016 37
Tables
Part AThe FPC’s approach to addressing risksfrom the UK mortgage market 1A.1 The Bank has an extensive toolkit to address risks
from the UK mortgage market 7A.2 Cuts in consumption between 2007 and 2009 among
mortgagors with different LTI ratios 10
Part BBanking sector resilience 27B.1 Selected measures of UK banks’ funding costs 30Box 71 The FPC’s Recommendations on cyber resilience 32
Market-based finance 34Box 81 Service characteristics of the renewed RTGS service 40
Annex 2: Core indicators 45A.1 Core indicator set for the countercyclical capital buffer 45A.2 Core indicator set for sectoral capital requirements 46A.3 Core indicator set for LTV and DTI limits 48

Glossary and other information 51
Glossary and other information
Glossary of selected data and instrumentsCDS – credit default swap.CPI – consumer prices index.GDP – gross domestic product.HICP – harmonised index of consumer prices.LCF – Living Costs and Food Survey.RPI – retail prices index.SVR – standard variable rate.
AbbreviationsARF – Authorities’ Response Framework.AT1 – additional Tier 1.BHPS – British Household Panel Survey.BIS – Bank for International Settlements.CBEST – UK Government’s National Cyber SecurityProgramme.CBPS – Corporate Bond Purchase Scheme.CCyB – countercyclical capital buffer.CCP – central counterparty.CEIC – CEIC Data Company Ltd.CET1 – common equity Tier 1.CGFS – Committee on the Global Financial System.CIS – collective insurance schemes.CML – Council of Mortgage Lenders.CRD IV – Capital Requirements Directive.CRE – commercial real estate.DSR – debt-servicing ratio.DTI – debt to income.ECB – European Central Bank.EEA – European Economic Area.EIOPA – European Insurance Occupational Pensions Authority.EME – emerging market economy.EU – European Union.FCA – Financial Conduct Authority.FDI – foreign direct investment.FISIM – financial intermediation services indirectly measured.FMI – financial market infrastructure.FPC – Financial Policy Committee.FSA – Financial Services Authority.FSB – Financial Stability Board.FTSE – Financial Times Stock Exchange.G7 – Canada, France, Germany, Italy, Japan, the United Kingdom and the United States.G20 – The Group of Twenty Finance Ministers and CentralBank Governors.G-SIB – global systemically important bank.HMRC – Her Majesty’s Revenue and Customs.HVPS – High-Value Payment System.ICR – interest coverage ratio.IFRS – International Financial Reporting Standard.
IIF – Institute of International Finance.IMF – International Monetary Fund.IOSCO – International Organization of SecuritiesCommissions.IRB – internal ratings based.LTI – loan to income.LTV – loan to value.MCOB – Mortgages and Home Finance: Conduct of Businesssourcebook.MFI – monetary financial institution.MPC – Monetary Policy Committee.MREL – minimum requirement for own funds and eligibleliabilities.MSCI – Morgan Stanley Capital International Inc.NBFI – non-bank financial institution.NCSC – National Cyber Security Centre.NSFR – Net Stable Funding Ratio.OECD – Organisation for Economic Co-operation andDevelopment.ONS – Office for National Statistics.OTC – over the counter.PCP – personal contract purchase.PNFC – private non-financial corporation.PPI – payment protection insurance.PRA – Prudential Regulation Authority.PSD – Product Sales Database.RBS – Royal Bank of Scotland.RFB – ring-fenced bank.RICS – Royal Institution of Chartered Surveyors.RoE – return on equity.RTGS – real-time gross settlement.SME – small and medium-sized enterprise.SMF – Sterling Monetary Framework.SMMT – Society of Motor Manufacturers and Traders.SRB – systemic risk buffer.S&P – Standard & Poor’s.TFS – Term Funding Scheme.WEO – IMF World Economic Outlook.