file_sb8_hisped_fnl
DESCRIPTION
By Adriana D. Kohler and Melissa Lazarín* I Latinos are a significant and growing proportion of the United States student population. In 2007 S TATISTICAL B RIEF N O . 8 Hispanics** have become the largest and fastest-growing minority group in the U.S., rising from 12% of the population in 2000 to 14% of the total U.S. population in 2004. 1TRANSCRIPT
IntroductionHispanics** have become thelargest and fastest-growingminority group in the U.S.,rising from 12% of thepopulation in 2000 to 14%of the total U.S. populationin 2004.1
While in some areas therehas been improvement in thestatus of Latino educationover the past decade, thedata continue to show thatHispanic educationalattainment does not matchthat of non-Hispanics.Participation in all levels ofeducation continues to below, while dropout andretention rates are still high.Insufficient financial aid andinadequate access to rigorouscourses and educationalresources are among thechallenges in improving theeducational status of
Latinos. Also, as immigrantand English language learner(ELL) students become agrowing segment of theLatino student population,educational gaps betweenLatinos and other U.S.students have becomeincreasingly apparent. Fromearly childhood throughhigher education, Latinoscontinue to be underservedby educational programsdesigned to help the mostdisadvantaged students.This statistical brief providesa summary of the key dataconcerning Latinos in theeducational pipeline.
Demographyof theHispanicStudentPopulationLatino children under 18years of age are the second-largest group of studentsafter Whites. Latino school-aged children are also amongthe fastest-growing studentpopulations. Furthermore,although Latino students arestill concentrated in“traditional” Latino states,such as Texas and California,their presence is growing innontraditional states in theMidwest and Southeast.
! Latinos are a significantand growing proportionof the United Statesstudent population. In
NCLRNATIONAL COUNCIL OF LA RAZA
2007STATISTICAL BRIEF NO. 8
* Adriana D. Kohler was a Policy Intern for Education Reform at the National Council of La Raza (NCLR) in 2006. Melissa Lazarín is theNCLR Senior Policy Analyst for Education Reform. The authors thank other NCLR staff who contributed to the completion of this brief,including Raul González, Legislative Director, who provided substantive input and oversight; Jennifer Kadis, Director of Quality Control,who provided expert editorial guidance; and Rosemary Aguilar, Director of the Graphics & Design Unit, who prepared this document forpublication and distribution. This brief was made possible with the support of the Bill & Melinda Gates Foundation. The findings andconclusion presented here, however, are those of the authors and NCLR alone. Permission to copy, disseminate, or otherwise useinformation from this paper is granted, provided that appropriate credit is given to NCLR.
** The terms “Hispanic” and “Latino” are used interchangeably by the U.S. Census Bureau and throughout this paper to identify personsof Mexican, Puerto Rican, Cuban, Central and South American, Dominican, Spanish, and other Hispanic descent; they may be of anyrace.
Hispanic Education in theUnited StatesBy Adriana D. Kohler and Melissa Lazarín*

N C L R S t a t i s t i c a l B r i e f ! 2 0 0 7 ! N o. 8 ! Pa g e 2
FIGURE 1
Minority Enrollment: Percentage Distribution of the Race/Ethnicity of Public School
Students Enrolled in Grades K-12, by Region: Fall 1972 and 2004
1 Includes Asian/Pacific Islanders# Rounds to zeroSource: National Center for Education Statistics, “Racial/Ethnic Distribution of Public School Students: Indicator 5,” The Condition ofEducation 2006. Washington, DC: U.S. Department of Education, 2006, p. 32.
particular, 32.1% of theHispanic population is enrolledin our nation’s schools.2 In2005, Hispanics accounted formore than 10.9 millionstudents enrolled in U.S.prekindergarten through 12thgrade public schools and 1.9million students enrolled ininstitutions of highereducation, representing 17% oftotal student enrollment.3
! The growth among the Latinostudent population hassignificantly surpassed thatof other ethnic/racial groups.Between 1993 and 2003, theproportion of Hispanic studentsenrolled in public elementaryand secondary schoolsincreased from 12.7% to 19%,while the proportion of Whitestudents decreased from 66%to 58% and the proportion of
Black students increasedslightly from 16.6% to 17.2%.4
! Hispanic students are agrowing presence in K-12public schools in every regionof the United States. Between1972 and 2004, the proportionof Hispanic K-12 students inthe West grew from 15% to39%, with minority enrollmentexceeding White enrollment by2003 (see Figure 1). Also, for

that same period, the Hispanicstudent population increasedin the South from 5% to 17%,in the Midwest from 2% to 7%,and in the Northeast from 6%to 14%.5
! Hispanic children represent alarge proportion of school-aged immigrant children.Specifically, Hispanicimmigrant children account formore than half (58%) of allimmigrant youth in the U.S.6
In considering this statisticand its relationship to Latinostudents, it is also importantto note that there is a largershare of foreign-bornimmigrants in the upper gradesthan in the lower grades.Specifically, foreign-bornchildren* account for 3% ofchildren in grades preK-5, andapproximately 5.7% of studentsin grades 6-12 are foreign-born.7 Moreover, a significantnumber of children areundocumented immigrants, orhave parents who areundocumented immigrants;approximately 1.6 millionchildren under age 18 in theU.S. are undocumented
immigrants, and an additionalthree million children arenative-born U.S. citizens buthave parents who areundocumented.8
Hispanics andEarly ChildhoodEducationAccess to early childhoodeducation programs has a positiveimpact on the school careers ofchildren. However, while Latinochildren account for more thanone in five (22%) of all childrenunder the age of five, they areunderrepresented in earlychildhood education programs.9
! There is a greater likelihoodthat Black and White three-to five-year-olds will beenrolled in center-basedpreschool educationcompared to Hispanicchildren of the same agegroup. In 2005, 66% of Blackchildren and 59% of Whitechildren participated in suchprograms, while only 43% ofHispanic childrenparticipated.10
! Hispanic three- to five-year-olds below the poverty lineare less likely than theirBlack or White peers to beenrolled in preprimaryprograms. Among Hispanicchildren ages three to five whoare living in poverty, fewerthan four in ten (36%) areenrolled in early childhoodcare and education programs.In contrast, 65% of Black and45% of White children of thesame age group living belowthe poverty line are enrolled inthese programs.11
! Hispanic children under theage of five are underservedin Head Start programs. Forexample, the Migrant andSeasonal Head Start (MSHS)program reaches only 19%(31,400 out of 161,400) ofeligible farmworker children.12
In addition, the Early HeadStart (EHS) program, whichprovides learning opportunitiesfor infants and toddlers in theU.S., served a mere 2.8%(22,115 out of 789,857) ofeligible Hispanic familiesduring the 2003-2004 programyear.13
N C L R S t a t i s t i c a l B r i e f ! 2 0 0 7 ! N o. 8 ! Pa g e 3
* These data include both Hispanic and non-Hispanic foreign-born children.
! There has been significantgrowth in the number ofSpanish-speaking Head Startparticipants. While in 199317.5% of Head Start childrenwere Spanish-speakers, by 2004the proportion had grown tomore than 23%.14
Hispanics andHigh SchoolEducation Approximately 2.9 millionHispanics are enrolled in U.S. highschools, representing 17% of allsecondary public school students.15
Yet, Hispanic students are lesslikely than their non-Hispanicpeers to complete high school,and high school dropout rates arehighest among recent Hispanicimmigrants. Furthermore, Latinosare underrepresented in advancedscience and mathematics highschool courses and in gifted andtalented education programs.
High School Dropoutand Completion Ratesamong Latinos! Grade retention among
Latinos is linked to highschool dropout rates.Hispanic 16- to 19-year-oldswho drop out of high schoolare more likely to have beenretained than youth who hadcompleted high school. In2004, for example, 11% ofHispanic youth who haddropped out of high school hadbeen retained in a grade atsome point in their schoolcareer, compared to 4.3% ofHispanic youth who completedhigh school.16
N C L R S t a t i s t i c a l B r i e f ! 2 0 0 7 ! N o. 8 ! Pa g e 4
FIGURE 2
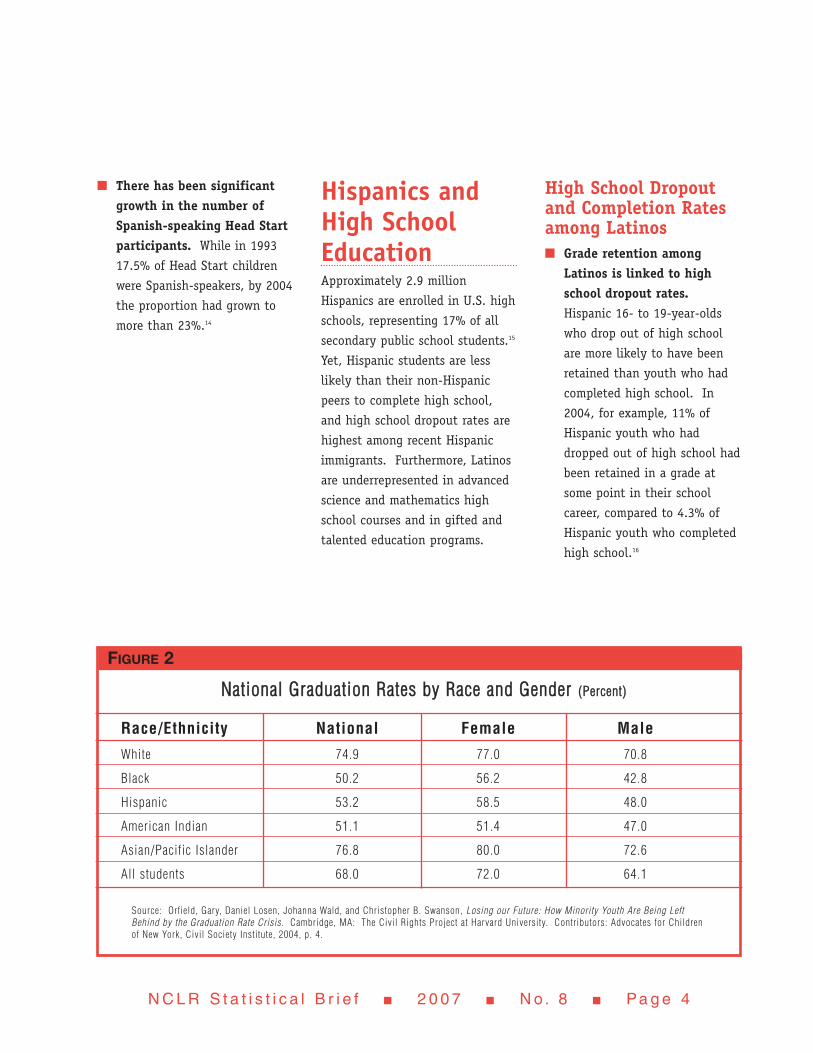
NNaattiioonnaall GGrraadduuaattiioonn RRaatteess bbyy RRaaccee aanndd GGeennddeerr ((PPeerrcceenntt))
Race/Ethnicity National Female MaleWhite 74.9 77.0 70.8
Black 50.2 56.2 42.8
Hispanic 53.2 58.5 48.0
American Indian 51.1 51.4 47.0
Asian/Pacific Islander 76.8 80.0 72.6
All students 68.0 72.0 64.1
Source: Orfield, Gary, Daniel Losen, Johanna Wald, and Christopher B. Swanson, Losing our Future: How Minority Youth Are Being LeftBehind by the Graduation Rate Crisis. Cambridge, MA: The Civil Rights Project at Harvard University. Contributors: Advocates for Childrenof New York, Civil Society Institute, 2004, p. 4.
N C L R S t a t i s t i c a l B r i e f ! 2 0 0 7 ! N o. 8 ! Pa g e 5
! Hispanics are significantlyless likely to complete highschool than their Whitepeers.* Although the highschool graduation rate forWhite students is 75%, only anestimated 53.2% of Hispanicstudents and 50% of Blackstudents who enter 9th gradewill complete the 12th gradeand graduate with a regulardiploma. In addition, theserates are lower among minoritymales; only 43% of Black and48% of Hispanic male studentsgraduate from high school (seeFigure 2).17
! High school dropout rates areparticularly high for 16- to24-year-old foreign-bornLatinos. Foreign-bornHispanic dropouts account for25.3% of all dropouts in theUnited States. In 2004, thestatus dropout rate** ofHispanic 16- to 24-year-oldsborn outside of the UnitedStates was 38.4%, which issignificantly higher than the
status dropout rate for first-generation*** Hispanics of thesame age group (14.7%).Latinos who are second-generation or greater**** dropout at a rate of 13.7%, whichis slightly lower than for first-generation Latinos.18
! Educational attainment issignificantly lower amongforeign-born Hispanics 25years and older than amongnative-born Hispanics of thesame ages. In 2005, there wasa significant difference in highschool graduation ratesbetween native- and foreign-born Hispanics. While 75% ofnative-born Hispanicscompleted high school, only46% of foreign-born Hispanicswere high school graduates.19
Rigorous AcademicPrograms ! Hispanic and Black high
school students are lesslikely than Whites to beenrolled in advanced
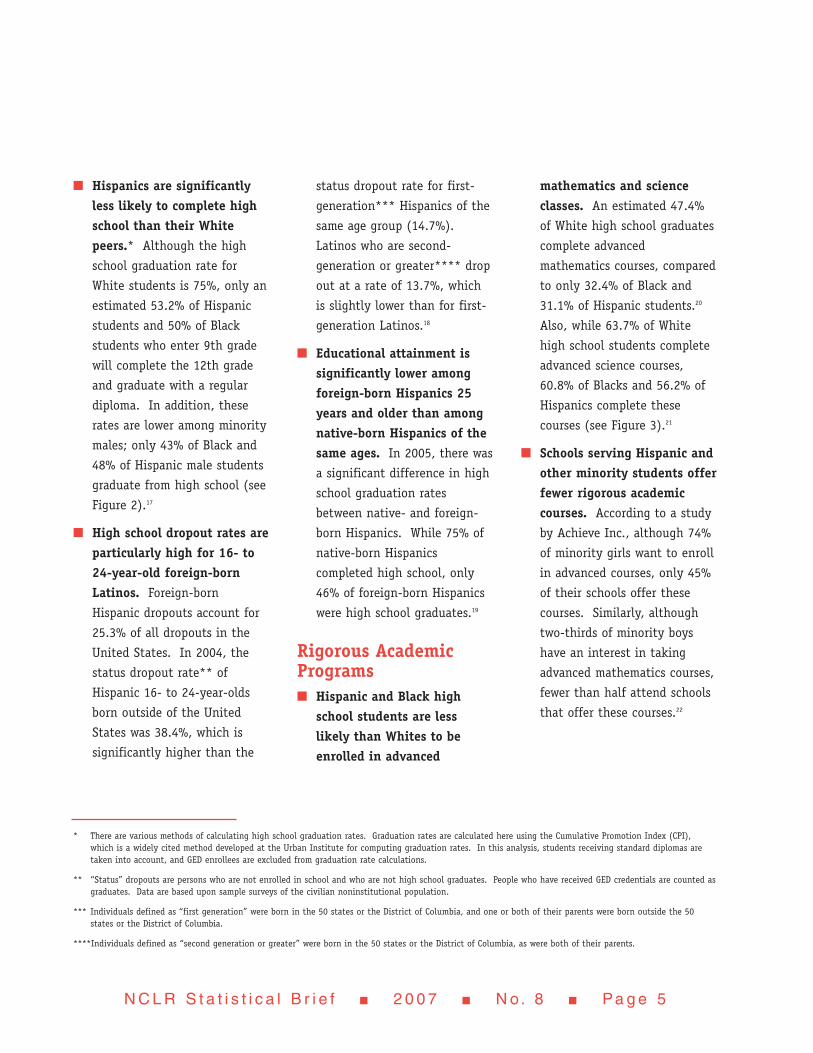
mathematics and scienceclasses. An estimated 47.4%of White high school graduatescomplete advancedmathematics courses, comparedto only 32.4% of Black and31.1% of Hispanic students.20
Also, while 63.7% of Whitehigh school students completeadvanced science courses,60.8% of Blacks and 56.2% ofHispanics complete thesecourses (see Figure 3).21
! Schools serving Hispanic andother minority students offerfewer rigorous academiccourses. According to a studyby Achieve Inc., although 74%of minority girls want to enrollin advanced courses, only 45%of their schools offer thesecourses. Similarly, althoughtwo-thirds of minority boyshave an interest in takingadvanced mathematics courses,fewer than half attend schoolsthat offer these courses.22
* There are various methods of calculating high school graduation rates. Graduation rates are calculated here using the Cumulative Promotion Index (CPI),which is a widely cited method developed at the Urban Institute for computing graduation rates. In this analysis, students receiving standard diplomas aretaken into account, and GED enrollees are excluded from graduation rate calculations.
** “Status” dropouts are persons who are not enrolled in school and who are not high school graduates. People who have received GED credentials are counted asgraduates. Data are based upon sample surveys of the civilian noninstitutional population.
*** Individuals defined as “first generation” were born in the 50 states or the District of Columbia, and one or both of their parents were born outside the 50states or the District of Columbia.
****Individuals defined as “second generation or greater” were born in the 50 states or the District of Columbia, as were both of their parents.
N C L R S t a t i s t i c a l B r i e f ! 2 0 0 7 ! N o. 8 ! Pa g e 6
! Hispanics and Blacksrepresent a small proportionof the student populationenrolled in gifted andtalented (GT) programs.*Black and Hispanic studentsare generally less likely thantheir White peers to participatein GT programs. In comparisonto White students, Blacks andHispanics are less than half aslikely to be enrolled in GTprograms, and Asian/PacificIslanders are one-third as likelyto be placed in GT programs.
Specifically, an estimated 7.5%of White and 10% ofAsian/Pacific Islander studentsare identified for placement ingifted programs; however, only3% of Hispanic and 3.5% ofBlack students are placed intoGT programs. Furthermore,studies have identified possiblereasons for these ethnic/racialdisparities, including failure ofBlack and Hispanic students tobe nominated to GT programs,the grade in which studentsare nominated, the qualities of
the GT program, andinformation considered duringthe screening process.23
Hispanics andEnglishLanguageLearnersGiven the predominance of Latinosamong the English languagelearner student population, it isno surprise that the rapid growthand the geographic distribution of
FIGURE 3
HHiigghh SScchhooooll GGrraadduuaatteess WWhhoo CCoommpplleetteedd AAddvvaanncceedd SScciieennccee aanndd MMaatthheemmaattiiccssCCoouurrsseess iinn 22000000 bbyy RRaaccee aanndd EEtthhnniicciittyy ((PPeerrcceenntt))
Race/ ethnicity Advanced chemistry, Advanced mathematicsphysics, or biology
White 63.7 47.4
Asian/Pacific Islander 79.7 68.6
Black 60.8 32.4
Hispanic 56.2 31.1
American Indian 43.1 29.2
Source: National Center for Education Statistics, The Condition of Education 2004. Washington, DC: U.S. Department of Education, 2004,Table 22-1 and 22-2.
* Students are identified for placement into GT programs by standardized measures of cognitive abilities and score among the top two percent on nationallystandardized intelligence tests. Existing class grades and work samples along with additional information on achievement, creativity, and leadership are takeninto account. GT programs are designed for students who display exceptional qualities, whose needs may not be sufficiently served in regular educationprograms, and who are likely to benefit from specialized education and related services.

N C L R S t a t i s t i c a l B r i e f ! 2 0 0 7 ! N o. 8 ! Pa g e 7
the ELL student population mirrorthat of the Latino studentpopulation. Likewise, educationaloutcomes for ELLs are intrinsicallytied to Latino studentachievement. Thus, inadequateaccess to rigorous courses andpersistent gaps in academicachievement are importantindicators in evaluating academicoutcomes among Latinos.
Nativity and Ethnicityof the Population! ELL students represent a
significant portion of theLatino student population.Nearly four-fifths (79%) of ELLstudents are Hispanic nativeSpanish-speakers.24 Also,nearly half (45%) of all Latinochildren are ELL students inour nation’s public schools.25
! Hispanic immigrants aremore likely than non-Hispanic immigrant groupsto be ELL students. AlthoughLatino immigrants make up58% of the total population ofimmigrant children, theyrepresent more than 75% ofELL students. In contrast,Asian immigrants make up 22%of total immigrant children,yet represent only 13% of ELLstudents.26
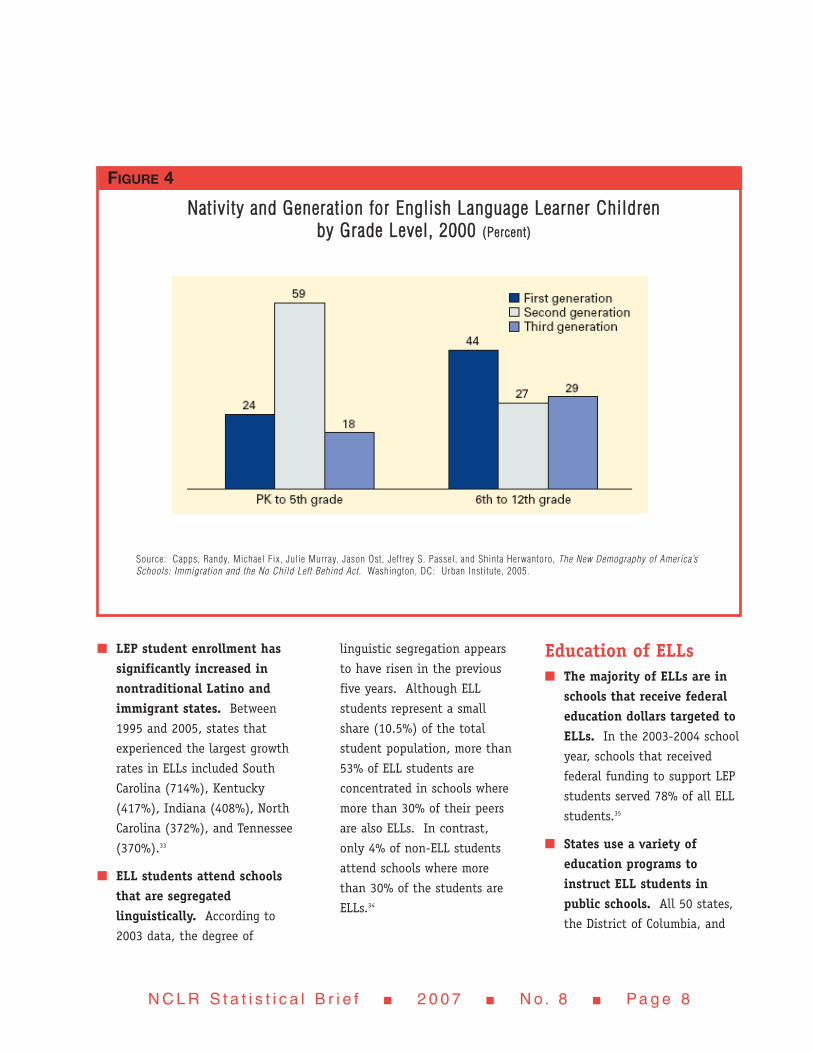
! In both elementary andsecondary education, mostELL students are native-bornand many have native-bornparents. Specifically, at theelementary level, 59% of ELLsare U.S.-born children ofimmigrants, or secondgeneration, and 18% arechildren of U.S. native-bornparents, or third generation.Only 24% of ELL elementaryschool children are foreign-born. In secondary schools,27% of ELLs are secondgeneration and 29% are thirdgeneration, compared to 44%of ELL students who areforeign-born. Thus, althoughthere is a larger share offoreign-born Hispanic ELLs inthe upper grades than in thelower grades, in bothelementary and secondarylevels the majority of ELLs arenative-born students (seeFigure 4).27
Growth and Size of thePopulation! The number of ELLs enrolled
in U.S. schools has increasedsubstantially in the pastdecade. During the 2004-2005academic year, there were anestimated 5.1 million ELLstudents enrolled in preK-12public schools, representing10.5% of the total public
school student enrollment anddemonstrating more than a56% increase between 1994-1995 and 2004-2005.28
! There is a larger share of LEPstudents in the lower grades.Approximately 52.6% of all LEPstudents are enrolled in gradespreK-5, and 47.4% of LEPchildren are enrolled in grades6-12.29
! The LEP student populationis mainly concentrated inmetropolitan areas. Anestimated 91% of LEP studentslive in metropolitan areas,compared to 79.5% of non-LEPstudents who live inmetropolitan areas.30 In fact,nearly 70% of the nation’s LEPelementary school students areenrolled in 10% ofmetropolitan-area schools.31
! LEP student enrollment isconcentrated in states withtraditionally large Hispanicpopulations. During the2004-2005 school year, thestates with the highestpercentages of LEP students intheir public school classroomswere California (25.7%), NewMexico (22.4%), Nevada(18.1%), Texas (15.5%), Alaska(15.1%), and Arizona(15.1%).32
N C L R S t a t i s t i c a l B r i e f ! 2 0 0 7 ! N o. 8 ! Pa g e 8
! LEP student enrollment hassignificantly increased innontraditional Latino andimmigrant states. Between1995 and 2005, states thatexperienced the largest growthrates in ELLs included SouthCarolina (714%), Kentucky(417%), Indiana (408%), NorthCarolina (372%), and Tennessee(370%).33
! ELL students attend schoolsthat are segregatedlinguistically. According to2003 data, the degree of
linguistic segregation appearsto have risen in the previousfive years. Although ELLstudents represent a smallshare (10.5%) of the totalstudent population, more than53% of ELL students areconcentrated in schools wheremore than 30% of their peersare also ELLs. In contrast,only 4% of non-ELL studentsattend schools where morethan 30% of the students areELLs.34
Education of ELLs! The majority of ELLs are in
schools that receive federaleducation dollars targeted toELLs. In the 2003-2004 schoolyear, schools that receivedfederal funding to support LEPstudents served 78% of all ELLstudents.35
! States use a variety ofeducation programs toinstruct ELL students inpublic schools. All 50 states,the District of Columbia, and
FIGURE 4
NNaattiivviittyy aanndd GGeenneerraattiioonn ffoorr EEnngglliisshh LLaanngguuaaggee LLeeaarrnneerr CChhiillddrreenn bbyy GGrraaddee LLeevveell,, 22000000 ((PPeerrcceenntt))
Source: Capps, Randy, Michael Fix, Julie Murray, Jason Ost, Jeffrey S. Passel, and Shinta Herwantoro, The New Demography of America’sSchools: Immigration and the No Child Left Behind Act. Washington, DC: Urban Institute, 2005.
N C L R S t a t i s t i c a l B r i e f ! 2 0 0 7 ! N o. 8 ! Pa g e 9
Puerto Rico have schools thatuse some type of English-as-a-second-language instructionalprogram. Forty states haveschools that use bilingual aswell as English-only programs.Twelve states have schools thatuse only English-mediumprograms. Finally, no stateuses only one program type.36
! There are differences in theachievement scores inreading and mathematicsbetween ELL students andnon-ELLs. According to the2005 National Assessment forEducational Progress, only 29%of ELL 8th-grade studentsscored at or above the basicachievement level formathematics, compared to 71%of non-ELL 8th graders. Also,only 29% of ELL 8th gradersscored at or above the basicachievement level for reading,compared to 75% of non-ELL8th-grade students.37
! Educational achievementamong ELL students is linkedto high school dropout rates.Specifically, Latino ELLstudents are less likely tocomplete high school than
Hispanics who are fluent inEnglish. While 15% of Latinosages 16-19 who are fluent inEnglish do not graduate fromhigh school, more than 59% ofLatino ELLs of the same agegroup are high schooldropouts.38
Hispanics andSchool ResourcesLatino children are more likely toattend schools that serve largelylow-income students and havefewer resources available forstudents. In many cases, theseschools also tend to have adisproportionately highconcentration of minoritystudents.
! Latino and Black studentsare more likely to attendschools that serve a largeconcentration of low-incomestudents.* Among 4thgraders, 49% of Hispanic and48% of Black students areenrolled in schools with thehighest measure of poverty,**compared to 5% of White and16% of Asian/Pacific Islander4th-grade students.39 Moreover,there is a strong relationship
between percent poor andpercent minority populationsin a school. Specifically, 88%of high-minority schools (morethan 90% minority) are high-poverty schools.40
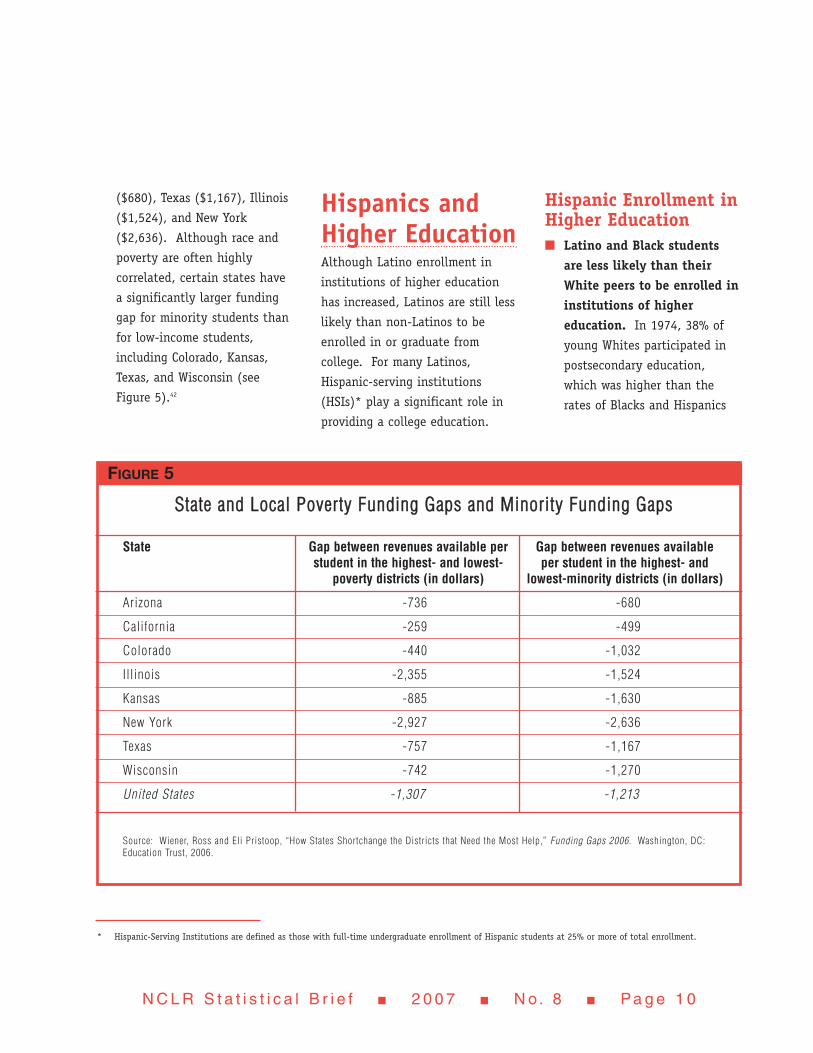
! Significant gaps in per-student expendituresbetween highest- and lowest-poverty districts includestates with large Latinocommunities. For example,such states include New Yorkwith a gap of $2,927 perstudent and Illinois($2,355).*** In 34 states, thehighest-poverty districtsreceive fewer cost-adjusteddollars than the lowest-povertydistricts (see Figure 5).41
! States that have considerablefunding gaps between low-and high-minority districtsinclude states with largeHispanic communities. Forexample, school districts withthe highest percentage ofminority children receivesignificantly less funding thandistricts with the fewestminority children in statesincluding California, with a gapof $499 per student, Arizona
* Levels of poverty can be measured by percentage of students eligible for national free or reduced-price lunch programs (FRL): very low= <5%, low=6-25%,medium= 26-50%, and high= 51-100%. Eligibility criteria for these programs are based on family size and income. In educational research, FRL eligibility is awidely employed measure of poverty and socioeconomic disadvantage.
** Schools with more than 75% of students eligible for free or reduced-price lunch.
*** Dollar amounts have been adjusted to account for regional cost differences, the additional cost of educating students with disabilities, and the additional costof educating low-income students.
N C L R S t a t i s t i c a l B r i e f ! 2 0 0 7 ! N o. 8 ! Pa g e 1 0
($680), Texas ($1,167), Illinois($1,524), and New York($2,636). Although race andpoverty are often highlycorrelated, certain states havea significantly larger fundinggap for minority students thanfor low-income students,including Colorado, Kansas,Texas, and Wisconsin (seeFigure 5).42
Hispanics andHigher EducationAlthough Latino enrollment ininstitutions of higher educationhas increased, Latinos are still lesslikely than non-Latinos to beenrolled in or graduate fromcollege. For many Latinos,Hispanic-serving institutions(HSIs)* play a significant role inproviding a college education.
Hispanic Enrollment inHigher Education! Latino and Black students
are less likely than theirWhite peers to be enrolled ininstitutions of highereducation. In 1974, 38% ofyoung Whites participated inpostsecondary education,which was higher than therates of Blacks and Hispanics
FIGURE 5
SSttaattee aanndd LLooccaall PPoovveerrttyy FFuunnddiinngg GGaappss aanndd MMiinnoorriittyy FFuunnddiinngg GGaappss
State Gap between revenues available per Gap between revenues availablestudent in the highest- and lowest- per student in the highest- and
poverty districts (in dollars) lowest-minority districts (in dollars)
Arizona -736 -680
California -259 -499
Colorado -440 -1,032
Illinois -2,355 -1,524
Kansas -885 -1,630
New York -2,927 -2,636
Texas -757 -1,167
Wisconsin -742 -1,270
United States -1,307 -1,213
Source: Wiener, Ross and Eli Pristoop, “How States Shortchange the Districts that Need the Most Help,” Funding Gaps 2006. Washington, DC:Education Trust, 2006.
* Hispanic-Serving Institutions are defined as those with full-time undergraduate enrollment of Hispanic students at 25% or more of total enrollment.

N C L R S t a t i s t i c a l B r i e f ! 2 0 0 7 ! N o. 8 ! Pa g e 1 1
(26% and 22%, respectively).Between 1974 and 2003,participation rates for all threegroups increased; however, in2003 Whites continued to havehigher participation rates thanboth Blacks and Hispanics.The White-Hispanic gapincreased from 16 percentagepoints in 1974 to 26percentage points in 2003.43 Infact, while 41.7% of Whitesand 31.8% of Blacks ages 18through 24 were enrolled inpostsecondary institutions in2004, only 24.7% of Hispanicsof the same age group wereenrolled in higher educationinstitutions.44
! Hispanics and Blacksconstitute a small proportionof undergraduate students inthe U.S. Latinos compose 18%and Blacks make up 17% of thetotal college-age population.However, only 10.4% of all2002 undergraduate studentswere Hispanic and only 12.4%were Black, while 69% ofundergraduates that year wereWhite.45
! Hispanic and Blackundergraduate students aremore likely than their White
peers to attend a two-yearcollege. Of the 1.7 millionHispanics pursuingundergraduate study,approximately 38% attendtwo-year institutions. Incontrast, 28% of White, 28% ofAsian, and 36% of Blackundergraduates are enrolled intwo-year colleges (seeFigure 6).46
Higher EducationGraduation Rates forLatinos! Hispanics age 25 and older
are less likely than Blacksand Whites to receive abachelor’s degree. In 2005,12% of Hispanics age 25 yearsand older had received abachelor’s degree or higher,compared to 17.7% of Blacksand 30.5% of comparableWhites.47
! Hispanics are less likely tohave expectations ofcompleting higher educationand receiving a bachelor’sdegree or higher. In 2003,28.2% of Hispanic 12th gradershad expectations of attaining abachelor’s degree, compared to35.1% of White and 32% ofBlack 12th graders.48
Hispanic-ServingInstitutions (HSIs)! HSIs enroll half of all Latino
students pursuing highereducation. In 2003-2004,although the 334 HSIs in theU.S. accounted for only 5% ofall institutions of highereducation, they enrolled 51%of all Hispanics pursuinghigher education degrees inthe U.S.49
! Hispanic undergraduatestudents at HSIs are morelikely to work full-timecompared to the overallundergraduate studentpopulation. Specifically, 44%of Latino HSI students workedfull-time compared to 39.3% ofstudents overall. Moreover,although tuition is generallylower at HSIs than at non-HSIs,students who attend HSIs aregenerally less able tocontribute to the cost of theireducation than are studentsfrom nonminority-servinginstitutions.50

N C L R S t a t i s t i c a l B r i e f ! 2 0 0 7 ! N o. 8 ! Pa g e 1 2
Financial Aid forHispanics in HigherEducation! Hispanics are more likely
than Whites yet less likelythan Blacks to receivefinancial aid to pay for anundergraduate education.During the 2004-2005 academic
year, 63% of Hispanicundergraduates received someform of financial aid,*compared to 62% of White and76% of Black undergraduatestudents.51
! Hispanic undergraduatesreceive less in financial aidon average than their Black
and White undergraduatepeers. During the 2004-2005academic year, although theaverage amount of financial aidreceived by an Hispanic full-time undergraduate was$4,622, White studentsreceived on average $4,837 andBlack students received $4,908in financial aid.52
FIGURE 6
TTyyppee ooff CCoolllleeggee EEnnrroolllleedd ffoorr SSttuuddeennttss 1155 YYeeaarrss OOlldd aanndd OOvveerr,, bbyy RRaaccee aanndd EEtthhnniicciittyy:: 22000055 ((NNuummbbeerrss iinn TThhoouussaannddss))
Race/Ethnicity Total number of Number of students Number of students Percent of students enrolled in enrolled in enrolled in students who attendundergraduate study two-year colleges four-year colleges two-year colleges
Non-Hispanic White 9,418 2,664 6,754 28.3%
Hispanic 1,671 641 1,030 38.3%
Black 1,972 701 1,270 35.5%
Asian/ Pacific Islander 795 223 571 28.1%
Source: Calculations tabulated by NCLR based on data from the U.S. Census Bureau, “School Enrollment – Social and EconomicCharacteristics of Students: October 2005,” Current Population Survey, Table 10. Washington, DC: U.S. Department of Commerce, 2006.
* Financial aid can be in the form of grants, loans, and work-study.
N C L R S t a t i s t i c a l B r i e f ! 2 0 0 7 ! N o. 8 ! Pa g e 1 3
ConclusionThe status of Latino educationsuggests a number of missedopportunities from early childhoodeducation through highereducation. Compared to theirpeers, Latinos are more likely tostart school later and leave schoolearlier. Especially concerning isthat Latinos are the second-largeststudent population enrolled in ournation’s schools, and improved
educational outcomes for Latinoshave not kept pace with theirrapid growth.
Ensuring that our nation’s publicschools and universities improvetheir capacity to adequately serveLatino students, as well asimmigrants and English languagelearners, is one of our country’smost significant challenges.However, it is also one that must
be overcome. At the federal level,Congress and the Administrationhave an opportunity to reversethese trends as they consider therenewal of the Head Start Act, theElementary and SecondaryEducation Act, the HigherEducation Act, and funding forfederal education programs, all ofwhich must be addressed in the110th Congress.

N C L R S t a t i s t i c a l B r i e f ! 2 0 0 7 ! N o. 8 ! Pa g e 1 4
1. U.S. Census Bureau, Race andHispanic Origin in 2004, PopulationProfile of the United States.Washington, DC: U.S. Department ofCommerce, January 2006, p. 3.
2. U.S. Census Bureau, “SchoolEnrollment - Social and EconomicCharacteristics of Students: October2005,” Table 1, Current PopulationSurvey. Washington, DC: U.S.Department of Commerce, 2006.
3. Ibid.
4. National Center for EducationStatistics, Digest of EducationStatistics, 2005, Table 38.Washington, DC: U.S. Department ofEducation, 2006.
5. National Center for EducationStatistics, “Racial/Ethnic Distributionof Public School Students: Indicator5,” The Condition of Education 2006.Washington, DC: U.S. Department ofEducation, 2006, p. 32.
6. Fix, Michael and Jeffrey Passel, U.S.Immigration – Trends & Implicationsfor Schools. Washington, DC:Immigration Studies Program, UrbanInstitute, January 2003.
7. Ruiz de Velasco, Jorge and MichaelFix, “Limited English ProficientStudents and High-StakesAccountability Systems,” in DianneM. Piché, William L. Taylor, andRobin A. Reed, eds., Rights at Risk:Equality in an Age of Terrorism.Washington, DC: Citizens’Commission on Civil Rights, 2002.
8. Passel, Jeffrey, Randy Capps, andMichael Fix, UndocumentedImmigrants: Facts and Figures.Washington, DC: Urban Institute,January 2004.
9. PowerPoint presentation of U.S.Census Bureau data, presented at theNCLR Latino Birth-to-Three AgendaAdvisory Committee Meeting, April22, 2005 by Michael Lopez, PhD,Center for Latino Child and FamilyResearch; Calderón, Miriam, HeadStart Reauthorization: EnhancingSchool Readiness for HispanicChildren. Washington, DC: NationalCouncil of La Raza, 2005, p. 2.
10. National Center for EducationStatistics, “Enrollment in EarlyChildhood Education,” The Conditionof Education 2006. Washington, DC:U.S. Department of Education, 2006,Table 2-1, p. 2.
11. Ibid.
12. Head Start Bureau, Descriptive Studyof Seasonal Farmworker Families.Washington, DC: U.S. Department ofHealth and Human Services,September 2001.
13. Percentage calculated by NCLR usingdata from the U.S. Census Bureau.Current Population Survey March2004; Annual Social and EconomicSupplement and unpublished datafrom Early Head Start ProgramInformation Report, 2003-04,provided by the Head Start Bureau,U.S. Department of Health andHuman Services; Head StartReauthorization: Enhancing School
Readiness for Hispanic Children, op.cit., p. 5.
14. Unpublished data from the HeadStart Program Information Report,2003-2004, provided by the HeadStart Bureau, U.S. Department ofHealth and Human Services, April2000; Head Start Reauthorization:Enhancing School Readiness forHispanic Children, op. cit., p. 5.
15. “School Enrollment – Social andEconomic Characteristics of Students:October 2005,” op. cit., Table 1.
16. The Condition of Education 2006, op.cit., Table 25-1.
17. Orfield, Gary, Daniel Losen, JohannaWald, and Christopher B. Swanson,Losing Our Future: How MinorityYouth Are Being Left Behind by theGraduation Rate Crisis. Cambridge,MA: The Civil Rights Project atHarvard University. Contributors:Advocates for Children of New Yorkand Civil Society Institute, 2004, p.2.
18. The Condition of Education 2006, op.cit., Table 26-2.
19. U.S. Census Bureau, EducationalAttainment in the United States:2003, Current Population Reports.Washington, DC: U.S. Department ofCommerce, 2003, pp. 3-6.
20. National Center for EducationStatistics, The Condition of Education2004, Table 22-2. Washington, DC:U.S. Department of Education, 2004.
21. Ibid, Table 22-1.
Endnotes
N C L R S t a t i s t i c a l B r i e f ! 2 0 0 7 ! N o. 8 ! Pa g e 1 5
22. “If We Raise Standards in HighSchool, Won’t Students Become MoreDisengaged?” Fact Sheet.Washington, DC: Achieve, Inc., 2005.(Retrieved June 2006) Online:http://www.achieve.org/node/595
23. Oakland, Thomas and Eric Rossen, “A21st-Century Model for IdentifyingStudents for Gifted and TalentedPrograms in Light of NationalConditions: An Emphasis on Raceand Ethnicity,” Gifted Child Today,October 1, 2005, Vol. 28, Issue 4, pp.1076-2175.
24. “What are the most commonlanguage groups for ELL students?”Washington, DC: NationalClearinghouse for English LanguageAcquisition and Language InstructionEducational Programs, 2002.(Retrieved January 2, 2007) Online:http://www.ncela.gwu.edu/expert/faq/05toplangs.html
25. Lazarín, Melissa, ImprovingAssessment and Accountability forEnglish Language Learners in the NoChild Left Behind Act. Washington,DC: National Council of La Raza,2006.
26. Ruiz de Velasco, Jorge and MichaelFix, Overlooked & Underserved:Immigrant Students in U.S. SecondarySchools. Washington, DC: UrbanInstitute, December 2000, p.13.
27. Capps, Randy, Michael Fix, JulieMurray, Jason Ost, Jeffrey S. Passel,and Shinta Herwantoro, The NewDemography of America’s Schools:Immigration and the No Child LeftBehind Act. Washington, DC: UrbanInstitute, 2005.
28. Pearson, Greg, “Ask NCELA No. 1:How many school-aged Englishlanguage learners (ELLs) are there inthe U.S.?” Washington, DC: NationalClearinghouse for English LanguageAcquisition and Language InstructionEducational Programs, 2006.(Retrieved December 22, 2006)Online:http://www.ncela.gwu.edu/expert/faq/01leps.htm
29. U.S. Immigration – Trends &Implications for Schools, op. cit.
30. Ibid.
31. De Cohen, Clemencia Cosentino andNicole Deterding, Who’s Left Behind?Immigrant Children in High and LowLEP Schools. Washington, DC:Program for Evaluation and EquityResearch, Urban Institute, September2005.
32. “Ask NCELA No. 1: How manyschool-aged English language learners(ELLs) are there in the U.S.?” op.cit.
33. Ibid.
34. U.S. Immigration – Trends &Implications for Schools, op. cit.
35. Percentage calculated by NCLR usingdata from the Office of EnglishLanguage Acquisition, LanguageEnhancement and AcademicAchievement for Limited EnglishProficient Students, BiennialEvaluation Report to Congress on theImplementation of the State FormulaGrant Program. Washington, DC: U.S.Department of Education, 2005; and,“Ask NCELA No. 1: How manyschool-aged English language learners(ELLs) are there in the U.S.?” op.cit.
36. Biennial Evaluation Report toCongress, op. cit.
37. National Center for EducationStatistics, National Assessment ofEducational Progress (NAEP):Reading and Mathematics.Washington, DC: U.S. Department ofEducation, 2005. (RetrievedDecember 22, 2006) Online:http://nces.ed.gov/nationsreportcard/nrc/reading_math_2005
38. Fry, Richard, Hispanic Youth DroppingOut of U.S. Schools: Measuring theChallenge. Washington, DC: PewHispanic Center, 2003.
39. Ibid.
40. Orfield, Gary and Chunfmei Lee, WhySegregation Matters: Poverty andEducational Inequality. Cambridge,MA: The Civil Rights Project atHarvard University, January 2005,p. 16.
41. Wiener, Ross and Eli Pristoop, “HowStates Shortchange the Districts thatNeed the Most Help,” Funding Gaps2006. Washington, DC: EducationTrust, 2006.
42. Ibid.
43. National Center for EducationStatistics, Postsecondary ParticipationRates by Sex and Race/Ethnicity:1974-2003. Washington, DC: U.S.Department of Education, March2005.
44. Digest of Education Statistics, 2005,op. cit., Table 184.
45. National Center for EducationStatistics, Digest of EducationStatistics, 2004. Washington, DC:U.S. Department of Education, 2005.
46. Percentages calculated by NCLR basedon data from the U.S. Bureau ofCensus, “School Enrollment – Socialand Economic Characteristics ofStudents: October 2005,” CurrentPopulation Survey, Table 10, 2006.
47. National Center for EducationStatistics, “Percent of persons age 25and over by years of schoolcompleted, race/ethnicity, and sex,”Digest of Education Statistics, 2005,Table 8. Washington, DC: U.S.Department of Education, 2006.
48. National Center for EducationStatistics, “PostsecondaryExpectations of 12th graders,” TheCondition of Education 2006, Table23-1. Washington, DC: U.S.Department of Education, 2006.
49. Digest of Education Statistics, 2005,op. cit., Table 208 and Table 217.
50. U.S. General Accounting Office,Distance Education: More Data CouldImprove Education’s Ability To TrackTechnology at Minority ServingInstitutions. Report to Congressional
Requesters. Washington, DC:General Accounting Office, ReportGAO-03-0900, 2003.
51. Digest of Education Statistics, 2005,op. cit., Table 316.
52. Ibid, Table 318.
Vis i t us at : www.nclr.orgNCLRNATIONAL COUNCIL OF LA RAZA