fiji marine conservation & diving beqa island… · fiji marine conservation & diving beqa...
TRANSCRIPT

FIJI MARINE
CONSERVATION & DIVING
Beqa Island, Fiji
FJM Phase 162 Science Report
April 2016 – June 2016
Author: Jane Sarah Giat, S.Si., M.Sc. (Principal Investigator)
Field Staff
Staff member
Role
Jane Giat (JG) Principal Investigator
Rosalyn Jones (RJ)
Assistant Research Officer
Olivia Cole (OC) Assistant Research Officer
Laurence Pidgeon (LP) Dive Officer

Table of Contents 1. Introduction ..................................................................................................................................................... 3
1.1 Frontier ...................................................................................................................................................... 3
1.2 Location ..................................................................................................................................................... 4
1.3 Background ................................................................................................................................................ 6
1.3.1 Natural Sources of Reef Degradation ................................................................................................. 7
1.3.2 Anthropogenic Sources of Reef Degradation ..................................................................................... 7
1.4 Project Aims & Objectives .................................................................................................................. 9
1.5 Phase Achievements .............................................................................................................................. 9
2. Training ......................................................................................................................................................... 10
2.1 Briefing sessions ...................................................................................................................................... 10
2.2 Science lectures ....................................................................................................................................... 10
2.3 Field work training .................................................................................................................................. 11
2.4 BTEC and Other Qualifications ............................................................................................................... 11
3. Research Work Program ................................................................................................................................ 12
3.1 Baseline Survey of Coral Reef Health in Beqa Lagoon .......................................................................... 12
3.1.1. Introduction...................................................................................................................................... 12
3.1.2 Survey Areas ..................................................................................................................................... 13
3.1.3 Materials and Methods ..................................................................................................................... 14
3.1.4 Results .............................................................................................................................................. 16
3.1.5 Discussion ......................................................................................................................................... 20
3.2 Mangrove Mapping in Vaga Bay ............................................................................................................ 22
3.2.1. Introduction...................................................................................................................................... 22
3.2.2 Mapping Area ................................................................................................................................... 23
3.2.3. Materials and Method ...................................................................................................................... 24
3.2.4. Results ............................................................................................................................................. 25
3.2.5 Discussion ......................................................................................................................................... 26
3.3. Identifying Blacktip Reef Shark Nursery Grounds ................................................................................. 27
3.3.1. Introduction...................................................................................................................................... 27
3.3.2. Methodology .................................................................................................................................... 29
3.3.3. Results ............................................................................................................................................. 30
3.3.4. Discussion ........................................................................................................................................ 32
4. Acknowledgement ......................................................................................................................................... 33
1. Introduction
1.1 Frontier

Frontier, established in 1989, is a UK-based non-profit NGO. Its mission statement is:
“to conserve the world’s most endangered wildlife and threatened habitats and to build
sustainable livelihoods for marginalised and under resourced communities in the world’s
poorest countries and to create solutions that are apolitical, forward-thinking, community-
driven and innovative, and which take into consideration the long-term needs of low income communities”.
Frontier employs non-specialist volunteers, or Research Assistants (RA). Frontier’s marine projects give RAs basic science and species identification training at the beginning of their placement, to enable them to collect data on local fish, benthic and invertebrate species. After working on Gau Island in Fiji conducting baseline surveys, Frontier relocated to Beqa Island, south of mainland Fiji, in order to assess the status of the coral reef systems around Beqa and within Beqa Lagoon.
1.2 Location
Fiji is an archipelago in the South Pacific Ocean composed of 332 islands and 500 islets and
cays, with land mass occupying 18,376 km² (Cumming et al., 2002) (Figure 1). Approximately
one third of the islands are inhabited and, of these, the two largest islands, Viti Levu and Vanua Levu, contain approximately 90% of Fiji’s population (Vuki et al., 2000).
Figure 1: The Fiji Islands, Beqa circled in red (adapted from Veitayaki, 2006).
Beqa is a large island in the Fijian archipelago and lies within Beqa Lagoon (Figure 2), with the coordinates 18°24’S 178°08’E. The island is located approximately 10 km south of the main island of Viti Levu and has a population of around 3,000 people.
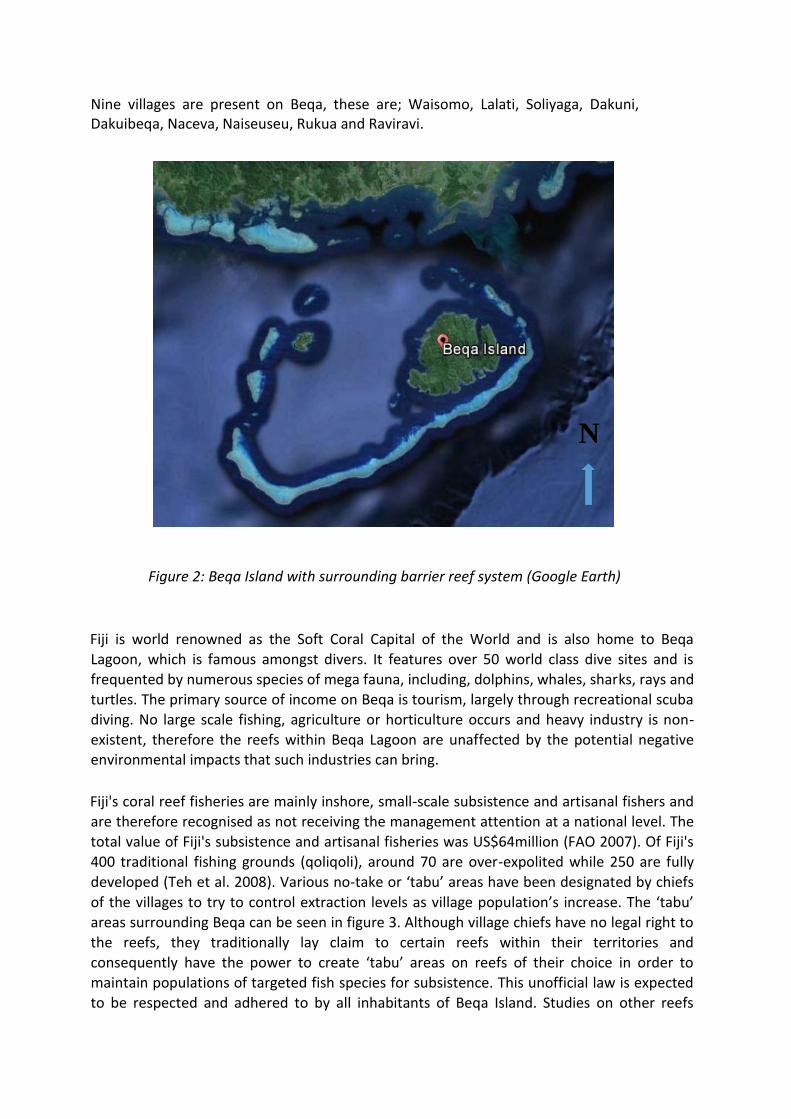
Nine villages are present on Beqa, these are; Waisomo, Lalati, Soliyaga, Dakuni, Dakuibeqa, Naceva, Naiseuseu, Rukua and Raviravi.
Figure 2: Beqa Island with surrounding barrier reef system (Google Earth)
Fiji is world renowned as the Soft Coral Capital of the World and is also home to Beqa
Lagoon, which is famous amongst divers. It features over 50 world class dive sites and is
frequented by numerous species of mega fauna, including, dolphins, whales, sharks, rays and
turtles. The primary source of income on Beqa is tourism, largely through recreational scuba
diving. No large scale fishing, agriculture or horticulture occurs and heavy industry is non-
existent, therefore the reefs within Beqa Lagoon are unaffected by the potential negative environmental impacts that such industries can bring.
Fiji's coral reef fisheries are mainly inshore, small-scale subsistence and artisanal fishers and
are therefore recognised as not receiving the management attention at a national level. The
total value of Fiji's subsistence and artisanal fisheries was US$64million (FAO 2007). Of Fiji's
400 traditional fishing grounds (qoliqoli), around 70 are over-expolited while 250 are fully
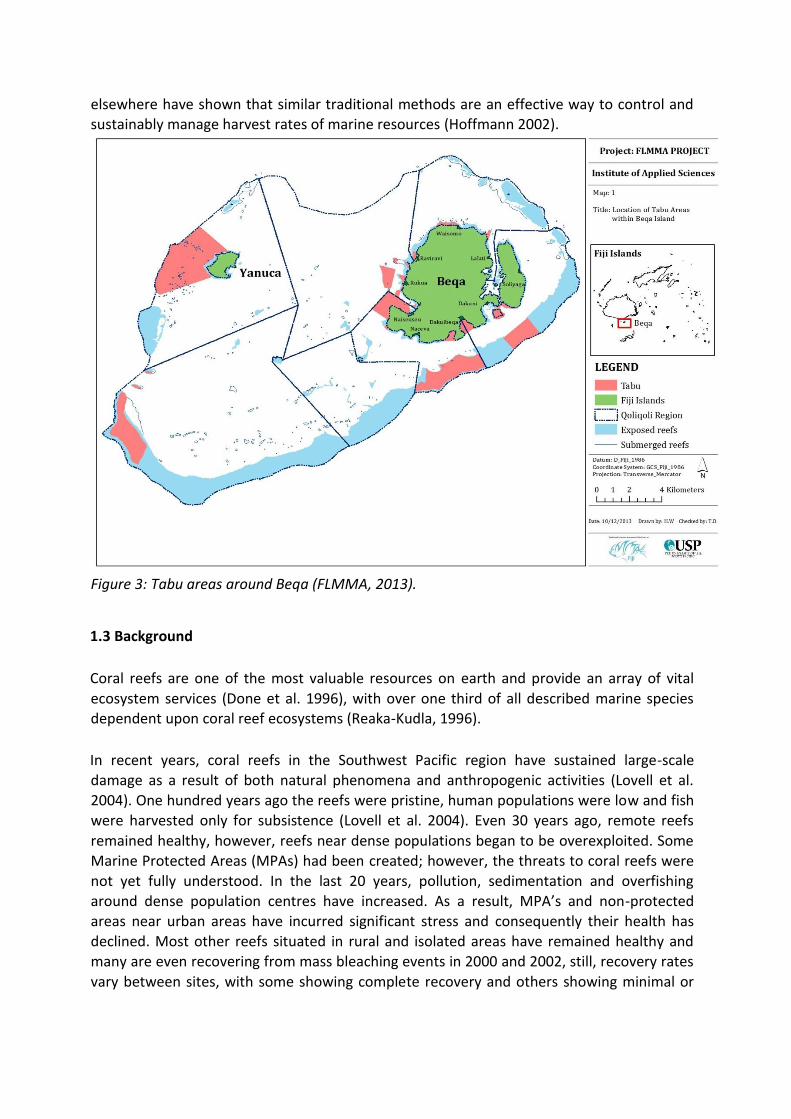
developed (Teh et al. 2008). Various no-take or ‘tabu’ areas have been designated by chiefs
of the villages to try to control extraction levels as village population’s increase. The ‘tabu’
areas surrounding Beqa can be seen in figure 3. Although village chiefs have no legal right to
the reefs, they traditionally lay claim to certain reefs within their territories and
consequently have the power to create ‘tabu’ areas on reefs of their choice in order to
maintain populations of targeted fish species for subsistence. This unofficial law is expected
to be respected and adhered to by all inhabitants of Beqa Island. Studies on other reefs
N
elsewhere have shown that similar traditional methods are an effective way to control and
sustainably manage harvest rates of marine resources (Hoffmann 2002).
Figure 3: Tabu areas around Beqa (FLMMA, 2013).
1.3 Background
Coral reefs are one of the most valuable resources on earth and provide an array of vital
ecosystem services (Done et al. 1996), with over one third of all described marine species dependent upon coral reef ecosystems (Reaka-Kudla, 1996).
In recent years, coral reefs in the Southwest Pacific region have sustained large-scale
damage as a result of both natural phenomena and anthropogenic activities (Lovell et al.
2004). One hundred years ago the reefs were pristine, human populations were low and fish
were harvested only for subsistence (Lovell et al. 2004). Even 30 years ago, remote reefs
remained healthy, however, reefs near dense populations began to be overexploited. Some
Marine Protected Areas (MPAs) had been created; however, the threats to coral reefs were
not yet fully understood. In the last 20 years, pollution, sedimentation and overfishing
around dense population centres have increased. As a result, MPA’s and non-protected
areas near urban areas have incurred significant stress and consequently their health has
declined. Most other reefs situated in rural and isolated areas have remained healthy and
many are even recovering from mass bleaching events in 2000 and 2002, still, recovery rates
vary between sites, with some showing complete recovery and others showing minimal or

no recovery. Beqa Barrier Reef in particular has been showing a slow recovery rate (Lovell et
al. 2004).
Fiji is dependent on its low lying coastal regions for its socio-economic development (Teh et
al. 2008). This, like many other South Pacific islands, makes it extremely vulnerable to the
impacts climate change. Current predictions indicate a potential rise in global sea levels of
between 49.9cm to 1m by 2100 (Solomon et al. 2009). A rise of this size would cause wide
spread devastation to Fiji's coastal infrastructure and artificial preservation would be a
substantial drain on Fiji's economy. In addition, the frequency of destructive environmental
events is predicted to increase, occurring at a greater frequency than potential recovery (Hutchings et al. 2008).
1.3.1 Natural Sources of Reef Degradation
Natural sources of coral reef degradation include cyclones, coral bleaching and invasive
predator outbreaks. 64% of all coral colonies surrounding Fiji suffered mass bleaching in
2000 and in the southern areas of Viti Levu 84% of colonies were affected (Cumming et al.
2002). Since 2002, significant damage has been sustained on coral reefs within the
Southwest Pacific region as a result of cyclones (Lovell et al. 2004). Most recently, severe
tropical cyclone Winston made a category 5 landfall on Fiji and was the strongest tropical
cyclone to make landfall over Fiji on record (Fritz 2016). However, the impact of the cyclone
towards reef health has not been assessed. Coral predator outbreaks, specifically the Crown
of Thorn starfish (Acanthaster planci), have occurred on Fijian reefs since 1965, for periods
ranging from two to five years and continue to this day (Zann et al. 1990). This can be
attributed to natural fluctuations in availability of planktonic food, water salinity levels and temperature.
1.3.2 Anthropogenic Sources of Reef Degradation
The main anthropogenic sources of reef degradation include overfishing, destructive fishing
practices (such as dynamite fishing), poisoning, pollution, deforestation and coral harvesting for the curio and marine aquarium trade (Lovell, 2001, Teh et al. 2008).
The fisheries sector is the third largest natural resource sector in Fiji. The main sources of
foreign exchange are the tourism industry (contributing 19% to GDP), sugar industry
(contributing 8.5%) and then fisheries (contributing 2.5%). Understanding the role of societal
and economic factors on fishing is critical for designing appropriate fisheries management
strategies. Teh et al., 2008 produced an overview of the socio-economic and ecological
perspectives of Fiji’s inland reef fisheries. The result from this overview was that the status
of Fiji’s reef-associated fisheries at national level is still uncertain due to lack of dependable data on the subsistence fisheries.
Since the 1990's there's been increasing pressure on small scale fisheries due to growing
population and demand for fish. A socio-economic study done in Beqa villages Rukua and
Yanuca reported that of the fish caught locally 54% were consumed by the local community

while 46% were either sold outside or to a middleman/agent, presumably to an outside
source (MRIS 2012). Common methods for targeting reef fish species include: hand-line,
spear, gillnet, seine net, hookah (diving with surface supplied air) and reef gleaning (Teh et
al. 2009). Of these methods hand-lining and spearfishing are used most frequently by
residents of Rukua and Yanuca (MRIS 2012). Commercial fishing does not occur near the
island of Beqa, however, overfishing in other areas may have reduced population numbers
to such an extent that species such as L. harak, L. xanthochilus, L nebulosus and B.
muricatum are not present or are very rarely encountered. Other species such as the
humphead parrotfish (Bolbometopon muricatum), have now become almost completely
extinct in Fijian waters (Cumming et al. 2002). Lack of long term monitoring and limited
technical expertise hinders assessment of the coral reef fisheries. There's been numerous
site-specific studies yet no national level evaluation of Fiji's reef fisheries. To tackle this at a
national level the Fisheries Division, Fiji Locally Managed Marine Areas (FLMMA) and the
University of the South Pacific have started facilitating coral reef conservation initiatives by
conducting socio-economic surveys of marine resource use.
The marine aquarium trade inflicts reef degradation in a variety of ways. According to Fiji's
Fisheries Department annual estimate, 311,097 aquarium fish were exported from Fiji in
2001. Convention of International Trade of Endangered Species (CITES) database recorded
that 169,143 ornamental fish and 31,900 invertebrates were exported from Fiji in 2004 to
overseas markets. It has also been reported that between 2000 and 2004 annual live rock
exports from Fiji increased from 800,000kg in 2000 to 1.3million kg. Live rock exports are a
major problem in Fiji as it significantly diminishes reef ecosystems by reducing the number
of available spawning sites for marine species, reducing the buffer areas for sites of
increased wave action, and decreasing carbon dioxide sequestration by reducing the amount
of photosynthetic material in the marine environment. In 2001, a reported 800,000 kg of
‘live rock’ was harvested and exported; however the actual figure is likely much greater as a
substantial quantity is lost in the trimming and grading process (Lovell et al., 2004). Although
this has not been observed around Beqa, likely due to tourism being the main activity, there
is potential for harvesting to occur in the future.
Pollution in the form of sewage is a major threat to coral reefs in Fiji. Untreated sewage
deposited directly into the ocean causes increased levels of phosphates and consequently
macro algal blooms and eutrophication (Ginsberg 1994). Coral reefs are unique in that they
possess low levels of nutrients and are highly efficient at recycling them. Consequently, they
can cope with minor levels of eutrophication, however, when marine ecosystems are highly
enriched with chemical nutrients, the result is excessive plant growth in the form of macro
algae. Such algae are detrimental to the health of the reef because they use all available
oxygen within the water column, causing fish populations to die off. In addition, these algal
blooms reduce the amount of light penetrating the water column, inhibiting coral
photosynthesis, subsequently causing rapid declines in reef system biodiversity (Fabricius
2005). Unmanaged disposal of raw sewage is common in areas of dense population as well
as in popular tourist destinations. Villages on Beqa use pit latrines for sewage, however,
because they are close to the coast it is likely that nutrients leach through the soil into the
surrounding coastal waters and increase levels of phosphates and nitrates, which in turn
negatively affect near shore reefs. It is unclear how the resorts on Beqa manage their waste,
but it is likely that septic tanks are employed. Incidents of dumping on reefs along the Coral
Coast of Viti Levu, Mamanuca and Suva have been observed (Mosley and Aalbersberg, 2002, Tamata and Thaman, 2001; Zann and Lovell, 1992).
Many families on Beqa lay claim to some plantation regions which they farm, both for local
consumption and trading as well as to sell on the mainland (MRIS 2012). It has been noted
that there has been an increase in the area of land cleared using slash and burn
methodologies to make room for these farms (pers comm, 2015). These areas of clearing will
increase sedimentation and the rate at which fresh water is being leached onto the reef.
Mangrove forests help stabilize shorelines, filter freshwater run off and reduce the impact of
natural disasters such as tsunamis and hurricanes. In addition, many of the reef fish targeted
for consumption are known to depend on the mangroves for refuge from predators and for
ontological development (FAO 2007, Giri et al. 2010). According to locals, the areas of
mangroves have significantly decreased and with the added impact of slash and burn
techniques this is likely to continue (pers comm, 2015). The combination of land clearing
using slash and burn techniques as well as mangrove deforestation will be having measureable impacts on the reef.
1.4 Project Aims & Objectives
The overarching aim of the Fiji Marine Conservation project is to ascertain the health of the
reef through the use of baseline surveys in order to inform sustainable management.
Baseline surveys will be used to;
1. Indicate which natural and anthropogenic processes currently affect the reef system.
2. Determine the effectiveness of the current locally managed marine areas.
3. Feed into national data collection objectives through Fiji Fisheries Department and
University of the South Pacific (USP)
4. Build awareness and education of local people as to the importance of sustained marine
management techniques with the hope to assist with the long term sustainable use of
marine resources.
1.5 Phase Achievements
The overall objective of the phase was to expand the scope of data gathering and engaging more with the community;
Camp and logistics:
• New Solar panels
Scientific Development:
• Implementing benthic baseline survey
• Building a Mangrove nursery
Community:
• Initiated school visits to Korovatu Primary School at Naceva and Beqa-Yanuca Primary and Secondary School at Raviravi.
• Being invited and present on various village function in Raviravi, Rukua, Naiseusei, and Naceva.
2. Training
2.1 Briefing sessions
• Orientation – staff member takes new volunteers around camp.
• Bula and Welcome – staff member introduces all members of staff, other volunteers and
local Fijian family.
• Intro to duties – staff member shows new volunteers rotor and where description of duties can be found and outlines what needs doing for each duty.
• Health and safety – staff member outlines important health and safety points for camp and new volunteers then take health and safety and medical tests.
• Dive and Boat Safety – Dive officer explains the possible hazards of diving which may be encountered as well as safety equipment used in case of an incident.
• Surface cover briefing – Dive officer demonstrate procedure of surface covering including
emergency procedures such as emergency diver recall, deploying the anchor, re-mooring the
boat, and retrieving tired divers.
Briefing session Presenter
Orientation JG/RJ/OC
Bula and Welcome JG
Intro to Duties RJ/OC
Health and Safety JG
Dive and Boat Safety LP
Surface Cover LP
Table 1. Briefing sessions conducted during phase 162
2.2 Science lectures
Research assistants (RA’s), with the support of staff members, are fully responsible for
all data collection on FJM. Before RA’s were permitted to conduct surveys, rigorous testing
was undertaken. RA’s were given an array of lectures, computer ID tests and in-water ID
tests. A pass rate of 95% accuracy was required for theory tests and only when theory and
in-water ID tests have been completed were RA’s allowed to start surveying. RA’s were
then required to complete two practice surveys before actual benthic and fish surveys could be undertaken and data recorded.
The science lectures given to guide learning are as follows;
• Introduction to Coral Reefs – coral reef biology, function and threats, most common benthic forms found along transects, and how to conduct snorkel survey.
• Mangrove Mapping – Introduction to mangroves and how to conduct transect based surveys for mangrove mapping.
• Fish Survey Methodology – underwater techniques and processes involved in conducting a fish survey
• Fish Anatomy – important parts of fish biology which will help identify indicator and
distinguishing features which separate families
• Indicator Fish Family – distinguishing features of indicator fish families.
• Indicator Fish Species – distinguishing features of indicator fish species
• Other Butterflies and Damsels – illustrate which species may get confused with indicator
species
Science Lectures Presenter
Introduction to Coral Reefs JG/RJ/OC
Mangrove Mapping JG/OC
Fish Survey Methodology JG/RJ/OC
Fish Anatomy JG/RJ/OC
Indicator Fish Family JG/RJ/OC
Indicator Fish Species JG/RJ/OC
Other Butterflies and Damsels JG/RJ/OC
Table 2. Science lectures conducted during phase 162
2.3 Field work training
The following computer ID tests were conducted before in-water tests:
• Indicator fish species
• Fish families
• Master test – encompassing indicators, families and others
A dry run of survey methodology for was also conducted in order to reinforce techniques before conducing in-water surveys.
2.4 BTEC and Other Qualifications
2 BTEC’s were completed this phase, they are as follows:

1. Name: Charles Joshua Cupples
BTEC type: Tropical Habitat Conservation
Title: Variation in Shark Abundance in Relation to Fish Abundance.
Mentor: Jane Giat & Olivia Cole
2. Name: Emily Yates
BTEC type: Tropical Habitat Conservation
Title: Morphological Structure of Corals in Frontier’s Study Sites
Mentor: Olivia Cole & Rosy Jones
1 CoPE was completed this phase, it is as follows:
1. Name: Charles Joshua Cupples
Mentor: Jane Giat
1 Diploma in Tropical Habitat Conservation was completed this phase, it is as follows:
1. Name: Meg Young
Title: Asessing the Reef Health by Baseline Survey of Fish Indicator Species
and Benthic Cover.
Mentor: Jane Giat & Rosy Jones
3. Research Work Program
3.1 Baseline Survey of Coral Reef Health in Beqa Lagoon
3.1.1. Introduction
Beqa Island lies within Beqa Lagoon, 10 km south of the main island of Viti Levu. The island is
known for its traditional subsistence village lifestyles, as well as hosting a number of tourism
resorts (Burns, 1994). Fiji Fisheries department currently monitor the area as part of their
national monitoring plan, however, surveys are only conducted once a year in different area
around Fiji due to personnel restrictions. FJM’s presence on Beqa aims to contribute to this
knowledge gap by directly feeding survey results into work by WWF and Fisheries department initiatives.
The most comprehensive assessment conducted by Fisheries to date was a resource survey
for Yanuca and Rukua villages in 2012 by the Marine Resource Inventory Survey (MRIS)
team. The overall goal of this survey was to formulate and later implement a management
plan for sustainable use of the marine resources. Methodologies included an underwater
visual census and socio-economic surveys. It was reported that the main source of income
for villagers was fishing and that over 90% of villagers “always” or “sometimes” consumed

fresh fish in a week. Also recorded was the most common fish species caught per fishing trip,
the top 5 being; E.polyphekadion, L.harak, L.atkinsoni, C.ignobilis and L.gibbus (MRIS 2012).
The survey identified that many of the marine inshore species that usually inhabit the Beqa
reef system are under threat due to the continued destruction of the reef system through
anthropogenic activities including; pollution from pig farms, reef-walking, over-fishing,
anchor damage and the use of destructive fishing methods. It was reported that many of the
reefs in the region have a major algae overgrowth problem with large areas of reef totally
covered by algae thought to be attributed to the combination of sewage stimulating algae growth and lack of major algae grazers from overfishing.
Indicator species are used to infer reef health trends. Indicator families (emperors,
butterflyfish, angelfish, damsel fish and barracudas) are identified to species level as there
are many interspecies variations. Angelfish show a preference for structurally complex reefs
and are not tolerant to fluctuations in physical variables such as temperature, while
barracudas are very tolerant due to ontological and seasonal shifts in habitat range
(Christine 2010). Butterflyfish are reported to be very sensitive to reef degradation and have
species dependent feeding preferences, while emperors display niche partitioning (Pratchett 2005, Carpenter and Allen 1989).
3.1.2 Survey Areas
Beqa lies within Beqa Lagoon, with the coordinates 18°24’S 178°08’E. The island is located
approximately 10 km south of the main island of Viti Levu and has a population of around 3,000 people.
Six survey sites were used for reef data collection;
Table 3. Survey site coordinates
Site Name GPS coordinates
Bikini S 18˚23’40.1”
E 178˚05’26.0”
Mala’s S 18˚24’10.5”
E 178˚05’58.2”
Rabbit S 18˚24’.07.5”
E 178˚06’09.9”
Vuvalae S 18˚24’07.6”
E 178˚03’54.9”
Wreck Reef S 18˚22’48.22”
E 178˚05’18.3”
Snapper S 18˚24’56.7”
E 178˚04’04.4”
Bikini – A near-shore site (1.29 nautical miles from camp) protected from westerly winds but is more prone to northerly, southerly and easterly winds. Average depth is 7.5m and a gentle slope drops down to a depth of 20 m on the outer reef. Bikini is outside of Vaqa Bay and so will encounter freshwater dissipating out of the bay and also from the local village of Rukua. The site is rarely visited by Beqa Lagoon Resort for tourism. Bikini is a no take zone and so only fished on rare occasions when the chief opens the site for fishing for celebrations or funerals.
Mala’s – An inshore site (0.56 nautical miles from camp) found within Vaqa Bay and relatively protected from southerly and easterly winds. It is an estuarine environment with three freshwater streams flowing into it. The majority of the reef is at around 8 m, whereas the outer reef is at around 18 m. It is near the local village of Naiseuseu and the site is not visited for tourism and is a non-tabu area. Targeted fish include parrotfish, unicornfish, porcupinefish, rabbitfish, surgeonfish and goatfish.
Rabbit – An inshore site (0.44 nautical miles from camp) located within Vaqa Bay close to river
outflows. The site is generally shallow with an average depth of 6 m dropping down to 12 m at the reef edge. The site is not visited for tourism and is a no-take zone.
Vuvalae – an offshore site (2.53 nautical miles from camp) relatively protected from south easterly, easterly and north easterly winds and usually is not subjected to strong currents. The reef is extremely large, comprising of numerous patch reefs and coral bombies. The average depth is around 8 m dropping down to 16 m at the reef’s edge. Vuvalae is located far away from Beqa and can be difficult to get to because of rough weather conditions. It will encounter no freshwater and there can often be strong currents. The site is not visited for tourism.
Wreck Reef – an offshore site (1.97 nautical miles from camp) very exposed with a purpose
sunk wreck is located on the seabed just off the reef at a depth of 22 m. The reef has an
average depth of 8 m, however, the edge of the reef has a steep drop off down to a depth of
22 m. There can be strong currents present, however, the site is far enough away from
freshwater sources to not be affected by dissipation. The site is rarely visited by Beqa Lagoon Resort for tourism or fishing by the locals.
Snapper – An offshore site (2.42 nautical miles from camp) relatively protected from south
easterly and north easterly winds. The reef has as average depth of 8.5 m with a drop off to 15
m at the reef edge. Six large coral bombies surround the mooring line with depths ranging 3-6 m. Transects are places on patch reefs with areas of sand.
3.1.3 Materials and Methods
Baseline Survey Protocol (BSP) was used following standardised Reef Check methodology
(Hodgson, 2001). In order to initially set up the permanent transects, fifty metre survey tapes
were used to create transect lines spaced 10 m apart. Four permanent transect sites were set
up at each of the survey sites and highly visible markers deployed in order to allow RAs to
easily locate the transect start points. Transect bearings were kept consistent in order to

obtain independent samples to be replicated at each site. Transect lines were laid for a total
length of 45 m and this permitted 2 x 20 metre transects to be completed separated by a 5 m gap.
3.1.3.1. Indicator Fish Species Survey
Fish surveys were completed using belt transect methodology. During the fish surveyor
methodology, RAs would lay the survey tape, swim back to the start point, and wait five
minutes for any disturbed fish to return into the transect area. RA’s then swam the length of
the survey tape recording all fish seen within a 5m x 5m square from the base of the transect tape measure.
Figure 4: Fis The surveyor methodology, recording all fish seen within a 5m x 5m square from the
base of the transect tape measure.
Surveyor Roles: RAs undertook various roles during fish surveys depending on the data being
collected and the level of training they had received. As four weeks were required to become
fish survey proficient, any RAs on the project for less than four weeks were unable to survey
fish and would therefore occupy another surveyor role. Data was collected on fish biodiversity, abundance and size.
Consequently, there were two surveyor roles; physical surveyor and fish surveyor. Provided
that research assistants were able to undertake all survey roles, the allocated role rotated on a daily basis.
The role of the physical surveyor was to lead the dive and therefore keep track of all
surveyors’ air consumption, dive depth and survey time, in addition to towing the surface
marker buoy and navigating bearings. The physical surveyor recorded the depth and time at
the start and end of each transect and navigated the set bearing of each transect whilst laying
out the tape measure. During fish surveys the physical surveyor remained behind the fish
surveyor to reduce disturbance to the fish within the transect area. On completion of the
survey the physical surveyor reeled in the tape.

Fish species richness, abundance and size were recorded. Research assistants learn forty-five
indicator species and twenty other fish families. Fish size was recorded in categories; 1-10 cm,
11-20 cm, 21-30 cm, 31-40 cm, 41-50 cm and >50 cm. When a fish surveyor encountered a
large school of fish, the abundance was estimated and recorded in the most common average
size category. Upon completion of a survey dive, RAs directly enter their survey data into the master database.
3.1.3.2. Benthic Lifeform Survey
Medium-scale monitoring is used to assess the occurrence of coral recruitment and
composition of the underlying benthos. During this survey RAs will lay their survey tape, swim
back to the starting point. They will a 50 cm x 50 cm quadrant every 5 metres, producing 10
recorded quadrants per transect, recording the benthic composition within each quadrant.
Surveyor Roles: RAs undertook various roles during benthic surveys depending on the data
being collected and the level of training they had received. As benthic lifeforms are much
easier to learn than fish identification, RAs that are on project for four weeks or less will be
able to carry out the survey.
Consequently, there were two surveyor roles; quadrant holder and data recorder. Provided
that research assistants were able to undertake all survey roles, the allocated role rotated on a daily basis.
The role of the quadrant holder was to lead the dive and therefore keep track of all surveyors’
air consumption, dive depth and survey time, in addition to navigating bearings. Quadrant
holder will hold the quadrant every 5 metres while the data recorder counts the live benthic
cover and underlying substratum. The following data will be collected along each transect:
1) Live benthic cover recorded at 5m intervals, producing 10 recorded quadrant per transect.
a. Scleractinian corals will be categorized as: Branching, Corymbose, Encrusting, Foliaceous,
Massive, Tabular, Columnar, or Laminar.
2) Underlying substratum (i.e., sand, rock, live rock, rubble, or dead coral) quantified at 5 m
intervals,
This survey can be taken together with the fish indicator species survey by combining the role
of physical surveyor and quadrant holder.
3.1.4 Results
3.1.4.1. Indicator Fish Species Survey
The result of 162 survey data showed that there was a significant recovery in fish abundance
(F = 15.96, p = 0.0001) compared to data from surveys collected in last quarter (Figure 5).
Most significant increase was observed at Wreck reef where there are ~90% increase in fish

abundance, followed by Mala’s Rock with ~68% increase, Vuvale with ~ 64% increase, Snapper
with ~62% increase, Bikini with ~42% increase, and least was observed at Rabbit with ~39%
decrease in fish abundance. However, compared to fish abundance of the same time period
last year (152 quarter) the fish abundance on 162 quarter is still significantly less (F = 33.59, p
< 0.0001). Wreck reef that had the most increase compared to last quarter, only has ~31% of
the fish abundance of previous year. Worst is Bikini which only has ~26%, followed by Rabbit
with ~30%, then Mala’s Rock with ~49%. Vuvale is doing quite well with ~60% stock recovery and Snapper seem to reach the same abundance as the previous year.
Figure 5. Average fish abundance per transect for all survey sites from 162 quarter
compared to 152 and 161 quarter
Conversely, the species richness result showed a significant decrease (F = 60.72, p < 0.0001) in
the number of species observed in each site during 162 compared to 161 (Figure 6). Most
significant decrease in the number of species encountered was at Rabbit with ~56% decrease,
followed by Bikini with a ~49% decrease, Snapper with a ~32% decrease, Mala’s Rock and
Vuvale with a ~28% decrease, and finally Wreck Reef with a ~23% decrease in species
richness. The species richness seems to be back to similar levels that were seen in the 152
quarter as there are no significant differences in the species richness between 162 and 152 quarters (F = 0.01, p = 0.927).
0
100
200
300
400
500
600
700
Bikini Rabbit Vuvale Wreck Snapper Mala
Fish Abundance
152 162 161
152v162
F = 33.59, p < 0.0001
161v162
F = 15.96, p = 0.0001

Figure 6. Average species richness per transect for all survey sites from 162 quarter
compared to 152 and 161 quarter
Family richness on the other hand showed a significant decrease when compared to last
quarter (F = 57.84, p < 0.0001) and last year (F = 62.35, p < 0.0001). Bikini has a ~54% and
~50% decrease compared to 152 and 161 respectively. Rabbit has a 31% and 48% decrease,
Vuvale has a 48% and 55% decrease, Wreck Reef has a 28% and 22% decrease, Snapper has a
5% and 38% decrease, and finally Mala’s Rock has a 16% and a 50% decrease in family
richness compared to 152 and 161 quarters respectively.
Figure 7. Average family richness per transect for all survey sites from 161 quarter
compared to 152 quarter
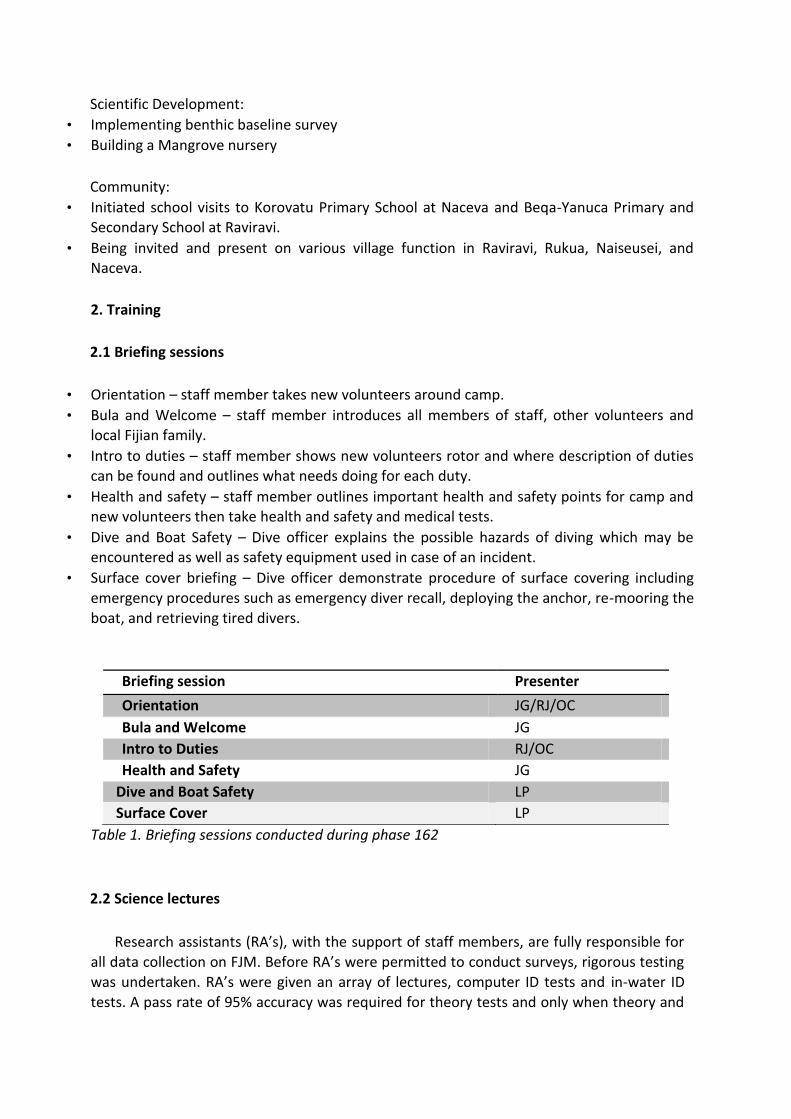
The size composition of fish observed had again shifted quite significantly from 161 to
162 (Figure 8). 161 was dominated by fish in the size range of 10 -20 cm, however, little
to no fish surveyed were larger than 30 cm. The >50 cm category was retired from use
last quarter because no fish surveyed were in that size category. 162 however was
0
2
4
6
8
10
12
14
16
Bikini Rabbit Vuvale Wreck Snapper Mala
Species richness
152 162 161
0
2
4
6
8
10
12
Bikini Rabbit Vuvale Wreck Snapper Mala
Family Richness
152 162 161
152v162
F = 0.01, p = 0.927
152v162
F = 62.35, p < 0.0001
161v162
F = 60.72, p < 0.0001
161v162
F = 57.84, p < 0.0001
dominated by fish in the size range of >10 cm. Fish larger than 30 cm in size are present
in Bikini, Mala’s Rock, and Wreck Reef although in very small number.
Figure 8. Average size categories of fish per transect from 162 quarter compared to 161 quarter.
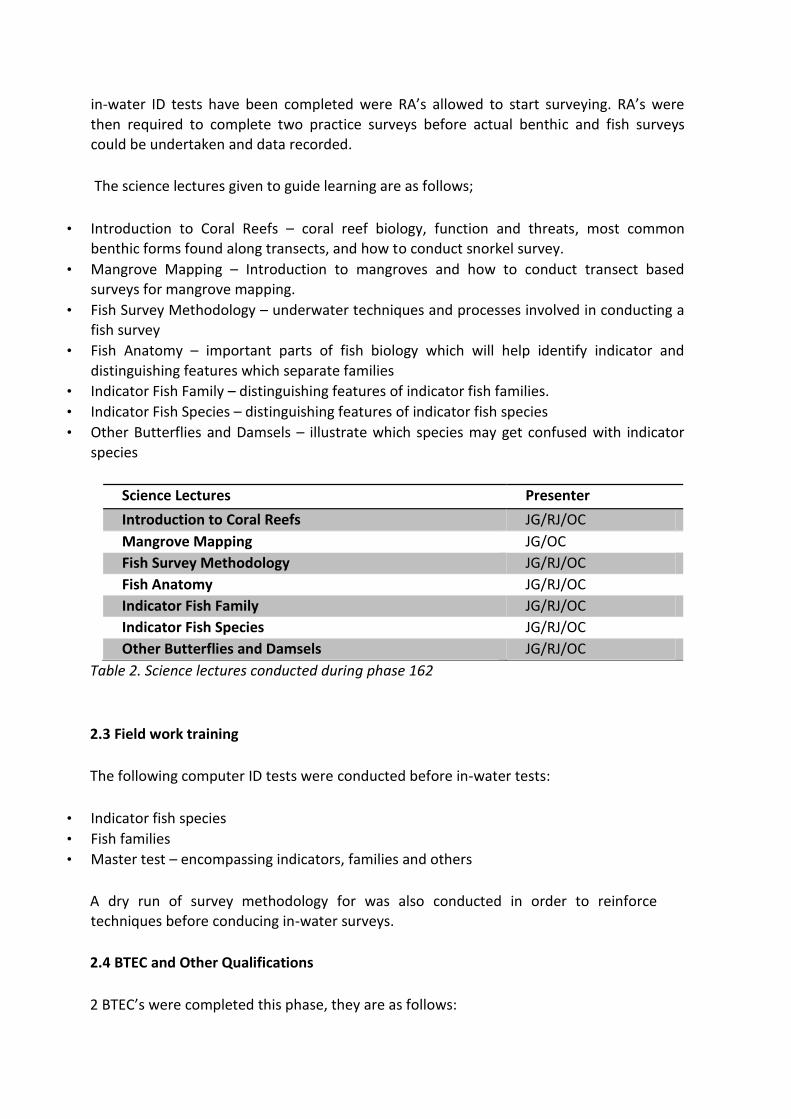
3.1.4.2. Benthic Lifeform Survey
Benthic lifeform surveys from the 162 quarter showed an overall average of 33% coral
cover from all study sites (Figure 9). The highest was found at Mala’s rock, with 45%
coral cover, and the lowest was found at Vuvale, with 16% coral cover. The
morphologies assemblage is dominated by Encrusted and Corymbose corals, followed by Branching and Massive corals.
Figure 9. Total coral cover and their morphologies from 162 quarter.
0
50
100
150
200
250
162 161 162 161 162 161 162 161 162 161 162 161
Bikini Rabbit Vuvale Wreck Snapper Mala's
Size Assemblage
<10 <20 <30 <40 <50
0
10
20
30
40
50
Rabbit Snapper Bikini Mala's Vuvale
Total coral cover
Branching Encrusted Corymbose Massive Sub-Massive
Tabular Foliose Solitary Digitate Soft

Overall, there was approximately 3.7% of dead coral and 3.5% of bleached coral observed in
all study sites during the 162 quarter (Figure 10). The largest proportion of dead coral was
observed at Mala’s rock, with 6.5% dead coral, and the smallest at Vuvale, where no dead
coral was observed at all. The majority of the dead coral are Branching coral followed closely
by Corymbose coral. There’s also a large amount of dead Foliose coral (0.8%) in Rabbit and
Digitate coral (1.6%) in Snapper. The most bleached coral was observed at Rabbit, with 7.4%
of bleached coral, and the least at Vuvale where 1.2% of the coral is bleached. The majority
of the bleached coral were Branching coral and Corymbose coral. However, there was a large number of bleached Digitate coral (6.4%) found in Rabbit.
Figure 10. Total dead coral and bleached coral and their morphologies from 162 quarter.
3.1.5 Discussion
The significant recovery of fish abundance on all sites suggested seasonal effect. There’s a
possibility that the months from March – June are breeding months, attracting more fishes to
the reef (Cohen & Alexander 2013). However, the fish abundance is still very low compared to
the data from the same months last year. This means fishing pressure still affects the fish
stock in Beqa lagoon massively. Research on fish behavior showed that fish used visual cues as
well as other myriad cues to detect predators (Karplus & Algom 1981, Holmes et al. 2012).
Most fish can correctly identify a specific predator from a random shape of similar size (Ferrari
et al. 2010). This means that it is very possible that fish may have associated diver presence
with spear fishing, which in turn causes the fish to hide or run away from surveyors.
Overfishing is often known as the systematic exploitation of resources because after one type
or size class is exhausted, the fishing industry will fulfill market demand by exploiting the next
size class down (Botsford et al. 1997). Without management this will continue until there’s
nothing left to take. Proper management will take advantage of this natural shift, allowing one
0
1
2
3
4
5
6
7
Rabbit Snapper Bikini Mala's Vuvale
Dead Coral
Soft
Digitate
Solitary
Foliose
Tabular
Sub-Massive
Massive
Corymbose
Encrusted
Branching 0
1
2
3
4
5
6
7
8
Rabbit Snapper Bikini Mala's Vuvale
Bleached Coral

resource to recover so the fishing industry may switch back and forth rather than
systematically fishing down (Botsford et al. 1997, Russ 2002).
The decrease in family richness and the shift in size ranges that dominate the reef is also
consistent with the effect of fishing pressure. As large top predators are removed from the
area (as indicated by the lack of fish >30 cm surveyed and the decrease of large fishes family)
there will be an increase in mid-sized (10 – 20 cm) fish species observed (Jackson et al. 2001).
This is a major shift in ecological top-down interaction. However, this quarter the dominating
size class is < 10 cm. This is similar to last year’s report, which gives more support to the seasonal effect over fish size assemblages (Cohen & Alexander 2013).
The decrease in species richness from last quarter back to the levels of this time last year
indicates seasonal effect. There’s a high possibility that Beqa lagoon have transient fish
species that used the reef as either breeding or hunting grounds (Cohen & Alexander 2013). It
seems that January – March is the breeding period for some fish species, which attracts their
associated predators to Beqa lagoon, and thus increases species richness. The months April –
June is where we observe large numbers of small fishes that survived larval stage, and hence
the larger number of fish <10 cm is observed. Consequently, the enforcement of the no take
area or “tabu” area is essential in the first quarter of the year to help with the recovery of fish stocks.
Three of our sites Mala’s rock, Bikini and Rabbit were already located in “tabu” areas where
locals are not allowed to fish (FLMMA, 2013). This indicates that there are other sources of
fishing pressure or that locals have ways of circumventing the “tabu” law. Personal
communication with the locals indicates that both are happening. Fishing vessels from Suva
have been sighted in Beqa waters to fish (pers. Comm. 2016) and locals have been putting in
fishing lines in the “tabu” area and pulled up when they had passed the areas (pers. Comm. 2016).
Furthermore the no-take areas (NTA) or “tabu” areas were established almost randomly
without consideration for the reef system as a whole. Fernandez et al. (2009) suggested that
for a NTA to work it has to represent at least 20% of the reef and non-reef bioregion. He also
suggested that the NTA should form a network that represents all habitat types within the
region (Fernandez et al. 2009). Our results highlight the need to better manage the
establishment of “tabu” areas. However further studies, especially in habitat connectivity
and larval dispersal, are needed in order to design an effective network of “tabu” areas that
benefit biodiversity and local fisheries. We did not have the resources and expertise to conduct said studies during this quarter.
Benthic cover surveys revealed a relatively healthy ecosystem. The overall coral cover was
close to the average coral cover throughout the country, which is estimated at 45% (Morris
and Mackay, 2008). Sykes and Lovell (2009) reported that Fiji’s reefs were remarkably
resilient to sudden catastrophic events. The general status of Fiji’s coral reef was considered
to be stable, with reefs recovering following disturbance events, and with little evidence of
widespread and prolonged stress, damage or loss of coral cover (Chin et al., 2011). This is
reflected by the low number (<4%) of dead coral and bleached coral that is observed in our
study sites.
From this it seems as though our study sites suffer from extreme fishing pressure. The fishing
activity itself did not cause much damage to the reef system. Whether this is caused by non-
destructive fishing methods used by locals (line and spear) (pers comm. 2016) or because
Fiji’s reefs were remarkably resilient (Sykes and Lovell, 2009) remains unclear. Longer term
monitoring of benthic assemblages is needed to judge the resilience of the reef throughout the year.
Observer bias is a constant consideration when gathering data based on visual surveys
(Cheal & Thompson 1997, Nadon & Stirling 2006). However, since the data within quarters
showed consistency, as indicated by the small error bars, we can put some measure of
confidence in the accuracy of the data.
3.2 Mangrove Mapping in Vaga Bay
3.2.1. Introduction
Mangrove forests occur on low energy, sedimentary shorelines of the tropics, between mean
tide and high tide elevations (Molony et al. 1995). Mangrove trees have physiological and
morphological adaptations to the environmental stresses of their intertidal habitat, of high
salinity, low oxygen, poor nutrient availability and substrate mobility (Duggan, 2003). These
cause the different mangrove species to prefer a particular elevation between mean tide and
high tide. True mangrove species occur exclusively in this saline wetland environment, with
adaptations such as aerial roots and halophytic strategies (Molony et al. 1995, Duggan, 2003).
Mangrove ecosystems provide a useful buffer between the land and the sea. Mangrove forests
are a sink for sediment and nutrient-rich runoff, protecting nearshore waters from
eutrophication and turbidity to benefit seagrass and coral reef health (Peters et al. 1997). They
also provide protection of the land from marine inundation during storms. Mangroves have been
shown to be important fish habitats, particularly functioning as a fish nursery (Lal et al. 1984).
Mangroves sustain a food chain within the mangrove habitat, and tidal export of mangrove
material supports offshore food chains (Ley et al. 2002). Many species of fishes, crustaceans,
molluscs, amphibians, reptiles and birds are found in mangroves (Lal et al. 1984, Ley et al. 2002)
Mangrove wetlands are one of the most threatened natural communities worldwide, with about
50% of the global area lost since 1900, and 35% of the global area lost in the past two decades
(FAO, 2003; Spalding et al., 2010). Human activities remain a major cause of degradation and
loss of mangrove ecosystems in all parts of the world, including the Pacific Islands region
(Polidero et al., 2010). Monitoring will measure mangrove extent and condition, and allow

mangrove ecosystems to be conserved and managed sustainably to maintain their
environmental, ecological, and socioeconomic benefits.
Mangrove ecosystems are also sensitive to climate change impacts, particularly to associated
relative sea level rise. Inter-tidal mangroves are most extensively developed on sedimentary
shorelines, where mud accretion determines their ability to keep up with sea-level rise (Gillman
et al. 2008). The IPCC 4th Assessment projected a global sea level rise of 0.18-0.59 m by 2099
(1.5-9.7 mm per year), and mangrove accretion rates are usually less than this, resulting in
dieback at the seaward edge, and inland recruitment. Rise in temperature and the effects of
increased CO2 levels should increase mangrove productivity, change phenological patterns, and
continue expansion of mangrove species ranges into higher latitudes (Gillman et al. 2008).
Fiji has the third largest mangrove area in the Pacific Island region, after PNG and the Solomon
Islands. Mangrove areas are one of the better wetland types inventoried in the Pacific Islands
(particularly Fiji), though the information sources are fairly dated (Watkins, 1999). The mangrove
area was estimated by Spalding et al. (1997) from a forest cover map prepared by the Ministry of
Forests, Fiji based on a 1985 survey, with mangroves distinguished using the Fiji Forest Inventory
carried out 1966-9. This gave a total mangrove area for Fiji of 517km2. Largest areas are on the
SE and NW Viti Levu shorelines, and the northern shore of Vanua Levu (Richmond and
Ackermann, 1974). Only 19.7 km2 of mangrove was recorded for Fiji by Saenger et al. (1983), an
area which is not accepted by other writers.
Rehabilitation of degraded mangrove and inshore reef areas will increase their resilience to
climate change effects. Site selection should consider value for money, the level of community
or stakeholder support, benefits to adjacent systems and the relative risk of sea-level rise. Any
rehabilitation program should initially remove the stress that caused decline, decide on whether
to use natural regeneration or active replanting techniques, in which case us of local sources of
seeds or juveniles will reduce loss of genetic variation across Fiji. This mapping exercise aimed to
collect baseline data before rehabilitation commences, to enable demonstration of
improvement in water quality, reef cover and fisheries with progression of the rehabilitation
project.
3.2.2 Mapping Area
Survey done by the WWF showed that Beqa island is one of the major mangrove habitat in Fiji,
housing approximately 72 ha of mangrove. Vaga bay is the largest bay on the west side of Beqa
Island. It is approximately 1.2 km wide and 1.5 km deep inshore. There is mangrove wetland
present along the inside of the bay which is the characteristic of the sheltered bay area. There
are two villages in the bay: Rukua which is located on the north part at the mouth of the bay and
Naiseuseu which is located in the south part inside the bay. Both of these villages fish in the bay
as part of their livelihood. Mangroves have been shown to be important fish habitats,
particularly functioning as a fish nursery, therefore it is beneficial to assess the condition of Mangroves that are present in the Bay.

3.2.3. Materials and Method
Level 1 monitoring protocol was used following the Manual for Mangrove Monitoring in Pacific
Island Regions (Ellison et al. 2012). Firstly we determined the extent of the mangrove forest
using the most recent aerial photograph (Figure 9). Vegetation zones were marked based on the
photograph and was taken into the field to accurately check the types and positions of the
zones, called ground truthing. On the aerial photograph, six transects perpendicular to the coastline were marked. The transects were numbered from one to six from North to South.
Figure 9. Aerial photograph of mangrove wetland at Vaqa Bay, Beqa Island, marked by red square. Frontier Fiji Marine basecamp marked by red pin. (Source: Google Maps)
Using major features visible on the aerial photograph, we determined the starting point of each
transect. The start position of the transect was identified using the GPS and marked using
flagging tape. A new data form was used for each vegetation zone along the transect. Notes
were taken to help re-locate the position if a GPS was not available, such as marking the point
with flagging tape. The transect lines were walked into the forest using a 50 m fibreglass tape. A
compass was used to ensure that the transect was perpendicular to the shoreline and stayed
straight. Notes were taken on which species were in a zone, which species were abundant, and which species were rare. The width of each zone was also measured zone (mm).
The degree of impact in the area was assessed at each observation point with a 15m radius.
Impact was assessed on a scale from 0 to 5 where 0 is no impact and 5 is severely impacted
(Table 4). The surroundings were then inspected visually to determine the cause of Impact.
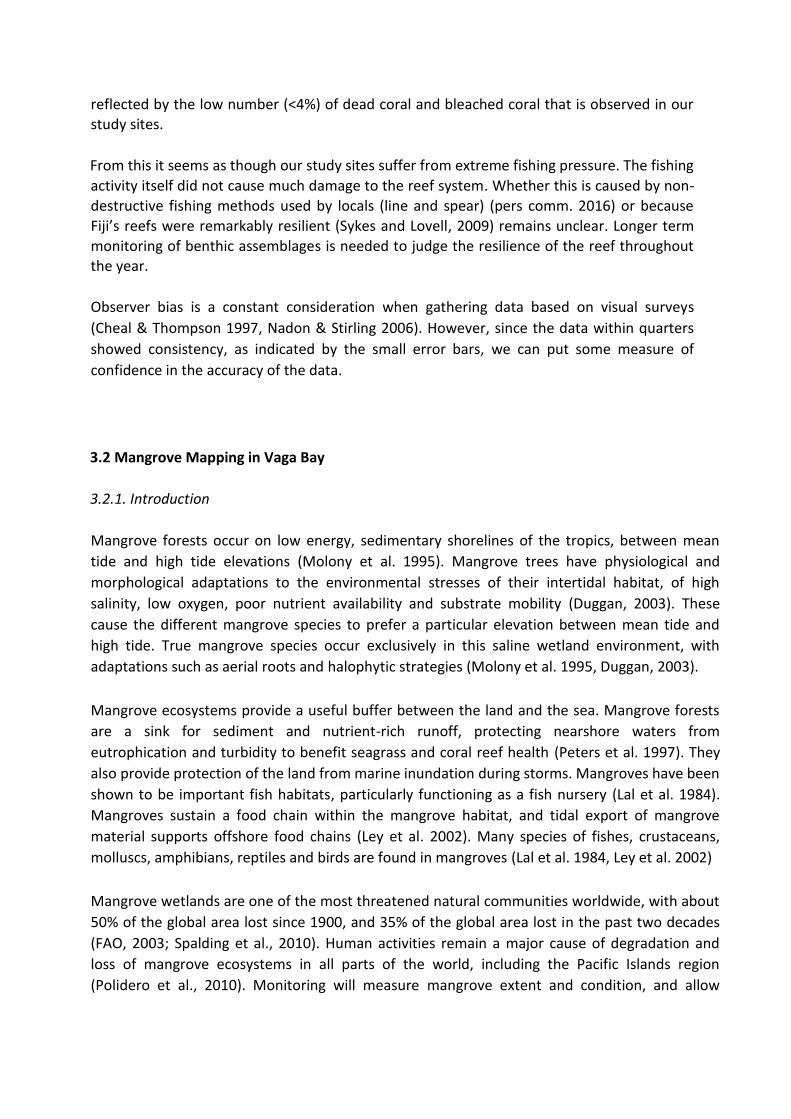
Impact may be direct, indirect, or both, anthropogenic activities such as piggeries, garbage,
illegal cutting, storm damage, etc was recorded.
Table 4. Codes used to record the impact of pressure on mangrove ecosystems
The GPS position at the mangrove edge and the condition of the seaward edge was noted, such as any recruitments, or signs of erosion.
3.2.4. Results
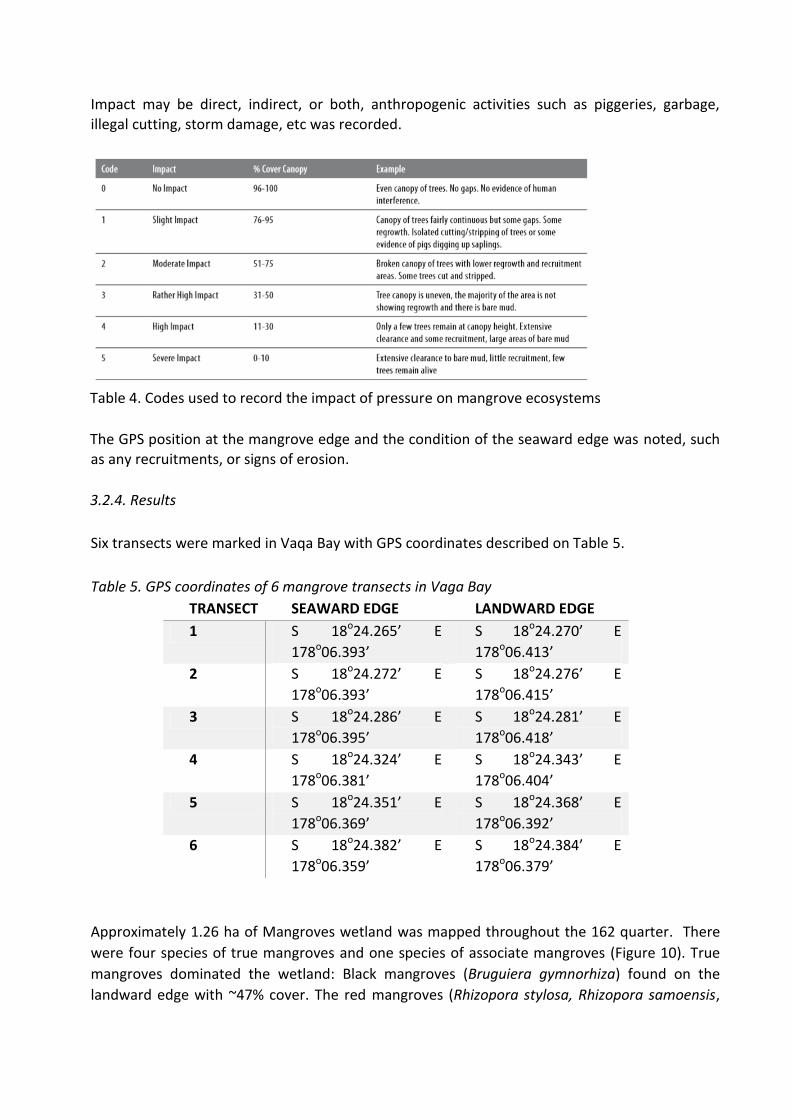
Six transects were marked in Vaqa Bay with GPS coordinates described on Table 5.
Table 5. GPS coordinates of 6 mangrove transects in Vaga Bay
TRANSECT SEAWARD EDGE LANDWARD EDGE
1 S 18o24.265’ E
178o06.393’
S 18o24.270’ E
178o06.413’
2 S 18o24.272’ E
178o06.393’
S 18o24.276’ E
178o06.415’
3 S 18o24.286’ E
178o06.395’
S 18o24.281’ E
178o06.418’
4 S 18o24.324’ E
178o06.381’
S 18o24.343’ E
178o06.404’
5 S 18o24.351’ E
178o06.369’
S 18o24.368’ E
178o06.392’
6 S 18o24.382’ E
178o06.359’
S 18o24.384’ E
178o06.379’
Approximately 1.26 ha of Mangroves wetland was mapped throughout the 162 quarter. There
were four species of true mangroves and one species of associate mangroves (Figure 10). True
mangroves dominated the wetland: Black mangroves (Bruguiera gymnorhiza) found on the
landward edge with ~47% cover. The red mangroves (Rhizopora stylosa, Rhizopora samoensis,

and Rhizopora x selala) followed closely with ~37%. The majority of them were Rhizopora x
selala (21% cover). The one associate mangrove species (Barringtonia asciata) was found by the
high tide line and covered approximately 11% of the wetland. Canopy cover was mostly uniform
with only 5% of bare patches throughout the area. Damage observed on the trees was mostly
from storm damage. High tide marks varied around 50 – 60 cm on the landward edge and
around 90 – 110 cm on the seaward edge. Seaward edge was littered with recruitments, most of
them were black mangroves.
Figure 10. Distribution of Mangrove Species in Vaga Bay
3.2.5 Discussion
All four of true mangrove species present in Vaga Bay are members of Rhizoporaceae. The family
Rhizophoraceae includes around 135 tropical species of trees and shrubs placed in around 15
genera (Prance 2001). The principal genera in Rhizophoraceae are Bruguiera, Carallia,
Cassipourea, Ceriops, Crossostylis, Pellacalyx, and Rhizophora (Spalding et al. 2010). Rhizophora
is the most conspicuous genus in tropical, coastal mangrove ecosystems (Prance 2001).
Rhizopora x selala is a hybrid mangrove, which is sterile and only occurs if both Rhizopora stylosa
and Rhizopora samoensis are present (Robertson & Alongi 1992). All of them are medium sized
trees ranging from 8-30m in height (Spalding et al. 2010). Their leaves are about 10cm long and
slightly rounded with a small spike at the tip (Giesen et al. 2007). The flowers are white and are
wind or insect pollinated (Spalding et al. 2010) except for Rhizopora x selala which are sterile.
The majority of red mangroves observed being Rhizopora x selala raises concerns about the
seaward recruitment.
Bruguiera gymnorhiza is a darkly coloured mangrove which only grows to 10 m in height. Its bark
is rough and reddish-brown (Allen & Duke 2006). The tree develops short prop-roots rather than
long stilt-roots (Giesen et al. 2007). Flowers are creamy-white which soon turn brown (Sheue et
al. 2005). The sepals are persistent, narrow and slightly tapered. When mature, the spindle-
shaped fruits drop and become embedded in the mud in an upright position, where they rapidly
9%
7%
21%
47%
11% 5%
Rhizopora stylosa
Rhizopora samoensis
Rhizopora x selala
Bruguiera gymnorhiza
Barringtonia asciata
Bare

develop roots (Allen & Duke 2006). It is found on the seaward side of mangrove swamps, often
in the company of Rhizophora (Giesen et al. 2007). The two species work together to stabilize
the shoreline, provide buffers from storm surges, trap debris and detritus brought in by tides,
and provide feeding, breeding, and nursery grounds for a great variety of fish, shellfish, birds,
and other wildlife (Smith 1992).
Barringtonia asiatica is a species native to mangrove habitats on the tropical coasts and islands
of the Indian Ocean and western Pacific Ocean (Molony & Sheaves 1995). It is a small to
medium-sized tree growing to 7–25 m tall (Robertson & Alongi 1992). The leaves are narrow
obovate, 20–40 cm in length and 10–20 cm in width. The fruit is otherwise aptly known as the
Box Fruit, due to distinct square like diagonals jutting out from the cross section of the fruit,
given its semi spherical shape form from stem altering to a subpyramidal shape at its base
(Giesen et al. 2007). The fruit measures 9–11 cm in diameter, where a thick spongy fibrous layer
covers the 4–5 cm diameter seed (Giesen et al. 2007). All parts of the tree are poisonous, the
active poisons including saponins (Tan 2001). The seeds have been ground to a powder to stun
or kill fish for easy capture, suffocating the fish where the flesh is unaffected (Tan 2001). This
method is commonly used by local villagers in Beqa for fishing (pers. Comm., 2016).
Overall the mangrove wetlands seem to be healthy with uniform canopy cover. This indicates
that the area was relatively free of direct anthropogenic impact such as piggeries, garbage, or
illegal cutting.
The lack of recruitment observed at the seaward edge indicates a lack of growth in that area.
This is likely to have been caused by sea level rise which naturally pushes the mangrove area
landwards (Krauss et al. 2014). But since the landward edge in Vaqa Bay is dense rainforest
(pers. obsv. 2016), the mangrove wetland is unable to expand inland and is likely become
reduced in time. Another possible cause is the sterility of the dominating species, Rhizopora x
selala. This may be remedied by a planting project that focuses on the two other species of red
mangroves.
3.3. Identifying Blacktip Reef Shark Nursery Grounds
By: Rosalyn Jones
3.3.1. Introduction
Fijian waters play host to a wide variety of elasmobranch species; from large, highly migratory
sharks to coastal dwelling rays and reef sharks. Beqa Island is known globally for precisely this
reason.
Blacktip reef sharks, Carcharhinus limbatus, are commonly sighted around Beqa. They are a
coastal species found in tropical and sub-tropical reef systems. They can reach a maximum
length of 1.8m and are easily recognised by the black tip and white sub-marginal band on their
first dorsal fin (Castro, 1996). They favour reef flats and shallow lagoons, using reef systems as

primary hunting grounds. Blacktips are apex predators in many reef systems, including those in
Beqa lagoon. Their reproductive cycle occurs over two years; a one year gesticulation period and
a one year rest before mating again. Blacktip sharks can be classed as ecosystem engineers –
having an above average effect on ecosystem processes (Killam & Parsons, 1989). This makes it
imperative to protect them in order to preserve the health of the reef and its associated species.
Globally, elasmobranch species are in a state of severe population decline. The IUCN 2014 Red
List classed blacktip sharks as 'near threatened' in their 2014 review. The main causes for decline
in blacktips are fishing pressure, both for meat and fins, and being caught accidentally; termed
by-catch (Fong & Anderson, 2002). Sharks in Fiji are relatively well protected. Fijian culture
dictates that sharks are sacred and it is forbidden in numerous villages to harvest them (Rasalato
et al. 2010). However, Fijian shark populations are still threatened by foreign fishing vessels in
their waters and the demand for shark fins internationally. An effective way to protect a species
is to focus conservation efforts upon areas of key ecological significance; for example nursery
grounds (Hueter et al. 2005).
The concept of nursery ground use by some elasmobranch species has been widely recognized in
scientific literature for decades (M. Heupel et al. 2007). These are generally classed as 'an area
where young are born and reside as they grow towards maturity' (M. Heupel et al. 2007).
Genetic studies have identified this behaviour in black tip sharks in New Mexico (Keeney et al.
2003). Keeney et al. (2003) also identified natal philopatry within the species; adults return to
the same area to breed and give birth. This phenomenon results in genetic heterogeneity
between sub-populations meaning that each individual stock requires protection to preserve species genetic diversity (Hueter et al. 2005).
However, there is no definitive method for correctly identifying a nursery area. M. Heupel et al.
(2007) proposes classifying it under three key characteristics:
• Sharks are more commonly encountered in the area than other areas • Sharks have a tendency to remain or return for extended periods • The area or habitat is repeatedly used across years
These are widely accepted characteristics of elasmobranch nursery grounds and will be referred
to regularly throughout this study. It is also important to account for the size ratio of the
population when identifying nursery areas. If the population in the proposed area has a high proportion of juveniles it will also be an indicator of a nursery ground (Duncan et al. 2006).
Beqa has many possible bays and shallow areas that could be potential nursery grounds for
blacktip sharks. The sandbar was selected as an initial point of study due to a high number of juvenile and adult blacktip sightings while on recreational visits.
Sandbar is positioned on the lagoon side of the barrier reef, to the west of Beqa Island. It is
frequently visited by tourists, primarily from the Duveuni Luxury Resort, increasing boat traffic
and noise pollution to the surrounding marine environment. It is also subjected to a high level of
fishing pressure from residents of Beqa, both using long lines and spear fishing. Beqa residents

know it as a place where sharks are seen frequently, particularly blacktips. All scuba sites which
are being used as a comparison are survey sites located inside Beqa lagoon.
This study hypothesises that the sandbar is a nursery ground for blacktip reef sharks. It also
proposes and discusses the extension of the study to further assess other areas of Beqa lagoon
where blacktips are regularly sighted. This will help to identify and compare other possible
nursery areas through a long term monitoring programme. The overarching aim is to make recommendations regarding blacktip conservation management in Beqa.
3.3.2. Methodology
Following site selection, the sandbar was divided into two study areas as their depth and topographies vary significantly. Both sites extend for 50m from the edges of the sandbar.
Site Depth Range (m)
Topography
Sandbar 1 – facing barrier reef 0.5 – 2.5 Mainly reef with occasional
sandy patches, small wreck close to barrier
Sandbar 2 – facing Beqa Island 0.5 - 14 Large sandy area with the occasional coral bombies
Table 1: Survey site specifics
Snorkel surveys were deemed most appropriate due to the relatively shallow depth ranges of the sites.
Surveyors swim in a 'sweeping' pattern through the site and count individuals appropriately;
similar to a belt transect method. Each transect, or sweep, is conducted for 10 minutes which is
timed by the observer using a dive watch. Minute breaks are kept in between transects as a
minimum to ensure each replicate is independent. This also reduces the possibility of double
counting an individual. Surveyors aim to conduct five transects during their 'in water' sessions if conditions are favourable.
Slates are used to record survey times, visibility (m) and current, demonstrated in Table 2.
Current speed is divided into 6 categories; 0 being no current and 6 being a very strong current.
If current is above 5 or visibility is <5m then surveys are suspended until environmental conditions improve.
Upon sighting a blacktip shark, surveyors record sighting time, length estimate (m) and
interaction time – how long the shark was within sight for. Length estimate can give an idea of
sexual maturity. Killam & Parsons (1989) identified three size classes in blacktip reef sharks
which will be used to identify individuals as juveniles, adolescents or adults. Interaction time can
be used to make implications of the behaviour of the individual. Short interaction times suggest
that the shark was wary of the observer, whereas longer interaction times suggest that the
individual may be used to human presence. The slate also has space for a 'comment' box. In this

area surveyors can record any specific markings the shark may have which would help to identify
it in the future. Behaviour notes and sightings of other shark species can also be noted in this box.
Surveyor: Meg Visibility:8 Current:2
Transect no. Start
time
Sighti
ng time
Length
estimate (m)
Interaction
time (s)
Additional
Comments
1 14.32 14.35 0.75 20 Came
within 5m
Table 2: Layout of the survey slate
Surveys for both Sandbar sites are conducted on a weekly basis. Dedicated snorkel surveys
started at sandbar on the 24/05/16. Thus far two have been completed, the second week being missed due to weather conditions and boat availability.
Data from regular dive and snorkel sites is also used as a comparison. This has been collected
sporadically from the 01/05/16. Sharks are sighted opportunistically while conducting fish or coral surveys. Upon sighting a blacktip, length estimates and interaction times are recorded.
Statistical analysis of data this early in the study is limited due to the low number of transects
completed; the reliability of such statistical outputs would be very low. For this reason only basic comparisons have been made in this report.
3.3.3. Results
Sandbar 1 recorded the highest number of individuals sighted; reporting five in total. Jane's Rock
and Vaga Bay both had one sighting. Surveyors at Sandbar 2, Mala's Rock, Wreck Reef, Snapper, Vuvale and Bikini all reported no blacktip sightings (figure 1).
Figure 1: Number of individual sharks recorded compared by site
0
1
2
3
4
5
6
Site
Nu
mb
er o
f in
div
idu
als

With regards to the snorkel survey method, sandbar 1 had more transects completed than
sandbar 2 by 4 transects. Snorkel surveys were completed at Jane's Rock only once whereas
surveys in Vaga Bay were conduced 8 times. Scuba surveys across sites vary widely in number. Bikini was surveyed the most and Vuvale the least; 6 and 3 times respectively (table 3).
Site Survey Method
Number of surveying trips
Number of
transects completed
Sandbar 1 Snorkel 2 21
Sandbar 2 Snorkel 2 17
Jane's Rock Snorkel 1 n/a
Mala's Rock Scuba 4 n/a
Vaga Bay Snorkel 8 n/a
Wreck Reef Scuba 5 n/a
Snapper Scuba 4 n/a
Vuvale Scuba 3 n/a
Bikini Scuba 6 n/a
Table 3: Breakdown of survey methods and surveys completed per sites
Length estimate and interaction time both vary considerably between shark sightings. The
smallest individual was 0.5m in length and seen at Vaga Bay and the largest, of 1.6m length, at
Sandbar 1. The smallest individual at Vaga Bay also showed the smallest interaction time of 3
seconds. Two individuals at Sandbar 1 gave the longest interaction time of 60 seconds each (table 4).
Date of
Sighting
Site Length
estimate (m)
Interaction
Time (s)
Additional Comments
14/05/16 Vaga Bay 0.5 3 Very shy
29/05/16 Jane's Rock
1.2 10 Seen at a distance of 10m
24/05/16 Sandbar 1 0.8 30 -
24/05/16 Sandbar 1 1.5 60 Stayed within 5m for 20s
24/05/16 Sandbar 1 1.6 10 Swam away quickly
11/06/16 Sandbar 1 0.75 60 Stayed within 2m for 15s
11/06/16 Sandbar 1 1.7 7 -
Table 4: Details of each shark sighting
During recreational time on the Sandbar on 11/06, two blacktip sharks of 0.5m and 0.4m
respectively were sighted very close to the shore; in no more than 0.5m of water. Sharks of
other species were also sighted while conducting surveys. At sites Bikini, Mala's Rock, Wreck
Reef, Vuvale and Snapper, white tip reef shark are commonly sighted. The exact number of
these sightings has not been recorded. At Sandbar 1 on 11/06 a 2m tawny nurse shark was sighted resting inside the wreck very close to the barrier lagoon.
3.3.4. Discussion
Preliminary data is extremely promising, especially in terms of determining whether sandbar is a
nursery area. Juveniles and adults have been sighted, which is very exciting, and the presence of other shark species indicates that the area is also an important area for other shark species.
Blacktips were only recorded in three of the total nine sites; Sandbar 1, Jane's Rock and Vaga
Bay. This could be related to the bottom topography of the sites. All nine sites are reef centric
but the three sites where sightings occurred have a higher area of sandy patches. It is doubtful
that depth is significant to overall blacktip shark presence as the sites are all relatively similar in
depth. Further comparison of bottom topography between sites is needed to investigate this hypothesis further.
Alternatively, the differences between sites could perhaps be linked to the presence of white tip
reef sharks, a species of reef shark also commonly sighted in Beqa Lagoon. Blacktips and
whitetips very rarely occur in the same sites, due to inter-species competition. This is supported
by preliminary findings; whitetips are regularly observed in all six sites where blacktips did not
occur. Blacktips are also understood to be more evasive of divers than other shark species. The
six sites where zero were recorded are all of our most frequently dived sites, with at least one
visit per week. This is supported by evidence displayed in table 3; all sightings occurred when
snorkel surveys were being conducted. Unless depth demands the use of scuba, snorkel sweep surveys will be used as the primary survey method.
On average, sharks at Sandbar 1 showed the longest interaction time when compared with Vaga
Bay and Jane's Rock sightings; 33.4s compared to 3s and 10s respectively. This indicates that
individuals at Sandbar 1 are more accustomed to human presence, which correlates with the
tourist activity and high fishing pressure recorded. Individuals may have even started associating
snorkelers with food as such a large proportion of locals spearfish while snorkeling. Blacktip
sharks have been observed stealing fish from lines and fishermen (IUCN, 2014).
Conclusions drawn from preliminary data of such a small sample size are speculative at best.
Continued surveying is crucial to identify statistically significant differences between sites. This is
particularly important for Vaga Bay and Jane's Rock in order to distinguish whether the single sightings recorded are indicating key habitat areas for blacktip sharks or merely anomalies.
Continuing study will refer to the guidelines set by Heuter et al. (2007):
1. Sharks are more commonly encountered in the area than other areas
2. Sharks have a tendency to remain or return for extended periods
3. The area or habitat is repeatedly used across years
To meet these criteria as many new sites as possible need to be added to draw valid conclusions.
Further studies will target sites with different depths, bottom topography and anthropogenic impacts. This extended approach ensures that guideline 1 can be confirmed.

Further studies will attempt to employ photo identification of individuals as a way to assess their
tendency to remain in the area. Baby sharks use a small initial area for around 3 months then
extend their nursery area. This happened in the gulf Coast of Florida where they were tagged
(Heupel & Hueter 2001). Comparisons can be made to this study using photo identification
techniques. If the results indicate a large movement of individuals, tagging projects can be pursued using contacts at the University of the South Pacific.
4. Acknowledgement
We would like to thank the family that owns the land we operate from, especially to Malakai
Tabaka and family which had been crucial for our fieldwork. Thanks also to all of the RAs whose had been working hard in collecting all of the data.
5. References
Allen, J.A. & N.C. Duke. 2006. Bruguiera gymnorrhiza (large-leafed mangrove). ver. 2.1. In: Elevitch,
C.R. (ed.). Species Profiles for Pacific Island Agroforestry. Permanent Agriculture Resources (PAR), Hōlualoa, Hawai‘i
Botsford LW, Castilla JC, Peterson CH (1997) The Management of Fisheries and Marine Ecosystems.
Science 277:509-515
Burgess, H. G. & Branstetter, S. 2014. Carcharhinus limbatus. The IUCN Red List of Threatened Species 2009: e.T3851A10124862
Burns, G. L. "Amidst our people': Impact of tourism and local knowledge in Beqa." Science of Pacific Island People (1994): 25-40.
Carpenter, K. E. and Allen, G. R. (1989) FAO Species Catalogue, Emperor fishes and large-eye breams
of the world (family Lethrinidae). An annotated and illustrated catalogue of lethrinid species known to date. FAO Fisheries Synopsis 125: 9, 1-118.
Castro JI (1996) Biology of the blacktip shark, Carcharhinus limbatus, off the southeastern United states. Bull Marine Science 59; 508-522.
Cheal AJ, Thompson AA (1997) Comparing visual counts of coral reef fish: Implications of transect
width and species selection. Mar Ecol-Prog Ser 158:241-248
Christine, A.O. The physiological ecology and behaviour of an apex marine predatory fish, the great barracuda (Sphyraena barracuda). (2010). Dissertation. Carleton University Ottawa.
Cohen PJ, Alexander TJ (2013) Catch rates, composition and fish size from reefs managed with periodically-harvested closures.
Cumming, R. L., Aalbersberg, W. G. L., Lovell, E. R., Sykes, H. & Vuki, V. C. (2002). Institute of Applied
Sciences, The University of the South Pacific. IAS technical report 2002/11. 1-16.
Done, T. J., Ogden, J. C., Wiebe, W. J & Rosen B, R. (1996). Biodiversity and ecosystem function of coral
reefs. In: Mooney, H. A, Cushman, J. H & Medina E. Sala, O. E. Schulze ED (eds). Functional roles of biodiversity: a global perspective. John LViley & Sons, New York. 394-427.
Duggan L (2003) Mangroves. University of Queensland Press, St Lucia, Qld

Duncan, K, M, Holland, K (2006). Habitat use, growth rates and dispersal patterns of juvenile
scalloped hammerhead sharks Sphyrna lewini in a nursery habitat. Marine Ecology Progress Series; 312; 211-221.
Fabricius KE (2005) Effects of terrestrial runoff on the ecology of corals and coral reefs: review and synthesis. Mar Pollut Bull 50:125-146
Fabricius, E. (2005). Effects of terrestrial runoff on the ecology of corals and coral reefs: review and synthesis. Marine Pollution Bulletin 50, 125–146
FAO (2003) Status and trends in mangrove area extent worldwide. In Wilkie ML, Fortuna S, editors.
Forest Resources Assessment Working Paper No. 63. Rome: Forest Resources Division, FAO. http:// www.fao.org/docrep/007/j1533e/j1533e00.HTM
FAO (2007). The world’s mangroves 1980–2005. FAO Forestry Paper 153. FAO, Rome
Fernandez LA, Macfarlane JK, Tcaciuc AP, Gschwend PM (2009) Measurement of freely dissolved PAH
concentrations in sediment beds using passive sampling with low-density polyethylene strips. Environmental Science and Technology 43:1430-1436
Ferrari MCO, Lysak KR, Chivers DP (2010) Turbidity as an ecological constraint on learned predator recognition and generalization in a prey fish. Animal Behaviour 79:515-519
Fong SW and Anederson JL (2002) International shark fin markets and shark management: an
integrated market preference–cohort analysis of the blacktip shark (Carcharhinus limbatus). Ecology Economics 40; 177-130
Fritz, A. (2016). Catastrophic cyclone winston bears down on fiji's main island in worst case scenario.
Washington: WP Company LLC d/b/a The Washington Post. Retrieved from http://search.proquest.com/docview/1766612999?accountid=16285
Giesen, W., S. Wulffraat, M. Zierenand & L. Scholten. (2007). Mangrove Guidebook for Southeast Asia, p. 692-693. FAO and Wetlands International, Bangkok. ISBN 974-7946-85-8
Gilman, E. L., Ellison, J., Duke, N. C., & Field, C. (2008). Threats to mangroves from climate change and
adaptation options: A review. Aquatic Botany, 89(2), 237-250.
doi:10.1016/j.aquabot.2007.12.009
Giri, C., Ochieng. E., Tieszen L.L.,Zhu Z., Singh, A., Loveland, T. Masek, J. and. Duke, N. (2010). Status
and distribution of mangrove forests of the world using earth observation satellite data. Global
Ecology and Biogeography, 20, 154-159.
Heupel M, Carlson JK, Simpfendorfer JM (2007). Shark nursery areas: concepts, definition, characterization and assumptions. Marine Ecology Progress Series 337; 287-297.
Heupel MR, Hueter RE (2001) Use of an automated acoustic telemetry system to passively track juvenile blacktip shark movements. Electronic tagging and tracking in marine fisheries 1; 217-236
Hodgson, G. (2001). Reef Check; The first step in community-based management. Bulletin of Marine Science. 69: 861-868
Hoffmann TC (2002) Coral reef health and effects of socio-economic factors in Fiji and Cook Islands. Mar Pollut Bull 44:1281-1293
Hoffmann, T. C. (2002). Coral reef health and effects of socio-economic factors in Fiji and Cook Islands. Marine Pollution Bulletin. 44: 1281–1293.
Holmes TH, Wilson SK, Vanderklift M, Babcock R, Fraser M (2012) The role of Thalassoma lunare as a predator of juvenile fish on a sub-tropical coral reef. Coral Reefs 31:1113-1123
Hueter RE, Heupel MR, Heist EJ, Keeney DB (2005) The implications of philopatry in sharks for the management of shark fisheries. Fisheries Science 35; 239-247

Hutchings, P., Kingsford, M & Hoegh-Guldberg, O. (2008) The Great Barrier Reef; Biology, Environment
and Management. CSIRO Publishing. 298.
Intergovernmental Governmental Panel on Climate Change (2007). Climate Change 2007: The Physical Basis. Intergovernmental Panel on Climate Change. IPCC, Geneva.
Jackson JBC, Kirby MX, Berger WH, Bjorndal KA, Botsford LW, Bourque BJ, Bradbury RH, Cooke R, Jon
E, Estes JA, Hughes TP, Kidwell S, Lange CB, Lenihan HS, Pandolfi JM, Peterson CH, Steneck RS,
Tegner MJ, Warner RR (2001) Historical Overfishing and the Recent Collapse of Coastal Ecosystems. Science 293:629-638
KA Killam and GR Parsons (1989) age and growth of the blacktip shark, Carcharhinus limbatus, near Tampa Bay, Florida. Fisheries Bulletin, NOAA 846-857
Karplus I, Algom D (1981) Visual Cues for Predator Face Recognition by Reef Fishes. Zeitschrift für
Tierpsychologie 55:343-364
Keeney DB, Heupel MR, Hueter RE, Heist EJ (2003) Genetic evidence of stock structure among blacktip
sharks Carcharhinus limbatus, continental nurseries along the U.S Atlantic and Gulf of Mexico.
Marine Biology 143; 1039-1046
Krauss, K. W., McKee, K. L., Lovelock, C. E., Cahoon, D. R., Saintilan, N., Reef, R., & Chen, L. (2014). How
mangrove forests adjust to rising sea level. New Phytologist, 202(1), 19-34. doi:10.1111/nph.12605
Lal, P.N., K. Swamy, and P. Singh. 1984. Mangrove Ecosystem: Fisheries Associated with Mangroves
and their Management. Mangrove Fishes in Wairiki Creek and their Implications on the
Management of Resources in Fiji. In Productivity and Processes in Island Marine Ecosystems. UNESCO Report on Marine Science. Paris, France.
Ley, J.A., I.A. Halliday, A.J. Tobin, R.N. Garrett, N.A. Gribble. 2002. Ecosystem effects of fishing closures in mangrove estuaries of tropical Australia. Marine Ecology Progress Series 245: 223-238.
Lovell, E., H. Sykes, M. Deiye, L. Wantiez, C. Garrigue, S. Virly, J. Samuelu, A. Solofa, T. Poulasi, K.
Pakoa, A. Sabetian, D. Afzal, A. Hughes and R. Sulu. (2004), Status of Coral Reefs in the South
West Pacific: Fiji, Nauru, New Caledonia, Samoa, Solomon Islands, Tuvalu and Vanuatu. In: C.
Wilkinson (eds.). Status of coral reefs of the world Volume 2. Townsville, Queensland: Australian Institute of Marine Science, Pp. 337–362.
Messmer V (2010) From genes to ecosystems: patterns, processes and consequences of declining biodiversity in coral reef fish communities. Dissertation/Thesis
Molony B, Sheaves M. (1995) Mangroves: ecology of intertidal forests, Vol 4. James Cook University of North Queensland, Townsville, Qld
Morris, C. and Mackay, K. 2008. Status of the coral reefs in the South West Pacific: Fiji, New Caledonia,
Samoa, Solomon Islands, Tuvalu and Vanuatu. In: Status of Coral Reefs of the World: 2008, p.177–188
Mosley, L. M., Aalbersberg, W. G. L. (2002). Nutrient levels in sea and river water along the "Coral Coast" of Viti Levu, Fiji. South Pacific Journal of Natural Sciences. 7.
MRIS (Marine Resource Inventory Survey) (2012) - Team Resource Survey at Beqa Lagoon for Yannuca and Rakua Villages and Commissioner Central – Fisheries dept, Lami. Sept 2012.
MRIS (Marine Resource Inventory Survey) (2012) - Team Resource Survey at Beqa Lagoon for Yannuca and Rakua Villages and Commissioner Central – Fisheries dept, Lami. Sept 2012.
Nadon M-O, Stirling G (2006) Field and simulation analyses of visual methods for sampling coral cover. Coral Reefs 25:177-185

Peters, E. C., Firman, J. C., Richmond, R. H., & Power, E. A. (1997). Ecotoxicology of tropical marine
ecosystems. Environmental Toxicology and Chemistry, 16(1), 12-40. doi:10.1002/etc.5620160103
Polidoro, B.A., Carpenter, K.E., Collins, L., Duke, N.C., Ellison, A.M., Ellison, J.C., Farnsworth, E.J.,
Fernando, E.S., Kathiresan, K., Koedam, N.E., Livingstone, S.R., Miyagi, T., Moore, G.E., vien, N.N.,
Ong, J.E., Primavera, J.H., Salmo, S.G., Sanciangco, J.C., Sukardjo, S., Wang, Y.M., and Yong,
J.W.H. (2010). The loss of species: Mangrove extinction risk and geographic areas of concern. Plos One, 5(4), 1-10.
Prance, G. T. 2001. Rhizophoraceae. En: Stevens, W.D., C. Ulloa, A. Pool & O.M. Montiel (eds.). Flora de Nicaragua. Monogr. Syst. Bot. Missouri Bot. Gard. 85(3): 2200–2201.
Pratchett, M.S. (2005) Dietary overlap among coral-feeding butterflyfishes (Chaetodontidae) at Lizard Island, northern Great Barrier Reef. Marine Biology, 148:373382.
Rasalato E, Maginnity A, Brunnschweiller JM (2010). Using local ecological knowledge to identify shark river habitats in Fiji (South Pacific). Environmental Conservation 37; 90-97
Reaka-Kudla, M.L. (1996). The global biodversity of coral reefs: a comparison with rain forests. In:
Reaka-Kudla ML, Wil- son DE, Wilson E0 (eds) Biodiversity 11. Joseph Henry Press, Washington. 83-108.
Robertson, A. I., & Alongi, D. M. (1992). Tropical mangrove ecosystems. Washington, DC: American
Geophysical Union.
Russ GR (2002) Yet another review of marine reserves as reef fishery management tools. Elsevier
Sheue, C.R., J.W.H. Yong & Y.P. Yang. 2005. The Bruguiera (Rhizophoraceae) Species in the Mangroves of Singapore, Especially on the New Record and the Rediscovery. Taiwania 50(4): 251-260, 2005
Smith, TJ. 1992. Forest structure p 101-136 In Tropical mangrove ecosystems. Coastal and estuarine
studies no. 4. In: Robertson, AI; Alongi, DM, editors. Washington D.C.: American Geophysical Union.
Solomon, S., Plattner, G. K., Knutti, R., & Friedlingstein, P. (2009). Irreversible climate change due to
carbon dioxide emissions. Proceedings of the national academy of sciences, 106(6), 1704-1709.
Spalding, M., Kainuma, M. and Collins, L. (2010). World Atlas of Mangroves. Earthscan: London ad Washington D.C.
Sykes, H. R. and Lovell, E. R. 2009. “A Cause for Optimism”: Identification of threats and resiliency on
Pacific Reefs through establishment of a long term reef monitoring network in Fiji : The Fiji Coral
Reef Monitoring Network (FCRMN ). In: French Research in the Pacific, 02 – 06 March 2009, 2009, Tahiti, French Polynesia., p.1–15.
Tamata, B & Thaman, B. (2001). Water quality in the ports of Fiji – survey of various ports and
industrial point sources of pollution. IAS Environment Studies Report C103, Institute of Applied Sciences, The University of the South Pacific.
Tan, R. (2001). "Sea Poison Tree". Mangrove and wetland wildlife at Sungei Buloh Nature Park. Singapore.
Teh L.C.I, Tech L.S.L, Starkhuse B, Sumalla R (2008). An overview of the socio-economic and ecological perspectives of Fiji’s inshore reef fisheries. Marine Policy (33), 807-817.
Veitayaki, J. (2006). Caring for the Environment and the Mitigation of Natural Extreme Events in
Vanuaso Tikina, Gau Island, Fiji Islands: A Self-help Community Initiative. Island Studies Journal, Vol. 1, No. 2

Zann L. P & Lovell, E. R. (1992). The coral reefs of the Mamanuca group, Fiji: preliminary descriptions
and recommendations for management. National Environmental Management Project. Report on the Marine Environment. Annex 3.
Zann, L. P., Brodie, J. E & Vuki, V. C. (1990). History and dynamics of the crown-of-thorns starfish Acanthaster planci (L.) in the Suva area, Fiji. Coral Reefs. 9: 135-144.