figures of merit for nuclear/hydrogen hybrid systems · nuclear energy has the potential to exert a...
TRANSCRIPT

INL/EXT-17-41484 Revision 0
Figures of Merit for Nuclear/Hydrogen Hybrid Systems
Richard D. Boardman
March 2017
The INL is aU.S. Department of EnergyNational Laboratoryoperated byBattelle Energy Alliance
uIdaho NationalLaboratory

DISCLAIMER This information was prepared as an account of work sponsored by an
agency of the U.S. Government. Neither the U.S. Government nor any agency thereof, nor any of their employees, makes any warranty, expressed or implied, or assumes any legal liability or responsibility for the accuracy, completeness, or usefulness, of any information, apparatus, product, or process disclosed, or represents that its use would not infringe privately owned rights. References herein to any specific commercial product, process, or service by trade name, trade mark, manufacturer, or otherwise, does not necessarily constitute or imply its endorsement, recommendation, or favoring by the U.S. Government or any agency thereof. The views and opinions of authors expressed herein do not necessarily state or reflect those of the U.S. Government or any agency thereof.

INL/EXT-17-41484 Revision 0
Figures of Merit for Nuclear/Hydrogen Hybrid Systems
Richard D. Boardman
March 2017
Idaho National Laboratory Idaho Falls, Idaho 83415
http://www.inl.gov
Prepared for the U.S. Department of Energy Office of Nuclear Energy
Under DOE Idaho Operations Office Contract DE-AC07-05ID14517

vii
EXECUTIVE SUMMARY
Nuclear energy has the potential to exert a major impact on energy security by providing an economically reliable heat source that can be used for electrical power generation and heating of many industrial processes. Hydrogen is an important chemical intermediate in the U.S. and world energy economy. This was born out in a recent study on market opportunities for nuclear energy use by industry. Over 500 small modular nuclear reactors (SMRs, defined as <300 MWe) could be employed for hydrogen production in the U.S. alone by providing heat, steam and electricity to split methane and water into hydrogen and oxygen (McMillan 2016).
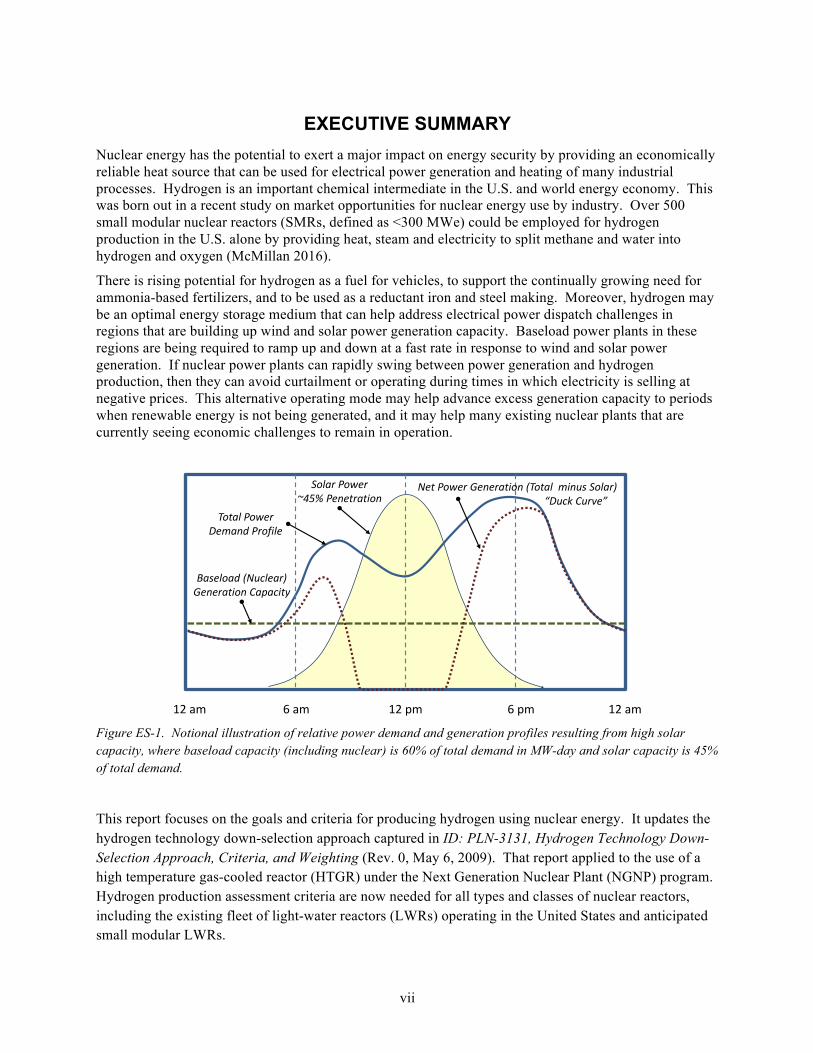
There is rising potential for hydrogen as a fuel for vehicles, to support the continually growing need for ammonia-based fertilizers, and to be used as a reductant iron and steel making. Moreover, hydrogen may be an optimal energy storage medium that can help address electrical power dispatch challenges in regions that are building up wind and solar power generation capacity. Baseload power plants in these regions are being required to ramp up and down at a fast rate in response to wind and solar power generation. If nuclear power plants can rapidly swing between power generation and hydrogen production, then they can avoid curtailment or operating during times in which electricity is selling at negative prices. This alternative operating mode may help advance excess generation capacity to periods when renewable energy is not being generated, and it may help many existing nuclear plants that are currently seeing economic challenges to remain in operation.
Figure ES-1. Notional illustration of relative power demand and generation profiles resulting from high solar capacity, where baseload capacity (including nuclear) is 60% of total demand in MW-day and solar capacity is 45% of total demand.
This report focuses on the goals and criteria for producing hydrogen using nuclear energy. It updates the hydrogen technology down-selection approach captured in ID: PLN-3131, Hydrogen Technology Down-Selection Approach, Criteria, and Weighting (Rev. 0, May 6, 2009). That report applied to the use of a high temperature gas-cooled reactor (HTGR) under the Next Generation Nuclear Plant (NGNP) program. Hydrogen production assessment criteria are now needed for all types and classes of nuclear reactors, including the existing fleet of light-water reactors (LWRs) operating in the United States and anticipated small modular LWRs.
6am 12pm 6pm 12am12am
TotalPowerDemandProfile
Baseload(Nuclear)GenerationCapacity
SolarPower~45%Penetration
NetPowerGeneration(TotalminusSolar)“DuckCurve”
viii
Over 2,000 electrolysis and thermochemical looping cycles have been investigated for hydrogen production (IAEA 1999). Over time, five options have emerged as leading contenders for nuclear hybrid applications: low temperature (water) electrolysis (LTE), high temperature (steam) electrolysis (HTE), hybrid sulfuric acid (HSA), copper-chloride looping (CCL) and steam-methane reforming (StMR). Each option has pros and cons relative to cost, scalability, safety, thermal versus electrical duties, and operational characteristics. It is therefore important that a set of criteria, referred to as figures of merit (FOM), be provided to aid project managers and technology developers in choosing the best hydrogen generation option while optimizing 1) the dynamics of application-specific technical requirements, 2) nuclear reactor thermal energy output temperatures, and 3) the revenue of the overall system.
The buildout of wind and solar power generation has presented an opportunity to use nuclear energy for purposes other than power generation. Such systems may be referred to as nuclear cogeneration plants or nuclear “hybrids” due to the production of multiple commodities. Preliminary financial projections indicate that nuclear hybrids can be economically competitive and can contribute to energy security in the United States.
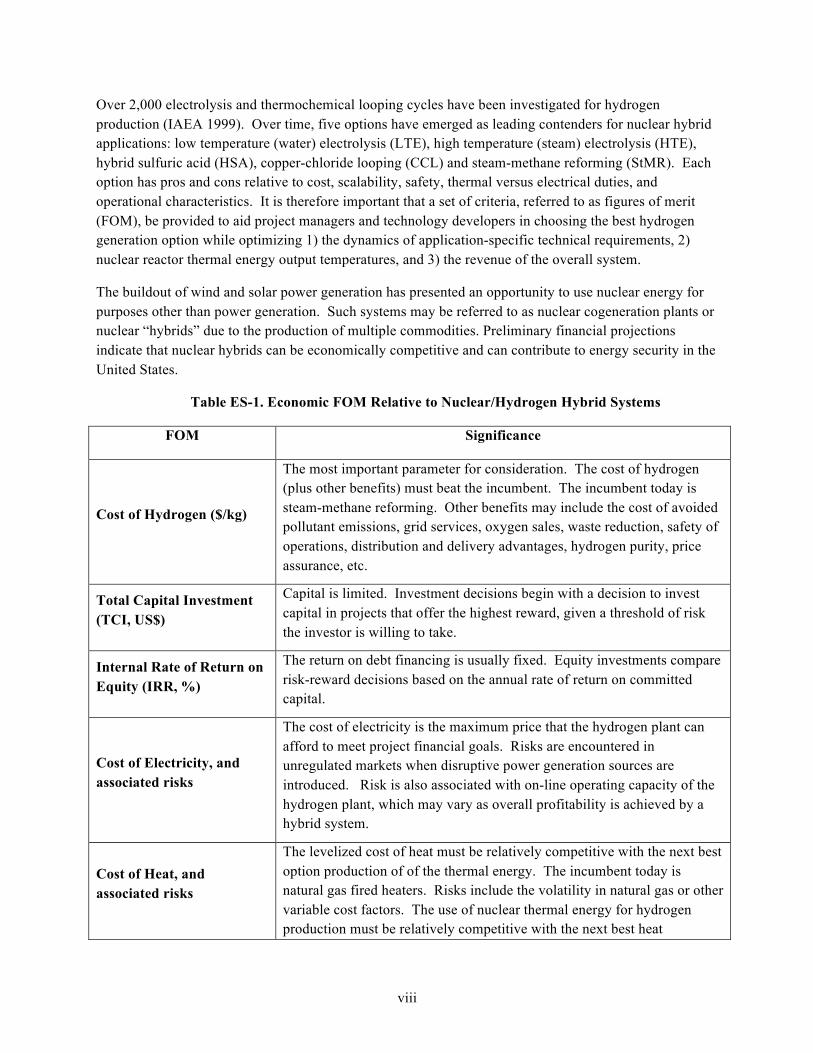
Table ES-1. Economic FOM Relative to Nuclear/Hydrogen Hybrid Systems
FOM Significance
Cost of Hydrogen ($/kg)
The most important parameter for consideration. The cost of hydrogen (plus other benefits) must beat the incumbent. The incumbent today is steam-methane reforming. Other benefits may include the cost of avoided pollutant emissions, grid services, oxygen sales, waste reduction, safety of operations, distribution and delivery advantages, hydrogen purity, price assurance, etc.
Total Capital Investment (TCI, US$)
Capital is limited. Investment decisions begin with a decision to invest capital in projects that offer the highest reward, given a threshold of risk the investor is willing to take.
Internal Rate of Return on Equity (IRR, %)
The return on debt financing is usually fixed. Equity investments compare risk-reward decisions based on the annual rate of return on committed capital.
Cost of Electricity, and associated risks
The cost of electricity is the maximum price that the hydrogen plant can afford to meet project financial goals. Risks are encountered in unregulated markets when disruptive power generation sources are introduced. Risk is also associated with on-line operating capacity of the hydrogen plant, which may vary as overall profitability is achieved by a hybrid system.
Cost of Heat, and associated risks
The levelized cost of heat must be relatively competitive with the next best option production of of the thermal energy. The incumbent today is natural gas fired heaters. Risks include the volatility in natural gas or other variable cost factors. The use of nuclear thermal energy for hydrogen production must be relatively competitive with the next best heat
ix
applications (for example, to produce steam that is used by a petroleum refinery or for concentration of a mineral slurry).
Operating Costs, and associated risks
Operating costs include fixed and variable costs, including labor, chemicals, materials, and resource inputs. Risks include the price stability of variable costs.
Maintenance Costs, and associated risks
Maintenance costs include projected equipment wear and preventative maintenance activities. Risks include technology uncertainty.
Performance Guarantees, and associated risks
Performance guarantees apply to individual equipment and overall system performance and capacity factors. Performance guarantees are correlated with technology commercial readiness levels.
Capacity Factor, and associated risks
Capacity factor is the ratio of the average actual operation of the plant relative to its name-plate capacity. Risks are associated with component failures, process stability, and interoperability of integrated systems.
Technology Readiness Level
An indicator of commercial readiness to perform at capacity or to achieve performance guarantees.
Operability Assurance, and associated risks
A measure of the ability to flexibly startup, control, and shutdown processes on demand. Also a measure of auto-controllability.
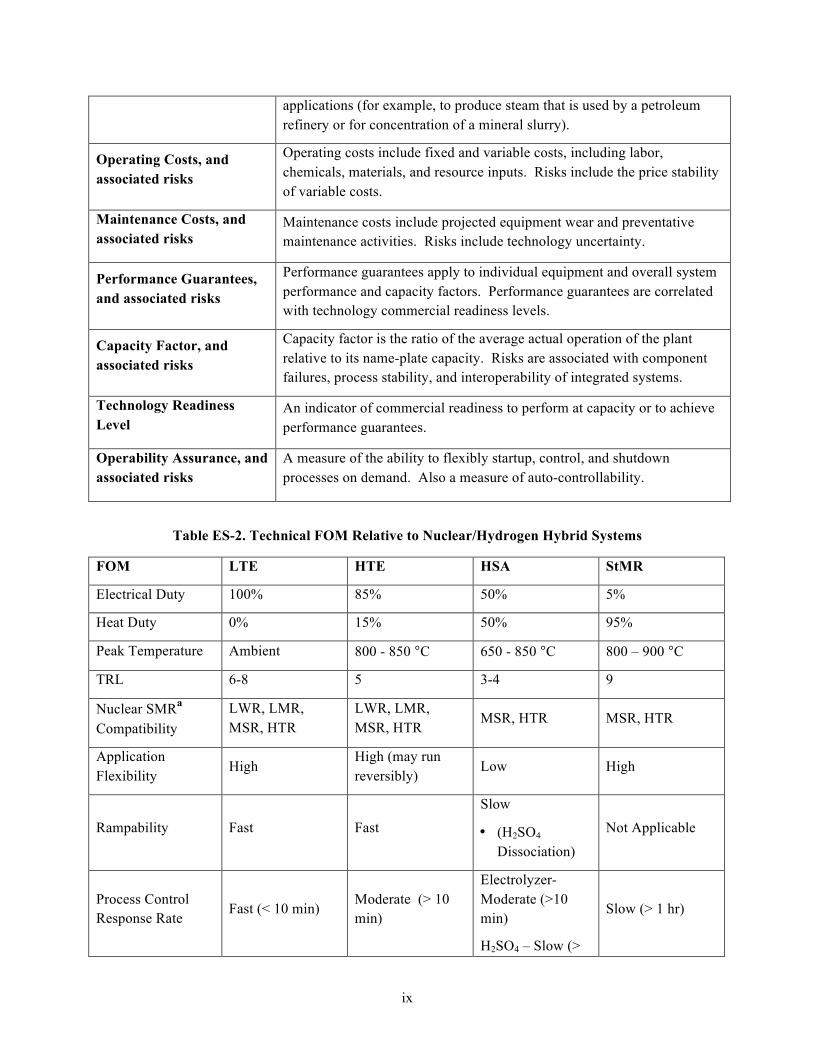
Table ES-2. Technical FOM Relative to Nuclear/Hydrogen Hybrid Systems
FOM LTE HTE HSA StMR
Electrical Duty 100% 85% 50% 5%
Heat Duty 0% 15% 50% 95%
Peak Temperature Ambient 800 - 850 °C 650 - 850 °C 800 – 900 °C
TRL 6-8 5 3-4 9
Nuclear SMRa Compatibility
LWR, LMR, MSR, HTR
LWR, LMR, MSR, HTR
MSR, HTR MSR, HTR
Application Flexibility
High High (may run reversibly)
Low High
Rampability Fast Fast
Slow
• (H2SO4 Dissociation)
Not Applicable
Process Control Response Rate
Fast (< 10 min) Moderate (> 10 min)
Electrolyzer- Moderate (>10 min)
H2SO4 – Slow (>
Slow (> 1 hr)

x
24 hr)
Electrical Demand Response Rate
Fast (< 1 sec) Fast (<1 sec) Fast (<1 sec)
Electrolyzer Not Applicable
Thermal Response Rate
Not Applicable Unknown (minutes?)
Unknown (hours?) Not Applicable
Complexity Medium High Medium Low
Scalability
High
• modular cell stacks
High
• modular cell stacks
Medium
• typically large
Low
• typically large
Hydrogen Purity High High Medium
• acid gases High
Controllability
(Relative ranking)
High
• electrical only • remote/auto
control possible
Medium /
• thermal heat integration
Medium
• semi steady-state system operation
• electrical, thermal, and chemical integration
• plant operator required
High
• steady-state system operation
• thermal integration
• plant operator required
Safety Risk Low Low
High
• hazardous chemicals
Low
aLWR – Light Water Reactor; HTR – High Temperature Reactor (typically gas-cooled); MSR – Molten Salt Reactor; LMR – Liquid Metal Reactor
Recommendations for future work planning include:
• Establish a consistent set of financial parameters for case evaluations. The H2A model is a starting point for the hydrogen plant. These are needed to compare net present value (NPV) and internal rate of return (IRR) for alternative nuclear/hydrogen hybrid systems.
• Measure technical performance factors to quantify system technical functionality FOM. This is needed to assess capacity factor risks.
• Implement a robust design and engineering program that includes Quality Assurance/Quality Control (QA/QC) requirements, safety requirements, and functional requirements with respect to system responsiveness, and controllability. This is needed to quantify FOM for these parameters.

ix
CONTENTS
EXECUTIVE SUMMARY ......................................................................................................................... vii
ACRONYMS ............................................................................................................................................... xii
1. INTRODUCTION ............................................................................................................................... 1
2. BACKGROUND ................................................................................................................................. 22.1 Hydrogen Production ................................................................................................................ 22.2 Incumbent Hydrogen Technology ............................................................................................ 42.3 Nuclear Reactor Characteristics ................................................................................................ 52.4 Grid Dynamics .......................................................................................................................... 6
3. GOALS and REQUIREMENTS ......................................................................................................... 83.1 Economics ................................................................................................................................. 83.2 Performance .............................................................................................................................. 93.3 Resource Availability ............................................................................................................... 93.4 Schedule and Risk ................................................................................................................... 103.5 Safety & Licensing ................................................................................................................. 10
4. FIGURES OF MERIT ....................................................................................................................... 104.1 Financial Pro Forma ................................................................................................................ 104.2 Technology Flexibility & Versatility ...................................................................................... 134.3 Hydrogen Purity ...................................................................................................................... 144.4 Development Risk / Technology Maturity ............................................................................. 164.5 Complexity and Controllability .............................................................................................. 164.6 Quality Assurance/Quality Control ........................................................................................ 174.7 Scalability ............................................................................................................................... 174.8 Ancillary Benefits ................................................................................................................... 174.9 Safety ...................................................................................................................................... 174.10 Waste Management ................................................................................................................. 18
5. CONCLUSIONS & RECOMMENDATIONS ................................................................................. 18
6. REFERENCES .................................................................................................................................. 22
FIGURES Figure ES-1. Illustration of relative power demand and generation profiles resulting from high solar capacity, where
baseload capacity (including Nuclear) is 60% of total demand in MW-day and solar capacity is 45% or total demand ................................................................................................................................................ vii
Figure 1. Conventional steam-methane reforming. ....................................................................................... 2

x
Figure 2. Nuclear Hydrogen Production Concepts: Thermochemical process and high-temperature electrolysis (O’Brien 2011). .......................................................................................................... 4
Figure 3. Notional power demand and supply curves for a typical August afternoon for a utility in the Southwest U.S. with high penetration of solar energy, where baseload capacity (including nuclear) is 60% of total daily demand and solar capacity is 45% of total. .................. 7
Figure 4. Notional curtailment (shaded area), where 27% of Baseload generation capacity is curtailed and 19% of solar generation capacity is curtailed. ......................................................... 7
Figure 5. Advancement of excess generation through energy storage. ......................................................... 8Figure 6. Simplified overview of TRLs for N-R HES. ................................................................................ 16
TABLES
Table ES-1. Economic FOM Relative to Nuclear/Hydrogen Hybrid Systems .......................................... viii
Table ES-2. Technical FOM Relative to Nuclear/Hydrogen Hybrid Systems ............................................. ix
Table 1. Calculated Efficiencies of HTSE Using Nuclear Energy ................................................................ 5Table 2. MACRS Depreciation .................................................................................................................... 11Table 3. Assumed Economic Input Parameters used in Financial Analysis ................................................ 12Table 4. Potential Applications for Hydrogen, Noting Ideal Operating Temperature and Pressure
Ranges. ........................................................................................................................................ 13Table 5. Potential Applications with Regard to Purity. ............................................................................... 14Table 6. Economic FOM Relative to Nuclear/Hydrogen Hybrid Systems .................................................. 19Table 7. Technical FOM Relative to Nuclear/Hydrogen Hybrid Systems .................................................. 20

xi

xii
ACRONYMS AIChE American Institute of Chemical Engineers
ATCF After Tax Cash Flow
BTCF Before Tax Cash Flow
BWR Boiling Water Reactor
CCL Copper-Chloride Looping
CSD Compression, Storage, and Delivery
D&D Decontamination & Dismantlement
DOE U.S. Department of Energy
EIA Energy Information Agency
EPA Environmental Protection Agency
EPRI Electric Power Research Institute
FCTO Fuel Cell Technology Office
FOM Figure of Merit
F-T Fischer-Tropsch
HSA Hybrid Sulfuric Acid
HTGR High Temperature Gas Reactors
HTR High Temperature Reactor
HES Hybrid Energy System
HTE High Temperature Electrolysis
H2A Hydrogen Analysis (model for calculating hydrogen costs)
HTSE High Temperature Steam Electrolysis
IAEA International Atomic Energy Agency
INL Idaho National Laboratory
IRR Internal Return of Return
LTE Low Temperature Electrolysis
LMR Liquid Metal Reactor
LWR Light Water Reactor
MARCS Modified Accelerated Cost Recovery Systems
MSR Molten Salt Reactor
NETL National Energy Technology Laboratory
NIBT Net Income Before Taxes
NGNP Next Generation Nuclear Plant
NE Nuclear Energy
xiii
NHES Nuclear hybrid energy systems
NREL National Renewable Energy Laboratory
N-R HES Nuclear-Renewable Hybrid Energy System
PW Present Worth
PWR Pressurized Water Reactor
QA/QC Quality Assurance/Quality Control
RE Renewable Energy
RO Reverse Osmosis
SOEC Solid Oxide Electrolysis Cell
SMR Small Modular Reactor
S/N Signal to Noise
SNG Substitute Natural Gas
StMR Steam Methane Reforming
TCI Total Capital Investment
TLC Total Capital Investment
TRL Technology Readiness Level

xiv

1
Figures of Merit for Nuclear/Hydrogen Hybrid Systems
1. INTRODUCTION Nuclear energy has the potential to exert a major impact on energy security by providing an economically reliable heat source for electrical power generation and heating of many industrial processes. This report focuses on the goals and criteria for producing hydrogen using nuclear energy. It updates the hydrogen technology down-selection approach captured in ID: PLN-3131, Hydrogen Technology Down-Selection Approach, Criteria, and Weighting (Rev. 0, May 6, 2009). That report applied to the use of a high temperature gas-cooled reactor (HTGR) under the Next Generation Nuclear Plant (NGNP) program. Hydrogen production assessment criteria are now needed for all types and classes of nuclear reactors, including the existing fleet of light-water reactors (LWRs) operating in the United States. It is also important to consider how nuclear energy can be used with intermittent hydrogen generation operations. The buildout of wind and solar power generation has presented an opportunity to use nuclear energy for purposes other than power generation.
The purpose of this report is to identify metrics that can be used to complete technical evaluations and economic assessments of alternative technologies to produce hydrogen using nuclear energy. These metrics are referred to as figures of merit (FOM). Efforts were recently made to identify FOM for general economic evaluation of regional nuclear-renewable hybrid energy systems in a workshop with utilities, industry, and DOE program managers (INL and NREL 2014). A list of approximately 30 FOM were generated and then grouped into four categories: 1) Environmental, 2) Financial, 3) Design Criteria, and 4) Policy. The FOM criteria were ranked by polling the workshop participants. The leading indicators were Financial Pro Forma, Greenhouse Gas Emissions Reduction, National Energy Security, Near-Term Deployment, Grid Reliability, Development & Deployment Commercial Risk, and Net Return on Energy.
Following the workshop, a framework for economic analysis of hybrid energy systems was developed to help identify and mathematically express the “value” flow of energy and grid services that are not currently compensated or even arbitraged (Rabiti 2015). This work includes a qualitative analysis of the impact of uncertainty, both in the demand and supply side. An introduction to investment analysis methodologies based on discounted cash flow is also provided, along with an illustration of exergonomic principles to cost accounting of plant components used in cash flow analysis.
Both INL and NREL have completed technical and economic assessments to evaluate the potential market case for building a hybrid plant in select regions, based on future green-field projects for a small, modular, light-water nuclear reactor (LWR). This work includes a nuclear-wind hybrid case for gas-to-methanol production in West Texas and a nuclear-solar hybrid case for desalination of water in Arizona (Garcia 2016). This work was followed by a study of economic potential by NREL for these same cases, plus a case for hydrogen generation based on the same regional case assumptions (Ruth 2017). The outcome of these case studies was mixed, meaning positive financial returns were possible, but not generally disruptive versus incumbent natural gas hybrids or independent systems. These cases may require additional incentives such as a tax on carbon emissions, high capacity payments, or other policy drivers. These efforts assumed natural gas price projections by the Energy Information Agency (EIA).
The present effort attempts to establish a consistent approach to evaluate nuclear/hydrogen generation hybrid systems. A comprehensive, part quantitative, part holistic approach is needed given the uncertainty of future energy prices and policy directives. Economic standard discounted cash-flow analysis,

2
technology commercial readiness, performance characteristics, and ancillary benefits need to be understood and weighed by project engineers and stakeholders.
It should be noted that the previous assessments were completed for LWRs which, unlike high temperature reactors, do not produce high quality heat for electricity generation and industrial users. Conversion of the existing fleet of LWRs in the U.S. to support more than just electricity generation may also be competitive in hybrid systems given that the initial capital investments for the nuclear plants has been paid down. Hence, the revenue is dependent mainly on operating and maintenance costs and revenue generated from power sales. Other factors should also be considered, such as payments for grid services and the value of energy storage. Energy storage is of particularly high interest given the evolution of grid supply/demand needs with renewable energy. Hydrogen production is one form of energy storage that can scale to the capacity of hydrogen storage tanks or caverns.
2. BACKGROUND 2.1 Hydrogen Production
Hydrogen demand in the United States will continue to grow as refineries process heavier crudes into transportation fuels and chemical feedstock. Renewable fuel standards in California and other states provide incentive for hydrogen fuel cell vehicles. Increased hydrogen production will also be needed to meet rising demand for ammonia-based fertilizers for food crop production and for purpose-grown biomass as a renewable energy source (including for biofuels production). In addition, hydrogen is being recognized as a possible reductant and heat source for iron and steel making as this industry turns to cleaner (and perhaps less expensive) methods of refining iron ore.
The two major sources for hydrogen are water and hydrocarbons. Currently, most of the hydrogen produced in the United States is provided by the steam-methane reforming process given the current abundance and low cost of natural gas in the United States. Steam methane reforming requires moderately high temperature heat (700-900 °C) to provide the thermal energy necessary to sustain process reformer endothermic reactions. Auto-catalytic processes, such as the scheme shown below, have been optimized to minimize the energy required for this process.
Figure 1. Conventional steam-methane reforming.
Nuclear heat can be used to replace most of the heat produced by natural gas combustion, but the peak temperature of the nuclear heat must be relatively high, as shown in previous studies supported by DOE-NE (INL/NGNP 2010).
Preheat 25-540 ºC
Secondary reformer1040 ºC
Primary reformer 740 ºC
Steam generation120-252 ºC
Heat ex-changers
Heat ex-changers
Oxygen
Natural gas /steam mixture
Process steam
Fired heater860 ºCNatural gas CO2
heat heat
heat
BFW
Syngas 140 ºC

3
Care must be used to avoid confusing the acronym for steam-methane reforming with the lexicon of the nuclear energy community, which defines SMR as the acronym for Small Modular Reactors. Therefore, throughout this report, the former is designated as StMR.
DOE currently supports the development hydrogen production technologies under the Energy Efficiency/Renewable Energy Fuel Cell Technologies Program. The current emphasis is on electrolysis options, but also includes some thermal-chemical, photo-electric, solar thermal-chemical, and biological hydrogen synthesis options.
The DOE Fossil Energy program historically supported coal gasification to produce zero-emissions power through production and combustion of hydrogen under the now suspended DOE FutureGEN program (NETL 2007). The primary goal of FutureGEN was to overcome the shortcoming of coal being the most carbon-intensive energy source, while meeting the increasing market demand for hydrogen gas supply. This program failed to move forward given the challenge of CO2 sequestration and the comparatively high cost of integrated gasification/combined cycle for hydrogen combustion. Additionally, hydrogen can be readily produced from biological process such as fermentation, but these processes are not well matched to the scale and high grade thermal potential of nuclear reactors.
DOE NE supported research and development of high temperature hydrogen production technology under the Next Generation Nuclear Plant program which was authorized by Congress in the 2005 Energy Policy Act. This work mainly focused on high temperature electrolysis and sulfuric acid splitting looping cycles (AIChE 2007).
Water splitting is accomplished by electrolysis and thermochemical processes that are usually comprised of two or more looping reaction steps. Some 2,000-3,000 potential thermochemical cycles have been tested in terms of appropriate reaction temperatures and reactor space velocities and relative to economic aspects (IAEA 1999). The hybrid sulfuric acid process is an example.
Both electrolysis and thermochemical processes achieve their best efficiencies at high temperatures and, therefore, can be tied to nuclear reactors that supply both heat and electricity. A conceptual description of a high temperature gas-cooled reactor coupled to a high temperature electrolysis system is shown in Figure 2. In this scheme, the primary helium loop serves as the working fluid to drive a Brayton power cycle, which provides electricity to the solid-oxide electrolysis cell. Some of the hot helium is used to deliver high temperature process heat directly to a high temperature solid oxide electrolysis cell (SOEC) stack array.

4
Figure 2. Nuclear Hydrogen Production Concepts: Thermochemical process and high-temperature electrolysis (O’Brien 2011).
Major problems arise due to large materials flows, by the introduction of impurities, and by the potential creation of toxic and environmental contaminants. Many of the thermal chemical processes involve strong acids, which present an industrial safety risk to both the hydrogen plant operators and to the nuclear plant operators.
2.2 Incumbent Hydrogen Technology Steam methane reforming (StMR) will continue to be the incumbent technology as long as the price of natural gas remains low in the United States. Alternatives must compete with this option throughout the U.S., with the exception of remote locations where StMR is uneconomical, impractical, or impossible from a regulatory standpoint to install natural gas pipelines.
The cost of hydrogen produced by StMR is a strong function of the cost of natural gas, and the scale of the plant. The typical StMR plant in the U.S. today produces around 200-300 tonnes per day (tpd) of hydrogen. At plant size, and at a cost of natural gas around $6.0/MMBtu, the cost target to beat is $2/kg-hydrogen. This inevitably requires delivery to customers through a pipeline, compressed gas tube trailer, or liquefied hydrogen tank carrier.
Cost considerations should account for system-wide benefits that can be monetized. For example, the benefits associated with pollutant control should be included. This may be quantified in terms of the
(
Recuperator
HighPressure
Reactor Compressor
PrimaryHeat Rejection
Turbwo
l'ImixessoPr"3:7°)Power
Conversion Unit
InlerCoo:
HeatExchanger
Power torElecadysts
/woo a.m.\
.11•No',swam
Heat Exchanger
Hydrogen Productlon(Electrolysis)
J—Lf
Hydrogen Production(Thermochemical)
CommerealPower
Hydrogen
HYdregen

5
cleanup required for the incumbent process. This cost can be credited as an avoided cost to competing options that have no emissions.
For the purposes of this report, it is assumed that the hydrogen plant will be located near the nuclear plant (but not necessarily inside the nuclear plant exclusion zone) to take advantage of steam or heating that is provided by the nuclear operations. This assumption will be relaxed for distributed hydrogen stations that rely solely on electricity for electrolysis.
2.3 Nuclear Reactor Characteristics Three factors must be considered when matching nuclear reactors and hydrogen production technologies: 1) the coolant outlet temperature from the nuclear reactor, 2) the thermodynamic and heat transfer properties of the secondary heat transfer fluid connecting the nuclear reactor to the hydrogen generation process, and 3) the coolant return temperature at the inlet of the nuclear reactor. Heat recuperation is generally a best practice in all high temperature water splitting processes, but only an independent electricity and heat source can supply the reaction enthalpy at the highest temperature stage. This is illustrated in Table 1 for high temperature steam electrolysis (HTSE). The overall thermal-to-hydrogen efficiency rises with the outlet temperature of the nuclear reactor for two reasons: steam generation and superheating are more efficient and power generation is more efficient.
Table 1. Calculated Efficiencies of HTSE Using Nuclear Energy
Light Water Reactor
Liquid Metal Reactor
Molten Salt Reactor
Gas-Cooled Reactor
Reactor Attributes Water-Cooled; PWRa
Sodium
Fluoride Salt
Helium-cooled
Reactor Outlet Temperature (°C)
300 550 850 850
Reactor Inlet Temperature (°C)
Pressurized condensate
400 750 450
Power Cycle Heat Transport Fluid
Subcritical Steam
Supercritical Steam
Supercritical CO2
He
Power Cycle Rankine Supercritical Rankine
Supercritical CO2 with Recompression
Brayton
Power Cycle Efficiency (%)
31 43.8 49.5 45.8
HTSE Heat Delivery Media
Subcritical Steam
Subcritical Steam
He He
HTSE Electricity (MWe/kg-H2)
127 126 123 130
HTSE Thermal Input (MWt/kg-H2)
34 30 33 34
Overall Thermal-to-H2 efficiency (Higher Heating Value)b
0.32 0.45 0.50 0.45
aPWR – Pressurized Water Reactor; Around two-thirds of LWRs in the United State are PWRs. The remaining third is Boiling Water Reactors (BWRs) bHHV Hydrogen = 141.8 MJ/kg
6
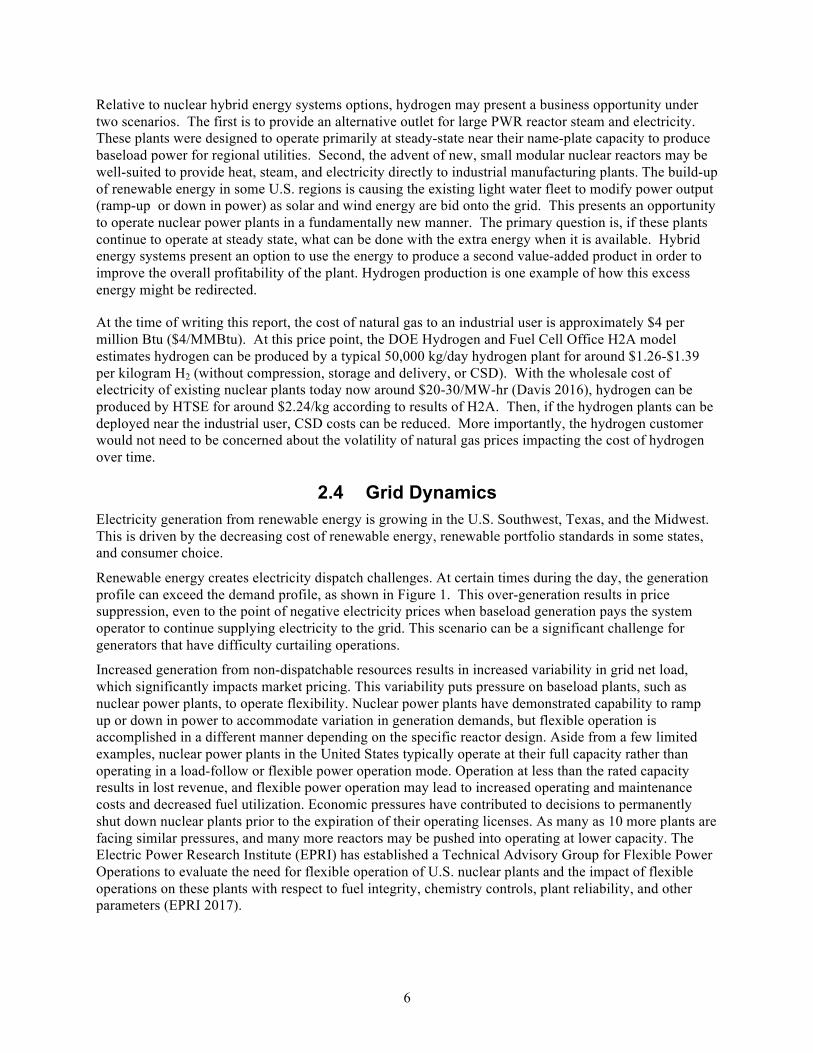
Relative to nuclear hybrid energy systems options, hydrogen may present a business opportunity under two scenarios. The first is to provide an alternative outlet for large PWR reactor steam and electricity. These plants were designed to operate primarily at steady-state near their name-plate capacity to produce baseload power for regional utilities. Second, the advent of new, small modular nuclear reactors may be well-suited to provide heat, steam, and electricity directly to industrial manufacturing plants. The build-up of renewable energy in some U.S. regions is causing the existing light water fleet to modify power output (ramp-up or down in power) as solar and wind energy are bid onto the grid. This presents an opportunity to operate nuclear power plants in a fundamentally new manner. The primary question is, if these plants continue to operate at steady state, what can be done with the extra energy when it is available. Hybrid energy systems present an option to use the energy to produce a second value-added product in order to improve the overall profitability of the plant. Hydrogen production is one example of how this excess energy might be redirected.
At the time of writing this report, the cost of natural gas to an industrial user is approximately $4 per million Btu ($4/MMBtu). At this price point, the DOE Hydrogen and Fuel Cell Office H2A model estimates hydrogen can be produced by a typical 50,000 kg/day hydrogen plant for around $1.26-$1.39 per kilogram H2 (without compression, storage and delivery, or CSD). With the wholesale cost of electricity of existing nuclear plants today now around $20-30/MW-hr (Davis 2016), hydrogen can be produced by HTSE for around $2.24/kg according to results of H2A. Then, if the hydrogen plants can be deployed near the industrial user, CSD costs can be reduced. More importantly, the hydrogen customer would not need to be concerned about the volatility of natural gas prices impacting the cost of hydrogen over time.
2.4 Grid Dynamics Electricity generation from renewable energy is growing in the U.S. Southwest, Texas, and the Midwest. This is driven by the decreasing cost of renewable energy, renewable portfolio standards in some states, and consumer choice.
Renewable energy creates electricity dispatch challenges. At certain times during the day, the generation profile can exceed the demand profile, as shown in Figure 1. This over-generation results in price suppression, even to the point of negative electricity prices when baseload generation pays the system operator to continue supplying electricity to the grid. This scenario can be a significant challenge for generators that have difficulty curtailing operations.
Increased generation from non-dispatchable resources results in increased variability in grid net load, which significantly impacts market pricing. This variability puts pressure on baseload plants, such as nuclear power plants, to operate flexibility. Nuclear power plants have demonstrated capability to ramp up or down in power to accommodate variation in generation demands, but flexible operation is accomplished in a different manner depending on the specific reactor design. Aside from a few limited examples, nuclear power plants in the United States typically operate at their full capacity rather than operating in a load-follow or flexible power operation mode. Operation at less than the rated capacity results in lost revenue, and flexible power operation may lead to increased operating and maintenance costs and decreased fuel utilization. Economic pressures have contributed to decisions to permanently shut down nuclear plants prior to the expiration of their operating licenses. As many as 10 more plants are facing similar pressures, and many more reactors may be pushed into operating at lower capacity. The Electric Power Research Institute (EPRI) has established a Technical Advisory Group for Flexible Power Operations to evaluate the need for flexible operation of U.S. nuclear plants and the impact of flexible operations on these plants with respect to fuel integrity, chemistry controls, plant reliability, and other parameters (EPRI 2017).
7
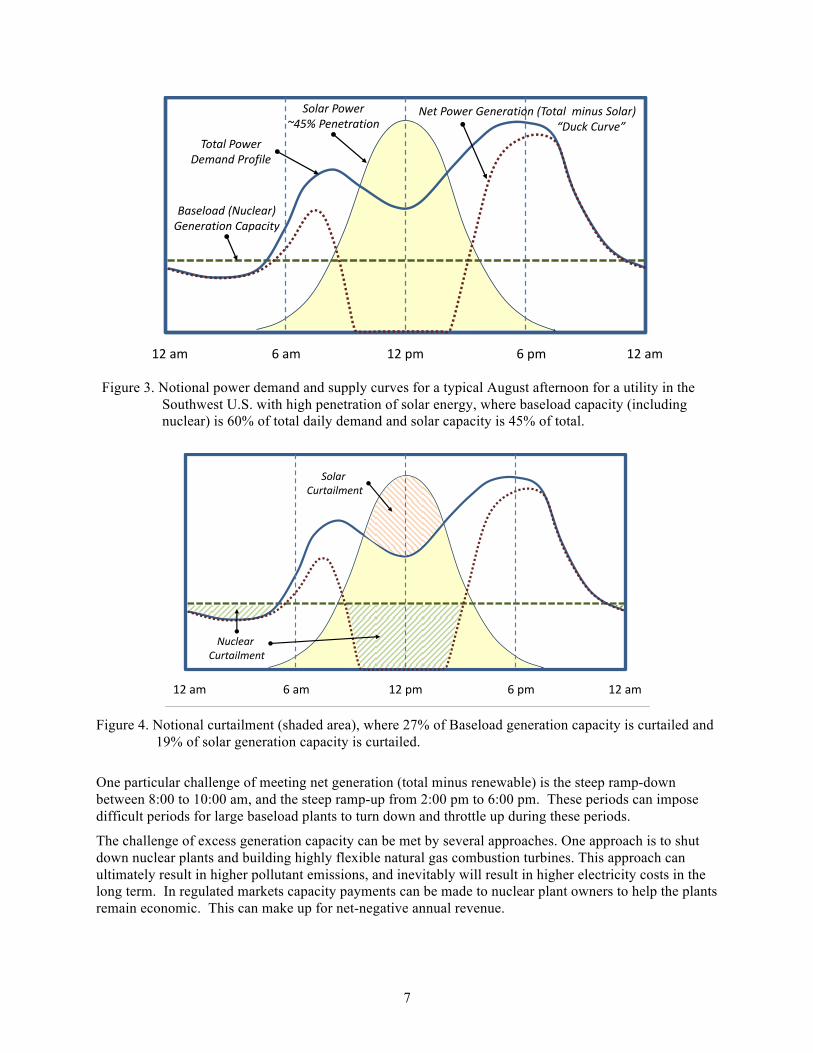
Figure 3. Notional power demand and supply curves for a typical August afternoon for a utility in the
Southwest U.S. with high penetration of solar energy, where baseload capacity (including nuclear) is 60% of total daily demand and solar capacity is 45% of total.
Figure 4. Notional curtailment (shaded area), where 27% of Baseload generation capacity is curtailed and 19% of solar generation capacity is curtailed.
One particular challenge of meeting net generation (total minus renewable) is the steep ramp-down between 8:00 to 10:00 am, and the steep ramp-up from 2:00 pm to 6:00 pm. These periods can impose difficult periods for large baseload plants to turn down and throttle up during these periods.
The challenge of excess generation capacity can be met by several approaches. One approach is to shut down nuclear plants and building highly flexible natural gas combustion turbines. This approach can ultimately result in higher pollutant emissions, and inevitably will result in higher electricity costs in the long term. In regulated markets capacity payments can be made to nuclear plant owners to help the plants remain economic. This can make up for net-negative annual revenue.
6am 12pm 6pm 12am12am
TotalPowerDemandProfile
Baseload(Nuclear)GenerationCapacity
SolarPower~45%Penetration
NetPowerGeneration(TotalminusSolar)“DuckCurve”
6am 12pm 6pm 12am12am
NuclearCurtailment
SolarCurtailment
-

8
Energy storage can also help mitigate excess generation. If electrical, thermal, or chemical energy can be stored and shifted to evening and morning periods then less intermediate load power generation would be needed. It is clear that the scale of energy storage must be large and reliable, but will vary throughout the week and year. With increasing renewable energy coming on line, overall power generation in the system may far exceed demand.
Figure 5. Advancement of excess generation through energy storage.
Another opportunity that is quickly gaining traction is to repurpose the use of nuclear reactors. Plant owners and operators are considering the benefits of operating flexibly without modifying the core power level, choosing to produce electricity when it is profitable and producing a second energy product when the price of electricity is low. A related approach is to convert entirely to supplying energy (thermal and/or electrical) to an industrial process.
Some leading options that can be serviced by the existing fleet of light water reactors (LWRs) include:
• Seawater or brackish water desalination (to provide cooling water to the nuclear plant and potable water to communities)
• Hydrogen production by electrolysis of water or steam (where the clean water could be supplied from a desalination plant, or where the steam could be provided by the nuclear plant)
• Steam supply to a set of nearby industries (such as food processes, wood products, and minerals processes).
3. GOALS and REQUIREMENTS In order to establish FOM to assist the decision making process, project goals or targets must be established. Relative to project decisions and investments required to execute a commercial project, the key factors impacting executive decisions are; Economics, Performance, Schedule, and Safety. Because these factors are correlated, it is necessary to break down the goals into metrics that can be quantified and evaluated.
3.1 Economics The overall goal for nuclear/hydrogen hybrid systems is utilizing the energy constantly produced by the nuclear plant in a manner that generates the highest profit. The bottom line for hydrogen users is the cost of hydrogen (dollars per kg); therefore, the selling price of hydrogen must match or beat steam-methane
6am 12pm 6pm 12am12am
IntermediateGenerationShortfall
Canenergystoragereliablyand
cost-effectivelyadvance
excesscapacity?

9
reforming. Projections show the cost of natural gas will trend up. The cost of hydrogen by StMR will rise according. Therefore, for the nuclear/hydrogen hybrid plant, the following goals are important to project manager decisions:
• Cost of hydrogen. The Fuel Cell Technology Office (FCTO) has set of goal of $2.00/kg as a target to meet with alternative hydrogen production processes.
• Minimize total capital investment risk. There is a limit to capital investment potential. Large capital investments represent risk to financial institutions and equity investors. Projects that can be scaled-up in phases can reduce capital that is at risk.
• Minimize technology risk. Development and implementation costs are required to verify technology performance targets. Transformative hydrogen production technologies should be prioritized according to their cost and schedule to reach commercial readiness and deployment
• Minimize environmental risks. Environmental risks may include land-use disposition, air pollution risks, and waste management costs. The associated costs of natural gas production and air pollution may be considered in the overall assessment.
3.2 Performance Performance criteria translate to economic criteria, and therefore need to be identified and ranked to establish program research and development priorities. Performance criteria include:
• Maximize hydrogen product purity relative to end user requirements. • Maximize on-line operating capacity factor. • Minimize maintenance requirements and costs. • Optimize hydrogen and oxygen pressure, and possibly the temperature, for direct use by the
end user (versus hydrogen compression and/or liquefaction of gases). • Demand profile- supply/demand cost trends. • Maximize co-product production synergies, such as the production of electricity or the
production of syngas through co-electrolysis of steam and CO2 as a function of market signals and industrial needs.
• Optimize the scale of hydrogen production units and distribution relative to combined market needs and supporting infrastructure (e.g., pipelines, rail and roads, and storage systems). Provide a technology that can grow with market demand growth.
• Provide production technology that is stable, and resilient to resource and market disruption.
3.3 Resource Availability Nuclear energy is deployable on a long-term basis. When produced at scale, the availability of the resources used to produce hydrogen may become significant and disruptive to hydrogen production. Therefore, it is imperative to consider:
• Resource projection for the life of a project • Precious metals or rare gases used at all stages for hydrogen production • Materials of construction - supply chain of metallurgy • Life projection of industrial users.

10
3.4 Schedule and Risk Schedule risk is related to technology commercial readiness and supply chain assurance. The key indicators relative to repurposing the light water reactor fleet are more pressing than technology readiness requirements for the emerging advanced nuclear reactor technologies. Therefore, the hydrogen technology commercial readiness targets are indicated as follows:
• Deployment probability by 2020 relative to the existing fleet of LWRs. • Deployment probability by 2025 relative to advanced nuclear reactor technologies that
include light water reactor SMRs and high temperature gas-cooled SMRs operating at or below 750 °C.
• Deployment probability by 2030 relative to advanced nuclear reactor technologies that include liquid-metal (LMR), molten-salt reactors (MSR) and advanced high temperature gas-cooled reactors (HTR).
• Determine technology readiness and the activities required for the high temperature hydrogen technology to reach commercial readiness.
3.5 Safety & Licensing The hydrogen process technology must be fully compliant with all safety (worker and public) requirements. Most safety requirements are go/no-go criteria that must be meet. Relative to nuclear plant operations, integration of a hydrogen production plant must be seen as having no impact on the probability risk assessment that is addressed in the plant’s operating license. It is almost certain that the hydrogen plant will need to be sited outside the nuclear reactor exclusion zone. Therefore, it is prudent to call out the following safety criteria and goals:
• Assure no possible event at the hydrogen plant will impact operations at the nuclear plant. • Assure no possible process upset at the hydrogen plant will “trip” nuclear plant operations. • Meet regulatory and safety requirements for public health and licensing considerations.
Given the flammability hazards associated with hydrogen and oxygen, the hydrogen plant will likely need to be placed outside the nuclear plant exclusion zone.
4. FIGURES OF MERIT The FOM are intended to help compare the range of options for hydrogen production to steam-methane reforming as the incumbent option. Steam-methane reforming is a mature technology employed by several gas producers around the world. Nuclear-hydrogen options must ultimately compete with the low price of natural gas.
4.1 Financial Pro Forma Economics will naturally lead the list of FOM, but other factors impacting research and project decisions may be considered, including:
• Price of Hydrogen, measured as the cost of hydrogen at the plant gate. • Return on Equity Investment, reported as the internal rate of return on equity given a specific
percentage of Debt Financing at a fixed or variable discount rate. • Total Capital Investment at Risk.
11
• Operating Costs, including maintenance and labor. • Ancillary Monetary Benefits, related to grid services, energy storage, and reversible power
generation, as examples.
As the leading criterion for project decisions, financial pro forma traditionally are compared on the basis of the Internal Rate of Return (IRR) on equity given a set of fixed financial parameters for a given project. IRR is typically reported as the percentage gained on the unpaid equity until the net present value of the project is reduced to zero. At this point, with debt and equity payments satisfied, the margin of profit becomes the difference in revenues from product sales minus operating costs and taxes.
The majority of nuclear power plants in the U.S. have reached this point of equilibrium. The typical period for financing debt and equity payments is either 15 or 20 years. The parameters discussed in the remainder of this section will be used to evaluate options. To assess the IRR and present worth (PW) of each scenario, it is necessary to calculate the after tax cash flow (ATCF). To calculate the ATCF it is necessary to first calculate the revenues (Rk), cash outflows (Ek), sum of all noncash, or book, costs such as depreciation (dk), net income before taxes (NIBT), the effective income tax rate (t), and the income taxes (Tk) for each year (k). The taxable income is revenue minus the sum of all cash outflow and noncash costs. The income taxes per year are therefore defined as follows:
𝑇! = 𝑡 𝑅! − 𝐸! − 𝑑! (1)
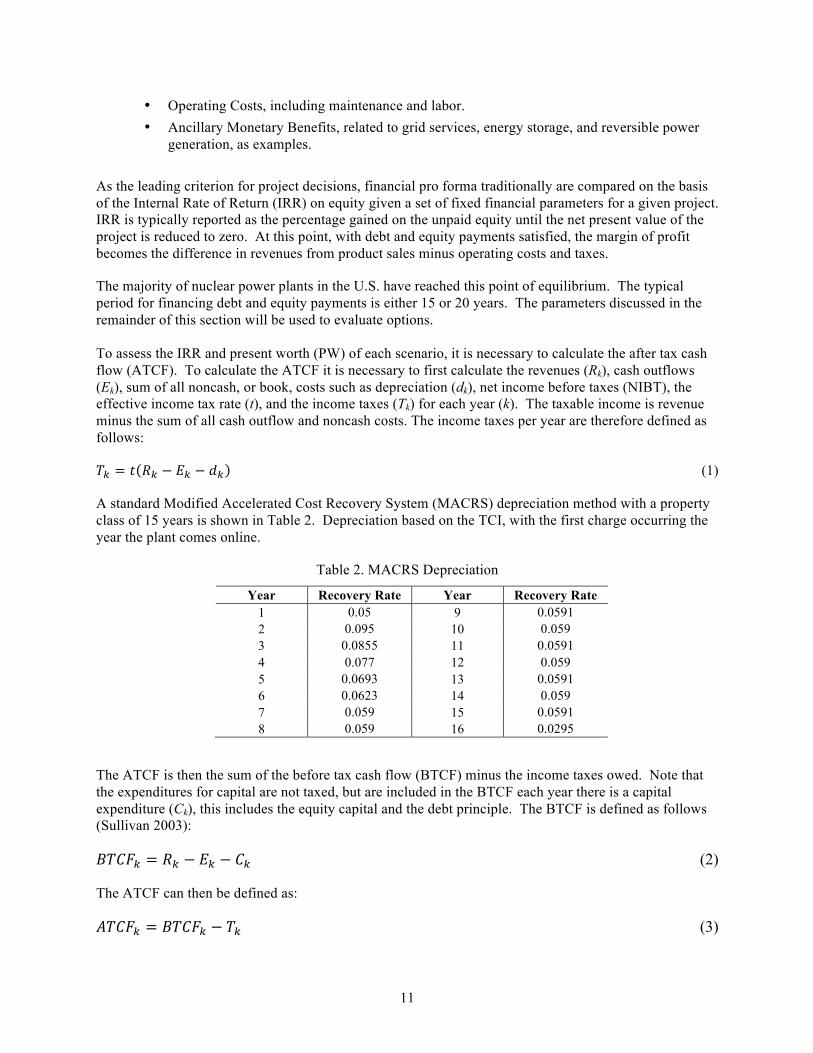
A standard Modified Accelerated Cost Recovery System (MACRS) depreciation method with a property class of 15 years is shown in Table 2. Depreciation based on the TCI, with the first charge occurring the year the plant comes online.
Table 2. MACRS Depreciation
Year Recovery Rate Year Recovery Rate 1 0.05 9 0.0591 2 0.095 10 0.059 3 0.0855 11 0.0591 4 0.077 12 0.059 5 0.0693 13 0.0591 6 0.0623 14 0.059 7 0.059 15 0.0591 8 0.059 16 0.0295
The ATCF is then the sum of the before tax cash flow (BTCF) minus the income taxes owed. Note that the expenditures for capital are not taxed, but are included in the BTCF each year there is a capital expenditure (Ck), this includes the equity capital and the debt principle. The BTCF is defined as follows (Sullivan 2003):
𝐵𝑇𝐶𝐹! = 𝑅! − 𝐸! − 𝐶! (2)
The ATCF can then be defined as:
𝐴𝑇𝐶𝐹! = 𝐵𝑇𝐶𝐹! − 𝑇! (3)

12
The avoided cost of pollutant emission can be viewed as a revenue stream. The same applies to CO2 tax credits; otherwise, a process that emits CO2 would need to include this as a manufacturing cost, thus decreasing the yearly revenue.
As indicated, IRR is calculated by solving for the interest rate that equates the equivalent worth of an alternative’s cash inflows to the equivalent worth of cash outflows (after tax cash flow), i.e., the interest rate at which the present worth (PW) is zero. The resulting interest is the IRR (i').
𝑃𝑊 𝑖! = 𝐴𝑇𝐶𝐹! 1+ 𝑖! !! = 0!!!! (4)
The relevant parameters applied in the current financial analysis are summarized in Table 3.
Table 3. Assumed Economic Input Parameters used in Financial Analysis
Parameter Value Federal Tax Rate 35% State Tax Rate 6% Overall Tax Rate 38.9% Annual Inflation Rate 3% Economic Life 30 years Debt/Equity Ratio 50% Interest Rate on Debt 8% Repayment Term 15 years Reactor Construction Period 3 years Startup Time 1 year Plant Availability (nuclear and chemical) 90%
The cost of hydrogen can be calculated using the H2A model, which applies a discounted cash flow analysis consistent with the discussion herein. The H2A model was developed by the National Renewable Energy Laboratory to better calculate and compare the cost of producing hydrogen by various technologies. The model is based on a set of parameters and assumptions that could be used by all hydrogen production systems to calculate the cost. Additional financial consideration, such as the avoided cost to control air pollutants, can be added to the model. The H2A model has five objectives as listed on the hydrogen energy website (see http://www.hydrogen.energy.gov/h2a_analysis.html for further discussion):
• Establish a standard format and list of parameters for reporting analysis results for central production, distributed (forecourt) production, and delivery.
• Seek better validation of public analyses through dialog with industry.
• Enhance understanding of the differences among publicly available analyses and make these differences more transparent
• Establish a mechanism for facile dissemination of public analysis results.
• Work to reach consensus on specific analysis parameters for production and delivery.
13
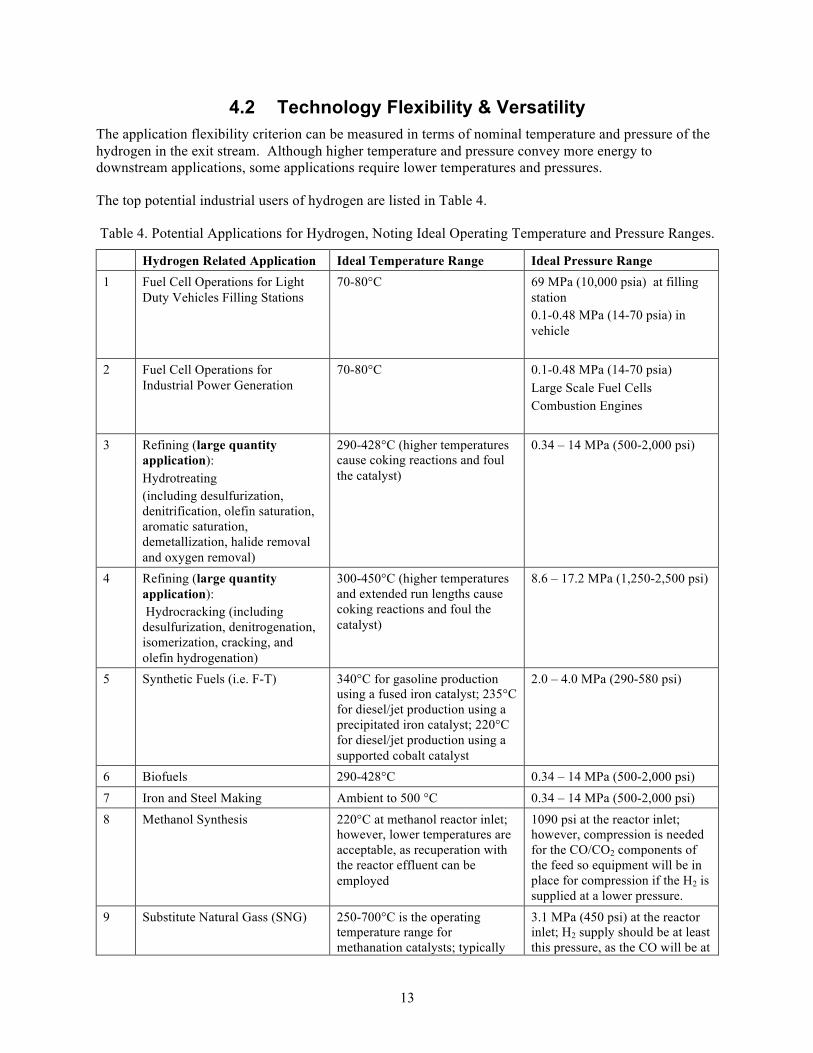
4.2 Technology Flexibility & Versatility The application flexibility criterion can be measured in terms of nominal temperature and pressure of the hydrogen in the exit stream. Although higher temperature and pressure convey more energy to downstream applications, some applications require lower temperatures and pressures.
The top potential industrial users of hydrogen are listed in Table 4.
Table 4. Potential Applications for Hydrogen, Noting Ideal Operating Temperature and Pressure Ranges.
Hydrogen Related Application Ideal Temperature Range Ideal Pressure Range 1 Fuel Cell Operations for Light
Duty Vehicles Filling Stations 70-80°C
69 MPa (10,000 psia) at filling station 0.1-0.48 MPa (14-70 psia) in vehicle
2 Fuel Cell Operations for Industrial Power Generation
70-80°C
0.1-0.48 MPa (14-70 psia) Large Scale Fuel Cells Combustion Engines
3 Refining (large quantity application): Hydrotreating (including desulfurization, denitrification, olefin saturation, aromatic saturation, demetallization, halide removal and oxygen removal)
290-428°C (higher temperatures cause coking reactions and foul the catalyst)
0.34 – 14 MPa (500-2,000 psi)
4 Refining (large quantity application): Hydrocracking (including desulfurization, denitrogenation, isomerization, cracking, and olefin hydrogenation)
300-450°C (higher temperatures and extended run lengths cause coking reactions and foul the catalyst)
8.6 – 17.2 MPa (1,250-2,500 psi)
5 Synthetic Fuels (i.e. F-T) 340°C for gasoline production using a fused iron catalyst; 235°C for diesel/jet production using a precipitated iron catalyst; 220°C for diesel/jet production using a supported cobalt catalyst
2.0 – 4.0 MPa (290-580 psi)
6 Biofuels 290-428°C 0.34 – 14 MPa (500-2,000 psi) 7 Iron and Steel Making Ambient to 500 °C 0.34 – 14 MPa (500-2,000 psi) 8 Methanol Synthesis 220°C at methanol reactor inlet;
however, lower temperatures are acceptable, as recuperation with the reactor effluent can be employed
1090 psi at the reactor inlet; however, compression is needed for the CO/CO2 components of the feed so equipment will be in place for compression if the H2 is supplied at a lower pressure.
9 Substitute Natural Gass (SNG) 250-700°C is the operating temperature range for methanation catalysts; typically
3.1 MPa (450 psi) at the reactor inlet; H2 supply should be at least this pressure, as the CO will be at

14
Hydrogen Related Application Ideal Temperature Range Ideal Pressure Range the inlet temperature for the syngas should be on the lower end of this range
pressure exiting the gasifier (i.e., no intermediate compression)
10 Ammonia (and associated derivatives) Large quantity application
340-430°C is the typical inlet temperature for an ammonia reactor
13.8- 15.1 MPa (2000-2200) psi at the reactor inlet; however, compression is needed for the CO feed component so equipment will be in place for compression if the H2 is supplied at a lower pressure. Older process operated at even higher pressures (i.e., 30 MPa)
11 Float Glass Manufacturing 200-1200°C
Atmospheric pressure
12 Fuel Cell Operations 70-80°C
0.096-0.48 MPa (14-70 psia) Include filling station for autos
13 Food (hydrogenation) 140-230°C
0.34- 2.6 MPa (50-370 psia)
Hydrogen production processes that can be adapted to more than one use, or that serve a variety of purposes, require unique FOMs. Higher product purity is required from some processes. Processes that can ramp up and down, or co-generate syngas, may also have market advantages.
4.3 Hydrogen Purity The hydrogen generated is subject to contamination. As such, this criterion measures the impact or limitation of the contamination on potential applications. It is expected that some processes will provide mitigation methods, which clean the hydrogen before it exits the system. For this reason, the contamination is measured as the hydrogen leaves the system as a product. The cost and complexity of any mitigation should be included in other criteria. The expected contaminants from each process are identified in Table 5.
Table 5. Potential Applications with Regard to Purity.
Hydrogen Related Application
Ideal Purity and Contaminant Levels
1 Refining (large quantity application): Hydrotreating (including desulfurization, denitrification, olefin saturation, aromatic saturation, demetallization, halide removal and oxygen removal)
Lower limit in H2 recycle loop of 70-80 mol.%; hence, high purity is desired. Catalyst deactivation from coking (reversible), metals (Pb, Fe, As, P, Na, Ca, Mg, Ni, V – irreversible), and sintering (from temperature – irreversible); reversible deactivation also occurs from excessive H2S or CO in the feed

15
Hydrogen Related Application
Ideal Purity and Contaminant Levels
2 Refining (large quantity application): Hydrocracking (including desulfurization, denitrogenation, isomerization, cracking, and olefin hydrogenation)
Lower limit in H2 recycle loop of 70-80 mol.%; hence, high purity is desired. Catalyst deactivation from coking (reversible), metals (Pb, Fe, As, P, Na, Ca, Mg, Ni, V – irreversible, keep to < 2 ppmw), sintering (from temperature – irreversible), or high water partial pressure (causes catalyst agglomeration, but is reversible); reversible deactivation also occurs from excessive H2S or CO in the feed
3 Biofuels Production High purity desired in order to avoid product contamination; Sulfur must be maintained at less than 1 ppm, preferably around 100 ppb
4 Synthetic Fuels (i.e. F-T) High purity desired in order to minimize inert buildup in F-T recycle loop; Sulfur must be maintained at less than 1 ppm, preferably around 100 ppb; N2 and CH4 are inerts only, but should be minimized; Halogens, HCN, and NH3 should be removed from the FT feed gas; CO2 should be limited to less than a few percent, especially for iron catalysts
5 Methanol Synthesis High purity is desired in order to minimize inerts in the synthesis gas. 2% CO2 in the synthesis gas is desirable, but levels of CO2 greater than 4% will reduce methanol conversion. Copper-based catalysts are readily poisoned (even catastrophically) by sulfur, chlorine, and iron pentacarbonyl. Hence, sulfur and chlorine must be removed and carbon steel surfaces must be passivated.
6 Substitute Natural Gas (SNG) High purity is desired in order to maximize the heating value of the resultant SNG product. Sulfur compounds will poison the catalyst; hence, sulfur in the syngas should be limited below 5 ppmv. Other poisons include potassium and arsenic. Other metals an also poison the catalyst. Amines and methanol do not poison this catalyst.
7 Ammonia (and associated derivatives) Large quantity application
Iron catalysts are deactivated by oxygenates such as CO, CO2, O2, and H2O. CO, CO2, and H2O will cause reversible deactivation at concentrations above 200 ppm. O2 will cause irreversible deactivation at concentrations above 50 ppm. Other poisons include copper, chlorides, sulfur, phosphorous, and arsenic.
8 Float Glass Manufacturing In order to prevent oxidation of the molten tin used in float glass manufacture, a hydrogen (4-15%) and nitrogen (85-96%) atmosphere is used. Impurity limits for the combined hydrogen/nitrogen atmosphere are oxygen < 0.0001%, water < -60°C dew point = .00106%, CO2 and SO2 content < 0.0001%.
9 Iron and Steel Making High purity hydrogen is not be needed for direct reduction iron making; Sulfur should be maintained at less than 1 ppm
10 Fuel Cell Operations The platinum catalyst used at the anode requires hydrogen gas purity >99.99%. Nominal limits for impurities that cause catalyst poisoning are CO, CO2, hydrocarbons < 1 ppm each, O2 < 2 ppm, N2 < 50 ppm, H2S and COS << 1 ppm.
11 Food (hydrogenation) The nickel catalysts typically utilized for hydrogenation of fats and oil become poisoned by both gaseous sulfur compounds and CO, although re-activation due to CO exposure is reversible at reduced pressure. Other poisons from oil impurities include phosphatides, free fatty acids and chlorophylloids. Hydrogen purity >99.8% is recommended.

16
4.4 Development Risk / Technology Maturity Development risk is a measure of the vulnerabilities of each of the proposed technologies that must be addressed before deployment. The technology development plan should describe a technology development and demonstration schedule required to reach deployment within the scheduled time frame for NHES.
For the purpose of this evaluation, development risk will be a qualitative composite score based on major sub-systems. The emphasis will be on technology-specific components and not on processes that are industry standard such as water purification, instrumentation and control, or waste management.
Each technology has established its current Technology Readiness Level (TRL) for the major components in the N-R HES Technology Development Program Plan (Bragg-Sitton 2016) A technology is assigned an overall TRL score based upon the lowest component TRL score for that technology. For example, if one component received a TRL score of 3 and another TRL of 5, the composite TRL score of the technology would be a 3.
Figure 6. Simplified overview of TRLs for N-R HES.
4.5 Complexity and Controllability Plant complexity and controllability are arbitrary criteria that impact project risk. It can be measured by on-line operating capacity factor for plants of similar complexity. Capacity factors exceeding 0.9 (averaging 90% of plant name-plate capacity throughout the year) are typical for mature chemical plants with years of operating history. New plants (or first-of-a-kind plants) often have capacity factors around 0.7.
Capacity factor FOM can be measured in pilot plants that have the same configuration and complexity as full-scale plants. Control systems can be developed and demonstrated and rated in terms of resiliency and cyber security.
A second FOM is the degree to which a process can be operated with auto-controls. This FOM can be cast in terms of operating costs that include operators and maintenance labor to run a given option. Again,
Technology Readiness Levels (N-R HES)
1 2 3 4Basic 1' Application Proof of Experimental
Principle Formulated Concept Scale
Component
Technology
5BenchScale
PilotScale
EngineeringScale
Prototype
1 Subsystem I System
•
Plant
Area
Single Effects Testing---Integral Effects Testing
Cold Testing Hot Operations

17
the FOM should be established by actual operating experience. For new plants, never before operated, this FOM can be established by a representative pilot plant operation.
Controllability can also be related to systems flexibility to ramp-up/down to match the power generation profiles. Hence, another figure of merit is the responsiveness of the hydrogen generation system from start-up to full capacity.
4.6 Quality Assurance/Quality Control Producing a high quality product- in this case hydrogen- is the objective of engineering design and can be considered a FOM from the perspective of quality assurance/quality control (QA/QC). It is a function of robust design which is an engineering methodology for improving productivity during research and development so that high quality products can be consistently produced at the lowest cost feasible. Robust process design is addressed in the curricula of process engineers (Phadke, 1989). A discussion on robust design and engineering is rooted in:
• Measurement of quality during design/development
• Efficient experimentation to find dependable information about the design parameters
Development of a FOM for QA/QC is possible by “employing the signal-to-noise (S/N) ratio to measure quality and orthogonal arrays to study many design parameters simultaneously. A detailed discussion of these tools is beyond the scope of this report, but should be applied in the R&D plan.
Ultimately, QA/QC FOM should be established relative to project technical requirements.
4.7 Scalability Scalability relates to design flexibility to match a given hydrogen production technology with project-specific production opportunities or targets. It also relates to the ability to incrementally scale-up a process as demand increases or as opportunity to scale-up increases. This may be the case as renewable energy is progressively increased on the grid, which then may provide more excess power generation capacity that can be used to produce hydrogen.
Some hydrogen operations, such as electrolysis plants, are infinitely scalable in their current design. Electrolysis units are highly distributable. Other processes are more rigid, and may only be competitive at larger scale, and not easily scalable. Therefore, FOM for scalability should be established relative to project requirements.
4.8 Ancillary Benefits Ancillary benefits FOM include side benefits that may improve financial pro forma. These include revenue generation by selling grid services, such as frequency and voltage control, area power balancing, and demand response.
Additional ancillary services may include energy storage to provide auxiliary power, or an auxiliary supply of hydrogen when needed.
4.9 Safety While safety must meet specific technical requirements and regulations, relative FOM can be applied to factors that may include:
• Volume and pressure of hydrogen and oxygen product receivers and storage tanks
• Disposition of hydrogen (how it is transferred and transported)

18
• Remote operations versus human-contract for control and maintenance
• Presence of other hazardous chemicals, e.g., sulfuric acid
• Presence of other high energy hazards, e.g. electrical and thermal energy.
Ideally, the FOM for safety is a rating of health hazards risk, which may be related to lost-work time due to illness or injury. Although the goal for any project is zero accidents, the safety FOM should be based on actual plant operational experience.
4.10 Waste Management A base assumption is that any deployed technology will be safe and compliant with all regulations; nevertheless, hydrogen generation will produce waste. The most useful discriminator for waste management is the quantity and type of waste generated. This includes contaminant mitigation, failed components, industrial, and possibly hazardous, waste. This criterion measures the relative difficulty of waste management and disposal. Relative to the incumbent, waste management also must capture environmental impacts (or avoided impacts) on resource production. The consequences of natural gas production include associated geological impact of horizontal drilling and hydraulic fracturing of shales and other formations, contamination by use of drilling muds and other fluids, produced water cleanup and disposal, fugitive gaseous emissions, and air pollutant emissions during hydrogen production.
It is noted that waste management is captured at some level in the H2A life-cycle cost of hydrogen. Since all of the technologies will generate industrial waste, it is not a discriminator and is not a part of this criterion. It is also assumed for alternative hydrogen production evaluations that none of the technologies will generate radioactive or mixed hazardous waste.
Hazardous waste is any reactive, toxic or characteristic waste regulated by EPA. These are generally more difficult and costly to manage and dispose. This criterion considers two characteristics of waste generation: the amount of a specific hazardous waste and the difficulty of management and disposal. It is noted again that the deployed technology will meet all safety and environmental requirements.
Tritium migration from the nuclear reactor core to the hydrogen product is controlled by isolating the secondary heat transfer loop from the process steam generator. This provides two barriers of protection from tritium that builds up in the primary cooling loop of a reactor. Notwithstanding, a tritium monitor on hydrogen product could alleviate public concerns.
Decontamination and dismantlement (D&D) cost are not typically included in the financial assessment of a project, or as a discriminator between technologies. The H2A model assumes that the D&D cost is equal to the salvage cost and is therefore not included. Although the D&D costs will likely exceed the salvage costs, this is an appropriate simplification for the present evaluation.
5. CONCLUSIONS & RECOMMENDATIONS Nuclear energy has the potential to exert a major impact on energy security by producing an economically reliable heat source that can be used for electrical power generation and heating for many industrial processes. Hydrogen is an important energy intermediate in the U.S. and world energy economy, as was born out in a recent study on market opportunities for nuclear energy use by industry. If nuclear power plants can rapidly swing between power generation and hydrogen production, then they can avoid curtailment or operating at negative electricity pricing. This flexible operation may help advance excess

19
generation capacity to periods when renewable energy is not being generated and it may also help many existing nuclear plants that are currently economically challenged to remain in operation.
The buildout of wind and solar power generation has presented an opportunity to use nuclear energy for purposes other than power generation. Based on preliminary financial projections, nuclear hybrids appear to be economically competitive and can contribute to energy security in the United States.
A summary of the FOM discussed in this report is provided below. These FOM are recommended when considering nuclear hydrogen hybrid system choices. In order to reduce the associated risks related to the various FOM, additional modeling and simulation and technology validation is recommended.
The cost of hydrogen (plus other benefits) must beat the incumbent steam-methane reforming. Other benefits may include the cost of avoided pollutant emissions, grid services, oxygen sales, waste reduction, safety of operations, distribution and delivery advantages, hydrogen purity, price assurance, etc.
Table 6. Economic FOM Relative to Nuclear/Hydrogen Hybrid Systems
FOM Significance
Cost of Hydrogen ($/kg)
The most important parameter for consideration. The cost of hydrogen (plus other benefits) must beat the incumbent. The incumbent today is steam-methane reforming. Other benefits may include the cost of avoided pollutant emissions, grid services, oxygen sales, waste reduction, safety of operations, distribution and delivery advantages, hydrogen purity, price assurance, etc.
Total Capital Investment (TCI, US$)
Capital is limited. Investment decisions begin with a decision to invest capital in projects that offer the highest reward, given a threshold of risk the investor is willing to take.
Internal Rate of Return on Equity (IRR, %)
The return on debt financing is usually fixed. Equity investments compare risk-reward decisions based on the annual rate of return on committed capital.
Cost of Electricity, and associated risks
The cost of electricity is the maximum price that the hydrogen plant can afford to meet project financial goals. Risks are encountered in unregulated markets when disruptive power generation sources are introduced. Risk is also associated with on-line operating capacity of the hydrogen plant, which may vary as overall profitability is achieved by a hybrid system.
Cost of Heat, and associated risks
The levelized cost of heat must be relatively competitive with the next best option production of of the thermal energy. The incumbent today is natural gas fired heaters. Risks include the volatility in natural gas or other variable cost factors. The use of nuclear thermal energy for hydrogen production must be relatively competitive with the next best heat applications (for example, to produce steam that is used by a petroleum refinery or for concentration of a mineral slurry).
20
Operating Costs, and associated risks
Operating costs include fixed and variable costs, including labor, chemicals, materials, and resource inputs. Risks include the price stability of variable costs.
Maintenance Costs, and associated risks
Maintenance costs include projected equipment wear and preventative maintenance activities. Risks include technology uncertainty.
Performance Guarantees, and associated risks
Performance guarantees apply to individual equipment and overall system performance and capacity factors. Performance guarantees are correlated with technology commercial readiness levels.
Capacity Factor, and associated risks
Capacity factor is the ratio of the average actual operation of the plant relative to its name-plate capacity. Risks are associated with component failures, process stability, and interoperability of integrated systems.
Technology Readiness Level
An indicator of commercial readiness to perform at capacity or to achieve performance guarantees.
Operability Assurance, and associated risks
A measure of the ability to flexibly startup, control, and shutdown processes on demand. Also a measure of auto-controllability.
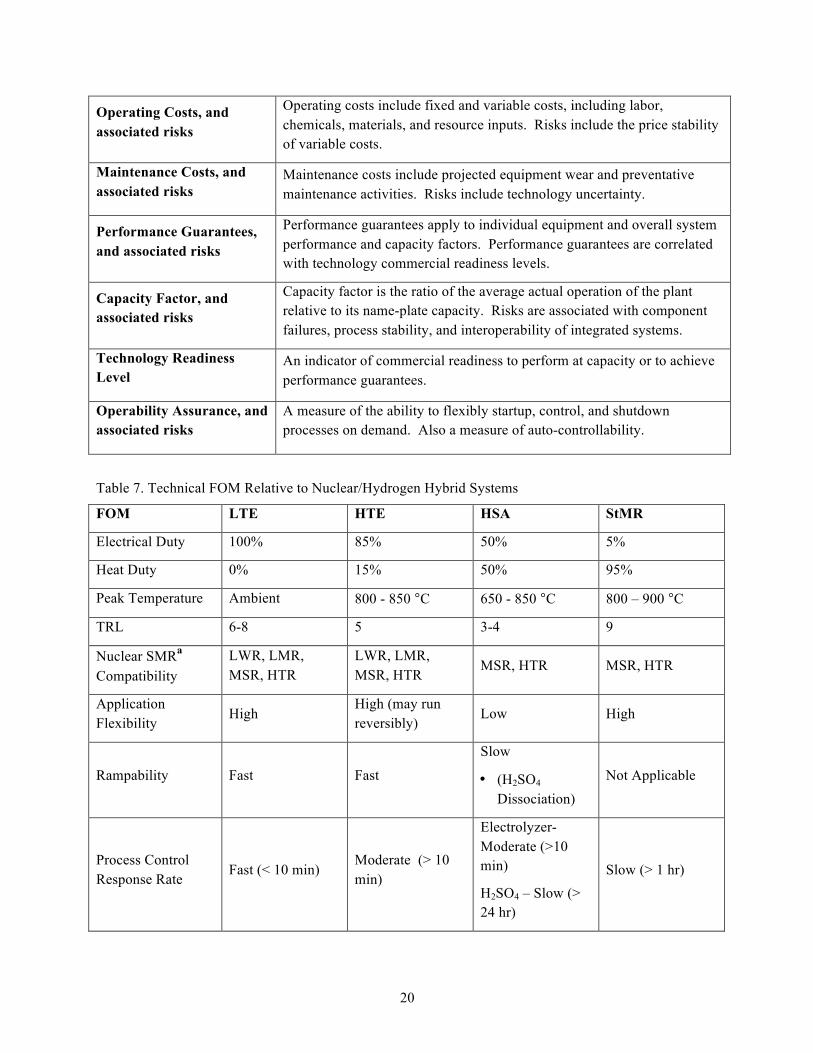
Table 7. Technical FOM Relative to Nuclear/Hydrogen Hybrid Systems
FOM LTE HTE HSA StMR
Electrical Duty 100% 85% 50% 5%
Heat Duty 0% 15% 50% 95%
Peak Temperature Ambient 800 - 850 °C 650 - 850 °C 800 – 900 °C
TRL 6-8 5 3-4 9
Nuclear SMRa Compatibility
LWR, LMR, MSR, HTR
LWR, LMR, MSR, HTR
MSR, HTR MSR, HTR
Application Flexibility
High High (may run reversibly)
Low High
Rampability Fast Fast
Slow
• (H2SO4 Dissociation)
Not Applicable
Process Control Response Rate
Fast (< 10 min) Moderate (> 10 min)
Electrolyzer- Moderate (>10 min)
H2SO4 – Slow (> 24 hr)
Slow (> 1 hr)

21
Electrical Demand Response Rate
Fast (< 1 sec) Fast (<1 sec) Fast (<1 sec)
Electrolyzer Not Applicable
Thermal Response Rate
Not Applicable Unknown (minutes?)
Unknown (hours?) Not Applicable
Complexity Medium High Medium Low
Scalability
High
• modular cell stacks
High
• modular cell stacks
Medium
• typically large
Low
• typically large
Hydrogen Purity High High Medium
• acid gases High
Controllability
(Relative ranking)
High
• electrical only • remote/auto
control possible
Medium /
• thermal heat integration
Medium
• semi steady-state system operation
• electrical, thermal, and chemical integration
• plant operator required
High
• steady-state system operation
• thermal integration
• plant operator required
Safety Risk Low Low
High
• hazardous chemicals
Low
QA/QC High High Unknown High aLWR – Light Water Reactor; HTR – High Temperature Reactor (typically gas-cooled); MSR – Molten Salt Reactor; LMR – Liquid Metal Reactor Recommendations for future work planning include:
• Establish a consistent set of financial parameters for case evaluations. The H2A model is a starting point for the hydrogen plant. These are needed to compare NPV and IRR for alternative nuclear/hydrogen N-R HES.
• Measure technical performance factors to quantify system technical functionality FOM. This is needed to assess capacity factor risks.
• Implement a robust design and engineering program that includes QA/QC requirements, safety requirements, and functional requirements with respect to system responsiveness, and controllability. This is needed to quantify FOM for these parameters.

22
6. REFERENCES(AIChE 2007) AIChE Annual Meeting, Salt Lake City, Topical G: Nuclear Energy and the Hydrogen
Economy; https://www.aiche.org/conferences/aiche-annual-meeting/2007/proceeding/group/nuclear-energy-and-hydrogen-economy, November, 2007.
(IAEA 1999) International Atomic Energy Agency, IAEA-TECDOC-1085, May 1999
(Bragg-Sitton 2016) S. M. Bragg-Sitton, R. Boardman, C. Rabiti, S.K. Jong, M. McKellar, P. Sabharwall, J. Chen, C. Cetiner, T. J. Harrison, A. L. Qualls, “Nuclear-Renewable Hybrid Energy Systems: 2016 Technology Development Program,” INL/EXT-16-38165, March 2016
(Davis 2016) L. Davis, C. Hausman, “Market Impacts of a Nuclear Power Plant Closure,” American Economic Journal: Applied Economics 2016, 8(2), 2016, http://dx.doi.org/10.1257/app.20140473
(EPRI 2017) 2017 Research Portfolio, Program 41.11.01 – Flexible Operations Program, http://www.epri.com/Our-Portfolio/Pages/Portfolio.aspx?program=106194
(Garcia 2015) H. E. Garcia, J. Chen, J. S. Kim, M. G. McKellar, W. R. Deason, R. B. Vilim, S. M. Bragg-Sitton, R. D. Boardman, “Nuclear Hybrid Energy Systems Regional Studies: West Texas & Northeastern Arizona,” INL/EXT-15-34503, 2015
(Garcia 2016), H. E. Garcia, J. Chen, J. S. Kim, R. B. Vilim, W. R. Binder, S. M. Bragg-Sitton, R. D. Boardman, M. G. McKellar, and C. J. J. Paredis, “Dynamic performance analysis of two regional Nuclear Hybrid Energy Systems,” Energy, 107, p. 234-258, 2016.
(IAEA 1999) “Hydrogen as an Energy Carrier and Its Production by Nuclear Energy,” 1999
(INL 2009) “Hydrogen Technology Down-Selection Approach, Criteria and Weighting," Idaho National Laboratory, PLN-3131, May 2009
(INL/NGNP 2010) “HTGR-Integrated Hydrogen Production via Steam Methane Reforming (SMR) Economic Analysis,” INL/TEV-954, 2010
(INL and NREL 2014) “Integrated Nuclear Renewable Energy Systems Foundational Workshop Report," INL/EXT-134-32857, 2014
(McMillan, 2016) C. McMillan, R. Boardman, M. McKellar, P. Sabharwall, M. Ruth, S. Bragg-Sitton, “Generation and Use of Thermal Energy in the United States Industrial Sector and Opportunities to Reduce its Carbon Emissions,” NREL/TP-6A50-66763, INL/EXT-16-39680, October 2016
(Melaina 2013) M. Melaina, M. Penev, D. Heimiller, “Resource Assessment for Hydrogen Production,” NREL/TP-5400-55626, September 2013
(NETL 2007) “FutureGen Technologies Projects Facts,” https://www.netl.doe.gov/File%20Library/Research/Coal/Advanced%20Research/Proj460.pdf
(O’Brien 2012) J. E. O’Brien, “Potential of Nuclear Hydrogen for Addressing Energy Security and Climate Change,” Nuclear Technology, Vol. 178, April 2012

23
(Phadke 1989) M.S. Padke, Quality Engineering Using Robust Design, AT&T Bell laboratories, P T R Prentice-Hall, Inc., ISBN 0-13-745167-9, 1989
(Rabiti 2015) C. Rabiti, C , R A. Kinoshita, J. S. Kim, W. Deason, S. M. Bragg-Sitton, R. D. Boardman, and H. E. Garcia, “Status on the Development of a Modeling and Simulation Framework for the Economic Assessment of Nuclear Hybrid Energy Systems,” INL/EXT-15-36451, September 2015
(Ruth 2017) M. Ruth, D. Cutler, F. Flores-Espino, G. Stark, “The Economic Potential of Nuclear-Renewable Hybrid Energy Systems Producing Hydrogen,” Draft Report, to be issued Spring 2017