fig. s1. co-purification of 6his-scy with para and...
TRANSCRIPT

Fig. S1. Co-purification of 6His-Scy with ParA and ParAScy- from S. coelicolor and the control
experiments.
A. The control negative experiment for ParA-Scy co-purification using metal-ion affinity
chromatography performed with the extract of thiostrepton-induced strain BD11
(M145pCJW93) strain showing no unspecific interaction of ParA and Scy with the Ni-NA
resin. Top panel SDS-PAGE, bottom panel Western-blotting with anti-ParA antibody.

B. Co-purification of ParAScy- with 6His-Scy from the extract of thiostrepton-induced strain BD10
(ParAScy-, pCJW93ptipAhis-scy) using metal-ion affinity chromatography. Top panel SDS-
PAGE, bottom panel Western-blotting with anti-ParA antibody.
C. Comparison of the efficiency of co-purification of ParA and ParAScy- with 6His-Scy. Western-
blotting with anti-ParA antibody of the selected elution fractions. The same amount of the
protein was loaded from elution fraction of M145pK48 and from BD10. 1, purified ParA
protein; 2, cell extract of M145pK48 (M145pCJW93ptipAhis-scy) strain; 3, cell extract of BD10
(ParAScy-, pCJW93ptipAhis-scy) strain 4, cell extract of J3306 (∆parA strain); M, marker; E1,
imidazole elution fraction of M145pK48 (M145pCJW93ptipAhis-scy) – positive result; E2,
imidazole elution fractions of BD11 (M145pCJW93) – negative control; E3, imidazole elution
fractions of BD10 (ParAScy-, pCJW93ptipAhis-scy) – weakened interaction; E4 imidazole elution
fractions of BD12 (ParAScy-, pCJW93) – negative control.
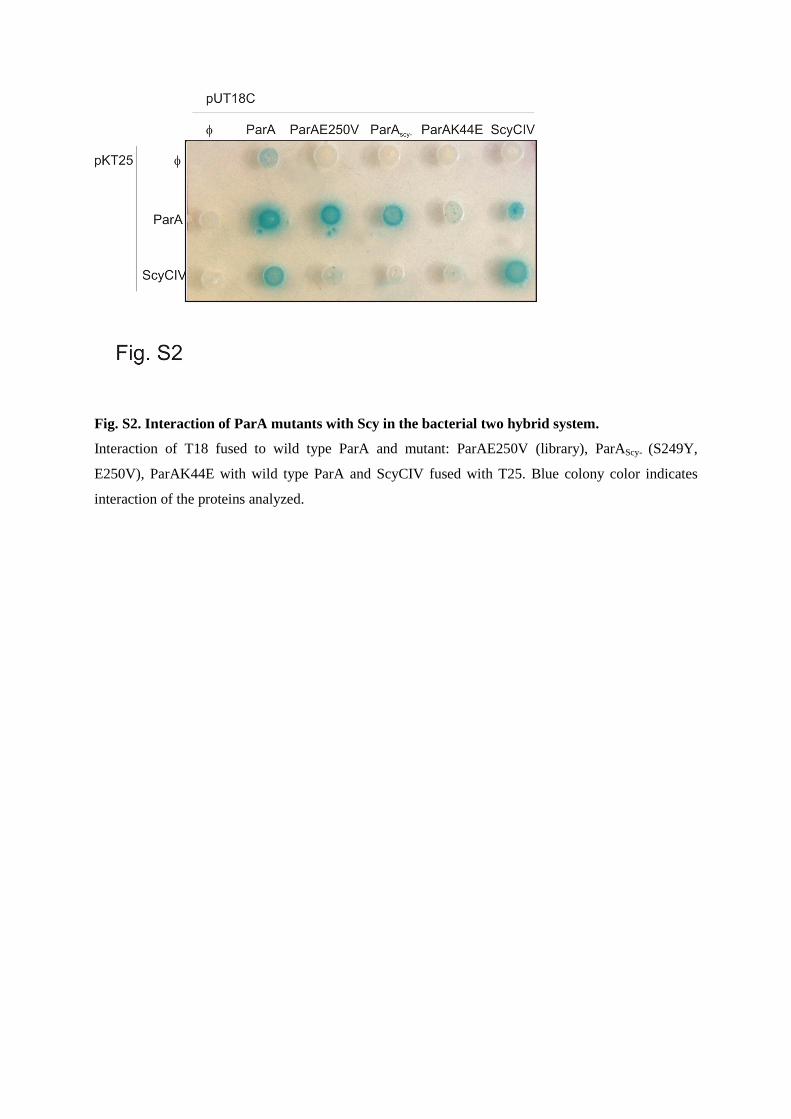
Fig. S2. Interaction of ParA mutants with Scy in the bacterial two hybrid system.
Interaction of T18 fused to wild type ParA and mutant: ParAE250V (library), ParAScy- (S249Y,
E250V), ParAK44E with wild type ParA and ScyCIV fused with T25. Blue colony color indicates
interaction of the proteins analyzed.

Fig. S3. Polymerization of the wild type ParA and ParA scy- assayed by glutaraldehyde crosslinking.
SDS-PAGE analysis of 5 µM ParA crosslinked with the increasing concentration of glutaraldehyde (2.5,
5 and 10 mM) in presence of 2 mM ATP

Fig. S4. The electrostatic potential on the surface of ParA (A) and ParAscy- (B) mapped using
VMD. Potential values in kJ/mol.

Fig. S5. Time lapse of Streptomyces venezuelae sporulating hyphae development showing close
correlation of ParA-EGFP extension and the cessation of the hyphae growth.