fifa quality programme for football turf handbook … quality programme for football turf handbook...
TRANSCRIPT

FIFA Quality Programme for Football Turf
Handbook of Test Methods
October 2015 Edition
October 2015 V2.4 (23.11.16) FIFA Quality Programme - 2 -
Handbook of Test Methods for Football Turf
Contents 1 Introduction
2 Normative references
3 Laboratory test specimens
4 Field test positions
5 Test conditions
6 Balls used for testing
7 Football studs used for testing
8 Determination of Football Rebound
9 Determination of Angle Ball Rebound
10 Determination of Ball Roll
11 Determination of Shock Absorption
12 Determination of Standard Vertical Deformation
13 Determination of Energy Restitution
14 Determination of Rotational Resistance
15 Determination of Skin / Surface Friction & Skin Abrasion
16 Procedure for Artificial Weathering
17 Procedure for assessment of synthetic infill
18 Procedure for the assessment of surface planarity
19 Procedure for the determination of heat on artificial turf products
20 Procedure for the determination of wear on artificial turf
21 Procedure to determine the quantity of infill splash
22 Procedure for determination of reduced ball roll
23 Procedure for measuring free pile height
24 Procedure for the determination of UV stabilizer content in artificial turf yarn
25 Procedure to determine the particle size distribution of granulated infill materials (FIFA 20)
26 Procedure for the measurement of infill depth (FIFA Test Method 21)
27 Procedure for the measurement of differential scanning calorimetry (DSC) (FIFA 22)
28 Procedure for the determination of decitex of yarns (FIFA Method 23)
29 Procedure for the determination of the infiltration rate of artificial turf systems (FIFA 24)
30 Procedure for the measurement of yarn thickness (FIFA Method 25)
31 International and European Standard test methods adopted by FIFA

October 2015 V2.4 (23.11.16) FIFA Quality Programme - 3 -
Handbook of Test Methods for Football Turf
Whilst every effort has been made to ensure the accuracy of the information contained in this Handbook any party who makes use of any part of this Handbook in the development of a football turf pitch (a "User") does so at its own risk and shall indemnify FIFA, their officers, directors, servants, consultants and agents against all claims, proceedings, actions, damages, costs, expenses and any other liabilities for loss or damage to any property, or injury or death to any person that may be made against or incurred by FIFA arising out of or in connection with such User's use of this Handbook.
Compliance with the requirements detailed in this Handbook by a User does not of itself confer on that User immunity from legal obligations.
Compliance with the requirements detailed in this Handbook by a User constitutes acceptance of the terms of this disclaimer by that User.
FIFA reserve the right to amend, update or delete sections of this manual at any time as they deem necessary.
Changes in the 2015 FQP Test Method Manual (compared to 2012 edition):
• New methodology for advanced wearing
• New methodology for reduced ball roll measurements
• New methodology for heat measurements
• New methodology for the determination of infill splash
• New methodology for measuring UV stabilizer content in artificial turf yarns
• New methodology for measuring free pile height
• Methodology for measurement of infill depth
• Methodology for measurement of dtex
• Methodology for measurement of permeability
• Methodology for measurement of granulated infills
• Methodology for DSC assessment

October 2015 V2.4 (23.11.16) FIFA Quality Programme - 4 -
Handbook of Test Methods for Football Turf
1 Introduction
This Handbook describes the procedures for assessing artificial turf football surfaces under the FIFA Quality Programme. Although the manual has been written to specify how Football Turf (artificial turf surfaces) should be tested the ball/surface and player/surface tests can also be used to assess the qualities of natural turf fields.
This edition of the manual supersedes previous editions with effect from 26 October 2015.
2 Normative references
This Handbook incorporates by dated or undated reference provisions from other publications. For dated references, subsequent amendments to or revisions of any of these publications will apply to this Handbook only when incorporated into it by amendment or revision. For undated references, the latest edition of the publication referred to applies.
3 Laboratory test specimens
3.1 A Football Turf is defined as the synthetic surface and infill, any shockpad and all supporting layers that influence the sports performance or biomechanical response of the surface.
3.2 Tests shall be made on all elements of the construction that influence the sports performance or biomechanical response of the surface.
3.3 Unless a Football Turf is laid on a base that is designed to contribute to the dynamic performance of the surface laboratory tests shall be carried out on tests specimens laid on a rigid flat concrete floor.
3.4 If a Football Turf is laid on a base that is designed to contribute to the dynamic performance of the surface the measurements of ball rebound, angle ball rebound, shock absorption and vertical deformation shall be made on a test specimen comprising the Football Turf and the base, laid to the depth specified by the manufacturer or supplier.
3.5 Laboratory tests for ball roll, rotational resistance, skin / surface friction and skin abrasion shall be made on all elements that influence the response - this does not normally include the supporting layers.
3.6 Size of test specimen
Test specimens shall be equal to or greater than the sizes stated in Table 1.
Table 1 - minimum size of test specimens
Test Minimum length of test specimen
Minimum width of test specimen
Ball rebound 1.0m 1.0m Angle ball rebound 1.0m 1.0m Reduced Ball roll 4.0m 1.0m Shock absorption 1.0m 1.0m Vertical deformation 1.0m 1.0m Rotational resistance 1.0m 1.0m Surface Friction / Abrasion 1.0m 1.0m Sub-ambient & Elevated tests 0.4m 0.4m Simulated wear 4.0m 1.0m Heat testing 1.0m 1.0m Splash testing 1.0m 1.0m Artificial weathering: carpet pile yarn(s) 20m length UV stabiliser assessment 1m length

October 2015 V2.4 (23.11.16) FIFA Quality Programme - 5 -
Handbook of Test Methods for Football Turf
3.7 Unless specified in the test method laboratory test specimens shall not include joints or inlaid lines.
3.8 Preparation of test specimens
Following filling, filled test specimens shall be conditioned prior to test by passing a hand-pulled roller over the test specimen for 50 cycles (one cycle comprises one outward and one return path of one roller) or 5 cycles of the lisport XL. The barrel of the roller shall weigh (28,5 ± 0,5) kg, be (118 ± 5) mm in diameter and have plastic studs mounted as shown in Figure 1 and detailed in Table 1. The studs shall be as shown in Figure 2, be manufactured from plastic and have a Shore A hardness of 96 ± 2.
Note a manufacturing tolerance of ± 1 mm for the stud positions has been found satisfactory.
Figure 1 — Pattern of studs

October 2015 V2.4 (23.11.16) FIFA Quality Programme - 6 -
Handbook of Test Methods for Football Turf
Table 1 — Coordinates of stud positions (center of stud)
STUD - X AXIS - Y AXIS STUD - X AXIS - Y AXIS STUD - X AXIS - Y AXIS mm mm mm mm mm mm
1 154,5 0,0 51 279,5 127,5 101 150,0 252,5 2 271,5 4,5 52 255,5 128,5 102 78,5 252,5 3 35,0 8,5 53 185,5 129,5 103 31,0 259,0 4 198,5 10,5 54 92,5 134,5 104 242,5 264,5 5 246,0 13,5 55 139,0 136,5 105 289,0 268,0 6 105,0 14,0 56 22,0 141,0 106 195,0 270,5 7 11,5 16,0 57 65,5 146,5 107 7,5 271,0 8 128,5 19,0 58 231,5 149,0 108 125,0 271,0 9 79,0 23,0 59 114,5 149,5 109 101,0 274,5 10 55,0 23,0 60 208,0 151,0 110 51,5 275,5 11 173,0 24,0 61 159,5 152,5 111 169,5 280,5 12 222,0 25,0 62 42,0 157,5 112 219,0 280,5 13 267,0 30,0 63 276,0 158,5 113 76,0 282,0 14 149,0 33,5 64 182,5 160,0 114 263,5 284,0 15 289,5 37,0 65 252,5 162,5 115 145,5 285,0 16 196,0 40,0 66 89,0 164,0 116 28,0 291,5 17 31,0 41,0 67 135,0 170,0 117 286,0 297,0 18 102,0 43,5 68 18,5 173,0 118 239,0 298,5 19 242,0 46,0 69 63,0 177,5 119 192,0 300,0 20 8,5 47,0 70 111,0 179,5 120 98,0 304,0 21 125,0 52,5 71 204,5 180,0 121 121,0 304,0 22 76,0 54,0 72 229,0 180,5 122 48,5 308,0 23 169,0 55,0 73 155,5 184,5 123 166,0 312,0 24 52,0 56,0 74 178,5 188,5 124 72,0 312,5 25 218,5 57,5 75 272,5 189,0 125 215,0 313,5 26 263,0 63,0 76 38,5 190,5 126 260,0 316,0 27 286,0 67,0 77 85,0 192,5 127 142,0 319,5 28 146,0 68,5 78 249,0 196,5 128 21,0 329,0 29 193,0 70,5 79 131,5 204,5 129 113,0 333,0 30 98,5 75,0 80 14,5 207,0 130 64,5 336,0 31 28,0 75,5 81 294,5 208,0 131 180,0 340,0 32 5,5 78,0 82 58,5 210,5 132 231,0 340,0 33 239,0 81,0 83 201,0 210,5 133 87,0 342,5 34 122,0 85,0 84 108,5 212,5 134 275,0 343,5 35 73,0 85,5 85 226,0 215,0 135 157,5 345,5 36 166,0 88,0 86 153,0 218,0 136 40,0 352,0 37 215,0 88,0 87 270,0 220,0 137 251,0 357,5 38 48,5 89,5 88 176,5 220,5 138 204,0 358,5 39 259,5 96,0 89 82,0 222,5 139 110,0 362,5 40 283,0 97,5 90 34,5 224,5 140 16,5 362,5 41 189,0 100,0 91 246,0 231,0 141 133,0 363,5 42 142,0 103,0 92 128,5 237,5 142 61,0 368,0 43 94,5 104,0 93 292,0 237,5 143 177,5 369,0 44 25,5 109,0 94 12,0 238,5 144 84,5 370,0 45 235,0 114,5 95 199,0 241,0 145 228,0 370,0 46 69,5 116,0 96 104,0 242,0 47 118,5 117,5 97 55,,0 243,0 48 162,5 119,5 98 222,0 248,0 49 211,5 119,5 99 172,5 250,0 50 46,0 123,5 100 266,5 252,5

October 2015 V2.4 (23.11.16) FIFA Quality Programme - 7 -
Handbook of Test Methods for Football Turf
4 Field test positions
Unless otherwise specified, tests on site shall be made in the positions shown on Figure 2.
All field tests, when not otherwise specified, shall be undertaken in positions 1 – 6. The orientation of test positions shall be determined by the test institute.
Figure 2 - field test positions
Field tests should not be made on joints or inlaid lines, other than ball roll that will cross them.
5 Test conditions
5.1 Laboratory tests
Laboratory tests shall be made at an ambient laboratory temperature of 23 ± 2º C.
Test specimens shall be conditioned for a minimum of 3 hours at the laboratory temperature prior to test.
Laboratory tests shall be made on dry and wet test specimens as specified in the appropriate test procedure.
5.2 Preparation of wet test specimens
Wet specimens shall be prepared by evenly applying to the test piece a volume of water that thoroughly soaks the specimen (if in doubt this should be equal to the volume of the test specimen). Following wetting the test specimen shall be allowed to drain for 15 minutes and the test carried out immediately thereafter.
5.3 Field (site) tests

October 2015 V2.4 (23.11.16) FIFA Quality Programme - 8 -
Handbook of Test Methods for Football Turf
Tests on site shall be made under the prevailing meteorological conditions, but with the surface temperature in the range of -5°C1 to +50°C. If weather conditions make it impossible to undertake tests within the specified temperature range the deviation from the specified test conditions shall be clearly noted in the test report. In cases of failure a retest shall be undertaken within the specified range.
The surface and ambient temperatures and the ambient relative humidity at the time of test shall be reported.
Ball roll and ball rebound tests (unless the test area is screened from the wind) shall be made when the maximum prevailing wind speed is less than 2 m/s. The wind speed at the time of test shall be reported.
If weather conditions make it impossible to undertake ball roll tests within the specified wind speed range and the ball roll is found to exceed the relevant requirement a reduced test programme may be carried out where screening (e.g. by means of a plastic tunnel) is used to reduce the maximum wind speed to less than 2 m/s providing the free pile height (height of pile above any infill) is consistent (+ 3mm of the mean for the pitch) and the pile over the entire field is predominately vertical in each of the standard Field Test Positions. In the reduced test programme ball roll shall be measured in three directions (0°, 90°and 180°) on at least one area of the pitch. If the free pile height is found to be inconsistent (> + 3mm of the mean for the pitch) or not predominately vertical in each test position ball roll shall be measured in each of the standard Field Test Positions using screening as necessary. The Mean Free Pile Height for the pitch shall be calculated by measuring the free pile height at each of the field test positions at 0m, 5m and 8m spacings at 0°, 90°, 180°and 270° (nine readings at each of the six test positions).
6 Balls used for test
Tests shall be made with a FIFA QUALITY PRO football2. Immediately prior to any test, the pressure of the ball shall be adjusted so the ball gives a rebound on concrete to the bottom of the ball, at the temperature the test will be made, of 1.35 ± 0.03m, from a drop height of 2.0 + 0.01m. If the pressure adjustment is excessive and puts the ball pressure outside of the normal operating pressure as defined by the ball manufacturer the ball should be rejected.
To prevent damage to the skin of the ball the ball used to measure ball roll shall not be used for any other tests.
Note: To minimise the effect on results of the inherent variations found in footballs, FIFA accredited test laboratories are supplied with specially selected test balls.
7 Football studs used for test
The studs used on the Rotational Resistance and sample conditioning roller shall be in accordance with Figure 3. They shall be manufactured from plastic and have a Shore A Hardness of 96 ±2.
1 The field may be tested at temperatures as low as -5°C provided there is no ice on the field at time of testing. 2 ‘FIFA Approved’ footballs (designation until 2014) are permitted for testing.

October 2015 V2.4 (23.11.16) FIFA Quality Programme - 9 -
Handbook of Test Methods for Football Turf
Figure 3 - profile of football stud (new) Stud replacement – Rotational Resistance
After a maximum of fifty tests, the length of the studs shall be determined. If any stud is found to be less than 11.0mm all shall be replaced.

October 2015 V2.4 (23.11.16) FIFA Quality Programme - 10 -
Handbook of Test Methods for Football Turf
8 Determination of ball rebound (FIFA Test Method 01)
8.1 Principle
A ball is released from 2m and the height of its rebound from the surface calculated.
Laboratory tests are also undertaken to assess the effects on this property of compaction through simulated use of the surface.
8.2 Test apparatus
8.2.1 Measuring device
The test apparatus comprises:
• An electromagnetic or vacuum release mechanism that allows the ball to fall vertically from 2.00 +0.01m (measured from the bottom of ball) without imparting any impulse or spin.
• Vertical scale to allow the drop height of the ball to be established.
• Timing device, activated acoustically, capable of measuring to an accuracy of 1ms.
• Football.
• Means of measuring wind speed to an accuracy of 0.1 m/s (field tests only).
8.3. Test procedure
Validate the vertical rebound of the ball on concrete immediately before testing.
Release the ball from 2.00 ±0.01m, bottom of ball to top above the top of the pile on filled and unfilled systems of playing surface, and record the time between the first and second impact in seconds.
Note: To limit the influence of the valve, it will be preferentially positioned at the top when the ball is attached.
8.4 Calculation and expression of results
For each test calculate the rebound height using the formula:
H = 1.23 (T - Δt)² x 100
Where:
H = rebound height in cm
T = the time between the first and second impact in seconds
Δt = 0.025s
Report the value of ball rebound to the nearest 0.01m as an absolute value in metres e.g. 0.80m.

October 2015 V2.4 (23.11.16) FIFA Quality Programme - 11 -
Handbook of Test Methods for Football Turf
Quote the uncertainty of measurement as + 0.03m.
8.5 Laboratory tests at 23 ±2°C
8.5.1 Procedure
Determine the ball rebound of the test specimen in five positions, each at least 100mm apart and at least 100mm from the sides of the test specimen. Re-condition the sample to original state as per manufacturer’s declaration prior to each individual ball rebound.
Undertake tests under dry and wet conditions, as appropriate.
8.5.2 Calculation of results
Calculate the mean value of ball rebound from the five tests.
8.6 Laboratory tests after simulated mechanical abrasion during use
8.6.1 Procedure
Condition the test specimen in accordance with FIFA Test 20.
Leave the sample in place and perform the below tests with the sample in the Lisport XL machine. Record the temperature of the surface and the ambient temperature during testing.
Determine the ball rebound of the test specimen in a minimum of five positions. Each measurement shall be made on the fully conditioned area of the test specimen at least 100mm from any edge and 150mm from any other test position. Remove any displaced infill from adjacent tests prior to making a test.
Undertake tests under dry conditions only except when moisture is an inherent constituent of the system.
8.6.2 Calculation of results
Calculate and indicate the mean value of ball rebound from the five tests.
8.7 Field tests
8.7.1 Test Conditions
Tests shall be made under the meteorological conditions found at the time of test subject to the limits of Section 5.3. The conditions shall be reported.
8.7.2 Procedure
Record the maximum wind speed during the test.
At each test location make five individual measurements, each at least 300mm apart.
8.7.3 Calculation of results
Calculate the mean value of ball rebound from the five tests for each test location.

October 2015 V2.4 (23.11.16) FIFA Quality Programme - 12 -
Handbook of Test Methods for Football Turf
9 Determination of Angle Ball Rebound (FIFA Test Method 02)
9.1 Principle
A ball is projected, at a specified speed and angle, onto the surface and the angle ball rebound calculated from the ratio of the ball’s velocity just after impact to the velocity just prior to impact.
9.2 Test apparatus
The test apparatus comprises:
• A pneumatic cannon capable of projecting the ball onto the surface at the specified angle and velocity.
• Radar gun capable of determining the horizontal speed of the ball before and after its impact with the test specimen. The radar gun must read to 0.1 km/h.
• Football.
9.3 Test procedure
Validate the vertical rebound of the ball on concrete immediately before the testing.
Adjust the pneumatic cannon so that the vertical height of the lowest point of the diameter of the cannon mouth is 0.90 + 0.02m above the top of the infill (in filled systems) or on the top of the pile on unfilled systems and so the ball departs the cannon at an angle of 15 ±2° to the horizontal and has a velocity of 50 ±5 km/h just prior to impacting the surface.
Position the radar so it is adjacent to the cannon, parallel to the surface, aligned in the direction the ball will be fired and at a vertical height at the middle of the radar gun of between 450mm and 500mm from the test surface.
Project the ball onto the surface and record the velocity of the ball immediately before and immediately after impact with the surface.
Repeat the procedure five times, ensuring that ball does not strike the same position twice.
9.4 Calculation and expression of results
Calculate the angle ball rebound using the formula:
Angle ball rebound (%) = (S2 / S1). 100
Where:
S2 = velocity after rebound in km/h S1 = velocity before rebound in km/h
Report the angle ball rebound as a percentage to the nearest whole number e.g. 55%.
Quote the uncertainty of measurement as + 5% absolute.

October 2015 V2.4 (23.11.16) FIFA Quality Programme - 13 -
Handbook of Test Methods for Football Turf
9.5 Laboratory tests
9.5.1 Procedure
Determine the angle ball rebound of the test specimen, ensuring each test position is each at least 300mm apart and at least 100mm from the sides of the test specimen.
Rotate the test specimen by 90° and repeat
Undertake tests under dry and wet conditions, as appropriate.
9.5.2 Calculation of results
Calculate the mean value of angle ball rebound from the five tests for each direction of test.
Calculate the mean value of angle ball rebound from the two directions of test.

October 2015 V2.4 (23.11.16) FIFA Quality Programme - 14 -
Handbook of Test Methods for Football Turf
10 Determination of Ball Roll (FIFA Test Method 03)
10.1 Principle
A ball is rolled down a ramp and allowed to roll across the surface until it comes to rest. The distance the ball has travelled across the surface is recorded.
10.2 Test apparatus
The test apparatus comprises:
• A ball roll ramp as shown in Figure 4 consisting of two smooth parallel rounded bars with a maximum diameter of the contact area with the ball of 40mm, whose inside edges are 100 ±10 mm apart. The ball shall transfer from the ramp to the surface without jumping or bouncing.
• Method of measuring the distance the ball rolls to an accuracy of ±0.01m (e.g. steel tape, laser).
• Football
• Means of measuring wind speed to an accuracy of 0.1 m/s (field tests only).
Figure 4: Ball Roll ramp
10.3 Test procedure
Validate the vertical rebound of the test ball on concrete immediately before the testing.
Adjust the ramp so that it is perpendicular to the surface and so the end of the guide rails are sitting on the top of the infill (in filled systems) or on the top of the pile on unfilled systems so that the ball rolls smoothly from the ramp onto the surface without jumping or bouncing.
Place the ball on the ball roll ramp so the point below the centre of the ball sitting on the ramp is 1000 ±5 mm above the test specimen.

October 2015 V2.4 (23.11.16) FIFA Quality Programme - 15 -
Handbook of Test Methods for Football Turf
Release the ball and allow it to roll down the ramp and across the test specimen until it comes to rest.
Measure the distance from the point the ball first comes into contact with the test specimen (top of carpet pile) to the point below the centre of the ball resting on the test specimen at the position the ball came to rest.
10.4 Expression of results
Report the Ball Roll value to the nearest 0.1m e.g. 6.9m
Quote the uncertainty of measurement as + 0.05m.
10.5 Field tests
10.5.1 Test conditions
Tests shall be made under the meteorological conditions found at the time of test subject to the limits of Section 5.3. The conditions shall be reported.
10.5.2 Procedure
Record the wind speed during the test.
At each test location make three individual measurements, each at least 100mm apart.
Undertake the tests in at least four directions (0º, 90º, 180º and 270º) with three individual measurements in each direction to determine if the result is influenced by factors such as slope or turf direction.
If there is slope ensure that the roll is carried out up and down the slope, and if there is a crown do not perform the test in a location with the ball rolling over the crown in any direction.
10.5.3 Calculation of results
For each test position/direction calculate the mean value of ball roll from the three tests.
Calculate the mean value of ball roll from all tests at each test position.

October 2015 V2.4 (23.11.16) FIFA Quality Programme - 16 -
Handbook of Test Methods for Football Turf
11 Determination of Shock Absorption (FIFA Test Method 04a) 11.1 Principle A mass with a spring attached to it is allowed to fall onto the test specimen. The acceleration of the mass is recorded, from the moment of its release until after its impact on the test specimen. The Shock Absorption is calculated by comparing the maximum force on the test specimen with the reference force of impact on concrete. 11.2 Test Apparatus The principle of the shock absorption apparatus is described in Figure 5 below, together with a list of its main components. These essential components are then further specified.
Figure 5 – test apparatus
1- Guide for the falling mass 2- Electric magnet 3- Falling mass 4- Accelerometer 5- Spring 6- Test foot 11.2.1 Electric magnet (2) Electric magnet allows the falling height of the mass to be set with an accuracy of ± 0.25 mm. 11.2.2 Falling mass (3) The falling mass incorporates an accelerometer, a spiral metal spring (5) and a steel test foot (6). The total mass of (3) + (4) + (5) + (6) shall be 20.000 g ± 100 g. 11.2.3 Piezo-resistive accelerometer (4) The accelerometer has a 50 g full scale capacity (= 50 x 9.80665 m·s-2), with the following characteristics: - Frequency range: bandwidth until 1000 Hz (-3dB) - Linearity: 2% over the operating range. The g-sensor should be positioned on the vertical line of gravity of the falling mass and as much as possible on the lower side of the mass. The g-sensor should be firmly attached to the mass to avoid natural filtering. 11.2.4 Spiral steel spring (5),

October 2015 V2.4 (23.11.16) FIFA Quality Programme - 17 -
Handbook of Test Methods for Football Turf
The spring rate is 2000 ± 100 N/mm and is linear over the range 0.1 to 7.5 kN. The linear characteristic of the spring is controlled with maximum increment of 1000 N. The spring shall be positioned centrally below the point of gravity of the falling mass. The spring shall have three coaxial coils rigidly fixed together at their ends. The mass of the spring shall be 800 g ± 50 g. 11.2.5 Test foot (6) The test foot has a diameter 70 ± 1 mm and a minimum thickness of 10 mm. The lower side part of the test foot is rounded with a radius of 500 mm ±50 mm and has an edge radius of 1 mm. The mass of the test foot shall be 400g ± 50g. 11.2.6 Test apparatus frame The frame consists of three adjustable supporting feet. Feet are at a distance of not less than 250 mm from the point of impact of the falling mass on the test specimen. Frame is designed so as to ensure that the mass of the apparatus is equally distributed on its three feet. For the apparatus with the mass, the pressure resulting on each foot must be less than 0.020 N/mm². For the apparatus without the mass, the pressure resulting on each foot must be more than 0.003 N/mm². 11.2.7 Signal recording A mean of conditioning and recording the signal of the accelerometer and a mean of displaying the recorded signal (see the figure 6). - Sampling rate: minimum 9600 Hz - Electronic A/D converter with a minimum resolution of 16 bits - Signal filtration with a 2nd order low-pass, Butterworth filter with a cut-off frequency of 600 Hz.
Figure 6 – example of curve representing falling mass acceleration versus time
Where:
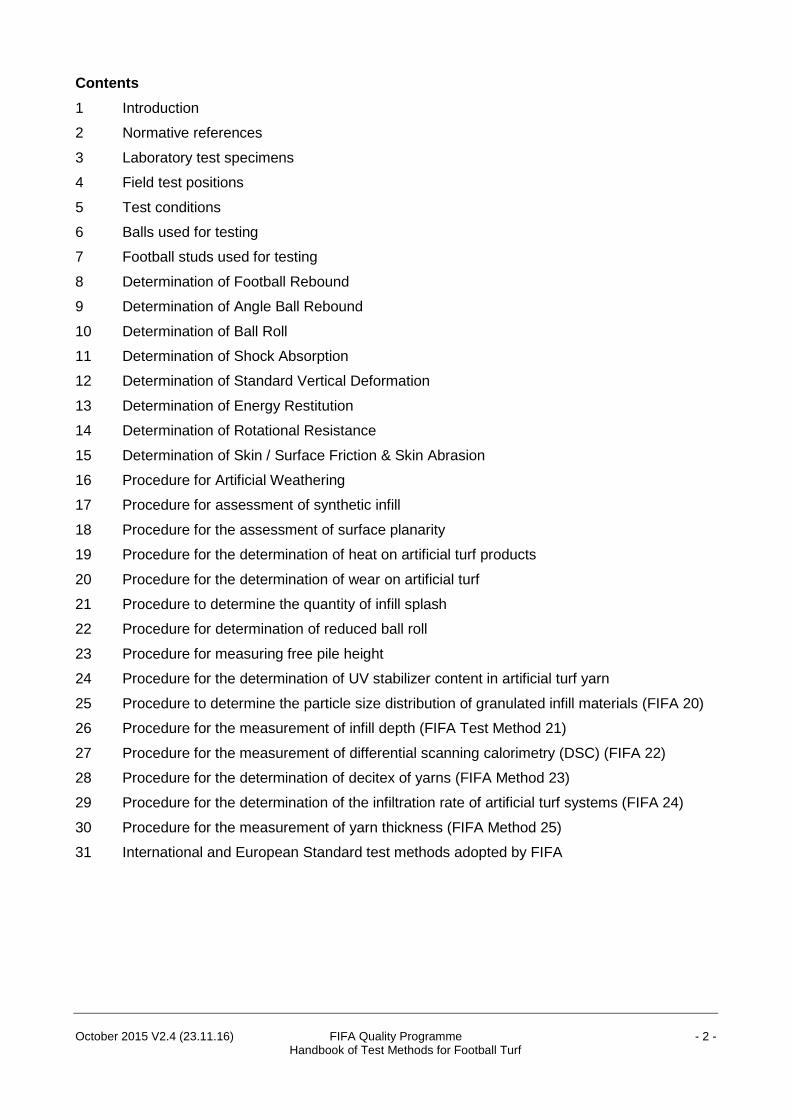
T0: time when the mass starts to fall T1: time when the test foot makes initial contact with the surface (corresponds with the maximum absolute value of the velocity of the falling mass Vmax*, see figure 7) T2: time of the maximum absolute velocity of the mass during its rebounds after the impact on the test specimen (determined by Vmin*, see figure 7) * Vmax and Vmin could be positive or negative values, depending on accelerometer set-up.
October 2015 V2.4 (23.11.16) FIFA Quality Programme - 18 -
Handbook of Test Methods for Football Turf
A mean of calculating the velocity and the displacement of the falling mass during its course by integration and double integration of the accelerometer signal (see figure 7).
Figure 7 – example of curve representing velocity of the falling mass versus time 11.2.8 Auxiliary equipment 11.2.8.1 Auxiliary equipment for tests at -5°C A conditioning cabinet capable of maintaining a temperature of -8°C to -12°C. A tray for test specimens with the following design specifications:
- Internal dimensions of at least 450 mm by 450 mm - Depth at least 10 mm higher than the test specimen thickness - Base of rigid mesh, to allow the free draining of water from the test specimens.
A temperature probe. 11.2.8.2 Auxiliary apparatus for tests at 50°C An air circulating oven compliant with ISO 188. A temperature probe. 11.3. Verification of the apparatus: falling mass impact velocity and lift height This verification is essential to ensure the correct functioning of the apparatus and has to be conducted: For lab tests: at regular interval of time, in accordance with the intensity of usage of the apparatus. The recommendation is one verification every day of testing. For field tests: before any on-site field testing. The verification procedure consists of four steps and must be carried out on a stable and rigid floor (floor with no significant deflection under a 5 kg/cm² pressure). Step 1
Set up the apparatus for a vertical free drop. Verticality tolerance: maximum 1° Set the height of the lower face of the test foot at 55.00 ± 0.25 mm above the rigid floor Dropped the mass on the concrete floor and record the acceleration of the falling mass
Step 2 Repeat Step 1 two more times, giving a total of three impacts.
Vmax
Vmin
TIME
VELOCITY
ContactPhase
Free DropPhase
T1 T2

October 2015 V2.4 (23.11.16) FIFA Quality Programme - 19 -
Handbook of Test Methods for Football Turf
Step 3 For each impact, integrate the acceleration signal from T0 to T1 and calculate the initial impact velocity. Calculate the mean impact velocity of the 3 impacts. The mean impact velocity shall be in the range of 1.02 m/s to 1.04 m/s.
Step 4 After verification of the impact velocity, place the falling mass on the rigid floor. Measure the height between a static reference point on the apparatus (for example the bottom base of the magnet) and the top of the falling mass. This height will be a reference and shall be used for all subsequent measurements; it is designated as the “lift height”.
11.4 Test procedure Set up the apparatus vertically (90° ± 1 degree) on the test specimen Lower the test foot smoothly onto the surface of the test specimen Within 10 seconds, set the reference “lift height” described on Step 4 of the verification of the apparatus and hang the falling mass on the magnet. First impact: After 30 (± 5) seconds (to allow the test specimen to relax after removal of the test mass) drop the mass and record the acceleration signal. Within 10 seconds after the impact, check the lift height and re-attached the mass on the magnet. Second impact: After 30 (± 5) seconds, drop the mass and record the acceleration signal. Within 10 seconds after the impact, check the lift height and re-attached the mass on the magnet. Third impact: After 30 (± 5) seconds, drop the mass and record the acceleration signal. Do not brush or adjust the surface in any way between impacts. 11.4.1 Shock absorption calculation Calculate the peak force (Fmax) at the impact with the following formula,
𝐹𝐹𝑚𝑚𝑚𝑚𝑚𝑚 = 𝑚𝑚 × 𝑔𝑔 × 𝐺𝐺𝑚𝑚𝑚𝑚𝑚𝑚 + 𝑚𝑚 × 𝑔𝑔 Where 𝐹𝐹𝑚𝑚𝑚𝑚𝑚𝑚 , is the peak force, expressed in Newton N 𝐺𝐺𝑚𝑚𝑚𝑚𝑚𝑚, is the peak acceleration during the impact, expressed in g (1 g = 9.81 m/s²) 𝑚𝑚, is the falling mass including spring, test foot and accelerometer, expressed in kg 𝑔𝑔, is the acceleration by gravity ( 9.81 m/s²) Calculate the Shock absorption (Fred) with the following formula,
𝑆𝑆𝑆𝑆 = �1 − 𝐹𝐹𝑚𝑚𝑚𝑚𝑚𝑚
𝐹𝐹𝑟𝑟𝑟𝑟𝑟𝑟� × 100
Where: SA, is the Shock Absorption in % 𝐹𝐹𝑚𝑚𝑚𝑚𝑚𝑚 , is the Force max measured on the sport surface, in N

October 2015 V2.4 (23.11.16) FIFA Quality Programme - 20 -
Handbook of Test Methods for Football Turf
𝐹𝐹𝑟𝑟𝑟𝑟𝑟𝑟 , is the reference force fixed to 6760 N (theoretical value calculated for a concrete floor) Expression of the results: Report the Shock Absorption value to the nearest 0.1%, e.g. 56.9%. 11.5 Laboratory tests The laboratory test floor must be a concrete floor with the following requirements:
- Thickness of minimum 10 cm - Concrete hardness of minimum 40 MPa, verified according to EN 12504-2 “Testing
concrete in structures – Part 2: Non-destructive testing – Determination of rebound number”.
11.5.1 Laboratory tests at 23 ± 2°C Make three impacts on the same spot of the test specimen according to Test Procedure 11.4. Do not brush or adjust the surface in any way between impacts. Repeat the procedure in three positions, each at least 100mm apart and at least 100mm from the sides of the test specimen. Calculate the mean value of Shock Absorption of the three positions. Undertake tests under dry and wet conditions, as appropriate. 11.5.2 Laboratory tests at -5°C Place the tests specimen in the sample tray and immerse in water to a depth of at least 10 mm above the top of the artificial turf pile. After a minimum of one hour, remove the tests specimen from the water and place it on a free draining base to allow it to drain by gravity for 30 ± 2 minutes. Place the test specimen and sample tray in a conditioning cabinet at a temperature of -8°C to -12°C. After 240 ± 5 min, remove the tests specimen and metal tray from the conditioning cabinet. Unless the test specimen includes an unbound mineral base, carefully remove it from the metal tray ensuring any infill materials are not disturbed. Place the test specimen on the test floor and allow it to warm. Monitor its temperature using a temperature probe inserted into the top of the performance infill on filled systems or on the top of the primary backing for non-filled systems. When the temperature gauge reads -5°C, make a measure of Shock Absorption (only one impact). Move the apparatus and repeat to obtain three results. The temperature of the test specimen shall not rise above -3°C during the test. Do not brush or adjust the surface in any way before impacts. Undertake tests under dry conditions only. Calculate the mean value of Shock Absorption (-5°C) of three initial impacts. Note: cooling a concrete slab in the freezer and using this as the test floor will extend the length of time available to undertake the tests. The concrete slab must be flat and not move during the tests. 11.5.3 Laboratory tests at 50°C Preheat the oven at a temperature of 50 °C + 2°C. Place the tests specimen inside the oven. Inside the oven, test specimen shall be stable, free from strain and exposed to air on all sides. After 240 ± 5 min, remove the test specimen from the oven and place it on the test floor. Determine the Shock Absorption, making three impacts on one location, according to test procedure 11.4. The temperature of the test specimen shall not fall below 48°C. Undertake tests under dry conditions only.

October 2015 V2.4 (23.11.16) FIFA Quality Programme - 21 -
Handbook of Test Methods for Football Turf
Calculate the Shock Absorption (50°C). If the result of this initial first position fails with requirement, repeat the procedure on two other locations, at least 100mm apart from each other and at least 100mm from the sides of the test specimen. Calculate the mean value of Shock Absorption (50°C) of the second and third impacts for each test position. If required calculate the mean value of the second and third impacts of Shock Absorption (50°C) of the three test positions. Note: heating a concrete slab in the oven and using this as the test floor will extend the length of time available to undertake the tests. The concrete slab must be flat and not move during the tests. 11.5.4 Laboratory tests after simulated mechanical abrasion during use Condition the test specimen in accordance with Section 20. Whenever possible, perform the tests with the test specimen inside the Lisport XL machine or carefully remove the test specimen from the Lisport XL machine and place it on the test floor. Determine the Shock Absorption of the test specimen in five positions. Each measurement shall be made on the fully conditioned area of the test specimen, at least 100mm from any edge and 150mm from any other test position. Undertake tests under dry conditions only. Calculate the mean value of Shock Absorption of the second and third impacts for each test position. Calculate the mean value of Shock Absorption (simulated use) from the five test position. 11.6 Field tests 11.6.1 Test conditions Tests shall be made under the meteorological conditions found at the time of test subject to the limits of Section 5.3. The conditions shall be reported. 11.6.2 Procedure Tests shall be made in the 19 test positions shown in Figure 4; 15 test Positions are fixed and shall be in the general positions shown. Positions – F, R, N and B may be in the positions shown or other locations selected at the discretion of the test institute. Bonded carpet joints should be avoided unless they are the cause of compliant or concern.

October 2015 V2.4 (23.11.16) FIFA Quality Programme - 22 -
Handbook of Test Methods for Football Turf
A M
SG
D
PJ
H
L
Q
O
K
C
E
I
NB
F R
Figure 8 – field test positions 11.6.3 Calculation of results Calculate the mean values (second and third impacts) of Shock Absorption for each test location.

October 2015 V2.4 (23.11.16) FIFA Quality Programme - 23 -
Handbook of Test Methods for Football Turf
12 Determination of Vertical Deformation (FIFA Test Method 05a) 12.1 Principle A mass with a spring attached to it is allowed to fall onto the test specimen. The acceleration of the mass is recorded, from the moment of its release until after its impact on the test specimen. The vertical deformation of the test specimen is calculated by the displacement of the falling mass into the test specimen after its impact on it. 12.2 Test Apparatus See description in 11.2 12.3. Verification of the apparatus See description in 11.3 12.4 Test procedure See description in 11.4 12.4.1 Calculation and expression of Vertical Deformation The displacement of the falling mass Dmass (t) is calculated by integration of V(t) on the interval [T1, T2]). Integration starts at (T1), the moment when the mass has reached its highest velocity. On the time interval [T1 - T2], the vertical deformation (VD) of the test specimen is defined as:
𝑽𝑽𝑽𝑽 = 𝑽𝑽𝒎𝒎𝒎𝒎𝒎𝒎𝒎𝒎 − 𝑽𝑽𝒎𝒎𝒔𝒔𝒔𝒔𝒔𝒔𝒔𝒔𝒔𝒔
Where: 𝐷𝐷𝑚𝑚𝑚𝑚𝑚𝑚𝑚𝑚 = ∬ 𝑔𝑔 𝐺𝐺 𝑑𝑑𝑑𝑑𝑇𝑇2
𝑇𝑇1 , 𝑤𝑤𝑤𝑤𝑑𝑑ℎ 𝐷𝐷𝑚𝑚𝑚𝑚𝑚𝑚𝑚𝑚 = 0 𝑚𝑚𝑚𝑚 𝑎𝑎𝑑𝑑 𝑇𝑇1
𝐷𝐷𝑚𝑚𝑠𝑠𝑟𝑟𝑠𝑠𝑠𝑠𝑠𝑠 =(𝑚𝑚 × 𝑔𝑔 × 𝐺𝐺𝑚𝑚𝑎𝑎𝑚𝑚)
𝐶𝐶𝑠𝑠𝑠𝑠𝑠𝑠𝑤𝑤𝑠𝑠𝑔𝑔
𝐹𝐹𝑚𝑚𝑚𝑚𝑚𝑚 is the peak force, expressed in Newton N 𝐺𝐺𝑚𝑚𝑚𝑚𝑚𝑚 is the peak acceleration during the impact, expressed in g (1 g = 9.81 m/s²) 𝑚𝑚 is the falling mass, including spring, base plate and accelerometer expressed in kg 𝑔𝑔 is the acceleration by gravity ( 9.81 m/s²) 𝐶𝐶𝑚𝑚𝑠𝑠𝑟𝑟𝑠𝑠𝑠𝑠𝑠𝑠 is the spring constant (given by the certificate of calibration)
Expression of the results: Vertical Deformation is reported to the nearest 0.5mm 12.5 Laboratory tests 12.5.1 Laboratory tests at 23 ±2°C The Vertical Deformation is calculated for the three positions tested for the Shock Absorption (see 11.5.1). Calculate the mean value of Vertical Deformation of the second and third impacts for each test position.

October 2015 V2.4 (23.11.16) FIFA Quality Programme - 24 -
Handbook of Test Methods for Football Turf
Calculate the mean value of the second and third impacts of Vertical Deformation of the three test positions. Undertake tests under dry and wet conditions, as appropriate. 12.5.2 Laboratory tests at -5°C The Vertical Deformation is calculated for the position tested for the Shock Absorption (see 11.5.2). Calculate the mean value of Vertical Deformation (-5°C) of the three first impacts. 12.5.3 Laboratory tests at 50°C The Vertical Deformation is calculated for the position tested for the Shock Absorption (see 11.5.3). Calculate the mean value of Vertical Deformation (50°C) of the second and third impacts for initial test position. If required calculate the mean value of the second and third impacts of Vertical Deformation (50°C) of the three test positions. 12.5.4 Laboratory tests after simulated mechanical abrasion during use The Vertical Deformation is calculated for the position tested for the Shock Absorption (see 11.5.4). Undertake tests under dry conditions only. Calculate the mean value of Vertical Deformation of the second and third impacts for each test position. Calculate the mean value of Vertical Deformation (simulated use) from the five test positions. 12.6 Field tests 12.6.1 Test conditions Tests shall be made under the meteorological conditions found at the time of test subject to the limits of Section 5.3. The conditions shall be reported. 12.6.2 Procedure The Vertical Deformation is calculated for the position tested for the Shock Absorption (see 11.6.2). 12.6.3 Calculation of results Calculate the mean values (second and third impacts) of Vertical Deformation for each test location.

October 2015 V2.4 (23.11.16) FIFA Quality Programme - 25 -
Handbook of Test Methods for Football Turf
13 Determination of Energy of Restitution (FIFA Test Method 13) 13.1 Principle A mass with a spring attached to it is allowed to fall onto the test specimen. The acceleration of the mass is recorded, from the moment of its release until after its impact on the test specimen. The energy of restitution is given by the comparison of energy of the falling mass before and after impact on the test specimen. 13.2 Test Apparatus See description in 11.2 13.3. Verification of the apparatus See description in 11.3 13.4 Test procedure See description 11.4 13.4.1 Calculation and expression of test results Calculate the energy restitution ER (%) defined by the formula:
ER = [E2/E1] x 100
Where: E1 is the energy before impact. E1 = 0.5 x mV2
max E2 is the energy after impact. E2 = 0.5 x mV2
min Vmax is the velocity before impact at T1 (see figure 7) in m/s Vmin is the velocity after impact at T2 (see figure 7) in m/s 𝑚𝑚, is the falling mass including spring, base plate and accelerometer, expressed in kg
13.5 Laboratory tests 13.5.1 Laboratory tests at 23 ±2°C The Energy Restitution is calculated for the three positions tested for the Shock Absorption (see 11.5.1). Undertake tests under dry and wet conditions, as appropriate. Calculate the mean value of Energy of Restitution of the second and third impacts for each test position. Calculate the mean value of Energy of Restitution of the three test positions. 13.5.2 Laboratory tests after simulated mechanical abrasion during use The Energy Restitution is calculated for the position tested for the Shock Absorption (see 11.5.4). Undertake tests under dry conditions only. Calculate the mean value of Energy of Restitution of the second and third impacts for each test position. Calculate the mean value of Energy of Restitution (simulated use) from the five test positions. 13.6 Field tests 13.6.1 Test conditions

October 2015 V2.4 (23.11.16) FIFA Quality Programme - 26 -
Handbook of Test Methods for Football Turf
Tests shall be made under the meteorological conditions found at the time of test subject to the limits of Section 5.3. The conditions shall be reported. 13.6.2 Procedure The Energy Restitution is calculated for the position tested for the Shock Absorption (see 11.6.2). 13.6.3 Calculation of results Calculate the mean values (second and third impacts) of Energy of Restitution for each test position.

October 2015 V2.4 (23.11.16) FIFA Quality Programme - 27 -
Handbook of Test Methods for Football Turf
14 Determination of Rotational Resistance (FIFA Test Method 06)
14.1 Principle
The torque required to rotate a loaded test foot in contact with the surface is measured and the rotational resistance calculated.
Laboratory tests are undertaken to assess the effects on this property of mechanical abrasion of the surface during use.
14.2 Test apparatus
The principle of the apparatus is shown in Figure 7. It consists of the following:
A test foot comprising a metal disc -150 ± 2 mm in diameter with six football studs equally spaced on the bottom surface each 46 +1 mm from the centre of the disc.
A shaft with attached lifting handles that are attached centrally to the centre of the studded disc.
A two-handled mechanical torque wrench with a scale of 0 to a minimum of 60Nm in maximum 2 Nm increments, which attaches to the top of the shaft.
Figure 9 - Rotational Resistance apparatus
A set of annular weights which rest centrally on the upper surface of the studded disc and are able to freely rotate. The total mass of the studded disc, weights and shaft shall be 46 ± 2 Kg.

October 2015 V2.4 (23.11.16) FIFA Quality Programme - 28 -
Handbook of Test Methods for Football Turf
Tri-pod and guide to minimise lateral movement of the test foot during tests. The tri-pod shall not restrict the free rotation of the shaft and the guide shall incorporate a means of dropping the weighted test foot onto the test specimen from a height of 60 + 5mm.
14.3 Test procedure
Before conducting each test ensure that the disc and studs are cleared of any in-fill/detritus.
Assemble the apparatus and ensure the free movement of the test foot. Remove the torque wrench and drop the weighed test foot from a height of 60 + 5mm onto the surface. Reattach the torque wrench.
Zero the torque wrench indicator needle.
Without placing any vertical pressure on the torque wrench and applying minimum rotational torque to the torque wrench, turn the wrench and test foot smoothly, without snatching, at a nominal speed of rotation of 12 rev/min until movement of the test foot occurs and it has rotated through at least 45º.
Record the maximum value displayed on the torque wrench to the nearest Nm.
14.4 Calculation & expression of results
Calculate the mean value of Rotational Resistance.
Report the mean result to the nearest 1Nm, e.g. 40Nm.
Quote the uncertainty of measurement as + 2Nm.
14.5 Laboratory tests
Determine the Rotational Resistance in five positions ensuring each test position is, at least 100mm (outside edge of test foot to outside edge) apart and at least 100mm (outside edge of test foot) from the sides of the test specimen. Calculate the mean from the five test positions.
Undertake tests under dry and wet conditions, as appropriate.
14.6 Laboratory test after simulated use
Whenever possible, perform the tests with the test specimen inside the Lisport XL machine or carefully remove the test specimen from the Lisport Wear machine and place on the test floor.Determine the Rotational Resistance of the test specimen in five positions. Each measurement shall be made on the fully conditioned area of the test specimen, at least 100mm from any edge and 150mm from any other test position. Calculate the mean from the five test positions.
14.7 Field tests
14.7.1 Test Conditions
Tests shall be made under the meteorological conditions found at the time of test subject to the limits of Section 5.3. The conditions shall be reported.
14.7.2 Procedure
At each test location make five individual measurements, each at least 100mm (outside edge of test foot to outside edge of test foot) apart.

October 2015 V2.4 (23.11.16) FIFA Quality Programme - 29 -
Handbook of Test Methods for Football Turf
15 Determination of Skin / Surface Friction (FIFA Test Method 08)
15.1 Principle
A rotating test foot on which a silicon skin is mounted is allowed to move across a test specimen in a circular motion and the coefficient of friction between the silicon skin and the test specimen calculated.
15.2 Apparatus
The test apparatus comprises: • Securisport ® Sports Surface Tester. • Test foot as detailed in Figure 14 • Silicon Skin L7350 supplied by Maag Technic AG, Sonnentalstrasse 8600
DUEBENDORF, Switzerland (Tel. +41 44 824 9191). • Water level • Polished steel test plate (0.2µm < Ra < 0.4µm).
15.3 Procedure
Caution: do not touch the silicon skin during the test. Determination of sliding distance force – new test skins Wash in water three silicon skin specimens each measuring 15cm by 8cm. Allow to air dry for 24 hours.
Attach a test skin to the test foot (glossy side exposed) using double sided adhesive tape and the clamping screws. Ensure the smooth surface of the silicon skin is the test face; the grooved side being attached to the test foot.
Test foot with clamping screws

October 2015 V2.4 (23.11.16) FIFA Quality Programme - 30 -
Handbook of Test Methods for Football Turf
Figure 10 - Test Foot

October 2015 V2.4 (23.11.16) FIFA Quality Programme - 31 -
Handbook of Test Methods for Football Turf
Clean the metal test plate with acetone and allow it to evaporate for at least 5 minutes.
Attach the draw strings to the mounting screws on the test foot and place the test foot (with silicon skin) onto the clean test plate and add additional mass to obtain a total mass of 1,700 ± 50g, ensuring the test foot remains stable on the test plate. Measure the force required to pull the silicon skin along the metal plate over a sliding distance of 100mm at a speed of 500 ± 10mm/min. Repeat the force measurement at least ten times.
Determine the average force over a sliding distance of 40mm and 80mm.
Calculate the average force (Fnew skin) of the ten measurements. Ensure the standard deviation is less than 0.3 and the average force is 6 ± 1.5N.
Repeat on two further samples of silicon skin.
Undertake the test under laboratory conditions of 23 + 2 °C.
Figure 11: Determination of sliding distance force
(note additional mass added to test foot) Determination of skin friction
Undertake the test under laboratory conditions of 23 + 2 °C.
Attach the test specimen to the laboratory floor to prevent movement during the test.
Attach the silicon skin to the test foot of the Securisport Sports Surface Tester using double sided adhesive tape and mount onto the apparatus. Adjust the test foot so it is positioned just above the test specimen.
Position the Securisport Sports Surface Tester over test specimen and adjust to level. Apply a vertical force to the test foot of 100N + 10 N and start the rotation of the test foot. Allow the test foot to make five complete revolutions at a speed of 40 + 1 rev/min; sampling at a minimum frequency of 40 Hz.
Ignoring any peak value occurring as the test foot starts to rotate calculate the mean coefficient of friction value as displayed on the Securisport.
Repeat the test three times, changing the synthetic skin and replacing any infill between tests.

October 2015 V2.4 (23.11.16) FIFA Quality Programme - 32 -
Handbook of Test Methods for Football Turf
Calculate and report the mean Coefficient of Friction of the three tests
Determination of skin abrasion
Carefully remove the test foot from the Securisport without touching the test skin. Remove any detritus from the test skin using compressed air. Place the test foot (with silicon skin) onto the clean metal plate and add an additional mass to obtain a total mass of 1,700 ± 50g.
Measure the force required to pull the silicon skin along the metal plate over a sliding distance of 100mm at a speed of 500 ± 10mm/min. Repeat the force measurement at least ten times.
Determine the average force over a sliding distance of 40mm and 80mm.
Calculate the skin abrasion using the following formula:
Skin abrasion = 100 x [Fnew skin - Fabraded skin ] / Fnew skin )
where:
F(new skin) = the mean average force of the second to fourth tests prior to the Skin Friction test
F(abraded skin) = the mean average force of the second to fourth tests after the Skin Friction test
Report the result to the nearest 1% e.g. 10%
Repeat the test three times.
Note: Values of uncertainty for this test have are yet to be established.

October 2015 V2.4 (23.11.16) FIFA Quality Programme - 33 -
Handbook of Test Methods for Football Turf
16 Procedure for Artificial Weathering (FIFA Test Method 10)
16.1 Principle
Test pieces of pile yarn and polymeric infill are exposed to artificial weathering by fluorescent UV lamps under controlled environmental conditions and the resulting changes in colour, appearance and selected physical properties are determined.
16.2 Apparatus Artificial weathering cabinet using fluorescent UV lamps and environmental controls having
the following features: a. UVA-340 nm lamps (Type 1A), in accordance with EN ISO 4892-3:2006 and with a
spectrum in accordance with EN ISO 4892-3:2006 and capable of uniformly applying radiation to the test specimen at an irradiance of 0.80 W/m2/nm at 340 nm.
b. Exposure chamber, constructed from inert material and that provides uniform irradiance
in accordance with item a) and that includes a means of controlling and measuring the relevant parameters.
c. Wetting mechanism, either condensation or water spray, to wet the exposed face of the
specimen, in accordance with EN ISO 4892-3:2006, For the humidity-condensing mechanism, the water vapour shall be generated by
heating water in a container located beneath and extending across the whole area occupied by the test pieces. Racks (completely filled with test pieces) shall constitute the sidewall of the exposure chamber, so that the backs of the test pieces are exposed to the cooling effect of the ambient air of the exposure chamber or ambient room air. The water being used for condensing or spraying shall conform to EN ISO 4892-3:2006.
In apparatus designed to wet the exposed faces of the specimens by means of a
humidity-condensing mechanism, the water vapour shall be generated by heating water in a container located beneath and extending across the whole area occupied by the specimens. Specimen holders (completely filled with specimens) shall constitute the sidewall of the exposure chamber, so that the backs of the specimens are exposed to the cooling effect of the ambient room air. If wetting is provided by spraying the specimens, the water shall conform to EN ISO 4892- 2:1999,
d. Radiometer, conforming to EN ISO 4892-1:2000, 5.1.7, to monitor irradiance and
radiant exposure. e. Black-panel thermometer, conforming to EN ISO 4892-1:2000. f. Specimen holders, made from inert materials that will not affect the results of the
exposure.
16.3 Exposure conditions
The exposure cycle shall comprise 240 + 4 min of dry UV exposure at a black-standard temperature of 55°C ± 3°C, followed by 120 + 2 min of condensation exposure, commencing once equilibrium has been attained, without radiation, at a black-standard temperature of 45°C ± 3°C.

October 2015 V2.4 (23.11.16) FIFA Quality Programme - 34 -
Handbook of Test Methods for Football Turf
16.4 Test specimens
For otherwise identical products3 with different yarn thicknesses, only the thinnest product needs to be tested. The results from this test can apply to the entire range of thicker products.
16.5 Procedure Wrap, without strain, a specimen of the yarn around the specimen holders so that the exposed stands do not overlap and mount in the test cabinet with the test surface facing the lamps. Fill any spaces, using blank panels, to ensure uniform exposure conditions.
Expose the specimen, measuring the irradiance and radiant exposure at the surface of the specimen. The exposure cycle shall comprise (240 ± 4) min of dry UV exposure at a black-panel temperature of (55 ± 3) °C, followed by (120 ± 2) min of condensation exposure, without radiation, at a black-panel temperature of (45 ± 3) °C. If sample wetting is by condensation, allow at least 120 min per interval to ensure attainment of equilibrium. This time does not form part of the exposure cycle. After an exposure of (9,600 ± 125) kJ/m2/340nm, carefully remove the specimen from the exposure cabinet and test as required by the product specification.
NOTE An exposure of (9600 ± 125) kJ/m2/340nm will require approximately 5000 h with cycling to
complete to moisture cycling.
16.6 Assessment of test specimens
16.6.1 Pile yarn(s)
Assess the change in colour of the exposed test specimen when compared to an unexposed test specimen using the grey scale in accordance with EN ISO 20105-A02.
Determine the tensile strength of exposed specimens of the pile yarn(s) in accordance with EN 13864 (minimum gauge length 100mm) and calculate the percentage change in tensile strength (in N) compared to test specimens of unexposed yarn.
16.6.2 Polymeric infill materials (rubbers, thermoplastics, etc)
Assess the change in colour of the exposed test specimen when compared to an unexposed test specimen using the grey scale in accordance with EN ISO 20105-A02.
Photograph specimens of exposed and unexposed polymeric infills to show any visual effects of the artificial weathering.
3 products with the same DSC trace (no more than ±3°C difference at the peak(s), the same percentage of UV stabiliser and the same cross-sectional shape.

October 2015 V2.4 (23.11.16) FIFA Quality Programme - 35 -
Handbook of Test Methods for Football Turf
17 Assessment of synthetic infill (FIFA Test Method 11)
17.1 Principle
Synthetic infill is analysed to determine the ratio of organic to inorganic material present. To take account of different types of materials used as performance infill, this test is divided into two procedures depending on the infill at hand.
17.2 Apparatus
17.2.1 Thermogravimetric Analyzer (TGA) which has the following features:
- Heating rate up to 40°C/min - nitrogen purge gas with a flow rate in the range 10ml/min to 50ml/min - the analyzer should be maintained and calibrated in accordance with the
manufacturer’s instructions 17.2.2 Analytical balance with accuracy of ±0.01mg 17.2.3 Nitrogen supply.
17.3 Conditioning of samples 17.3.1 Switch on apparatus and allow to equilibrate for at least 30 min 17.3.2 Use the same purge gas flow rate that was used to calibrate the instrument.
17.4 Procedure
17.4.1 Thermogravimetric Analysis (TGA) of SBR infill (from recycled tyres coated or uncoated) • Nitrogen purge gas flow rate within the range of 10 ml / min to 50 ml /min to be applied during
entire test • Sample weight should be between ≥40 mg and ≤ 100 mg • Heating programme:
o Heating from 50°C to 300°C with a heating rate of 15°C / min o Maintain the sample at 300°C for 8 minutes o Heating from 300°C to 650°C at a heating rate of 15°C / min o Heating from 650°C to 850°C at a heating rate of 25°C / min
17.4.2 TGA on EPDM, TPE and other polymer infill types • Nitrogen purge gas flow rate within the range of 10 ml / min to 50 ml /min to be applied during
entire test • Sample weight should be between ≥40 mg and ≤ 100 mg • Heating programme: 50°C to 850°C with a heating rate of 10°C / min
17.5 Assessment of test specimens
17.5.1 TGA on SBR infill
Measurement: • Organics: mass loss up to 650°C • Inorganics: 100% - % of organics

October 2015 V2.4 (23.11.16) FIFA Quality Programme - 36 -
Handbook of Test Methods for Football Turf
• Elastomers: mass loss between 300°C and 650°C
17.5.2 TGA on EPDM, TPE and other polymer infill types
Measurement: • Organics: mass loss up to 650°C • Inorganics: 100% - % of organics • Elastomers (for EPDM only): mass loss between beginning of second peak (usually
around 400°C) and 650°C
18 Procedure for the assessment of surface planarity (FIFA Method 12)
18.1 Principle
The evenness of the playing surface is measured with the aid of a straightedge pulled over the surface longitudinally and transversely between the play lines. Deviations beneath the straightedge are measured using a calibrated graduated wedge known as a slip gauge.
18.2 Apparatus
Straight edge design:
- Length 3000 ± 10 mm, Width 75mm ± 5 mm, Height 40mm ± 5 mm
- Minimum Weight 6.6 kg4
- Linearity of the straight edge : ± 2 mm
- Rigidity of the straight edge : 2 mm minimum
- Sliding side on the surface: 75 mm x 3000 mm
- A means to pull the straightedge along, typically a rope. This can be attached to the straightedge directly or passed through a hollow core in the straightedge. The length of the rope should be sufficient as to allow the technician to pull the straightedge in a straight line and observe the potential deviations under it. The technician shall be at a distance of a minimum of 3.0m and a maximum of 5.0m from the straightedge when pulling it.
Wedge (slip gauge) :
Length 250 ± 5 mm5, ,
Width 15 ± 2 mm.
4 The weight of the test device may need to be increased if the straight edge is not sitting on top of the infill due to resilient yarn. Add enough weight for the straight edge to be sitting on the top of the infill. 5 Where the 250mm wedge is too big, a small wedge or small ruler may be used to assess the deviation

October 2015 V2.4 (23.11.16) FIFA Quality Programme - 37 -
Handbook of Test Methods for Football Turf
Height ranges from 2 to 18mm
Angle of the wedge: 5 ± 1°
The slip gauge should be graduated on its upper surface at intervals corresponding to a 1.0mm increase in height.
18.3 Procedure
Starting from one of the corners with the centre of the straightedge on the centre of the touchline, the straightedge should be dragged across the playing surface parallel to the longitudinal lines.
The straightedge should be pulled along the surface at such a speed and without sudden movements to ensure that it remains in contact with the surface and does not bounce off the surface.
To ensure the playing surface is completely checked a minimum overlap of 0.5m between each successive pass is recommended. All deviations ≥ 10mm should be recorded on a site plan. It should be made clear whether the deviation is a high or low spot. Upon completion of the surface check parallel to the longitudinal lines the procedure should be repeated perpendicularly to the longitudinal lines. 18.4 Additional Remarks Other defects may present themselves including (but not exclusively) open seams, open play lines, differing fibre lengths et cetera. All such defects should also be recorded on the site plan.

October 2015 V2.4 (23.11.16) FIFA Quality Programme - 38 -
Handbook of Test Methods for Football Turf
19 Procedure for the determination of heat on artificial turf products (FIFA Test Method 14) 19.1 Principle A conditioned test specimen is exposed to surface infrared radiation. Over a period of three hours the gain in surface temperature and backing of the specimen is recorded by means of infrared pyrometer and K-type thermocouple respectively. The test is conducted in a partial enclosure to reduce the effects of cross wind. 19.2 Apparatus The primary components of the surface temperature apparatus are presented in diagramme 1 below, together with a list of the primary components.
19.2.1 Test Enclosure (1) Internal dimensions of length 1000mm, breadth 1000mm and height 1200mm constructed from a unpainted wood based material of thickness 15mm. All internal dimensions carry a tolerance of ±10mm. Three holes of diameter 60±5mm should be cut into each face of the enclosure at a height of 250±5mm from its base. Holes must be positioned on and 250±5mm either side of the centre of the enclosure panel. 19.2.2 Sample Container (2) Internal dimensions of length 500mm, breadth 500mm and height 350mm constructed from a unpainted wood based material of thickness 15mm. All dimensions carry a tolerance of ±5mm.
Diagramme 1: Sectional Schematic of Apparatus Arrangement

October 2015 V2.4 (23.11.16) FIFA Quality Programme - 39 -
Handbook of Test Methods for Football Turf
19.2.3 Infrared Lamp & Reflector (3) A square profile reflector of dimensions shown in diagramme 2.
Six bulbs are mounted in the positions shown in figure 2.0. Each bulb must have a rated output of 200W and of clear glass type. All bulbs should be replaced after 150 hours of operation. 19.2.4 Infrared Pyrometer An infrared pyrometer or similar equipment such as infrared camera which meets the following specification should be adopted:
- Minimum temperature range: 0 - 100°C - Accuracy: ±1°C or 1.5% (whichever is greater) - Resolution: 0.1°C - Response time: 1 second - Spectral response:8 - 14 um - Emissivity value: 95%
19.2.5 Thermocouple A thermocouple of the following specification:
- Minimum temperature range: 0 - 100°C - Sensitivity: 0.1°C - Type: K-Type - Resolution: 0.1°C
19.2.6 Luxmeter A luxmeter of the following or higher specification:
- Minimum measurement range: 0 – 1000lx
Diagramme 2: Lamp and Reflector Arrangement

October 2015 V2.4 (23.11.16) FIFA Quality Programme - 40 -
Handbook of Test Methods for Football Turf
- Resolution: 0.01lx - Accuracy: Class C in accordance to appendix B of EN13032-1
19.3 Sample preparation Condition all sample material for 24 hours at 23±2°C prior to testing, for sample containing organic infill material; refer to section 1.3.3 for specific requirements. 19.3.1 Stone Sub-base Preparation A sub-base of the following properties should be constructed within the sample container:
- Moisture content of 0% by oven drying the stone base - particles size of 0/40mm when tested in accordance to EN 933-1 - Layer thickness of 250mm ± 5 mm (approx 100kg of aggregate) - Stone should be manually compacted using a 10kg tamper - Level with 2kg of oven dried 0.4 - 0.8mm sand
19.3.2 Test Specimen preparation A suitably filled carpet sample of 500x500mm should be placed directly onto the levelled stone sub-base material within the sample container. Where samples require shockpads, the shockpad should be placed into the sample container prior to the carpet sample. The K-Type thermocouple should be attached by adhesive tape to the centre of the carpet backing in both samples with and without shockpads. 19.3.3 Organic Infill Material Organic infill material must be prepared and conditioned in the following stages:
- Organic infill must be oven dried to a moisture content of 0% - Dried infill should be placed in a moisture proof bag or other appropriate airtight
container and water added via mist spray to achieve the suppliers specified moisture content
- Moistened infill must be sealed and conditioned within its container for a period of 24 hours at 23±2°C
- Carpet sample should be filled immediately prior to testing to avoid loss of infill moisture
19.4 Procedure The test must be conducted at an ambient laboratory temperature of 23±2°C. Care should be taken not to conduct testing in close vicinity to sources of turbulent airflow such as doorways, air conditioning units, heavy machinery or windows. The sample container is placed in the centre of the test enclosure. The infrared reflector should be positioned centrally at a height of 675mm above the infill of the test specimen. The lamp must be positioned by means which does not significantly reduce airflow from the top of the test enclosure e.g. steel wire. Measurement of ambient air, specimen surface, carpet backing temperatures in addition to relative humidity should be recorded at the following time periods:

October 2015 V2.4 (23.11.16) FIFA Quality Programme - 41 -
Handbook of Test Methods for Football Turf
Phase Elapsed Time (min)
1
0 5
10 15 20
2
30 40 50 60
3
75 90 105 120 135 150 165 180
Three surface temperature measurements are recorded at each period taken from the central portion of the specimen surface. The IR pyrometer should be held at 500mm above the specimen surface when taking measurements. A measurement of the bulb Lux output should be measured after an elapsed time of 180 minutes. The luxmeter sensor should be positioned in the centre of the sample surface and a measurement recorded. Where the intensity of the light falling upon the surface falls out with (To be determined during current phase of testing), all bulbs must be replaced and any recorded data discarded. 19.5 Expression of results
19.5.1 Reporting Test report must include the following information:
-Maximum surface temperature reached and relevant categorisation -All temperature measurements of specimen surface, carpet backing and ambient air in addition to relative humidity in graphical and tabulated formats -Final lux measurement after 180 minutes elapsed time
19.5.2 Categorisation
Category Temperature Range °C
Category 1 <50
Category 1-2 50-54
Category 2 55-59
Category 2-3 60-65
Category 3 > 65

October 2015 V2.4 (23.11.16) FIFA Quality Programme - 42 -
Handbook of Test Methods for Football Turf
20 Procedure for the determination of wear on artificial turf (FIFA Test Method 15) 20.1 Principle A trolley with two rotating plates and two studded rollers moves back and forth along a test specimen of the Football Turf to replicate the mechanical wear of the synthetic turf and compaction of the infill observed in practice on synthetic turf playing surfaces. 20.2 Apparatus The Lisport XL shall comprise a trolley (or other means) containing two rotating plates on the x,y plane and two bladed rollers (rollers must be dragged by the trolley and not be motorised). The trolley traverses the test specimen with a velocity of 0.15m/s ±0.01.
Figure 12 – overview of Lisport XL machine
20.2.1 Rotating plates
Each rotating plate shall have mechanical degree of freedom �𝑇𝑇𝑚𝑚𝑇𝑇𝑇𝑇𝑇𝑇𝑇𝑇�
00𝑅𝑅𝑇𝑇� and the following
characteristics. The rotating plates shall be vertically independent of each other (see Figure 2 as an example) and be spaced (centres of each plate) from 250 to 350 mm apart6. Each rotating plate shall be fitted with a rectangular piece of rubber of 89x900 ±1mm (x,y) and have a circular-translation movement based on a radius of 10.0mm. ±0.25mm, with a rotational speed of 540 ±10rpm moving in the same direction but 180° out of phase. The rotating plates shall be designed to ensure a constant pressure of 30 ±1 g/cm² is applied over the whole test specimen. To ensure this, the 2 rotating plates shall:
• Be designed with one degree of freedom (Z axis), • Be independent of each other so that any vertical movement of one plate shall not
influence the vertical movement of the other plate, • Be free to move vertically till at least 10 mm above the level of the test specimen.
6 large range due to the 40 mm movement between the two plates and 60 mm tolerance for conception

October 2015 V2.4 (23.11.16) FIFA Quality Programme - 43 -
Handbook of Test Methods for Football Turf
Figure 13: configuration of machine
To avoid damage generated by the metal frame supporting the rubber sole, a 45°x10 mm chamfer shall be attached on the edge of the frame (see figure 3 as example)
Figure 14: rubber sole configuration
20.2.2 Rubber test sole
The wearing surface of each vibrating plate shall be Autosoler 6mm, Profile 26 Fine Crepe as supplied by Nora Systems GmbH; 2 -4 Höhnerweg, 69469 Weinheim, Germany www.nora-shoe.com. The test sole shall have a Shore hardness of 93 ± 2.
20.2.3 Bladed roller
Each Bladed roller shall comprise a metal cylinder measuring 955 ±10mm length with a diameter of 120 ±1mm fitted with a polyamide (PA 12) moulded profile of studs / blades as shown in Figure 4. The total weight of each roller shall be 95 ±5 kg. Note: in practice, it is recommended to manufacture the sleeve in two half cylinders which are then screwed on to the metal roller.
X

October 2015 V2.4 (23.11.16) FIFA Quality Programme - 44 -
Handbook of Test Methods for Football Turf
Overall view of bladed roller
Blade detail
Figure 15 – bladed roller (all dimensions have a tolerance of ± 5%)
Note: A digital 3D file suitable for the manufacturing of the roller sleeve is available from FIFA at [email protected]. A recommended way of manufacturing is with professional 3D printing method. The rollers shall be fitted adjacent to the vibrating plates within the trolley carriage. They shall be designed to roll in the direction of the Z-axis only to ensure the full weight of the roller applies to the specimen. The distance between each roller axis and the middle of each nearest vibrating plate shall be from 200 to 300 mm. The design of the machine shall ensure unrestricted rotation of the leading roller at the end of traverse of the test specimen to ensure the studs do not repeatedly impact the same position on the sample.

October 2015 V2.4 (23.11.16) FIFA Quality Programme - 45 -
Handbook of Test Methods for Football Turf
Note: The vibrating plates shall remain in contact with the test specimen at the end of each traversal.
20.3 Procedure 20.3.1 Test specimen The test specimen shall be fixed to the floor to ensure no movement during the wear simulation. Note 1: To minimise heterogeneous ageing it is recommended to put the sample on a floor with a maximum deviation under a 3.0m straightedge of 2.0mm Note 2: Double tape, flanges, etc… could be used to do so. It is necessary to seal perforation holes before filling-in the sample to avoid particle slippage (often sand) between the floor and the backing. The test specimen shall be fully representative of the Football Turf system as specified by the manufacturer. It shall include the specified performance and stabilising infill and where appropriate any shockpad or elastic layer. The dimensions of test specimen shall ensure a uniformly conditioned area of at least 2.5m by 0.9 m to allow the necessary performance measurements to be made. 20.3.2 Test base The test specimen shall be laid on a flat smooth rigid solid concrete floor with a minimum thickness of 100mm and a minimum stiffness of 40MPa when measured in accordance with EN 12504-2 Part 2. 20.3.3 Testing procedure 20.3.3.1 Preparation of the test specimen Check the condition of the studded rollers for signs of stud wear. If significant damage or burring of the stud profile is observed or if the height of at least ten studs is 14mm or less, replace the stud sleeve. Replace the rubber sole by a new one before each new sample. Test specimen preparation & pre-tests Within the Lisport XL build the test specimen strictly in accordance with the manufacturer’s instructions and EN 12229. Unless the performance infill is designed to have a specific moisture content (e.g. an organic infill) all FIFA product assessment tests shall be undertaken on a dry test specimen. Consolidate the infill with 5 conditioning cycles (one cycle comprises one pass up and down of the test specimen and undertake the initial performance tests. Check that the initial performance tests results correspond with the values normally associated with the system to be tested. Notes:

October 2015 V2.4 (23.11.16) FIFA Quality Programme - 46 -
Handbook of Test Methods for Football Turf
1 All other FIFA performance tests shall be made on separate tests specimens to eliminate the effects of wetting the test specimens; 2 If a manufacturer requires wet or damp tests to be made this shall be noted in the test report and the results shall not be used in any official FIFA test report. 3 All performance testing shall be carried out at least 250mm from the edge of the sample
20.3.3.2 Conditioning procedure 20.3.3.2.1 Undertake 500 cycles of continuous conditioning and stop. Maintain the tests specimen
using the procedure described in Clause 20.3.3.1 Repeat at 500-cycle continuous intervals until the specified number of cycles are complete. Carry out a final maintenance procedure (re-introduce the infill and ensure it is evenly distributed) and run for a further 5 cycles. Undertake the performance tests without any further maintenance on the test specimen.
20.3.3.2.2 For FIFA QUALITY PRO product assessment tests undertake a total of 3005 cycles as follows:
• 5 consolidation cycles prior to initial performance tests • to be conditioned at 500-cycle intervals • 5 cycles following surface maintenance after the final 500 cycles and prior to
performance tests • The surface shall be brushed sufficiently with a hand held broom to mimic the normal
maintenance that would have taken place.
20.3.3.2.3 For FIFA QUALITY product assessment tests undertake a total of 6005 cycles as follows:
• 5 consolidation prior to initial performance tests • to be conditioned at 500-cycle intervals • 5 cycles following surface maintenance after the final 500 cycles and prior to
performance tests • The surface shall be brushed sufficiently with a hand held broom to mimic the normal
maintenance that would have taken place. 20.3.4 Performance infill replacement
Using a vacuum cleaner collect any infill; material that has dislodged from the test specimen (see Figures 16 and 17). Re-fill the test specimen with material that has been dislodged from the test specimen.
Figure 16 – examples of infill dispersion and infill collection .

October 2015 V2.4 (23.11.16) FIFA Quality Programme - 47 -
Handbook of Test Methods for Football Turf
Figure 17 – examples of infill collection
Carefully replace on the conditioned area the infill material collected; ensuring a homogeneously distribution using an appropriate application device as showed in Figure 7.
Figure 18 – redistribution of dispersed infill

October 2015 V2.4 (23.11.16) FIFA Quality Programme - 48 -
Handbook of Test Methods for Football Turf
21 Procedure to determine the quantity of infill splash (FIFA Test Method 16) 21.1 Principle A high-speed camera is used to film the impact of a ball onto a test sample. The images of the surface interaction with the ball are then analysed as 2 colour images in high contrast where the infill appears on the image as black pixels against a completely white background. From this HD camera sized image (1280x1024) we can mathematically evaluate the density of infill splash as a percentage of black to white pixels. This method is designed to give a striking visual representation of splash, which can be assigned, to a mathematically calculated number in order to rank splash characteristics of turf. This allows both qualitative and quantitative data analysis. 21.2 Scope The current test method is considered a laboratory-based test. There is potential for providing splash testing as part of a field test programme. 21.3 Test Apparatus
- A Ball Cannon, used to project the ball at an angle of 45±2° onto test locations at a speed of 50±2 km/h. The cannon must not impart spin of greater than 3 Rev/s to be verified on the images of the high-speed camera.
- A High Speed Camera capable of recording images at 1280x1024 pixels at a minimum rate
of 300Hz. Attached to the camera sensor aperture shall be an optical lens which has a focal length of 50mm and F-stop range of minimum ƒ/1.4 – ƒ/16.
- A uniform light source that will provide strong white backlighting. The device must be
considered flicker free.
- FIFA approved football with pressure adjusted to ensure ball rebound of 1.35±0.02m on concrete when released from 2.00±0.01m
- Measuring device for distance to an accuracy of ±0.01m and angle to ±0.1°
- Ball speed as it leaves the cannon should be measured using the high-speed camera.
21.4 Test Specimens In order to conduct this test method 2 specimens of minimum dimensions 1x1m must be prepared and in-filled in accordance with EN 12229:2014. The test specimen must be filled evenly and adhere to a logical procedure to ensure repeatability of testing. Sample movement must be limited to ensure the prepared test specimen is not disturbed. To ensure the homogeneity of the test specimen during testing sample drainage holes must be sealed prior to adding infill material. 21.5 Apparatus Setup 21.5.1 Equipment Positions The ball cannon must be setup to ensure the ball impacts a specified location on the turf sample at an angle of 45±2°. The locations are specified in section 21.6.2.

October 2015 V2.4 (23.11.16) FIFA Quality Programme - 49 -
Handbook of Test Methods for Football Turf
The high-speed camera must be placed perpendicular to the direction the ball will strike the surface. The distance between the location being tested and the lens of the camera shall be 2.5 ± 0.01m. The camera may be moved if required to ensure the displaced infill plume is visible while ensuring that the specified distance and perpendicularity are not affected. An optional uniform light source is positioned facing the camera and provides a backlighting function. This may be required in certain lighting conditions to ensure a high contrast image.
Figure 19: pictoral representation of the setup The camera must be angled with the lens above horizontal at 5°±1° and the height off ground adjusted so that the bottom of the sample is visible but as large a splash window as possible is visible. 21.5.2 Calibration of Camera and Environment The camera should be set up so that on the 2-colour image the whole usable picture is white. Image cropping can be conducted to remove any dark areas on the image that are not due to splash. From this point, the camera focus, exposure and environmental lighting conditions should be adjusted to ensure that it would be possible to detect a black 1mm diameter dot on the 2 colour image but no smaller than a 0.5mm dot. The dot should be visible at the distance from camera to the centre of the sample where the impact will occur and should be detectable from all positions on the image during calibration. Note: Any dark points visible on the image will distort the results producing a higher infill splash percentage. 21.6 Test Procedure 21.6.1 Test Procedure for a Single Location
Cannon Light Box

October 2015 V2.4 (23.11.16) FIFA Quality Programme - 50 -
Handbook of Test Methods for Football Turf
Figure 20 - Images Recorded During Splash Test
The ball is projected onto the sample from the cannon and the impact on the surface is recorded using a high-speed camera. The full interaction from the point that the ball impacts the surface should be captured.
Figure 21: Raw Splash Image Figure 22: 2 Colour Splash Image
The frames are then transformed into 2 colour black and white images and cropped to ensure none of the yarn is included in the image. The percentage of black to white pixels in the image is calculated. [1] The highest “splash percentage” is then recorded as the test result. [1] NOTE: The standard image size is 1280x1024 for analysis. The splash percentage should always be calculated using a frame size of 1280x1024 even after cropping. This method assumes that any cropped area will automatically be white space. 21.6.2 Sample Test Location Plan and Test Directions 12 test locations are spread over a total of two 1x1m samples to complete a test. The test must be carried out in 2 directions on the sample:
- Direction 1 - Parallel and against the direction of tufting. - Direction 2 - Perpendicular to the direction of tufting.
6 locations will be tested for each direction to total 12 test locations overall. Avoid impacting the same position and do not test any area that has additional infill due to displacement during testing.
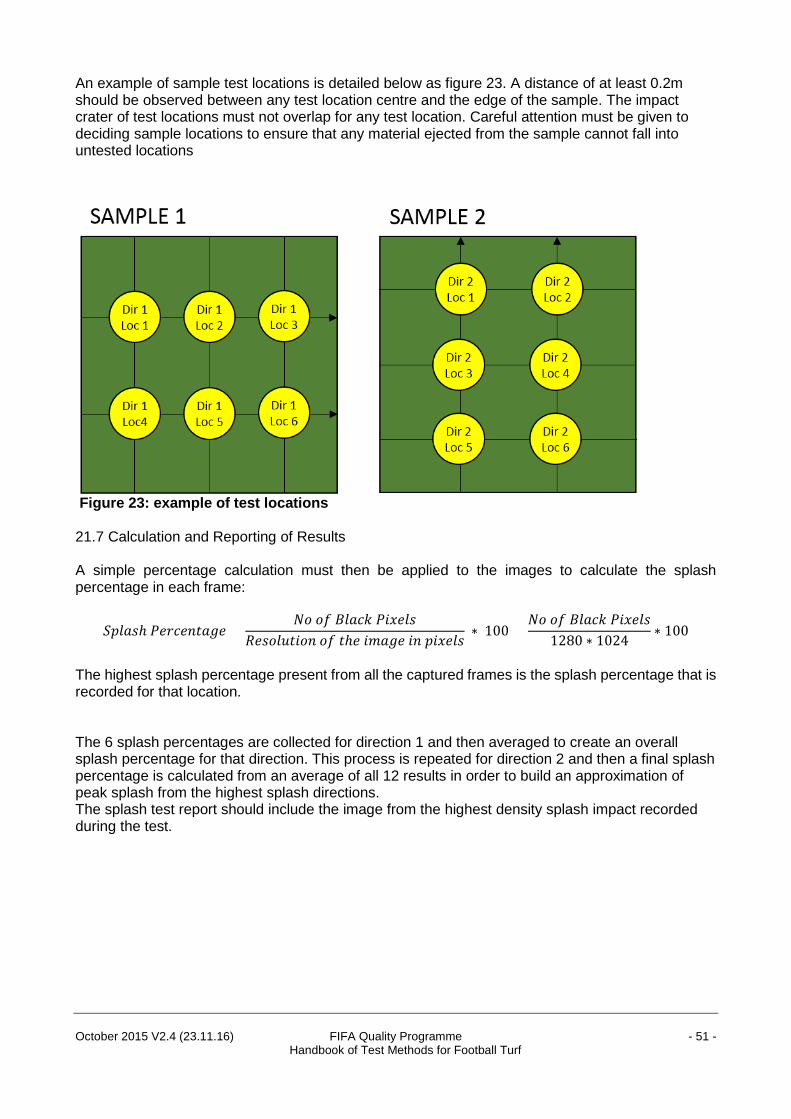
October 2015 V2.4 (23.11.16) FIFA Quality Programme - 51 -
Handbook of Test Methods for Football Turf
An example of sample test locations is detailed below as figure 23. A distance of at least 0.2m should be observed between any test location centre and the edge of the sample. The impact crater of test locations must not overlap for any test location. Careful attention must be given to deciding sample locations to ensure that any material ejected from the sample cannot fall into untested locations
Figure 23: example of test locations 21.7 Calculation and Reporting of Results A simple percentage calculation must then be applied to the images to calculate the splash percentage in each frame:
𝑆𝑆𝑠𝑠𝑆𝑆𝑎𝑎𝑠𝑠ℎ 𝑃𝑃𝑃𝑃𝑠𝑠𝑃𝑃𝑃𝑃𝑠𝑠𝑑𝑑𝑎𝑎𝑔𝑔𝑃𝑃 =𝑁𝑁𝑁𝑁 𝑁𝑁𝑜𝑜 𝐵𝐵𝑆𝑆𝑎𝑎𝑃𝑃𝐵𝐵 𝑃𝑃𝑤𝑤𝑚𝑚𝑃𝑃𝑆𝑆𝑠𝑠
𝑅𝑅𝑃𝑃𝑠𝑠𝑁𝑁𝑆𝑆𝑅𝑅𝑑𝑑𝑤𝑤𝑁𝑁𝑠𝑠 𝑁𝑁𝑜𝑜 𝑑𝑑ℎ𝑃𝑃 𝑤𝑤𝑚𝑚𝑎𝑎𝑔𝑔𝑃𝑃 𝑤𝑤𝑠𝑠 𝑠𝑠𝑤𝑤𝑚𝑚𝑃𝑃𝑆𝑆𝑠𝑠 ∗ 100 =
𝑁𝑁𝑁𝑁 𝑁𝑁𝑜𝑜 𝐵𝐵𝑆𝑆𝑎𝑎𝑃𝑃𝐵𝐵 𝑃𝑃𝑤𝑤𝑚𝑚𝑃𝑃𝑆𝑆𝑠𝑠(1280 ∗ 1024) ∗ 100
The highest splash percentage present from all the captured frames is the splash percentage that is recorded for that location. The 6 splash percentages are collected for direction 1 and then averaged to create an overall splash percentage for that direction. This process is repeated for direction 2 and then a final splash percentage is calculated from an average of all 12 results in order to build an approximation of peak splash from the highest splash directions. The splash test report should include the image from the highest density splash impact recorded during the test.

October 2015 V2.4 (23.11.16) FIFA Quality Programme - 52 -
Handbook of Test Methods for Football Turf
22 Procedure for determination of reduced ball roll (FIFA Test Method 17) 22.1 Principle A football is rolled from a ramp and travels through two sets of timing gates which calculate the ball speed over a known distance. Allowing the ball to roll from several different release heights ensures that the ball to surface interaction is assessed through all of the phases that would occur in a full length ball roll. From this a satisfactory representation of a full ball roll can be achieved. Using the two speeds and a known distance it is possible to calculate the deceleration of the ball and calculate at what distance the ball will come to rest. 22.2 Apparatus - Ball roll ramp as describen in section 10 (FIFA Test Method 03),
Figure 24 - Ball Roll Ramp
- FIFA approved football as defined in section 6. - Distance measuring device capable of measuring up to 1mm.with accuracy to ±1mm - Optically activated timing gate system accurate to a minimum of 1ms which will be triggered by the rolling ball travelling over a distance of 0.2±0.01m. Two sets of timing gates are required to calculate the ball speed between two points. - An indoor floor brush with soft bristles used to restore the surface pile at specified intervals during the test. 22.3 Procedure 22.3.1 Apparatus setup Position the ramp so that it is centred at one end of the test specimen ensuring the rails are parallel to the direction being tested. The end of the ramp curve should rest on the infill material, when using filled systems, or on the compressed thatch, when using unfilled systems, to ensure that the ball rolls smoothly from the ramp onto the test specimen. Set up the apparatus as shown in Figure 24.

October 2015 V2.4 (23.11.16) FIFA Quality Programme - 53 -
Handbook of Test Methods for Football Turf
Figure 25 - Ball Roll Ramp and Gate Positions
Timing gates consist of 2 sensors that activate a timer as the ball passes. These sensors are spaced 200±10mm apart. Measure the exact distance and take account of this measurement in the calculation of the results. The distance from the ball roll ramp, where the ball contacts the surface, to the centre of the first timing gate must be 1.0±0.01m. This is to ensure that the ball rolls smoothly along the surface before it passes the timing gates. The distance between the centres of timing gate 1 and timing gate 2 must be 1.5±0.01m. Four release heights should be selected on the ramp from which to release the ball as shown in Figure 3. Release height one should be the lowest height selected on the ball ramp. This should be adjusted to ensure the ball stops between 0.1m and 0.5m past the second timing gate. The final release height is the highest and should be the same as a full ball roll, 1.0±0.01m. The other two release heights are intermediate and should be evenly incremented between heights 1 and 4. Release heights are measured vertically as the distance from the lowest point on the ball, when placed on the ramp, to the infill level on the turf using the distance measuring device specified in 3.0. All release heights must be repeatable to ±0.01m.
Figure 26 - Ball Release Heights
22.3.2 Test specimens For conducting this test method a specimen of at least 3 x 1m must be prepared and in-filled, where appropriate, in accordance with EN 12229:2014.

October 2015 V2.4 (23.11.16) FIFA Quality Programme - 54 -
Handbook of Test Methods for Football Turf
22.3.3 Test procedure Figure 3 - Ball Release Heights Place the ball on the ramp at so that the lowest point of the ball is in contact with position 1 as defined in Figure 26. Release the ball and allow it to roll freely across the test specimen and through the timing gates using the optically activated timing gate system specified in 22.2. Record the initial speed, “vstart,” at timing gate 1 and the final speed of the ball, “vend,” as recorded by timing gate 2. vstart and vend are calculated using the relationship between speed, distance and time using tgate1 and tgate2.
𝑣𝑣=𝑠𝑠𝑠𝑠/𝑑𝑑 Equation 1 - Speed, Distance and Time Relationship
“Ss,” is defined as the exact distance, , between each timing sensor as measured. “t,” is the time taken for the front of the ball to traverse between timing sensor 1 and timing sensor 2(tgate1). The same calculation is conducted for vend using timing sensor 3 and timing sensor 4 (tgate2).
The process is then repeated twice more to give 3 sets of results for the ball release height. The surface shall be restored using a brush each time that 2 ball rolls have been conducted. The brushing is conducted as a drag motion and repeated only once at a walking pace. These steps should be repeated for all 4 release heights. 3 sets of vstart and vend must be collected for the first two lower release heights but only 2 sets of vstart and vend must be collected for the top two heights. 22.4 Calculation and expression of results By the end of the test method, 10 combinations of vstart and vend should have been collected for four different release heights. The first stage of the calculation is to determine the averages of vstart and vend for each height. This will leave 4 values of vstart and 4 for vend. Using the 4 combinations of starting and ending speeds it is possible to represent a relationship between vstart/vend as a second order polynomial equation which reflects the interaction between the ball and the surface over a variety of ball roll speeds. A second order polynomial for this relationship is as follows:
𝑣𝑣𝑃𝑃𝑠𝑠𝑑𝑑=𝑎𝑎(𝑣𝑣𝑠𝑠𝑑𝑑𝑎𝑎𝑠𝑠𝑑𝑑)^2+𝑏𝑏(𝑣𝑣𝑠𝑠𝑑𝑑𝑎𝑎𝑠𝑠𝑑𝑑)+𝑃𝑃 Equation 2 - 2nd Order Polynomial Equation Construction
Using this relationship and the average vstart from height 4 on the ramp, which is the release height for standard ball roll measurements, this equation can be used to estimate vend of the ball after 1.5m. The predicted vend value is then used as the value, vstart, for another iteration of this process. This process is repeated until:
𝑣𝑣𝑃𝑃𝑠𝑠𝑑𝑑≤0 To get the first part of the ball roll length: 𝑆𝑆𝑠𝑠=𝑁𝑁𝑅𝑅𝑚𝑚𝑏𝑏𝑃𝑃𝑠𝑠 𝑁𝑁𝑜𝑜 𝐼𝐼𝑑𝑑𝑃𝑃𝑠𝑠𝑎𝑎𝑑𝑑𝑤𝑤𝑁𝑁𝑠𝑠𝑠𝑠∗𝑆𝑆𝑔𝑔
Equation 3- Primary Ball Roll Calculation “Sp” is the distance the ball has travelled in the primary portion of the ball roll calculation.“Sg” is the distance measured between each set of timing gates and is defined in this method as 1.5m.”Number of Iterations” is the number of times the polynomial equation is repeated before the iteration where Vend ≤ 0. The second part of the ball roll length, or residual ball roll, is a calculation based on predicting the time taken for the ball to come to a complete stop from the vstart of the last iteration – where vend
becomes negative. To calculate this first calculate the deceleration of the ball through the second last iteration:
𝑎𝑎1=(𝑣𝑣𝑃𝑃𝑠𝑠𝑑𝑑^2− 𝑣𝑣𝑠𝑠𝑑𝑑𝑎𝑎𝑠𝑠𝑑𝑑^2)/2𝑆𝑆 Equation 4 - Kinematic Equation for Time Independent Acceleration
This deceleration value can then be used to predict the deceleration for the final phase of the ball roll until vend= 0 m/s. This equation is constructed using a1 and vstart from the final iteration of the

October 2015 V2.4 (23.11.16) FIFA Quality Programme - 55 -
Handbook of Test Methods for Football Turf
polynomial process where vend ≤ 0. Equation 5 can then be used to calculate the last portion of the ball roll distance, Sr, which occurs from the end of Sp until vend = 0 m/s where the ball would be at rest.
𝑆𝑆𝑠𝑠=−(𝑣𝑣𝑠𝑠𝑑𝑑𝑎𝑎𝑠𝑠𝑑𝑑)^2/2𝑎𝑎1 Equation 5 - Re-ordered Form of Equation 4 to Give Distance as the Subject
The predicted ball roll calculation, which is comparable to a standard full length ball roll, comprises:
𝑃𝑃𝑠𝑠𝑃𝑃𝑑𝑑𝑤𝑤𝑃𝑃𝑑𝑑𝑃𝑃𝑑𝑑 𝐵𝐵𝑎𝑎𝑆𝑆𝑆𝑆 𝑅𝑅𝑁𝑁𝑆𝑆𝑆𝑆=𝑆𝑆𝑤𝑤+𝑆𝑆𝑠𝑠+ 𝑆𝑆𝑠𝑠 Equation 6 - Predicted Ball Roll Calculation Using Results from Equations 3 & 5
“Si” is the distance specified between the end of the ramp and the middle of the first light gate (1.0m) Predicted ball roll results shall be reported for both test specimen directions. Each direction will be reported individually to a precision of 0.1m. 23 Procedure for measuring free pile height (FIFA Test Method 18) 23.1 Principle As a means of validation for laboratory and onsite testing to ensure that the free pile height is in line with the product declaration. If the free pile height is correct, this infers that the sum of the two infills is also correct (not necessarily the ratio). It also helps during retests to establish whether the infill levels are consistent with previous tests. 23.2 Apparatus A steel and glass prism frame of minimum 150 mm length; minimum 125 mm width; and minimum 70 mm height. The frame should contain a transparent prism with a mirrored bottom surface of reflective material which should be angled at 45 ± 0.2 degrees. A scale in ‘mm’ to a height of 40 ± 1 mm with a measuring resolution of 1 mm. 23.3 Procedure Place the prism gauge on the synthetic turf surface. Ensure the prism gauge is flat on the surface by means of a bubble/spirit level. Record the length of the 10 highest yarn fibres; repeat this procedure at 90° to the first test (For measurements on site alternate between longitudinal and cross pitch directions for each test position and calculate the median pile height in mm from the 10 highest yarn fibres at each position.). Calculate the median of the highest pile fibres in mm from the 20 highest yarn fibres. The measurement shall be carried out at the 19 test locations as set out in 11.6.2 for field tests and at 3 locations at least 100mm apart and a minimum of 100mm from the edge of an unworn sample.

October 2015 V2.4 (23.11.16) FIFA Quality Programme - 56 -
Handbook of Test Methods for Football Turf
24 Procedure for the determination of UV stabilizer content in artificial turf yarn (FIFA Test Method 19) 24.1 Principle Test pieces of pile yarn are exposed to infrared light and the change in absorbance is determined. 24.2 Apparatus
1. Fourier Transformed Infrared Reflection (FT-IR) apparatus equipped with an Attenuated Total Reflectance (ATR) unit
2. An air circulating oven conforming to ISO 188 3. Ultrasonic bath 4. Demi-water 5. Climatic room of 23+/-2°C and 50+/-5% RH
Conditioning of samples If samples are taken from the field, they have to stabilize in a climatic room during a minimum of 11 days at 23+/-2°C and 50+/-5% RH. 24.3 Procedure Remark: Clean the ATR crystal before every measurement according to the manufacturer’s guidelines! 24.3.1 Procedure for fresh samples 24.3.1.1 Identification of the peak Minimum 5 monofilaments or tapes are put in an oven at 105°C during 4h+/-15 minutes. Then the samples are cooled down in a desiccator for a minimum of 2h allowing them to reach room temperature. The “heated” samples are put on the ATR crystal of the FT-IR apparatus for 32 scans. The spectra are taken on 3 different positions along the fibre. A minimum of 5 original monofilaments or tapes are put on the ATR crystal for 32 scans and a minimum 3 spectra are taken. The averages of these spectra are compared to each other. The heat treatment produces a shift in the reaction of the UV stabilisers and this will be reflected in a shift of the peak of the UV- stabilisers. 24.3.1.2 Quantification of the peak A minimum of 5 monofilaments or tapes are put on the ATR crystal of the FT-IR apparatus. Every measurement consists of 32 scans. 8 different positions of the yarn are measured. The spectrum must be normalized at the carbon peak located at 2950 cm -1 for PE and the baseline correction needs to be done. The maximum height of the absorbance peak (determined in 24.3.1.2) is measured. If abnormal low values are measured, check if the sample holder of the ATR is completely filled with material. If this is the case, these measurements should be eliminated. The average of the 8 different positions are calculated. If the coefficient of variation (ratio of the standard deviation to the mean) of these 8 measurements is higher than 10%, 8 additional samples are measured.

October 2015 V2.4 (23.11.16) FIFA Quality Programme - 57 -
Handbook of Test Methods for Football Turf
The same measurements are done on the samples used for the UV test.
24.3.1.3 Calculation % original content of UV stabiliser = Absorbance of the sample *100
Absorbance of the UV samples 24.4 Cleaning of samples from the field.
Samples from the field contain traces of sand and rubber that need to be washed off. The yarn that was protected by the sand layer on the field is cut from the rest of the sample. These yarns are put in an Erlenmeyer with water. This Erlenmeyer is put in an ultrasonic bath during 15 minutes. After 15 minutes samples are taken out of the water with a tweezers and wiped off with soft paper. The measurement is done according to 24.3.1

October 2015 V2.4 (23.11.16) FIFA Quality Programme - 58 -
Handbook of Test Methods for Football Turf
25 Procedure to determine the particle size distribution of granulated infill materials (FIFA method 20) 25.1 Scope This procedure describes the method of test to determine the particle size distribution of granulated infill materials and to determine the consistency of samples in comparison to a manufacturer’s product declaration. 25.2 References EN 933-1 Test for geometrical properties of aggregates – Part 1: Determination of particle size distribution – sieving method. 25.3 Procedure Weigh a minimum of 300g of the granulated infill material and place on a clean tray in an oven at 105 ° C ± 5 ° C for 2 hours. Re-weigh the sample. If the weight has reduced by more than 1.0 ± 0.1g return it to the oven for a further 2 hours. Re-weigh the sample if the weight is consistent with the previous reading to within 1.0 ± 0.1g then remove it from the oven, if not repeat this procedure until the weight is consistent to 1.0 ± 0.1g. Remove the sample from the oven and allow to cool to room temperature (minimum period 1 hour). Determine the particle size distribution of the infill materials in accordance with EN 933-1 using the following sieves: 0.00mm, 200μm, 315μm, 0.5mm, 0.63mm, 0.80mm, 1.00mm, 1.25mm, 1.60mm, 2.00mm, 2.50mm, 3.15mm, and 4.00mm 25.4 Calculation of results Definitions d starting at the smallest sieve dtest is the largest sieve through which 10% or less of the
sample passes (i.e. between 0% and 10% of the sample is smaller than the sieve designated d)
D starting at the biggest sieve, Dtest is the smallest sieve on with 10% or less of the sample is retained (i.e. between 0% and 10% of the sample is bigger than the sieve designated D).
Plot the results on a graph and determine the values of dtest and Dtest for the sample. Calculate the percentage mass of the sample falling between dtest and Dtest when compared to the overall test sample mass. 25.5 Analysis of results Validation of the manufacturer’s declaration – Type Approval laboratory tests The Manufacture’s Declaration shall define the range intended to be encompassed by d and D. For a sample to comply with a Manufacturer’s Declaration the mesh size of the dtest and Dtest sieves shall be ± one sieve size of the declared dm and Dm values and at least 60% of the total infill sample shall be within the declared range, as illustrated in Figure 27.

October 2015 V2.4 (23.11.16) FIFA Quality Programme - 59 -
Handbook of Test Methods for Football Turf
Figure 27: example of particle distribution curve

October 2015 V2.4 (23.11.16) FIFA Quality Programme - 60 -
Handbook of Test Methods for Football Turf
26 Procedure for the measurement of infill depth (FIFA Test Method 21) 26.1 Scope This test method is based upon.EN 1969 with adaptation of the apparatus to cater for the soft nature of the surfacing of Football Turf in order to gain consistent, reproducible and repeatable results. 26.2 Apparatus Thickness measuring probe, this comprises a barrel with three flat-ended, steel probes, circular in section, approximately 2 mm in diameter, these probes are set in a triangular pattern with an approximate spacing of 15 mm to 20 mm apart, The probes shall be long enough that when driven into a surface under test the minimum depth of penetration from the upper surface of the material under test (infill) can be measured by means of the calibrated, graduated barrel capable of reading between 0 and 50mm in 1mm increments. The circular base plate should be a minimum of 25 mm in diameter in order to reduce the compression of the infill during measurement. 26.3 Testing Place the depth gauge on the surface of the Turf, ensuring that there are no extraneous items under the base plate. Extend the probes from the barrel, using hand pressure only; push the plunger down into the infill materials whilst supporting the gauge upright with your other hand. Continue to push the probes until resistance of the carpet backing material is felt, release the pressure on the plunger and check and slide the barrel gauge down onto the surface of the infill. Read the depth of penetration directly from the graduated scale, record this as the infill depth. The measurement shall be carried out at the 19 test locations as set out in 11.6.2.
Figure 28: infill depth gauge

October 2015 V2.4 (23.11.16) FIFA Quality Programme - 61 -
Handbook of Test Methods for Football Turf
27 Procedure for the measurement of differential scanning calorimetry (DSC) (FIFA Method 22) 27.1 Scope This procedure describes the method of test to determine the melting point(s) of a fibre in the Football turf and thereby determine the consistency of fibre(s) used. 27.2 References ISO 11357-3Plastics – Differential Scanning Calorimetry (DSC) Note: The fibres used in 3rd Generation surfaces are typically produced from either a single polymer or a blend of polymers. Single polymers generally will show a specific relatively narrow melting peak as in Figure 27.
Figure 29: example of DSC curve with single melting peak
Blends of polymers conversely will show a broad range of melting. Each individual component of the blend will have its own melting peak. These individual melting peaks will superimpose upon the other melting peaks present and where the melting peaks are close together will appear as a broader melting more diffuse melting peak as in Figure 28. If the melting peaks of a blend of polymers are more spaced then the peak will be broadened further or the peaks will either appear separately or a “shoulder” will appear on the overall melting peak.

October 2015 V2.4 (23.11.16) FIFA Quality Programme - 62 -
Handbook of Test Methods for Football Turf
Figure 30: DSC curve representing melting behaviour of fibre with a blend of polymers
The peak is clearly broader in Figure 28 and there is a shoulder approximately around 120ºC however the device has only measured a single peak at 111.23ºC. The following temperature programme is to be used for the measurement: 1. Equilibrate at 30.00°C 2. Heat at 20.00°C/min to 190.00°C 3. Isothermal for 5 min 4. Cool down at 20.00°C/min to 50.00°C 5. Isothermal for 5.00 min 6. Heat up at 20.00°C/min to 190.00°C 27.3 Results 27.3.1 Record the Melting Point(s) and Enthalpy of the second heating peak of the fibre . 27.3.2 Record the width of the peak, in ºC, at 50% of the peak height. If a shoulder is present its melting point should also be noted. Single polymers generally will show a specific relatively narrow melting peak as in Figure 27. There are also some fibres produced from a single polymer that has a broad molecular weight distribution which will produce a single broad peak.

October 2015 V2.4 (23.11.16) FIFA Quality Programme - 63 -
Handbook of Test Methods for Football Turf
28 Procedure for the determination of decitex of yarns (FIFA Method 23)
1 Principle
A yarn is analysed to determine the linear density Dtex.
2 Apparatus
2.1 Analytical balance with accuracy of ±1mg 2.2 Gauge with a reading of 1mm 2.3. Air circulating oven conforming to ISO 188 2.4. Tweezers
3 Conditioning of samples If samples are from a (wet) field, they should be dried in the oven at 70°C for 24h. Afterwards they have to be conditioned for minimum 24h at 23+/-2°C and 50+/-5% RH.
4 Procedure
4.1. General method Take out 20 complete tufts with tweezers from the back of the carpet. Scrape off any residue of latex (or coating) with the tweezers. Measure the length of each tuft to the nearest mm. Note down this length. Weigh the 20 cleaned tufts.
4.2. Special cases. In the cases where the coating or latex can’t be removed: Take 3 turf samples of min 200x200mm. Shave off the pile of each piece and measure the length of the piles that have been shaved off up to the nearest mm. Calculate the number of tufts according to ISO 8543.
5. Calculation of results
5.1. General method
Calculate the total length of the 20 tufts.
Dtex= weight of the 20 tufts (in g) . x 10,000,000 Total length of the 20 tufts (in mm)
5.2. Special method Dtex= pile weight of the 3 samples (in g) . x 10,000,000 number of tufts of the 3 samples*2* length of the pile (in mm)

October 2015 V2.4 (23.11.16) FIFA Quality Programme - 64 -
Handbook of Test Methods for Football Turf
29 Procedure for the determination of infiltration rate of artificial turf systems (FIFA Method 24) 29.1 Scope This test method is largely based upon EN 12616:2003 and has been adapted to suit the requirements of Football Turf. 29.2 Definition Porosity for the purposes of this test is defined as the infiltration rate of a material allowing water to pass through the system, measured over a period of time from the falling water head level. This can be measured as a component of a system or e.g. shock pad only or a carpet only or as a combined carpet, shock pad and infill system. 29.3 Apparatus
• A ring of metallic or plastic material with a known diameter of 300mm ± 2mm and a method of sealing this ring to a sample of pad and carpet (mechanically with a clamp or by use of silicon sealant or similar)
• A support grid for sitting beneath the sample to prevent deformation when water is applied to the ring, maximum deformation to be 5mm from the outside of the ring to the centre once water has been added to the ring. Within the ring this should be 3 horizontal wires or bars and a central bar at 90° to that of the other three. These should be 2.5 +/- 0.5mm in width to prevent obstruction of any porosity holes in the carpet.
• A thermometer or thermocouple capable of reading to 0.1°C • Stopwatch (accurate to 0.1s) • Spirit level
Figure 31: example of apparatus for porosity testing

October 2015 V2.4 (23.11.16) FIFA Quality Programme - 65 -
Handbook of Test Methods for Football Turf
29.4 Sample preparation
• Condition the test samples and any relevant infill in the laboratory at a temperature of 23 ± 2°C for a minimum period of 4 hours.
• Prepare a sample of shock pad and/or carpet, sealing it by either method in the ring; ensure that the minimum number of porosity holes are visible within the 300mm ring area. Measure the diameter and location of holes within the test piece and record/photograph for inclusion in report.
• Fill the carpet if required to the specified infill depths. Ensure that all fibres are showing and that there are no trapped fibres beneath the infill. Each layer should be compressed under self-weight utilising a round disc with a mass of 5.00kg ± 0.25kg, the disc should be rotated and contra rotated on the surface a minimum of 5 full rotations to ensure compaction and levelling of any carpet infill, no additional pressure should be added to the disc.
• If a mesh support is used, ensure that there is no sag in the sample that would induce an uneven head of water in the sample.
• Wetting of the test sample should be by the application of a minimum of 5 litres of water; this water should be applied through a disc of geotextile material or through a metal sieve with a mesh size no greater than 300 micron. Ensure that there is no leaking of water laterally from the ring. If there is then reseal the sample to correct this. The sample should be left to drain for a minimum of 30 minutes.
29.5 Procedure
• Ensure that the test rig is level prior to the start of the test • Distribute water evenly to the consolidated samples through the mesh or geotextile. The
head of water to be applied should be between 70-90mm above the infill or backing on the sample, whichever is highest. Time the fall in the head from 30-10mm above the infill or backing (i.e. a 20mm drop in head) record the time to the nearest 0.1 second, ensure that any geotextile is removed prior to the start of the timer. If through infiltration rate is slow then stop the test at 30 minutes.
• Repeat the test a further 2 times and average the last 2 results. 29.6 Calculation and expression of results

October 2015 V2.4 (23.11.16) FIFA Quality Programme - 66 -
Handbook of Test Methods for Football Turf
30 Procedure for the measurement of yarn thickness (FIFA Method 25) 30.1 Scope This method describes how to measure the thickness of a yarn including the shape identification through an image. 30.2 Apparatus 30.2.1 General Microscope with a capability of magnification in the range of 200x to 250x and able to measure the dimensions. 30.3 Samples From a minimum of 3 different tuft lines cut at least 3 fibres to be measured and photographed. When sampling from a spool, three pieces of fibre, must be measured and photographedat not less than 5 meters from each other. 30.4 Procedure Cut a piece of fibre around 50mm ±10mm long from the available length from within the carpet. Cool one end of the sample using an inverted compressed air bottle, and cut accurately the end using a sharp blade (preferably a scalpel) against an aluminum plate. The sample obtained will have a clean cut without burrs or distortion of the fibre.
Figure 32: sample preparation procedure
Using a support, holding the cut end in a vertical position perpendicular to the microscope verify that the cut is clean, and if necessary, depending on the colour of the fibre, use a insert different coloured background to maximize the definition of the image.

October 2015 V2.4 (23.11.16) FIFA Quality Programme - 67 -
Handbook of Test Methods for Football Turf
Figure 33: placement under the microscope
Adjust the magnification of the microscope in the range of 200x to 250x, and focus on the cut plane of the fibre after making sure they're in focus take the picture.
Figure 34: screen view of the sample under the microscope
Proceed now to the measurement of the following points. Using the measurement function of the microscope (line) 1) maximum width of the fibre; 2) maximum thickness of the fibre, referred to as the perpendicular of its width; 3) at least one reading intermediate between the centre and the extremity, on each side; Using the "circle" function of the microscope, inscribe where possible, in the areas of maximum thickness, the largest circle possible. The picture obtained will be included in the FIFA Laboratory Report with the following details:
• Length 15cm • Width 10cm • Resolution 100 dpi
30.5 Results Note the dimensions of the yarn from the three perspectives:
- Cross section - Width side A - Width side B
Where there are complex shapes, note the dimensions at several points as per the example below.

October 2015 V2.4 (23.11.16) FIFA Quality Programme - 68 -
Handbook of Test Methods for Football Turf
Figure 35: sample of thickness measurements

October 2015 V2.4 (23.11.16) FIFA Quality Programme - 69 -
Handbook of Test Methods for Football Turf
31 List of International and European Standard test methods adopted by FIFA In addition to the test methods described in this manual FIFA has adopted the following International and European Standards for measuring the material properties of football turf.
Particle size of unbound sub-bases EN 933 -1 Determination of particle size; sieving method
Bulk density of infill materials EN 1097 – 3
Tests for mechanical and physical properties of aggregates - Part 3: Determination of loose bulk density and voids
Thickness of shockpads and depth of infill layers
EN 1969
Surfaces for sports areas: Determination of thickness of synthetic sports surfaces
Joint strength of artificial turf EN 12228 Surfaces for sports areas - Determination of joint strength of synthetic surfaces
Tensile strength of shockpads EN 12230 Surfaces for sports areas: Determination of tensile properties of synthetic sports surfaces
Immersion in hot water EN 13744 Surfaces for sports areas: Procedure for accelerated ageing by immersion in hot water
Mass per unit area of artificial turf ISO 8543 Textile floor coverings: Methods for determination of mass
Tufts per unit area of artificial turfs ISO 1763 Carpets: Determination of number of tufts and or loops per unit length and per unit area
Pile length above backing of artificial turf ISO 2549 Hand knotted carpets: Determination
of tuft leg length above woven ground Mass per unit area of artificial turf and total pile weight ISO 8543 Textile floor coverings: Methods for
determination of mass
Tuft withdrawal force ISO 4919: Carpets: Determination of tuft withdrawal force
Particle shape of infill materials and unbound base materials EN 14955
Surfaces for sports areas: Determination of composition and particle shape of unbound mineral surfaces for outdoor sports areas