field study of soil compaction
TRANSCRIPT

Field Study of Soil Compaction DELON HAMPTON, Senior Research Engineer, and E. T. SELIG, Manager, Soil Mechanics , IIT Research Institute, Chicago
Full-scale field tests dealing with soil compaction for highway construction were undertaken to determine the following: (a) the desired characteristics of compacted soil, (b) how best to measure and specify the proper compaction, and (c) the effec tiveness of various methods of achieving compaction . The test variables included were type of soil or base course material, moisture content, lift thickness , type of compactor , compactive effort, and number of roller coverages. Measurements of the soil properties were made using a cone penetrometer, 6-in. bearing plate, CBR apparatus, seismograph, portable nuclear mois ture/ dens ity instrument, nuclear Road Logger and sand cone, together with conventional moisture content procedures. The experiments were divided into 6 sets, 3 for subgradc s oils and 3 for base cour s e materials, each incorporating some of the independent variables for different purposes. Statistical techniques were used for planning the experiments and analyzing the data. This paper describes the scope of the field tests, the plans and procedures and the type of information being obtained.
•IN 1964, the U. S. Bureau of Public Roads in conjunction with 14 states and Puerto Rico undertook sponsorship of a comprehensive study of soil compaction. The research comprised three parts. North Carolina State of the University of North Carolina at Raleigh was to evaluate the state of the art of compaction of s oil and r ock materials for highway purposes . The Ohio State University was to study fundamental properties of soils in the labor ator y, on a r heological basis , to dete r mine whal lhe basic pr operties of soils in relation to soil compaction are . The third part of the compaction triology was under taken by the IIT Resear ch Institute.
The obj ective of this s tudy wer e to determ ine (a) the desired haracteristics of compacted soil (b) how best to s pecify ru1d measure the proper compaction and (c) the effectiveness of various methods of ac hieving compac tion. The lest plan consisted of full-scale field tests using commercial compac tion equipment, l aboratory investiga tions of soil behavior, and analysis and experiments as required to interpre l the fie ld results and develop the theory.
The purpose of this report is to describe the fi ld tests so lhal the r eader can better understand and assesR the test results and conclusions from the study whic h are contained in two other papers published in this RECORD (1, 2) as well as those tha t may be published at a later date. Specifically, the paper describes the plans for the field tests , the factors considered in the design of the exper iments and the procectw·es fol lowed in conducting the tests.
The field tests were conducted from June through October 1965 at Hazelcrest, Illinois. From the outset, considerable effort {vas devoted to a comprehensive review of the field test plans. Although the test objectives were r easonably well established, the best plan for obtaining them was not easy to determine because many factors , both
Paper sponsored by Committee an Compaction and presented at the 46th Annual Meeting.
44

45
technical and nontechnical, had to be considered simultaneously. Each piece of compaction equipment and each soil has its own unique characteristics. The test plan had to accommodate these differences and still provide a valid comparison between the results for each set of variables. Bias, such as produced by weather and unknown factors influencing the results, had to be averaged out. The thousands of possible combinations of independent variables involved in the study had to be reduced by some rational process to an amount which could be handled within the time and iunds available. A tentative selection of the variables was made during contract negotiations to provide a starting point for the program. These were revised in light of further information gathered during the research. Pilot tests (3) to provide necessary information to facilitate proper planning of the main field test program were conducted at the Hazelcrest test site during the last two weeks of October 1964.
The general criteria for establishing the test plan were as follows:
1. Represent as broad a range of compaction equipment and soil conditions as pos-sible.
2. Select lift thickness to cover the range of principal interest , 6 to 18 in. 3. Provide a variation in moisture content from dry to wet of optimum. 4. Choose methods of measuring soil properties to be indicative of the various im
portant characteristics and at the same time be rapid and nondestructive, and have potential for use as construction control tests.
5. Consider methods of soil preparation. 6. Select the specific test variables to permit analysis of the results on a statistical
basis, taking into account the large variability anticipated in the field.
The detailed test plans were prepared after an analysis of the pilot test results, discussions with the project steering committees and a review of the overall research objectives. These plans are presented in this paper together with a brief description of the apparatus and procedures used.
EXPERIMENTAL PLAN
The basic independent variables considered for inclusion in the field test plan were (a) subgrade soil and base course material types, (b) moisture content, (c) compaction equipment type, (d) l evel of compactive effort, (e) number of roller coverages, (f) lift thickness, (g) characteristics of foundation beneath lift being compacted, and (h) method of soil preparation.
It was intended that the range of variables selected be as broad as possible to permit a comprehensive study of the problem of soil compaction. The tests were conducted in the field under as realistic conditions as possible to permit the most direct and immediate application of the results to construction practice. Selection and grouping of the major variables were based on a valid statistical plan to provide the most information for the number of tests possible within the available funds, recognizing that large variability should be expected in the field. To satisfy these conditions, it was decided that replicate tests should not be included and that the size of the experiment, i.e. , number of related tests, should be large enough to assure distinguishing real effects from random variations of the magnitude anticipated. The viewpoint was taken that a full factorial experiment would provide the best chance of success in interpreting the results.
A range of moisture content for each of the soils was considered essential for three principal reasons: (a) moisture content significantly influences soil properties, (b) optimum moisture content varies with compactive effort which is both different and unknown for each compactor, and (c) an understanding of field moisture-density relationships would be a significant aid in the accomplishment of the study objectives .
Compaction of subgrade soils most commonly involves multiple lifts. It is generally believed that during the compaction of the topmost lift the underlying lifts will also be affected and their properties in turn will influence the compaction of the topmost lift. However, even though these are important considerations, it was decided to eliminate them from the test plan in favor of other factors. This was done by constructing all
46
Name
Clay
Silty clay
Silty sand and gravel
Silt
Sand
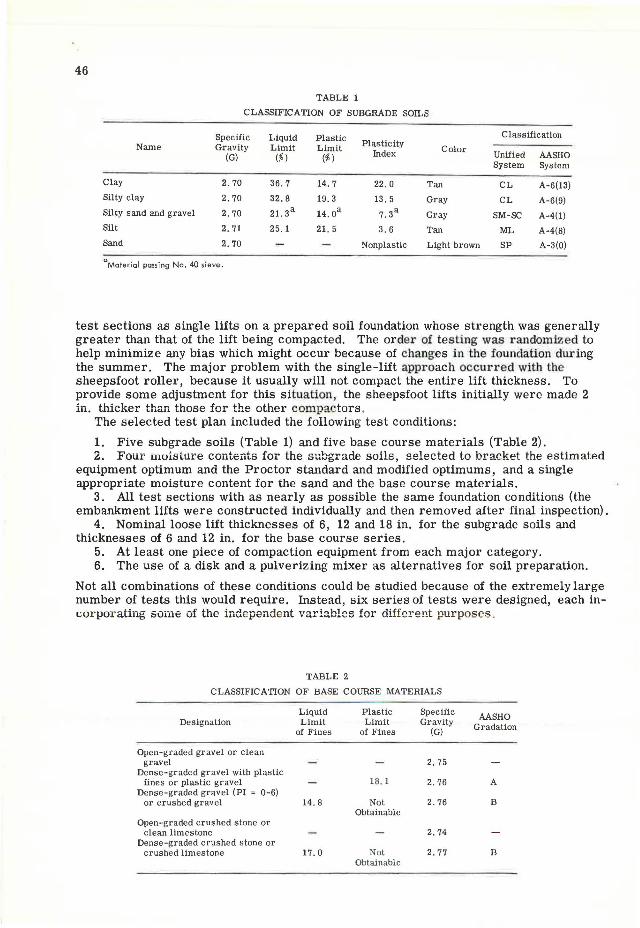
TABLE 1
CLASSIFICATION OF SUBGRADE SOILS
Specific Liquid Plastic Gravity Limit Limit Plastic ity
Color (G) (%) (%) Index
2.70 36 . 7 14. 7 22.0 Tan
2. 70 32 . 8 19 . 3 13. 5 Gray
2.70 21 . 3a 14.0a 7. 3a Gray
2.71 25. 1 21. 5 3. 6 Tan
2.70 Nonplastic Light brown
0Moterial passing No. 40 sieve.
Classification
Unified AASHO System System
CL A-6(13)
CL A-6(9)
SM-SC A-4(1)
ML A-4(8)
SP A-3(0)
test sections as single lifts on a prepared soil foundation whose strength was generally greater than that of the lift being compacted. The order of testing was randomized to help minimize any bias which might occur because of changes in the foundation during the summer. The major problem with the single-lift approach occurred with the sheepsfoot roller, because it usually will not compact the entire lift thickness. To provide some adjustment for this situation, the sheepsfoot lifts initially were made 2 in. thicker than those for the other compactors .
The selected test plan included the following test conditions:
1. Five subgrade soils (Table 1) and five base course materials (Table 2). 2. Four moisture contents for the subgrade soils, selected to bracket the estimated
equipment optimum and the Proctor standard and modified optimums, and a single appropriate moisture content for the sand and the base course materials.
3. All test sections with as nearly as possible the same foundation conditions (the embankment lifts were constructed individually and then removed after final inspection).
4. Nominal loose lift thicknesses of 6, 12 and 18 in. for the subgrade soils and thicknesses of 6 and 12 in. for the base course series.
5. At least one piece of compaction equipment from each major category. 6. The use of a disk and a pulverizing mixer as alternatives for soil preparation.
Not all combinations of these conditions could be studied because of the extremely large number of tests this would require. Instead, six series of tests were designed, each incur porating some of the independent variables fer different purposes .
TABLE 2
CLASSIFICATION OF BASE COURSE MATERIALS
Liquid Plastic Specific AASHO Designation Limit Limit Gravity Gradation of Fines of Fines (G)
Open-graded gravel or clean gravel 2.75
Dense-graded grave l with plastic fines or plastic gravel 18.1 2.76 A
Dense-graded gravel (PI = 0-6) or crushed gravel 14 . 8 Not 2. 76 B
Obtainable Open-graded c rushed stone or
clean limestone 2.74 Dense-graded crushed stone or
crushed limestone 17 . 0 Not 2 . 77 B Obtainable
47
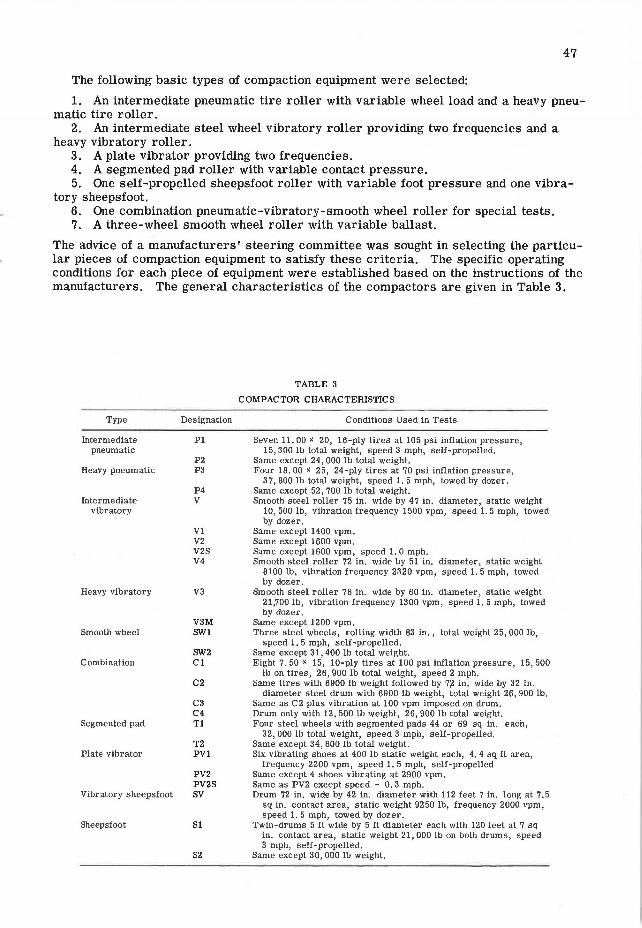
The following basic types of compaction equipment were selected:
1. An intermediate pneumatic tire roller with variable wheel load and a heavy pneumatic tire roller.
2. An intermediate steel wheel vibratory roller providing two frequencies and a heavy vibratory roller.
3. A plate vibrator providing two frequencies. 4. A segmented pad roller with variable contact pressure. 5. One self-propelled sheepsfoot roller with variable foot pressure and one vibra
tory sheepsfoot. 6. One combination pneumatic-vibratory-smooth wheel roller for special tests. 7. A three-wheel smooth wheel roller with variable ballast.
The advice of a manufacturers' steering committee was sought in selecting the particular pieces of compaction equipment to satisfy these criteria. The specific operating conditions for each piece of equipment were established based on the instructions of the manufacturers. The general characteristics of the compactors are given in Table 3.
Type Designation
Intermediate Pl pneumatic
P2 Heavy pneumatic P3
P4 Intermediate V
vibratory
Vl V2 V2S V4
Heavy vibratory V3
V3M Smooth wheel SWl
SW2 Combination C 1
C2
C3 C4
Segmented pad Tl
T2 Plate vibrator PVl
PV2 PV2S
Vibratory sheepsfoot SV
Sheepsfoot Sl
S2
TABLE 3
COMPACTOR CHARACTERISTICS
Conditions Used in Tests
Seven 11. 00 x 20, 16-ply tires at 105 psi inflation pressure, 15, 300 lb total weight, speed 3 mph, self-propelled.
Same except 24, 000 lb total weight. Four 18. 00 x 25, 24-ply tires at 70 psi inflation pressure,
37, 800 lb total weight, speed 1. 5 mph, towed by dozer. Same except 52, 700 lb total weight. Smooth steel roller 75 in. wide by 47 in. diameter, static weight
10, 500 lb, vibration frequency 1500 vpm, speed 1. 5 mph, towed by dozer.
Same except 1400 vpm. Same except 1600 vpm. Same except 1600 vpm, speed 1. 0 mph. Smooth steel roller 72 in. wide by 51 in. diameter, static weight
8100 lb, vibration frequency 2320 vpm, speed 1. 5 mph, towed by dozer.
Smooth steel roller 78 in. wide by 60 in. diameter, static weight 21,700 lb, vibration frequency 1300 vpm, speed 1. 5 mph, towed by dozer.
Same except 1200 vpm. Three steel wheels, rolling width 83 in., total weight 25, 000 lb,
speed 1. 5 mph, self-propelled. Same except 31, 400 lb total weight. Eight 7. 50 x 15, 10-ply tires at 100 psi inflation pressure, 15, 500
lb on tires, 26, 900 lb total weight, speed 2 mph. Same tires with 6900 lb weight followed by 7~ in. wide by 32 in.
diameter steel drum with 6900 lb weight, total weight 26, 900 lb. Same as C2 plus vibration at 100 vpm imposed on drum. Drum only with 12, 500 lb weight, 26, 900 lb total weight. Four steel wheels with segmented pads 44 or 69 sq in. each,
32, 000 lb total weight, speed 3 mph, self-propelled. Same except 34, 600 lb total weight. Six vibrating shoes at 400 lb static weight each, 4. 4 sq ft area,
frequency 2200 vpm, speed 1. 5 mph, self-propelled Same except 4 shoes vibrating at 2900 vpm. Same as PV2 except speed = 0. 3 mph. Drum 72 in. wide by 42 in. diameter with 112 feet 7 in. long at 7. 5
sq in. contact area, static weight 9250 lb, frequency 2000 vpm, speed 1. 5 mph, towed by dozer.
Twin-drums 5 ft wide by 5 ft diameter each with 120 feet at 7 sq in. contact area, static weight 21, 000 lb on both drums, speed 3 mph, self-propelled.
Same except 30, 000 lb weight.

48
The following types of measurement on the compacted materials were included:
1. Penetration resistance vs depth with cone penetrometer. 2. Deflection under load applied to 6-in. circular bearing plate. 3. California Bearing Ratio. 4. Moisture and density with portable backscatter nuclear instruments. 5. Moisture and density logs with a nuclear Road Logger. 6. Density with sand cone and moisture content using oven-dried samples. 7. Seismic velocity with seismograph. 8. Lift thickness before and after compaction.
In addition, measurements were made periodically on the foundation soils. Modified Proctor and CBR tests were made in the field on samples from each subgrade soil lift, and ambient temperature and humidity were recorded.
SUBGRADE SOILS
The combination of variables investigated in the subgrade soil tests is given in Table 4. These were accomplished in 3 test series for convenience. Since series 1 initiated the field test program, it served in part as a check on procedures before embarking on series 2, the main series of subgrade soil tests. Series 3, dealing only with sand, was conducted last. These tests provided 336 test sections to represent the soil types, lift thicknesses and compaction methods of Table 4, together with variation in moisture content, compactive effort and method of soil preparation.
For analysis the test sections were grouped in several ways. Series 2, the principal subgrade soil series, provided 256 test sections combining the following variahlPR:
1. Four soils-moderately plastic clay, silty clay, silty sand and gravel, and silt. 2. Lift thicknesses of 6 and 12 in. 3. Four moisture contents. 4. Four compactors-intermediate pneumatic, intermediate vibratory, segmented
pad and self-propelled sheepsfoot. 5. Two levels of compactive effort for each roller. 6. Soil preparation by pulverizing mixer.
This series resulted in a basic body of statistically meaningful data on which most of the analysis and evaluation of soil properties and measurement techniques for subgrade soils was based.
A second subset provided 36 test sections from series 1 and 2 combining (a) silty clay; (b) four moisture contents; (c) lift thickness of 12 in.; (d) nine different pieces of compaction equipment, each at a single level of effort (all equipment in Table 3 except plate vibrator); and (e) soil preparation by pulverizing mixer. This series permitted observing, for a single soil type and lift thickness , whether or not there would be any fundamental differences in conclusions for a wide range in type of compaction equipment.
A third subset of 24 test sections from series 1 provided information on methods of soil preparation by comparing the results using disking vs pulverizing mixer preparation for (a) heavy pneumatic roller on silty clay; (b) heavy vibratory roller on silty sand and gravel; (c) combination roller on silty clay; (d) lift thickness of 12 in. ; and (e) four moisture contents.
A fourth subset of 16 test sections from series 1 provided information on thick lifts by combining (a) lift thickness of 18 in.; (b) two rollers-heavy pneumatic and heavy vibratory; (c) two soils-silty clay, and silty sand and gravel; and (d) four moisture contents. Because the pulverizing mixer could not handle 18-in. lifts, preparation was accomplished by adding and disking three 6-in. thick layers of soil.
A fifth subset of 16 test sections from series 3 provided information on compaction of sand by combining lift thicknesses of 12 in. and 18 in. and eight pieces of compaction equipment (all in Table 3 except the two sheepsfoot rollers).

TABLE 4
SUBGRADE son. TESTS
Compaction Method Loose Lift
Soil Type Thickness Pneumatic Vibratory Segmented Plate Smooth
Sheepsfoot (in.) Combination
Pad Vibrator Wheel Inter. Heavy Inter . Heavy Vibr. Self-Prop.
Moderately plastic clay 6 G) C) C) C) 12 [!] 18
Silty clay 6 C) C) G) C) 12 ill ill [ill m ill 18 II] [!]
Silty sand and gravel 6 C) C) C) C) 12 []] 18 [TI [!]
Silt 6 C) C) C) C) 12 [!] 18
Sand 6
12 & & & & & & & & 18 & & & & & & & &
Note : Numbers indicate amount of test sections for each combination required by planned variation in moisture content, compactive effort and method of soil preparation.
0 Series l Q Series 2 6. Series 3
.i:. CD

50
Finally, some additional special tests from series 1 are included for general information. These were vibratory sheepsfoot on 12-in. lifts of three soils (clay, silty clay and silt) at four moisture contents.
BASE COURSE MATERIALS
The combinations of variables investigated in the tests on base course materials are given in Table 5. Ninety test sections are represented. Moisture content was not a control variable as in the subgrade soil tests. Instead, one replicate of each test section was provided at the moisture content existing in the materials as they were brought from the quarry stockpiles.
The tests were planned in 3 series (Table 5), but conducted simultaneously for convenience. The results are grouped into 3 subsets for purposes of analysis. The pr in -cipal one provides 64 single-moisture test sections from series 5 combining the following variables:
1. Two base course materials-dense-graded gravel and dense-graded crushed stone.
2. Lift thicknesses of 6 and 12 in. 3. Four compactors-intermediate pneumatic, intermediate vibratory, plate vibra
tor and smooth wheel. 4. Two levels of effort with each compactor. 5. One replicate of each set of conditions.
This series provides the basic body of data on which the analysis and evaluation of soil properties and test techniques for the base course series will be based.
A second subset of 16 test sections from series 5 and 6 provides a comparison across all equipment types for one soil type by combining (a) one material-densegraded cr ushed stone; (b) lift thickness of 6 in.; (c) all eight compactor s in Table 5; (d) one level of effort with each compactor; and (e) one replicate of each set of conditions.
The third subset consists of 30 test sections from series 4 and 5 to compare the re sults with all five base course materials by combining (a) all five materials in Table 5; (l::i) lift thickness of 6 in.; (c) three compactors-intermediate pneumatic, intermediate vibratory and plate vibrator; (d) one level of effort with each compactor; and (e) one replicate of each set of conditions.
TABLE 5
BASE COURSE TESTS
Compaction Method Loose Lift
Material Thickness Pneumatic Vibratory Segmented Plate Smooth (in.) Combination
Inter. Heavy Inter. Heavy Pad Vibrator Wheel
Open-graded gravel or 6 rn [fl [I] clean gravel 12
Dense-graded gravel 6 [fil ~ [I] with plastic fines or 12 plastic gravel
Dense-graded gravel 6 CD CD CD CD (PI = 0-6) or crushed 12 gravel
Open-graded crushed stone 6 rn 0 [TI or clean limestone 12
Dense-graded crushed 6 CD & CD & &i & CD CD stone or crushed 12 limestone
Note: Numbers indicate amount of test sections For each combination required by planned variation in compadive effort plus one replication of conditions.
0 Series 4 Q Series 5 6. Series 6

51
SEQUENCE OF OPERATIONS
A complete review of the sequence of operations employed in all 6 test series is beyond the scope of this paper. However, to provide insight into the order and coordination of tests, the procedures used during test series 2 (the main series) are outlined. In this series each individual lift was 160 ft long by 15 ft wide and divided into 4 equal test sections oriented end-to-end, each with a different moisture content (Fig. 1). Location flags were used to mark the position at which measurements were to be taken.
The pulverizing mixer was used for all soil processing to provide uniform distribution of moisture and to avoid undesirable density gradients in the loose lift material. Immediately prior to initiating compaction, moisture samples were taken from one location in each test section, with one 300-gram sample taken for each 3 in. of lift thickness. Simultaneously, two 1-gal cans of soil were taken from the same location in each section for modified Proctor compaction tests and unsoaked CBR tests. The tests were carried out during the time the lift was being compacted and tested. In addition, approximately 6 gal of soil were taken randomly along the lift and stored in 50 gal drums to acquire during the test program a large sample of material representative of each stockpile.
Two coverages, usually consisting of single passes, were then made with the selected compactor. At the completion of the second coverage, measurements were made with the portable nuclear, Road Logger, seismic, penetrometer and plate apparatus. With the exception of the Road Logger, all measurements were made once in each test section at the same predetermined random location. The Road Logger made one pass along the length of the lift within the compacted width. Two more coverages were then made with the compactor and the testing process repeated at a new random location. The remaining sets of measurements were made after 8 and 16 coverages.
On completion of the growth measurements after the 16th coverage, lift thickness measurements were taken. Then the lift was stripped down approximately 2 in. for a
TEST SECTIONS
(15by47-S)
3
MEASUREMENT LOCATIONS ( 10 PER SECTION)
Figure 1. Lift layout with four test sections.

52
6-in. lift or 5 in. for a 12-in. lift and additional thickness measurements made. In general, the stripping operation was completed in about 20 min.
Final inspection tests were then performed. These included all previous measurements, and in addition, CBR tests in each test section, sand cone tests in sections 1 and 2 and moisture content determinations in each test section. The sand cone tests and moisture samples were taken at the exact location at which the final hand nuclear measurements were made. After these tests were completed, the remainder of the lift was removed and the test area prepared for another lift.
Approximately 25 to 30 min were required for each set of growth measurements, and about 45 min for final inspection measurements. Compaction and stripping time consumed approximately 50 min. Total time required for a test totaled approximately 3% hr. Instrument and equipment malfunctions and inclement weather frequently increased the required time.
PREPARATION PHASES
Test Area
Preparation of the test site was started in September 1964 prior to the pilot studies. The area was cleared and graded and the 5-acre portion to be used for the test sections was inspected for suitability as a foundation for the compacted lifts. Pockets of unsatisfactory soil were removed and replaced with a moderately plastic clay so that the entire 5 acres would be relatively uniform in composition.
The clay, silty clay, and silty sand and gravel used in the tests (Table 1) were obtained from selected borrow pits at the test site. About 3000 cu yd of each of these materials were stockpiled on the site and then mixed by a bulldozer to insure homogeneity. The silt was hauled to the site from a location about 10 miles away. It was also mixed by a bulldozer. The sand was obtained from a location near Lake Michigan. It was very uniform and required no further processing.
The base course materials were hauled to the site from quarries in Thornton and Joliet, Illinois, and wer e deposited directly in the test areas as required for compac tion. It was felt that the quarry control would be sufficient to assure adequate uniform -ity between test sections.
At the completion of site preparation, eight 30 by 120-ft test areas were laid out side by side. Soil within these areas was compacted by 18 coverages with a selfpropelled sheepsfoot roller followed by 2 coverages with a 50-ton pneumatic roller. Each of the 8 test areas was then divided into four 30 by 30- ft test sections. This arrangement was made to provide up to four different moisture contents in each lift with the same soil. By putting all four levels of moisture in a single lift for the subgrade soil tests, moisture increments could be more precisely controlled. After subgrade soil series 1, the test sections were extended in length to 40 ft and reduced in width to 20 ft. This provided a more suitable layout for preparing and compacting the soil.
Measurements of penetration resistance, bearing plate, and CBR were then made in each test area to obtain quantitative measures of the foundation conditions. These measurements were repeated periodically to determine variations in conditions. After a general increase in penetration resistance in all sections for the first month, fairly uniform results were obtained thereafter.
Subgrade Soil Processing
It was desired that the stockpiled soils be uniformly dried to a moisture content equal to or less than the lowest of the four preselected test values for each lift before placing them in a test area. Drying was best accomplished at the stockpile, but some drying had to be accomplished after the soil was placed in the test area. In addition, a compromise had to be found between the amount of time which could be devoted to drying the soil and the minimum moisture content acceptable. In general, the minimum moisture content tested was 2 to 3 percent higher than lhe prel:ielected desfred

53
TABLE 6
RELATIONSHIP BETWEEN son. TYPE AND MOISTURE CONTENT
Range from Nominal Moisture Content Moisture
Soil Type T-99 to T-180 (%) Increment Optimum Moisture
(%) (%) 2 4
Clay 10-16 8 11 14 17
Silty clay 9-1 3 7 9 11 13 2 Silty sand and gravel 7-10 5 7 9 11 2 Silt 11-13 7 9 11 13 2
mm1mum. This was considered acceptable, since the optimum moisture content for each compactive effort would still not be generally exceeded.
Prior to placing the soil in the test areas, elevation marks were placed on the grade stakes defining the corners of each test section. Reference elevation marks were obtained by means of a stringline stretched across the section between stakes and adjusted to an average height of 6 in. greater than the planned lift thickness. This was a rapid and accurate method of setting elevation guide marks.
Soil was transported from the stockpile to the test areas with a self-loading scraper. For test series 1 the scraper laid the soil in two parallel strips. The motor grader then spread the soil to the proper width and leveled the surface. Additional soil was placed, spread, and leveled until the desired loose thickness was obtained over a width sufficient to accommodate at least two adjacent nonoverlapping passes with the particular compactor being tested, allowing a minimum of 2 ft of shoulder on each side. The scraper and grader operators were instructed to follow the same wheel paths when traversing the lift each time to avoid compacting the material in the areas where the test measurements were to be made. This was particularly important in spreading the second and third layers of the 12- and 18-in. lifts when prepared with the disk.
For series 2 the soil was deposited in a single lane by the scraper and spread to a width of 12 to 15 ft by the motor grader. After a sufficient amount of soil had been deposited, stringline measurements were made and the final grading carried out to provide the desired lift thickness. Enough additional soil was placed at the ends of each lift to provide 10- to 15-ft long ramps.
After arriving at estimates of initial moisture content and wet density, the number of cubic feet of water to be added to each test section was calculated. The selected nominal moisture contents for each soil were as shown in Table 6. The moisture order assigned each section within a lift varied randomly as prescribed by the statistical plan instead of increasing monotonically from one end of the lift to the other .
Three techniques were used for mixing the water and soil: (a) surface sprinkling followed by a towed disk, (b) s urface s prinkling followed by a pulveriz ing mixer , and (c) direct addition of water during pr ocessing by a pulverizing mixer . Sprinkling and disking was found to be unsatisfactory for mixing water into the more cohesive soils due to the immobilization of the disks because of clogging by soil and the tendency, in the wetter sections , for soil to be transported from one test section to another. Sprinkling and pulverization proved to be the most advantageous so it was used for most of the subgrade soils. Direct addition of water during pulverization, though most desirable, could not be satisfactorily accomplished because of a varie~y of difficulties with the water dispensing system on the mixer .
SOIL TESTING INSTRUMENTS
The instruments used for measuring soil properties are briefly described here; additional details are given elsewhere (_!:., ~, !, ~.

54
Figure 2. Penetrometer apparatus. Figure 3. Bearing plate apparatus.
Penetrometer
The field penetration apparatus was designed to measure and record continuously the penetration resistance vs depth (Fig. 2). The penetrometer used was the standard Corps of Engineers 30 deg (included angle) cone with a 7'2-sq in. base area. The rate of penetration was maintained at a constant value of 2 in. I sec by the hydraulic control system. The maximum depth of penetration was 15 in. No preparation of the soil was required and the total measurement time was less than 1 min.
Bearing Plate
A rapidly loaded 6-in. diameter plate (Fig. 3) was developed in which load could be automatically applied and removed at a controlled rate of 500 lb/ sec, and a continuous record of load vs deformation obtained. A maximum load of 4500 lb was provided using the weight of the test vehicle as a reaction. If a sinkage of 1 in. was developed the load cycle was automatically terminated. Prior to the test, uncompacted soil had to be removed and the surface smoothed. Displacement was referenced to the soil surface by a special mechanism.
Field CBR Test
The CBR apparatus (Fig. 4) included a piston, surcharge weights, and a loading device. The piston was 5 in. long and had an end area of 3 sq in. (diameter of 1. 95 in.). A 6-in. diameter plate was fixed to the top end of the penetration piston to permit it to be clamped to the bearing plate apparatus.
Three annular steel rings were used to produce the same surcharge pressure as the 20-lb weight for the laboratory CBR test specimens. The loading device consisted of a hand pump connected into the hydraulic system. This pump allowed load to be applied at slower rates than provided by the automatic control system of the bearing plate.

Figure 4. Field CBR apparatus.
Figure 5. Portable nuclear moisture/ density apparatus.
Portable Nuclear Moisture/Density Instruments
Two model 5901 d/M combination backscatter moisture-density gages (Fig. 5)
55
were furnished for use on the compaction field studies by the Nuclear Chicago Corp. This gage has a single 4-mc radium beryllium source which emits both gamma rays and neutron radiation permitting measurement of both moisture and density. A twoposition switch on the gage housing provides for selection of either moisture or density measurement.
A series of tests was conducted in the laboratory prior to entering the field for the purpose of becoming familiar with the characteristics of the instrument, and for establishing calibration curves for the soils used in the study. The calibration curves were checked against those provided by the manufacturer, and where significant differences existed the calibration curves developed in the laboratory took precedence.
Standard blocks of material were used to provide reference measurements of wet density and moisture density (moisture content in lb/ cu ft), and to provide a continuous check on the operation of the gage and scaler. The gage seating technique used a cushion of dry sand following the removal of loose soil and trimming of the surface. Three 1-min readings were then obtained on the lift for both moisture and wet density and divided by the average of respective sets of reference counts taken before and after the measurements on the soil. The moisture density and wet density were determined from the count ratio by using the appropriate calibration curve.
Nuclear Road Logger
The Road Logger (Fig. 6) is a specially designed vehicle manufactured by LaneWells Co. that is equipped to record the wet density and moisture density of the material over which it is driven. Either stationary or continuous moving logs at driving speeds up to 3 mph may be obtained. Measurements are recorded on a strip chart presenting direct reading of wet density and moisture density vs distance of travel.
The moisture density and wet density measuring systems are mounted on two-wheel carriages which rest on the ground surface when logging in order to minimize the variations of surface roughness. The system investigates a single track along the ground surface approximately 12 in. wide. Material to a depth of approximately 8 in. influences the reading, but the measurement is highly weighted toward the surface since the influence of soil diminishes exponentially with depth. When logging, the moisture

56
Figure 6. Road Logger apparatus. Figure 7. Seismic apparatus.
density and wet density plotted is a continuous average of the values over a preset distance of past travel, generally 6 ft. No soil preparation was needed except for the lifts compacted with the sheepsfoot. rollers.
Seismograph
A seismograph was used to determine rapidly the velocity of impulses through the compacted layers. Theoretically, seismic wave velocity is related to the density and elastic properties of the soil.
The instrument selected was a Minnetech Labs Model MD-3 (Fig. 7) modified to permit measurements over horizontal distances of 3 to 24 in. It consisted of four essential parts: (a) counter, (b) triggering device, (c) sensing device, and (d) a means to induce an impulse into the soil. A metal bar or spike held firmly on the ground surface was struck with a hammer. The triggering circuit was arranged so that the circuit was closed (starting the counter) when the hammer made contact with the bar or spike. A geophone, anchored to the soil by either a flat plate or spike, served as the sensing device.
CONCLUSIONS
The purpose, scope and operational procedures used in the compaction study have been described to provide the necessary background for understanding and appreciating the results of this study. More detailed information on the test plan, compaction and testing equipment, and test procedures are given elsewhere (3, 4, 5).
Over 10, 000 measurements were taken and are now in the process of analysis. Some of the results are presented in two companion papers in this RECORD (1, 2). Even with the aid of statistical methods and computer techniques, the complete realization of the potential of the data will not be realized for some time, since a considerable amount of analysis is required for proper interpretation. In addition, it should be recognized that in spite of the great mass of data collected thus far, more research is required both in the field and in the laboratory to supplement data previously collected. This is necessary to broaden the scope of understanding of all aspects of the compaction process and the properties of compacted soils.

57
ACKNOWLEDGMENTS
The authors would like to thank the following states and organizations which made this study possible and contributed to its success: the U.S. Bureau of Public Roads, represented by T. F. McMahon; the states of Indiana, Iowa, Kentucky, Lousiana, Massachusetts, Minnesota, Mississippi, Montana, New Mexico, Ohio, Rhode Island, Utah, West Virginia and Wisconsin, and the Commonwealth of Puerto Rico, all represented by a steering committee led by C. R. Hanes of the Ohio Department of Highways; the compaction equipment manufacturers represented by M. J. Trainor; and the George J. Beemsterboer Construction Company, represented by T. Beemsterboer, who was the subcontractor for the field work. Appreciation is also expressed to Lane-Wells Co., Minnetech Labs, Inc. , and Nuclear-Chicago Corp. who provided instruments for the study.
REFERENCES
1. Selig, E. T., and Truesdale, W. B. Evaluation of Rapid Field Methods for Measuring Compacted Soil Properties. Presented at the 46th Annual Meeting and published in this RECORD.
2. Truesdale, W. B., and Selig, E. T. Properties of Field Compacted Soils. Presented at the 46th Annual Meeting and published in this RECORD.
3. Selig, E. T. Introduction and Results of Initial Phases. Final Report, U.S. BPR Soil Compaction Study, Vol. I, April 1967.
4. Selig, E. T., and Truesdale, W. B. Field Test Plans and Procedures. Final Report, U.S. BPR Compaction Study, Vol. II, April 1967.
5. Selig, E. T., and Truesdale, W. B. An Evaluation of Field Measurements of Soil Compaction. Second Internat. Conf. of the Internat. Soc. for Terrain-Vehicle Systems, Aug. 1966.