evaluation of laboratory compaction techniques … report for the florida department of...
TRANSCRIPT

FINAL REPORT
For the Florida Department of Transportation
Evaluation of Laboratory Compaction Techniques for
Simulating Field Soil Compaction
(Phase II)
Research Report No.: FL/DOT/RMC/BB-890(F)
FSU Project No.: 6120-549-39
by
W. V. Ping, P.E.
Guiyan Xing
Michael Leonard
Zenghai Yang
Department of Civil & Environmental Engineering
Florida A&M University – Florida State University
COLLEGE OF ENGINEERING
Tallahassee, FL 32310
March 2003
ii
METRIC CONVERSIONS inches = 25.4 millimeters
feet = 0.305 meters
square inches = 645.1 millimeters squared
square feet = 0.093 meters squared
cubic feet = 0.028 meters cubed
pounds = 0.454 kilograms
poundforce = 4.45 newtons
poundforce per square inch = 6.89 kilopascals
pound per cubic inch = 16.02 kilograms per meters cubed
iii
DISCLAIMER
“The opinions, findings and conclusions expressed in
this publication are those of the authors and not
necessarily those of the Department of Transportation or
the U.S. Department of Transportation. This publication is
prepared in cooperation with the State of Florida
Department of Transportation and the U.S. Department of
Transportation.”
iv
ACKNOWLEDGEMENTS
Funding for this research was provided by the Florida
Department of Transportation (FDOT) and Federal Highway
Administration (FHWA) through the Research Center of the FDOT.
This research was initiated and managed by Sastry Putcha, State
Construction Geotechnical Engineer.
The FDOT Research Center, through the assistance of Richard
Long and his staff, provided financial and contractual support.
The field stress monitoring study was conducted by Ardaman &
Associates, Orlando, Florida. Dan Turner, formerly with FDOT,
provided strong support to this research study.

v
TABLE OF CONTENTS
LIST OF TABLES..........................................viii LIST OF FIGURES............................................x SUMMARY OF FINAL REPORT.................................xvii CHAPTER 1 INTRODUCTION.....................................1
1.1 BACKGROUND ......................................................................................................... 1 1.2 PROBLEM STATEMENT ........................................................................................... 2 1.3 SCOPE OF THE STUDY ......................................................................................... 3 1.4 REPORT ORGANIZATION ....................................................................................... 5
CHAPTER 2 LITERATURE REVIEW................................7
2.1 BACKGROUND ........................................................................................................... 7 2.2 IMPACT COMPACTION.............................................................................................. 9 2.2.1 Standard Proctor compaction procedure ...........10 2.2.2 Modified Proctor compaction procedure ...........11
2.3 VIBRATORY COMPACTION ...................................................................................... 12 2.3.1 Vibratory compaction test procedures ............12 2.3.2 ASTM D 4253 vibratory test method ...............13
2.4 GYRATORY COMPACTION ........................................................................................ 14 2.4.1 Gyratory Testing Machine (GTM) ..................15 2.4.2 GTM test Procedure ..............................16 2.4.3 Comparison of GTM Test Results ..................18
2.5 POTENTIAL USE OF GYRATORY COMPACTOR FOR SOIL COMPACTION ................. 20 CHAPTER 3 FIELD COMPACTION CHARACTERISTICS................25
3.1 INTRODUCTION...................................................................................................... 25 3.2 THOMASVILLE ROAD FIELD TEST........................................................................ 26 3.2.1 Thomasville Road field test procedure ...........26 3.2.2 Thomasville Road field test results ...........28
3.3 SUN COAST PARKWAY FIELD TEST ................................................................... 29 3.3.1 Sun Coast Parkway field test procedures .......29 3.3.2 Sun Coast Parkway field test results ..........32
3.4 STATE ROAD 56 FIELD TEST ......................................................................... 36 3.4.1 SR 56 field test procedures ...................36 3.4.2 SR 56 field test results ........................39

vi
CHAPTER 4 LABORATORY COMPACTION CHARACTERISTICS...........52
4.1 GENERAL ............................................................................................................... 52 4.2 LABORATORY TESTING PROGRAM .......................................................................... 52 4.3 IMPACT COMPACTION METHOD .............................................................................. 53 4.3.1 Modification of impact compaction method ........54 4.3.2 Impact compaction test results ..................56
4.4 VIBRATORY COMPACTION METHOD ........................................................................ 57 4.4.1 Vibratory compaction test results ...............57 4.4.2 Concerns about vibratory compaction .............58
4.5 GYRATORY COMPACTION METHOD......................................................................... 59 4.5.1 Gyratory compactor ..............................60 4.5.2 Initial investigation of gyratory variables .....62
CHAPTER 5 SUMMARY AND ANALYSIS OF EXPERIMENTAL RESULTS...118
5.1 COMPARISON OF LABORATORY AND FIELD COMPACTION ................................... 118 5.2 FURTHER EVALUATION OF GYRATORY COMPACTION PROCEDURE........................ 120 5.2.1 Number of gyrations ............................120 5.2.2 Gyration angle .................................121 5.2.3 Vertical pressure ..............................121 5.2.4 Further comparison of gyratory compaction ......122 5.2.5 Selection of critical number of gyrations ......123
5.3 GYRATORY COMPACTION ENERGY ........................................................................ 125 5.4 RECOMMENDED GYRATORY TESTING PROCEDURE................................................. 125
CHAPTER 6 CONCLUSION AND RECOMMENDATIONS.................150
6.1 CONCLUSIONS...................................................................................................... 150 6.2 RECOMMENDATIONS .............................................................................................. 152
APPENDIX A METHOD OF ESTIMATING GYRATORY COMPACTION ENERGY........................................154
A.1 THE FORCE ANALYSIS OF GYRATORY MACHINE ................................................ 154 A.2 COMPACTION ENERGY OF SERVOPAC GYRATORY MACHINE ................................. 155 A.2.1. Work done by vertical pressure ................155 A.2.2. Work done by shear force ......................156
A.3 COMPARISON OF ENERGY FROM IMPACT AND GYRATORY COMPACTION .............. 158 APPENDIX B PROPOSED GYRATORY COMPACTION TEST PROCEDURE...166
B.1 PROPOSED SCOPE ............................................................................................... 166 B.2 SUMMARY OF THE PROPOSED TEST METHOD ...................................................... 167 B.3 SIGNIFICANCE AND USE .................................................................................... 167 B.4 BASIC DEFINITIONS.......................................................................................... 167 B.5 PROPOSED APPARATUS........................................................................................ 169 B.6 TESTING PROCEDURES........................................................................................ 170 B.7 CALCULATION...................................................................................................... 172 B.8 DATA PRESENTATION.......................................................................................... 173

vii
REFERENCES...............................................182

viii
LIST OF TABLES Table 3.1 Thomasville road field compaction results...... 41
Table 3.2 Summary of compaction test method and results for
Sun Coast Parkway.............................. 42
Table 3.3 State Road 56 field test results............... 43
Table 4.1 Soil materials for laboratory evaluation....... 70
Table 4.2 Summary of impact compaction data for Alford City
A-2-4 soil .................................... 71
Table 4.3 Summary of impact compaction data for Clay County
A-2-6 soil..................................... 72
Table 4.4 Summary of impact compaction data for Lake City
A-3 soil....................................... 73
Table 4.5 Summary of lab compaction test results for
Thomasville Road project....................... 75
Table 4.6 Summary of lab compaction test results for Sun
Coast Parkway project ......................... 76
Table 4.7 Lab Impact and vibratory compaction test results
(A-2-4 12% soil)............................... 77
Table 4.8 Lab impact and vibratory compaction test results
for A-2-4 24% soil............................. 78
Table 4.9 Data for characterization of gyration rate..... 79
ix
(Alford City A-2-4 soil) ....................... 79
Table 4.10 Gyratory compaction test results for Thomasville
Road soil..................................... 80
Table 4.11 Gyratory compaction test results for Sun Coast
Parkway soil ................................. 81
Table 4.12 Lab gyratory test data for A-2-4 12% soil..... 83
Table 4.13 Lab gyratory test data for A-2-4 24% soil..... 84
Table 5.1 Effect of gyrations on dry unit weight for
Thomasville Road A-3 soil with 7.7% water content
.............................................. 127
Table 5.2 Effect of gyrations on dry unit weight for
Thomasville Road A-3 soil at optimum water content
.............................................. 128
Table A.1 Work done by the vertical force............... 160
Table A.2 Work done by the shear force.................. 161

x
LIST OF FIGURES Figure 1.1 Effect of compactive effort on the compaction
curve.......................................... 6
Figure 2.1 Standard Proctor mold and hammer.............. 22
Figure 2.2 Vibratory table and mold assembly............. 23
Figure 2.3 Schematic illustration of gyratory testing
machine(U.S. Army Corps of Engineers)......... 24
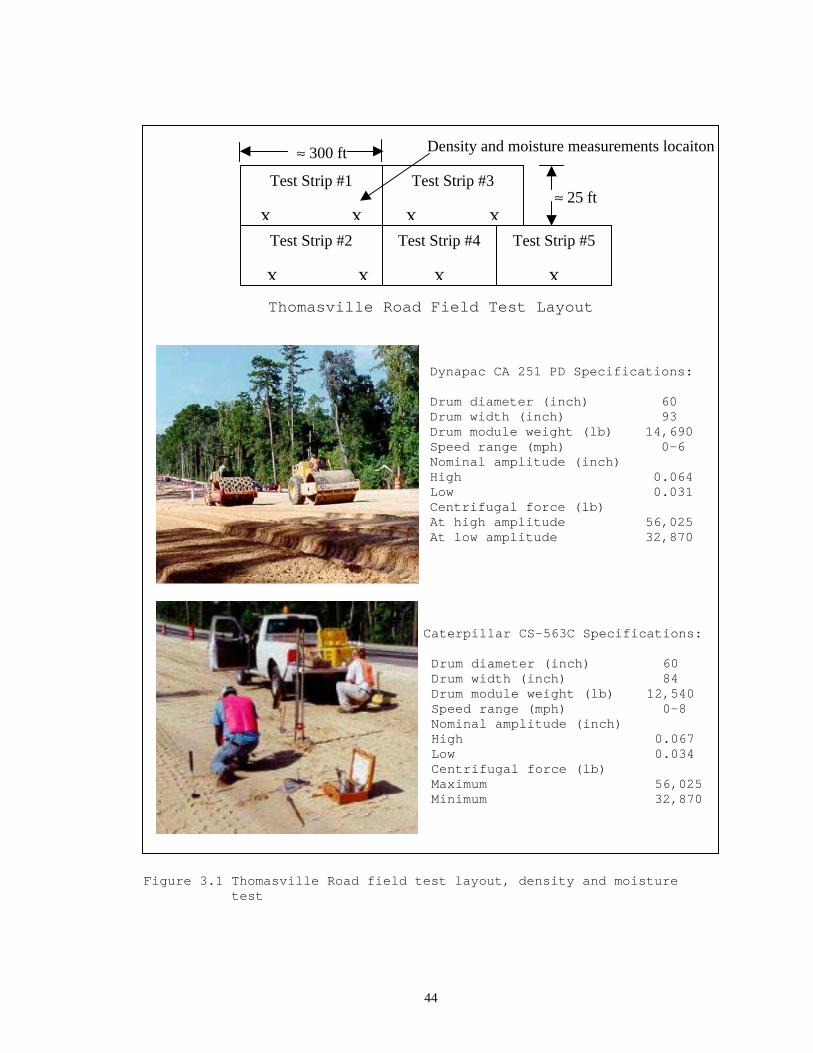
Figure 3.1 Thomasville Road field test layout, density and
moisture test................................. 44
Figure 3.2 Thomasville Road field compaction results..... 45
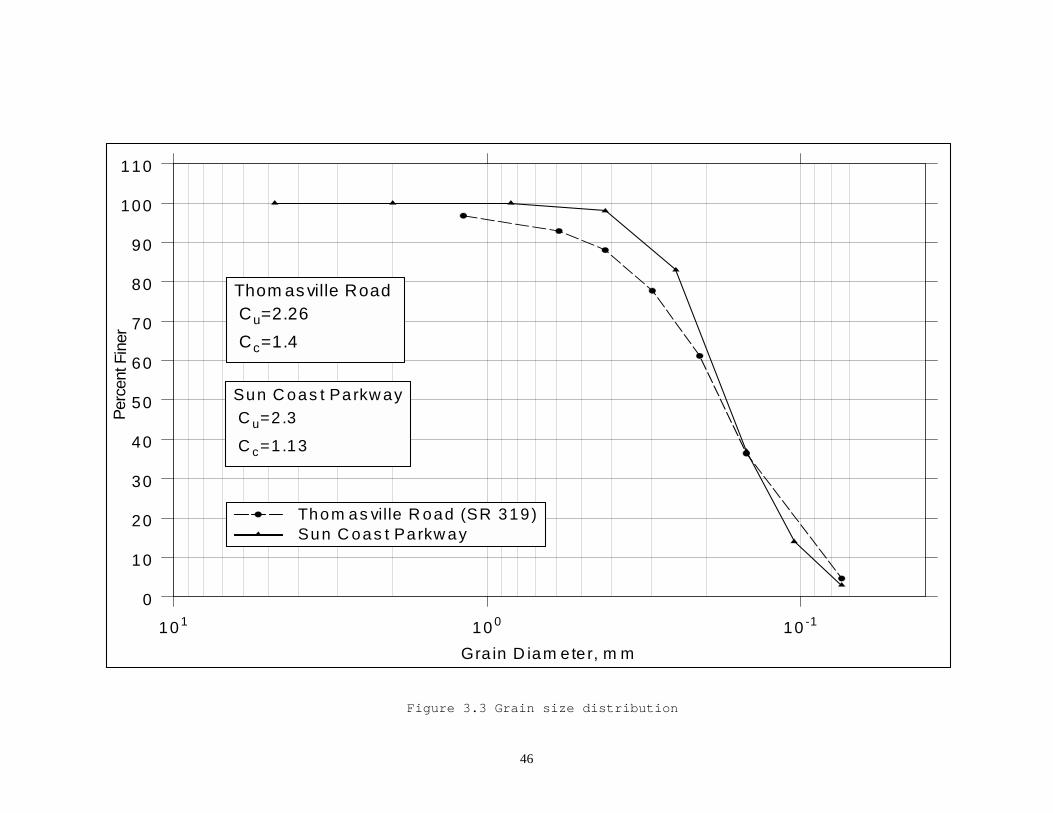
Figure 3.3 Grain size distribution....................... 46
Figure 3.4 Sun Coast Parkway field test layout and earth
pressure cell................................. 47
Figure 3.5 Sun Coast Parkway field test results.......... 48
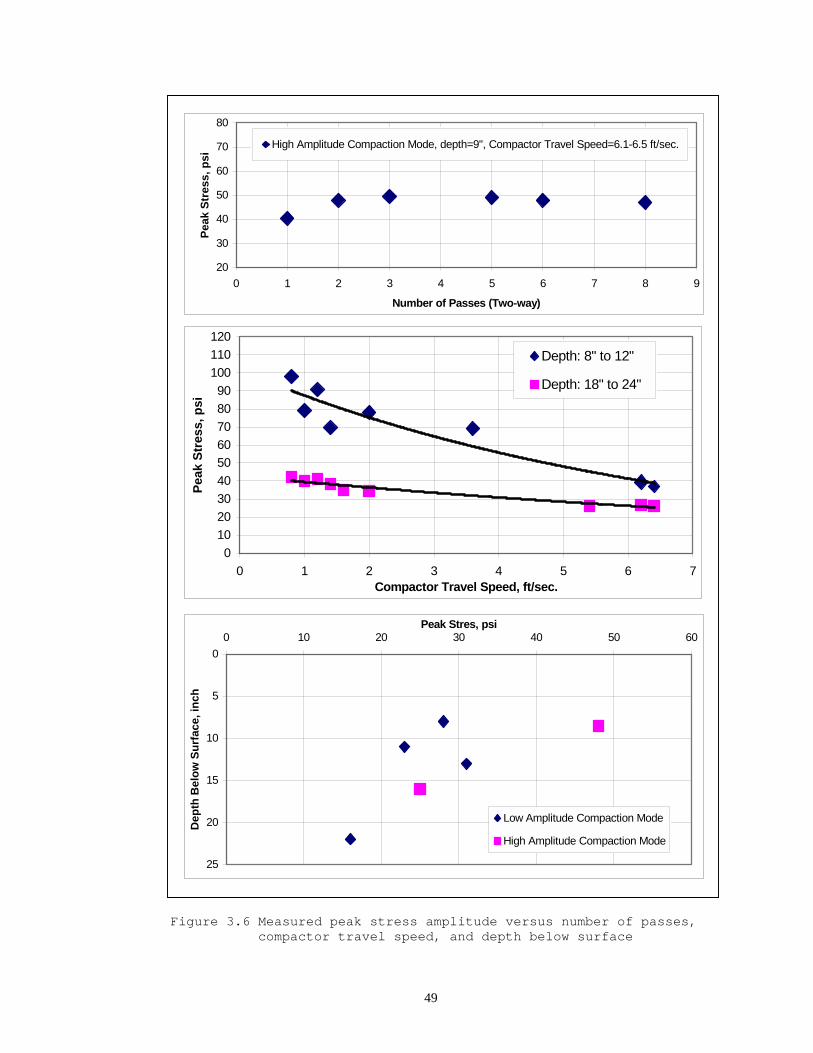
Figure 3.6 Measured peak stress amplitude versus number of
passes, compactor travel speed, and depth below
surface ...................................... 49
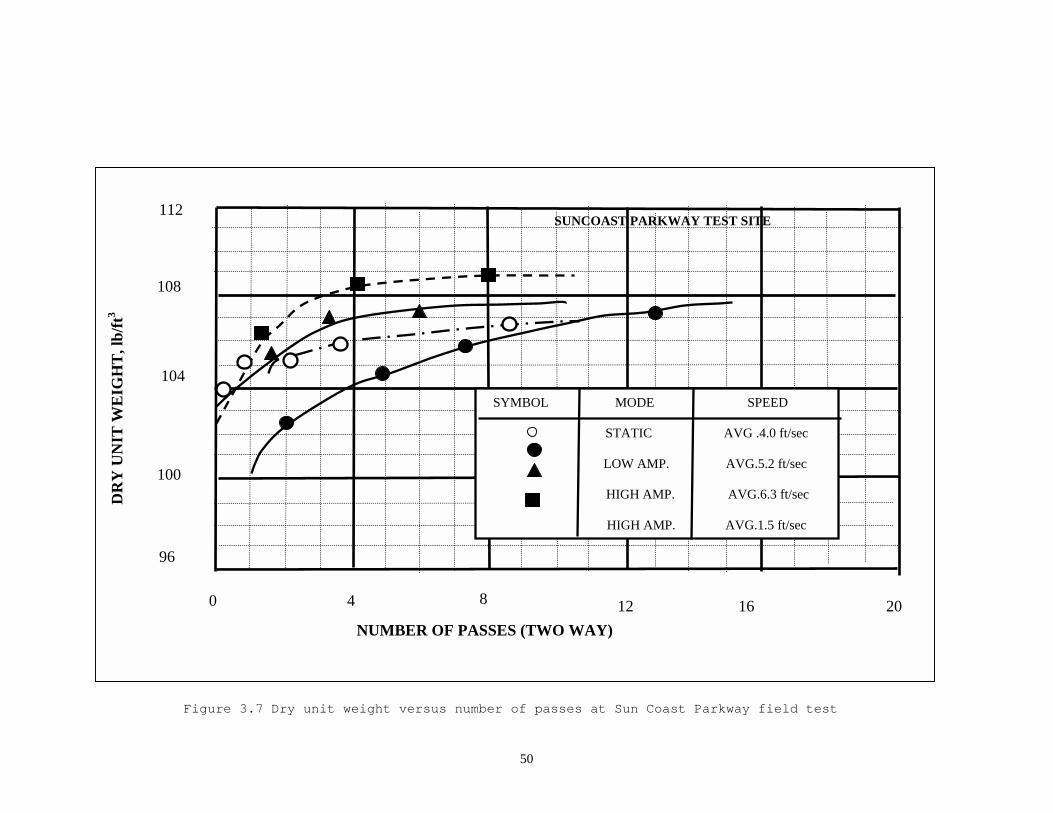
Figure 3.7 Dry unit weight versus number of passes at Sun
Coast Parkway field test ..................... 50
Figure 3.8 State Road 56 field test results.............. 51

xi
Figure 4.1 Field and lab compaction curves for Thomasville
Road A-3 soil................................. 85
Figure 4.2 Field and lab compaction curves for Sun Coast
Parkway A-3 soil.............................. 86
Figure 4.3 Impact compaction method investigation (Alford
City A-2-4 soil).............................. 87
Figure 4.4 Impact compaction method investigation (Clay
County A-2-6 soil) ........................... 88
Figure 4.5 Impact compaction test results (Lake City A-3
soil)......................................... 89
Figure 4.6 Laboratory impact compaction curves for
Thomasville Road A-3 soil..................... 90
Figure 4.7 Laboratory impact compaction curves for Sun
Coast Parkway A-3 soil........................ 91
Figure 4.8 Modified Proctor compaction test for A-2-4 soil
.............................................. 92
Figure 4.9 Vibratory compaction for Sun Coast Parkway and
Thomasville Road A-3 soils.................... 93
Figure 4.10 Vibratory compaction for A-2-4 with 12% fines
and A-2-4 with 24% fines soil................ 94
Figure 4.11 Servopac Gyratory compactor.................. 95
Figure 4.12 Theory of gyration angle working............. 96
Figure 4.13 Servopac Gyratory Compactor PC window........ 97

xii
Figure 4.14 Peak stress versus number of passes during
field compaction ............................ 98
Figure 4.15 Effect of gyration rate on compacted unit
weight ..................................... 100
Figure 4.16 Effect of water seepage on dry unit weight
during compaction........................... 101
Figure 4.17(a) Compaction curves for Thomasville Road soil
at 1.0 degree gyration angle, 100 kPa
vertical pressure........................ 102
Figure 4.17(b) Compaction curves for Thomasville Road soil
at 1.25 degrees gyration angle, 100 kPa
vertical pressure........................ 103
Figure 4.17(c) Compaction curves for Thomasville Road soil
at 1.0 degree gyration angle, 200 kPa
vertical pressure........................ 104
Figure 4.17(d) Compaction curves for Thomasville Road soil
at 1.25 degree gyration angle, 200 kPa
vertical pressure........................ 105
Figure 4.17(e) Compaction curves for Thomasville Road soil
at 1.25 degrees gyration angle, 300 kPa
vertical pressure........................ 106
Figure 4.18(a) Compaction curves for Sun Coast Parkway soil
at 1.0 degree gyration angle, 100 kPa
vertical pressure........................ 107

xiii
Figure 4.18(b) Compaction curves for Sun Coast Parkway soil
at 1.25 degree gyration angle, 100 kPa
vertical pressure........................ 108
Figure 4.18(c) Compaction curves for Sun Coast Parkway soil
at 1.00 degree gyration angle, 200 kPa
vertical pressure........................ 109
Figure 4.18(d) Compaction curves for Sun Coast Parkway soil
at 1.25 degree gyration angle, 200 kPa
vertical pressure........................ 110
Figure 4.18(e) Compaction curves for Sun Coast Parkway soil
at 1.25 degrees gyration angle, and
different vertical pressure.............. 111
Figure 4.19(a) Compaction curves for A-2-4 soil with 12%
fines at different vertical pressures and
gyration angles.......................... 112
Figure 4.19(b) Compaction curves for A-2-4 soil with 12%
fines at 1.25 degree gyration angle, and 200
kPa vertical pressure.................... 113
Figure 4.19(c) Compaction curves for A-2-4 soil with 12%
fines at 300 kPa vertical pressure and
different gyration angle................. 114
Figure 4.20(a) Compaction curves for A-2-4 soil with 24%
fines at different vertical pressures and
gyration angles.......................... 115

xiv
Figure 4.20(b) Compaction curves for A-2-4 soil with 24%
fines at 1.25 degree gyration angle, and 200
kPa vertical pressure.................... 116
Figure 4.20(c) Compaction curves for A-2-4 soil with 24%
fines at 300 kPa vertical pressure and
different gyration angles................ 117
Figure 5.1 Correlation of field and laboratory test results
for Thomasville Road soil.................... 129
Figure 5.2 Correlation of field and laboratory test results
for Sun Coast Parkway soil................... 130
Figure 5.3 Effect of gyrations on dry unit weight for
Thomasville Road and Sun Coast Parkway soils. 131
Figure 5.4 Effect of gyrations on dry unit weight for A-2-4
soil with 12% and 24% fines.................. 132
Figure 5.5 Effect of gyration angle on dry unit weight for
Thomasville Road soil........................ 133
Figure 5.6 Effect of gyration angle on dry unit weight for
Sun Coast Parkway soil....................... 134
Figure 5.7 Effect of gyration angle on dry unit weight for
A-2-4 soil with 12% fines.................... 135
Figure 5.8 Effect of gyration angle on dry unit weight for
A-2-4 soil with 24% fines.................... 136
Figure 5.9 Effect of vertical pressure on dry unit weight
for Thomasville Road soil.................... 137
xv
Figure 5.10 Effect of vertical pressure on dry unit weight
for Sun Coast Parkway soil.................. 138
Figure 5.11 Effect of vertical pressure on dry unit weight
with 1.25 degrees angle for A-2-4 soil with 12%
fines....................................... 139
Figure 5.12 Effect of vertical pressure on dry unit weight
with 1.00 degree angle for A-2-4 soil with 12%
fines ...................................... 140
Figure 5.13 Effect of vertical pressure on dry unit weight
with 1.00 degree angle for A-2-4 soil with 24%
fines....................................... 141
Figure 5.14 Effect of vertical pressure on dry unit weight
with 1.25 degrees angle for A-2-4 soil with 24%
fines....................................... 142
Figure 5.15 Comparison of three compaction curves for
Thomasville Road soil....................... 143
Figure 5.16 Comparison of three compaction curves for Sun
Coast Parkway soil.......................... 144
Figure 5.17 Comparison of three compaction curves for A-2-4
12% soil.................................... 145
Figure 5.18 Comparison of three compaction curves for A-2-4
soil with 24% fines......................... 146

xvi
Figure 5.19 Dry unit weight versus number of gyrations for
Thomasville Road A-3 soil with 7.7% water
content..................................... 147
Figure 5.20 Dry unit weight versus number of gyrations for
Thomasville Road A-3 soil at optimum water
content .................................... 148
Figure 5.21 Selection of critical number of gyrations... 149
Figure A.1 The work schematic of the gyratory machine... 164
Figure A.2 Shear force and Vertical force analysis...... 165
Figure B.1 Gyratory machine............................. 175
Figure B.2 Schematic of Servopac gyratory machine....... 176
Figure B.3 The gyratory system setup.................... 177
Figure B.4 Filling the soil in the mold................. 177
Figure B.5 Sliding the mold on the gyratory plate....... 178
Figure B.6 Running the gyratory machine................. 178
Figure B.7 Ejecting the soil sample from the mold....... 179
Figure B.8 The soil sample after gyration............... 179
Figure B.9 Illustration of compaction test results for A-3
soil......................................... 180
Figure B.10 Illustration of gyratory compaction test
results for A-2-4 soil ..................... 181

xvii
Summary of Final Report
Evaluation of Laboratory Compaction Techniques for
Simulating Field Soil Compaction
(Phase II)
PROBLEM STATEMENT Due to the development of much heavier earth moving and vibratory roller compaction equipment, densities in the field are reaching levels that are not attainable in the laboratory. Higher compaction efforts, routinely seen in the field, not only result in higher unit weights bot also lower optimum moisture contents than those found by the modified Proctor test. The optimum moisture content (OMC) obtained in the laboratory is often higher than that in the field compaction. Consequently, in the field compaction the maximum density compacted using the laboratory OMC will be lower than that obtained using the field OMC. In addition, the impact compaction method does not work well with the pure sandy soil. A suitable compaction test procedure is evidently needed, which will produce laboratory densities as great or greater than those being obtained under field compaction and traffic in actual pavements and one that will work well for the cohesionless A-3 soil. On the basis of findings from Phase I study, the gyratory compaction is the potential test procedure to achieve these goals.
OBJECTIVES The primary objective of this project was to further the Phase I study, which was to investigate the potential of using gyratory compaction for field simulation, and try to establish the standard test procedure for compacting silty and sandy soils. The objectives included examination of the effects of the gyratory compaction variables on laboratory-compacted specimens, comparison with other compaction methods such as impact and vibratory compaction, and correlation of these data from the gyratory, impact and vibratory compaction to the results from field tests. Several laboratory compaction procedures were evaluated to determine which would best replicate the field compaction effort.
FINDINGS AND CONCLUSIONS The findings and conclusions based on the analysis of this experimental study are
summarized below.

xviii
1. The impact compaction method was not an adequate laboratory test procedure to
specify the maximum dry unit weight and optimum water content for the field compaction of cohesionless soils. The study showed that higher field compaction efforts resulted in higher unit weights and lower optimum moisture content than those obtained by the modified Proctor compaction test.
2. Gyratory compaction was more reliable than impact compaction when fine sands were compacted in the laboratory.
3. For the gyratory compaction test, using the vertical stress as a means of increasing the dry unit weight was not effective when the vertical stress was higher than 200 kPa. The 200 kPa stress level was within the range of peak vertical soil stresses measured during the field compaction tests.
4. The gyration angle had some effect on the dry unit weight when the soil had lower percent of fines, and when the number of gyrations was higher. When the soil became more silty (with more than 6% fines), the influence of the gyration angle on the dry unit weight became less significant.
5. When the number of gyrations was increased, there was a continuous increase of dry unit weight, which needed to be adjusted to get the desired dry unit weight.
6. The gyratory test procedure conducted with 200 kPa vertical pressure, 1.25 degree gyration angle, 90 gyrations, and 20 gyrations per minute showed considerable promise for replicating field compaction characteristics.
7. A gyratory compaction test procedure was proposed for determining the maximum dry unit weight and optimum moisture content of the granular soils with a gyratory compactor under conditions that simulated field compaction.
RECOMMENDATIONS
Based on this study, gyratory compaction was the most suitable technique to simulate field compaction for granular soils. The research should be expanded to study the effect of those gyratory variables on clay soils in laboratory as well as to monitor the performance of the clay soils under field compaction.
In Florida, most subgrade soils are classified as A-3 fine sand and A-2-4 silty soil. The gyratory compaction procedure has great potential to be the construction specification for quality control of field compaction. A further research study is recommended for possible implementation of the gyratory compaction method in design and construction.

1
CHAPTER 1
INTRODUCTION
1.1 Background
Fill materials are used in almost all roadway construction
projects. When fill materials are used, the engineering
properties of the soil need to be improved through
compaction. The primary benefit of compacting soil is to
increase its strength.
When fill soils are used, testing is required in the
laboratory first, in order to determine their maximum dry
densities and their optimum moisture contents (OMC).
Compacting fill at their optimum moisture content is the
most economical technique that a contractor can use to
reach the required density of the material. Over the years,
several techniques have been developed to compact soils in
the laboratory. These include impact, static, kneading, and
vibratory compaction. All of these methods are used to
determine the density to which soil can be compacted in the
field.
2
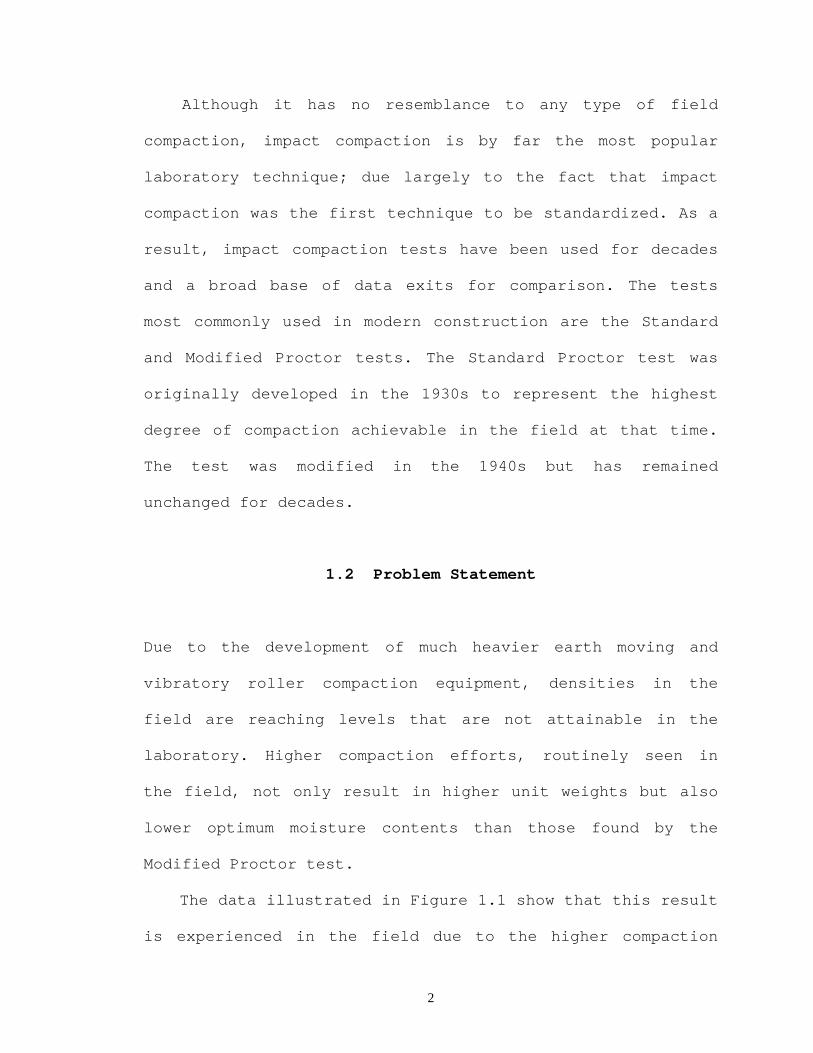
Although it has no resemblance to any type of field
compaction, impact compaction is by far the most popular
laboratory technique; due largely to the fact that impact
compaction was the first technique to be standardized. As a
result, impact compaction tests have been used for decades
and a broad base of data exits for comparison. The tests
most commonly used in modern construction are the Standard
and Modified Proctor tests. The Standard Proctor test was
originally developed in the 1930s to represent the highest
degree of compaction achievable in the field at that time.
The test was modified in the 1940s but has remained
unchanged for decades.
1.2 Problem Statement
Due to the development of much heavier earth moving and
vibratory roller compaction equipment, densities in the
field are reaching levels that are not attainable in the
laboratory. Higher compaction efforts, routinely seen in
the field, not only result in higher unit weights but also
lower optimum moisture contents than those found by the
Modified Proctor test.
The data illustrated in Figure 1.1 show that this result
is experienced in the field due to the higher compaction

3
energies produced by modern heavy compaction equipment. Due
to this phenomenon, the optimum moisture content (OMC)
obtained in the laboratory, is often higher than that in
the field compaction. Consequently, in the field compaction
the maximum density compacted using the laboratory OMC will
be lower than that obtained using the field OMC (point A
versus point B in Figure 1.1). In addition, the impact
compaction method does not work well with the pure sandy
soil.
A suitable compaction test procedure is evidently needed,
which will produce laboratory densities as great or greater
than those being obtained under field compaction and
traffic in actual pavements and one that will work well for
the cohensionless A-3 soil. From the Phase I study, the
gyratory compaction is the potential test procedure to
achieve these goals.
1.3 Scope of the Study
The primary objective of this project is to further the
Phase I study, which was to investigate the
potential of using gyratory compaction for field
simulation, and try to establish the standard test
procedure for compacting silty and sandy soils. The first

4
objective of this study is to examine the effects of the
gyration compaction variables (vertical pressure, angle of
gyration, and number of gyrations) on laboratory-compacted
specimens of soil material. Samples of the soil were
prepared and compacted in the gyratory machine. During
compaction, two of the three variables were held constant
while the third was allowed to run through a given range of
values. This procedure was repeated for each of the three
variables of the machine.
The second objective is to compact these soil samples
with other compaction methods such as impact and vibratory
compaction, and correlate these data from the gyratory,
impact and vibratory compaction to the results from field
tests. The field and laboratory results were analyzed to
determine the appropriate procedures to simulate the field
compaction efforts in the laboratory. Several laboratory
compaction procedures were evaluated to determine which
would best replicate the field compaction effort.
In addition, the energy from the gyratory compaction was
calculated and compared to the energy from the Standard and
Modified Proctor methods. Through this study, the gyratory
test procedure will be explored to determine if it shows
more promise than the impact compaction method.
5
1.4 Report Organization
This report summarizes the results of the study on field
and laboratory compaction characteristics and the analysis
of the experimental results.
Chapter 1 presents the background, problem statement
and objectives of the field and laboratory programs. A
brief literature review of previous research in soil
compaction is presented in Chapter 2. A review of the field
experimental program and results is summarized in chapter
3. The laboratory experimental program, test material, and
laboratory test results are summarized in Chapter 4. The
analysis of field and laboratory experimental results, and
further correlation of the laboratory test results to the
field results are presented in Chapter 5. Finally,
conclusions and recommendations of this research study are
summarized in Chapter 6. The energy calculation for
gyratory compactor is introduced in Appendix A. The
proposed test procedure for soil compaction with a gyratory
compactor is presented in Appendix B.

6
Figure 1.1 Effect of compactive effort on the compaction curve
Compaction Water Content, ω
Laboratory Effort
Field Effort
OMC (field) OMC(lab)
Zero Air Voids Curve
Dry Unit Weight,
γ
A
B

7
CHAPTER 2
LITERATURE REVIEW
2.1 Background
Fill materials are used by engineers for a variety of
purposes, e.g., to build dams, construct embankments,
develop low-lying land, support pavements, and make sites
more suitable for support of foundations. With such fills,
compacting the soil is almost always necessary to improve
the engineering properties. Although the relationships
among compacted properties and the variables of the
compaction process are most properly studied in the field,
this procedure is expensive and time consuming.
Accordingly, in the present state of the art, the above
relationships are established in the laboratory. But this
approach has serious intrinsic limitations, because field
compaction is achieved by different modes and at different
energy levels than in the laboratory and more variability
exists in all variables in the field.

8
In order to simulate the different field compaction
methods, a number of techniques have been developed to
compact soil in the laboratory – most of the tests fall
into four types:
• Impact compaction tests in which a standard weight
is repeatedly dropped on the soil sample for a
prescribed number of blows. The weight is adjusted
to achieve the desired compaction effort.
• Static compaction tests in which a uniform pressure
is applied to the soil and maintained long enough
for the soil to compact under the pressure.
• Kneading compaction tests in which a small “foot” is
loaded, then unloaded, at various locations on the
surface of the sample being compacted; the soil is
effectively kneaded with this procedure.
• Vibratory compaction tests in which the soil is
vibrated as it is compacted, which is particularly
effective in compacting cohensionless soil such as
sand and gravel.
Ideally, the laboratory compaction tests should
simulate the characteristics of soil compaction used in
field procedures. The direct consequence of soil compaction
is densification of the fill. The quality of compacted
material is generally specified in terms of dry unit
9
weight, which is usually expressed as a percentage of the
maximum dry unit weight achieved in a specific laboratory
compaction test. Construction specifications based on this
principle are known as “end-result” specifications. Many
laboratory soil compaction procedures are available. Most
of these procedures utilize either impact compaction or
vibratory compaction. These include the tests based on the
Proctor hammer (AASHTO T 99 and T 180), those using
vibratory compaction (ASTM D 4253), and procedures based on
the Texas State Highway Department gyratory soils press.
Details of these test procedures as well as their
applications are presented in the following sections.
2.2 Impact Compaction
The most common impact compaction tests are the standard
and modified Proctor tests, AASHTO T 99 and T 180,
respectively. Developed in the 1930s and 1940s, these tests
were the first to be standardized and as a result a broad
base of data exists for comparison. One downfall of the
Proctor tests is that impact compaction has proved to be
relatively ineffective for the compaction of noncohesive
soils because the material displaces under the hammer, and
consequently low-density values are obtained. Despite this

10
fact, the majority of states use these test procedures in
their construction specifications.
2.2.1 Standard Proctor compaction procedure This test procedure covers laboratory compaction procedures
used to determine the relationship between water content
and dry unit weight of soils compacted in a 4 or 6 in.
diameter mold with a 5.5 lb. hammer dropped from a height
of 12 in. (Figure 2.1) (AASHTO, T99), producing a
compactive effort of 12,400 ft-lb/ft3. A soil at a selected
water content is placed in three layers into a mold of the
given dimensions, with each layer compacted by 25 blows of
the hammer. The resulting dry unit weight is then
determined. This procedure is repeated for a sufficient
number of water contents to establish a relationship
between the dry unit weight and the water content of the
soil. This test procedure applies only to soils that have
30% or less by weight of particles retained on the 3/4 in.
sieve. Generally a well-defined maximum dry unit weight
will be produced for non-free draining soils. If this test
method is used on free draining soils the maximum unit
weight may not be well defined and can be less than that
obtained using the ASTM test procedure D 4253 (vibratory
compaction).
11
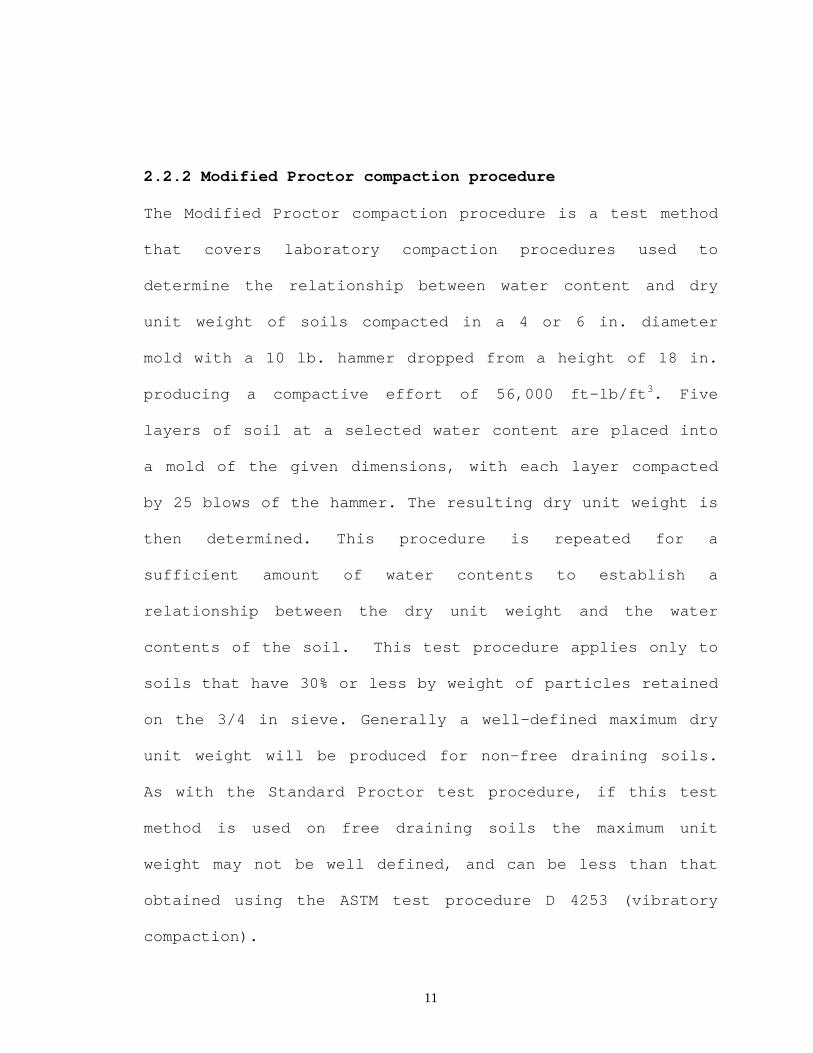
2.2.2 Modified Proctor compaction procedure The Modified Proctor compaction procedure is a test method
that covers laboratory compaction procedures used to
determine the relationship between water content and dry
unit weight of soils compacted in a 4 or 6 in. diameter
mold with a 10 lb. hammer dropped from a height of 18 in.
producing a compactive effort of 56,000 ft-lb/ft3. Five
layers of soil at a selected water content are placed into
a mold of the given dimensions, with each layer compacted
by 25 blows of the hammer. The resulting dry unit weight is
then determined. This procedure is repeated for a
sufficient amount of water contents to establish a
relationship between the dry unit weight and the water
contents of the soil. This test procedure applies only to
soils that have 30% or less by weight of particles retained
on the 3/4 in sieve. Generally a well-defined maximum dry
unit weight will be produced for non-free draining soils.
As with the Standard Proctor test procedure, if this test
method is used on free draining soils the maximum unit
weight may not be well defined, and can be less than that
obtained using the ASTM test procedure D 4253 (vibratory
compaction).

12
2.3 Vibratory Compaction
For many cohesionless free draining soils, impact
compaction does not yield consistent results. As a result,
several test procedures have been developed using vibratory
compaction. These test procedures produce more consistent
results than impact compaction, for the compaction of
granular soils. Vibratory compaction also provides a better
correlation between the field and the laboratory results,
since most field compaction is performed with vibratory
compaction equipment.
2.3.1 Vibratory compaction test procedures
The most common laboratory test that utilizes vibratory
compaction is the ASTM D 4253, Maximum Index Density and
Unit Weight of Soils Using a Vibratory Table, test
procedure. Since the development of the ASTM test, several
alternative methods have been presented, but none has
received wide spread acceptance. One of these alternatives
was a vibratory compaction procedure developed by the
Concrete and Soil Laboratory of AB Vibro-Verken, Solna,
Sweden in the 1960s. This compaction method utilized a
vibrating tamper to compact soils. The developers of this

13
procedure claimed that the results obtained during the
compaction of cohesionless soils were similar to those
obtained by the Modified Proctor impact compaction test.
This claim detracted from the validity of this procedure
because the Modified Proctor test is not suitable for round
noncohesive soils due to the material displacement under
the compaction hammer. No other proposed method of
vibratory compaction has proved to be as suitable as the
ASTM D 4253 test procedure.
2.3.2 ASTM D 4253 vibratory test method
The ASTM D 4253 test method covers the determination of the
maximum index density/unit-weight of cohesionless, free-
draining soils using a vertically vibrating table. This
test method is applicable to soils that may contain up to
15%, by dry mass, of soil particles passing a No. 200
sieve, provided they still have cohesionless free-draining
characteristics. Further, this test method is applicable to
soils in which 100%, by dry mass, of soil particles pass a
3 in. sieve. The maximum index density/unit weight of a
given free draining soil is determined by placing either
oven-dried or wet soil in a mold, applying a 2 lb/in.
surcharge to the surface of the soil, and then vertically
vibrating the mold, soil, and surcharge. The assembly is
14
vibrated using either an electromagnetic, eccentric, or
cam-driven vibrating table having a sinusoid-like time-
vertical displacement relationship at double amplitude of
vertical vibration of about 0.013 in. for 8 min. at 60 Hz
or about 0.019 in. for 10 min. at 50 Hz. The maximum index
density/unit weight is calculated by dividing the oven-
dried mass/weight of the densified soil by its volume. The
detail equipment setup is shown in Figure 2.2 (ASTM D4253).
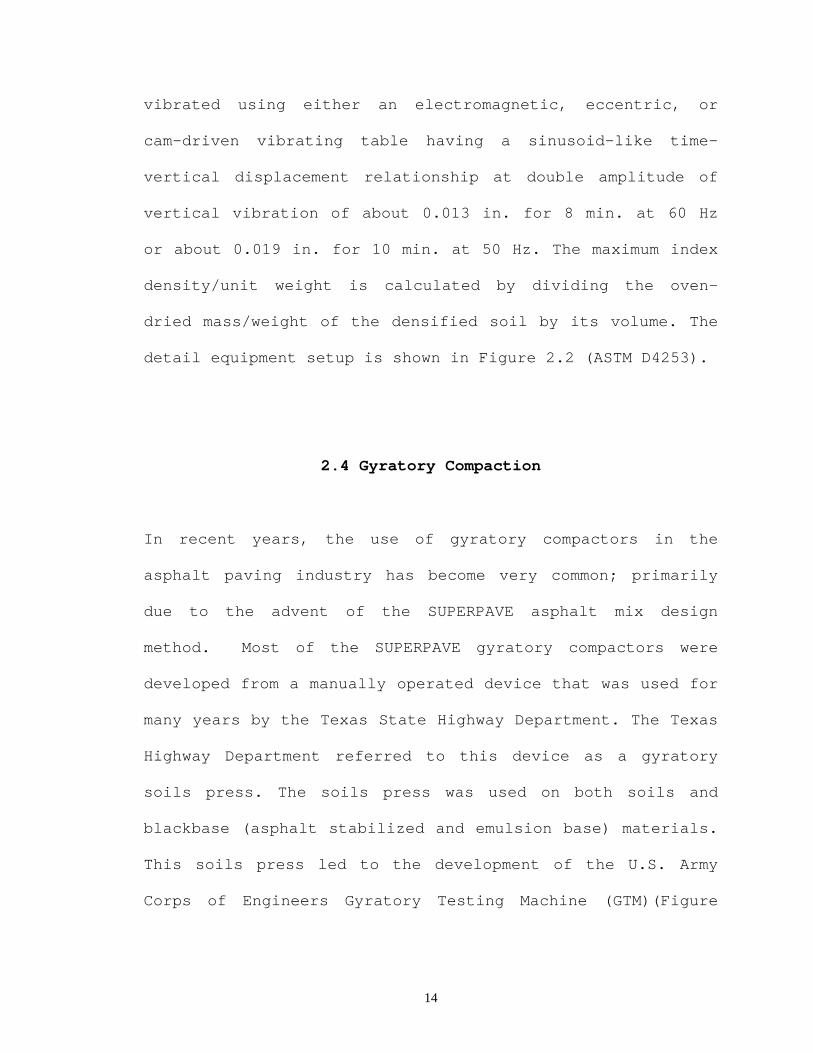
2.4 Gyratory Compaction
In recent years, the use of gyratory compactors in the
asphalt paving industry has become very common; primarily
due to the advent of the SUPERPAVE asphalt mix design
method. Most of the SUPERPAVE gyratory compactors were
developed from a manually operated device that was used for
many years by the Texas State Highway Department. The Texas
Highway Department referred to this device as a gyratory
soils press. The soils press was used on both soils and
blackbase (asphalt stabilized and emulsion base) materials.
This soils press led to the development of the U.S. Army
Corps of Engineers Gyratory Testing Machine (GTM)(Figure
15
2.3)(U.S. Army 1968) and the GTM in turn led to the
development of the current gyratory compactors.
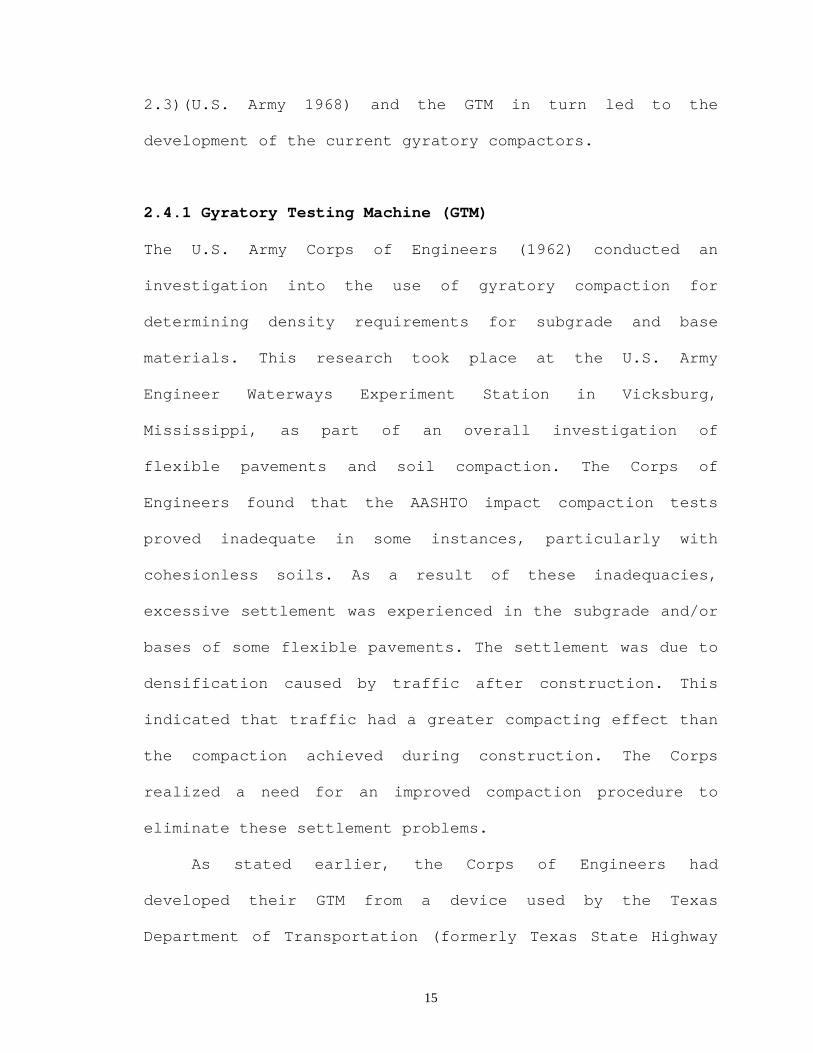
2.4.1 Gyratory Testing Machine (GTM) The U.S. Army Corps of Engineers (1962) conducted an
investigation into the use of gyratory compaction for
determining density requirements for subgrade and base
materials. This research took place at the U.S. Army
Engineer Waterways Experiment Station in Vicksburg,
Mississippi, as part of an overall investigation of
flexible pavements and soil compaction. The Corps of
Engineers found that the AASHTO impact compaction tests
proved inadequate in some instances, particularly with
cohesionless soils. As a result of these inadequacies,
excessive settlement was experienced in the subgrade and/or
bases of some flexible pavements. The settlement was due to
densification caused by traffic after construction. This
indicated that traffic had a greater compacting effect than
the compaction achieved during construction. The Corps
realized a need for an improved compaction procedure to
eliminate these settlement problems.
As stated earlier, the Corps of Engineers had
developed their GTM from a device used by the Texas
Department of Transportation (formerly Texas State Highway

16
Department). During the initial development of the Gyratory
Testing Machine, the Corps of Engineers undertook a study
of the major test variables. During this study, the Corps
made several observations. First, the rate of kneading had
little or no effect on densification. Additional findings
show that increased vertical pressure resulted in a
consistent increase in unit weight, that an increased
number of revolutions resulted in a consistent increase in
unit weight, and that the optimal gyration angle should be
between one and two degrees.
2.4.2 GTM test Procedure Early study information was used to develop test procedures
for both bituminous paving mixtures and soils. Most
relevant to this report is the proposed Corps of Engineers
test procedure (U.S. Army, 1962) for compacting soils with
the GTM. This test procedure was proposed as an alternative
to the AASHTO impact compaction tests. The procedure
suggested the use of compaction pressures based on the
theoretical vertical stresses produced at various depths by
the anticipated wheel load. The proposed test procedure is
listed below:
• Obtain a representative sample of the soil or base
course material for the proposed pavement.

17
• Select a water content for the test specimen that will
be representative of the anticipated water content of
the material in the field immediately after
construction.
• Assuming equivalent circular loading for each tire
contact area, calculate theoretical vertical pressure
versus depth for the anticipated wheel loading.
• Thoroughly mix the sample of soil or base material at
the selected water content and then compact it in the
gyratory compactor for 500 revolutions at a one-degree
gyration angle using the vertical pressures
corresponding to those computed for several depths
beneath the wheel load.
• Calculate the dry density of the soil or base material
on the basis of vertical movement of the compression
ram of gyratory compactor. To calculate the density,
it is necessary to know only the weight of the
material and the volume of the test mold for various
readings of the ram travel.
• Then prepare a plot of density versus the number of
revolutions for each selected depth. On these density
versus revolutions curves, mark the point where the

18
next 100 revolutions caused an increase in dry density
of only one pound per cubic foot. The density at this
point will be considered the required construction
density for the proposed material at the selected
depth.
2.4.3 Comparison of GTM Test Results The Corps of Engineers used this procedure to compare field
results with those obtained in the laboratory. They used
construction and after-traffic density data that was
available from two field test sections. The materials used
at the test sections included a limestone aggregate base
course and a sand-gravel subbase from Columbus Air Force
Base, Columbus, Mississippi; and a sand-gravel subbase, and
a sand subgrade from the channelized traffic test section
No. 2 at the Waterways Experiment Station. The Corps used
these data to compare the after-traffic densities from the
field sections to those densities determined using the
gyratory compactor. The after-traffic and gyratory
densities were also compared to the modified AASHTO
compaction test results as well as the construction
densities. The Corps of Engineer conclusions showed a good
correlation between the gyratory computed construction
density and the final field density for the four

19
cohesionless subgrade and base materials tested. In
addition, they found that the densities obtained using the
proposed gyratory test procedure showed a better
correlation with the after-traffic densities than those
results obtained with the AASHTO compaction test (1962).
The above literature study shows evidence that
equilibrium under the tire pressures on the roadway should
logically be insured by using not less than the anticipated
maximum tire pressure in the compaction of the laboratory
specimen. The gyratory testing machine accomplished
kneading type compaction under any selected compaction
pressure and degree of kneading, thus it provided a
rational compaction test for the pavement design engineer.
The gyratory testing machine is called a testing machine to
distinguish it from a machine used for compaction purposes
only, since it is used for other tests including stability
or shear tests. This machine can record the shear stress
changing with time and height changing with time, so data
are easily obtained to calculate energy after each test,
without intending to do certain tests to get shear stress.
20
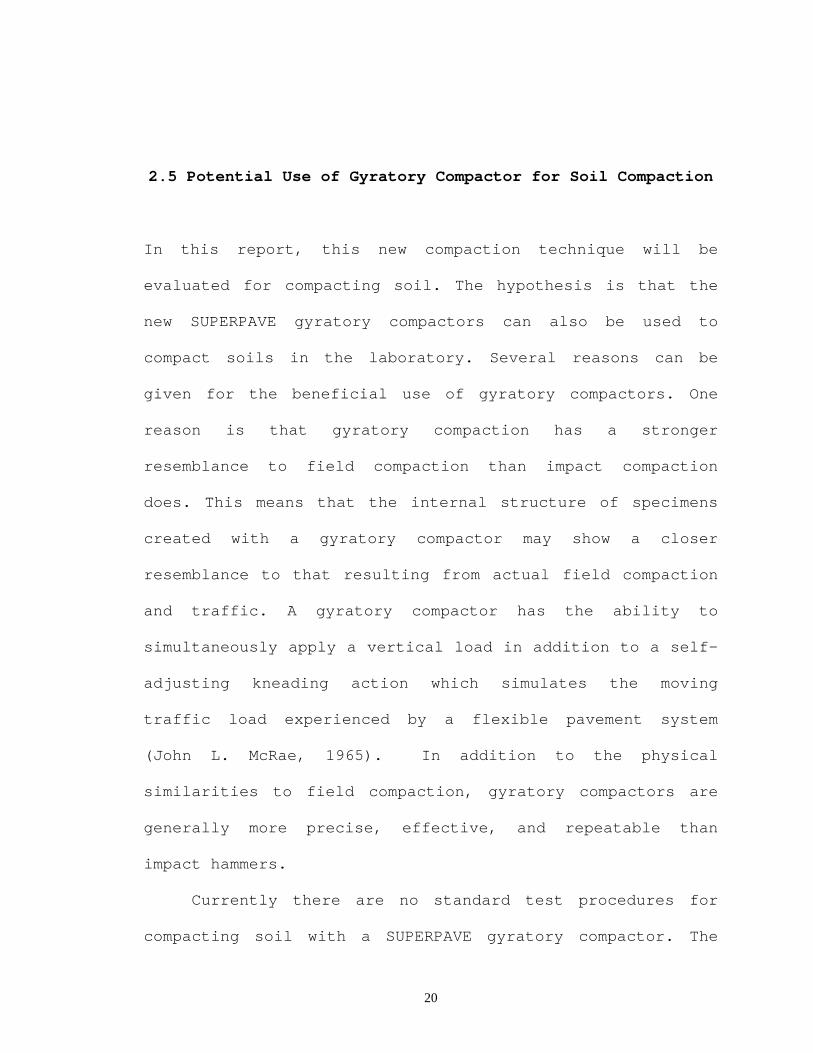
2.5 Potential Use of Gyratory Compactor for Soil Compaction
In this report, this new compaction technique will be
evaluated for compacting soil. The hypothesis is that the
new SUPERPAVE gyratory compactors can also be used to
compact soils in the laboratory. Several reasons can be
given for the beneficial use of gyratory compactors. One
reason is that gyratory compaction has a stronger
resemblance to field compaction than impact compaction
does. This means that the internal structure of specimens
created with a gyratory compactor may show a closer
resemblance to that resulting from actual field compaction
and traffic. A gyratory compactor has the ability to
simultaneously apply a vertical load in addition to a self-
adjusting kneading action which simulates the moving
traffic load experienced by a flexible pavement system
(John L. McRae, 1965). In addition to the physical
similarities to field compaction, gyratory compactors are
generally more precise, effective, and repeatable than
impact hammers.
Currently there are no standard test procedures for
compacting soil with a SUPERPAVE gyratory compactor. The
21
only previous research available was conducted using the
Texas gyratory soils press or the Army Corps of Engineers
GTM (1968, 1969). In this study, the gyratory compaction
variables will be studied to establish a standard test
procedure for soil compaction with a gyratory compactor.

22
Figure 2.1 Standard Proctor mold and hammer

23
Figure 2.2 Vibratory table and mold assembly

24
Figure 2.3 Schematic illustration of gyratory testing machine (U.S. Army Corps of Engineers)

25
CHAPTER 3
FIELD COMPACTION CHARACTERISTICS
3.1 Introduction
The main objective of this study is to evaluate the
applicability of laboratory gyratory compaction for
simulating field compaction. Correlations are necessary
between the density produced in samples of soil material
compacted by the gyratory compaction and the density
produced in the field compaction. Therefore the field test
was the first step in this research study.
Three field test sections were carried out for this
study. The materials used in these field test sections were
compacted in the laboratory with the gyratory compaction in
order to develop a compaction curve that serves as a
comparison to field compaction data. Through this
comparison, determinations were made on the effectiveness
of current construction specifications. The field tests
focused on construction sites utilizing sandy soils as
embankment or stabilized subgrade materials. These test
26
sites were selected for two reasons, first, sandy subgrades
are very common in Florida and second, sandy soils proved
to be the most difficult to use with the current impact
compaction standards.
3.2 Thomasville Road Field Test
The first field test was conducted on August 25, 1999. The
test section was part of the reconstruction of Thomasville
Road (U.S. 319) in Tallahassee, Florida.
3.2.1 Thomasville Road field test procedure
For the Thomasville Road field test, the stabilized
subgrade was placed on five test strips, each approximately
300 feet long and 25 feet wide (Figure 3.1). The test
strips were compacted at increasing levels of water
content, using an identical compaction pattern with two
different compactors. The first was a Dynapac CA 251
padfoot vibratory roller. This compactor weighs
approximately 25,000 pounds and features a 60 inch drum
with four inch pads. The second compactor was a Caterpillar
CS 563C smooth drum vibratory roller. It also weighed
25,000 pounds and had a 61 inch drum. The first test
27
section was mixed, to a depth of 12 inches, at the in-situ
moisture content (approximately 7%). Once the subgrade was
mixed, it was compacted using four passes of the sheepsfoot
roller followed by four passes with the smooth drum roller.
One pass is defined as both the forward and backward motion
of the roller. This compaction pattern was the standard
pattern being used by the contractor on the rest of the
project site. After compaction, density was measured at
three locations along the test strip. Density measurements
were accomplished using a nuclear density gage at depths of
six and 12 inches. In addition to the nuclear density
tests, a speedy moisture test was conducted to determine
the moisture content at each location. Once the density and
moisture measurements were taken, the strip was compacted
again using the same pattern. Density and moisture
measurements were repeated following the second compaction.
After the completion of the first test strip, work
moved to the second strip. The moisture content on the
second test strip was raised, from the in-situ moisture, by
running a water truck over the strip. Running the water
truck over the strip one time resulted in an increase in
moisture content by approximately two percent. The test
strip was then mixed and compacted using the same technique

28
used on the first, with density and moisture measurements
taken in the same manner described earlier. This procedure
was repeated on the five test strips with each strip
receiving more water than the previous one.
3.2.2 Thomasville Road field test results
The density and moisture data obtained during the field
test was used to develop field compaction curves at the two
different energy levels. The energy levels corresponded to
the number of compactor passes applied to the test strips.
The first energy level represented four passes each by the
sheepsfoot roller and the flat drum roller. The second
energy level reflected an additional four passes (eight
total) by each of the compactors. Although nuclear density
measurements were taken at depths of 12 and six inches, the
12 inches measurements proved to be more consistent and
therefore were used to analyze the field test results. The
compaction curves for the two energy levels are shown in
Figure 3.2. The soil is A-3 fine sand with about five
percent fines (Figure 3.3).
Evaluation of the field compaction data indicated some
variability. This variability of the data may have been
caused by the discrepancy of the compacted material at
29
different conditions. Figure 3.2 shows that the increase in
compactive energy during the field test had little effect
on the maximum dry density and the optimum moisture content
of the subgrade soil. In future field tests, it may be
necessary to start with a lower initial compactive effort,
in order to better define the relationship between
compactive energy and the maximum density and OMC.
3.3 Sun Coast Parkway Field Test
In February 2000, a second field test was conducted at the
Sun Coast Parkway construction site, near Brooksville,
Florida. The field test procedures follow:
3.3.1 Sun Coast Parkway field test procedures
The test procedures at the Sun Coast Parkway site were
slightly different than that used at the Thomasville Road
site due to the limitations of the test site area. The
length of the test site would not allow for the test strips
to be aligned adjacent to each other. To accommodate this
limitation, test strips were constructed in lifts on top of
each other. Three different adjacent areas were used to
construct these lifts. The first three lifts were
30
constructed in Area one (Figure 3.4), Area two was the site
of two lifts, and Area three was the site of the final
lift. The six test lifts were approximately 200 feet long
and 50 feet wide. The lifts were constructed so that the
after compaction thickness was approximately 12 inches. The
soil used during the field test was a yellow-brown sand
with approximately three percent fines, classifying it as
A-3 in the AASHTO classification system (Figure 3.3). The
soil was compacted with an Ingersoll-Rand SD 100 smooth
drum vibratory compactor. This compactor is very similar to
the smooth-drummed vibratory roller that was used for the
Thomasville Road field test. The compactor was operated at
its highest vibratory frequency and at maximum speed, in
accordance with the contractors usual operation.
The first test lift was compacted at the in-situ
moisture content at approximately four percent. After six
passes of the vibratory roller, density and moisture
measurements were taken at two locations in the center of
the test strip. Both the density and moisture measurements
were conducted using a nuclear density gage at depths of
six and 12 inches. After the measurements were completed
the test strip was compacted with an additional four passes
(10 total) of the compactor. Following the second

31
compaction, the density and moisture content of the strips
were retested. After the second set of measurements were
taken, the second test lift was constructed on top of the
first. Once the soil had been loosely placed, a water truck
was used to raise the moisture content of the test strip.
The second lift was then compacted in the same manner as
the first, and density and moisture measurements were
conducted after six and 10 passes. Using this same
procedure, the third test lift was constructed on top of
the second.
After the third test lift had been completed, the work
moved to the second test area. Test Area 2 was the site of
the next two test lifts. These lifts were put on embankment
soil that had been placed there previously by the
contractor. The embankment soil had been compacted to the
density required in the construction specifications and
provided the same support to the test lifts as was
experienced in Test Area 1. The fourth and fifth test lifts
were completed using the same procedure as described above,
with each test lift having a higher moisture content than
the previous one. The final test lift was constructed in
the third test area, on top of the previously compacted

32
embankment material. A summary of the compaction method and
test results is presented in Table 3.2
For the Sun Coast Parkway field test a compactive
energy study was conducted simultaneously on the same test
lifts by Ardaman & Associates, Inc. The test procedure and
test results can be found in a report submitted by Ardaman
& Associates, Inc (Ardaman & Associates, 2001). A schematic
plan and profile of this program for Test Site 1 is
presented in Figure 3.4. As shown, one earth pressure cell
was installed at the base of each lift, aligned with the
approximate centerline of the roller track.
3.3.2 Sun Coast Parkway field test results
As previously described for the Thomasville Road field
test, the density and moisture measurements taken during
the Sun Coast Parkway field test were used to develop field
compaction curves. During the Thomasville Road field test,
very little increase in density was achieved after eight
passes of the compaction equipment. For this reason, it was
determined that the compaction curves for the second field
test would start at a lower compaction level. The first
compaction curve for the Sun Coast Parkway field test
represented a level of compaction equivalent to four to six

33
passes of the field compactor. The second compaction curve
used data points taken after 10 to 12 passes. The Sun Coast
Parkway compaction data covered a wider range of moisture
content than the Thomasville Road compaction data. This
helped in constructing more complete compaction curves. By
using lower compaction energy levels than those used in the
first field test, a better correlation was made between
density and the number of roller passes in the field.
Although nuclear density measurements were taken at depths
of six and 12 inches, only the 12-inch measurements were
used for the compaction curves. As was experienced during
the Thomasville Road field test, nuclear density
measurements taken at a depth of six inches proved to be
inconsistent.
The low fine content of the soil presented a problem
which was keeping the test strips at the water content
above approximately eight percent during the field test.
The free draining soil would not hold large amounts of
water unless an excessive amount of water was applied. As a
result, the moisture measurements during the field test
tended to be on the low side of optimum. Even with this
phenomenon, the contractor did not experience any
difficulty bringing the soil to the required density; once
34
again showing that the current construction specifications
for sandy soils are not representative of field conditions.
In addition to the low moisture contents, several density
measurements taken from the first test lift had to be
disregarded. Several of the 12-inch density measurements
taken from the first test lift were excessively high
suggesting that the test depth was at or near the interface
between the natural ground and the fill soil. The remaining
data points were used to develop the compaction curves seen
in Figure 3.5.
As can be seen in Figure 3.5, the maximum density on
the four to six pass compaction curve is 107 lbs/ft3 and the
optimum moisture content is approximately twelve percent.
When the compactive energy was increased to 10 to 12 passes
of the compactor, the maximum density increased to 110
lbs/ft3. The highest density on the 10 to 12 pass curve
occurred at a slightly lower moisture content than the
maximum density on the four to six pass curve. This result
is consistent with the hypothesis presented in the
literature review of this report.
The magnitude of the peak dynamic impact stress
measured during the roller pass is plotted versus the
number of passes and compactor travel speed in Figure 3.6.

35
As shown, the peak stress tends to increase slightly at the
first three passes. This observation may reflect that a
slight increase in soil stiffness accompanying the
increasing dry density is causing slight increases in the
vertical roll displacement and thus the apparent increase
in the applied dynamic stress amplitude.
The data in Figure 3.6 suggest that the peak stress is
not highly dependent on the compactor travel speed when the
compactor is operated at conventional speeds (i.e., between
4 and 6 feet per second or about 3 to 4 mph). However,
considerably higher peak dynamic stress magnitudes were
measured at travel speed slower than about 2 feet per
second. Considering an average vibration frequency of 28.5
Hertz, the impact spacing at travel speeds less than about
2 feet per second is less than one inch. As illustrated in
Figure 3.6, a slight heave of the fill surface was observed
just ahead of the roller (which is typically expected for
cohesionless materials). Since this surface “heave” is
likely less stiff which may have a higher damping
potential, lower peak stresses may be expected at higher
travel speeds (i.e., where the impact spacing increases
such that the drum impacts the heaved surface).

36
Peak impact stresses measured during low and high
amplitude vibratory compaction at conventional travel
speeds (4 to 6 feet per second) are also plotted versus
depth in Figure 3.6. The relationship of dry unit weight
versus number of passes is plotted in Figure 3.7.
3.4 State Road 56 Field Test
The third and final field test was conducted on November
20, 2000. The location of the field test was the State Road
56/I-75 interchange construction site near Land O’Lakes,
Florida. As was the case with the Sun Coast Parkway field
test, Ardaman & Associates, Inc. conducted a compactive
energy study concurrently with the field test.
3.4.1 SR 56 field test procedures
The field test was conducted in an area where the
contractor was placing embankment material. The embankment
material used was a native soil excavated on site and
placed as roadway fill. The excavated soil was an A-3 loamy
sand with approximately two percent fines. The soil was
placed in test lifts that were approximately 300 feet long
and 50 feet wide and to a depth of 12 inches after
37
compaction. Due to the fact that the soil was excavated
immediately prior to being placed on the test lifts, the
initial moisture content of the soil was wet of optimum
(approximately 13 to 14 percent). Soil for the first test
lift was placed loosely at this high moisture content. The
field equipment used to compact the test lifts was a
Dynapac CA 251 smooth-drummed vibratory roller. This is the
same model compactor used during the Thomasville Road field
test, with the exception of the drum type.
Initial compaction of the first test lift was
accomplished by making four passes with the compactor. One
pass is considered the forward and backward travel motion
of the roller. After the four passes had been completed,
density and moisture measurements were taken at a central
location in the test lift. The density measurement was
conducted using a nuclear density gage at a depth of 12
inches and the moisture measurement was made with a speedy
moisture gage. After the density and moisture levels were
documented, an additional four passes (eight total) were
made with the compactor. After the eighth pass, the density
and moisture were again checked. At this point the density
still failed to reach the required density for roadbed
material, due to the high moisture content. The compactor

38
continued to make passes on the test lift in order to bring
the density up to the specification requirements. After
making 20 passes with the compactor, the lift still failed
to reach the required density and therefore could not be
left in place. Because compacting the soil at such a high
water content proved to be ineffective along with the
desire to conduct test lifts at lower moisture contents,
the first test lift was milled up and allowed to dry
overnight. In addition to the first test lift, a second
lift was placed loosely in an adjacent area so that the
soil could dry overnight.
After drying, the moisture content of the soil from the
first test lift dropped approximately three percentage
points. The loose soil was smoothed out and compacted in
the same manner previously described. The resulting lift
was considered the second test lift. After four passes of
the compactor were completed, density and moisture
measurements were taken at several locations along the test
lift, in order to provide a wider range of moisture
contents. Several density and moisture measurements were
also taken after eight passes had been completed. Reaching
the required density proved to be much easier at the lower
moisture content. The additional soil that was dried

39
overnight was then placed on top of the completed second
lift. This third test list was compacted using the same
procedure as the rest with density and moisture
measurements taken at several locations along the lift,
after four and eight passes of the compactor. Due to the
amount of time required to dry additional soil, the third
lift was the final lift of the field test.
3.4.2 SR 56 field test results
The density and moisture measurements taken during the
State Road 56 field test were once again used to construct
field compaction curves. One difference between the State
Road 56 field compaction curves and the other field curves
is that the moisture range was considerably smaller. Due to
the fact that the in-situ moisture content of the field
soil was above optimum, compaction data was only available
over a small range. The compaction data corresponding to
four and eight passes of the compactor can be seen in
Figure 3.8.
Although proper field compaction curves could not be
established, comparisons are still useful between the peak
densities achieved during the field tests with those found
using the Modified Proctor laboratory test. The maximum
40
density obtained from the Modified Proctor test is
approximately 113 lbs/ft3. This density is 0.5 lbs/ft3 less
than the peak density achieved after four passes of the
field compactor and 1.0 lbs/ft3 lower than the eight passes
peak density. If current stabilized subgrade construction
specifications were applied to this Modified Proctor
result, the required density would be 110.4 lbs/ft3, much
lower than the densities obtained during the field test.
Due to the small moisture range tested in the field,
comparisons are difficult between the effect of moisture
content for this soil, although the field test results
clearly show that densities greater than those required by
current specifications can be achieved.

41
Table 3.1 Thomasville road field compaction results
Number of Passes
Water Content
(%)
Dry Unit Weight
(pcf)
at 12” Depth
7.0 111.6 8.6 111.5
10.6 111.3
10.6 112.5
10.8 113.8
10.8 113.9
11.9 111.5
12.2 109.0
8 passes
12.9 106.7
9.1 108.9
10.6 110.9
10.6 111.5
10.8 112.8
11.0 112.7
11.2 113.6
12.2 111.5
16 passes
14.1 110.1

42
Table 3.2 Summary of compaction test method and results for Sun Coast Parkway
Test Area No.
Lift No.
Pass No.
Frequency (vpm) Amplitude
Travel speed
(ft/sec.)
Water Content
(%)
Dry Unit Weight (pcf)
Remarks
1-6 1710 High 3.7 5.0 106.67-12 1715 High 3.7 4.4 108.6
13-16 1735 High 3.7 13.9 105.9Water was added to meet
the Lab optimum MC1-6 1710 High 6.2 6.2 106.16-12 1710 High 6.3 5.4 109.3
13-16 1710 High 6.3 15.8 104.9Water was added to meet
the Lab optimum MC1-4 1620 High 4.3 6.8 105.35-9 1620 High 1.3 5.8 109.3
10-15 1750 High 1.3 5.7 110.11-6 1840 Low 6.3 10.9 103.57-12 1840 Low 6.3 7.8 108.01-6 1840 Low 6.3 12.8 103.07-12 1840 Low 6.3 9.4 107.71-6 1710 High 6.3 8.0 106.87-12 1710 High 6.3 7.0 110.0
Compactor type: Ingersoll-Rand SD 100 smooth drum vibratory compactor
63
42
1
2
5
1
3

43
Table 3.3 State Road 56 field test results
Number of Passes
Water Content
(%)
Dry Unit Weight
(pcf)
at 12” Depth
9.7 113.6
10.3 112.1
10.4 111.9
10.6 112.8
11.7 113.2
11.7 111.7
11.7 109.7
Field
4 passes
12.8 106.4
10.8 112.7
11.9 114.1
12.6 110.6
Field
8 Passes
13.5 107.6
44
Thomasville Road Field Test Layout Figure 3.1 Thomasville Road field test layout, density and moisture
test
Density and moisture measurements locaiton
Test Strip #1
X X
Test Strip #3
X XTest Strip #2
X X
Test Strip #4
X
Test Strip #5
X
≈ 300 ft
≈ 25 ft
Dynapac CA 251 PD Specifications: Drum diameter (inch) 60 Drum width (inch) 93 Drum module weight (lb) 14,690 Speed range (mph) 0-6 Nominal amplitude (inch) High 0.064 Low 0.031 Centrifugal force (lb) At high amplitude 56,025 At low amplitude 32,870
Caterpillar CS-563C Specifications: Drum diameter (inch) 60 Drum width (inch) 84 Drum module weight (lb) 12,540 Speed range (mph) 0-8 Nominal amplitude (inch) High 0.067 Low 0.034 Centrifugal force (lb) Maximum 56,025 Minimum 32,870

45
Figure 3.2 Thomasville Road field compaction results
Thomasville Road Field Test Compaction Results
106
108
110
112
114
116
118
120
122
124
126
6 7 8 9 10 11 12 13 14 15 16
Water Content, %
Dry
Uni
t Wei
ht, p
cf
8 Passes16 Passes
Zero Air Voids, Gs = 2.65
S = 85%, Gs = 2.65
S = 70%, Gs = 2.65
46
10 1 10 0 10 -1
Gra in D iam eter, m m
0
10
20
30
40
50
60
70
80
90
100
110
Thom as ville R oad (SR 319)Sun C oas t Parkw ay
Perc
ent F
iner
Thom as ville Road Cu=2.26 Cc=1.4
Sun C oas t Parkw ay C u=2.3
C c=1 .13
Figure 3.3 Grain size distribution

47
Earth pressure cell
Figure 3.4 Sun Coast Parkway field test layout and earth pressure cell
Test Area 1 3 Test Strips
Test Area 2 1 Test Strip
Test Area 3 2 Test Strips
≈ 200 ft
≈ 50 ft

48
Sun Coast Parkway Field Compaction and Lab Proctor Compaction Results
101
102
103
104
105
106
107
108
109
110
111
112
113
114
115
116
117
118
119
2 3 4 5 6 7 8 9 10 11 12 13 14 15 16 17 18Water Content, %
Dry
Uni
t Wei
ght,
pcf
Field test, 12" depth, 10 to 12 passesField test, 12" depth, 4 to 6 passesModified ProctorStandard Proctor
LL
Field test, 12" depth, 10 to 12 passes
Field test, 12" depth, 4 to 6 passes
Modified Proctor
Standard Proctor
L L
L - Compacted in low vibratory amplitude mode
L
Zero Air Voids, Gs = 2.65
S = 85%, Gs = 2.65
S = 70%, Gs = 2.65
Figure 3.5 Sun Coast Parkway field test results
49
Figure 3.6 Measured peak stress amplitude versus number of passes, compactor travel speed, and depth below surface
20
30
40
50
60
70
80
0 1 2 3 4 5 6 7 8 9
Number of Passes (Two-way)
Peak
Str
ess,
psi
High Amplitude Compaction Mode, depth=9", Compactor Travel Speed=6.1-6.5 ft/sec.
0102030405060708090
100110120
0 1 2 3 4 5 6 7Compactor Travel Speed, ft/sec.
Peak
Str
ess,
psi
Depth: 8" to 12"
Depth: 18" to 24"
0
5
10
15
20
25
0 10 20 30 40 50 60Peak Stres, psi
Dep
th B
elow
Sur
face
, inc
h
Low Amplitude Compaction Mode
High Amplitude Compaction Mode
50
Figure 3.7 Dry unit weight versus number of passes at Sun Coast Parkway field test
0 4 8 12 16 20
96
100
104
108
112
NUMBER OF PASSES (TWO WAY)
SUNCOAST PARKWAY TEST SITE
SYMBOL MODE SPEED
STATIC AVG .4.0 ft/sec LOW AMP. AVG.5.2 ft/sec
HIGH AMP. AVG.6.3 ft/sec
HIGH AMP. AVG.1.5 ft/sec
DR
Y U
NIT
WE
IGH
T, l
b/ft
3

51
Figure 3.8 State Road 56 field test results
S tate R oad 56 F ie ld Test C om paction R esu lts
106
107
108
109
110
111
112
113
114
115
8 9 10 11 12 13 14W ater C ontent, %
Dry
Uni
t Wei
ght,
pcf
4 P asses8 P asses
52
CHAPTER 4
LABORATORY COMPACTION CHARACTERISTICS
4.1 General
After the field test study of the Sun Coast Parkway and
Thomasville Road sites, the next step was to develop a
comprehensive laboratory test program to evaluate the most
suitable compaction test procedures for soil compaction.
The primary objective of this chapter is to evaluate the
compaction characteristics of soils obtained from the field
study. In this chapter, experiments were focused on the
characteristics of gyratory compaction and test program. In
addition, other two widely used laboratory compaction
techniques, impact compaction method and a vibratory
compaction method were also examined for the comparison.
4.2 Laboratory Testing Program
Several soil types were used during the laboratory
evaluation. The soils were chosen to represent the types of

53
material that are commonly used for stabilized subgrade in
Florida. These soils included the silty sand, and the fine
sand from State Road 319 and Sun Coast Parkway. The basic
properties of the soils are listed in Table 4.1.
For the first two A-3 soils, field tests were
available to compare with the results of laboratory
compaction test. But for the two A-2-4 soils, no
corresponding field test exists. Therefore, the Modified
Procter test and vibratory compaction test were used as the
comparison curves.
In the laboratory experimental program, several test
methods were used:
• Impact compaction test method
• Vibratory compaction test method
• Gyratory compaction test method
In these three test methods, the gyratory compaction method
was the main focus for evaluation. The impact and vibratory
compaction methods were used for comparisons.
4.3 Impact Compaction Method
As stated earlier in this report, impact compaction is the
most common type of laboratory compaction used today. The
popular impact compaction test procedures are the Standard

54
and Modified Proctor tests (AASHTO T 90 and T 180). A
majority of the states use results obtained from these two
test procedures to specify density requirements for roadway
construction. Currently, Florida requires stabilized
subgrade to be compacted to 98 percent of the maximum dry
density determined from the Modified Proctor test, and
embankment materials to be compacted to 100 percent of the
maximum Standard Proctor density.
The field and laboratory compaction curves of the
Thomasville Road A-3 soil and the Sun Coast Parkway A-3
soil are presented in Figures 4.1 and 4.2 following the
modified Proctor compaction test. The modified Proctor
compaction curve does not simulate the field compaction
curve very well, due to too much difference between them.
The laboratory optimum moisture content was much higher
than the OMC in the field, and the maximum dry unit weight
was much lower than the field test value.
4.3.1 Modification of impact compaction method
From the literature study, the two factors that affect the
soil compaction are the water content and compaction
efforts applied to the soil. With the increase of
compaction efforts, the maximum dry unit weight would
increase and the OMC would decrease, e.g., the change from

55
Standard Proctor to Modified Proctor compaction. If the
impact compaction test procedure is further modified from
the Modified Proctor Compaction, it may still be a good
technique to simulate field results. Thus, in this study
the compaction effort was further increased to conduct
other higher energy compaction curves. The test soils
included a silty sand (A-2-4) from Alford City, a clayey
sand (A-2-6) from Clay County, and a fine sand (A-3) from
Lake City. The test procedures for the modified impact
compaction methods in this study are the following:
• 10 lb hammer with 25 blows per layer (Modified
Proctor),
• 10 lb hammer with 50 blows per layer (Augmented
Modified Proctor A),
• 15 lb hammer with 25 blows per layer (Augmented
Modified Proctor B),
• 15 lb hammer with 50 blows per layer (Augmented
Modified Proctor C),
The laboratory investigation of the soil began by
producing a Modified Proctor compaction curve for the soil.
After this, an additional compaction curve was created by
increasing the number of hammer drops on each lift of soil
from 25 to 50. Compaction curves were also developed at two

56
other energy levels. These included a 15 lb hammer at 25
blows per lift, and a 15 lb hammer at 50 blows per lift.
4.3.2 Impact compaction test results
The impact compaction test results are summarized in Tables
4.2, 4.3, 4.4 and are shown in Figures 4.3, 4.4, 4.5 for
Alford City A-2-4 soil, Clay County A-2-6 soil, and Lake
City A-3 soil, respectively. From these figures, for the A-
2-4 Alford City soil and A-2-6 Clay County soil, with the
increase of the compaction effort, an increase of the
maximum dry unit weight and decrease of the water content
occurred. However, for the A-3 Lake City soil, increasing
the weight of the hammer had little or no effect on the
maximum density. Due to a lack of cohesion in pure sand made
using impact compaction difficult. The bell-shaped
compaction curve could not be developed. The inability of
the impact compaction to consistently produce the bell-
shaped compaction curve for the cohesionless soil was the
primary drawback.
The impact compaction test results for four additional
soils are summarized in Tables 4.5, 4.6, 4.7, 4.8 and shown
in Figures 4.6, 4.7, 4.8. The compaction curves showed
little effect from the increased hammer weight. This result
was consistent with the A-3 soils that had been tested in

57
the laboratory previously. As can be seen in Figure 4.6,
the maximum dry density that was achieved in the laboratory
was approximately 113 lbs/ft3 for the Thomasville Road A-3
soil.
4.4 Vibratory Compaction Method
The vibratory test method is used to determine the dry unit
weight of the cohesionless free-draining soils for which
impact compaction will not produce a well-defined moisture-
density relationship curve. In this study the vibratory
table and test procedure (ASTM D4253) were used to develop
the compaction curves.
4.4.1 Vibratory compaction test results
The vibratory compaction test results for the four types of
soil are summarized in Tables 4.5, 4.6, 4.7.and 4.8. The
water content and density relationship curves are plotted
for the Sun Coast Parkway and Thomasville Road soils, shown
in Figure 4.9. These curves were also plotted in Figures
4.1 and 4.2 with the other three compaction curves. From
these figures, the results show that the densities from the
vibratory compaction are much lower than the field test
results and the corresponding OMC is much higher than the
58
field OMC. If the laboratory OMC is used to compact the
soil in the field, it will not reach the desired dry unit
weight in the field as in the laboratory since the
laboratory OMC is much higher than the corresponding field
OMC. In order to be comparative, another two soils, A-2-4
with 12% fines and A-2-4 with 24% fines were also compacted
to develop compaction curves using the vibratory table. The
compaction curves for the A-2-4 soils are shown in Figure
4.10. The data show that the vibratory compaction may be
suited for compacting A-2-4 silty sand.
4.4.2 Concerns about vibratory compaction
During the vibratory test, two disadvantages resulted:
1. The time to conduct this test was lengthy. At least
six minutes were needed after filling the soil into
the mold to create evenly distributed soil and at
least an additional eight minutes to perform the
test. The mold and surcharge set up was quite
complicated. The whole test took at least 30 minutes.
2. Due to the unmovable bottom of the mold, difficulty
was encountered in removing the sample from the mold.
It is not similar to the impact and gyratory methods
that use some tool or air pressure to remove the soil
specimen easily.

59
The vibratory test has not been widely used recently.
Due to the above disadvantages it may not be a suitable
technique for further development.
4.5 Gyratory Compaction Method
`
From the above laboratory compaction investigation,
apparently both the impact compaction and vibratory
compaction methods have some problems needing further
improvements. Therefore an alternative technique is needed
to better simulate the field compaction characteristics.
As mentioned previously in this report, gyratory
compaction is one laboratory compaction method that has
shown considerable promise. History on the development of
gyratory compaction equipment and its testing procedures
are provided in Chapter 2 of this report. Some initial work
has been done (Leonard, 2002). The gyratory compaction
curves are presented in Figures 4.1 and 4.2. From these
curve comparisons, the results show that the gyratory
compaction has much potential to simulate the field test
results. Currently, no published test procedures exist for
compacting soils with a SUPERPAVE gyratory compactor. To
date, the majority of research conducted on using gyratory
compaction has focused on the characteristics of SUPERPAVE

60
asphalt mixtures. In the following sections of this
chapter, an initial study is presented for evaluating the
characteristics of gyratory compaction variables, and an
attempt is made to develop a gyratory standard test
procedure to simulate the field test results.
4.5.1 Gyratory compactor
The gyratory compactor used in this study was supplied by
the Industrial Process Controls Ltd. (IPC) Servopac
Gyratory Compactor (Figure 4.11). The Servopac is a fully
automated, servo-controlled gyratory compactor originally
designed to compact asphalt mixes by means of the gyratory
compaction technique. Compaction is achieved by
simultaneous action of static compression and the shearing
action resulting from the mold being gyrated through an
angle about its longitudinal axis.
The Servopac was designed to automatically compensate
(under servo-feedback control) and to maintain the gyratory
angle constant during compaction, and to provide a means to
simply and quickly adjust the critical parameters. The
servo-feedback control enables it to provide more accurate
and consistent results, provides a powerful tool to
evaluate optimum parameter settings, and allows ready

61
adjustment should future work indicate that settings be
changed.
In plan view (Figure 4.12), three actuators are
located 120 degrees apart around the outside diameter of
the mold carrier ring. To each of these actuators, the
electronic control system sends a sine wave via a
servovalve. The three sine waves are out of phase from
each other by 120 degrees. The amplitude of the sine wave
controls the angle, and the frequency of the sine wave
controls the gyration rate. The feedback signal comes from
the displacement transducer which bears directly on the
bearing that connects the actuator rod to the mold.
Since the Servopac uses servovalves for both gyratory
angle and vertical load, the response time is generally
faster than systems that use electromechanical drives. The
servo-control operation of the machine allows the vertical
stress, gyratory angle, and gyration rate to be quickly
modified from a hand-held pendant or personal computer(PC).
An optional PC ‘Windows’ interface (Figure 4.13) provides a
screen to place data on test parameters and display and
plot either height, density, or angle against gyratory
cycles in real time. Test data may be stored and retrieved
or transferred to other analyses packages. The Servopac is

62
designed to comply with SHRP SUPERPAVE asphalt mix design
requirements.
When compacting specimens using gyratory compaction,
four factors influence test results. These factors are the
gyration angle used, the vertical pressure applied, the
rate of gyration, and the number of gyration cycles. The
Servopac is capable of producing gyration angles between
zero and three degrees, gyration rates up to 60 gyrations
per minute, and vertical pressures as high as 600 kPa for
as many as 999 gyration cycles.
4.5.2 Initial investigation of gyratory variables
The gyratory machine has four variables which are the main
factors effecting the compaction characteristics. The
variables are gyration angle, gyrations, vertical pressure,
and gyration rate. Therefore, the initial study conducted
for this project concentrated on the influence of these
variables during laboratory compaction.
4.5.2.1.Vertical pressure
From the reference (U.S.Army, 1969), an increase in
vertical pressure causes a consistent increase in unit
weight during compaction. Therefore, for laboratory
compaction, the vertical test pressure should be set
63
equivalent to the anticipated, approximate tire contact
pressure to which the pavement will be subjected. The
vertical stress in the soil compaction should be close to
the soil stress developed in the field compaction test.
The field measured soil peak stress amplitudes versus
the number of passes are shown in Figure 4.14. From this
figure, the data show that for both SR 56 and Sun Coast
Parkway soils, the peak stress achieved is about 40 psi
which is approximately 280 kPa. Therefore in this study the
100 kPa, 200 kPa, 300 kPa, 400 kPa, 500 kPa were chosen as
the range of vertical pressures for evaluation.
4.5.2.2.Gyration angle Researchers usually acknowledge that a gyratory angle has
some effect on soil compaction. Early work (Kadar,1992)
indicated that the setting of the gyratory angle is more
sensitive at the lower gyratory angles used by some
European groups than as specified by SHRP (1.0° - 1.25°).
SUPERPAVE specification uses a 1.25 degree angle for
compacting asphalt mixtures.
From the literature study, a 1.25 degree angle is a
reasonable value to choose. This value is for compacting
asphalt concrete material. For the soil the gyration angle
should not be higher than 1.25 for its lower stiffness than
64
the asphalt concrete material. For the Servopac Gyratory
test machine, the recommended minimum gyration angle is
1.0. If it is less than 1.00 degree, it requires an
adjustment of the PID controls of the Servopac for the best
response. When the gyration angle is lower than the 1.00,
the void is increased too much with the increase of the
gyration angle. When it is between 1.00 degree and 2.00
degrees, the void ratio becomes more stable. So in this
project a range of 1.00-1.25 degrees was chosen to be the
range of gyration angle.
4.5.2.3. Number of gyrations
Notations from the literature show that by increasing the
number of gyrations, a consistent increase of the unit
weight is produced. The gyrations needed to be adjusted to
get the desired dry unit weight. In order to test the
characteristics of the range of gyrations in this project,
30,60,90 gyrations were chosen to test each of two field
test soils.
4.5.2.4.Rate of gyration
The effect of the rate of rotation was evaluated with a
series of tests on A-2-4 soil where all other parameters
were held constant with the exception of the rate of

65
gyration, which was varied. The per-minute rates of
gyrations selected were 10, 20 and 30. The results are
summarized in Table 4.9 and are shown in Figure 4.15. The
results confirmed previous SHRP work (Cominsky et al,
1994), that little variation was obtained through different
rates of rotation and this appeared to be applicable at any
angle. For this study 20 gyrations/minute were chosen which
took 4.5 minutes to finish one test at 90 gyrations, a
reasonable time for the test.
4.5.3 Test conditions A gyratory testing program was conducted using soils from
two of the field tests and two types of A-2-4 soil that is
the popular Florida subgrade soil. From the above
investigation of Servopac Gyratory machine variables, ten
different test conditions were used for the gyratory
compaction. The test conditions included combinations of
two different gyration angles (1.0 degree and 1.25
degrees), five different levels of vertical stresses (100
kPa and 200 kPa, 300 kPa, 400 kPa, 500 kPa), and three
types of gyrations (30,60,90).
During compaction, two of the three variables were
held constant while the third was allowed to vary through a

66
given range of values. This procedure was repeated for each
of the three variables.
4.5.4 Test procedure One issue that came to light during the initial testing
program was the loss of water experienced by those samples
having a high water content. At lower compactive energies
the water seepage was not as severe, but a higher water
content could not be maintained during the gyratory
compaction process, particularly at the high compaction
efforts. The water was squeezed out of the sample, and
frequently final water contents were two to three percent
lower than the initial water content. For the A-3 and A-2-4
soil, generally when the water content was higher than 11%,
the water began to seep out of the soil sample. As the test
energy and most importantly the test duration was
increased, water loss became a major problem in determining
proper dry unit weights.
The PC based software used to determine wet densities
of the samples after compaction, bases the wet density on
the weight of the sample prior to compaction. If
significant water loss is experienced during compaction,

67
the post-compaction sample weight is considerably less than
the pre-compaction weight. Therefore, the wet density
provided by the Servopac software may be inaccurate. If the
wet density, based on the pre-compaction weight, is used in
conjunction with the moisture content calculated after
compaction, the resulting dry density will be higher than
the actual density achieved during the test.
This problem was experienced in samples with moisture
contents wet of optimum. This phenomenon resulted in a
compaction curve that did not peak but rather flattened out
when the moisture content reached optimum. If the water
loss was too excessive, the curve did not peak at all but
rather continued to rise over the entire moisture content
range. This result can be seen in several of the compaction
curves developed during the initial program (Figure 4.16).
Because of this problem, the densities of samples
cannot be used for comparison with other laboratory and
field test results. To remedy this situation, tests
conducted after the initial phase of the program did not
use the wet density provided by the Servopac software.
Instead, the following modified test procedure was used.
After the gyration was finished, the data file was
saved and the height of the sample recorded. The sample was
removed from the mold and the soil sample was weighed.

68
About 100 g of soil were needed from the middle of the
sample to measure the water content.
From the weight, height, diameter, and water content,
the dry unit weight was obtained.
( )wHD
W
+×
×
×
=
12
2
πγ
samplesoilofcontentwaterwsamplesoilofheightH
mmDmoldofdiameterDsamplesoilofweightW
samplesoilofweightunitdry
==
===
=
150
γ
The height of the sample after compaction was obtained
from the software, in order to calculate the after
compaction volume of the sample. This volume was then used
with the after compaction weight of the sample to calculate
the appropriate wet unit weight and dry unit weight.
4.5.5 Gyratory compaction test results The Gyratory test results for the four types of soil are
summarized in Tables 4.10, 4.11, 4.12, and 4.13. The
results are presented in Figures 4.17, 4.18, 4.19, and
4.20, for the Thomasville Road soil, Sun Coast Parkway
soil, A-2-4 soil with 12% fines, and A-2-4 soil with 24%
fines, respectively.

69
During the initial investigation for the two field
test soils from Thomasville Road and Sun Coast Parkway, the
compaction test was conducted with different levels of
gyrations while the sample was in the mold. Only one sample
was used with each mixing water content, to record the
different height from the PC software to get different dry
unit weights with 30, 60, and 90 gyrations. After
consideration of the water seepage during compaction, the
procedure was changed. Because the water seeped during the
test, the water content and weight of the sample were not
equal to the water content and weight of sample when the
test was finished. Therefore, in order to get a more
accurate test results, during the test of A-2-4 12% and A-
2-4 24% soil compaction, different samples were used for
each level of gyrations at 30, 60 or 90. When the gyration
reached the preset number, the water content and weight of
the samples were measured to obtain the unit weight. The
gyratory test results are further analyzed in the next
chapter.

70
Table 4.1 Soil materials for laboratory evaluation
Location Visual
Description
AASHTO
Classification
% Passing
No. 200
Sun Coast
Parkway
Fine Sand A-3 3%
Thomasville Road
(SR 319)
Fine Sand A-3 6~8%
Silty sand1 Silty Sand A-2-4 12
Silty sand2 Silty Sand A-2-4 24

71
Table 4.2 Summary of impact compaction data for Alford City A-2-4 soil
Test Procedure
Water Content
(%)
Dry Unit Weight
(Pcf)
5.3 122.00
6.4 124.80
7.2 126.64
8.1 128.14
10 lb Hammer, 25 Blows/layer
(Modified Proctor)
9.4 126.30
5.4 126.66
6.3 129.20
7.4 130.60
8.2 130.71
10 lb Hammer, 50 Blows/layer (Augmented Modified Proctor A)
9.1 127.40
5.3 126.32
5.9 129.12
6.1 130.80
6.8 132.08
7.8 130.50
15 lb Hammer, 25 Blows/layer (Augmented Modified Proctor B)
8.4 129.76
5.1 131.11
5.7 133.66
15 lb Hammer, 50 Blows/layer (Augmented Modified
6.2 134.49

72
7.2 134.38
7.9 132.40
Modified Proctor C)
8.2 131.09
Table 4.3 Summary of impact compaction data for Clay County A-2-6 soil
Test Procedure Water Content
(%)
Dry Unit Weight
(Pcf)
7.8 121.73
8.0 122.36
9.0 124.86
9.2 125.29
9.6 127.29
10 lb Hammer,
25 Blows/layer
(Modified
Proctor)
11.4 123.61
7.4 125.23
7.7 126.98
8.9 130.72
9.2 130.47
9.5 129.41
10 lb Hammer,
50 Blows/layer
(Augmented
Modified
Proctor A)
11.3 124.29
7.1 128.04
8.1 130.00
8.3 129.95
9.1 129.69
15 lb Hammer,
25 Blows/layer
(Augmented
Modified
Proctor B) 10.4 126.55
7.3 132.20 15 lb Hammer,
50 Blows/layer 8.3 133.16

73
8.6 132.60
8.8 132.50
(Augmented
Modified
Proctor C) 11.0 124.72
Table 4.4 Summary of impact compaction data for Lake City A-3 soil
Test Procedure Water Content
(%)
Dry Unit Weight
(pcf)
8.8 104.59
10.1 104.81
10.9 105.13
11.9 104.98
10 lb Hammer,
25 Blows/layer
(Modified
Proctor)
12.4 105.15
8.8 106.20
9.8 105.85
11.0 106.37
11.6 106.38
10 lb Hammer,
50 Blows/layer
(Augmented
Modified
Proctor A) 12.5 106.55
8.9 103.65
9.9 104.45
11.1 104.76
11.5 104.89
15 lb Hammer,
25 Blows/layer
(Augmented
Modified
Proctor B) 13.0 105.26
103.7 105.85

74
104.5 105.88
104.8 106.18
104.9 106.07
105.3 107.33
103.7 106.96
15 lb Hammer
50 Blows/layer
(Augmented
Modified
Proctor C)
104.5 106.39

75
Table 4.5 Summary of lab compaction test results for Thomasville Road project
Compaction Test Water Content
(%)
Dry Unit Weight
(pcf)
8.2 109.82
9.1 109.43
9.6 109.48
10.6 110.51
11.7 111.05
12.2 110.67
13.2 109.23
10 lb hammer,
25 blows/layer
(Modified
Proctor Test)
13.5 108.93
8.2 111.37
9.1 111.88
10.4 112.61
11.2 112.95
10 lb hammer
50 blows/layer
(Augmented
Modified
Proctor A) 11.9 112.3
9.2 109.69
9.9 110.25
10.1 110.71
11.4 110.89
15 lb hammer
25 blows/layer
(Augmented
Modified
Proctor B) 12.8 109.04
8.9 110.98
10.4 112.53
11.0 112.65
11.4 112.67
15 lb hammer
50 blows/layer
(Augmented
Modified
Proctor C) 12.5 110.67
8.0 107.76
10.1 109.66
12.0 109.51
Vibratory
Compaction
12.6 105.5
8.3 110.53
9.0 112.02
10.2 112.40
11.0 113.22
Initial
Gyratory
Compaction
12.3 111.06

76
Table 4.6 Summary of lab compaction test results for Sun Coast Parkway project
Test
Procedure
Water Content
(%)
Dry Unit Weight
(pcf)
11.0 103.60
12.9 104.00
14.6 104.50
Lab
Standard
Proctor
17.3 101.60
9.0 105.50
10.8 106.00
13.1 106.20
Lab
Modified
Proctor
15.1 104.30
8.3 104.00
10.0 105.60
12.1 105.30
Vibratory
Compaction
(Laboratory)
13.5 100.00
7.8 106.97
9.6 107.15
10.7 107.44
Initial
Gyratory
Compaction
11.8 107.07

77
Table 4.7 Lab Impact and vibratory compaction test results (A-2-4 12% soil)
Test
Procedure
Water Content
(%)
Dry Unit Weight
(Pcf)
7.4 110.89
10.3 111.32
12.0 111.97
Modified
Proctor
Compaction
Test 12.5 110.11
9.0 106.32
10.3 111.42
11.9 111.48
Vibratory
Compaction
Test
12.3 110.03

78
Table 4.8 Lab impact and vibratory compaction test results for A-2-4 24% soil
Test
Procedure
Water Content
(%)
Dry Unit Weight
(pcf)
7.8 115.61
9.3 116.48
11.3 116.52
Modified
Proctor
Compaction
Test 12.5 113.72
7.5 106.75
9.1 108.60
10.3 111.89
Vibratory
Table
Compaction
Test 11.3 110.77

79
Table 4.9 Data for characterization of gyration rate (Alford City A-2-4 soil)
Dry Unit Weight, pcf (Water Content = 5.0%)
Dry Unit Weight, pcf (Water Content = 5.5%)
Gyration Rate
(gyrations/minute)
10
20
30
10
20
30
30 105.90 106.10 105.40 104.70 103.50 104.30
60 108.50 108.70 107.90 107.20 106.20 106.90
Number of
Gyrations 90 109.80 109.80 109.30 108.50 107.50 108.30

80
Table 4.10 Gyratory compaction test results for Thomasville Road soil
Gyrations = 90 Gyrations = 60 Gyrations = 30
Test
Procedure Water
Content
(%)
Dry
Unit Weight
(pcf)
Water
Content
(%)
Dry
Unit Weight
(pcf)
Water
Content
(%)
Dry
Unit Weight
(pcf)
8.6 110.02 8.6 108.73 8.6 106.16
10.6 110.37 10.6 109.07 10.6 106.48
10.9 112.74 10.9 111.64 10.9 109.32
11.8 112.90 11.8 111.79 11.8 109.91
Vertical
Pressure=100 kPa
Angle=1.0o
12.5 112.45 12.5 111.61 12.5 110.05
7.8 109.17 7.8 108.05 7.8 105.77
9.1 111.29 9.1 110.07 9.1 107.62
9.4 111.33 9.4 110.48 9.4 108.92
11.4 113.23 11.4 112.16 11.4 110.45
Vertical
Pressure=100 kPa
Angle=1.25o
11.7 110.16 11.7 109.12 11.7 107.24
6.3 107.72 6.3 106.53 6.3 104.22
9.0 109.15 9.0 107.92 9.0 105.48
9.5 111.19 9.5 109.75 9.5 107.08
11.0 113.12 11.0 111.72 11.0 108.98
Vertical
Pressure=200 kPa
Angle=1.00o
11.3 112.26 11.3 111.25 11.3 108.67
8.3 110.24 8.3 109.10 8.3 106.82
8.9 112.25 8.9 111.05 8.9 108.67
9.5 113.09 9.5 111.95 9.5 109.88
10.9 113.28 10.9 112.36 10.9 110.70
Vertical
Pressure=200 kPa
Angle=1.25o
11.1 111.57 11.1 110.43 11.1 108.51
_ _ 8.3 110.53 _ _
_ _ 9.0 112.03 _ _
_ _ 10.2 112.40 _ _
Vertical
Pressure=300kPa
Angle=1.25o _ _ 11.0 113.23 _ _

81
Table 4.11 Gyratory compaction test results for Sun Coast Parkway soil
Gyrations = 90 Gyrations = 60 Gyrations = 30
Test Procedure Water Content
(%)
Dry
Unit Weight
(pcf)
Water
Content
(%)
Dry
Unit Weight
(pcf)
Water
Content
(%)
Dry
Unit Weight
(pcf)
8.4 105.21 8.4 104.17 8.4 102.01
9.4 105.25 9.4 104.23 9.4 102.04
10.5 105.33 10.5 104.27 10.5 102.12
10.7 105.88 10.7 104.88 10.7 102.69
11.1 107.59 11.1 106.58 11.1 104.60
Vertical
Pressure=100 kPa
Angle=1.0o
11.8 107.12 11.8 106.11 11.8 104.27
8.7 106.05 8.7 105.13 8.7 103.17
10.2 106.45 10.2 105.49 10.2 103.51
11.2 107.96 11.2 107.09 11.2 105.13
11.8 107.84 11.8 106.66 11.8 105.21
Vertical
Pressure=100 kPa
Angle=1.25o
14.3 105.40 14.3 104.50 14.3 102.78
7.7 106.77 7.7 105.74 7.7 103.68
10.6 107.27 10.6 106.23 10.6 104.16
11.0 107.30 11.0 106.30 11.0 104.22
Vertical
Pressure=200 kPa
Angle=1.00o
11.8 106.93 11.8 105.99 11.8 104.24
8.5 106.97 8.5 106.03 8.5 104.25
10.0 108.77 10.0 107.87 10.0 106.00
10.9 109.65 10.9 108.74 10.9 106.97
11.2 108.83 11.2 107.89 11.2 106.38
Vertical
Pressure=200 kPa
Angle=1.25o
11.7 108.11 11.7 107.47 11.7 105.74

82
Gyrations = 90 Gyrations = 60 Gyrations = 30
Test Procedure Water Content
(%)
Dry
Unit Weight
(pcf)
Water
Content
(%)
Dry
Unit Weight
(pcf)
Water
Content
(%)
Dry
Unit Weight
(pcf)
_ _ 7.8 106.98 _ _
_ _ 9.6 107.15 _ _
_ _ 10.7 107.44 _ _
Vertical
Pressure=300 kPa
Angle=1.25o
_ _ 11.8 107.08 _ _
_ _ 7.7 106.85 _ _
_ _ 10.0 107.16 _ _
_ _ 10.5 108.42 _ _
Vertical
Pressure=400 kPa
Angle =1.25o _ _ 10.9 107.85 _ _
_ _ 7.6 106.47 _ _
_ _ 10.2 107.47 _ _
_ _ 10.7 107.59 _ _
_ _ 11.0 107.58 _ _
Vertical
Pressure=500 kPa
Angle =1.25o
_ _ 11.1 107.36 _ _
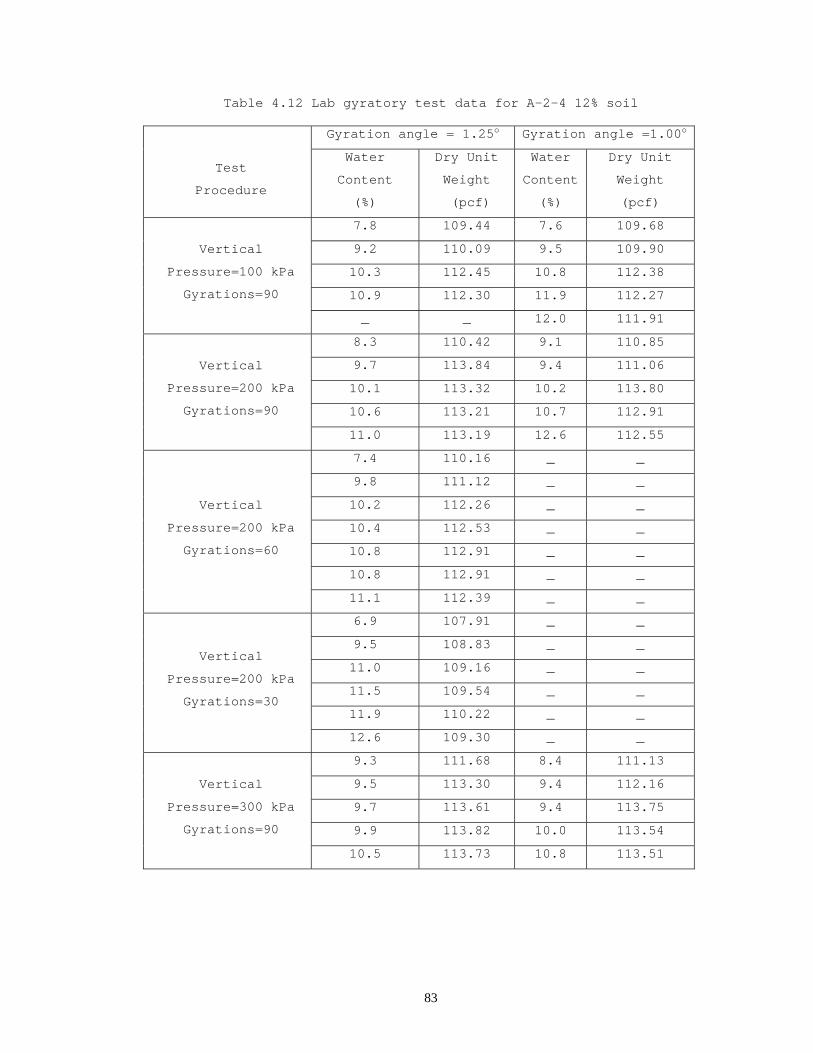
83
Table 4.12 Lab gyratory test data for A-2-4 12% soil
Gyration angle = 1.25o Gyration angle =1.00o
Test
Procedure
Water
Content
(%)
Dry Unit
Weight
(pcf)
Water
Content
(%)
Dry Unit
Weight
(pcf)
7.8 109.44 7.6 109.68
9.2 110.09 9.5 109.90
10.3 112.45 10.8 112.38
10.9 112.30 11.9 112.27
Vertical
Pressure=100 kPa
Gyrations=90
_ _ 12.0 111.91
8.3 110.42 9.1 110.85
9.7 113.84 9.4 111.06
10.1 113.32 10.2 113.80
10.6 113.21 10.7 112.91
Vertical
Pressure=200 kPa
Gyrations=90
11.0 113.19 12.6 112.55
7.4 110.16 _ _
9.8 111.12 _ _
10.2 112.26 _ _
10.4 112.53 _ _
10.8 112.91 _ _
10.8 112.91 _ _
Vertical
Pressure=200 kPa
Gyrations=60
11.1 112.39 _ _
6.9 107.91 _ _
9.5 108.83 _ _
11.0 109.16 _ _
11.5 109.54 _ _
11.9 110.22 _ _
Vertical
Pressure=200 kPa
Gyrations=30
12.6 109.30 _ _
9.3 111.68 8.4 111.13
9.5 113.30 9.4 112.16
9.7 113.61 9.4 113.75
9.9 113.82 10.0 113.54
Vertical
Pressure=300 kPa
Gyrations=90
10.5 113.73 10.8 113.51

84
Table 4.13 Lab gyratory test data for A-2-4 24% soil
Gyration angle = 1.25o Gyration angle =1.00o
Test
Procedure
Water
Content
(%)
Dry Unit
Weight,
(pcf)
Water
Content
(%)
Dry Unit
Weight
(pcf)
8.2 111.37 8.3 110.39
8.2 112.92 9.5 112.62
10.6 114.62 10.1 113.02
11.1 114.76 11.0 114.59
Vertical
Pressure=100 kPa,
Gyrations=90
12.6 113.65 11.9 113.35
8.9 114.46 8.7 113.18
9.4 115.99 9.8 115.06
10.1 116.12 10.9 115.47
10.4 116.15 12.0 114.67
10.7 116.25 _ _
Vertical
Pressure=200 kPa,
Gyrations=90
12.2 115.14 _ _
8.0 114.36 _ _
10.0 114.47 _ _
11.3 115.16 _ _
Vertical
Pressure=200 kPa,
Gyrations=60 12.5 114.59 _ _
8.0 111.57 _ _
10.8 112.06 _ _
11.3 112.87 _ _
Vertical
Pressure=200 kPa,
Gyrations=30 13.1 112.47 _ _
9.0 115.49 9.2 114.24
9.5 116.46 9.9 115.82
10.5 117.09 10.3 116.33
Vertical
Pressure=300 kPa,
Gyrations=90 11.2 116.87 11.6 115.40

85
Figure 4.1 Field and lab compaction curves for Thomasville Road A-3 soil
Field Test Result
Thomasville Road
101
102
103
104
105
106
107
108
109
110
111
112
113
114
115
6 7 8 9 10 11 12 13 14
Water Content,%
Dry
Uni
t Wei
ght ,
pcf
Field test resultsModified ProctorVibration CompactionGyratory Compaction
Gyratory Compaction
Modified Proctor
Field Test Results
Vertical Pressure=300 kPa Gyration angle=1.25 degrees Number of Gyrations=60 Gyration rate = 20 gyrations/m
Vibratory Compaction

86
Figure 4.2 Field and lab compaction curves for Sun Coast Parkway A-3 soil
Vertical Pressure = 200 kPa Gyration Angle = 1.25 degrees Number of Gyrations = 60 Gyration Rate = 20 gyrations/m
Sun Coast Parkway
98
99
100
101
102
103
104
105
106
107
108
109
110
111
112
0 1 2 3 4 5 6 7 8 9 10 11 12 13 14 15 16 17 18 19 20Water Content,%
Dry
Uni
t Wei
ght,p
cf
Field test resultsModified ProctorVibration CompactionGyratory Compaction
Field Test Results
Gyration Compaction
Modified Proctor
Vibratory Compaction
Vertical Pressure = 200 kPa Gyration Angle = 1.25 degrees Number of Gyrations = 60 Gyration Rate = 20 gyrations/minute

87
Alford City A-2-4 soil
120
122
124
126
128
130
132
134
136
4 5 6 7 8 9 10 11 12Water Content, %
Dry
Uni
t Wei
ght,
pcf
Modified ProctorAugmented Modified Proctor AAugmented Modified Proctor BAugmented Modified Proctor C
Figure 4.3 Impact compaction method investigation (Alford City A-2-4 soil)
Augmented Modified Proctor C
Augmented Modified Proctor B
Augmented Modified Proctor A
Modified Proctor
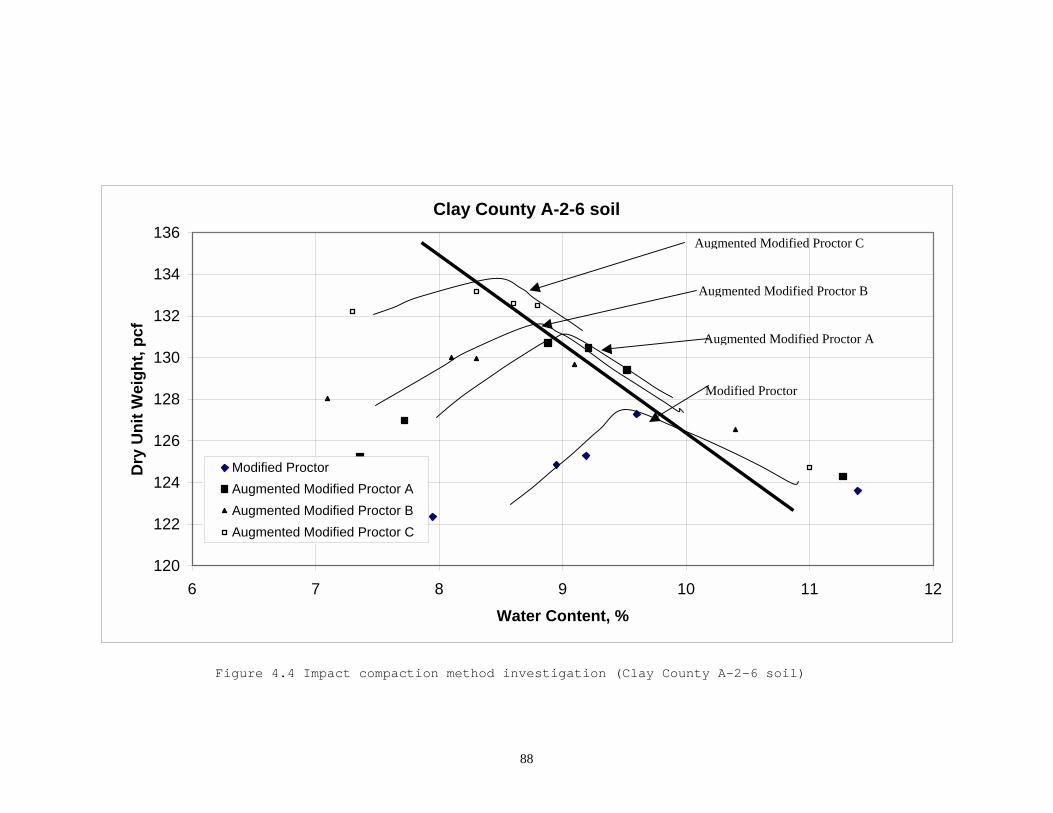
88
Clay County A-2-6 soil
120
122
124
126
128
130
132
134
136
6 7 8 9 10 11 12Water Content, %
Dry
Uni
t Wei
ght,
pcf
Modified ProctorAugmented Modified Proctor AAugmented Modified Proctor BAugmented Modified Proctor C
Figure 4.4 Impact compaction method investigation (Clay County A-2-6 soil)
Augmented Modified Proctor C
Augmented Modified Proctor B
Augmented Modified Proctor A
Modified Proctor

89
Figure 4.5 Impact compaction test results (Lake City A-3 soil)
Lake City A-3 Soil
103
104
105
106
107
108
8 9 10 11 12 13 14Water Content, %
Dry
Uni
t Wei
ght,
pcf
10 lb hammer, 25 blows10 lb hammer,50 blows15 lb hammer, 25 blows15 lb hammer, 50 blows

90
Figure 4.6 Laboratory impact compaction curves for Thomasville Road A-3 soil
Impact Compaction (Thomasville Road A-3 Soil)
101
102
103
104
105
106
107
108
109
110
111
112
113
114
115
7 8 9 10 11 12 13 14W ater Content, %
Dry
Uni
t Wei
ght,
pcf
10 lbs Hammer, 25 Blows(Modified Proctor)10 lbs Hammer, 50 Blows(Augmented Modified Proctor A)15 lbs Hammer, 25 Blows(Augmented Modified Proctor B)15 lbs Hammer, 50 Blows(Augmented Modified Proctor C)

91
Impact Compaction (Sun Coast Parkway A-3 Soil)
98
99
100
101
102
103
104
105
106
107
108
109
110
7 8 9 10 11 12 13 14 15 16 17 18Water Content, %
Dry
Uni
t Wei
ght,
pcf
Modified Proctor
Standard Proctor
Modified Proctor
Standard Proctor
Figure 4.7 Laboratory impact compaction curves for Sun Coast Parkway A-3 soil

92
Impact Compaction (A-2-4 Soil)
106
107
108
109
110
111
112
113
114
115
116
117
118
7 8 9 10 11 12 13 14Water Content , %
Dry
Uni
t Wei
ght ,
pcf
A-2-4 with 12% finesA-2-4 with 24% fines
Figure 4.8 Modified Proctor compaction test for A-2-4 soil

93
Vibratory Compaction (A-3 Soil)
9899
100101102103104105106107108109110111112113114115
7 8 9 10 11 12 13 14Water Content, %
Dry
Uni
t Wei
ght,
pcf
Thomasville Road A-3 soilSun Coast Parkway A-3 soil
Figure 4.9 Vibratory compaction for Sun Coast Parkway and Thomasville Road A-3 soils

94
Vibratory Compaction (A-2-4 Soil)
106
107
108
109
110
111
112
113
114
115
116
117
118
7 8 9 10 11 12 13 14Water Content, %
Dry
Uni
t Wei
ght,
pcf
A-2-4 with 12% fineA-2-4 with 24% fine
Figure 4.10 Vibratory compaction for A-2-4 with 12% fines and A-2-4 with 24% fines soil

95
Figure 4.11 Servopac Gyratory compactor
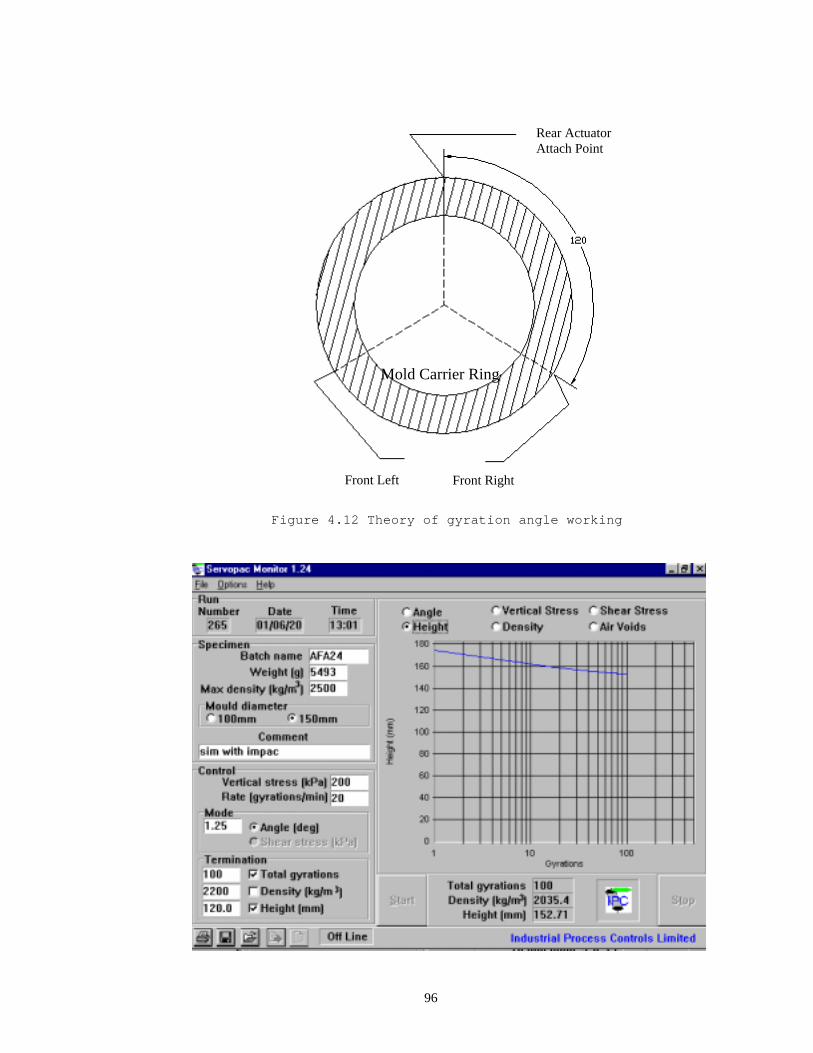
96
Figure 4.12 Theory of gyration angle working
Rear Actuator Attach Point
Front Left Front Right
Mold Carrier Ring

97
Figure 4.13 Servopac Gyratory Compactor PC window
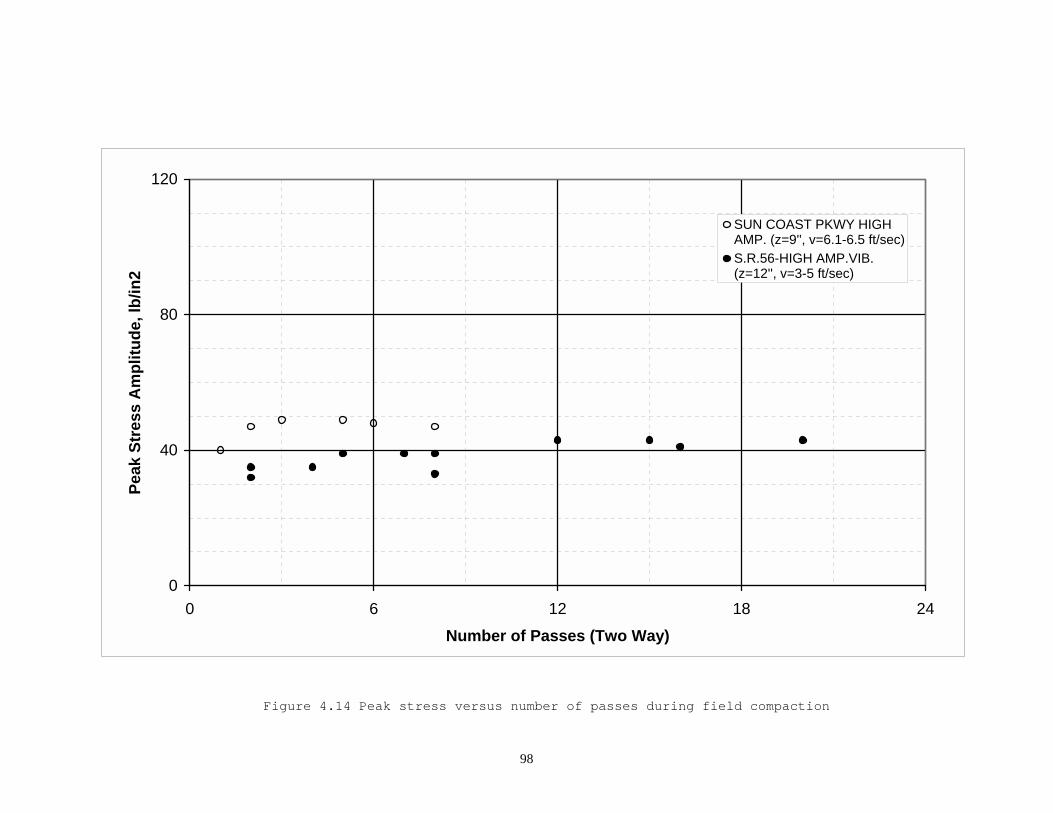
98
0
40
80
120
0 6 12 18 24Number of Passes (Two Way)
Peak
Str
ess
Am
plitu
de, l
b/in
2
SUN COAST PKWY HIGHAMP. (z=9'', v=6.1-6.5 ft/sec)S.R.56-HIGH AMP.VIB.(z=12'', v=3-5 ft/sec)
Figure 4.14 Peak stress versus number of passes during field compaction

99
100
102
104
106
108
110
112
114
116
5 10 15 20 25 30 35Gyration Rate, gyrations/minute
Dry
Uni
t Wei
ght ,
pcf
water content = 5% gyrations = 60water content = 5.5% gyrations = 60

100
Figure 4.15 Effect of gyration rate on compacted unit weight

101
Figure 4.16 Effect of water seepage on dry unit weight during compaction
Sun Coast Parkway Gyratory Test
98
99
100
101
102
103
104
105
106
107
108
109
110
7 8 9 10 11 12 13 14 15
Water Content, %
Dry
Uni
t Wei
ght,
pcf
40 Gyrations60 Gyrations80 Gyrations
Gyration Angle: 1.0 degreeVertical Stress: 100 kPaGyration Rate: 20 gyrations/minute

102
Figure 4.17(a) Compaction curves for Thomasville Road soil at 1.0 degree gyration angle, 100 kPa vertical pressure.
Gyratory Compaction (Thomasville Road A-3 Soil)
101
102
103
104
105
106
107
108
109
110
111
112
113
114
115
7 8 9 10 11 12 13 14
Water Content, %
Dry
Uni
t Wei
ght,
pcf
Number of Gyrations =90Number of Gyrations = 60Number of Gyrations = 30
Gyration Angle=1.00 degreeVertical Pressure=100 kPaGyration Rate=20 gyration/minute

103
Gyratory Compaction (Thomasville Road A-3 Soil)
101
102
103
104
105
106
107
108
109
110
111
112
113
114
115
7 8 9 10 11 12 13 14
Moisture Content, %
Dry
Uni
t Wei
ght,
pcf
Number of Gyrations = 90Number of Gyrations = 60Number of Gyrations = 30
Gyration Angle=1.25 degreesVertical Pressure=100 kPaGyration Rate=20 gyration/minute
Figure 4.17(b) Compaction curves for Thomasville Road soil at 1.25 degrees gyration angle, 100 kPa vertical pressure

104
Gyratory Compaction (Thomasville Road A-3 Soil)
101102103104105106107108109110111112113114115
7 8 9 10 11 12 13 14Moisture Content, %
Dry
Uni
t Wei
ght,
pcf
Number of Gyrations =90Number of Gyrations =60Number of Gyrations =
Gyration Angle=1.00Vertical Pressure=200 kPaRate=20 gyration/minute
Figure 4.17(c) Compaction curves for Thomasville Road soil at 1.0 degree gyration angle, 200 kPa vertical pressure.

105
Gyratory Compaction (Thomasville Road A-3 Soil)
101
102
103
104
105
106
107
108
109
110
111
112
113
114
115
7 8 9 10 11 12 13 14Moisture Content, %
Dry
Uni
t Wei
ght,
pcf
Number of Gyrations = 90Number of Gyrations = 60Number of Gyrations = 30 Gyration Angle=1.25
Vertical Pressure=200 kPaRate=20 gyration/minute
Figure 4.17(d) Compaction curves for Thomasville Road soil at 1.25 degree gyration angle, 200 kPa vertical pressure.
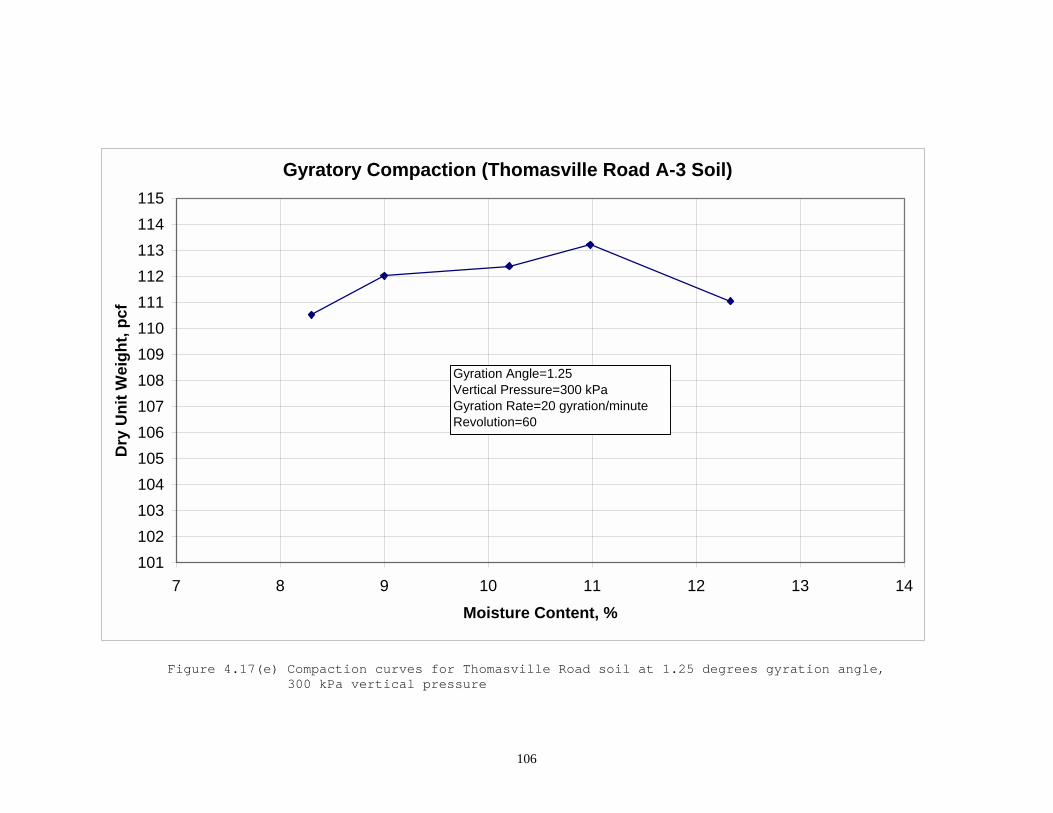
106
Gyratory Compaction (Thomasville Road A-3 Soil)
101102103104105106107108109110111112113114115
7 8 9 10 11 12 13 14Moisture Content, %
Dry
Uni
t Wei
ght,
pcf
Gyration Angle=1.25Vertical Pressure=300 kPaGyration Rate=20 gyration/minuteRevolution=60
Figure 4.17(e) Compaction curves for Thomasville Road soil at 1.25 degrees gyration angle, 300 kPa vertical pressure

107
Gyratory Compaction (Sun Coast Parkway A-3 Soil)
98
99
100
101
102
103
104
105
106
107
108
109
110
7 8 9 10 11 12 13 14 15
Moisture Content, %
Dry
Uni
t Wei
ght,
pcf
Number of Gyrations = 30Number of Gyrations = 60Number of Gyrations = 90
Gyration Angle=1.00 degreeVertical Pressure=100 kPaRate=20 gyration/minute
Figure 4.18(a) Compaction curves for Sun Coast Parkway soil at 1.0 degree gyration angle, 100 kPa vertical pressure

108
Gyratory Compaction (Sun Coast Parkway A-3 Soil)
98
99
100
101
102
103
104
105
106
107
108
109
110
7 8 9 10 11 12 13 14 15Moisture Content, %
Dry
Uni
t Wei
ght,
pcf
Number of Gyraions = 90Number of Gyraions = 60Number of Gyraions = 30
Gyration Angle=1.25 degreesVertical Pressure=100 kPaGyration Rate=20 gyration/minute
Figure 4.18(b) Compaction curves for Sun Coast Parkway soil at 1.25 degree gyration angle, 100 kPa vertical pressure.

109
Gyratory Compaction (Sun Coast Parkway A-3 Soil)
98
99
100
101
102
103
104
105
106
107
108
109
110
7 8 9 10 11 12 13 14 15Water Content, %
Dry
Uni
t Wei
ght,
pcf
Number of Gyraions = 90Number of Gyraions = 60Number of Gyraions = 30
Gyration Angle=1.00 degreeVertical Pressure=200 kPaRate=20 gyration/minute
Figure 4.18(c) Compaction curves for Sun Coast Parkway soil at 1.00 degree gyration angle, 200 kPa vertical pressure.

110
Gyratory Compaction (Sun Coast Parkway A-3 Soil)
98
99
100
101
102
103
104
105
106
107
108
109
110
7 8 9 10 11 12 13 14 15Moisture Content, %
Dry
Uni
t Wei
ght,
pcf
Number of Gyraions = 30Number of Gyraions = 60Number of Gyraions = 90
Gyration Angle=1.25 degreesVertical Pressure=200 kPaRate=20 gyration/minute
Figure 4.18(d) Compaction curves for Sun Coast Parkway soil at 1.25 degree gyration angle, 200 kPa vertical pressure.

111
Gyratory Compaction Tests (Suncoast Parkway)
98
99
100
101
102
103
104
105
106
107
108
109
110
7 8 9 10 11 12 13 14 15Water Content, %
Dry
Uni
t Wei
ght,
pcf
Vertical Pressure = 300 kPaVertical Pressure = 400 kPaVertical Pressure = 500 kPa
Figure 4.18(e) Compaction curves for Sun Coast Parkway soil at 1.25 degrees gyration angle, and different vertical pressure
Gyration Angle = 1.25 degrees Number of Gyrations = 60 Gyration Rate = 20 gyrations/minute

112
Gyratory Compaction (A-2-4 soil with 12% fines)
106
107
108
109
110
111
112
113
114
115
116
7 8 9 10 11 12 13Water Content, %
Dry
Uni
t Wei
ght,
pcf
Vertical Pressure = 100 kPa,Gyration Angle = 1.00 degreeVertical Pressure = 100 kPa,Gyration Angle = 1.25 degreesVertical Pressure = 200 kPa,Gyration Angle = 1.00 degree
Figure 4.19(a) Compaction curves for A-2-4 soil with 12% fines at different vertical pressures and gyration angles
Number of Gyrations = 90 Gyration Rate = 20 gyrations/minute

113
Gyratory Compaction (A-2-4 soil with 12% fines)
106
107
108
109
110
111
112
113
114
115
116
7 8 9 10 11 12 13Water Content, %
Dry
Uni
t Wei
ght,
pcf
Number of Gyrations = 30Number of Gyrations = 60Number of Gyrations = 90
Vertical Pressure = 200 kPa Gyration Angle = 1.25 degrees Gyration Rate = 20 Gyrations/minure
Figure 4.19(b) Compaction curves for A-2-4 soil with 12% fines at 1.25 degree gyration angle, and 200 kPa vertical pressure
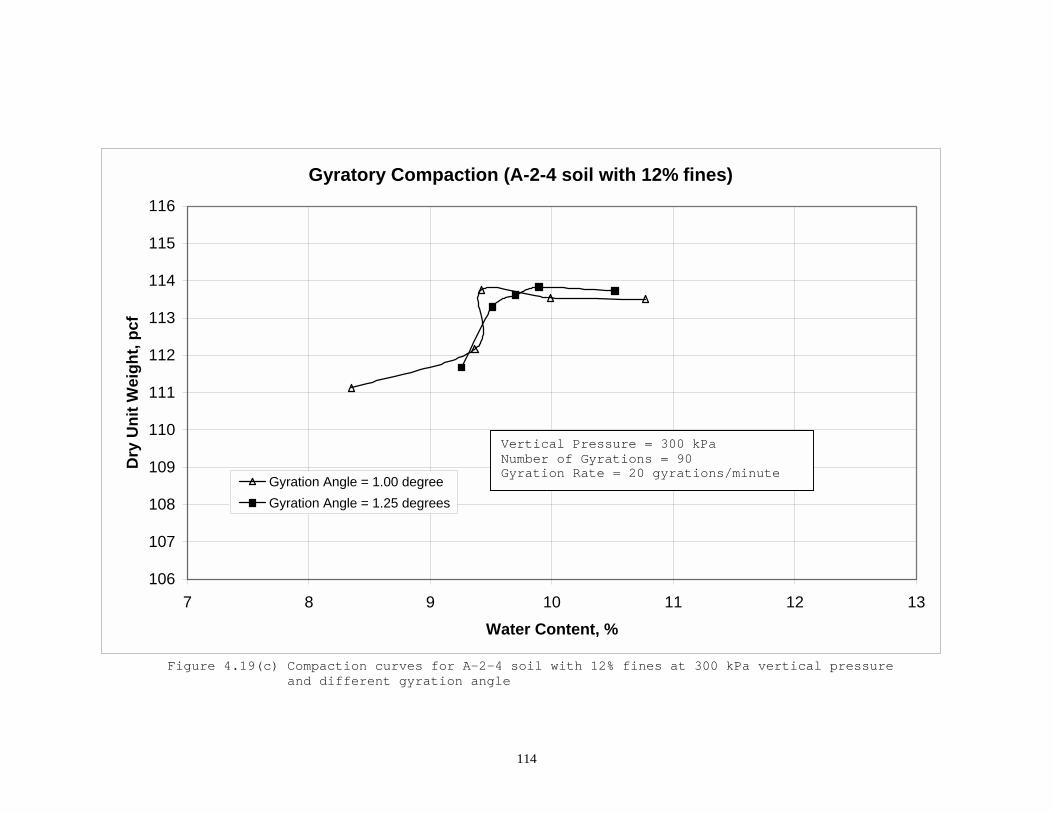
114
Gyratory Compaction (A-2-4 soil with 12% fines)
106
107
108
109
110
111
112
113
114
115
116
7 8 9 10 11 12 13Water Content, %
Dry
Uni
t Wei
ght,
pcf
Gyration Angle = 1.00 degreeGyration Angle = 1.25 degrees
Figure 4.19(c) Compaction curves for A-2-4 soil with 12% fines at 300 kPa vertical pressure and different gyration angle
Vertical Pressure = 300 kPa Number of Gyrations = 90 Gyration Rate = 20 gyrations/minute

115
Gyratory Compaction (A-2-4 soil with 24% fines)
106
107
108
109
110
111
112
113
114
115
116
117
118
7 8 9 10 11 12 13 14Water Content, %
Dry
Uni
t Wei
ght,
pcf
Vertical Pressure = 100 kPa,Gyration Angle = 1.00 degreeVertical Pressure = 100 kPa,Gyration Angle = 1.25 degreesVertical Pressure = 200 kPa,Gyration Angle = 1.00 degree
Figure 4.20(a) Compaction curves for A-2-4 soil with 24% fines at different vertical pressures and gyration angles
Number of Gyrations = 90 Gyration Rate = 20 gyrations/minute

116
Gyratory Compaction (A-2-4 soil with 24% fines)
106
107
108
109
110
111
112
113
114
115
116
117
118
7 8 9 10 11 12 13 14Water Content, %
Dry
Uni
t Wei
ght,
pcf
Number of Gyrations = 30Number of Gyrations = 60Number of Gyrations = 90
` Vertical Pressure = 200 kPa Gyration Angle = 1.25 degree Gyration Rate = 20 Gyrations/minure
Figure 4.20(b) Compaction curves for A-2-4 soil with 24% fines at 1.25 degree gyration angle, and 200 kPa vertical pressure
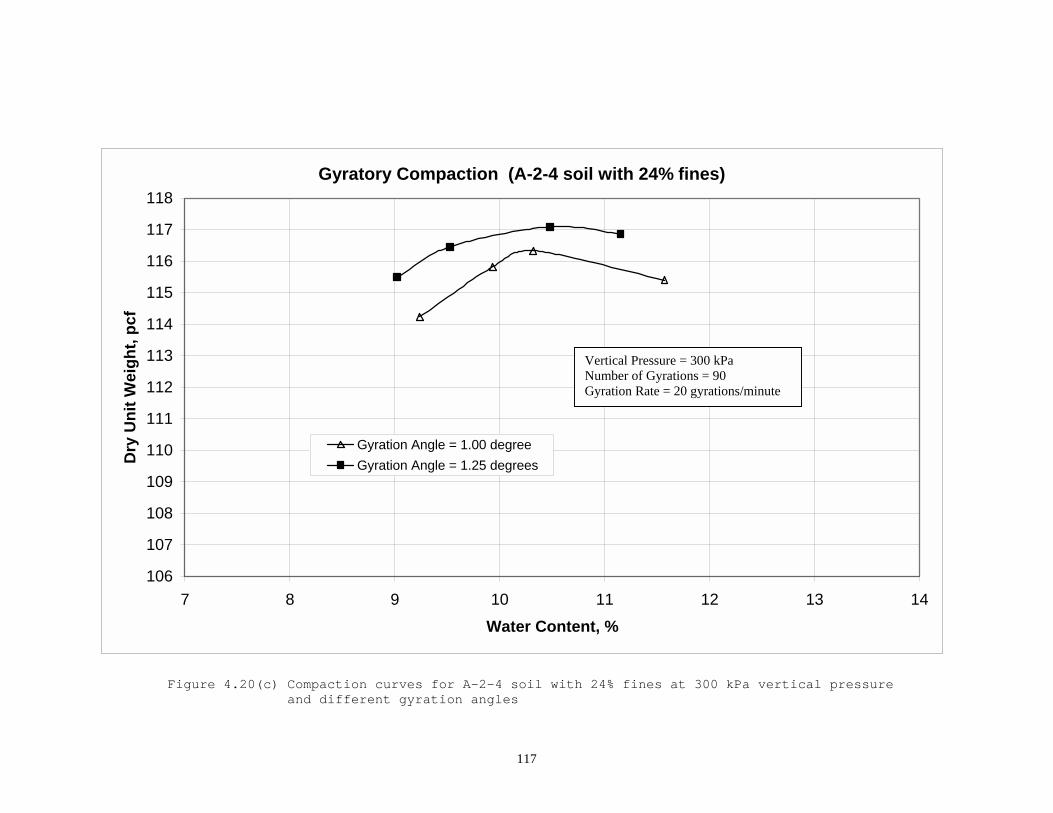
117
Gyratory Compaction (A-2-4 soil with 24% fines)
106
107
108
109
110
111
112
113
114
115
116
117
118
7 8 9 10 11 12 13 14Water Content, %
Dry
Uni
t Wei
ght,
pcf
Gyration Angle = 1.00 degreeGyration Angle = 1.25 degrees
Figure 4.20(c) Compaction curves for A-2-4 soil with 24% fines at 300 kPa vertical pressure and different gyration angles
Vertical Pressure = 300 kPa Number of Gyrations = 90 Gyration Rate = 20 gyrations/minute

118
CHAPTER 5
SUMMARY AND ANALYSIS OF EXPERIMENTAL RESULTS
5.1 Comparison of Laboratory and Field Compaction
The laboratory compaction curves (gyratory, impact, and
vibratory compaction) are further compared with the field
compaction curves in Figures 5.1 and 5.2. From these
figures, the modified Proctor compaction test results show
significant difference from the field test results.
For the Thomasville Road soil, the OMC from the
modified Proctor test was 12% and the maximum dry unit
weight was 110.5 pcf, while the field OMC was 10% and the
maximum dry unit weight was about 113.8 pcf. About a 2%
water content and a 3 pcf maximum dry unit weight were the
differences between the modified Proctor and field
compaction. According to the recent specification 98% of
the modified Proctor dry unit weight is 108 pcf, about a
five pcf difference. Also for the Sun Coast Parkway soil,
the laboratory maximum dry unit weight was 106.5 pcf at 13%
water content, and the field maximum dry unit weight was

119
110 pcf at 8% water content. The modified Proctor maximum
dry unit weight at 98% for field specification is 104 pcf,
about a 6 pcf difference from the field test results.
These results showed that the current construction
specifications drastically underestimate the maximum
achievable field density for sandy soils. Therefore, the
modified Proctor is not a reasonable test procedure to
specify the density requirement for the sandy soil.
The gyratory test parameter setting used 200 kPa
vertical pressure (optimum vertical pressure), a gyration
angle of 1.25 degrees and 90 gyrations may be compared with
the field test results. From these comparisons, these
gyratory parameter settings show considerable promise for
simulating the field test results.
According to the above comparison of the laboratory
results with the field test results, the gyratory
compaction is shown to be a better test method to simulate
the field test results. Thus, the characteristics of three
variables of the gyratory compaction should be studied
further to find the most suitable test procedure. The
gyratory compaction procedure is further evaluated as
follows.

120
5.2 Further Evaluation of Gyratory Compaction Procedure
The three Servopac Gyratory Compactor variables were
further evaluated in the laboratory. The results are
summarized in this section.
5.2.1 Number of gyrations
The effect of gyrations on the dry unit weight for the four
soils are shown in Figures 5.3 and 5.4. From these two
figures, the results show that with the increase of the
gyrations there was an increase of dry unit weight and a
decrease of water content. But from Figure 5.3, due to the
shortcoming of the test procedure, the problem of water
seepage was not adjusted in determining the proper water
content for the Thomasville Road and Sun Coast Parkway
soils. That is the reason why the OMC was exactly the same
for the different number of gyrations.
Also observed from these figures, the dry unit weight
increased more than 2 pcf from 30 to 60 gyrations, but from
60 to 90 gyrations, the dry unit weight increased only
about 1 pcf. The results show that the number of gyrations
had significant influence on the OMC and the maximum dry
unit weight. When the number of gyration was small, the dry
unit weight was sensitive to the gyrations.

121
5.2.2 Gyration angle
The effect of the gyratory angles on the dry unit weight
for the four soils are shown in Figures 5.5, 5.6, 5.7, 5.8.
From these figures, it can be seen that the gyration angle
had much less influence on the dry unit weight than the
gyrations.
The gyration angle had some effect on the dry unit
weight when the gyration cycles were low. However, the
effect became insignificant when the gyration cycles were
high.
When the soil had less fines, the value of the
gyration angle had more influence on the dry unit weight.
When the fines in the soil were increased, the influence
became less significant. For example, the Sun Coast Parkway
A-3 soil had 3% fines and the Thomasville Road soil had
6~8% fines. Hence the gyration angle had more influence on
the dry unit weight for Sun Coast Parkway soil than that
for the Thomasville Road soil.
5.2.3 Vertical pressure
The effect of the vertical pressures on the dry unit weight
for the four soils are shown in Figures 5.9, 5.10, 5.11,
5.12, 5.13, and 5.14. The results show that when the
vertical pressure was higher than 200 kPa, the dry unit

122
weight did not increase significantly with the increase of
the vertical pressure. This is similar to the Lake City A-3
sandy soil that was compacted with the impact compaction
method. When the impact compaction effort was increased by
increasing hammer weight, the dry unit weight did not
increase accordingly (Figure 4.5). From these figures, 200
kPa is chosen as the optimum vertical pressure for the
gyratory compaction. This corresponds to the field peak
stress, about 30 psi under field compaction equipment.
5.2.4 Further comparison of gyratory compaction
The compaction curves obtained from the gyratory, modified
Proctor, and vibratory compaction were further compared for
the four soils and are shown in Figures 5.15, 5.16, 5.17,
and 5.18. The results show that for the A-3 sandy soil
(Thomasville Road and Sun Coast Parkway), the modified
Proctor compaction generated much lower dry unit weight
values than the field test. The gyratory compaction with
200 kPa vertical pressure, 1.25 degrees gyration angle, and
30 gyrations could achieve similar results with the
modified Proctor and vibratory compaction. The gyratory
compaction with a higher number of gyrations could be used
to simulate the field test. The gyrations should be higher

123
than 30 gyrations to match the maximum dry unit weight in
the field test.
The impact compaction method worked well for the more
silty soil. For the A-2-4 soil with 12% fines, a gyratory
setting at 200 kPa vertical pressure, 1.25 degrees of
gyration angle, and 60 gyrations can almost simulate the
modified Proctor compaction curve (Figure 5.17). For the A-
2-4 soil with 24% fines, the number of gyrations should be
at least 90 in order to simulate the modified Proctor
compaction curve (Figure 5.18).
From these figures, vibratory compaction does not work
very well for compacting silty soil. This corresponds to
the findings in the literature study, that vibratory
compaction is better suited for compacting cohensionless
soil.
5.2.5 Selection of critical number of gyrations
In order to develop a general gyratory test procedure for
compacting the soils common in Florida, and to simulate the
field compaction, the required number of gyrations should
not be less than 90 from the above comparison. From the
above comparison, 200 kPa was the optimum vertical pressure
and it corresponded to the peak stress in the field test. A
gyration angle of 1.25 degrees was a reasonable value to

124
use and it corresponded to the SUPERPAVE specification. For
the number of gyrations, it was recommended to be at least
90. It should be adjusted to match the desired dry unit
weight.
The results from the gyration compaction test can be
used to select an optimum number of gyrations to simulate
the field compacted condition. The gyratory test results
are summarized in Tables 5.1 and 5.2 for the Thomasville
Road soil with 7.7% water content and at OMC, respectively.
The data in Figure 5.19 show that with the increase of the
number of gyrations, there is a consistent increase of the
dry unit weight. In Figure 5.20, the compaction curve is
shown with the initial condition at optimum water content
(OMC). The shape of the curve is not as consistent as in
Figure 5.19, because when the initial water content was
around 11%, the water began to seep out during the higher
number of gyrations. It was very difficult to get exactly
the same water content for the soil samples under the
different numbers of gyrations. The water content of the
data points in the curve were very close to the optimum
water content, but might deviate a little due to seepage of
water. From this investigation, the number of gyrations
should be chosen the most suitable number in order to get
the desired dry unit weight. The selection of an optimum
125
number of gyrations is demonstrated in Figure 5.21. From
the figure, 90-gyration is the optimum number of gyrations
to be selected to simulate the field compaction.
5.3 Gyratory Compaction Energy
The compaction effort is the work done by compacting the
soil with a compactor. For the impact compaction technique,
the energy is transferred through the hammer to the soil.
The impact compaction energy is determined by the hammer
weight, the height of drop, the number of layers, the
number of blows per layer, and the volume of the mold. For
the gyratory compaction, the method to estimate the energy
level produced by a gyratory compactor was evaluated in
this study. The method of estimating the energy using a
gyratory compactor is presented in Appendix A.
5.4 Recommended Gyratory Testing Procedure
The gyratory compaction was more reliable than the impact
compaction when used on sandy soils in the laboratory. The
gyratory test procedure with 200 kPa vertical pressure, a
1.25 degree gyration angle, 90 gyrations, and 20 gyrations
per minute showed considerable promise for simulating field

126
compaction. Use of the gyratory test procedure may be
suitable for specifying the optimum water content and
maximum dry unit weight for the field construction of the
popular Florida subgrade soils. The detail of a proposed
gyratory test procedure is presented in Appendix B for
reference.

127
Table 5.1 Effect of gyrations on dry unit weight for Thomasville Road A-3 soil with 7.7% water content
Number of
Gyrations
Water Content
(%)
Dry Unit Weight
(pcf)
30 7.7 107.64
60 7.7 109.95
90 7.7 111.09
120 7.7 111.80
150 7.7 112.30
180 7.7 112.67
210 7.7 112.96
240 7.7 113.19
270 7.7 113.40
300 7.7 113.58
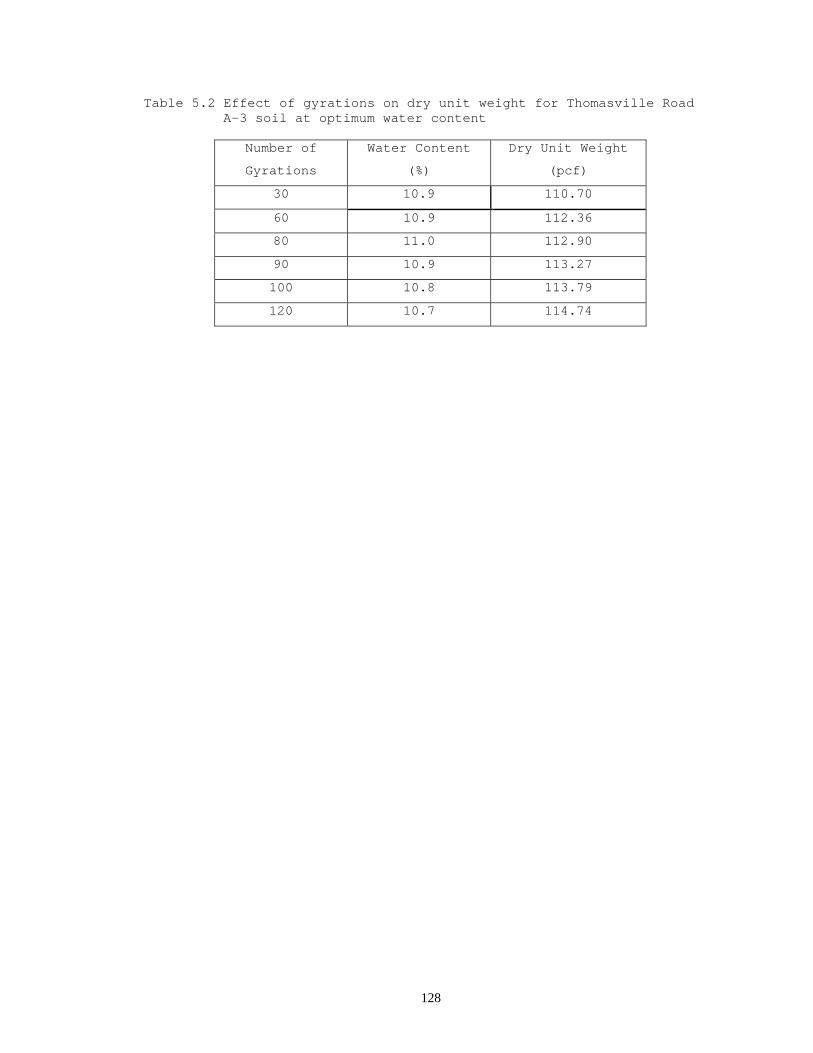
128
Table 5.2 Effect of gyrations on dry unit weight for Thomasville Road A-3 soil at optimum water content
Number of
Gyrations
Water Content
(%)
Dry Unit Weight
(pcf)
30 10.9 110.70
60 10.9 112.36
80 11.0 112.90
90 10.9 113.27
100 10.8 113.79
120 10.7 114.74

129
Figure 5.1 Correlation of field and laboratory test results for Thomasville Road soil
Thomasville Road
105
106
107
108
109
110
111
112
113
114
115
6 7 8 9 10 11 12 13 14Water Content, %
Dry
Uni
t Wei
ght,
pcf
Field test, 12" depth, 8 passesModified Proctor, 10 lbs, 25 blowsVibratory CompactionGyratory test, 1.25 degree angle, 200 kPa pressure, 90 gyrations
Gyratory test, 1.25 degree angle200 kPa pressure, 90 gyrations
Field test, 12" depth, 8 passes
Modified Proctor10 lbs, 25 blows
Vibratory Compaction

130
Figure 5.2 Correlation of field and laboratory test results for Sun Coast Parkway soil
Modified Proctor
L 200 kPa pressure L L
Sun Coast Parkway
99
100
101
102
103
104
105
106
107
108
109
110
111
0 2 4 6 8 10 12 14 16 18 20Water Content, %
Field test, 12" depth, 10 to 12 passesGyratory test, 1.25 degree angle, 200 kPa pressure, 90 gyrations
Vibratory compaction
Field test, 12" depth, 10 to 12 passes
Vibratory compaction Dry
Uni
t Wei
ght,
pcf
Modified Proctor
Gyratory test1.25 degree angle
90 gyrations - Compacted in low
vibratory amplitude mode

131
101
102
103
104
105
106
107
108
109
110
111
112
113
114
115
0 30 60 90 120
Number of Gyrations
Max
imum
Dry
Uni
t Wei
ght,
pcf
Thomasville Road A-3 SoilSun Coast Parkway A-3 Soil
Figure 5.3 Effect of gyrations on dry unit weight for Thomasville Road and Sun Coast Parkway soils
Vertical pressure = 200 kPa Gyration Angle = 1.25 degrees Gyration Rate = 20 Gyrations/minute
OMC (10.89%)
(10.89%)
(10.89%)
OMC (10.9%)
(10.9%)
(10.9%)

132
106
107
108
109
110
111
112
113
114
115
116
117
118
0 30 60 90 120Number of Gyrations
Max
imu
Dry
Uni
t Wei
ght,
pcf
A-2-4 soil with 12% finesA-2-4 soil with 24% fines
Figure 5.4 Effect of gyrations on dry unit weight for A-2-4 soil with 12% and 24% fines
Vertical pressure = 200 kPa Gyration Angle = 1.25 degrees Gyration Rate = 20 Gyrations/minute
OMC (11.3%)
(11.3%)
(10.7%)
(9.7%)
(10.8%)
OMC (11.9%)

133
Thomasville Road A-3 Soil
101
102
103
104
105
106
107
108
109
110
111
112
113
114
115
7 8 9 10 11 12 13 14
Water Content, %
Dry
Uni
t Wei
ght,
pcf
Vertical Pressure = 100 kPa,Gyration Angle = 1.25 degreesVertical Pressure = 100 kPa,Gyration Angle = 1.00 degreeVertical Pressure = 200 kPa,Gyration Angle = 1.25 degreesVertical Pressure = 200 kPa,Gyration Angle = 1.00 degree
Figure 5.5 Effect of gyration angle on dry unit weight for Thomasville Road soil
Number of Gyrations = 90 Gyration Rate = 20 gyrations/minute

134
Sun Coast Parkway A-3 Soil
98
99
100
101
102
103
104
105
106
107
108
109
110
111
7 8 9 10 11 12 13 14 15Water Content, %
Dry
Uni
t Wei
ght,
pcf
Vertical Pressure = 100 kPa,Gyration Angle = 1.25 degreesVertical Pressure = 100 kPa,Gyration Angle = 1.00 degreeVertical Pressure = 200 kPa,Gyration Angle = 1.25 degreesVertical Pressure = 200 kPa,Gyration Angle = 1.00 degree
Figure 5.6 Effect of gyration angle on dry unit weight for Sun Coast Parkway soil
Number of Gyrations = 90 Gyration Rate = 20 gyrations/minute

135
A-2-4 soil with 12% fines
106
107
108
109
110
111
112
113
114
115
116
6 7 8 9 10 11 12 13 14Water Content, %
Dry
Uni
t Wei
ght,
pcf
Vertical Pressure = 100 kPa,Gyration Angle = 1.00 degreeVertical Pressure = 100 kPa,Gyration Angle =1.25 degreesVertical Pressure = 200 kPa,Gyration Angle =1.00 degreeVertical Pressure = 200 kPa,Gyration Angle =1.25 degrees
Figure 5.7 Effect of gyration angle on dry unit weight for A-2-4 soil with 12% fines
Number of Gyrations = 90 Gyration Rate = 20 gyrations/minute
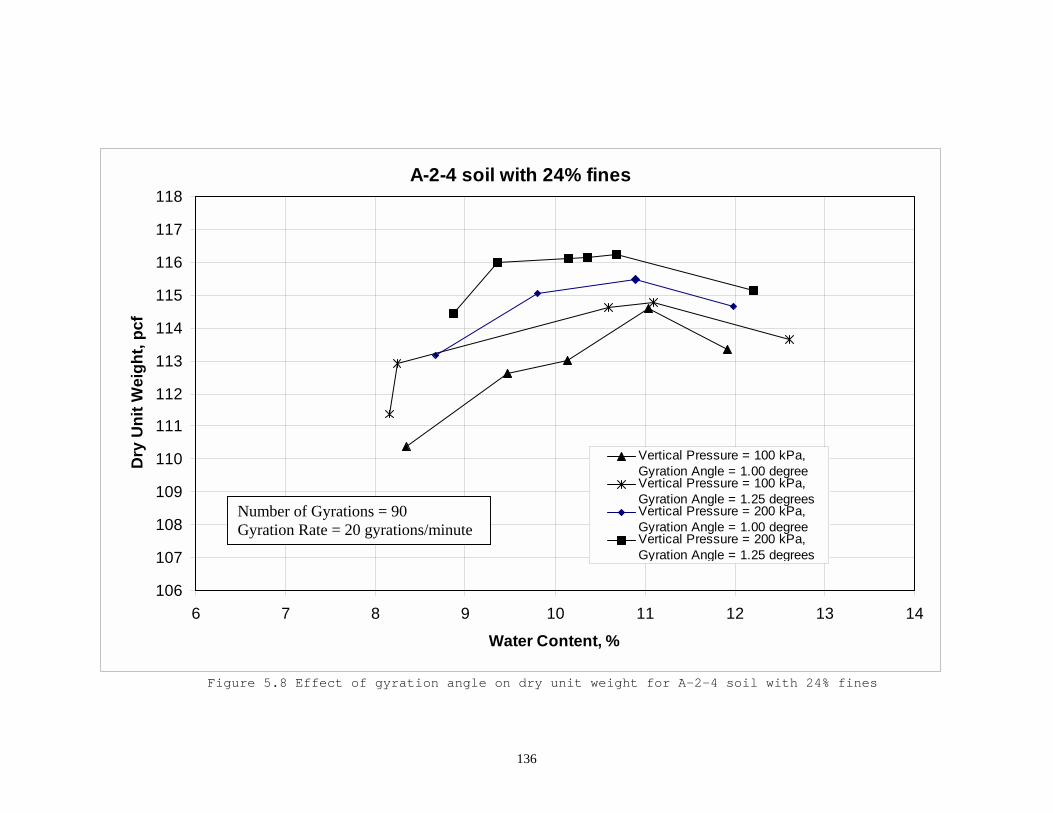
136
A-2-4 soil with 24% fines
106
107
108
109
110
111
112
113
114
115
116
117
118
6 7 8 9 10 11 12 13 14
Water Content, %
Dry
Uni
t Wei
ght,
pcf
Vertical Pressure = 100 kPa,Gyration Angle = 1.00 degreeVertical Pressure = 100 kPa,Gyration Angle = 1.25 degreesVertical Pressure = 200 kPa,Gyration Angle = 1.00 degreeVertical Pressure = 200 kPa,Gyration Angle = 1.25 degrees
Figure 5.8 Effect of gyration angle on dry unit weight for A-2-4 soil with 24% fines
Number of Gyrations = 90 Gyration Rate = 20 gyrations/minute

137
Thomasville Road A-3 Soil
101
102103
104
105
106107
108
109110
111
112
113114
115
7 8 9 10 11 12 13 14
Water Content, %
Dry
Uni
t Wei
ght,
pcf
Vertical Pressure = 100 kPaVertical Pressure = 200 kPaVertical Pressure = 300 kPa
Figure 5.9 Effect of vertical pressure on dry unit weight for Thomasville Road soil
Number of Gyrations = 60 Gyration Angle = 1.25 degrees Gyration Rate = 20 gyrations/minute

138
Sun Coast Parkway A-3 Soil
98
99
100
101
102
103
104
105
106
107
108
109
110
7 8 9 10 11 12 13 14 15
Water Content, %
Dry
Uni
t Wei
ght,
pcf
Vertical Pressure = 100 kPaVertical Pressure = 200 kPaVertical Pressure = 300 kPaVertical Pressure = 400 kPaVertical Pressure = 500 kPa
Figure 5.10 Effect of vertical pressure on dry unit weight for Sun Coast Parkway soil
Number of Gyrations = 60 Gyration Angle = 1.25 degrees Gyration Rate = 20 gyrations/minute

139
A-2-4 soil with 12% fines
106
107
108
109
110
111
112
113
114
115
116
7 8 9 10 11 12 13
Water Content, %
Dry
Uni
t Wei
ght,
pcf
Vertical Pressure = 100 kPaVertical Pressure = 200 kPaVertical Pressure = 300 kPa
Figure 5.11 Effect of vertical pressure on dry unit weight with 1.25 degrees angle for A-2-4 soil with 12% fines
Number of Gyrations = 90 Gyration Angle = 1.25 degrees Gyration Rate = 20 gyrations/minute

140
A-2-4 soil with 12% fines
106
107
108
109
110
111
112
113
114
115
116
7 8 9 10 11 12 13
Water Content, %
Dry
Uni
t Wei
ght,
pcf
Vertical Pressure = 100 kPaVertical Pressure = 200 kPaVertical Pressure = 300 kPa
Figure 5.12 Effect of vertical pressure on dry unit weight with 1.00 degree angle for A-2-4 soil with 12% fines
Number of Gyrations = 90 Gyration Angle = 1.00 degree Gyration Rate = 20 gyrations/minute

141
A-2-4 soil with 24% fines
106
107
108
109
110
111
112
113
114
115
116
117
118
7 8 9 10 11 12 13 14
Water Content, %
Dry
Uni
t Wei
ght,
pcf
Vertical Pressure = 100 kPaVertical Pressure = 200 kPaVertical Pressure = 300 kPa
Figure 5.13 Effect of vertical pressure on dry unit weight with 1.00 degree angle for A-2-4 soil with 24% fines
Number of Gyrations = 90 Gyration Angle = 1.00 degree Gyration Rate = 20 gyrations/minute

142
A-2-4 soil with 24% fines
106
107
108
109
110
111
112
113
114
115
116
117
118
7 8 9 10 11 12 13 14
Water Content, %
Dry
Uni
t Wei
ght,
pcf
Vertical Pressure = 100 kPaVertical Pressure = 200 kPaVertical Pressure = 300 kPa
Figure 5.14 Effect of vertical pressure on dry unit weight with 1.25 degrees angle for A-2-4 soil with 24% fines
Number of Gyrations = 90 Gyration Angle = 1.25 degrees Gyration Rate = 20 gyrations/minute

143
Thomasville Road Soil
101102103104105106107108109110111112113114115
7 8 9 10 11 12 13 14Water Content, %
Dry
Uni
t Wei
ght,
pcf
Number of Gyrations = 30Number of Gyrations = 60Number of Gyrations = 90Modified ProctorVibratory Compaction
Figure 5.15 Comparison of three compaction curves for Thomasville Road soil
Vertical Pressure = 200 kPa Gyration Angle = 1.25 degrees Gyration Rate = 20 gyrations/minute

144
Sun Coast Parkway Soil
98
99
100
101
102
103
104
105
106
107
108
109
110
7 8 9 10 11 12 13 14 15 16 17 18Water Content, %
Dry
Uni
t Wei
ght,
pcf
Number of Gyrations = 30Number of Gyrations = 60Number of Gyrations = 90Modified ProctorVibratory Compaction
Figure 5.16 Comparison of three compaction curves for Sun Coast Parkway soil
Vertical Pressure = 200 kPa Gyration Angle = 1.25 degrees Gyration Rate = 20 gyrations/minute

145
A-2-4 soil with 12% fines
106
107
108
109
110
111
112
113
114
115
116
7 8 9 10 11 12 13Water Content, %
Dry
Uni
t Wei
ght,
pcf
Number of gyrations = 30Number of gyrations = 60Number of gyrations = 90Modified ProctorVibratory Compaction
Figure 5.17 Comparison of three compaction curves for A-2-4 12% soil
Vertical Pressure = 200 kPa Gyration Angle = 1.25 degrees Gyration Rate = 20 gyrations/minute
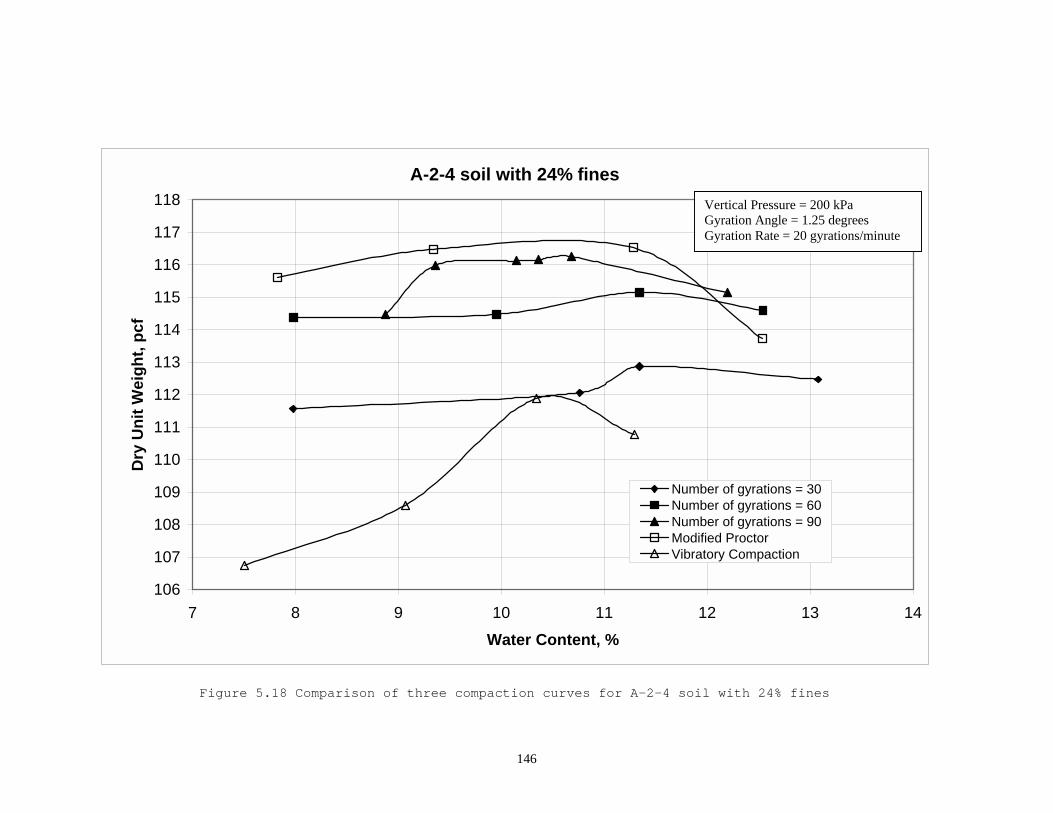
146
A-2-4 soil with 24% fines
106
107
108
109
110
111
112
113
114
115
116
117
118
7 8 9 10 11 12 13 14Water Content, %
Dry
Uni
t Wei
ght,
pcf
Number of gyrations = 30Number of gyrations = 60Number of gyrations = 90Modified ProctorVibratory Compaction
Figure 5.18 Comparison of three compaction curves for A-2-4 soil with 24% fines
Vertical Pressure = 200 kPa Gyration Angle = 1.25 degrees Gyration Rate = 20 gyrations/minute

147
Dry Unit Weight vs Number of Gyrations
106
107
108
109
110
111
112
113
114
115
116
0 30 60 90 120 150 180 210 240 270 300 330Number of Gyrations
Dry
Uni
t Wei
ght,
pcf
Figure 5.19 Dry unit weight versus number of gyrations for Thomasville Road A-3 soil with 7.7% water content
Vertical Pressure = 200 kPa Gyration Angle = 1.25 degrees Gyration Rate = 20 gyrations/minute Water Content = 7.7%

148
Dry Unit Weight vs Number of Gyrations
106
107
108
109
110
111
112
113
114
115
116
0 10 20 30 40 50 60 70 80 90 100 110 120 130Number of Gyrations
Dry
Uni
t Wei
ght,
pcf
Figure 5.20 Dry unit weight versus number of gyrations for Thomasville Road A-3 soil at optimum water content
Vertical Pressure = 200 kPa Gyration Angle = 1.25 degrees Gyration Rate = 20 gyrations/minute
OMC (10.9%)
(10.9%)(11.0%)
(10.9%)(10.8%)
(10.7%)

149
Thomasville Road A-3 soil
106
107
108
109
110
111
112
113
114
115
116
10.9 10.9 11.0 10.9 10.8 10.7 10.7Optimum Water Content, %
Max
imum
Dry
Uni
t Wei
ght,
pcf
Figure 5.21 Selection of critical number of gyrations
120 gyrations
100 gyrations
90 gyrations 80 gyrations
60 gyrations
30 gyrations
Field test

150
CHAPTER 6
CONCLUSIONS AND RECOMMENDATIONS
6.1 Conclusions
Based on the analysis of field and laboratory experimental
results, the following conclusions have been drawn:
1. The impact compaction method did not work well for the
A-3 fine sand soil in developing the compaction curve.
The standard and modified Proctor test procedures,
AASHTO T 90 and T 180, respectively, were not
developed for use with cohesionless soils.
2. The impact compaction method was not an adequate
laboratory test procedure to specify the maximum dry
unit weight and optimum water content for the field
compaction of cohesionless soils. The study showed
that higher field compaction efforts resulted in
higher unit weights and lower optimum moisture
contents than those obtained by the modified Proctor
compaction test.
151
3. Gyratory compaction was more reliable than impact
compaction when fine sands were compacted in the
laboratory.
4. For the gyratory compact test, using the vertical
stress as a means of increasing the dry unit weight
was not effective when the vertical stress was higher
than 200 kPa. The 200 kPa stress level was within the
range of peak vertical soil stresses measured during
the field compaction tests.
5. The gyration angle had some effect on the dry unit
weight when the soil had lower percent of fines, and
when the number of gyrations was higher. When the soil
became more silty (with more than 6% fines), the
influence of the gyration angle on the dry unit weight
became less significant.
6. When the number of gyrations was increased, there was
a continuous increase of dry unit weight, which needed
to be adjusted to get the desired dry unit weight.
7. The gyration rate was not a significant factor on the
dry unit weight when the gyration rate was increased.
8. The gyratory test procedure conducted with 200 kPa
vertical pressure, 1.25 degree gyration angle, 90
gyrations, and 20 gyrations per minute showed

152
considerable promise for replicating field compaction
characteristics.
9. A gyratory compaction test procedure was proposed for
determining the maximum dry unit weight, and optimum
water content of the granular soils with a Servopac
Gyratory Compactor under conditions that simulated
field compaction.
6.2 Recommendations
Based on this study, gyratory compaction was the most
suitable technique to simulate field comapction for
granular soils. However, the experimental program was only
focused on a few sites with A-3 fine sand and A-2-4 silty
sand soils. The research should be expanded to study the
effect of those gyratory variables on clay soils in
laboratory as well as to monitor the performance of the
clay soils under field compaction.
The gyratory compaction may also be used to simulate
field compaction for clay soils. In this case, the clay
soil should not be overly densified or compacted, due to
its tendency of volumetric expansion when the compacted
soils is subjected to wetting or moisture variation. For
clay soils, it would probably be adequate if the gyratory

153
compaction procedure can produce the maxumum dry unit
weight that is equivalent to the one produced by the
modified Proctor test. Because in practice the modified
Proctor compaction method has been working just fine for
field compaction of clay soils.
In Florida, most subgrade soils are classified as A-3
fine sand and A-2-4 silty soils. The gyratory compaction
procedure has great potential to be the construction
specification for quality control of field compaction. A
further research study is recommended for possible
implementation of the gyratory compaction method in design
and construction.

154
APPENDIX A
METHOD OF ESTIMATING GYRATORY COMPACTION ENERGY
A.1 The Force Analysis of Gyratory Machine
During the gyratory compaction, two kinds of forces work on
the soil sample. One of the forces is caused by the
vertical pressure which is constant during the test and it
is the value set before the test. Another force is the
shear force that changes with time. The shear stress is
calculated from the pressure transducers. The equation used
to compute the value during testing is,
)(2HALPs
×××= (A.1)
Where s is the shear stress, P is the average force on the
three actuators, L is the radial distance to the point of
application of the actuator load (165 mm), A is the cross
sectional area of the specimen, and H is the height of the
specimen. This equation is a 2D approximation to a 3D
problem, and is of the same form as that used to compute
shear in other compactors such as the Corps of Engineers
gyratory compactor (McRae et al 1969). But the value of P

155
comes from a totally different type of loading and is based
on measurements from differential pressure transducers at
each actuator.
A.2 Compaction Energy of Servopac Gyratory Machine
With a Servopac gyratory machine, the compaction energy is
transferred to the soil through the vertical pressure and
shear stress (Figure A.2). The method of estimating the
compaction energy is presented as follows.
A.2.1. Work done by vertical pressure
From the figure provided by the Servopac gyratory machine
software, the vertical pressure (stress) is not changed
over time. Therefore, the work done by vertical pressure
can be calculated using the following equation:
HPW verticalvertical ∆×= (A.2)
where: verticalW = the work done by the vertical force verticalP
for the whole soil sample
verticalP = the vertical force = Ap vertical ×.
verticalp. = the vertical pressure that is set before
the gyration

156
A = the area of the cross section of the soil
sample
H∆ = the total height change during the test
= beforeH - afterH
beforeH = the height of the soil before the test
afterH = the height of the soil after the test
The unit energy caused by the vertical pressure:
volume
verticalvertical V
Ww = (A.3)
where : verticalw = the unit work done by the vertical pressure
volumeV = the volume of the soil sample after test
= AHafter ×
The work done by the vertical force for the Sun Coast
Parkway soil was calculated and is presented in Table A.1.
The gyratory condition settings were as the following:
vertical pressure = 200 kPa, gyration angle = 1.25 degrees,
number of gyrations = 90, and gyration rate = 20
gyrations/minute.
A.2.2. Work done by shear force
For the shear stress, s, the direction changes with time.
During one cycle the value of the shear force can be seen

157
as a constant number. For one cycle the work done by the
shear force can be calculated with the following method.
During the gyration (Figure A.2), the center of the
top plane is moving around a circular path with a radius of
R equal to H times θ. When the center moves from point A to
point B, it changes the angle very little dφ.
Then the small arch distance, Rddt ×= φ (A.4)
The distance in X direction, )sin()sin( φφφ ××=×= dRdtdx (A.5)
The distance change in Y direction,
)cos()cos( φφφ ××=×= dRdtdy (A.6)
The shear force in X direction, )cos(φ×= SSx (A.7)
The shear force in Y direction, )sin(φ×= SSy (A.8)
The work done in the X direction,
∫∫∫ ×××××=×××=×=2/
0)sin()cos(4)sin()cos(
πφφφθφφφ dHSdRSdxSW xx
(A.9)
The work done in the Y direction,
∫∫∫ ×××××=×××=×=2/
0)sin()cos(4)cos()sin(
πφφφθφφφ dHSdRSdySW yy
(A.10)
The total work done by the shear force,
θ
φφφθφφθπ
××=
××××+××××=+= ∫H
dHSHSWWW yx
4
))]cos()sin(()cos()sin([42/
0
(A.11)

158
where:
H = height of the soil sample
S = shear force AsS ×=
s = shear stress from the software
A = area of the cross section, 2
2
×= DA π
D = the diameter of the cross section, mmD 150=
The details of the calculation are shown in Table A.2 for
the following conditions:
Sun Coast Parkway soil
vertical pressure = 200 kPa
gyration angle = 1.25 degrees
number of gyrations = 90 gyrations
gyration rate= 20 gyrations/ minute
A.3 Comparison of Energy from Impact and Gyratory
Compaction
From Tables A.1 and A.2, the energy for the gyratory
compaction (vertical pressure = 200 kPa, gyration angle =
1.25 degrees, gyrations = 90) is about 30,000 lb-ft/ft3. The
maximum dry unit weight achieved under the gyratory
compaction was about 109.65 pcf. However, the modified

159
Proctor compaction method used the energy of 56,000 lb-
ft/ft3, but the maximum dry unit weight was 106.5 pcf. The
reason might be that for the impact compaction method, too
much energy is lost during compaction.

160
Table A.1 Work done by the vertical force
Vertical pressure
200000
The height of sample before compaction
0.1906
The height of sample after compaction
0.1754
The diameter of the cross section of sample
0.15
The area of the soil sample
0.01766
The energy done by vertical force
17330
The energy done by vertical force
368.76
)/( 2mNpvertical
)(mH before
)(mH after
)()2
( 22 mDAsample ×= π
)/)(( 3mmNHAHH
ApUafterforce
afterbeforesampleverticalv −
×−
××=
107.4)/(
)/(3
3
×−
=−mmNU
ftftlbU vv
)(mD

161
Table A.2 Work done by the shear force
Number
Of Gyrations
Gyration
Angle
Shear Stress
(kPa)
Sample Height
(mm)
Work Done
(N-m)
1 1.24 93 190.76 27.330
2 1.23 112 188.6 32.541
3 1.23 122 187.05 35.155
4 1.23 126 185.87 36.079
5 1.24 131 184.9 37.315
6 1.24 135 184.07 38.282
7 1.24 137 183.37 38.701
8 1.24 140 182.73 39.410
9 1.24 143 182.16 40.129
10 1.24 144 181.65 40.297
11 1.24 148 181.2 41.314
12 1.25 151 180.76 42.049
13 1.24 153 180.35 42.5095
14 1.24 155 179.98 42.976
15 1.24 158 179.65 43.728
16 1.24 159 179.32 43.924
17 1.24 162 179.02 44.678
18 1.24 162 178.73 44.605
19 1.24 164 178.46 45.088
20 1.24 164 178.18 45.017
21 1.24 166 177.97 45.512
22 1.24 166 177.75 45.456
23 1.24 168 177.54 45.949
24 1.25 168 177.33 45.895
25 1.25 169 177.14 46.119
26 1.25 169 176.97 46.075
27 1.25 170 176.78 46.297
28 1.24 172 176.59 46.792
29 1.24 172 176.42 46.747
30 1.24 172 176.27 46.707
31 1.25 173 176.12 46.939
32 1.24 174 175.97 47.170

162
Number of
Gyrations
Gyration
Angle
Shear Stress
(kPa)
Sample Height
(mm)
Work Done
(N-m)
33 1.24 175 175.82 47.400
34 1.25 174 175.69 47.095
35 1.25 172 175.54 46.514
36 1.24 174 175.42 47.022
37 1.24 175 175.3 47.260
38 1.24 176 175.21 47.506
39 1.24 176 175.09 47.473
40 1.24 176 174.96 47.438
41 1.24 176 174.84 47.405
42 1.24 177 174.74 47.648
43 1.25 178 174.64 47.889
44 1.24 178 174.52 47.856
45 1.25 178 174.43 47.831
46 1.24 176 174.32 47.264
47 1.24 177 174.23 47.508
48 1.24 178 174.13 47.7499
49 1.24 180 174.06 48.267
50 1.24 179 173.97 47.974
51 1.25 179 173.89 47.952
52 1.25 180 173.8 48.194
53 1.24 180 173.72 48.172
54 1.25 179 173.64 47.883
55 1.24 178 173.56 47.593
56 1.24 180 173.51 48.114
57 1.24 180 173.42 48.089
58 1.25 180 173.36 48.072
59 1.25 181 173.31 48.326
60 1.25 180 173.21 48.031
61 1.24 179 173.13 47.742
62 1.25 180 173.05 47.986
63 1.25 180 172.99 47.970
64 1.25 182 172.92 48.483
65 1.24 179 172.85 47.665

163
Number of
Gyrations
Gyration
Angle
Shear Stress
(kPa)
Sample Height
(mm)
Work Done
(N-m)
66 1.24 180 172.79 47.914
67 1.25 181 172.74 48.167
68 1.25 180 172.66 47.878
69 1.25 179 172.6 47.596
70 1.24 180 172.52 47.840
71 1.24 180 172.47 47.826
72 1.25 179 172.39 47.5383
73 1.25 178 172.33 47.256
74 1.25 180 172.28 47.773
75 1.25 182 172.22 48.287
76 1.25 182 172.15 48.267
77 1.24 181 172.09 47.985
78 1.24 180 172.05 47.7096
79 1.25 181 172 47.960
80 1.25 182 171.93 48.206
81 1.25 182 171.86 48.186
82 1.24 181 171.81 47.907
83 1.24 182 171.76 48.158
84 1.24 182 171.7 48.141
85 1.25 182 171.67 48.133
86 1.25 184 171.63 48.650
87 1.24 183 171.59 48.375
88 1.24 184 171.53 48.622
89 1.25 184 171.48 48.608
90 1.24 184 171.43 48.594
total work done by shear stress(90 gyrations) N-m/m3 4133.777
unit work of the soil sample (90 gyrations) lb-ft/ft3 29047.602

164
Figure A.1 The work schematic of the gyratory machine
TEST SPECIMEN
N P L
L
H P
s.A
N
θ

165
Figure A.2 Shear force and Vertical force analysis
Xdφ
φ o
BA
R=Hθ
S S
Y
F
R
θ
O R=Hθ S S
H

166
APPENDIX B
PROPOSED GYRATORY COMPACTION TEST PROCEDURE
B.1 Proposed Scope
This proposed test procedure provides a process for
determining the maximum dry unit weight, and optimum water
content of the granular base/subbase materials with a
SUPERPAVE Gytatory Compactor under conditions that
represent a reasonable simulation of field compaction
characteristics. This proposed gyratory test procedure for
laboratory soil compaction is a better alternative to the
Modified Proctor test procedure which did not produce the
maximum dry unit weight to match the field test value and
did not produce a satisfactory bell shaped compaction curve
for the sandy soil. The properties (optimum water content
and maximum dry unit weight) related to these procedures
can be used as the specification for field compaction.
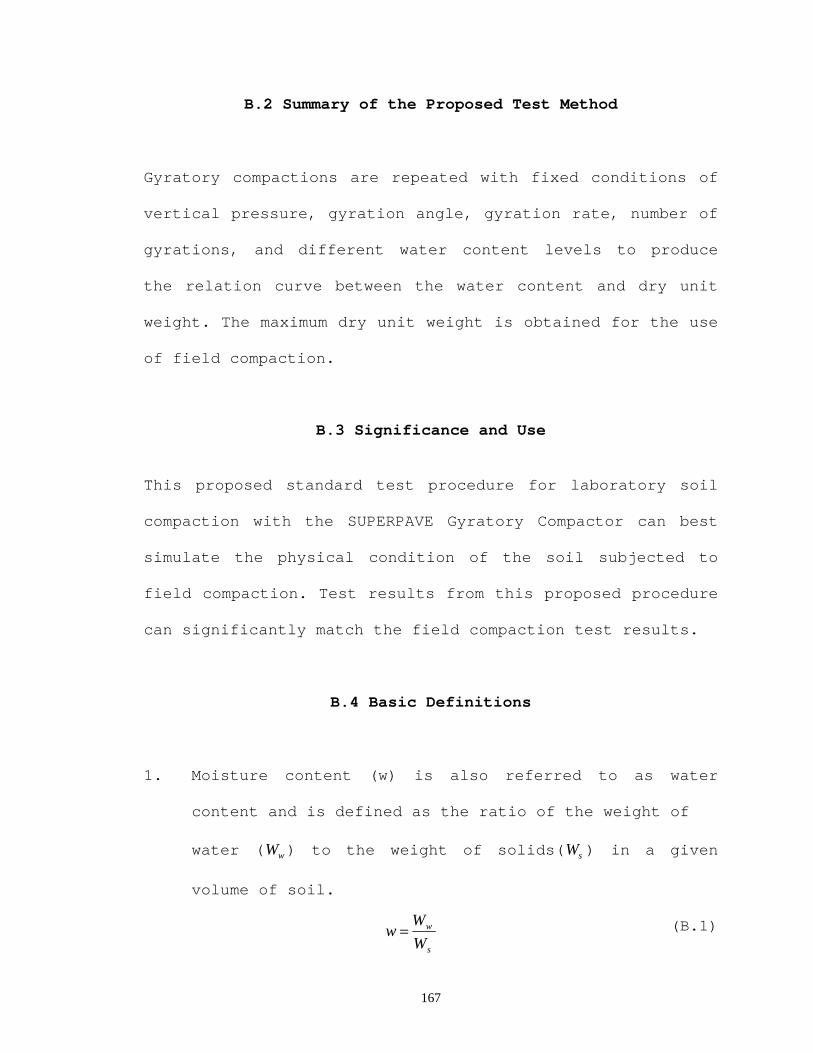
167
s
w
WW
w =
B.2 Summary of the Proposed Test Method
Gyratory compactions are repeated with fixed conditions of
vertical pressure, gyration angle, gyration rate, number of
gyrations, and different water content levels to produce
the relation curve between the water content and dry unit
weight. The maximum dry unit weight is obtained for the use
of field compaction.
B.3 Significance and Use
This proposed standard test procedure for laboratory soil
compaction with the SUPERPAVE Gyratory Compactor can best
simulate the physical condition of the soil subjected to
field compaction. Test results from this proposed procedure
can significantly match the field compaction test results.
B.4 Basic Definitions
1. Moisture content (w) is also referred to as water
content and is defined as the ratio of the weight of
water ( wW ) to the weight of solids( sW ) in a given
volume of soil.
(B.1)

168
VW=γ
wVWs
d +==
1γγ
2. Wet unit weight (γ) is the weight of soil(W ) per unit
volume(V ).
(B.2)
3. Dry Unit Weight (γd) is the weight per unit volume of
soil, excluding water.
(B.3)
4. Vertical Stress is a numerical parameter that defines
the vertical or axial-stress in kPa to be applied to
the specimen during a compaction run.
5. Gyration Rate is a numerical parameter that defines
the number of gyrations per minute of the machine
during a compaction run.
6. Gyrations are the total number of cycles the mold will
rotate.
7. The gyration angle is the amplitude of the mold
rotating.

169
B.5 Proposed Apparatus
The proposed apparatus for gyratory compaction is a
SUPERPAVE gyratory compactor. The gyratory compactor used
for this application is a Servopac Gyratory Compactor
(Figures B.1 and B.2).
The vertical force (compression) is applied using a
digital servo (load) controlled, pneumatic actuator. A load
cell is used to measure the vertical force and the signals
are used to accurately set and maintain the vertical stress
during compaction.
Three gyratory motion actuators are attached to a mold
carrier that clamps the mold securely during compaction. A
pneumatically operated base pedestal, located in the center
of the mold carrier assembly, is used to lower the mold and
its contents into position prior to clamping. The mold is
unclamped and the base pedestal is raised automatically, at
the completion of the compaction process.
A specimen extraction unit is located at the front of
the machine. The extraction ram operates pneumatically and
derives its air supply from the main unit. The connecting
tube is coiled to allow the extraction unit to be detached
from the main unit and rest on the floor without the need
to disconnect it.

170
The basic machine has an LCD display and keypad, which
allows the basic functions to be accessed and altered, i.e,
vertical stress, angle and speed of gyration, target
specimen height and/or number of gyrations; as well as
displaying the specimen height and number of gyrations
during the compaction process. An optional personal
computer(PC) may be connected to the Servopac to access an
increased number of modes and features and generate graphic
plots (Figure B.3).
B.6 Testing Procedures
1. All water should be eliminated in the air pressure
hose that is applied to the Servopac Gyratory Machine
before the power is turned on.
2. The Servopac power is turned on, then the air pressure
is applied and increased to about 100 kPa.
3. A representative sample of the soil or subbase/base
course material proposed for use in the pavement is
obtained.
4. The water content is selected for the test specimen.
The sample of soil or subbase/base material is
thoroughly mixed at the selected water content. The
required water is mixed with about a 5000-g portion of

171
the soil. This sample is allowed to cure for a few
hours or overnight in a closed container in order to
obtain an even moisture distribution.
5. The bottom platen is placed in the mold, and then one
of the two round disks is placed on the bottom platen.
The required weight of cured material is added into
the gyratory mold and hand tamped (with care that the
limit line is observed). After putting in the soil
material, the other round disk is placed on the top of
the soil material (Figure B.4).
6. The mold and its contents are slid into the Servopac,
until the mold comes to rest against the two locating
pegs fitted to the mold carrier (Figure B.5).
7. The ‘MOLD LOWER’ button is pressed and careful
observations verify that the mold was lowered through
the center of the mold carrier.
8. The “MOLD LOCK” button is pressed.
9. The gyratory parameters in the PC program are selected
as the following:
Vertical pressure = 200 kPa
Gyratory angle = 1.25 degrees
Number of gyrations = 90 gyrations
Gyration rate = 20 gyrations/minute

172
10. The “START” key is pressed. The door is then lowered
automatically (Figure B.6).
11. When the termination conditions are satisfied, the
door is opened and the mold is unlocked and raised.
12. The mold is gently pulled forward and across, over the
extraction platen and the specimen is ejected by
operating the “EJECT” switch (Figure B.7).
13. The specimen height is recorded, and saved in a file
for later use.
14. The soil specimen is weighed (Figure B.8).
15. The soil specimen is split yielding about 100-g soil
from the top, middle, and bottom of the specimen along
the axle of the soil specimen. Then the samples are
dried with a microwave oven about 10 minutes to obtain
the water content.
B.7 Calculation
1. The moisture content is calculated.
(B.4)
Where:
specimensoiltheofcontentmoisturew =
)( bowlafter
afterbefore
s
W
WWWW
WW
w−−
==

173
driedissoilthebeforebowltheandsoilwettheofweightWbefore =
driedbeenhassoiltheafterbowltheandsoildrytheofweightWafter =
bowltheofweightWbowl =
2. The dry unit weight is calculated.
From the weight, height of soil specimen, diameter of
the mold, and water content, the dry unit weight is
obtained.
( )wHDW
d
+×
×
×
=
12
2
πγ (B.5)
Where:
specimensoilofcontentwaterwspecimensoilofheightH
mmDmoldofdiameterDspecimensoiltheofweightW
specimensoilofweightunitdryd
==
====
150
γ
B.8 Data Presentation
Figures B.9 and B.10 illustrate the compaction curves
obtained from the gyratory test procedure for A-3 soil and
A-2-4 soil, respectively. From these compaction curves, the
maximum dry unit weight (γd(max)) and optimum moisture
content (ωopt), which is the water content corresponding to

174
γd(max), can be determined. The maximum dry unit weight
(γd(max)) and optimum water content (ωopt) can then be used
for the field specification.
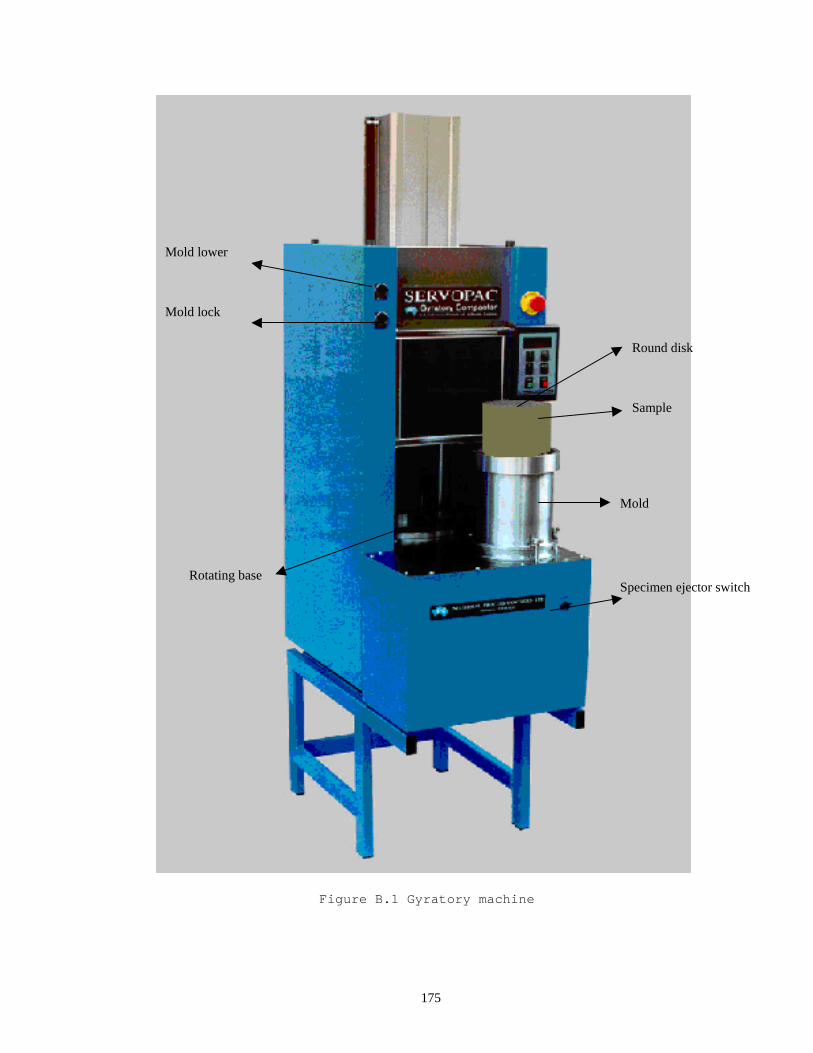
175
Figure B.1 Gyratory machine
Mold lower
Mold lock
Mold
Specimen ejector switch Rotating base
Sample
Round disk
176
Figure B.2 Schematic of Servopac gyratory machine
Vertical Actuator
Emergency Stop
Control Pendent
Specimen Ejector Switch
100 mm bottom platen
100 mm mold
150 mm bottom platen
150 mm mold
Stand
Specimen Extractor
Mold Lower Mold Lock

177
Figure B.3 The gyratory system setup
Figure B.4 Filling the soil in the mold

178
Figure B.5 Sliding the mold on the gyratory plate
Figure B.6 Running the gyratory machine

179
Figure B.7 Ejecting the soil sample from the mold
Figure B.8 The soil sample after gyration

180
Gyratory Compaction Test (A-3 Soil)
101
102
103
104
105
106
107
108
109
110
111
112
113
114
115
7 8 9 10 11 12 13 14Water Content, %
Dry
Uni
t Wei
ght,
pcf
Sun Coast Parkway A-3 SoilThomasville Road A-3 Soil
Figure B.9 Illustration of compaction test results for A-3 soil
Vertical Pressure = 200 kPa Gyration Angle = 1.25 degrees Number of Gyrations = 90 Gyration Rate = 20 gyrations/minute
Maximum Dry Unit Weight
OMC

181
Gyration Compaction Test (A-2-4 Soil)
106
107
108
109
110
111
112
113
114
115
116
117
118
7 8 9 10 11 12 13 14Water Content, %
Dry
Uni
t Wei
ght,
pcf
A-2-4 Soil with 12% FinesA-2-4 Soil with 24% Fines
Figure B.10 Illustration of gyratory compaction test results for A-2-4 soil
Vertical Pressure = 200 kPa Gyration Angle = 1.25 degrees Number of Gyrations = 90 Gyration Rate = 20 gyrations/minute
Maximum Dry Unit Weight
OMC

182
REFERENCES 1. Ardaman & Associates, Inc., 2001. “Summary and
Evaluation of Test Strip Construction, Instrumentation and Monitoring.” Compactive Energy Study; Florida Department of Transportation, File Number 99-6302.
2. Bowles, J., 1984. Physical and Geotechnical Properties
of Soils, McGraw-Hill. 3. Butcher, M., 1998. Determining Gyratory Compaction
Characteristics Using Servopac Gyratory Compaction. In Transportation Research Record 1630, TRB, National Research Council, Washington, D.C, pp.89-96.
4. Cominsky, R., R. B. Leahy, and E. T. Harrigan , 1994.
“Level One Mix Design: Materials Selection, Compaction, and Conditioning,” SHRP-A-408 Strategic Highway Research Program, National Research Council, Washington, D.C.
5. D’Appolonia, D. J., R. V. Whitman, and E. D.
D’Appolonia, 1969. “Sand Compaction with Vibratory Compaction Equipment.” Journal of the Soil Mechanics and Foundations Division (JSMFD), ASCE, Vol. 95, No. SMl.
6. Essigmann, M. F., 1978. Method for Specifying Soil
Compaction. In Transportation Research Record 690, TRB, National Research Council, Washington, D.C.
7. Forssblad, L., 1967. New Method for Laboratory Soil
Compaction by Vibration. Highway Research Record 177, HRB, National Research Council, Washington, D.C.
8. George, K. P., and W. Uddin, 1993. “Verifying Kneading
Resilient Modulus of Soils with Backcalculated Values.” In Transportation Research Record 1406, TRB, National Research Council, Washington, D.C.

183
9. Hampton, D., and E. T. Selig, 1967. “Field Study of Soil Compaction”, Highway Research Record 117, HRB, National Research Council, Washington, D.C., pp.44-57.
10. Hanson, D. I., 1998. “Evaluation of Servopac Superpave
Gyratory Compactor,” National Center for Asphalt Technology, Auburn University, Alabama.
11. Kadar, P., 1992. “The Development and Testing of a
Gyratory Asphalt Compactor”, Australian Asphalt Pavement Association Project, Report INS4.
12. Leonard, M., 2002. “Laboratory simulation of field
compaction characteristics”, Master thesis, Florida State University, Tallahassee. Florida.
13. Lewis, W. A., 1961. “Recent Research into the
Compaction of Soils by Vibratory Compaction Equipment.” Proceedings Fifth ICSMFE, Paris, Vol. 2.
14. McRae, J. L., 1965. “THEORETICAL ASPECTS OF MIX DESIGN
FOR PLANT MIXED ASPHALTIC CONCRETE” , Lecture for the Asphalt Institute 1965 summer program in asphalt technology and construction on the Texas A&M campus
15. McRae, J. L., and C. R. Foster., 1959. “Theory and
Application of a Gyratory Testing Machine for Hot-Mix Bituminous Pavement,” Miscellaneous Paper No.4-333, U.S. Army Engineer Waterways Experiment Station, CE, Vicksburg, Miss.
16. McRae, J. L., and A. R. McDaniel, 1962. “Feasibility
Study of the Gyratory Machine for Testing Soils,” Miscellaneous Paper No. 3-474, U.S. Army Engineer Waterways Experiment Station, CE, Vicksburg, Miss.
17. McRae, J. L., and A. R. McDaniel, 1962. “Gyratory
Compaction Method for Determining Density Requirements for Subgrade and Base of Flexible Pavements,” Miscellaneous Paper No. 4-494, U.S. Army Engineer Waterways Experiment Station, CE, Vicksburg, Miss.
18. McRae, J. L., 1997. “Use of Gyratory Testing Machine
(GTM) to evaluate exiting airfield pavement, base and subgrade for use by larger military aircraft,” Mechanical Tests for Bituminous Materials, Di

184
Benedetto & Francken (eds), ISBN 9054108762. PP.575-583.
19. McDowell, C., 1967. Density Control: Its Benefits and
Complexities. Highway Research Record 177, HRB, National Research Council, Washington, D.C.
20. National asphalt training center, Feb. 1995.
“Background of superpave asphalt mixture design and analysis”, demonstration project 101, Federal Highway Administration, FHWA-SA-95-003.
21. Research Society for Road and Traffic, team for earth
and foundation construction, 1994, “Technical Testing Instructions for Soil and Rock in Road Construction, part E2: surface Covering Dynamic Compaction Test.”
22. Selig, E. T., and W. B. Truesdale, 1967. “Properties
of Field Compacted Soils”, Highway Research Record 117, HRB, National Research Council, Washington, D.C., pp. 77-79.
23. Selig, E. T., 1982. Compaction Procedures,
Specifications, and Control Considerations. In Transportation Research Record 897, TRB, National Research Council, Washington, D.C
24. Selig, E. T., and T. Yoo, 1982. Compaction Effects of
Oscillating Rollers. In Transportation Research Record 897, TRB, National Research Council, Washington, D.C.
25. Transportation Research Board, National Research
Council, 1990. Guide to Earthwork Construction State of the Art. Report 8.
26. Turnbull, W. J., 1958. Stabilization of Materials by
Compaction. American Society of Civil Engineers: Journal of the Soil Mechanics and Foundations Division, Vol. 123.
27. U.S. Army Engineer Waterways Experiment Station, Sep.
1968. “Gyratory Compaction of Soil, report 1, Pit-run clay gravel, data report.” Vicksburg, Miss.
28. U.S. Army Engineer Waterways Experiment Station, Nov.
1969. “Gyratory Compaction of Soil, report 2, lean clay, data report.” Vicksburg, Miss.

185
29. U.S. Army Engineer Waterways Experiment Station, May,
1969. “Gyratory Compaction of Soil, report 3, crushed limestone data report.” Vicksburg, Miss.
30. U.S. Army Engineer Waterways Experiment Station,
February, 1962. “Development of the Gyratory Testing Machine and Procedures for Testing Bituminous Paving Mixtures.” Vicksburg, Miss.
31. Vinod, K. G., 1988. “Effect of Sample Size on Shear
Strength of Basaltic Residual Soils” Canadian Geotechnical Journal, Vol.25. pp.478-487.
32. Yong, R. N., and E. A. Fattah, 1982. Prediction of
Roller Compaction Efficiency. In Transportation Research Record 897, TRB, National Research Council, Washington, D.C.