field demonstration of the use of metarhizium anisoplae for
TRANSCRIPT

8/7/2019 Field Demonstration of the Use of Metarhizium Anisoplae For
http://slidepdf.com/reader/full/field-demonstration-of-the-use-of-metarhizium-anisoplae-for 1/16
Field Demonstration of the Use of Metarhizium anisoplae for
Desert Locust Control Using the Release – Spray- Recapture
Method
Mohamed El Hadi Ould Taleb1
Diallo Amadou2
1. Project : GCP/INT/651/NOR, Nouakchott, Mauritania
2. Centre de Lutte Antiacridiennce, Nouakchott, Mauritania
GCP/INT/651/NOR
EMPRES
Improving Pesticide Application
Techniques for Desert Locust
Control
March 2001

8/7/2019 Field Demonstration of the Use of Metarhizium Anisoplae For
http://slidepdf.com/reader/full/field-demonstration-of-the-use-of-metarhizium-anisoplae-for 2/16
Improving Pesticide Application Techniques for DesertLocust Control
This report is prepared under GCP/INT/651/NOR, “Improving Pesticide Application
Techniques for Desert Locust Control”, a collaborative project between FAO, the Centre
National Lutte Antiacridienne, Nouakchott, Mauritania, and other countries of the EMPRES
Western Region. The project is funded by Norway and executed by FAO.
The views expressed in this report of those of the authors alone, and do not imply anyrecommendation by FAO or other collaborators of any products mentioned in the report.

8/7/2019 Field Demonstration of the Use of Metarhizium Anisoplae For
http://slidepdf.com/reader/full/field-demonstration-of-the-use-of-metarhizium-anisoplae-for 3/16
Table of Contents
1 Introduction..........................................................................................................................2
2 Methods................................................................................................................................2
2.1 Site Description.............................................................................................................32.2 Germination Test...........................................................................................................3
2.3 Application Parameters .................................................................................................4
2.3.1 Application Conditions ..............................................................................................4
2.4 Sampling Methods.........................................................................................................4
2.4.1 Insects present in the plot at the time of treatment. ...................................................4
2.4.2 Persistence of GM Activity........................................................................................4
2.4.3 Untreated Controls .....................................................................................................5
2.4.4 Data Collected............................................................................................................5
3 Results..................................................................................................................................5
3.1 Mortality – Insects present in Plot at Time of Application...........................................5
3.1.1 Insects Collected 2 hours after treatment...................................................................53.1.2 Insects Collected 3 days after treatment ....................................................................6
3.2 Persistence of GM .........................................................................................................6
3.2.1 Insects Exposed Immediately After Application ( 0 D).............................................6
3.2.2 Insects Exposed 3 Days After Application ( 3 DAT) ................................................6
3.2.3 Insects Exposed 6 Days After Application (6 DAT) .................................................6
3.2.4 Insects Exposed 9 Days After Application (9 DAT) .................................................6
3.2.5 Insects Exposed 12 Days After Application (12 DAT) .............................................6
3.3 Temperature and Relative Humidity .............................................................................7
4 Discussion............................................................................................................................7
5 Conclusions..........................................................................................................................8
6 Acknowledgements..............................................................................................................8
8/7/2019 Field Demonstration of the Use of Metarhizium Anisoplae For
http://slidepdf.com/reader/full/field-demonstration-of-the-use-of-metarhizium-anisoplae-for 4/16
1 Introduction
In order to reduce the reliance on synthetic organic insecticides, the LUBILOSA (Biological
control of Locusts and Grasshoppers) have developed and marketed an insecticide based on
the fungus Metarhizium anisoplae var acridum Gams & Rozsypal (Deuteromycotina:Hyphomycetes). This fungus is marketed as “Green Muscle”, and is available in dry powder
and oil flowable formulations.
One of the objectives of the EMPRES programme is to promote the use of more
environmentally friendly control methods for Desert Locust such as “Green Muscle”.
However, one of the limitations has been the absence of field populations of Desert Locust on
which to undertake large scale trials.
Under the auspices of the project “Improving Pesticide Application Techniques for Desert
Locust Control”, a workshop was held in Mauritania from 17th – 30 November 2001. During
this workshop – Improved Spraying Techniques and Novel Survey Methods in Desert LocustControl – a session was held on the use of “Green Muscle” under field conditions. The aim of
this work was to demonstrate to participants – from India, Mauritania, Pakistan, Sudan and
Yemen – how to use and evaluate the efficacy of “Green Muscle” (GM) under field
conditions, in order that when the opportunity arises they will be able to undertake large scale
field trials in their own countries to promote the uptake of this product for Desert Locust
control. An expert from the LUBILOSA project (Mr Kpindou) led this section of the
workshop.
The specific objections of this work were to demonstrate :
• how to prepare the formulation for use
• the application of GM
• sampling methods
• to measure the persistence of GM in the field
in order that the participants could execute this work in their own conditions using a standard
technique.
2 Methods
As no field populations of Desert Locust were present at the time of the demonstration,insects from the large scale rearing facilty at Nouakchott were used as the target. (A large
scale rearing facility at Akjoujk had been established to produce insects for this work, but
unfortunately the insects at Akjoujt were not suitable due to their stage of development. Thus
insects from Nouakchott were used. This meant that the longer transport required to the field
site resulted in some mortality as a result of stress).
The method used was that these reared insects were released into the target area a few minutes
before application. After the plot had been sprayed, at various times after spraying samples of
insects were captured for assessment of biological effect. This method does not permit a
estimation of population control, as released insects are generally preyed upon very quickly
after release.

8/7/2019 Field Demonstration of the Use of Metarhizium Anisoplae For
http://slidepdf.com/reader/full/field-demonstration-of-the-use-of-metarhizium-anisoplae-for 5/16
2.1 Site Description
The area used or the trial was a wadi located 50 km (19 37 759 N 14 4 825 W) which was a
run off area for water coming from the hills north west of Akjoujt. Soil was sandy-clay.
Vegetation cover (estimated at 70%, mean plant height 0.4 m with a leaf area index of about
4) was largely Farsetia ramossissima. Other species present included Corchorus depressus, Heliotropium bacciferum, Psorellea plicata, Indigofera sp, Gisekia pharmacoides, Panicum
turgidum, Maerua crassifolia, Calotropis procera,Capparis decidua, Acacia raddiana .
(Photo 1).
Photo 1
2.2 Germination Test
A sample of the formulation was analysed for spore germination before and after the
treatment. The spore suspension is diluted with diesel in order to adjust the concentration of
spores to facilitate counting. Two or three drops of the diluted suspension were placed in each
of three petri dishes which contained Sabouraud Dextrose Agar (SDA). The dishes were
incubated at 26o
C for 20 hours. The dishes were examined under a microscope (40X) and thenumber of spores germinated (ie showing a germ tube) and non germinated were counted.
Before Application After ApplicationRepititions
Germinated
Spores
Spores
Non
Germinated
Total Germinated
Spores
Spores Non
Germinated
Total
I 118 11 126 20
II 122 6 103 19
III 93 8 94 9
Mean 111 8.33 119.33 107.66 16 123.66
% germination 93.02 87.06

8/7/2019 Field Demonstration of the Use of Metarhizium Anisoplae For
http://slidepdf.com/reader/full/field-demonstration-of-the-use-of-metarhizium-anisoplae-for 6/16
2.3 Application Parameters
Two Micron ULVA+ units were used simultaneously
Formulation : Oil Flowable (OF)
Dosage : 50 g spores/haVolume Application Rate : 2 l/ha (0.1 l OF + 1.9 l diesel)
Equipment : Micron ULVA+
Flowrate : 70 ml/min
Track Spacing : 6 m (marked by flagmen)
Number of Batteries : 5
RPM : Unit 1 6324; Unit 2 6341
Oil sensitive papers (28) were place throughout the plot in order to monitor the number of
droplets collected.
2.3.1 Application Conditions
Start End
Time 9h36 9h48
Temprature (0C) 25 25
%RH 23 23
Windspeed ms-1
4.65 4.65
Wind direction throughout the spraying period was 70 – 90o
relative to the spray track.
Conditions were generally good for the application.
About 15 minutes before spraying, approximately 5000 Desert Locusts (a mixed population
structure of L2 – L5) were released into the plot.
2.4 Sampling Methods
2.4.1 Insects present in the plot at the time of treatment.
Two hours after treatment 80 insects (L2 – L5) were collected and divided into 4 cages (20 per
cage – cage size 25 cm x 25 cm x 30 cm). The cages were transported to the laboratory for
monitoring.
Three days after treatment, a further 80 insects were collected from the plot and treated as
above.
Six days after treatment, no insects could be found in the treated area, although 2 were found
the following day and collected.
2.4.2 Persistence of GM Activity

8/7/2019 Field Demonstration of the Use of Metarhizium Anisoplae For
http://slidepdf.com/reader/full/field-demonstration-of-the-use-of-metarhizium-anisoplae-for 7/16
To study the persistence of GM, 3 cages (constructed from mosquito netting, 70 cm x 70 cm x
80 cm) were placed in the plot after treatment. In each cage 20 insects (L2 – L5) from an
untreated population were released. These insects were left in the cages for 72 hours, after
which they were collected and removed to the laboratory for observation. This was done 5
times – immediately after application (0 DP), and 3, 6 9 and 12 days after application). For
each time, the cages were moved to a new point on the plot.
2.4.3 Untreated Controls
Three cages containing 20 insects each were used as controls. They were kept under the same
conditions as the insects sampled from the field. They were followed for 15 days, and were
used as a comparison between treated and untreated for 0 and 3 days after treatment for those
insects present during spraying, and for the persistence samples for 0 and 3 days after
application.
However, it became clear that the mortality in the control was very high. This can largely beascribed to the effect of the long transport and additional handling of the insects. A new
control was established for insects exposed to the plot 6, 9 and 12 days after treatment, using
insects from the rearing facility at Akjoujt.
2.4.4 Data Collected
Temperature and relative humidity inside and outside the laboratory were noted at 2 hourly
intervals during the day.
Cages were checked daily for mortality, and dead insects were removed and placed in petri
dishes (see below). Cages were cleaned and fresh food placed in regularly.
The dead insects were allowed to dry in petri dishes for 24 hours. They were then placed on a
piece of moist paper in the same dish and left for a further 24 hours. Those insects which were
infected with the fungus clearly showed sporulation after this time.
3 Results
The average number of droplets counted on the cards was 16.9 per cm2. This is lower than
expected and probably results from the fading of the deposit. For operational reasons, it was
not possible to analyse the oil sensitive paper until some days after the treatment, andalthough diesel marks the paper clearly, the stain does fade after a time. It is likely that this
has led to an underestimate of the drops actually deposited.
3.1 Mortality – Insects present in Plot at Time of Application
3.1.1 Insects Collected 2 hours after treatment
15 days after treatment, the insects which were present during spraying and collected 2 hours
after treatment showed a mortality of 92.5 %. However, control mortality was high at 44..3%.
(Figure 1). As discussed above, this high mortality probably resulted from stress due totransport. Fifteen days after treatment, 37% of the insects were showing signs of sporulation.

8/7/2019 Field Demonstration of the Use of Metarhizium Anisoplae For
http://slidepdf.com/reader/full/field-demonstration-of-the-use-of-metarhizium-anisoplae-for 8/16
3.1.2 Insects Collected 3 days after treatment
Figure 2 presents this data. It should be noted that the control data used in this will include
those insects which had died as a result of stress during transport. However, for those insects
collected three days after treatment (DAT), only those that survived for after release will have
been collected. However, by 8 DAT the mortality in the treated insects began to exceed that
of the controls, and reached 77.5% by 18 DAT. Sporulation was evident from 7 DAT and
reached 48.5% by 18 DAT.
3.2 Persistence of GM
3.2.1 Insects Exposed Immediately After Application ( 0 D)
The total mortality of the insects exposed to the deposit immediately after treatment is lowerthan those exposed during treatment (Fig 3), reaching 57%. However, in terms of sporulation,
there was little difference between those on present during treatment and those exposed
immediately after (about 37% in both cases).
3.2.2 Insects Exposed 3 Days After Application ( 3 DAT)
The results are similar to 0 D; with the maximum mortality reaching 59% and 37% showing
signs of sporulation 21 DAT – which is equivalent to 18 days after first exposure of these
insects to the treated plot, and 15 days after removal from it. (Figure 4).
3.2.3 Insects Exposed 6 Days After Application (6 DAT)
A new control batch was used in at this time. Mortality reached 51% 24 DAT, while
sporultation had fallen to 14% (Figure 5).
3.2.4 Insects Exposed 9 Days After Application (9 DAT)
Figure 6 illustrates that the difference in mortality between the control and treated insects was
about 10% (26% in the control and 36% in the treated 27 DAT). Interestingly, about 10% of
the insects showed signs of sporulation.
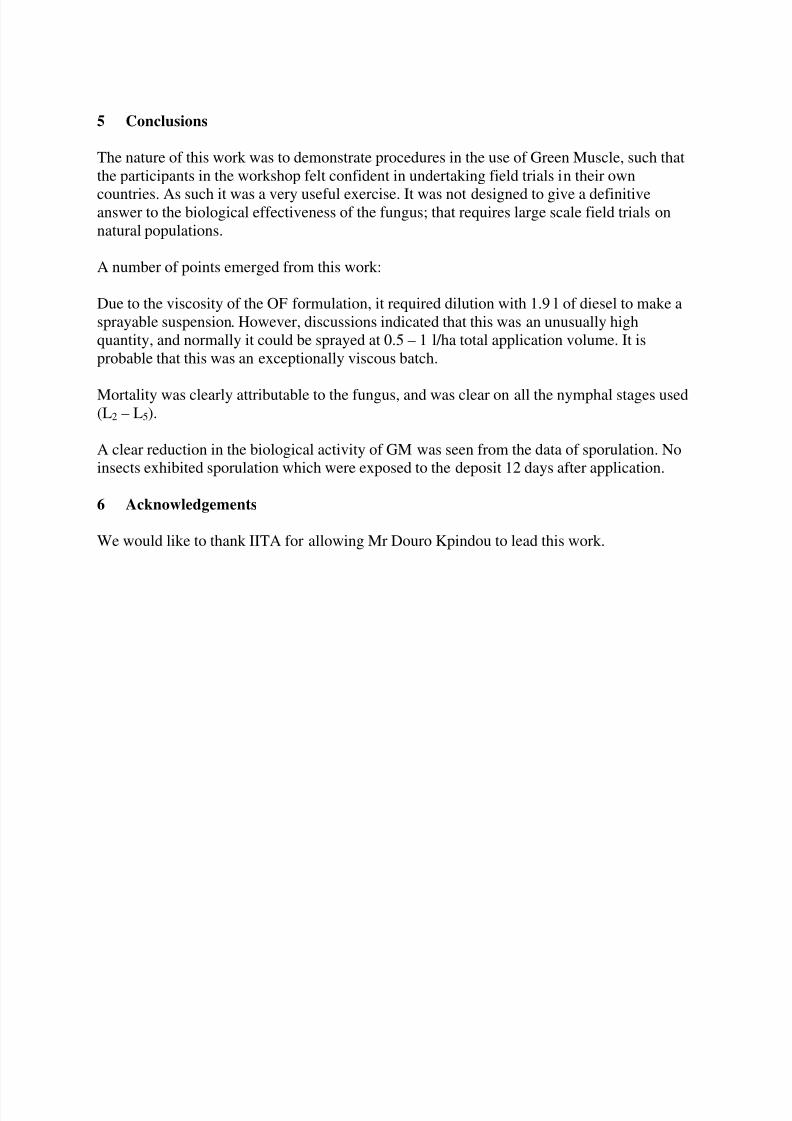
3.2.5 Insects Exposed 12 Days After Application (12 DAT)
There was no difference between the control and treated insects. No sporulation was evident
30 DAT. (Figure 7).
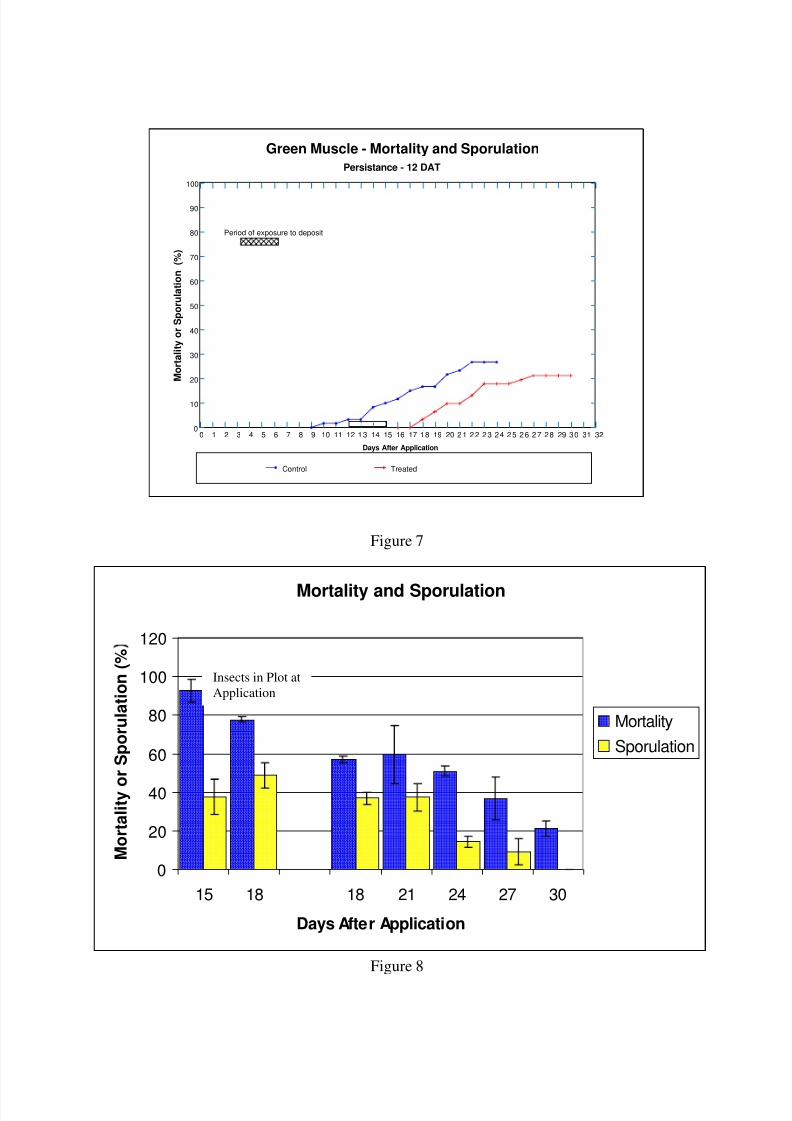
The results are summarised in Figure 8.

8/7/2019 Field Demonstration of the Use of Metarhizium Anisoplae For
http://slidepdf.com/reader/full/field-demonstration-of-the-use-of-metarhizium-anisoplae-for 9/16
3.3 Temperature and Relative Humidity
Temperature and relative humidity were recorded at 2 hourly intervals in both the laboratory
(where the insects were kept after collection) and exterior (as an indication of the conditions
in the field). These data have been analysed on a frequency basis as an indication of the
temperature and relative humidity variation throughout the daytime (Figure 9 – 12). It is clearthat there is less variation in the laboratory, where over 75% of the readings were between 25oC and 29
oC; this compares to 50% for the field readings. Similarly, the relative humidity
stayed more constant in the laboratory, with 85% of the readings between 21 and 24% RH,
compared to 65% for the field.
4 Discussion
Figure 8 is a summary of the results. In terms of mortality it is difficult to draw any
conclusions due to the high control mortality as a result of stress induced by transport. The
failure of the culture in Akjoujk to provide sufficient locusts meant that insects had to be
transported from Nouakchott.
There is however, a clearer picture in terms of insects showing signs of sporulation (and
therefore infected with the fungus). For those insects subjected to direct spray and removed 2
hours after treatment, 37% of the insects were confirmed as being infected by the fungus. This
increased to 48% when the insects were left on the treated plot for three days. Three days after
treatment however, this had fallen to 37%, and continued to fall to 0 at day 12 after
application. This therefore indicates that, under the conditions throughout this work, the
biological effectiveness of the fungus had disappeared by day 12, presumably as a result of
spore degradation by sunlight and temperature.
It is not possible to exclude the fact that the deposit obtained from the application was
comparatively low in terms of drops per cm2. The data from the oil sensitive paper is
unreliable due to the possibility of the stains fading thus resulting in undercounting.
8/7/2019 Field Demonstration of the Use of Metarhizium Anisoplae For
http://slidepdf.com/reader/full/field-demonstration-of-the-use-of-metarhizium-anisoplae-for 10/16
5 Conclusions
The nature of this work was to demonstrate procedures in the use of Green Muscle, such that
the participants in the workshop felt confident in undertaking field trials in their own
countries. As such it was a very useful exercise. It was not designed to give a definitiveanswer to the biological effectiveness of the fungus; that requires large scale field trials on
natural populations.
A number of points emerged from this work:
Due to the viscosity of the OF formulation, it required dilution with 1.9 l of diesel to make a
sprayable suspension. However, discussions indicated that this was an unusually high
quantity, and normally it could be sprayed at 0.5 – 1 l/ha total application volume. It is
probable that this was an exceptionally viscous batch.
Mortality was clearly attributable to the fungus, and was clear on all the nymphal stages used(L2 – L5).
A clear reduction in the biological activity of GM was seen from the data of sporulation. No
insects exhibited sporulation which were exposed to the deposit 12 days after application.
6 Acknowledgements
We would like to thank IITA for allowing Mr Douro Kpindou to lead this work.

8/7/2019 Field Demonstration of the Use of Metarhizium Anisoplae For
http://slidepdf.com/reader/full/field-demonstration-of-the-use-of-metarhizium-anisoplae-for 11/16
Green Muscle - Mortality and SporulationInsects Present In Plot (D0)
Days After Application
M o r t a l i t y o r S p o r u l a t i o n
( % )
0
10
20
30
40
50
60
70
80
90
100
0 1 2 3 4 5 6 7 8 9 10 11 12 13 14 15 16 17 18 19 20 21 22 23 24 25 26 27 28 29 30 31 32
Control Treated Sporulation
Insects present in plot at application and collected after 2 hours
Figure 1
Green Muscle - Mortality and Sporulation
Insects Present In Plot (D3)
Days After Application
M o r t a l i t y o r S p o r u l a t i o n
( % )
0
10
20
30
40
50
60
70
80
90
100
0 1 2 3 4 5 6 7 8 9 10 11 12 13 14 15 16 17 18 19 20 21 22 23 24 25 26 27 28 29 30 31 32
Control Treated Sporulation
Insects present in plot at application and collected after 3 days
Period of exposure to deposit
Figure 2

8/7/2019 Field Demonstration of the Use of Metarhizium Anisoplae For
http://slidepdf.com/reader/full/field-demonstration-of-the-use-of-metarhizium-anisoplae-for 12/16
Green Muscle - Mortality and SporulationPersistance (D0)
Days After Application
M o r t a l i t y o r S p o r u l a t i o n
( % )
0
10
20
30
40
50
60
70
80
90
100
0 10 20 30
Control Treated Sporulation
Insects exposed to deposit after applicationPeriod of exposure to deposit
Figure 3
Green Muscle - Mortality and Sporulation
Persistance - 3 DAT
Days After Application
M o r t a l
i t y o r S p o r u l a t i o n
( % )
0
10
20
30
40
50
60
70
80
90
100
0 1 2 3 4 5 6 7 8 9 10 11 12 13 14 15 16 17 18 19 20 21 22 23 24 25 26 27 28 29 30 31 32
Control Treated Sporulation
Period of exposure to deposit
Figure 4

8/7/2019 Field Demonstration of the Use of Metarhizium Anisoplae For
http://slidepdf.com/reader/full/field-demonstration-of-the-use-of-metarhizium-anisoplae-for 13/16
Green Muscle - Mortality and Sporulation
Persistance - 6 DAT
Days After Application
M o r t a l i t y o r S p o r u l a t i o n
( % )
0
10
20
30
40
50
60
70
80
90
100
0 1 2 3 4 5 6 7 8 9 10 11 12 13 14 15 16 17 18 19 20 21 22 23 24 25 26 27 28 29 30 31 32
Control Treated Sporulation
Period of exposure to deposit
Figure 5
Green Muscle - Mortality and Sporulation
Persistance - 9 DAT
Days After Application
M o r t a l i t y o r S p o r u l a t i o n
( % )
0
10
20
30
40
50
60
70
80
90
100
0 1 2 3 4 5 6 7 8 9 10 11 12 13 14 15 16 17 18 19 20 21 22 23 24 25 26 27 28 29 30 31 32
Control Treated Sporulation
Period of exposure to deposit
Figure 6
8/7/2019 Field Demonstration of the Use of Metarhizium Anisoplae For
http://slidepdf.com/reader/full/field-demonstration-of-the-use-of-metarhizium-anisoplae-for 14/16
Green Muscle - Mortality and Sporulation
Persistance - 12 DAT
Days After Application
M o r t a l i t y o r S p o r u l a t i o n
( % )
0
10
20
30
40
50
60
70
80
90
100
0 1 2 3 4 5 6 7 8 9 10 11 12 13 14 15 16 17 18 19 20 21 22 23 24 25 26 27 28 29 30 31 32
Control Treated
Period of exposure to deposit
Figure 7
Figure 8
Mortality and Sporulation
0
20
40
60
80
100
120
15 18 18 21 24 27 30
Days After Application
M o r t a l i t y o
r S p o r u l a t i o n ( %
Mortality
Sporulation
Insects in Plot at
Application

8/7/2019 Field Demonstration of the Use of Metarhizium Anisoplae For
http://slidepdf.com/reader/full/field-demonstration-of-the-use-of-metarhizium-anisoplae-for 15/16
Figure 9
Figure 10
Daytime Temperature
Laboratory
0
5
10
15
20
25
18 19 20 21 22 23 24 25 26 27 28 29 30 31 32 33 34
Temperature (C)
F r e q u e n c y ( % )
Daytime Relative Humidity
Laboratory
0
10
20
30
40
50
1 8 2 0 2 2 2 4 2 6 2 8 3 0 3 2 3 4 3 6 3 8 4 0 4 2 4 4 4 6 4 8 5 0
Relative Humidity (%)
F r e q u e n c y ( % )

8/7/2019 Field Demonstration of the Use of Metarhizium Anisoplae For
http://slidepdf.com/reader/full/field-demonstration-of-the-use-of-metarhizium-anisoplae-for 16/16
Figure 11
Figure 12
Daytime Temperature
Exterior
0
5
10
15
20
25
18 19 20 21 22 23 24 25 26 27 28 29 30 31 32 33 34
Temperature (C)
F r e q u e n c y ( % )
Daytime Relative Humidity
Exterior
0
10
20
30
40
50
1 8 2 0 2 2 2 4 2 6 2 8 3 0 3 2 3 4 3 6 3 8 4 0 4 2 4 4 4 6 4 8 5 0
Relative Humidity (%)
F r e q u e n c y ( % )