field crops research - lzu.edu.cn
TRANSCRIPT

Contents lists available at ScienceDirect
Field Crops Research
journal homepage: www.elsevier.com/locate/fcr
Developing sustainable cropping systems by integrating crop rotation withconservation tillage practices on the Loess Plateau, a long-term imperative
Zhou Lia,b, Xuan Yanga,b, Song Cuid, Qian Yanga,b,c, Xianlong Yanga,b, Juncheng Lia,b,Yuying Shena,b,c,⁎
a State Key Laboratory of Grassland Agro-ecosystems, Lanzhou, 730020, Chinab College of Pastoral Agriculture Science and Technology, Lanzhou University, Lanzhou, 730020, ChinacNational Demonstration Center for Experimental Grassland Science Education, Lanzhou University, Lanzhou, 730020, Chinad School of Agribusiness and Agriscience, Middle Tennessee State University, Murfreesboro, TN, 37132, USA
A R T I C L E I N F O
Keywords:No tillageSoil organic carbonSoil total nitrogenEnergyEconomy
A B S T R A C T
Loess Plateau agriculture, largely dependent on manual labor and precipitation water, exemplifies semiariddryland agricultural systems in China, where better cropping systems and practices are essential for maintainingcrop productivity and sustaining natural resources. An 11-year (2001–2011) study at the Xifeng, Gansu in-vestigated the effects of different conservation tillage practices and straw mulching methods on yield, waterproductivity (WP), soil organic carbon (SOC), total nitrogen (TN), energy expenditure and economic returns of amaize (Zea mays L.)-winter wheat (Triticum aestivum L.)-summer soybean (Glycine max L.) rotation system.Treatments included conventional tillage (T) as control, conventional tillage followed by straw mulching (TS),no tillage (NT) and no tillage followed by straw mulching (NTS). On average, TS treatment had increased yieldby 11, 22, and 4%; as well as WP by 13, 22, and 7% than T, NT and NTS treatments, respectively. Additionally,NTS indicated the greatest effect in increasing SOC and TN in the 0–10 cm soil layer. Our support vector machine(SVM)-based simulation modeling indicated great performance on predicting maize yield (R2= 0.76) and wheatWP (R2=0.84) based on a 10-fold cross validation (10-fold CV). TS treatment provided the greatest net energyand net economic income, and NTS treatment indicated the greatest economic benefit.
1. Introduction
To meet the growing demand for food abundance and security in thefast-growing developing countries as China, and at the same timemaintain the social, economic, and environmental sustainability acrossdifferent agroecosystems, agricultural innovations and integratedsystem approaches are imperative. The Loess Plateau is one of the mostintensive agronomic production regions in China featuring large grain-crop acreage, limited precipitation, erratic weather condition, and se-vere environmental degradation (Shan, 1993). To address the societal,ecological, and agricultural concerns on how the increasing populationcan be sustained, tremendous amount of alternative/innovative pro-duction practices have been adopted by producers nationwide, in-cluding rotational cropping and conservation tillage (Li et al., 2007;Wang et al., 2009; Liu et al., 2014b; He et al., 2016; Niu et al., 2016; Luand Lu, 2017). Particularly, conservation tillage/rotation practices,characterized by minimized soil disturbance, incorporation of strawmulching and integrated crop rotation (especially using legumes) have
accounted for 6.67×10⁷ ha of the agricultural acreage in China(Kassam et al., 2015).
A large number of studies have shown that conservation tillagepractices have produced favorable ecological benefits, including im-proved soil structure, increased soil organic contents, reduced surfacerunoff and soil erosion, improved nutrient condition of soil as well asincreased crop yield and water use efficiency (Tabaglio et al., 2009;Mazzoncini et al., 2016; Somasundaram et al., 2017). Meanwhile, thereare clear evidences that incorporating straw mulching in conservationtillage practices could reduce greenhouse gas emission by tillage, saveproduction costs, and further increase profitability (Sharma et al., 2011;Jin et al., 2017; Lu and Lu, 2017). However, great amount of hetero-geneity also exists in productivity and economic impact due to the factthat many crop varieties and indigenous practices have been spatiallyand temporally compartmentalized, which greatly hinder the inter-pretation and conclusion of certain experimental effects related toconservation practices. For example, many studies have also indicatedthat neither zero tillage nor straw mulching could actually increase
https://doi.org/10.1016/j.fcr.2018.03.027Received 5 December 2017; Received in revised form 26 March 2018; Accepted 31 March 2018
⁎ Corresponding author at: State Key Laboratory of Grassland Agro-ecosystems, College of Pastoral Agriculture Science and Technology, Lanzhou University, Lanzhou, 730020, China.E-mail address: [email protected] (Y. Shen).
Field Crops Research 222 (2018) 164–179
0378-4290/ © 2018 Elsevier B.V. All rights reserved.
T

crop yield or profitability (Pittelkow et al., 2015; Ernst et al., 2016;Seddaiu et al., 2016). Therefore, obtaining site-specific results is es-sential.
The Loess Plateau is located in the semi-arid climate zone ofnorthwestern China. The prevalence of traditional tillage and labor-intensive farming has fed millions of people for thousand years,meanwhile, has significantly overburdened the ecological resilienceand sustainability. Nowhere is more evident than in the semi-arid LoessPlateau of China where information related to alternative farmingpractices and long-term studies is extremely lacking. Only a few long-term studies have been conducted on agricultural innovation and sus-tainable farming practices such as conservation tillage and crop rota-tion. For instance, the 15-yr research conducted by Li et al. (2007) onthe eastern Loess Plateau showed that the zero tillage and strawmulching improved soil structure, soil fertility, crop yield and water useefficiency. In another study, Wang et al. (2009) suggested it would takeat least seven years before crop yield and soil health effects related toconservation tillage treatments can be detected.
Meanwhile, the profitability associated with conservation tillagewas doubled compared to traditional tillage by the end of the experi-mental period. Liu et al. (2014b) found that the long-term use (> 17 yr)of zero tillage significantly increased the concentration of variousfractions of soil organic carbon and raised the grain yield of winterwheat on the Loess Plateau. A five-yr study conducted by He et al.(2016) showed that the straw mulching has increased soil water contentand evapotranspiration yet would not improve the crop yield. Likewise,in another research on maize-winter wheat-rotation system carried outby Li et al. (2018) found that zero tillage incorporated with strawmulching provided similar grain yield but better economic profitabilitycompared with conventional tillage without straw mulching.
Without question, the future of agriculture in this region depends onmore long-term research work as well as scientific evidence and dataavailability. Advanced analytic tools, such as simulation modeling, arewarranted to provide better understanding of current data and enablegreat predictability of future outcomes on much larger scales. Modelingagronomic and ecophysiological processes in a highly coupled mannercould provide important insights in understanding how different re-sidual management practices and environmental conditions could im-pact crop production (e.g. grain yield and water productivity; Luo et al.,2011; Schipanski et al., 2014; Basche et al., 2016). It can also help toaddress the spatial and temporal variability nature of agronomic databy upscaling simulated results to a much larger regional or decadalscale.
Information abounds with using various existing process-basedmodels in agronomic research, such as Agricultural Production SystemsSimulator (APSIM), STICS crop model, Decision Support System forAgrotechnology Transfer (DSSAT), Erosion Productivity ImpactCalculator (EPIC), etc. (Salmerón et al., 2014, Yeo et al., 2014, Plaza-Bonilla et al., 2015). However, almost all of these existing models re-quire significant effort on parameter calibration and are heavily de-pendent on simple mathematical algorithms such as linear regression,thus, can easily cause model overfitting, poor robustness, and low ac-curacy (Cui et al., 2014a,b, Mirik et al., 2014a,b). In this study, we usedone of the state-of-the-art machine learning algorithms (support vectormachine, SVM; Boser et al., 1992; Cortes and Vapnik, 1995; Cui et al.,2014a,b; Lin et al., 2018; Ramcharan et al., 2018) and implementednovel site-specific models that have provided accurate results, whichcould lead to deeper understanding on the impacts of different en-vironmental conditions and managerial practices on crop productivity.It was noteworthy that the proposed modeling paradigm could be easilyadapted to other studies under different cropping systems or environ-mental conditions.
Although crop rotation, conservation tillage, and straw mulchinghave long been known for their individual agricultural benefits, sy-nergized effects involving all three management regimes coupled withsimulation modeling on a long-term basis is less well-known. In this
study, we researched the influences of different conservation tillage andstraw mulching practices on (1) crop productivity (grain yield andwater productivity), (2) soil health and nutrient status (soil moisture,SOC, TN); (3) economic benefits and fossil fuel use of a multi-sequencelong-term (10 yr) spring maize-winter wheat-soybean rotation systemon the semiarid Loess Plateau. Additionally, we also (4) investigated thepotential of using SVM for constructing site-specific prediction modelsas well as determining the contributions of environmental and man-agerial factors on grain yield and water productivity on a croppingsystem basis.
2. Materials and methods
2.1. Site, experimental design and crop management
This 11-yr experiment was started in 2001 at the Qingyang LoessPlateau Research Station of Lanzhou University (35°39′N, 107°51′E;elevation 1298m) in Northwestern China from 2001 to 2011. Thegrowing season for major crops extends from March to October forabout 255 days with 110 frost-free days on average. Annual precipita-tion is between 480 and 660mm and more than 60% falling from Julyto September (Fig. 1). Average field water-holding capacity is around0.223 cm3 cm−3 and permanent wilting point is 0.07 cm3 cm−3. Thepredominant soil type is sandy loam and the climate is semiarid withvery dry summer and harsh winter conditions which would not favorsoil organic matter accumulation. The primary agronomic productionin the Loess Plateau region of China features small-scale and heavydependency on hand labor input. Farmers typically collect crop residuesafter harvest and either burn them in the field or use them as animalfeed or fuel for winter heating purposes. Very few farmers return cropresidues back to the field as a way to improve crop productivity and soilhealth. Additionally, many farm lands in the Loess Plateau region arefairly small and feature complex topographical challenges (e.g. steepslope) for using large farming equipment. Therefore, human labor-based intensive practices such as hand planting, harvesting, as well ashand weeding in conjunction with very little dosing of herbicide arecommon.
Before this study was implemented in 2001, the same field was usedfor an intensively-tilled continuous maize monoculture system for manyyears followed by a three-year-no-cover fallow period used for preservesoil moisture. This experiment was set up as a randomized completeblock with split-plot treatment design replicated four times. Treatmentsalso had a factorial structure arrangement, thus, the study included twosequences (whole-plot factor)× four blocks× two tillage practices(split-plot factor)× two straw mulching practices (split-plotfactor)= 32 plots. The entire experiment was conducted within a bulkfield with each plot measured as 52m2 (4× 13m) in area. A detailedlayout of the entire field was presented in Fig. S1. Treatments wereimposed on two existing maize-wheat-soybean rotation cropping sys-tems based on different tillage and straw management practices, in-cluding conventional tillage (T), conventional tillage followed by strawmulching (TS), no tillage (NT), and no tillage followed by strawmulching (NTS). Crop rotations started after a spring maize (sequence1) and summer soybean (sequence 2) production in 2001 and was de-signed as a two-yr spring maize-winter wheat-summer soybean cycle(Table 1). Each cycle spans two years and was repeated five times (fivephases in each sequence) for a total of ten years (Table 1).
In our study, three crops were planted by manual no-tillage machinewhich was a specially planters/drills for small-plot seeding designed byChina Agricultural University. All plots were sampled and harvested byhand in accordance with common farming practices adopted by localfarmers. All plots were managed alike except for assigned treatments.For both T and TS treatment plots, a 30-cm-depth chisel plow was usedbefore each planting followed by manual smoothening using hand tools(e.g. shovels, hoes, and rakes). Soils under the NT and NTS treatmentplots were kept undisturbed during the entire experimental period.
Z. Li et al. Field Crops Research 222 (2018) 164–179
165

Within each crop rotation cycle, maize (‘Zhongdan NO. 2’) was sown inearly April at a seeding rate of 30 kg ha−1 (Pure Live Seed, PLS) withmanual broadcast of starter fertilizer application (diammonium phos-phate, 18-46-0) at a rate of 300 kg ha−1.Urea N fertilizer (46-0-0) wasapplied at a rate of 300 kg ha−1 when the majority of maize plantsreached V6 (Feekes 1; Miller, 1999) development stage. Winter wheat(‘Xifeng NO.24’) was planted in late September immediately after maizeharvest. The seeding rate was 187 kg ha−1 PLS with a row spacing of0.15m. Starter fertilizer (diammonium phosphate,-0) was applied at arate of 300 kg ha−1 below the seed using a fertilizer coulter attached tothe drill. Urea fertilizer was hand-broadcasted to the soil surface at arate of 150 kg ha−1 at the green-up stage (Feekes 4–5). ‘FengshouNO.12’ soybean was planted manually immediately after winter wheatharvest (late June or early July) at a rate of 15 kg ha−1 PLS. Starterfertilizer (Calcium superphosphate, 0-26-0) was banded at a rate of63 kg ha−1 during planting. All soybean plants were harvested by late
October. The residual stalks of all three crops were either completelyremoved (T and NT) by hand-clipping at a 5-cm cutting height or leftuntouched in the field (TS and NTS). Hand-weeding and herbicide ap-plication were performed periodically across all plots throughout dif-ferent growing seasons and a one-time application of 3 kg ha−1 ofTriadimefon was used in 2003 for both rotation sequences for a suddeninsect outbreak.
2.2. Data collection
2.2.1. Meteorological measurement and crop data collectionMeteorological data were recorded continuously using an on-site
weather monitoring system consisting of an HMP-50 Probe, a CNR-I netradiometer, a TE525MM rain gauge and a CR5000 data-logger. Cropgrain yield, straw production and above-ground biomass were mea-sured by randomly sampling three quadrats from the center zones
Fig. 1. Monthly net radiation, precipitation, maximum and minimum temperature from 2001 to 2011 at the Loess Plateau Research Station of Lanzhou University,Gansu, China.
Table 1Crop sequences and rotation cycles from 2001 to 2011 at the Qingyang Loess Plateau Research Station of Lanzhou University, Xifeng, Gansu, China.
Phase 1 Phase 2 Phase 3 Phase 4 Phase 5
Maize Wheat Soybean Maize Wheat Soybean Maize Wheat Soybean Maize Wheat Soybean Maize Wheat Soybean
Sequence 1 2001 2001–2002 2002 2003 2003–2004 2004 2005 2005–2006 2006 2007 2007–2008 2008 2009 2009–2010 2010Sequence 2 2002 2002–2003 2003 2004 2004–2005 2005 2006 2006–2007 2007 2008 2008–2009 2009 2010 2010–2011 2011
Z. Li et al. Field Crops Research 222 (2018) 164–179
166
within each treatment-block replicate. Quadrat sizes were measured as0.76, 0.3 and 0.25m2 for maize, wheat, and soybean plots respectively.All samples were reaped, threshed, and winnowed manually. Freshgrain weight of each crop was recorded immediately following har-vesting and then dried in an oven at a temperature of 40 °C to a constantweight to calculate grain yield. Residual straws following threshingwere all collected dried at 40 °C to a constant weight and recorded forcalculating straw production. The sum of grain and straw yields fromeach plot was used for calculating total above-ground biomass.
2.2.2. Soil moisture level and crop WPSoil moisture was measured in nine continuous layers (0–10, 10–20,
20–30, 30–60, 60–90, 90–120, 120–150, and 150–200 cm) using aneutron probe (NMM, Campbell pacific, HP503) for every 2 weeks.Seasonal evapotranspiration (ET, measured in mm) was computedusing the field water balance Eq. (1):
ET= P−△ SWS (1)
where P represents precipitation (mm) and △SWS represents thechange of soil water within certain soil profiles (mm). This simplifiedfield water balance equation omitted several hydrophysical componentssuch as irrigation input, upward water flow, surface runoff, anddownward drainage. The reason for this simplification is four-folds.First, on the Loess Plateau, the underground water table typically re-mains at a minimum depth of 50m below the soil surface, thus, theupward flow is usually ignored. Second, due to the extremely limitedprecipitation and flat topography, runoff water is also omitted fromhydrological processes at the experimental site (Li et al., 2018). Third,no heavy rain or water logging events were observed during theduration of the experiment, therefore, drainage was assumed to be in-significant (Shen et al., 2009). Finally, due to the fact that the entirestudy was set up based on a dryland rainfed system, therefore, no ir-rigation water was included. Combining both grain yield and computedET for each crop, water-use efficiency was calculated as (Hussain andAl-Jaloud, 1995):
WP=Y/ET (2)
where Y denotes crop grain yield (kg ha−1). In this study, estimates ofWP were all converted to kg m−3 (which can be converted to kgha−1 mm−1 by multiplying by 10).
2.2.3. Soil sampling, soil organic carbon and total nitrogen measurementsSoil samples were manually collected using a soil sampling auger
from two sampling depth ranges (0–5 and 5–10 cm) during the har-vesting season of each crop. Therefore, three sets of soil samples werecollected within each circle, two from wheat and soybean harvestingseasons and one from maize. During each round of sampling, threelocations were randomly selected from the central zones within eachplot, leading to a total of six individual soil samples per plot (3 loca-tions× 2 depths). Then, all three samples from the same horizon (0–5or 5–10 cm) were combined into one sample and mixed evenly forfollowing chemical analysis. All soil samples were transported to thelaboratory and immediately dried at 36 °C for 48 h and passed througha 2-mm sieve to remove large plant debris, rocks, and other foreignmaterials. SOC concentration was measured using the external heatingpotassium dichromate oxidation method (K2Cr2O7-H2SO4; Page et al.,1982). Specifically, each weighted soil sample (0.25 g) was placed in atest tube. Then, potassium dichromate (5ml of 0.167M) and con-centrated sulfuric acid (5ml) were added and heated for five minutes inan oil bath under 180 °C. After the reaction, the excess potassium di-chromate was titrated with ferric sulfate (1.0M) and the total po-tassium dichromate used was calculated to estimate the carbon dioxideemission, which is used for estimating SOC concentration. Soil total Nwas measured based on Kjeldahl method (Parkinson and Allen, 1975)by a nitrogen/protein determinator (KDN-102C, Shanghai Qianjian
Instrument Co., LTD).
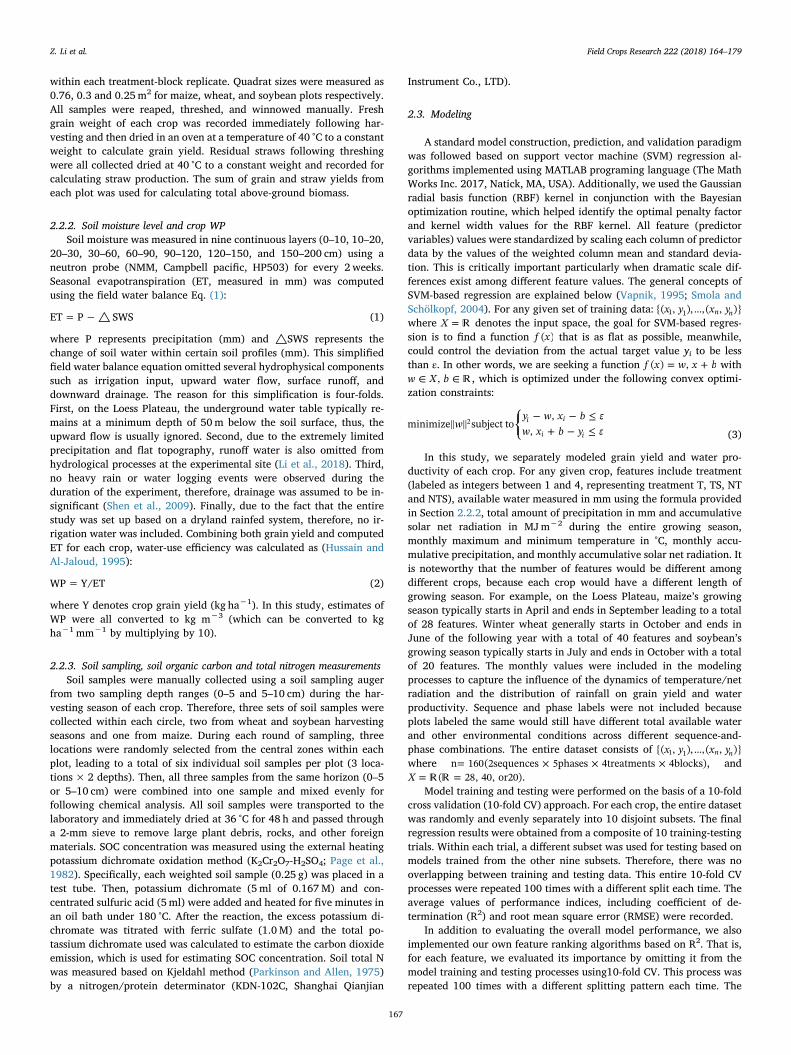
2.3. Modeling
A standard model construction, prediction, and validation paradigmwas followed based on support vector machine (SVM) regression al-gorithms implemented using MATLAB programing language (The MathWorks Inc. 2017, Natick, MA, USA). Additionally, we used the Gaussianradial basis function (RBF) kernel in conjunction with the Bayesianoptimization routine, which helped identify the optimal penalty factorand kernel width values for the RBF kernel. All feature (predictorvariables) values were standardized by scaling each column of predictordata by the values of the weighted column mean and standard devia-tion. This is critically important particularly when dramatic scale dif-ferences exist among different feature values. The general concepts ofSVM-based regression are explained below (Vapnik, 1995; Smola andSchölkopf, 2004). For any given set of training data: …x y x y{( , ), , ( , )}n n1 1where =X � denotes the input space, the goal for SVM-based regres-sion is to find a function f x( ) that is as flat as possible, meanwhile,could control the deviation from the actual target value yi to be lessthan ε. In other words, we are seeking a function = +f x w x b( ) , with
∈ ∈w X b, � , which is optimized under the following convex optimi-zation constraints:
⎧⎨⎩
− − ≤+ − ≤
wy w x b εw x b y ε
minimize subject to,
,i i
i i
2
(3)
In this study, we separately modeled grain yield and water pro-ductivity of each crop. For any given crop, features include treatment(labeled as integers between 1 and 4, representing treatment T, TS, NTand NTS), available water measured in mm using the formula providedin Section 2.2.2, total amount of precipitation in mm and accumulativesolar net radiation in MJm−2 during the entire growing season,monthly maximum and minimum temperature in °C, monthly accu-mulative precipitation, and monthly accumulative solar net radiation. Itis noteworthy that the number of features would be different amongdifferent crops, because each crop would have a different length ofgrowing season. For example, on the Loess Plateau, maize’s growingseason typically starts in April and ends in September leading to a totalof 28 features. Winter wheat generally starts in October and ends inJune of the following year with a total of 40 features and soybean’sgrowing season typically starts in July and ends in October with a totalof 20 features. The monthly values were included in the modelingprocesses to capture the influence of the dynamics of temperature/netradiation and the distribution of rainfall on grain yield and waterproductivity. Sequence and phase labels were not included becauseplots labeled the same would still have different total available waterand other environmental conditions across different sequence-and-phase combinations. The entire dataset consists of …x y x y{( , ), , ( , )}n n1 1where = × × ×n 160(2sequences 5phases 4treatments 4blocks), and
= =X ( 28, 40, or20)� � .Model training and testing were performed on the basis of a 10-fold
cross validation (10-fold CV) approach. For each crop, the entire datasetwas randomly and evenly separately into 10 disjoint subsets. The finalregression results were obtained from a composite of 10 training-testingtrials. Within each trial, a different subset was used for testing based onmodels trained from the other nine subsets. Therefore, there was nooverlapping between training and testing data. This entire 10-fold CVprocesses were repeated 100 times with a different split each time. Theaverage values of performance indices, including coefficient of de-termination (R2) and root mean square error (RMSE) were recorded.
In addition to evaluating the overall model performance, we alsoimplemented our own feature ranking algorithms based on R2. That is,for each feature, we evaluated its importance by omitting it from themodel training and testing processes using10-fold CV. This process wasrepeated 100 times with a different splitting pattern each time. The
Z. Li et al. Field Crops Research 222 (2018) 164–179
167

average R2 value for each feature was stored in a ranking list, whichwas later used to rank the importance of all features. Therefore, themost important/informative feature should be the one providing theleast R2 value.
2.4. Energy
The total energy expenditure of the entire project mainly consists ofthree parts: diesel fuels used by equipment for tillage and planting;inputs for regular farming operation, including seeds, fertilizers andherbicides; human labor inputs for fertilization, herbicide application,processing of plant residual materials such as straw harvesting, shred-ding, s and applying. In order to accurately quantify and compare theenergy input value across different categories, energy equivalents wereused (Table 2). Energy equivalent value of each category were calcu-lated by multiplying the quantity of each input by its correspondingenergy conversion factor. Particularly, the energy equivalent value ofartificial labor input was calculated by multiplying its energy coeffi-cient by the number of man-hours for completing a particular job.Detailed information of those energy equivalent coefficient can befound in research work conducted by Clements et al. (1995) as well as
Lu and Lu (2017). Likewise, the energy output was calculated based oncrop grain yield and straw production as well as their correspondingconversion coefficients. Particularly, coefficients for calculating energyoutput associated with grain yield were 14.7, 14.48, and 14.7MJ kg−1
for maize, winter wheat, and soybean, respectively. Meanwhile, coef-ficients for converting straw production into energy output were 12.7,9.25, and 18MJ kg−1, respectively. These conversion factors could befound in similar cropping system studies conducted by Tabatabaeefaret al. (2009), Mandal et al. (2009) and Lu and Lu (2017).
2.5. Economic analysis
Economic analysis of the current study was based on budgetaryrecords which considered values of production inputs and outputs as-sociated with each crop on a system level. For large equipment-basedfarming operation, we used the farming machine services (e.g. plantingand tillage) provided by the regional Farmers’ Cooperative andExtension Service agencies in Shi She township. The hourly servicecharge included costs of human labor/operation, fossil fuel consump-tion, capital recovery of equipment (depreciation and interest), in-surance, and costs associated with storing, repairing, and maintaining
Table 2Inputs for crop production (actual values) and energy coefficients of a maize-winter wheat-soybean rotation system during 2001–2011 at Xifeng, Gansu, China.
Crop Item Particular Unit T TS NT NTS Energy equivalent(MJ Unit−1)
Maize Diesel fuel Tillage L ha−1 120 120 56.31Planting L ha−1 12 12 12 12 56.31
Seeds kg ha−1 30 30 30 30 15.7Fertilizer P2O5 kg ha−1 138 138 138 138 13.07
N kg ha−1 192 192 192 192 75.46Herbicide 2–4-D butylate kg ha−1 1.08 1.08 1.08 1.08 84.91Labor hour h ha−1 180 217 180 217 1.95
Wheat Diesel fuel Tillage L ha−1 60 60 56.31Planting L ha−1 9 9 9 9 56.31
Seeds kg ha−1 187 187 187 187 20.1Fertilizer P2O5 kg ha−1 138 138 138 138 13.07
N kg ha−1 123 123 123 123 75.46Herbicide 2–4-D butylate kg ha−1 0.324 0.324 0.324 0.324 84.91Labor hour h ha−1 138 168 138 168 1.95
Soybean Diesel fuel Tillage L ha−1 60 60 56.31Planting L ha−1 7.5 7.5 7.5 7.5 56.31
Seeds kg ha−1 15 15 15 15 14.7Fertilizer P2O5 kg ha−1 8.82 8.82 8.82 8.82 12.44Herbicide Paraquat kg ha−1 0.6 0.6 0.6 0.6 460Labor hour h ha−1 69 77 69 77 1.95
Treatment includes: T= conventional tillage; TS= conventional tillage followed by straw mulching; NT=no tillage; NTS=no tillage followed by straw mulching.
Table 3A 11-year average cost (RMB Yuan kg−1) breakdown of a maize-winter wheat-soybean rotation system under different tillage treatments during 2001–2011 atXifeng, Gansu, China.
Crop Treatment Tillage Seeds Planting Fertilizers Fertilizer spreading Herbicides Spray herbicides Straw smash Straw mulching Harvest Total
Maize T 1242 1203 366 1457 53 336 53 525 5235TS 1242 1203 366 1457 53 336 53 83 40 525 5358NT 1203 366 1457 53 336 53 525 3993NTS 1203 366 1457 53 336 53 83 40 525 4116
Wheat T 621 345 233 918 36 98 26 408 2685TS 621 345 233 918 36 98 26 63 32 408 2780NT 345 233 918 36 98 26 408 2064NTS 345 233 918 36 98 26 63 32 408 2159
Soybean T 651 741 240 788 6 167 29 228 2850TS 651 741 240 788 6 167 29 19 12 228 2881NT 741 240 788 6 167 29 228 2199NTS 741 240 788 6 167 29 19 12 228 2230
Treatment includes: T= conventional tillage; TS= conventional tillage followed by straw mulching; NT=no tillage; NTS=no tillage followed by straw mulching.
Z. Li et al. Field Crops Research 222 (2018) 164–179
168

Table4
Rep
eatedmeasuresANOVA
resultsforwho
le-plottreatm
ents
(seq
uenc
es,SE
),split-plottreatm
ents
(TR),repe
ated
factor
(pha
se,PH
)maineff
ects,a
ndtheirinteractions
ongrainyield,
straw
yield,
totalab
oveg
roun
dbiom
assprod
uction
andWPof
maize,w
heat
andsoyb
eanat
Xifen
g,Gan
su,C
hina
.
Yield
Straw
Maize
Whe
atSo
ybean
Maize
Whe
at
Effect
Num
DF
FPva
lue
FPva
lue
FPva
lue
FPva
lue
FPva
lue
SE1
25.27
0.00
320
.42
0.00
2833
.52
0.00
0675
.43
0.00
0137
.65
0.00
31TR
37.32
0.00
154.45
0.02
213
.46
0.00
021.36
0.29
093.2
0.06
83SE
*TR
30.89
0.46
40.96
0.43
821.96
0.16
430.55
0.65
381
0.43
13PH
442
.67
<0.00
0156
.98
<0.00
0125
.99
<0.00
0110
0.57
<0.00
0139
.66
<0.00
01SE
*PH
411
7.4
<0.00
0116
0.35
<0.00
0113
.17
<0.00
0112
2.1
<0.00
0159
.36
<0.00
01PH
*TR
121.32
0.25
882.08
0.06
393.35
0.00
591.02
0.46
231.83
0.11
28SE
*PH*T
R12
1.31
0.26
381.76
0.11
721.42
0.22
551.29
0.28
492.21
0.05
77
Straw
Abo
vegrou
ndbiom
ass
Water
prod
uctivity
Soyb
ean
Maize
Whe
atSo
ybean
Maize
Whe
at
Effect
FPva
lue
FPva
lue
FPva
lue
FPva
lue
FPva
lue
FPva
lue
SE54
.11
<0.00
0110
.04
0.02
125
.38
0.00
1531
.3<
0.00
0129
.18
<0.00
0110
7.18
0.00
11TR
6.13
0.00
35.16
0.00
834.28
0.03
2111
.23
0.00
014.82
0.00
969.64
0.00
02SE
*TR
1.35
0.28
070.55
0.65
311.06
0.40
571.13
0.35
840.49
0.69
461.95
0.14
46PH
8.98
<0.00
0185
.29
<0.00
0152
.4<
0.00
0134
.74
<0.00
0151
.79
<0.00
0130
.75
<0.00
01SE
*PH
37.29
<0.00
0119
1.42
<0.00
0111
0.3
<0.00
0115
.24
<0.00
0150
.44
<0.00
0129
1.5
<0.00
01PH
*TR
2.7
0.01
171.64
0.13
422.01
0.08
323.39
0.00
311.53
0.16
451.79
0.09
07SE
*PH*T
R2.02
0.05
491.25
0.29
742.39
0.04
211.55
0.16
010.63
0.80
013.02
0.00
57
Yield
Straw
Water
prod
uctivity
Maize
Whe
atSo
ybean
Maize
Soyb
ean
Effect
Num
DF
Pva
lue
Pva
lue
Pva
lue
Pva
lue
FPva
lue
SE1
0.00
30.00
280.00
060.00
0150
.79
0.00
1TR
30.00
150.02
20.00
020.29
0915
.36
<0.00
01SE
*TR
30.46
40.43
820.16
430.65
384.36
0.01
29PH
4<
0.00
01<
0.00
01<
0.00
01<
0.00
0152
.41
<0.00
01SE
*PH
4<
0.00
01<
0.00
01<
0.00
01<
0.00
0120
.68
<0.00
01PH
*TR
120.25
880.06
390.00
590.46
233.95
0.00
08SE
*PH*T
R12
0.26
380.11
720.22
550.28
491.08
0.40
81
Z. Li et al. Field Crops Research 222 (2018) 164–179
169

of each equipment. The costs of materials (seeds, fertilizers, herbicides,and straw residues) were calculated based on the actual purchasingrecords from local farming supply companies or regional farmers’Cooperative and Extension Service agencies. labor costs for conductingstandard field operation (e.g. fertilization, herbicides application, re-sidual spreading, harvesting, etc.) were calculated based on the currentmarket hourly wage each year and number of hours required to com-plete the tasks (Table 3). Output values per unit land was calculatedbased on observed grain yield (kg ha−1) within each cycle and theharvest-month market price of each crop obtained from China’s Na-tional Agricultural Market Service Database (Table 7, http://datacenter.cngrain.com).
2.6. Statistical analysis
Crop yield, water productivity and soil data were analyzed using theMIXED procedure of SAS (SAS V9.3; SAS Institute, Cary, NC). The entirecrop and soil data were analyzed as a randomized complete block de-sign with split-plot treatment and factorial arrangement. All whole-plotfactors (cropping sequence) and sub-plot factors (tillage× strawmulching) were considered fixed effects. Block was considered randomeffects. Phase (repetition of each 2-yr cycle) was considered as repeatedmeasure and the first-order autoregressive covariance matrix was se-lected for controlling autocorrelation of observation over time. Meanseparation was performed using the PDMIX800 macro, which labelseach least-square mean using letter grouping based on pair-wise
differences created by PDIFF option of the LSMEANS statement (Saxton,1998). Additionally, when two-way or three-way interactions that in-volve treatments were detected, treatment effects were further analyzedwithin each level of the interactive factor using the BY statement inSAS. Statistical significance was evaluated at P=0.05 level unlessspecified otherwise.
3. Result
3.1. Gain yield, straw, aboveground biomass and WP
Five cycles of crop rotation (phases) had been completed across twosequences from 2010 to 2011. Sequence, phases, and sequence-phaseinteraction had significant influence on the grain yield, straw yield,aboveground biomass and WP regardless of crops (Table 4, P < 0.05).Split-plot treatments had significant effects on grain yield, abovegroundbiomass and WP of all three crops as well as straw yield of soybean.Grain yield, straw production, and WP for both maize and winter wheatindicated no significant two-way interactions (sequence× treatment,phase× treatment). Therefore, data were averaged across differentsequences and phases for simplicity purposes (Figs. 2 and 3).
For soybean, grain yield, straw production, and WP indicated sig-nificant interactions between phase and treatment, thus, were pre-sented by phase. The average yield of maize under TS treatment was9.1 Mg ha−1, which was significantly greater than either NT or NTStreatments (P < 0.05; Fig. 2a). Straw yield of maize under different
Fig. 2. Grain yield, straw yield, total aboveground biomass of maize (a) and wheat (b), water productivity of maize (c) and winter wheat (d) under different tillageand straw mulching treatments (T= conventional tillage; TS= conventional tillage followed by straw mulching; NT=no tillage; NTS= no tillage followed by strawmulching) averaged across different sequences and phases (completion of each rotation cycle) during 2001–2011 at Xifeng, Gansu, China. Letters separate meansbased on P < 0.05 level by pair-wise comparison.
Z. Li et al. Field Crops Research 222 (2018) 164–179
170

treatments had no significant difference (P=0.29). The averageaboveground biomass of maize under TS treatment was 18.2 Mg ha−1,which was 10% significantly greater than NT (P < 0.05). Likewise, theWP of maize under TS treatment was 2.14 kgm−3, which was 12%greater than NT (P < 0.05; Fig. 2c). The grain yields of winter wheatunder TS (3.2Mg ha−1) and T (3.2Mg ha−1) and NTS (3.0Mg ha−1)treatments were similar (Fig. 2b), and both T and TS treatments hadsignificantly yield greater than NT (P < 0.05). Both TS and NTStreatments produced greater straw yield than NT (P < 0.05). Theaverage aboveground biomass of wheat after TS treatment was7.7 Mg ha−1, which was 13% greater than NT (P < 0.05; Fig. 2b). TheWP of wheat was similar between TS and T treatments as well as be-tween NT and NTS treatments (Fig. 2d). The average WP of TS and Twas greater than that of NT and NTS (P < 0.05).
Soybean yield was affected by different treatments from phase 1 tophase 5 (P < 0.05; Fig. 3a). In general, NTS treatment had resulted insimilar soybean yield compared with TS (phase 1 and 3–5) and typically
greater yield than NT (phase 2–5, P < 0.05). Additionally, NTS treat-ment also resulted in greater yield than T during phase 2 and 3(P < 0.05), but comparable yield during phase 4 and 5 over time. In-terestingly, soybean straw yield and aboveground biomass productionclosely mirrored each other (Fig. 3b, c). During phase 1, NT treatmentprovided the lowest straw and overall aboveground biomass productionthan T、TS and NTS (P < 0.05). During phase 2, TS treatment hadgreater straw yield and aboveground biomass production than all othertreatments (P < 0.05). Additionally, NTS resulted in greater above-ground biomass than NT and T (P < 0.05). During phase 3, NTStreatment had resulted greater straw production and abovegroundbiomass than either NT or T (P < 0.05). Additionally, TS treatmenthad greater above-ground biomass production than NT (P < 0.05).During phase 4, both T and TS treatments increased greater straw andaboveground biomass than NT (P < 0.05). No statistical significanceswere detected during phase 5 for either straw yield or abovegroundbiomass production. During phase 1, The WP of soybean under TS and T
Fig. 3. Grain yield (a), straw yield (b), aboveground biomass (c) and water productivity (d) of soybean under different tillage and straw mulching treatments(T= conventional tillage; TS= conventional tillage followed by straw mulching; NT=no tillage; NTS= no tillage followed by straw mulching) averaged acrossdifferent sequences during 2001–2011 at Xifeng, Gansu, China. Letters separate means based on P < 0.05 level by pair-wise comparison.
Z. Li et al. Field Crops Research 222 (2018) 164–179
171

were significantly greater than NT (P < 0.05). Soybean WP providedsimilar results compared to grain yield in phase 1, 2 and 4 (Fig. 3d).Interestingly, NTS treatment resulted in greater WP than T during phase3 (P < 0.05) and TS produced greater WP than either T or NT duringphase 5 (P < 0.05).
3.2. Soil organic carbon
For SOC, sequences appeared to have little effect on its concentra-tion in both 0–5-cm and 5–10-cm layers regardless of crops except forthe 5–10-cm layer of soybean (P=0.043; Table 5), which is primarilycaused by the differences in the magnitude of responses only. There-fore, all SOC data were averaged over sequences. On the other hand,phase indicated very strong impacts on SOC over the years (P < 0.05;all phase effects were significant and the majority of the phase-treat-ment interactions were significant), which makes perfect sense, becausethe slow response of SOC to different cropping management practicescould take many years before they become detectable (Cui et al.,2014c). Thus, data were presented by phase (Fig. 4). In general, theadvantageous effects of adopting NTS increased over time and the moresignificant effects were typically observed in the 0–5-cm soil layercompared with the 5–10-cm soil layer.
For the 0–5-cm soil layer under maize fields, NTS treatment resultedin greater SOC than T during phase 2, and than all other treatmentsduring phase 3 (P < 0.05; Fig. 4a). During phase 4, both NTS and TSresulted greater SOC than T (P < 0.05). During phase 5, both NT andNTS treatments indicated greater SOC than T (P < 0.05). For the 5–10-cm soil layer, no effects were detected until phase 4, where TS hadgreater SOC than T (P < 0.05; Fig. 4d). During phase 5, TS had greaterSOC than T and NTT (P < 0.05). For the 0–5-cm soil layer of winterwheat fields, NTS indicated greater SOC than any other treatment andboth TS and NT treatments increased more SOC than T during phase 2,3, and 5 (P < 0.05; Fig. 4b). During phase 4, NTS had greater SOC thanT and TS (P < 0.05). For the 5–10-cm soil layer, only phase 3,4, and5indicated statistical significance caused by treatments (Fig. 4e). Parti-cularly, both TS and NTS indicated greater SOC than T and NTS in-creased more SOC than NT during phase 3 and 5 (P < 0.05). Duringphase 4, NTS had resulted in greater SOC than T (P < 0.05) For the0–5-cm soil layer of soybean fields, NTS increased SOC than T during allphases (P < 0.05; Fig. 4c). Additionally, NTS also indicated greaterSOC than NT during phase 2–5 (P < 0.05). TS also resulted in greaterSOC than T during phase 2, 3, and 5 (P < 0.05). NT indicated greaterSOC than T during phase 3 and 5 (P < 0.05). For the 5–10-cm soillayer, TS treatment increased SOC than T during phase 2 (P < 0.05;
Fig. 4f). T treatment indicated lower SOC than all other treatments inphase 3 (P < 0.05). During phase 5, both NTS and TS resulted ingreater SOC than T and NT (P < 0.05).
3.3. Soil total nitrogen
Similar to SOC, sequence indicated little effect on soil TN as in-dicated by lack of sequence effect across all three crops and two dif-ferent soil depths (Table 5). The only two-way interaction betweentreatment and sequence was detected at the 5–10-cm soil layer underthe soybean field. However, this interaction was again caused by themagnitude of response only. Therefore, all soil TN data were presentedby averaging over sequences (Fig. 5). Additionally, phase indicatedsignificant impact on soil TN and the treatment effect appeared to bedependent on phases within the 0–5-cm soil layer. Thus, all data werepresented by phase, including the 5–10-cm layer data for consistencypurposes. Again, the effect of NTS gradually increased over timestarting from phase 3–5. Interestingly, the effect of TS appeared to beless obvious compared with SOC results presented in the previoussection. Additionally, much less statistical significance was observed inthe 5–10-cm soil layer compared with SOC results.
For the top 0–5-cm soil layer under maize field, NTS indicatedgreater soil TN than any other treatment during phase 3 (P < 0.05;Fig. 5a). During phase 4 and 5, both NTS and NT resulted greater soilTN than either T or TS (P < 0.05). No statistical significance was ob-served in the 5–10-cm soil layer. For wheat field, NTS treatment re-sulted in greater soil TN than T in phase 3 in the 0–5-cm soil layer(P < 0.05; Fig. 5b). During phase 3, NTS resulted in greater soil TNthan any other treatment and NT also increased soil TN than T(P < 0.05). During phase 4 and 5, both NTS and NT resulted in similareffects on increasing soil TN and were both greater than T and TS(P < 0.05). Additionally, NTS had greater soil TN any other treatmentin phase 3 of the 5–10-cm soil layer (P < 0.05; Fig. 5e). For the top0–5-cm soil layer under soybean field, NTS indicated greater soil TNthan either T or TS, and NT had greater soil TN than T during phase 3–5(P < 0.05; Fig. 5c). In the 5–10-cm soil layer, NTS increased greatersoil TN than T and NT during phase 3(P < 0.05; Fig. 5f). Additionally,all non-control treatments increased more soil TN than T in phase 5(P < 0.05).
3.4. Modeling
Our best model yielded an R2 value of 0.83 and an RMSE value of0.43Mg ha−1when predicting wheat yield. Satisfactory results were
Table 5Repeated measures ANOVA results for whole-plot treatments (sequences, SE), split-plot treatments (TR), repeated factor (phase, PH) main effects, and their inter-actions on soil organic carbon and total nitrogen at Xifeng, Gansu, China.
Soil organic carbon Total nitrogen
Maize Wheat Soybean Maize Wheat Soybean
Soil Depth Effect Num DF F Value Pr > F F Value Pr > F F Value Pr > F F Value Pr > F F Value Pr > F F Value Pr > F
0–5 cm SE 1 0.23 0.6537 0.06 0.8167 1.75 0.292 1.43 0.2871 6.03 0.0527 4.97 0.0809TR 3 57.79 < 0.0001 65.99 <0.0001 52.79 < 0.0001 20.06 < 0.0001 28.27 <0.0001 27.71 < 0.0001SE*TR 3 1.54 0.2226 1.26 0.3061 1.35 0.2801 0.34 0.797 1.87 0.1595 1.14 0.3479PH 4 59.27 < 0.0001 37.39 <0.0001 29.43 < 0.0001 45.77 < 0.0001 36.87 <0.0001 35 <0.0001SE*PH 4 4.45 0.0049 9.68 <0.0001 6.7 0.0004 4.41 0.0048 4.46 0.0053 2.6 0.0504PH*TR 12 5.91 < 0.0001 4.17 0.0004 1.78 0.0916 3.84 0.0007 3.93 0.0008 2.85 0.0066SE*PH*TR 12 1.14 0.3591 0.87 0.587 1.2 0.3253 0.79 0.6535 0.63 0.8018 0.83 0.6214
5–10 cm SE 1 0 0.9605 1.74 0.2407 0.26 0.6508 0.1 0.7685 0.37 0.5662 0.51 0.5035TR 3 14.23 < 0.0001 10.53 <0.0001 22.37 < 0.0001 1.05 0.389 2.47 0.0846 5.51 0.004SE*TR 3 1.94 0.148 0.95 0.4325 3.1 0.043 0.95 0.433 1.13 0.3547 4.48 0.0105PH 4 21.52 < 0.0001 20.81 <0.0001 31.77 < 0.0001 22.56 < 0.0001 15.81 <0.0001 48.84 < 0.0001SE*PH 4 4.97 0.0029 6.7 0.0004 6.12 0.0008 1.76 0.1622 1.33 0.2778 5.04 0.0025PH*TR 12 1.57 0.148 2.07 0.0483 1.74 0.0999 0.3 0.9842 1.18 0.3376 0.86 0.5948SE*PH*TR 12 0.47 0.9205 0.43 0.9404 1.44 0.1949 0.54 0.873 0.68 0.7598 1.1 0.3879
Z. Li et al. Field Crops Research 222 (2018) 164–179
172

also obtained for predicting maize yield (R2= 0.76,RMSE=0.97Mg ha−1). Soybean models indicated less accurate re-sults, which yielded an R2 value of 0.56 and an RMSE value of0.21Mg ha−1. Similar results were observed for modeling WP. Wheatmodels yielded the best model performance again with an R2 value of0.84 and an RMSE value of 0.15 kgm−3, followed by maize (R2= 0.71,RMSE=0.24 kgm−3) and soybean (R2= 0.68, RMSE=0.13 kgm−3).It was worth mentioning that a significant performance increase wasobtained in soybean WP compared to its grain yield results. Detailedtwo-dimensional scatter plots associated with each crop and targetingvalues were presented in Fig. 6.
The top-three most and three least informative features for eachcrop were presented in Table 6. Interestingly, within-season tempera-ture dynamics (monthly minimum/maximum temperatures) indicatedstrong influence on predicting both grain yield and WP. Meanwhile,close-to-harvest-season net radiation intensity appeared to be importantfor determining both grain yield and WP of maize and winter wheat. Asexpected, total available water during each growing season providedthe strongest effect on determining WP regardless of crops.
Surprisingly, treatment and total available water appeared to be lessimportant in predicting grain yield for both maize and winter wheat.However, treatment indicated strong effects on predicting yield and WPof soybean.
3.5. Energy and economy
On a system level, energy input values were similar between T andTS treatments as well as between NT and NTS treatments (Table 7).Total energy output values were ranked in the following: TS >NTS > T > NT. For the system-level net energy, TS treatment andNTS treatment was very close to each other, yet T treatment indicatedslightly greater net energy gain than NT treatment. As for differenttypes of crops, the energy input, energy output and net energy of maizeaccounted for more than 51%, 65% and 67% of the overall systemvalues. Within each crop species, treatment practices involving tillage(T and TS) typically resulted in much greater input energy costs com-pared with no-till practices (NT and NTS). Meanwhile, both grain andstraw biomass made significant contribution to the final energy output.
Fig. 4. Soil organic carbon (g kg−1) in (a), (b) and (c) 0–5 cm depth of maize, wheat and soybean; (d), (e) and (f) 5–10 cm depth of maize, wheat and soybean under amaize-winter wheat-soybean rotation system affected by different tillage and straw mulching treatments (T= conventional tillage; TS= conventional tillage fol-lowed by straw mulching; NT=no tillage; NTS= no tillage followed by straw mulching) averaged across different sequences during 2001–2011 at Xifeng, Gansu,China. Letters separate means based on P < 0.05 level by pair-wise comparison.
Z. Li et al. Field Crops Research 222 (2018) 164–179
173

For the economic analysis, detailed results are presented in Table 8.Regardless of crops, TS and NTS treatments typically yielded the
greatest output value (with TS being slightly greater than NTS in mostcases). However, high costs associate with tillage practices of TStreatment caused significantly greater input costs, which con-sequentially caused lower net benefit than NTS treatment. Additionally,maize appeared to be the most profitable crop in the entire rotationalcropping system in our semiarid environmental conditions based oneither net benefit/output-input ratio, followed by wheat and soybean.Last but not the least, NT and NTS treatments tended to provide similaroutput-input ratio despite differences in net benefit values.
4. Disscusion
4.1. Effects of conservation tillage on grain yield and water productivity
The research results indicated that TS treatment provided greater(maize, wheat, phase 2 of soybean) or comparable grain yield (phase 1,
3–5 of soybean) compared to NT treatment. This evidences that thecombination of conventional tillage and straw mulching could increasegrain yield compared with no tillage alone. Additionally, grain yield ofmaize and soybean showed no statistical differences between T and NTtreatment as well as between TS and NTS treatments of winter wheatand soybean, and the average grain yield of maize under NTS treatmentor wheat under NT treatment was slightly lower (10%) than TS or T,respectively. This suggests that no-till practices could lead to compar-able grain yield or a little yield reduction than conventional tillage. Thisresult is consistent with many previous research findings. For example,a meta-analysis study conducted by Pittelkow et al. (2015) indicatedthat the use of no-tillage practices per se in a rotational cropping systemcould lead to a yield reduction of 6.2% on average. Likewise, in anotherdryland study purported in the Mediterranean climate, Seddaiu et al.(2016) compared the grain yield differences between conventional andconservation-till treated plots of a durum wheat-sunflower-corn crop-ping system. The results indicated that no-till fields could lead to anaverage yield reduction of 30% across all three crop species. The
Fig. 5. Soil total nitrogen (g kg−1) in (a), (b) and (c) 0–5 cm depth of maize, wheat and soybean; (d), (e) and (f) 5–10 cm depth of maize, wheat and soybean under amaize-winter wheat-soybean rotation system affected by different tillage and straw mulching treatments (T= conventional tillage; TS= conventional tillage fol-lowed by straw mulching; NT=no tillage; NTS= no tillage followed by straw mulching) averaged across different sequences during 2001–2011 at Xifeng, Gansu,China. Letters separate means based on P < 0.05 level by pair-wise comparison.
Z. Li et al. Field Crops Research 222 (2018) 164–179
174

fundamental mechanisms of how conservation tillage practices mightaffect grain yield have been investigated by numerous studies. For ex-ample, Lal et al. (2004) mentioned that conservation tillage practices,which involve less soil disturbance, might cause poor field drainage,increased soil compaction, and slow soil rewarming in spring, leadingto yield reduction of crops. Again, we observed similar trends on ourstudy but it seems like maize and soybean are less susceptible to thesenegative effects caused by tillage reduction compared to winter wheaton the Loess Plateau of China. It is generally believed that strawmulching practices can reduce the evaporation of water, provide ad-ditional carbon and nitrogen sources through mineralization of organic
matter, increase water infiltration, reduce soil erosion and providesubstrates and diversified microhabitat for soil microbes. The combinedeffects could lead to better soil health and ultimately increase cropproductivity in the long term (Govaerts et al., 2007; Jemai et al., 2013).For example, Sharma et al. (2011) evidenced a 4-year trial of con-tinuous conservation tillage in Jammu of India, and showed that thestraw mulching significantly increased the grain yield of maize andwheat by 47% and 31%, compared with the non-mulching treatments.Similarly, in our study, incorporation of straw mulching practices (TS orNTS) had provided similar (maize and wheat) or even greater (soybean)grain yield than treatments without residue retention (T or NT). We
Fig. 6. Determination coefficients and RMSE for (a) maize yield, (b) wheat yield, (c) soybean yield; (d) maize WP, (e) wheat WP and (f) soybean WP under a maize-winter wheat-soybean rotation system during 2001–2011 at Xifeng, Gansu, China; using Support vector machine (SVM) regression algorithms and ten-fold crossvalidation. The solid diagonal line represents the 1:1 line.
Table 6The top-three most and the three least informative features for predicting grain yield and water productivity of maize, winter wheat, and soybean in an 11-yearrotation cropping system located on the Loess Plateau of China.
Maize Winter Wheat Soybean
Feature Ranking Grain yield Water productivity Grain yield Water productivity Grain yield Water productivity
1 Jun MinTa TAW Apr MaxT TAW Treatment TAW2 Sept Radb Aug Precif May Preci Mar MaxT Sept MaxT Treatment3 Aug MaxTc Apr Rad Mar Rad Oct MinT Oct MaxT Oct MinT…… …… …… …… …… …… ……3rd from the last Jul Rad Sept Preci Dec Rad Totalg Rad Oct MinT Jul Preci2nd from the last TAWd Aug Rad Treatment Feb Min T Aug Preci Total RadLast Treatmente Treatment TAW Treatment TAW Aug MinT
a MinT represents the recorded minimum temperature in a given month.b Rad represents the total accumulative solar radiation in a given month.c MaxT represents the recorded maximum temperature in a given month.d TAW represents the total available water throughout the growing season.e Treatment includes T, TS, NT, and NTS.f Preci represents accumulative precipitation in a given month.g Total represents the entire growing season associated with each crop.
Z. Li et al. Field Crops Research 222 (2018) 164–179
175

believe the advantages of using straw mulching should become moreobvious over time as building soil health is a slow process.
Straw biomass, total aboveground biomass, and WP of three cropsprovided similar results compared to grain yield. This is expected be-cause the sward/canopy of crops is typically positively correlated withits seed productivity (Gardner et al., 1985) and all crops were underdryland production, therefore, greater yield would lead to greater WP.Interestingly, straw biomass of maize and winter wheat is not as re-sponsive as soybean. We attributed this effect to the fact that soybean
variety (‘Fengshou NO.12’) is more of an indeterminate variety, whichwill continuously produce both vegetative and reproductive tissues tillharvest, leading to a more symmetrical response compared to the othertwo crops. Meanwhile, both NTS and NT treatments had resulted ingreater soil moisture storage capacity than T treatment (soil moisturedata were not shown but were measured for calculating WP), but theincreased moisture retention failed to increase the grain yield to asignificant level as indicated on another similar study conducted on theLoess Plateau (He et al., 2016). The effect of NTS on WP was notconsistent across all different crop species compared with T. We believethat, on one hand, retaining straws would improve the nutrient supplycapacity of soil by adding more labile SOC. On the other hand, no til-lage can also cause some potential negative effects to soil structure (e.g.increased compaction, poor infiltration, etc.). Both effects might offseteach other. Furthermore, the interplay between these two factors (til-lage and straw mulching) might very complex, which could involvesophisticated interaction with other factors, such as crop species,varieties, and soil microbial population and activity. Thus, more long-term studies involving high-throughput crop phenotyping and soil mi-crobial analysis are warranted.
4.2. Soil organic carbon affected by tillage and straw mulching
The concentration of SOC is considered as one of the most importantindicators used to evaluate soil quality/health. The change of SOCcontent can not only cause the change of soil fertility and water holdingcapacity, but also affect soil microbial respiration of CO2, thus furtherimpact the global climate changes (Lal, 2004). The SOC input mainlycomes from the animal dung and plant residues (straw and root bio-mass). It is generally believed that straw mulching can effectively in-crease the concentration of SOC, and no tillage can reduce the surfaceexposure of SOM, minimize damage of soil structure, and reduce thedecomposition speed of SOM (Ussiri and Lal, 2009). This is consistentwith the results obtained in this study. For example, the SOC con-centration under TS and NTS treatments in the 0–5 cm soil depth wassignificantly higher than that under T treatment after continuous 10-year conservation tillage. These findings were very similar to anotherlong-term study (47 year) carried out by Somasundaram et al. (2017) ina semiarid environment of Queensland, Australia. In our study, the NTStreatment showed the best effects on SOC among all treatments, whichwas in great agreement with other studies on the Loess Plateau (Li et al.,2007; Liu et al., 2014a; Niu et al., 2016). On a cropping system level,SOC concentration of NTS treatment was 39, 12, and 13% higher thanT, TS and NT treatments, respectively, after five 2-year-phase circula-tions.
We also observed increased effects associated with no tillage andstraw mulching over time and an expected lagging effect on SOC at thedeeper soil profile (5–10 cm) compared with the 0–5-cm layer.Additionally, at the 0–5-cm soil layer, TS typically resulted in similar orlower SOC than NTS, which was also reflected in a study proffered byNiu et al. (2016). However, at the 5–10-cm soil layer, no differenceswere detected between TS and NTS. This suggested that tillage couldhelp incorporate labile SOM into deeper soil layers than no tillage, sothat the microbes at the deeper soil profiles could have access to ad-ditional sources of substrate rapidly. In addition, it’s noted that theoverall SOC concentration increase over time regardless if treatments.For example, SOC concentration under T treatment increased by 8, and11% compared with the beginning of experiment in the 0–5 cm and5–10 cm soil depths, respectively. This might be caused by the fact thatcrop rotation could provide prolonged complimentary effects on soilnutrient status, crop biomass productivity, and soil carbon sequestra-tion potential leading to a gradual increase of SOC over time (Gregorichet al., 2001). Additionally, no-till treatments (NT and NTS) appeared tocause more rapid building of SOC than the other two treatments. Inanother study, Liu et al. (2014a) verified that the SOC concentrationwould reach saturation point after 12 years of straw turnover. This
Table 8Input and output values of a maize-winter wheat-soybean rotation system underdifferent tillage and crop straw mulching treatments during 2001–2011 atXifeng, Gansu, China. AY=10-year yield (maize, wheat, soybean) average(kg ha−1); AP= 10-year price (maize, wheat, soybean) average (RMB Yuankg−1); OV=output value (RMB Yuan ha−1); IV= input value (RMB Yuanha−1); O/I= output/input; NB=net benefit (RMB Yuan ha−1); BFD=benefitdifference (RMB Yuan ha−1).
Crop Treatment AV AP OV IV NBa O/Ib BFDc
Maize T 8583 1.44 12359 5235 7124 2.36 0TS 9055 1.44 13039 5358 7681 2.43 557NT 8010 1.44 11534 3993 7541 2.89 417NTS 8397 1.44 12091 4116 7975 2.94 851
Wheat T 3228 1.61 5181 2685 2496 1.93 0TS 3229 1.61 5182 2780 2402 1.87 −94NT 2898 1.61 4652 2064 2588 2.26 92NTS 3049 1.61 4894 2159 2735 2.27 239
Soybean T 811 3.27 2652 2850 −198 0.93 0TS 1022 3.27 3342 2881 461 1.16 659NT 721 3.27 2358 2199 159 1.07 357NTS 1047 3.27 3422 2230 1192 1.54 1390
Total T 20192 10770 9422 1.87 0TS 21563 11019 10544 1.96 1122NT 18544 8256 10288 2.25 866NTS 20408 8505 11903 2.40 2481
Treatment includes: T= conventional tillage; TS= conventional tillage fol-lowed by straw mulching; NT=no tillage; NTS=no tillage followed by strawmulching.
a NB was calculated as OV− IV.b O/I was calculated as OV/IV ratio.c BFD was calculated as NB difference from the T treatment.
Table 7Input energy, output energy and net energy for crop production of a maize-winter wheat-soybean rotation system as influenced by tillage and strawmulching treatments.
Crop Treatment Input(GJ ha−1)
Output (GJ ha−1) Net energy(GJ ha−1)
Yield Straw Total
maize T 24.64 126.17 110.36 236.53 211.89TS 24.71 133.11 116.10 249.21 224.5NT 17.88 117.75 109.37 227.12 209.24NTS 17.95 123.44 113.51 236.95 219
Wheat T 19.03 46.74 39.53 86.27 67.24TS 19.08 46.76 40.65 87.41 68.33NT 15.65 41.96 36.07 78.03 62.38NTS 15.71 44.15 40.05 84.20 68.49
Soybean T 4.54 11.94 22.86 34.80 30.26TS 4.56 15.04 25.76 40.80 36.24NT 1.16 10.60 20.65 31.24 30.08NTS 1.18 15.39 23.80 39.19 38.01
Rotation T 48.21 184.85 172.75 357.60 309.39TS 48.35 194.90 182.52 377.42 329.07NT 34.69 170.31 166.08 336.39 301.7NTS 34.84 182.98 177.36 360.34 325.5
Treatment includes: T= conventional tillage; TS= conventional tillage fol-lowed by straw mulching; NT=no-till; NTS= no-till followed by strawmulching.
Z. Li et al. Field Crops Research 222 (2018) 164–179
176

might partially explained the flattened even slightly decreased SOC forsoybean from phase 4–5. However, we did not observe similar trends ofSOC for maize and wheat, suggesting that there might exists a species-duration interaction on the saturation SOC concentration. Although,cross-depth comparisons were not conducted in this study, but a generaldecrease in SOC could be found across all treatments from shallower todeeper soil layers. Likewise, Blanco-canqui and Lal (2008) proposed intheir study that protective tillage could improve SOC content in thesurface layer (0–10 cm), but this had little or even negative influence onthe deep soil carbon content. So the further cropping system studies onSOC accumulation at deeper soil profiles in a long-term setting are ofparamount importance.
4.3. The influence of conservation tillage on total nitrogen
It is generally believed that conversation tillage can increase the TNconcentration of surface soil. However, people have different opinionson whether the TN concentration increases with the duration of croprotation or not. For 28 consecutive years, Mazzoncini et al. (2016)showed that SOM and TN concentration under no tillage increased withthe duration of crop production. However, Dalal et al. (2011) indicatedthat soil TN concentration didn’t necessarily increase with longerduration of no tillage practices. In this study, the TN concentration ofthe top 0–5 cm soil layer indicated no statistical differences until the 5thyear of the trial. Many studies have shown that, compared with con-ventional tillage, the no-till and straw mulching practices can maintainand even improve the soil TN in cropping systems in semi-arid regions(Aziz et al., 2013; Mazzoncini et al., 2016). We observed that consistentand TN concentration increases associated with no-till and straw-mulching treatments over the years. Additionally, many studies alsofound that the TN concentration in the shallower soil layers increasesmore than that in the deeper soil layers, which is consistent with theresults obtained in this study (Li et al., 2007; Tabaglio et al., 2009;Melero et al., 2011).
In general, the mechanism driving soil TN increase by no-till orstraw mulching practices could be explained by the increased organicmatter return and improved microbial activity associated with nitrogenfixation. Thus, first, the straw mulching and less soil disturbance wouldtypically result in more labile organic matter being incorporated intothe overall SOM pool (Melero et al., 2011). Second, well-maintainedsoil structure, diversified soil micro-habitats, and improved substrateinputs under NTS treatments could provide excellent environment forfree-living N2-fixing bacteria and healthy microbial community thatcould benefit the plant-microbe symbiosis leading to improving sym-biotic N2 fixation as well (Kladivko, 2001). In the current study, the TNconcentration under NT treatment was usually similar to or sig-nificantly greater than that of T treatment, while the TS treatmentconsistently indicated similar soil TN concentration to T, indicating thatthe effect of no tillage on TN accumulation was greater than strawmulching. Again, the change in TN concentration could be primarilycaused by biological processes that could result in net nitrogen gain onthe system level such as N2 fixation. On the other hand, straw mulchingcould result in complex changes in the nitrogen cycle and the effect onTN concentration depends greatly on the nature of residual materials(e.g. C:N ratio, decomposition rate, etc.) (Frye et al., 1993).
There is also an interesting phenomenon that TN concentration in-creased more rapidly (19%–76%, 18%–38%) than that of SOC(8%–47%, 11%–45) in the 0–5 cm and 5–10 cm soil layer during thestudy, respectively. That’s because the N2 fixation associated withsoybean production significantly increased N inputs on a system leveland the decomposed leguminous plant materials would ultimately in-crease TN concentration in the soil (Torbert et al., 1996). Last but notthe least, compared with SOC, the treatment effects on TN within the5–10-cm layer were typically insignificant, indicating that the effect ofconservation tillage or straw mulching on TN concentration would notpropagate as deep as that of SOC within soils.
4.4. Modeling
Modeling crop yield and WP using non-parametric kernel-basedalgorithms such as SVM could unveil important features governing cropproduction and help construct high-accuracy models that could easilyoutperform traditional approaches. Unlike other research domains (e.g.genetics, engineering, etc.), where feature numbers could be extremelylarge and typically require sophisticated feature-selection algorithms toboost the performance. In this study, the most sophisticated modelsinvolved only 40 features. Therefore, we anticipated that the low fea-ture number and limited amount of training data might affect theperformance of models. The low values of performance indices fromsoybean might be caused by low number of features. Meanwhile, thesoybean variety ‘Fengshou NO.12’ is an early-mature spring-plantingvariety widely used on the Loess Plateau region, which is typicallyplanted in May and harvested in September. In our study, however,soybean planting was usually delayed (Mid-July) in order to accom-modate the harvesting season of winter wheat (Late-June). The shor-tened growing season of soybean could affect the accumulated heatunits (degrees days), accumulated solar net radiation, grain yield, andWP. Thus, we attributed the low accuracy of soybean models to bothlow feature number and low productivity. The winter wheat varietyused in this study, ‘Xifeng NO.24’ is a popular long-growing seasonvariety widely grown in this region, which has resulted more featuresused for the model building processes. Its well-documented water useefficiency and great adaptation to the local environment (Li et al.,2018) has generated reliable yield in this study. Therefore, greatermodeling performance was observed across both grain yield and WP.Interestingly, maize is the only crop that indicated greater accuracy inmodeling grain yield (R2=0.76) than WP (R2=0.71). Both winterwheat and soybean had either similar or better modeling accuracy inWP than grain yield. This could be caused by the different photo-synthetic pathways undergone by maize (C4) and the other two crops(C3), which makes maize slightly better adapted to surviving the hotand dry semiarid climatic conditions of the Loess Plateau region.Meanwhile, this inherent adaptability and resilience of maize todrought and heat stress makes it difficult to precisely model its pro-duction responses to water availability such as the WP.
Feature ranking results indicated that treatment typically had theleast influence on grain yield and WP of both maize and winter wheat.This finding showed that although different tillage and straw retentiontreatments had produced significant statistical differences among ex-perimental units, the primary drivers controlling yield and productivityare always the fundamental ecophysiological factors (e.g. solar net ra-diation and temperature-related heat unit accumulation) observedduring the growing season. For maize grain yield, early and mid-growing season temperature ranges appeared to be crucial for pre-dicting yield. This makes perfect sense, because these early-seasonmaize plants (Feekes 1) are the most susceptible towards heat/coldstress. The end-of-season solar net radiation is also very important forthe kernel hardening processes as indicated in the feature ranking re-sults. For winter wheat, the regreening-season (Feekes 4–5) solar netradiation, booting-stage (Feekes 10) maximum temperature and an-thesis-stage (Feekes 10.51) precipitation appeared to be the most in-formative features controlling yield. Soybean yield was mostly influ-enced by treatments which is consistent with field data reported inSection 3.1. Additionally, end-season maximum temperature indicatedgreat impact on soybean yield because of its importance on pod ma-turity and drying before harvesting. Last but not the least, the majorityof features provided similar R2 values once omitted from the entiremodel (range between 0.5–0.7), indicating that there exist strong in-teractive effects among different features during the model constructionprocesses. Thus, different environmental factors (temperature, net ra-diation, and precipitation) and their dynamics might be co-affecting theyield and WP of different crops in a highly coupled manner. Thiswarrants future modeling effort using high-throughput data in different
Z. Li et al. Field Crops Research 222 (2018) 164–179
177

cropping system studies.
4.5. Energy and economy impact
From an energy perspective, differences among treatments weremainly caused by whether tillage/straw mulching was adopted or not.On average, tillage accounted for 28% of the total input energy for Tand TS treatments in the rotation system, and fertilizer accounted for57%. For no-till treatments (NT and NTS), energy associated with fer-tilizer manufacturing accounted for 79%% of the total input. Therenumbers are similar to the research results obtained by Lu and Lu(2017), which indicated that fertilizer inputs accounted for over 50% ofenergy consumption across all conservation tillage treatments on theLoess Plateau. In this research, the lower input energy and lower yieldunder no-till treatments (NT and NTS) compared with conventional-tillage treatments (T and TS) had resulted in an offset effect on theoverall net energy level, thus, leading to similar net energy valuesacross all treatments. On a numerical scale, NTS treatment had resultedin the greatest net energy gain in both wheat and soybean and verycomparable values to TS under maize production. This finding is similarto what was reported by Lu and Lu (2017) and Tabatabaeefar et al.(2009). Both research groups found that the non-till treatments pro-vided greater net energy than the conventional tillage.
For the entire system level, both T and TS treatments for maize andwheat produced greater economic output values than NT and NTStreatments, and NTS treatments produced greater output values forsoybean production. In terms of net benefit, NTS had provided thegreatest net return re regardless of crops, demonstrating its great per-formance in maintaining the economic return and stability on a crop-ping system level. The results also provided important references andinformation for the extensive application of climate-smart and low-energy farming on a regional scale.
5. Conclusion
Opportunities for designing and evaluating greater cropping sys-tems on the semiarid Loess Plateau of China are abundant. This study isone of a few long-term cropping system studies that has demonstrateddetailed field-level data, including yield, WP, SOC, TN, energy andeconomic benefits in conjunction with simulation modeling based on an11-yr maize-wheat-soybean rotation system on the Loess Plateau regionof China. Overall, conventional tillage combined with straw mulchingappeared to be the most beneficial treatment for maintaining grainyield.
The continuous rotation of no-tillage and straw mulching practiceshad the most obvious beneficial effects on SOC and TN storage.Additionally, tillage with straw mulching treatment provided the mostoutput of total energy, net energy and economic value, however no-tillage with straw mulching had resulted in the greatest net economicbenefit compared with all other treatments. The limited productivity ofthe selected grain soybean variety suggested that a different low ra-diation sensitive variety or another alternative forage legume specieswith shorter growing season might be a better fit. The soil responsesuggested that other conservation tillage practices such as strip tillageor ridge tillage might help better maintaining yield and increasing SOCparticularly at deeper soil profiles more rapidly than no-till practices.The modeling results had indicated great potential for using machinelearning-based approaches in agronomic studies. Finally, more long-term studies involving high-throughput crop phenotyping and soil mi-crobial analysis are warranted for better understanding the underlyingmechanisms governing crop productivity and soil health on a systemlevel.
Acknowledgements
This research was jointly funded by China Forage & Grass Research
System (CARS-34), the 111 project (B12002), the Program forChangjiang Scholars and Innovative Research Team in University(IRT17R50), and Australian Centre for International AgriculturalResearch (LWR/2007/191). Authors are grateful to Ms Jing Yang, MsMingming Wang and Dr Caiyun Luo for their contributions to the fielddata collection.
References
Aziz, I., Mahmood, T., Islam, K.R., 2013. Effect of long term no-till and conventionaltillage practices on soil quality. Soil Tillage Res. 131 (7), 28–35. http://dx.doi.org/10.1016/j.still.2013.03.002.
Basche, A.D., Archontoulis, S.V., Kaspar, T.C., Dan, B.J., Parkin, T.B., Miguez, F.E., 2016.Simulating long-term impacts of cover crops and climate change on crop productionand environmental outcomes in the midwestern United States. Agric. Ecosyst.Environ. 218, 95–106. http://dx.doi.org/10.1016/j.agee.2015.11.011.
Blanco-canqui, H., Lal, R., 2008. No-tillage and soil-profile carbon sequestration: an on-farm assessment. Soil Sci. Soc. Am. J. 72 (3), 693–701. http://dx.doi.org/10.2136/sssaj2007.0233.
Boser, B., Guyon, I., Vapnik, V., 1992. A training algorithm for optimal margin classifier.In: Proceedings of the Fifth Annual Workshop on Computational Learning Theory.Pittsburgh, ACM. pp. 144–152.
Clements, D.R., Weise, S.F., Brown, R., Stonehouse, D.P., Hume, D.J., Swanton, C.J.,1995. Energy analysis of tillage and herbicide inputs in alternative weed managementsystems. Agric. Ecosyst. Environ. 52 (2–-3), 119–128. http://dx.doi.org/10.1016/0167-8809(94)00546-Q.
Cortes, C., Vapnik, V., 1995. Support-vector networks. Mach. Learn. 20 (3), 273–297.Cui, S., Rajan, N., Maas, S.J., Youn, E., 2014a. An automated soil line identification
method using relevance vector machine. Remote Sens. Lett. 5, 175–184. http://dx.doi.org/10.1080/2150704X.2014.890759.
Cui, S., Youn, E., Lee, J., Maas, J.J., 2014b. An improved systematic approach to pre-dicting transcription factor target genes using support vector machine. PLoS One 9(4), e94519. http://dx.doi.org/10.1080/2150704X.2014.890759.
Cui, S., Zilverberg, C.J., Allen, V.G., Brown, C.P., Moore-Kucera, J., Wester, D.B., Mirik,M., Chaudhuri, S., Phillips, N., 2014c. Carbon and nitrogen responses of three oldworld bluestems to nitrogen fertilization or inclusion of a legume. Field Crops Res.164, 45–53. http://dx.doi.org/10.1016/j.fcr.2014.05.011.
Dalal, R.C., Allen, D.E., Wang, W.J., Reeves, S., Gibson, I., 2011. Organic carbon and totalnitrogen stocks in a vertisol following 40 years of no-tillage, crop residue retentionand nitrogen fertilisation. Soil Tillage Res. 112 (2), 133–139. http://dx.doi.org/10.1016/j.still.2010.12.006.
Ernst, O.R., Kemanian, A.R., Mazzilli, S.R., Cadenazzi, M., Dogliotti, S., 2016. Depressedattainable wheat yields under continuous annual no-till agriculture suggest decliningsoil productivity. Field Crops Res. 186, 107–116. http://dx.doi.org/10.1016/j.fcr.2015.11.005.
Frye, W.W., Smith, M.S., Mackown, C.T., 1993. Tillage effects on legume decompositionand transformation of legume and fertilizer nitrogen-15. Soil Sci. Soc. Am. J. 57 (3),750–756. http://dx.doi.org/10.2136/sssaj1993.03615995005700030021x.
Gardner, F.P., Pearce, R.B., Mitchell, R.L., 1985. Physiology of Crop Pants. Iowa StateUniversity Press, pp. 31–46.
Govaerts, B., Fuentes, M., Mezzalama, M., Nicol, J.M., Deckers, J., Etchevers, J.D.,Figueroa-Sandoval, B., Sayre, K.D., 2007. Infiltration, soil moisture, root rot andnematode populations after 12 years of different tillage, residue and crop rotationmanagements. Soil Tillage Res. 94 (1), 209–219. http://dx.doi.org/10.1016/j.still.2006.07.013.
Gregorich, E.G., Drury, C.F., Baldock, J.A., 2001. Changes in soil carbon under long-termmaize in monoculture and legume-based rotation. Can. J. Soil Sci. 81 (1), 21–31.http://dx.doi.org/10.4141/S00-041.
He, G., Wang, Z., Li, F., Dai, J., Li, Q., Xue, C., Cao, H., Wang, S., Malhi, S., 2016. Soilwater storage and winter wheat productivity affected by soil surface managementand precipitation in dryland of the Loess Plateau, China. Agric. Water Manage. 171,1–9. http://dx.doi.org/10.1016/j.agwat.2016.03.005.
Hussain, G., Al-Jaloud, A.A., 1995. Effect of irrigation and nitrogen on water use effi-ciency of wheat in Saudi Arabia. Agric. Water Manage. 27 (2), 143–153. http://dx.doi.org/10.1016/0378-3774(95)91233-W.
Jemai, I., Aissa, N.B., Guirat, S.B., Ben-Hammouda, M., Gallali, T., 2013. Impact of threeand seven years of no-tillage on the soil water storage, in the plant root zone, under adry sub humid Tunisian climate. Soil Tillage Res. 126 (1), 26–33. http://dx.doi.org/10.1016/j.still.2012.07.008.
Jin, V.L., Schmer, M.R., Stewart, C.E., Sindelar, A.J., Varvel, G.E., Wienhold, B.J., 2017.Long-term no-till and stover retention each decrease the global warming potential ofirrigated continuous maize. Global Change Biol. 23 (7), 2848. http://dx.doi.org/10.1111/gcb.13637.
Kassam, A., Friedrich, T., Derpsch, R., Kienzle, J., 2015. Overview of the worldwidespread of conservation agriculture. Field Actions Sci. Rep. 8 (1). http://factsreports.revues.org/3966.
Kladivko, E.J., 2001. Tillage systems and soil ecology. Soil Tillage Res. 61 (1), 61–76.http://dx.doi.org/10.1016/S0167-1987(01)00179-9.
Lal, R., Griffin, M., Apt, J., Lave, L., Morgan, M.G., 2004. Managing soil carbon. Science304 (5669), 393. http://dx.doi.org/10.1126/science.1093079.
Lal, R., 2004. Soil carbon sequestration impacts on global climate change and food se-curity. Science 304 (5677), 1623–1627. http://dx.doi.org/10.1126/science.1097396.
Li, H., Gao, H., Wu, H., Li, W., Wang, X., He, J., 2007. Effects of 15 years of conservation
Z. Li et al. Field Crops Research 222 (2018) 164–179
178

tillage on soil structure and productivity of wheat cultivation in northern China. SoilRes. 45 (5), 344–350. http://dx.doi.org/10.1071/SR07003.
Li, Z., Lai, X.F., Yang, Q., Yang, X., Cui, S., Shen, Y.Y., 2018. In search of long-termsustainable tillage and straw mulching practices for a maize-winter wheat-soybeanrotation system in the Loess Plateau of China. Field Crops Res. 217, 199–210. http://dx.doi.org/10.1016/j.fcr.2017.08.021.
Lin, X., Pittman, J.J., Inostroza, L., Butler, T.J., Munoz, P., 2018. Improving predictabilityof multisensor data with nonlinear statistical methodologies. Crop Sci. 58, 972–981.http://dx.doi.org/10.2135/cropsci2017.09.0537.
Liu, C., Lu, M., Cui, J., Li, B., Fang, C., 2014a. Effects of straw carbon input on carbondynamics in agricultural soils: a meta-analysis. Global Change Biol. 20 (5),1366–1381. http://dx.doi.org/10.1111/gcb.12517.
Liu, E., Teclemariam, S.G., Yan, C., Yu, J., Gu, R., Liu, S., He, W., Liu, Q., 2014b. Long-term effects of no-tillage management practice on soil organic carbon and its frac-tions in the northern china. Geoderma 213 (1), 379–384. http://dx.doi.org/10.1016/j.geoderma.2013.08.021.
Lu, X., Lu, X., 2017. Tillage and crop residue effects on the energy consumption, in-put–output costs and greenhouse gas emissions of maize crops. Nutr. Cycl.Agroecosyst. 108 (3), 323–337. http://dx.doi.org/10.1007/s10705-017-9859-5.
Luo, Y., Ogle, K., Tucker, C., Fei, S., Gao, C., LaDeau, S., Clark, J.S., Schimel, D.S., 2011.Ecological forecasting and data assimilation in a data-rich era. Ecol. Appl. 21,1429–1442. http://dx.doi.org/10.2307/23023092.
Mandal, K.G., Hati, K.M., Misra, A.K., 2009. Biomass yield and energy analysis of soybeanproduction in relation to fertilizer-NPK and organic manure. Biomass Bioenergy 33(12), 1670–1679. http://dx.doi.org/10.1016/j.biombioe.2009.08.010.
Mazzoncini, M., Antichi, D., Bene, C.D., Risaliti, R., Petri, M., Bonari, E., 2016. Soil carbonand nitrogen changes after 28 years of no-tillage management under Mediterraneanconditions. Eur. J. Agron. 77, 156–165. http://dx.doi.org/10.1016/j.eja.2016.02.011.
Melero, S., López-Bellido, L., MunOz-Romero, V., Moreno, F., Murillo, J.M., 2011. Long-term effect of tillage, rotation and nitrogen fertiliser on soil quality in aMediterranean vertisol. Soil Tillage Res. 114 (2), 97–107. http://dx.doi.org/10.1016/j.still.2011.04.007.
Miller, T.D., 1999. Growth Stages of Wheat: Identification and Understanding ImproveCrop Management. SCS-1999-16. Texas Agricultural Extension Service. The Texas A&M University System, College Station, TX.
Mirik, M., Ansley, R.J., Steddom, K., Rush, C.M., Michels Jr., G.J., Workneh, F., Cui, S.,Elliott, N.C., 2014a. High spectral and spatial resolution hyperspectral imagery forquantifying Russian wheat aphid infestation in wheat using the constrained energyminimization classifier. J. Appl. Remote Sens. 8 (1). http://dx.doi.org/10.1117/1.JRS.8.083661.
Mirik, M., Emendack, Y., Attia, A., Chaudhuri, S., Roy, M., Backoulou, G.F., Cui, S.,2014b. Detecting musk thistle (Carduus nutans) infestation using a target recognitionalgorithm. Adv. Remote Sens. 3, 95–105. http://dx.doi.org/10.4236/ars.2014.33008.
Niu, Y., Zhang, R., Luo, Z., Li, L., Cai, L., Li, G., Xie, J., 2016. Contributions of long-termtillage systems on crop production and soil properties in the semi-arid loess plateau ofchina. J. Sci. Food Agric. 96 (8), 2650–2659. http://dx.doi.org/10.1002/jsfa.7382.
Page, A.L., Miller, R.H., Keeney, D.R., 1982. Total carbon, organic carbon, and organicmatter. Methods of Soil Analysis Part—Chemical Methods. pp. 961–1010.
Parkinson, J.A., Allen, S.E., 1975. A wet oxidation procedure suitable for the determi-nation of nitrogen and mineral nutrients in biological materials. Commun. Soil Sci.Plant Anal. 6, 1–11. http://dx.doi.org/10.1080/00103627509366539.
Pittelkow, C.M., Liang, X., Linquist, B.A., van Groenigen, K.J., Lee, J., Lundy, M.E., Gestel,N., Six, J., Venterea, R., Kessel, C., 2015. Productivity limits and potentials of theprinciples of conservation agriculture. Nature 517 (7534), 365–368. http://dx.doi.org/10.1038/nature13809.
Plaza-Bonilla, D., Nolot, J., Raffaillac, D., Justes, E., 2015. Cover crops mitigate nitrateleaching in cropping systems including grain legumes: field evidence and model
simulations. Agric. Ecosyst. Environ. 212, 1–12. http://dx.doi.org/10.1016/j.agee.2015.06.014.
Ramcharan, A., Hengl, T., Nauman, T., Brungard, C., Waltman, S., Wills, S., Thompson, J.,2018. Soil property and class maps of the conterminous United States at 100-meterspatial resolution. Soil Sci. Soc. Am. J. 82 (1), 186–201. http://dx.doi.org/10.2136/sssaj2017.04.0122.
Salmerón, M., Cavero, J., Isla, R., Porter, C.H., Jones, J.W., Boote, K.J., 2014. DSSATnitrogen cycle simulation of cover crop–maize rotations under irrigatedMediterranean conditions. Agron. J. 106, 1283–1296. http://dx.doi.org/10.2134/agronj13.0560.
Saxton, A.M., 1998. A macro for converting mean separation output to letter groupings inProc Mixed. In: Proceedings 23rd SAS Users Group International Conference. 22–25May 1998, Nashville, TN. pp. 1243–1246 SAS Inst., Cary, NC.
Schipanski, M.E., Barbercheck, M., Douglas, M.R., Finney, D.M., Haider, K., Kaye, J.P.,Kemanian, A.R., Mortensen, D.A., Ryan, M.R., Tooker, J., White, C., 2014. A fra-mework for evaluating ecosystem services provided by cover crops in agroecosys-tems. Agric. Syst. 125, 12–22. http://dx.doi.org/10.1016/j.agsy.2013.11.004.
Seddaiu, G., Iocola, I., Farina, R., Orsini, R., Iezzi, G., Roggero, P.P., 2016. Long termeffects of tillage practices and n fertilization in rainfed mediterranean cropping sys-tems: durum wheat, sunflower and maize grain yield. Eur. J. Agron. 77, 166–178.http://dx.doi.org/10.1016/j.eja.2016.02.008.
Shan, L., 1993. The Theory and Practice of Dryland Agriculture in the Loess Plateau ofChina. Science Press, Beijing, China (in Chinese).
Sharma, P., Abrol, V., Sharma, R.K., 2011. Impact of tillage and mulch management oneconomics, energy requirement and crop performance in maize–wheat rotation inrainfed subhumid inceptisols, India. Eur. J. Agron. 34 (1), 46–51. http://dx.doi.org/10.1016/j.eja.2010.10.003.
Shen, Y.Y., Li, L.L., Chen, W., Robertson, M., Unkovich, M., Bellotti, W., Probert, M.,2009. Soil water, soil nitrogen and productivity of lucerne–wheat sequences on deepsilt loams in a summer dominant rainfall environment. Field Crop Res. 111, 97–108.http://dx.doi.org/10.1016/j.fcr.2008.11.005.
Smola, A.J., Schölkopf, B., 2004. A tutorial on support vector regression. Stat. Comput. 14(3), 199. http://dx.doi.org/10.1023/B:STCO.0000035301.49549.
Somasundaram, J., Reeves, S., Wang, W., Heenan, M., Dalal, R., 2017. Impact of 47 yearsof no-tillage and stubble retention on soil aggregation and carbon distribution in avertisol. Land Degrad. Dev. 28, 1589–1602. http://dx.doi.org/10.1002/ldr.2689.
Tabaglio, V., Gavazzi, C., Menta, C., 2009. Physico-chemical indicators and micro-arthropod communities as influenced by no-till, conventional tillage and nitrogenfertilisation after four years of continuous maize. Soil Tillage Res. 105 (1), 135–142.http://dx.doi.org/10.1016/j.still.2009.06.006.
Tabatabaeefar, A., Emamzadeh, H., Varnamkhasti, M.G., Rahimizadeh, R., Karimi, M.,2009. Comparison of energy of tillage systems in wheat production. Energy 34 (1),41–45. http://dx.doi.org/10.1016/j.energy.2008.09.023.
Torbert, H.A., Reeves, D.W., Mulvaney, R.L., 1996. Winter legume cover crop benefits tomaize: rotation vs. fixed-nitrogen effects. Agron. J. 88 (4), 527–535. http://dx.doi.org/10.2134/agronj1996.00021962008800040005x.
Ussiri, D.A.N., Lal, R., 2009. Long-term tillage effects on soil carbon storage and carbondioxide emissions in continuous maize cropping system from an alfisol in ohio. SoilTillage Res. 104 (1), 39–47. http://dx.doi.org/10.1016/j.still.2008.11.008.
Vapnik, V., 1995. The Nature of Statistical Learning Theory. Springer, New York.Wang, Q., Chen, H., Li, H., Li, W., Wang, X., Mchugh, A.D., He, J., Gao, H., 2009.
Controlled traffic farming with no tillage for improved fallow water storage and cropyield on the chinese loess plateau. Soil Tillage Res. 104 (1), 192–197. http://dx.doi.org/10.1016/j.still.2008.10.012.
Yeo, I.Y., Lee, S., Sadeghi, A.M., Beeson, P.C., Hively, W.D., McCarty, G.W., Lang, M.W.,2014. Assessing winter cover crop nutrient uptake efficiency using a water qualitysimulation model. Hydrol. Earth Syst. Sci. 18, 5239–5253. http://dx.doi.org/10.5194/hess-18-5239-2014.
Z. Li et al. Field Crops Research 222 (2018) 164–179
179