agronomy guide for field crops publication 811€¦ · · 2017-12-08cropsfordetailsorchapter15,...
TRANSCRIPT

Soil management is a key component of the crop production system. The best crop production practices applied to a field will not consistently produce a good crop if there has been a history of poor soil management. Managing for a healthy soil is the only way to ensure fields will have the potential for sustained maximum economic yields, especially in years with weather stress. Similar to equipment purchases that require regular maintenance, soil must be protected from erosion and must have organic matter returned to it to support soil life and nutrient cycling.
This chapter will outline how to:
• build and maintain a healthy soil • prevent soil degradation• assess the components of a healthy soil
Ontario soils will provide the backdrop for concepts and examples that improve understanding of soil health, measure current soil health status and illustrate the fundamentals in maintaining economic crop productivity.
Healthy Soils are Productive Soils Soil health is often described as the soil’s capacity to support crop growth, without becoming degraded or otherwise harming the environment. Physical, chemical and biological indicators are measured to determine a soil’s health. Physical indicators include aggregate stability, soil structure and compaction and available water-holding capacity. Soil nutrient and pH levels are chemical indicators. Biological indicators include soil organic matter, microbial respiration and soil life populations. In simple terms, a healthy soil will:
• have good soil structure, resist crusting and have minimal compaction
• have good drainage, water movement and water-holding capacity
• have nutrient levels, pH and organic matter in the optimal range
• be resistant to wind, water or tillage erosion• have an abundance of earthworms
• have a fresh, earthy odour• readily decompose residue• encourage seedling emergence and root growth• produce uniform crop growth and colour
Most of the characteristics of a healthy soil have a direct or indirect link to soil organic matter.
Good Soil ManagementThe key to maintaining healthy and productive soil varies by farm, as do crop combinations and soil types. Some farmers have reduced tillage, many have good rotations and others use manure and other organic materials to improve their soil. Their soil is fertile and free from soil compaction. It is well-structured so it doesn’t crust, allows air to enter the soil and enables water to move into and through the soil. Their economic bottom line is better because yields are consistently higher and inputs are reduced.
Putting it all Together This fifth generation farm family strives to leave the land in excellent condition for the next generation.
The Strategy:• Seven-crop rotations (field crops, horticulture crops and cover crops such as red clover).
• Manure and compost applications to land to increase organic matter levels.
• Reduced tillage to incorporate manure and manage high residue crops.
The Result:• Careful attention to all aspects of soil management has resulted in productive soils where 12 T/ha (190 bu/acre) corn yields have been harvested with no commercial nitrogen.
8. Managing for Healthy Soils
191

Keeping Wheel Traffic Away from the Root Zone
This corn yield challenge winner credits his soil management system for the victory.
The strategy:•A no-till system combined with controlled traffic.
–All wheel traffic is kept off the rows controlling soil compaction.
–No-till on the sandy loam soil minimizes soil disturbance and loss of soil moisture.
–High amount of crop residue feeds earthworms and soil life.
–Mycorrhizae fungi proliferation in undisturbed soil profile improve phosphorus and water uptake.
The result:•Improved nutrient cycling, water holding capacity and an unrestricted root zone lead to high yields with reduced inputs.
Animals Provide a Soil Health Advantage
This dairy farm excels at diversity.
The strategy:•Dairy cattle manure provides both a nutrient and organic matter benefit.
•The length and diversity of the rotation is increased by including forages.
•Forages help to maintain or improve organic matter levels.
•No-till is used for all crops to maintain soil health and diversity of soil life.
The Result:•Soil management practices pay off in an improved bottom line and resilience under poor weather conditions.
Building a Healthy SoilThe key to success in building a healthy soil is effective management of the soil organic matter (SOM). The organic matter (OM) is made up of three parts: active, moderately stable and very stable. Refer to the section The Importance of Organic Matter. The active portion is the segment on which management can have the most influence. The organic matter pool continually experiences gains and losses. If the addition of organic material to the soil exceeds the losses, organic matter levels increase; if the losses exceed the gains, organic matter levels will decrease.
Soil and its management are part of the overall crop production system. Soil is also a central part of the agricultural ecosystem. Changes made in the crop production system over the years, have far-reaching effects on all other systems. When taking steps to improve soil quality, consider the changes being made and how they may affect other components of the crop production system.
Crop Rotation Crop rotation is an integral part of the crop production system. The greatest benefit to a good crop rotation is increased yields. A well-planned crop rotation will:
• aid in maintaining or improving soil structure and organic matter levels
• protect against soil erosion • improve soil resilience against weather extremes• provide residual nitrogen from legumes in
the rotation • help to control insect and disease cycles• reduce weed pressure• spread workload
The basic rule of crop rotation is that a crop should never follow itself. Continuous cropping of any crop will result in the build-up of diseases and insects specific to that crop, and cause a reduction in crop yields. The more often the same crop has been grown in the same field, the greater this impact will be. For example, the practice of growing two or more years of soybeans is becoming increasingly common. Perhaps the greatest impact of back-to-back years of soybeans has been the accelerated spread of soybean cyst nematode (SCN). For more information and potential yield reductions, see Chapter 16, Diseases, Soybean Cyst Nematode. The increased years of soybeans in the rotation is also increasing the susceptibility of Ontario’s soils to erosion. Table 8–1, Soybean yield response to tillage and rotation, describes the average soybean yield respond under long-term no-till and conventional tillage systems. Table 8–2, Corn yield response to crop rotation and tillage, describes the average corn yield response under long-term (established in 1995) no-till and conventional tillage systems.
Soil structure in corn-soybean rotations can actually be poorer than the structure of soils in continuous corn production. For example, the soil erosion that follows an intense June rainstorm in first-year corn following 2 years of soybeans is often twice as high as that
192
Agronomy guide for field Crops
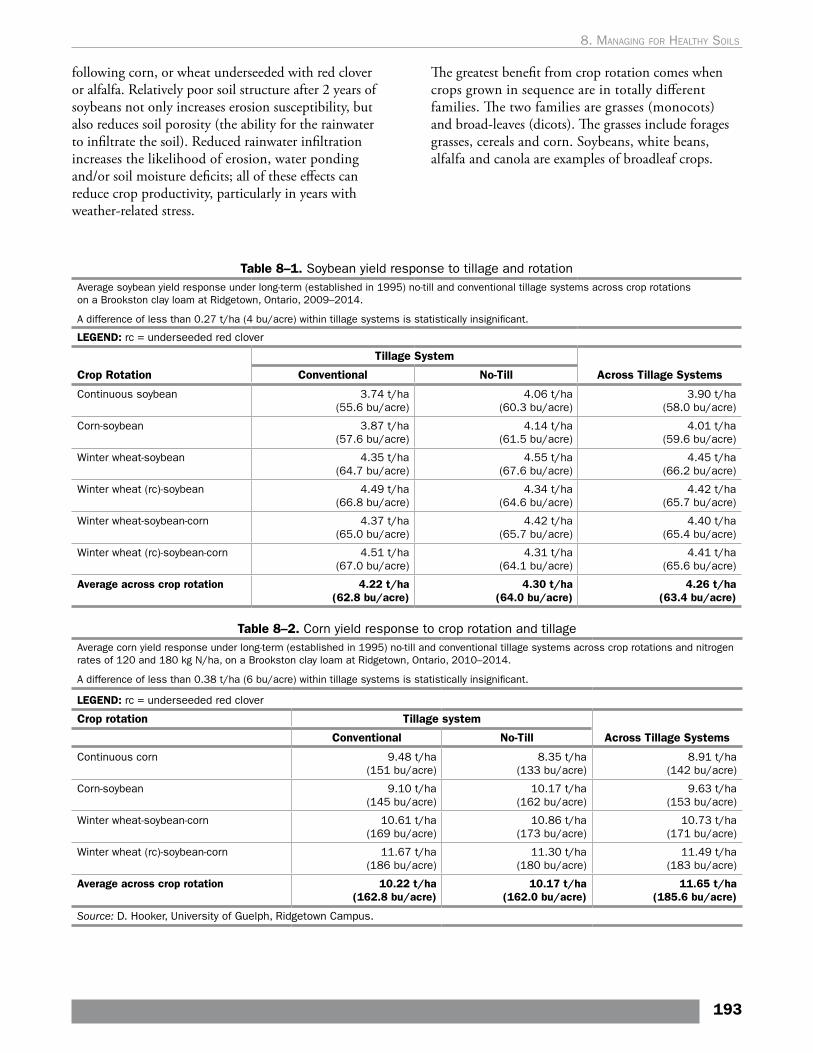
following corn, or wheat underseeded with red clover or alfalfa. Relatively poor soil structure after 2 years of soybeans not only increases erosion susceptibility, but also reduces soil porosity (the ability for the rainwater to infiltrate the soil). Reduced rainwater infiltration increases the likelihood of erosion, water ponding and/or soil moisture deficits; all of these effects can reduce crop productivity, particularly in years with weather-related stress.
The greatest benefit from crop rotation comes when crops grown in sequence are in totally different families. The two families are grasses (monocots) and broad-leaves (dicots). The grasses include forages grasses, cereals and corn. Soybeans, white beans, alfalfa and canola are examples of broadleaf crops.
Table 8–1. Soybean yield response to tillage and rotationAverage soybean yield response under long-term (established in 1995) no-till and conventional tillage systems across crop rotations on a Brookston clay loam at Ridgetown, Ontario, 2009–2014.
A difference of less than 0.27 t/ha (4 bu/acre) within tillage systems is statistically insignificant.
LEGEND: rc = underseeded red clover
Crop Rotation
Tillage System
Across Tillage SystemsConventional No-Till
Continuous soybean 3.74 t/ha (55.6 bu/acre)
4.06 t/ha (60.3 bu/acre)
3.90 t/ha (58.0 bu/acre)
Corn-soybean 3.87 t/ha (57.6 bu/acre)
4.14 t/ha (61.5 bu/acre)
4.01 t/ha (59.6 bu/acre)
Winter wheat-soybean 4.35 t/ha (64.7 bu/acre)
4.55 t/ha (67.6 bu/acre)
4.45 t/ha (66.2 bu/acre)
Winter wheat (rc)-soybean 4.49 t/ha (66.8 bu/acre)
4.34 t/ha (64.6 bu/acre)
4.42 t/ha (65.7 bu/acre)
Winter wheat-soybean-corn 4.37 t/ha (65.0 bu/acre)
4.42 t/ha (65.7 bu/acre)
4.40 t/ha (65.4 bu/acre)
Winter wheat (rc)-soybean-corn 4.51 t/ha (67.0 bu/acre)
4.31 t/ha (64.1 bu/acre)
4.41 t/ha (65.6 bu/acre)
Average across crop rotation 4.22 t/ha (62.8 bu/acre)
4.30 t/ha (64.0 bu/acre)
4.26 t/ha (63.4 bu/acre)
Table 8–2. Corn yield response to crop rotation and tillageAverage corn yield response under long-term (established in 1995) no-till and conventional tillage systems across crop rotations and nitrogen rates of 120 and 180 kg N/ha, on a Brookston clay loam at Ridgetown, Ontario, 2010–2014.
A difference of less than 0.38 t/ha (6 bu/acre) within tillage systems is statistically insignificant.
LEGEND: rc = underseeded red clover
Crop rotation Tillage system
Across Tillage SystemsConventional No-Till
Continuous corn 9.48 t/ha (151 bu/acre)
8.35 t/ha (133 bu/acre)
8.91 t/ha (142 bu/acre)
Corn-soybean 9.10 t/ha (145 bu/acre)
10.17 t/ha (162 bu/acre)
9.63 t/ha (153 bu/acre)
Winter wheat-soybean-corn 10.61 t/ha (169 bu/acre)
10.86 t/ha (173 bu/acre)
10.73 t/ha (171 bu/acre)
Winter wheat (rc)-soybean-corn 11.67 t/ha (186 bu/acre)
11.30 t/ha (180 bu/acre)
11.49 t/ha (183 bu/acre)
Average across crop rotation 10.22 t/ha (162.8 bu/acre)
10.17 t/ha (162.0 bu/acre)
11.65 t/ha (185.6 bu/acre)
Source: D. Hooker, University of Guelph, Ridgetown Campus.
193
8. ManagIng For healthy soIls

Crop Rotation Provides Yield Stability in Adverse YearsA diverse crop rotation provides yield benefits in addition to the rotation effect. Research from long-term tillage and rotation trials at Elora, Ontario have shown significant yield benefit to a good rotation in dry and wet growing seasons. Figure 8–1, Yield benefits of crop rotation vs. continuous corn in years with above and below average precipitation, shows the yield advantage of three rotations compared to continuous corn for the period from 1984 until 2012. The shaded bars show the yield advantage and the solid line indicates the precipitation deviation. Many of the years with low precipitation had over 700 kg/ha (630 lb/acre) yield advantage, while many years with higher precipitation gained over 400 kg/ha (360 lb/acre) yield.
Yie
ld a
dvan
tage
ove
r m
onoc
rop
corn
kg/
ha-1
Till
– – precipitations + + precipitations
Precipitation anom
aly(deviation from
30-year average)
4,000
Bill Deen
3,000
2,000
1,000
0
-1,000
-2,000
-3,000
250
200
150
100
50
0
-50
-100
-150
-200
CCCC-CCOrcBrc CCCC-CCSWrc CCCC-CCAA
20
05
20
07
19
94
19
88
20
02
19
97
19
84
20
12
19
89
19
98
20
04
19
83
20
09
19
87
20
03
19
90
19
91
19
85
20
06
19
95
20
01
19
99
20
10
19
82
20
00
19
96
19
93
20
11
20
08
19
86
19
92
Figure 8–1. Yield benefits of crop rotation vs. continuous corn in years with above and below average precipitation.
Benefits of Rotation Diversity (wheat/cover crops)
•yield and yield stability, particularly under moisture extremes
•increased carbon sequestration and reduced greenhouse gas (GHG) emissions
•winter wheat is a cover crop, which provides a “niche” opportunity
•increased opportunity to sustainably remove biomass
•greater resource-use efficiency (e.g., nitrogen) •increased profitability
194
Agronomy guide for field Crops

Crop Rotation Increases Soil Organic MatterA diverse crop rotation increases the amount of soil carbon (organic matter) in the soil. The long-term rotation plots at the University of Guelph, Elora Research Station has measured significant increases in soil carbon with more complex rotations, especially where cover crops such as red clover and perennial crops were included. Refer to Figure 8–2, Impact of long-term crop rotation on soil carbon content.
Figure 8–2. Impact of long-term crop rotation on soil carbon content.
The fibrous root systems of cereal and forage crops (including red clover) are excellent for building soil structure. Studies have shown that the benefits of including wheat, and especially wheat plus red clover, persist beyond just the following year. Underseeding red clover into wheat resulted in a 0.54 t/ha (8 bu/acre) corn yield increase on average, compared to 3-year rotations without red clover.
Crop Rotation Increases Productivity and Nutrient CyclingIn a study evaluating crop rotation and tillage for almost 20 years, crop rotation showed significant improvement in crop productivity and nutrient cycling, as shown in Figure 8–3, Corn yield response to soil N and soil health. Potentially mineralizable nitrogen is an indicator of the capacity of the soil microbial community to convert (mineralize) nitrogen tied up in complex organic residues into the plant available form of ammonium.
Cover crops are an important part of the crop rotation. There are a number of places cover crops can fit in the rotation. One of the easiest is following winter wheat or other cereals, dry edible beans, silage corn and other early harvested crops. Including cover crops in the corn crop is currently being studied.
A mobile App; "Cash Cropper", available at gfo.ca/apps, allows producers to compare the net profitability and
fertility requirements for different crop rotations. This app is powered by over 30 years of data on crop yield responses to different rotations from research conducted by the University of Guelph. The app uses default yield values provided by crop insurance records in Ontario and uses the OMAFRA cost of production defaults as a starting point.
Figure 8–3. Corn yield response to soil N and soil health.
In choosing which crop to grow, consider the economics of the entire rotation instead of a single crop in isolation. Refer to OMAFRA Publication 60, Field Crop Budgets, for cost estimates or visit the OMAFRA website at ontario.ca/agbusiness.
Be aware of any potential insect or disease problems that could affect crops later in the rotation. Cover crops in the rotation may also have an impact on diseases and pests, either positive or negative. Refer to specific cover crops for details or Chapter 15, Insects and Pests of Field Crops, or Chapter 16, Diseases of Field Crops.
Cover Crops Soil health is enhanced through the use of cover crops. Long-time advocates of no-till have found that adding cover crops to their rotation adds a critical amount of additional carbon to the soil.
Consider cover crops as part of the overall crop rotation. Cover crops play a role in regular soil maintenance. This is particularly important on the lighter soils with lower organic matter, or on fields with short rotations and little return of crop residue or manure. Cover crops can help to ensure appropriate ground cover, over the non-growing season and after planting, to protect the soil. This can help keep the soil on the field and out of water courses. To select the best cover crop for the job, identify the goal or expected benefit ahead of time. Table 8–3, Matching cover crop choices to function, looks at the various reasons for including cover crops in a rotation and the potential cover crops that best meet those goals.
195
8. ManagIng For healthy soIls

Table 8–3. Matching cover crop choices to function Cover Crop Function Best Choices for Cover Crops
Nitrogen production Legumes — red clover and other clovers, alfalfa, peas, vetch
Nitrogen scavenging Fall uptake — oilseed radish and other brassicas, oats, barleyWinter/spring uptake — cereal rye, winter wheat
Weed suppression Fast-growing/shading plants — oilseed radish and other brassicas, winter rye, buckwheat
Soil structure building Fibrous root systems from oats, barley, rye, wheat, triticale, ryegrass or clovers
Compaction reduction Most cover crop roots will assist in reducing compactionModerate compaction — radishMore severe compaction requires strong, dense tap roots that grow over time — alfalfa, sweet clover
Biomass return to soil Fall-seeded — spring cereals, oilseed radishSummer-seeded — millets, sorghum, sudangrass, sorghum-sudan
Erosion protection (i.e., wind, water)
Most cover crops once well established Winter rye, winter wheat, ryegrass (well-established), spring cereals seeded early
Emergency forage Fall — oats, barley, wheat, rye, forage brassicasSummer — millet, sorghum, sudangrass, sorghum-sudanSee Table 3–2 in Chapter 3, Forages for more annual forage options
Nematode suppression Cutlass mustard, sudans/sorghums (Sordan 79, Trudan 8), pearl millet (CFPM 101), marigold (Crackerjack, Creole), oilseed radish (Adagio, Colonel)Not all cover crops have the ability to suppress nematode populations; some will even act as hosts. Cover crop activity is variety- and nematode-specific. To get the most activity, cover crops should be weed free and may require specific handling.
Choosing a Cover CropThere are often several cover crop options for any one goal or function. Consider specific farm needs and management style to select the best cover crop or mix for a farming system. Table 8–4, Choosing a cover crop,
gives factors to consider when selecting a cover crop. Or consult the Ontario portion of the Midwest Cover Crop Council Selector tool at http://mccc.msu.edu/selector-tool/
Table 8–4. Choosing a cover cropConsideration Comment
Growth habits When is the growth required?• lots of vigorous growth in late fall• rapid growth in early springIs deep rooting important?
Overwintering Does the cover crop need to survive overwinter?Would it suit the cropping schedule and soil type if the cover crop winter-killed and dried out by spring?
Control options Will the cover crop become a weed concern? How is it controlled? What options are there for control?
Sensitivity to herbicides How sensitive is the cover crop to herbicide residues from other crops in the rotation?
Seed cost and availability What is the seed cost, and is the seed available?
Establishment What is the best way to plant the seed?Is different equipment required to plant the cover crop?How easy is it to establish? Will it create a solid cover?
Nutrient management Is the cover crop a nitrogen producer or does it require nitrogen to grow well?When will the cover crop release nitrogen? Does the release timing match with the needs of the following crop?Does the cover crop scavenge well for nitrogen?
Pest management What crop family is the cover crop in? Is it related to other crops in the rotation? Are there pest concerns?
196
Agronomy guide for field Crops

Spe
cies
See
ding
Rat
e3
Nor
mal
S
eedi
ng T
ime
Min
imum
G
erm
inat
ion
Tem
pera
ture
Nit
roge
n1
Ove
r-Win
teri
ng
Cha
ract
eris
tics
Bui
ldin
g S
oil
Str
uctu
re
Wee
d S
uppr
essi
on
Gro
wth
Roo
t Ty
pe
Characteristics of Cover CropsInformation on the most commonly used cover crops is provided in Table 8–5, Characteristics of cover crops grown in Ontario. More information about specific grass and legume cover crops can also be found in
Chapter 3, Forages. Many cover crops can also function as grazing crops, often to extend pasturing into winter months or to provide emergency forages during dry periods. Refer to Publication 19, Pasture Production for grazing opportunities and precautions and for specifics on each cover crop.
Table 8–5. Characteristics of cover crops grown in OntarioLEGEND: F = fixed S = scavenged
Grasses
Spring cereals 30–90 kg/ha Mid-Aug– Sept
9°C S killed by heavy frost
good good very fast fibrous
Winter wheat 60–120 kg/ha Sept–Oct 3°C S over-winters very well
good good fast fibrous
Winter rye 60–120 kg/ha Sept–Oct 1°C S over-winters very well
very good
very good
very fast fibrous
Sorghum sudan 15–25 kg/ha June–Aug 18°C S killed by frost good good/fair
very fast coarse fibrous
Pearl millet 9–20 kg/ha June–Aug 18°C S killed by frost good good/fair
fast coarse fibrous
Ryegrass 12–25 kg/ha April–May or Aug–early Sept
4.5°C S annual, Italian partially survive; perennial over-winters
very good
fair/poor
slow to establish
fibrous
Broadleaves -— Legumes
Hairy vetch 20–30 kg/ha Aug 15.6°C F/S over-winters good fair/poor
slow to establish
tap with secondary fibrous
Red clover 8–10 kg/ha March–April 5°C F/S over-winters good fair slow to establish
weak tap/ fibrous
Sweet clover 8–10 kg/ha March–April 5.5°C F/S over-winters good fair slow to establish
strong tap
Soybeans 40–50 kg/ha Aug 8°C F/S killed by frost poor good/fair
fast tap
Crimson clover 8–10 kg/ha May–Aug 6°C F/S over-winters inconsistently
good fair slow to establish
fibrous
Field peas 40–100 kg/ha Aug 5°C F/S killed by heavy frost
poor good/fair
fast weak tap/fibrous
Broadleaves — Non-Legume
Buckwheat 50–60 kg/ha June–Aug 10°C S killed by first frost
poor very good
fast weak tap/fibrous
100 kg/ha = 90 lb/acre1 Radish and other brassicas, buckwheat and the grasses do not fix nitrogen from the air but are scavengers of nitrogen from soil
and manure applications. Cover crops that die over winter often release much of the scavenged nitrogen before a corn crop is able to make use of it.
2 Roots have been reported to cause tile drainage blockage.3 Adjust seeding rates based upon cover crop purpose (e.g., erosion versus feed) and based upon seeding date (i.e., increase
seeding rates later in the fall to ensure appropriate cover levels).
continued on next page
197
8. ManagIng For healthy soIls
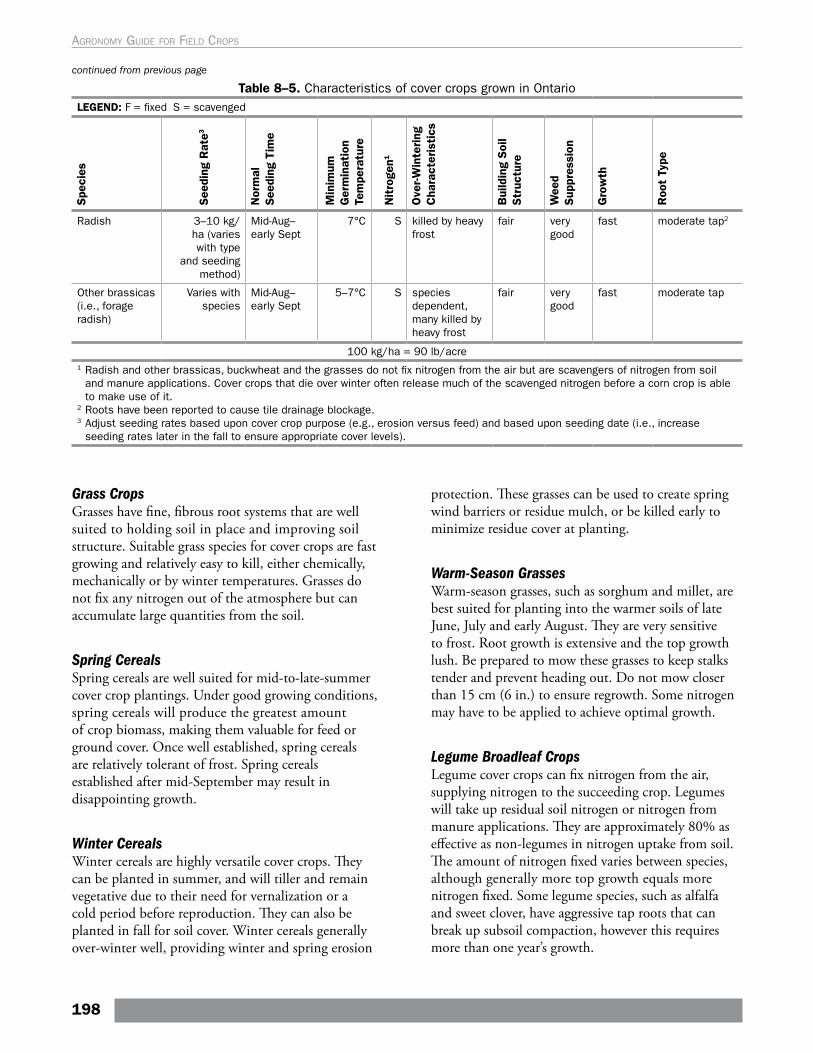
Table 8–5. Characteristics of cover crops grown in OntarioLEGEND: F = fixed S = scavenged
Spe
cies
See
ding
Rat
e3
Nor
mal
See
ding
Tim
e
Min
imum
G
erm
inat
ion
Tem
pera
ture
Nit
roge
n1
Ove
r-Win
tering
C
hara
cter
isti
cs
Bui
ldin
g Soi
l Str
uctu
re
Wee
d Sup
pres
sion
Gro
wth
Roo
t Ty
pe
Radish 3–10 kg/ha (varies with type
and seeding method)
Mid-Aug–early Sept
7°C S killed by heavy frost
fair very good
fast moderate tap2
Other brassicas (i.e., forage radish)
Varies with species
Mid-Aug–early Sept
5–7°C S species dependent, many killed by heavy frost
fair very good
fast moderate tap
100 kg/ha = 90 lb/acre1 Radish and other brassicas, buckwheat and the grasses do not fix nitrogen from the air but are scavengers of nitrogen from soil
and manure applications. Cover crops that die over winter often release much of the scavenged nitrogen before a corn crop is able to make use of it.
2 Roots have been reported to cause tile drainage blockage.3 Adjust seeding rates based upon cover crop purpose (e.g., erosion versus feed) and based upon seeding date (i.e., increase
seeding rates later in the fall to ensure appropriate cover levels).
continued from previous page
Grass CropsGrasses have fine, fibrous root systems that are well suited to holding soil in place and improving soil structure. Suitable grass species for cover crops are fast growing and relatively easy to kill, either chemically, mechanically or by winter temperatures. Grasses do not fix any nitrogen out of the atmosphere but can accumulate large quantities from the soil.
Spring Cereals Spring cereals are well suited for mid-to-late-summer cover crop plantings. Under good growing conditions, spring cereals will produce the greatest amount of crop biomass, making them valuable for feed or ground cover. Once well established, spring cereals are relatively tolerant of frost. Spring cereals established after mid-September may result in disappointing growth.
Winter Cereals Winter cereals are highly versatile cover crops. They can be planted in summer, and will tiller and remain vegetative due to their need for vernalization or a cold period before reproduction. They can also be planted in fall for soil cover. Winter cereals generally over-winter well, providing winter and spring erosion
protection. These grasses can be used to create spring wind barriers or residue mulch, or be killed early to minimize residue cover at planting.
Warm-Season GrassesWarm-season grasses, such as sorghum and millet, are best suited for planting into the warmer soils of late June, July and early August. They are very sensitive to frost. Root growth is extensive and the top growth lush. Be prepared to mow these grasses to keep stalks tender and prevent heading out. Do not mow closer than 15 cm (6 in.) to ensure regrowth. Some nitrogen may have to be applied to achieve optimal growth.
Legume Broadleaf CropsLegume cover crops can fix nitrogen from the air, supplying nitrogen to the succeeding crop. Legumes will take up residual soil nitrogen or nitrogen from manure applications. They are approximately 80% as effective as non-legumes in nitrogen uptake from soil. The amount of nitrogen fixed varies between species, although generally more top growth equals more nitrogen fixed. Some legume species, such as alfalfa and sweet clover, have aggressive tap roots that can break up subsoil compaction, however this requires more than one year’s growth.
198
Agronomy guide for field Crops

Red Clover is an example of a low-cost cover crop with multiple functions:•provides up to 82 kg/ha (75 lb/acre) nitrogen credit for subsequent corn crop
•75% of the fibrous root mass are located in the plough depth of the soil
•root volume increases 4–6 times when plowdown is delayed from September 1 until October 15
Non-Legume Broadleaf CropsThese broadleaf crops cannot fix nitrogen out of the air but may absorb large quantities from the soil. Most are not winter-hardy, so additional control measures are not normally required. They should not be allowed to go to seed, as the volunteer seed can become a significant weed problem.
Cover Crop MixesMixtures of cover crop species are growing in popularity. Mixes offer an opportunity to increase diversity in growth habit and rooting, and increase the chance that some cover crop will grow everywhere across a field. While there are commercial mixtures available, cover crop mixes can easily be created on farm. Consider:
• cover crops’ growth habits and speed of establishment and development (e.g., buckwheat may not be a good choice in a mix that will be allowed to grow for more than 5–6 weeks, due to flower and seed set)
• start with simple mixes of 2, 3 or 6 species• the proportions of various species in a mixture
(To determine the seeding rate for a single cover crop, divide the seeding rate for that one species by the number of species in the mix. Then, make adjustments based on the competitiveness of the species (e.g., radish and oats are more competitive, so rates of 2.2–3.4 kg/ha (2–3 lb/acre) for radish and 22–45 kg/ha (20–40 lb/acre) for oats work better in mixtures.)
• range of seed size for flow-through seeding equipment and the chance of seed segregation
• seed cost, which can increase rapidly with diverse cover crop mixtures
• herbicide carryover from previous crop, and control required for the planned cover crop
New and Emerging Cover CropsEvery year new species are tested as cover crops. Often these species are from different parts of the globe and may not be well adapted to Ontario growing conditions. For more information on new and common cover crop species, see the OMAFRA website at ontario.ca/crops or the Midwest Cover Crop Council at www.mccc.msu.edu.
Seeding RatesThere are many recommendations for seeding rates. Consider the following when choosing seeding rates:
• cover crop seeding rates are specific to soil texture and crop management system
• often less can be more• use higher seeding rates for feed and for erosion
protection and when seeding after mid-October• fine-tuning seeding rates based on experience
from previous years
See Table 8–5, Characteristics of cover crops grown in Ontario, which includes seeding rates of many common cover crop species.
Seeding Cover CropsCover crops can be seeded in a wide variety of ways, however, attention to seed placement, timing and soil conditions can help ensure success. Biomass, especially root growth, is an important goal with cover crops. Early harvested crops like wheat, dry edible beans and vegetables offer an excellent opportunity to plant cover crops. Often soil conditions are dry at that time of year, however early planting will allow for the maximum potential for cover crop growth. Planting with a drill or planter will ensure good seed placement and soil contact, supporting earlier emergence and growth. Broadcasting seed will also work but is more weather-dependent. Experimentation with interseeding some cover crops into corn and soybeans is occurring, but weather plays a significant role in establishment and growth.
Herbicides and Cover CropsSome cover crops are sensitive to herbicide residues and growth may be reduced. Check for herbicide carryover concerns before planting, particularly if planning to interseed into a standing crop such as corn.
Management and TerminationHaving a plan in place for cover crop termination is just as important as selecting the correct type of cover crop. Many of the common cover crops, such as oats
199
8. ManagIng For healthy soIls

and radish, will die over winter. Mowing or light tillage can be used with crops such as spring cereals, to control vegetative growth and ensure the remaining material remains vegetative. Hardy cover crops — for example cereal rye, winter wheat and in most cases annual ryegrass — will need a plan to control growth promptly in the spring.
When planting into a cover crop in spring, consider:
• how fast the cover crop will die once it has been controlled
• that a living cover crop will draw moisture from the soil until it dies, which can be beneficial in a wet spring, but may cause problems in a dry spring
• the amount of residue on the surface in the spring; thick residue can help conserve moisture throughout the season on a sandy soil, but may keep the soil too wet on a clay loam soil
• planting when the soil is fit; planting too wet may lead to the slot opening up in dry conditions
• planting when soil temperature is warm enough for germination, and avoid planting too deep
• modifying the planter to ensure good seed-to-soil contact and proper seed trench closure
• strip tillage as an option to allow good seed placement while maintaining soil cover
Reducing Tillage Soil is tilled for a number of reasons, including weed control, soil levelling, burying of crop residues, incorporation of fertilizer and manure, and seedbed preparation. The advent of herbicides greatly reduced the need for tillage to control weeds (except in organic systems) and the development of equipment to plant into crop residues ensures that crops can be planted successfully with little or no tillage. Generally, performing primary tillage operations in the spring will leave the soil less prone to erosion than tillage in the fall. Try to use the least amount of tillage necessary to achieve the goal. This will help keep the soil in place, so it doesn’t move to nearby streams and rivers.
The success of any reduced tillage system will be improved by considering all parts of the system. Spreading residue and chaff evenly at harvest will improve tillage and planting operations. The better the crop rotation, the better the potential success with reduced tillage. Making changes to the planter or drill, over and above the addition of coulters or row cleaners, will greatly improve seed placement.
See the tillage sections of each specific crop in this publication for additional information.
Maintain at Least 30% Soil Cover 100% of the Time
Invest in farm productivity. To protect the soil from erosion, provide at least 30% soil cover using crops, residues or cover crops all year long. A minimum of 50% residue cover going into the fall increases the chance of achieving at least 30% soil cover after planting. The residue should be large enough to intercept a raindrop. The cover will also slow water movement, helping to prevent soil detachment. A wide range of equipment and cropping options are available to achieve this goal.
Photo 8–1. 30% soil cover all year long helps protect the soil.
No-Till, Zone Till and Strip Till No-till systems provide the greatest opportunity to leave protective crop residues on the soil surface. They also have the greatest potential for reducing tillage costs, offset somewhat by the need to control weeds in nearly all cases with a pre-plant “burndown” herbicide application. Numerous options exist, both in the original design and in the modifications available, for row crop planters or seed drills to be considered “no-till” capable.
In Ontario, the term “no-till” generally describes planting the crop into a field with no previous tillage passes, with just the seed opener or with one coulter in front of the seed opener. Planting into the soil the spring after fields were tilled in the fall and left ready to plant is not no-till.
200
Agronomy guide for field Crops

Zone tillage systems usually have two or three coulters in front of the seed and fertilizer openers and may also include trash wheels.
Strip tillage uses a toolbar with coulters in front, followed by a combination of shanks and/or coulters or disks. It may be used in the fall, spring or both to prepare a seedbed. Most strip tillers operate at a 10–15 cm (4–6 in.) depth. The strip till system is another way to manage crop residues, allowing soils to warm up faster in the spring while still providing the benefits of residue cover between the rows. Fertilizer can be applied in the same operation.
The success of no-till systems is often dependent on a range of factors other than the equipment design. Two of these — soil drainage and crop rotation — have a significant influence on the performance of all no-till systems. Reduced tillage systems present the greatest challenge for planting corn. Tillage systems are described in more detail in Chapter 1, Corn. More information on these systems can be found in the OMAFRA publication Best Management Practices: No-Till: Making it Work.
Vertical TillageVertical tillage uses a series of coulters of different shapes and configurations to perform shallow tillage. The operation is performed in the fall or spring or both to chop and size residue and perform some light incorporation to encourage residue breakdown. This can reduce the amount of residue into which a producer must plant, and can help soils warm more quickly in spring. Ideally, the number of passes will be limited to ensure greater than 30% residue cover after planting.
Disc The disc, like the chisel plow, will leave more residue on the soil surface than the mouldboard plow. Using this tool when the soil is too wet can cause soil compaction. Too many passes will break down soil aggregates and increase the loss of soil organic matter and the risk of crusting. A planter that is properly set up to handle some residue and a rougher seedbed can help reduce the number of secondary tillage passes in any tillage system.
Chisel Plow The chisel plow will leave more residue on the surface than the mouldboard plow. This will be influenced by chisel plow set-up, the amount of crop residue to be handled and the amount of secondary tillage performed. Chisel plowing with twisted shovel teeth will leave the soil ridged, which is good for soil erosion control, but can require extra tillage passes in the spring and lead to uneven soil moisture in the seedbed. This can be overcome by:
• using sweep teeth on all or part of the chisel plow• adding a levelling bar or harrows to the rear of the
chisel plow• timely secondary tillage in the spring
The chisel plow can also be an effective tool for incorporating manure with uniform distribution through the soil profile.
The chisel plow can cause as much tillage erosion (the movement of soil down a slope) as the mouldboard plow on sloping land.
Mouldboard Plow From a soil health perspective, the mouldboard plow is the least desirable tillage method, because it leaves little residue on the soil surface, requires multiple passes of secondary tillage, is energy intensive and requires significantly more labour than no-till and many reduced tillage systems. Plowing and secondary tillage pulverize aggregates, making the soil more prone to crusting and erosion. The plow moves a significant amount of soil, contributing to tillage erosion and the loss of topsoil on sloping land. If mouldboard plowing is used, set the plow to stand the furrows on edge and try to leave some residue on the surface. Also, minimize the number of secondary tillage passes to reduce the breakdown of soil aggregates.
Fertility ManagementA healthy soil will have nutrient levels in an adequate range for the crops grown. The pH will also be in the correct range for the specific crops that are to be grown. Refer to Chapter 9, Soil Fertility and Nutrient Use, for information on soil and tissue sampling and how to correct deficiencies.
201
8. ManagIng For healthy soIls

Applying Organic Materials (Residues) to the Land The application of organic materials to the land is done to increase organic matter levels and also to add nutrients to the soil. Soils that are well aerated, such as sands, break down residues quickly, making it more difficult to increase soil organic matter levels. Soils with higher clay contents break down residues more slowly, requiring less organic residues to maintain or increase the soil organic matter level.
To achieve the maximum benefit and protect the environment, consider how organic materials are applied.
Providing a variety of residue types, such as manure, crop residues, composts, cover crops and biosolids, will support a diverse group of soil life. Soils with adequate organic matter levels will be more productive, have better aggregate stability and nutrient cycling. Table 8–6, Organic matter level rating of different soil textures, provides an organic matter ranking for different soil textures. Producers should try to improve the organic matter levels of soils rated “fair” or “poor” to the “good” category.
Table 8–6. Organic matter level rating of different soil textures
TextureVery Good Good Fair Poor
Sand 3.1% + 2.1%–3.0%
1.2%–2.0%
<1.1%
Sandy loam 3.6% + 2.6%–3.5%
1.6%–2.5%
<1.5%
Loam 4.1% + 3.1%–4.0%
2.1%–3.0%
<2.0%
Clay loam 4.6% + 3.6%–4.5%
2.6%–3.5%
<2.5%
Clay 4.6% + 3.6%–4.5%
2.6%–3.5%
<2.5%
To avoid contaminating surface water, be careful when applying various organic materials to the soil.
Manure Livestock manure is an excellent source of organic matter for the soil. Applying manure to the soil will provide other benefits, such as a greater diversity and activity of organisms and better soil structure. See Table 8–7, Effects of 11 years of manure additions on organic matter levels.
Consider the following when using manure as an organic matter source:
• Manure will add organic matter but also adds nutrients. Use the information in Table 9–10, Typical amounts of total and available nitrogen, phosphate and potash from various organic nutrient sources, to help avoid over-application of nutrients that could lead to losses into the environment.
• The organic matter content of manure will vary, depending on its composition. Generally, more solids will be added to the soil with solid manure than with liquid manure. Solid manure from cattle (ruminants) will contain more bedding materials than liquid manure. Refer to Table 9–10 for a listing of typical manure types and their dry matter content.
• The application rate will impact the amount of organic matter added to the soil.
• Solid manures usually contain more lignin (forage and bedding), which will have a longer-term effect on organic matter than liquid manure or manure without bedding. Type of bedding material (straw vs. wood shavings) will also impact soil organic matter levels.
• Apply manure without compacting the soil.
Table 8–7. Effects of 11 years of manure additions on organic matter levels
The original organic matter level was 5.2%. The study was conducted on continuous corn silage on a clay soil adding dairy manure. The manure application also improved soil aggregation and the amount of pore space.
Application Rate (per year)
None
22 t/ha (10 tons/
acre)
45 t/ha (20 tons/
acre)
67 t/ha (30 tons/
acre)
Organic matter
4.3% 4.8% 5.2% 5.5%
Source: Building Soils for Better Crops, 3rd version, 2009. (Magdoff) SARE Outreach. www.sare.org.
The nutrient content of manure is discussed in Chapter 9, Soil Fertility and Nutrient Use, Manure management section.
CompostApplying compost to the soil is another way of adding organic matter. Compost is blended from a variety of waste material inputs, which results in varying amounts of readily available nutrients. Leaf-yard sourced compost will supply relatively low amounts of readily available nutrients, while compost sourced from food waste, as well as composted poultry manure, will supply more nutrients. The composting process relies
202
Agronomy guide for field Crops

on specific moisture content and carbon-to-nitrogen ratio to allow micro-organisms to partially decompose organic matter, so the organic matter added to the soil is made up of more resistant compounds than in fresh manure. Micro-organisms in the soil utilize the compounds so that nutrient cycling in the soil releases nutrients to crops over a longer period of time.
Composted materials combined with applications of fresh organic residues (manure or cover crops) will stimulate production of compounds that act as a glue (called glomalins) to hold aggregates together. Compost should not be the only source of organic matter, as soils benefit from fresh residues as well. Fresh residues will stimulate more production of the sticky material that holds aggregates together than compost. Similar to manure, it is important to minimize compaction at application and avoid excessive nutrient additions.
Composting of manure and other materials will:
• help stabilize nutrients• reduce the volume to spread (volume can be
reduced by 30%–60%)• produce a better-smelling final product
Other Organic Materials Sewage Biosolids Like manure, biosolids are a source of organic matter and nutrients for the farm. As a regulated material, sewage biosolids are monitored to address environmental quality, food safety and human health issues. Sewage biosolids are available for application on agricultural land in many parts of the province. The application rate for a field is based on the soil test results for the field and crop nutrient requirements. The amount of organic matter applied will depend on the rate applied and the type of biosolid.
When applying sewage biosolids, similar to any land operation, ensure the soil is fit to avoid compaction. Work with the applicator to ensure the timing fits with crop production routines.
Other Agricultural and Non-Agricultural Source MaterialsThere are a variety of other organic materials that can be applied to soil to add organic matter. Knowing the dry matter and nutrient content — including micronutrients and total salts — of the material will help determine application rates and provide an indication of how much organic matter is being added. It is also important to know the carbon-to-nitrogen ratio of the material, to assess any potential impacts on nitrogen availability. When calculating the rate of application, consider the physical amount applied and the implications for the rest of the cropping system.
Carbon-to-Nitrogen Ratio (C:N ratio)When an organic amendment is applied to a field, it adds nutrients and organic matter to the soil. The organic matter contains about 60% organic carbon. The carbon-to-nitrogen (C:N) ratio shows the proportion of organic carbon to total nitrogen of a manure or organic material.
The nitrogen is a food source for the soil micro-organisms while they break down the carbon material. When that process is complete, the soil microbes die and decompose. The microbial nitrogen is then returned to the soil and becomes available to the plants. This is considered the “organic nitrogen” component of the manure and other organic materials. How long this process takes depends on the ratio of carbon to nitrogen in the material. The other portion of the nitrogen in the amendment is the “ammonium nitrogen.” This refers to the nitrogen portion that is quickly available to plants when manure or other organic materials are applied to a crop.
An organic material with C:N ratio under 20:1 is considered ideal for crop production. When there is not enough nitrogen in the organic material to break down the carbon, the micro-organisms utilize nitrogen from the soil. When C:N ratios are higher than 25–30:1, it could result in a nitrogen deficiency, for a crop such as corn that relies on soil nitrogen. Table 8–8, Carbon:Nitrogen ratio of various organic materials reveals the C:N ratio of various common materials.
203
8. ManagIng For healthy soIls

Table 8–8. Carbon:Nitrogen ratio of various organic materials
Material C:N Ratio Range
Soil microbes 4:1 to 9:1
Soil organic matter 10:1 to 12:1
Solid cattle manure 20:1 (light bedding) to 40:1 (heavy bedding)
Horse manure 27:1 (straw bedding) 60:1 (sawdust bedding)
Solid poultry manure 5:1 layers 10:1 broilers and turkeys
Liquid hog manure <8:1
Liquid dairy 15:1
Legume residues 20:1 to 30:1
Corn stalks 80:1
Wheat straw 80:1
Sawdust 500:1
Pulp and paper biosolids
25:1 (nitrogen added during process) to 200:1 (little or no nitrogen added)
Source: OMAFRA and Organic Field Crop Handbook, 2nd edition. 2001.
Considerations When Incorporating Organic Materials
Do I have to incorporate the material?
•Incorporate materials with an odour immediately or as soon as possible.
•Incorporate materials containing ammonium nitrogen as soon as possible to reduce nitrogen losses.
•Nutrient management regulations may require incorporation.
•Incorporate nutrient-rich materials on sloping land or flood plains to prevent loss.
•Leave materials that don’t meet the above criteria on the soil surface to help protect the soil. Earthworms and other soil life will help break down and incorporate the material.
How Much Organic Matter Will an Organic Material Application Add?
Organic material applications can be used to help maintain soil organic matter (SOM) or to increase the soil organic matter level. A corn, soybean and winter wheat rotation, or a rotation with perennial forages, will increase organic matter levels. The exception is if crop residues are removed from at least two of the corn, soybean or wheat crops or if the field receives excessive tillage. Low-residue crops such as soybeans, dry edible beans and canola do not return enough organic material back to the soil to maintain organic matter levels.
So how much organic matter is contributed to the soil from an application of compost? Below is an example calculation:
The addition of 15 ton/acre of a compost material (C:N ratio = 15:1; Total N = 35 lb/ton)
Total N x C:N x rate x stable OM portion= 35 lb N/ton x (15 lb C for each lb of N)
x 15 x 20% stable OM= 35 x 15 x 15 x 0.20= 1,575 lb/acre of stable carbon returned
to the soil= 0.08% increase in SOM.
It would take one application, every year for 13 years, to raise SOM 1%. If it was applied once every 3 years in a corn, soybean and wheat rotation the rotation would supply about 1,000 lb/acre so it would take about 24 years for a 1% increase.
How Much Tillage/Incorporation is Needed?
•Incorporating organic materials with excessive tillage will expose the soil to erosion and reduce or eliminate the benefits of the organic matter addition.
•Depending on the material, a minimal amount of tillage will be sufficient to incorporate most materials. Incorporating some of the material and leaving the rest on the surface is generally best.
•Full inversion mouldboard plowing will leave a layer of material at plow depth that will not readily decompose and may affect water movement through the soil.
204
Agronomy guide for field Crops

Greenhouse Gases and AgricultureGreenhouse gases (GHG) are atmospheric gases that reflect heat energy released by the Earth back to the surface. Carbon dioxide (CO2), methane (CH4) and nitrous oxide (N2O) are the three greenhouse gases associated with agriculture. Various management practices can release greenhouse gases into the atmosphere.
Carbon sequestration is the storage of carbon in the soil.•Practices such as good crop rotations, no-till, reduced tillage, planting trees and organic matter additions will increase carbon in the soil.
•Intensive tillage will speed the loss of carbon from the soil.
•Practices that reduce energy use will reduce the release of CO2 to the atmosphere.
Methane is released to the atmosphere from ruminant livestock, manure, manure storages and soils.
Nitrous oxide is released from manure storage and soil denitrification.
•Improving drainage and reducing the amount of nitrogen left in the soil post-harvest will reduce N2O emissions.
Preventing Soil DegradationAs agriculture has become more mechanized, and many rotations have become shorter and more intense, the health of many soils in Ontario has declined over the last 4 to 5 decades. Soil is vulnerable to degradation. Soil degradation is usually a combination of soil erosion and a decline in organic matter levels. Soils in this condition often end up on a downward spiral, as is shown in Figure 8–4, The downward spiral of soil degradation. Further loss of topsoil due to erosion reduces the nutrient content of the soil. The lost soil carries nutrients with it, so the topsoil layer becomes less fertile. Tillage of the soil begins to incorporate less fertile soil from below. As organic matter levels decline, the soil becomes less resistant
to erosion. The soil also becomes less resistant to soil compaction. As compaction increases, porosity is reduced and there is less air and less water movement through the soil. More runoff causes more erosion. As organic matter levels decline, the soil has less water-holding capacity. The cycle continues in a downward spiral of soil degradation.
Figure 8–4. The downward spiral of soil degradation.
Soil Erosion Soil erosion is a serious threat to the productivity of the soil. Soil erosion is a naturally occurring process, but farming practices have accelerated the rates of erosion. Erosion in agricultural fields involves the detachment and movement of soil particles within and outside the field. It results in:
• loss of topsoil• decreased crop yields (up to 50%)• increased cost of production• increased runoff and reduced water storage
Did you know? One ton/acre of topsoil lost to erosion — equivalent to the thickness of a piece of paper — contains approximately 1.8 kg (4 lb) of available nitrogen, 0.7 kg (1.5 lb) of phosphorus and 2.3 kg (5 lb) of potash
The changing climate threatens to increase the risk of soil erosion by wind and water. Warmer winters, with more fluctuating warm and cold spells, could result in less snow cover, leaving soils exposed longer between crops. Dry, bare soils are more vulnerable to wind erosion. The prediction of more frequent severe storms increases the potential for greater water erosion.
205
8. ManagIng For healthy soIls

Types of Soil Erosion Three types of soil erosion are water, wind and tillage.
1. Water erosion is the detachment and movement of unprotected soil particles by water. Common types of water erosion include sheet erosion and sedimentation, rill erosion, gully erosion and stream bank erosion. The Revised Universal Soil Loss Equation Version 2 (RUSLE2) can be used to estimate the long-term rate of soil erosion caused by rainfall and snowmelt from hill slopes on the farm. For more information, visit ontario.ca/omafra and search RUSLE2 for Ontario.
2. Wind erosion is the detachment and movement of soil particles by air currents or wind.
3. Tillage erosion occurs when tillage equipment lifts soil and moves soil particles forward, and gravity pulls it downhill. Tillage erosion causes about 80% of the soil erosion within a cultivated field. The use of tillage implements that move a lot of soil, such as the mouldboard or chisel plow on sloping fields, can remove much of the topsoil from upper slopes in a producer’s lifetime.
Practices to Prevent or Reduce Soil ErosionThere are a number of practices that can be used to prevent or reduce soil erosion, including:
• reduce tillage and leave crop residues on the soil surface
• plant cover crops to protect the soil• improve crop rotations by incorporating
perennial crops where possible• improve organic matter levels by adding
manure or other organic amendments• till across the slope
Reduce water erosion with these specific practices:
• install erosion control structures, such as water and sediment control basins, buffer strips, drop inlets, grassed waterways, diversion terraces, bank stabilization, etc.
• control stream bank erosion with the use of buffer strips and various erosion control structures
Reduce wind erosion with these specific practices:
• plant windbreaks• use wind strips• residue cover (especially in winter months)
Reduce tillage erosion on sloping land with these specific practices:
• avoid the use of implements that move a lot of soil, such as the mouldboard or chisel plow
• reduce tillage speed if possible• configure equipment to move less soil• perform shallower tillage
For more information, see the OMAFRA publications Best Management Practices: Soil Management, Best Management Practices: Field Crop Production and Best Management Practices: Controlling Soil Erosion on the Farm.
Soil Compaction Compaction is defined as increased bulk density and reduction in soil pore space. This occurs when the soil particles are forced closer together by the impact of raindrops, equipment or animals. The use of heavier tractors, combines and implements, particularly with earlier spring tillage, can cause problems under any tillage system. Soil compaction can reduce crop yields by up to 40%, depending on the severity of the compaction and the conditions during the growing seasons that follow.
Soils that have been poorly managed (excessive tillage and depleted organic matter levels) will have a structure that has deteriorated and aggregates that are not stable. This can be seen through increased compaction, decreased aeration and a reduction in water storage. This can have a negative impact on the soil biology. The reduction in the number of medium to large pores reduces the volume of soil available for air, water and populations of organisms that require large spaces in which to live. Three types of soil compaction can be found in the soil: surface crusting, tillage layer compaction and subsoil (deep) compaction. See Table 8–9, Types of soil compaction, for a description of each.
Practices to Prevent or Reduce Soil CompactionImplementing one or more of the following practices will help to alleviate or prevent soil compaction:
• plan timely tillage and field operations — stay off wet fields; soil should be at proper moisture conditions at tillage depth
• provide good drainage — install tile drainage in fields with variable drainage
206
Agronomy guide for field Crops

• implement longer crop rotations that include forages/cereals
• include forage crops — left in rotation for longer than one year
• use suitable tillage equipment — ensure it lifts and shatters soil (coulter chisel, cultivator) as opposed to pulverizing and grinding (disk)
• alternate tillage depth to prevent creation of tillage pans
• limit the amount of traffic including tillage across the field and implement controlled traffic (e.g., permanent traffic lanes) where possible
• restrict compaction — create a long, narrow “footprint” with tire arrangement, e.g., radials, large tires, duals, tracks, lower tire inflation
• limit axle loads to less than 5 t/axle
Soils with high organic matter contents, good internal drainage and good structure are less susceptible to compaction. For further information, see the OMAFRA website at ontario.ca/crops.
Table 8–9. Types of soil compaction Cause Impact
Surface crusting
Unprotected soil is dispersed by the action of raindrops and pushed into a thin, dense surface layer.
Soil is prone to high rates of runoff and water erosion.The surface becomes sealed, reducing water infiltration.When dry, a hard crust forms, which can delay or prevent seedling emergence.
Tillage layer compaction
Soil is eroded.Soil has low levels of organic matter.Heavy field equipment traffic results in soil compaction.
The layer is very dense, reducing water infiltration and the porosity of the soil.Root growth may be restricted.
Subsoil compaction
Pressure from a disc or plow on the soil below the tillage layer compacts the subsoil.Pressure from heavy field equipment with poor weight distribution results in compaction.
Water flow is restricted through the compacted layer.There will be little or no root growth through the compacted layer.
Soil Health: Measure to ManageOver time, the approach to soil management has an influence on the health of the soil. Assessing the soil health for each field, and taking steps to maintain or improve it, will help ensure high productivity. Maintaining soil health is a long-term process.
Some management practices will improve the soil and others will degrade it. The changes can occur relatively slowly, or quickly. How will the impact of past and current management practices on the soil be determined? Some measures are easy and relatively inexpensive to implement, while others require more effort and commitment. The following are a number of soil characteristics and simple assessments that can determine the status of each.
Soil Health Check
Soil StructureImportanceWater moves easily through a well-structured soil. A well-structured soil is very porous (lots of air space). Roots can more easily penetrate soils that have good structure. Poorly structured topsoil will crust, which can reduce crop emergence and water movement into the soil.
AssessmentSoil structure can be assessed by comparing the soil to the profiles in the section, Soil structure. Another way of assessing soil structure is by using the method described below.
• With a shovel, cut a square of soil about the width of the shovel and about 15 cm (6 in.) deep. (Photo 8–2a)
• Lift it up with the shovel. • Pick the soil up and drop it from waist height.• Compare how the soil breaks apart to the aggregation
of the clay loam soil shown in the photos, below — good (Photo 8–2b), moderate (Photo 8–2c) and poor condition (Photo 8–2d).
Photo 8–2a. Lift out the square of soil.
Photo 8–2b. Good condition.
Photo 8–2d. Poor condition.
Photo 8–2c. Moderate condition.
207
8. ManagIng For healthy soIls

Soil CompactionImportanceSoil compaction reduces the size of soil pores, restricting air and water movement through the soil. It also restricts root growth, limiting the plants’ ability to take up water and nutrients.
Assessment• Identify the areas of a field that have potential
compaction problems. • Choose a time when the soil is moist
(a couple of days after a good rain). • Using a tile probe or flexible rod, probe the affected
area to a depth of 50 cm (20 in.) and compare to a fencerow or unaffected area.
• Insert the probe into the ground at a slow, steady speed.
• Measure the force required to push the tip of the probe through the soil, with arms slightly bent to act as the pressure gauge (Photo 8–3a).
• Note the depths at which the tip of the probe requires more force to push it through the ground. These areas may indicate where roots cannot penetrate.
• Use a shovel to dig up the plants in the affected area and examine the roots.
• Compare the roots to healthy plants from an unaffected area. The compacted area will have plants with malformed/restricted roots (Photo 8–3b). Roots may be concentrated in the top 10–20 cm (4–8 in.) of the soil.
Note: When using a probe to compare compaction in different parts of fields, the areas measured must have similar moisture content for the results to be comparable.
Soil Organic MatterImportanceSoil organic matter plays a key role in soil structure, nutrient cycling and water-holding capacity, which can have significant impacts on crop growth.
Assessment• Soil samples taken for nutrient analysis to a depth of
15 cm (6 in.) can also be analyzed for organic matter. • Take samples as per the guidelines described
in Chapter 9, Soil Fertility and Nutrient Use, Soil Sampling, or from areas of concern within a field.
• Soil from a fencerow or woodlot can be analyzed for comparison.
Soil ColourImportanceThe colour of the surface soil (at the same moisture level) across a field is a visual indicator of soil organic matter levels. Lighter-coloured soil on the side of a knoll in a field can be an indicator of the loss of topsoil due to tillage erosion. Photo 8–4 shows lighter coloured knolls caused by tillage erosion which often results in poor crop growth. Tilling below the topsoil layer will mix in lower organic matter subsoil, causing those areas to appear lighter.
Photo 8–4. Tillage erosion appears as lighter coloured knolls and often results in poor crop growth.
Assessment:• Check whether the soil colour across the field is
fairly uniform.• Generally, the darker the soil, the higher the organic
matter level, if soil moisture levels are equal. • Areas of the field that were old wetlands will
usually be darker in colour, as they would have accumulated higher levels of organic matter prior to being drained.
Photo 8–3a. Identify parts of the field
with potential compaction problems by using a tile probe
or flexible rod.
Photo 8–3b. Impact of compaction on root growth.
208
Agronomy guide for field Crops

Soil LifeImportanceSoil life drives residue breakdown, nutrient cycling and organic matter stabilization (through aggregation). Macropores created by larger organisms aid in water movement through the soil. Organic matter plays a key role in the development of soil structure. A lifeless soil will not be productive.
Assessment• Count the number of large earthworm holes (middens,
as shown in the Photo 8–5a in a square metre. A good population is 10 or more per m2.
• Small earthworm populations can be assessed by digging up a shovelful of soil and breaking it apart to see how many earthworms are found. Earthworms help build soil structure and have a role in water movement through the soil (Photos 8–5a and 8–5b). The smell of a soil can also be an indicator of a healthy soil life population. A sweet, forest smell is good; a swampy smell indicates a less ideal situation.
Assessment• Observe the field to see if the soil stores
moisture well. • Observe the crop to see if it suffers during
moderate dry spells.
Plant GrowthImportancePoor crop growth could indicate a soil problem, if not caused by insects, diseases, weeds, the weather or some other circumstance.
Assessment• Observe the crop in the field, especially prior to
reproduction; look for differences in growth and in colour of the crop.
• The crop should be a dark green colour, and growth rapid and relatively uniform.
• Yield maps are also a good indicator of differences in crop growth in the field.
Root GrowthImportancePoor root growth, if not caused by insects or disease, is likely due to a soil factor. A plant root explores a large volume of soil for uptake of nutrients and water essential for plant growth.
Assessment• Carefully dig up the plant root. • Look for uniform distribution of the roots.• White roots indicate live roots. • Roots will grow down in the soil and on an angle out
from the base of the plant, in roughly a straight line. • Roots that take a sudden turn likely encountered a
compacted area.• Soil compaction will also restrict roots and result
in a shallow or restricted root system (Photos 8–6a and 8–6b).
Photo 8–5a. Earthworm midden.
Photo 8–5b. Earthworms help build soil structure and have a role in water movement
through the soil.
DrainageImportanceHow well a soil drains can affect the timeliness of field operations, water erosion, root growth, soil compaction risk and the amount of air in a soil.
Assessment• Observe the field to see if moisture drains away
quickly and if the soil is warm and ready for field operations in the spring.
• Observe the crop to see if excess moisture is reducing yield, except in wet years.
Water-Holding CapacityImportanceWater-holding capacity reflects the soil’s ability to supply moisture for crop growth. Crops grown in soils with good water-holding capacity will suffer less moisture stress during dry periods.
Photo 8–6a. and 8–6b. A plant root explores a large volume of soil for uptake of nutrients
and water essential for plant growth.
209
8. ManagIng For healthy soIls

Nutrient LevelsImportanceThe correct nutrient and pH levels in a soil are essential for good crop growth. Testing the levels is critical to being able to correct deficiencies.
AssessmentSee Chapter 9, Soil Fertility and Nutrient Use, for information on soil and tissue sampling and how to correct deficiencies.
The Foundations of Soil Management
The Importance of Organic Matter Soil organic matter is a very small component of the soil, but it plays a crucial role. Building and maintaining good levels of soil organic matter results in:
• higher-yielding, healthier crops• crops more tolerant to droughty conditions
and other stresses, such as insects and diseases• a reduced need for commercial fertilizer and lime
Soil organic matter exists in three pools in the soil, as illustrated in Figure 8–5, Soil organic matter pools.
Figure 8–5. Soil organic matter pools.
Active Soil Organic Matter (living and recently dead)• living portion includes bacteria, fungi, algae, plant
roots, insects, earthworms, etc., which help with the breakdown of residues and manures
• supplies nutrients as well as glues, for aggregate formation
• recently dead portion includes dead organisms, recently added manures, old plant roots and crop residues
• supplies food for organisms
Moderately Stable (dead)• recently decomposed organic material
Very Stable (very dead)• sometimes called humus• virtually untouchable, intimate part of the soil• holds on to some nutrients for slow release• can lessen drainage or compaction problems• can improve water retention in sandy soils
The Role of Organic MatterCrucial to many aspects of the soil and crop development, and with no single role taking precedence, organic matter:
• directly or indirectly influences the availability of nutrients obtained from the soil, playing an important role in many nutrient cycles
• improves the cation exchange capacity (CEC) of a soil by helping it hold on to positively charged ions such as calcium, potassium and magnesium, making them available to the crop (this is most important in loams and sands, where there is little clay to provide the negative charge to hold the cations)
• forms complex organic acids during the breakdown of organic materials, which also hold on to nutrients, and helps keep iron, zinc and manganese in the chelated or available form
• can buffer soil pH, slowing rapid changes in pH• darkens soil colour, helping warm the soil faster in
the spring• helps store carbon (there is four times as much
carbon in the soil as in plants)• stores nitrogen (almost all the nitrogen in soils
exists as part of the organic matter — bacteria and fungi convert the organic format to nitrate and ammonium, which can be used by plants)
210
Agronomy guide for field Crops

• maintains the water cycle by keeping the soil open and porous, so more water can soak into the soil (infiltration, rather than runoff, replenishes soil moisture during dry conditions and contributes to recharge of groundwater. This in turn increases the amount of water that plants can access from the soil, by increasing both storage capacity and rooting volume. It improves drainage of excess water through the soil)
• enhances porosity through the improvement in soil structure allowing air to enter the soil more easily
There is also some evidence that organic matter may help prevent phosphorus from being converted to forms that are unavailable to plants.
Soil Life A healthy soil is full of life. The organisms living in the soil play an important role in the health of the soil and of plants. Soil life includes bacteria, fungi, algae, protozoa, nematodes, earthworms, insects (ants, beetles, millipedes, etc.), larger animals (moles, rabbits, snakes, etc.) and plant roots.
Soil organisms play an important role:
• in the breakdown of organic residues and their incorporation into the soil — as organic materials are decomposed, nutrients become available to plants, humus is produced and soil aggregates are formed
• creating channels for water infiltration and better aeration• in moving surface residues deeper into the soil • in nitrogen fixation• in fighting plant pests, such as weeds, insects,
nematodes and diseases• stimulating root growth with substances produced
by micro-organisms
Soil StructureA well-structured soil is in a favourable condition for crop growth. Soil with good structure is porous and allows water to enter easily, as opposed to running off the surface, which makes it more available to plants and results in less erosion. A porous soil allows roots to exchange oxygen and eliminate carbon dioxide more easily, which aids root growth.
Soils and soil structure are formed through the actions of freeze-thaw cycles, wet-dry cycles, root growth, tillage, and the activity of soil animals and micro-organisms.
The active organic matter in a soil, the decomposing residues and the soil life all play a significant role in soil structure development and maintenance. Soil structure is developed from soil particles held together with clay, humus and the glues released from living and decomposing organisms. Good soil aggregation or structure can only be maintained with a continuous supply of organic materials, roots of living plants and soil organisms.
Below are photos showing the types of soil structures typically seen in Ontario soils.
Granular• soil breaks into small aggregates or crumbs (Photo 8–7)• usually found in the topsoil layer• ideal topsoil structure• very good water-holding capacity, lots of pore space,
good water movement and root growth
Photo 8–7. Granular.
Platy• soil particles are arranged in relatively thin
horizontal plates (Photo 8–8)• often found in the top 8 cm (3 in.) of long-term
no-till soils• coulters cutting through the soil will chop up
the plates to form a granular structure with time• can be found in compacted soil layers
211
8. ManagIng For healthy soIls

Photo 8–8. Platy.
Blocky• soil aggregates are cube-like or irregular in shape
(Photo 8–9)• usually found in the B horizon• promotes good root growth, aeration
Photo 8–9. Blocky.
Columnar or prismatic• soil particles are arranged vertically to form prisms
or pillar-like aggregates (Photo 8–10)• usually found in C horizons with higher clay content• the vertical areas between the aggregates allow root
growth and water movement
Photo 8–10. Columnar or prismatic.
StructurelessSingle grain: soil breaks into individual particles (i.e., low organic matter sands)
• structureless soils or soils with poor structure, especially soils with higher clay contents, are prone to crusting
• have little resistance to wind and water erosion• massive: soil breaks into large chunks (Photo 8–11)• soils with massive structure are compact, have very
few pores, restrict root growth and water movement
Photo 8–11. Structureless.
Soil structure is lost through a number of soil management practices:
• Excessive tillage breaks down soil structure. • Tillage along with poor rotations and little return
of organic matter to the soil results in a decline in soil organic matter — a critical factor in the development of soil structure.
212
Agronomy guide for field Crops

• practices that cause soil compaction, such as heavy loads, can also contribute to the loss of soil structure
• Soils with poor structure, will work up into large clods, which have few pores for root growth, water infiltration and air exchange
• Soils with poor structure also form crusts easily which can impede crop emergence and greatly reduce water infiltration while increasing runoff
Aggregate StabilityAggregate stability is a measure of how well soil aggregates resist falling apart when wetted and hit by rain drops. See Photo 8–12, Aggregate stability demonstrated with a good and poor crop rotation. Soils with good aggregate stability:
• have better soil structure • resist wind and water erosion • resist soil compaction • are unlikely to crust when hit by a pounding rain
Photo 8–12. Aggregate stability demonstrated with a good and poor crop rotation.
Soil Quality and Soil Genesis
Soil QualitySoil quality is a soil’s inherent capability to produce crops. The quality of a soil depends on a number of factors, such as the depth of soil over bedrock, texture, stoniness, and depth of topsoil. For example, a soil that has a very high sand content may not be very productive without irrigation. Similarly, a field with only 30 cm (1 ft) of soil over bedrock will have limited capacity to hold moisture and supply nutrients to a crop. Very little can be done to improve the productive capacity of both of these soils. On the other hand, a
loam soil with a deep topsoil layer that is free of stones can be a very productive soil and would be called a high quality soil. Canada Land Inventory mapping illustrates soil productivity and soil limitations (e.g., topography, stoniness). Refer to ontario.ca/agmaps.
Soil Formation The properties of Ontario’s soils are closely related to landforms that were created by glacial ice, meltwaters, glacial lakes and wind. Glaciers moved across all of Ontario, grinding rock into fine particles, and mixing and moving existing soil. As the glaciers retreated, they dropped soil materials from within the ice itself. The meltwater deposited gravel and sands as mixed layers. Flat beds of sand, silt and clay were deposited by lakes that formed from the ponding of melt waters. The soils were further distributed as strong winds moved across these landscapes. The soils of today were developed on these deposits.
Examples of the landforms include shallow-over-bedrock, muck or peat, till plain, end moraine, sand plain and clay plain. Additional information and photo examples of the landforms can be found in the OMAFRA publication Best Management Practices: Soil Management. See also the Soil Management page on the OMAFRA website at ontario.ca/crops.
Soils on the FarmThe soil on a farm may be all the same, or may be made up of many different soil map units. It can be useful to know what the soil type is for a particular field. The easiest way to determine the soil in a field is to look it up on a soil map. Soil maps are available through Service Ontario. Many soil maps also come with a report that provides more information about the soil. Soil type can also be determined using the AgMaps website at ontario.ca/agmaps.
Yield monitors have allowed producers to see how much that variability in soil characteristics can affect yields. Refer to Chapter 11, Precision Agriculture.
Soil Variability The soils of Ontario vary greatly in their make-up due to the scraping and mixing action of glacier movement. As the glaciers melted, wind, water and time contributed to further differences in soil development. Some soils are very shallow to bedrock, others have more than 100 m (328 ft) of overburden. The depth of topsoil varies as conditions for soil
213
8. ManagIng For healthy soIls

formation varied. Soils vary from region to region, from farm to farm and within fields. Observe a soil excavation to see the variation in the depth of soil horizons shown in Figure 8–6, Horizon variability in a soil profile. This natural variation often occurs over very short distances.
Producers have been aware of this soil variability for years and have tried to improve areas that were less productive.
Figure 8–6. Horizon variability in a soil profile.
214
Agronomy guide for field Crops