field characterization of vertical bromide transport in a fractured glacial till
TRANSCRIPT

Field characterization of vertical bromide transport in a fracturedglacial tillWilliam G. Harrar & Lawrence C. Murdoch &
Bertel Nilsson & Knud Erik S. Klint
Abstract A study of the fracture distribution, hydraulicproperties, groundwater levels and the transport ofbromide was conducted to characterize vertical transportin the oxidized and reduced zones of a fractured glacialtill. Detailed vertical profiles of groundwater levels andsolute concentrations were obtained over a 4.5-yearperiod. Vertical migration occurred at several time scales,as a low concentration front was rapidly transported atrates of 100–500 m/year ahead of a slower moving mainplume, which advanced at rates of 0.2–0.8 m/year. Con-centrations in the leading edge of the plume displayed ahigh degree of spatial variability over short verticaldistances through day 1,000. Late in the test, the influenceof matrix diffusion became apparent as concentrationpatterns developed from being irregular to more uniformdistributions. Calculations show that the mass within thelow concentration plume front accounts for less than 1%of the total solute mass. Simulation of the breakthroughcurves using a simple one-dimensional advection-dispersionmodel of transport in porous media indicates that verticaltransport is dominated by advection. Furthermore, theresults indicate that vertical transport of solutes in oxidizedand reduced zones of the till can be adequately simulatedusing an equivalent porous media.
Résumé Une étude de la distribution des fractures, despropriétés hydrauliques, des niveaux de l′eau souterraine
et du transport des bromures a été menée afin decaractériser le transport vertical dans les zones oxydéeset réduites d’un dépôt glaciaire fracturé. Des profilsverticaux détaillés des niveaux de l′eau souterraine et desconcentrations des solutés ont été obtenus sur une périodede 4.5 années. La migration verticale apparaît sur différ-entes échelles de temps ; un front de faible concentration aété rapidement transporté à une vitesse de 100 à 500 m/anà l′avant d’un panache plus important moins rapide sedéplaçant à une vitesse de 0.2 à 0.8 m/an. Les concen-trations des solutés à l′avant du panache ont montré unhaut degré de variabilité spatiale sur de courtes distancesverticales jusqu’au jour 1000. Plus tard dans le test, l′influence de la diffusion de la matrice est devenue plusapparente dès lors que les concentrations sont passéesd’une distribution irrégulière à une distribution plusuniforme. Les calculs montrent qu’au sein du panache defaible concentration, la masse compte pour moins de 1%de la masse totale de solutés. La simulation des courbes derestitution au moyen d’un simple modèle à une dimensiondu transport par advection dispersion en milieu poreuxindique que le transport vertical est dominé par l′advection. De plus, les résultats indiquent que le transportvertical des solutés dans les zones oxydées et réduites dudépôt glaciaire peut être adéquatement simulé en utilisantun milieu poreux équivalent.
Resumen Se realizó un estudio de la distribución defracturas, propiedades hidráulicas, niveles de agua sub-terránea y transporte de bromuro para caracterizar eltransporte vertical en las zonas reductoras y oxidadas deun conglomerado glacial fracturado. Se obtuvieron perfilesverticales detallados de niveles de agua subterránea yconcentraciones de solutos en un periodo de 4.5 años.Ocurrió migración vertical en varias escalas temporales amedida que un frente de baja concentración fue rápida-mente transportado a tasas de 100 a 500 m/año por delantede una pluma principal de movimiento más lento, la cualavanzó a tasas de 0.2 a 0.8 m/año. Las concentraciones desoluto en el borde frontal de la pluma mostraron un altogrado de variabilidad espacial en distancias verticalescortas hasta el día 1000. Al final de la prueba se hizoevidente la influencia de difusión intersticial a medida quese desarrollaron patrones de concentración de tipoirregular a distribución más uniforme. Los cálculosmuestran que la masa dentro del frente de la pluma de
Received: 11 February 2006 /Accepted: 7 May 2007Published online: 1 June 2007
© Springer-Verlag 2007
W. G. Harrar :B. Nilsson :K. E. KlintGeological Survery of Denmark and Greenland,Øster Voldgade 10, DK-1350, Copenhagen K, Denmark
L. C. MurdochDepartment of Geological Sciences,Clemson University,340 Brackett Hall, Clemson, SC, USA
Present address:W. G. Harrar ())DONG Energy,Agern Allé 24–26, 2970, Hørsholm, Denmarke-mail: [email protected].: +1-45-45170873Fax: +1-45-45171281
Hydrogeology Journal (2007) 15: 1473–1488 DOI 10.1007/s10040-007-0198-5

baja concentración corresponde a menos del 1% de lamasa total de soluto. La simulación de curvas de avanceusando un modelo simple de transporte advección-dispersión en una dimensión en medio poroso indica queel transporte vertical está controlado principalmente poradvección. Además, los resultados indican que el trans-porte vertical de solutos en zonas reductoras y oxidadasdel conglomerado glacial puede simularse adecuadamenteusando un medio poroso equivalente.
Keywords Glacial till . Fractured confining unit . Tracertest . Mass flux . Travel times
Introduction
Glacial tills were once thought to provide a low-permeability blanket that protected aquifers from contam-inants over large areas of northern Europe and NorthAmerica. However, it is now recognized that ubiquitousfractures can greatly reduce the protective capacity of tillsbecause they increase the hydraulic conductivity by up toseveral orders of magnitude and provide pathwaysthrough an otherwise tight barrier (Hendry 1982; Kelleret al. 1986; Fredericia 1990). The discovery of contami-nants in aquifers provided the first indication that theoverlying tills were leaking (Jørgensen and Fredericia1992; Fenlon and Moore 1998). Numerical simulationsshow that vertical transport of near-surface contaminantsalong a few fully penetrating fractures can severely impact thewater quality of underlying aquifers (Harrison et al. 1992).These suspicions were confirmed by field and laboratorytests demonstrating that colloids and some solutes could betransported rapidly along fractures (McKay et al. 1993a;Hinsby et al. 1996; Jørgensen et al. 1998).
A common feature of surficial glacial tills is a majordecrease in fracture density across the boundary betweenoxidized and underlying reduced zones (Hendry 1982;Ruland et al. 1991; McKay and Fredericia 1995; Klint andGravesen 1999). Typically, this results in a significantdecrease in the bulk hydraulic conductivity and degree offracture connectivity at depth within the reduced zone.These results also indicate that the vulnerability ofunderlying aquifers to contamination from near surfacesources is largely controlled by the flow and transportcharacteristics of the reduced zone. However, the behaviorof flow and transport within the reduced zone of glacialtills has received little attention.
The few published investigations of controlled field-scale tracer tests in glacial tills have largely focused upontransport within the shallow oxidized zone, and most ofthese tests were performed under forced-gradient con-ditions. A series of trench-to-trench tracer tests conductedby D’Astous et al. (1989) and McKay et al. (1993a)documented the horizontal transport of colloids at rates of2–>5 m/day, while solutes were transported at rates of0.01–0.07 m/day. The retardation of solutes relative to thecolloids is attributed to matrix diffusion. At the same site,a chloride plume originating from a landfill migrated
horizontally within the shallow oxidized zone at rates of0.01–0.027 m/day (McKay et al. 1998). Sidle et al. (1998)conducted a vertical tracer experiment in which thebreakthrough of a conservative tracer introduced slightlybelow the ground surface was observed at 4 m depthwithin 11 h after initiation of the test. In a similar test,McKay et al. (1999) infiltrated a conservative tracer and abacteriophage slightly below ground surface and moni-tored vertical transport at various depths within theoxidized till. The bacteriophage was transported verticallyat rates up to 1.5 m/day, whereas the conservative tracerwas transported at rates of 0.007–0.05 m/day. Common tothe controlled tracer tests, is the observed increase in thespatial variability of initial tracer arrival and concentra-tions with increasing travel distance and long tailing ofsolute breakthrough curves indicative of transport throughcomplex fracture networks and matrix diffusion.
The presence of hydraulically active fractures at depthin reduced tills has largely been deduced from groundwa-ter level monitoring, hydraulic tests and geochemicalindicators of recent recharge (Hendry 1982; Ruland et al.1991; Jørgensen and Fredericia 1992). Observations in alarge excavation documented the occurrence of free-phaseDNAPL in fractures to 9 m depth within a reduced till,providing direct evidence of transport along fractures(Jakobsen and Klint 1999). In a forced-gradient test,Nilsson et al. (2001) documented that a conservativetracer was transported through a 13-m thick glacial till toan underlying sand aquifer within 21 days after the tracerwas applied at the ground surface. Solutes where alsoobserved to be rapidly transported to a sand lens within thereduced zone of a glacial till during a short-term tracer testconducted under ponding conditions by Jørgensen et al.(2004). While these investigations have documented thatsolutes can be transported at environmentally significantrates along fractures within reduced glacial tills, plumedevelopment within the reduced zone has not been studied.This is largely because the published accounts of tracertests in the reduced zone of glacial tills were conductedover relatively short time periods (weeks), and themonitoring of tracer breakthrough relied upon thesampling of effluent either in an underlying aquifer orsandy zones within the till rather than within the reducedzone itself.
This paper presents the results of a detailed investigationcarried out in a fractured till at the Danish Institute ofAgricultural Sciences research station (Flakkebjerg) locatedabout 100 km south-west of Copenhagen on the island ofZealand. Activities performed at the site include fracturemapping in large excavations, hydraulic testing, and themonitoring of groundwater levels and a conservative solutetracer over 4.5 years. An innovative monitoring systeminstalled at the site provided a detailed vertical profile ofhydraulic heads and solute concentrations within both theoxidized and reduced zones. The objective of this paper is tointegrate these observations into a conceptual model thatdescribes the effects of the fracture system, hydraulicgradients and the bulk hydraulic properties on verticaltransport within the oxidized and reduced zones of a surficial
1474
Hydrogeology Journal (2007) 15: 1473–1488 DOI 10.1007/s10040-007-0198-5
glacial till. Solute concentration data are also modeled usinga simple theoretical analysis in order to identify thedominant processes governing vertical transport.
Methods
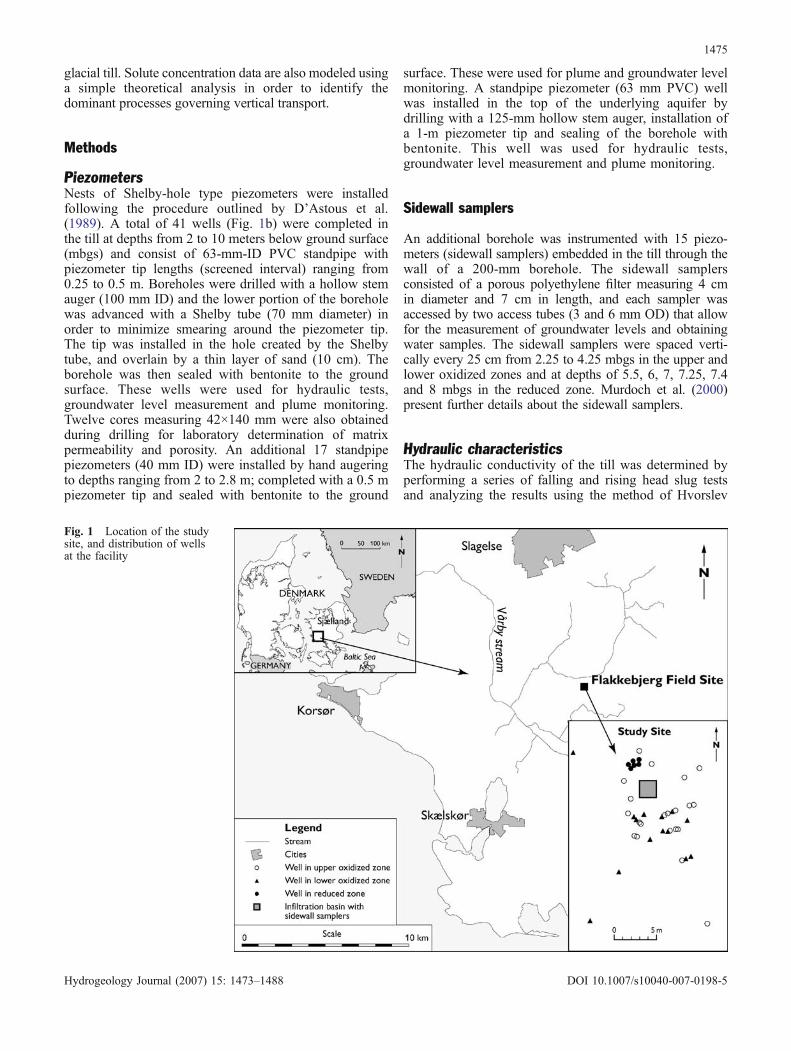
PiezometersNests of Shelby-hole type piezometers were installedfollowing the procedure outlined by D’Astous et al.(1989). A total of 41 wells (Fig. 1b) were completed inthe till at depths from 2 to 10 meters below ground surface(mbgs) and consist of 63-mm-ID PVC standpipe withpiezometer tip lengths (screened interval) ranging from0.25 to 0.5 m. Boreholes were drilled with a hollow stemauger (100 mm ID) and the lower portion of the boreholewas advanced with a Shelby tube (70 mm diameter) inorder to minimize smearing around the piezometer tip.The tip was installed in the hole created by the Shelbytube, and overlain by a thin layer of sand (10 cm). Theborehole was then sealed with bentonite to the groundsurface. These wells were used for hydraulic tests,groundwater level measurement and plume monitoring.Twelve cores measuring 42×140 mm were also obtainedduring drilling for laboratory determination of matrixpermeability and porosity. An additional 17 standpipepiezometers (40 mm ID) were installed by hand augeringto depths ranging from 2 to 2.8 m; completed with a 0.5 mpiezometer tip and sealed with bentonite to the ground
surface. These were used for plume and groundwater levelmonitoring. A standpipe piezometer (63 mm PVC) wellwas installed in the top of the underlying aquifer bydrilling with a 125-mm hollow stem auger, installation ofa 1-m piezometer tip and sealing of the borehole withbentonite. This well was used for hydraulic tests,groundwater level measurement and plume monitoring.
Sidewall samplers
An additional borehole was instrumented with 15 piezo-meters (sidewall samplers) embedded in the till through thewall of a 200-mm borehole. The sidewall samplersconsisted of a porous polyethylene filter measuring 4 cmin diameter and 7 cm in length, and each sampler wasaccessed by two access tubes (3 and 6 mm OD) that allowfor the measurement of groundwater levels and obtainingwater samples. The sidewall samplers were spaced verti-cally every 25 cm from 2.25 to 4.25 mbgs in the upper andlower oxidized zones and at depths of 5.5, 6, 7, 7.25, 7.4and 8 mbgs in the reduced zone. Murdoch et al. (2000)present further details about the sidewall samplers.
Hydraulic characteristicsThe hydraulic conductivity of the till was determined byperforming a series of falling and rising head slug testsand analyzing the results using the method of Hvorslev
Fig. 1 Location of the studysite, and distribution of wellsat the facility
1475
Hydrogeology Journal (2007) 15: 1473–1488 DOI 10.1007/s10040-007-0198-5

(1951). The hydraulic conductivity and total porosity ofthe matrix was determined in the lab on core samplescollected during drilling. The hydraulic conductivity wasdetermined as a specific liquid permeability in a specialHassler core holder. The total porosity was determinedusing a double-chambered Helium porosimeter withdigital readout. Both methods are described in detail inRosenbom et al. (1998). A pumping test conducted byJones (1999) was designed to determine the hydraulicdiffusivity of the till.
Tracer testIn preparation for the tracer test, an infiltration basinmeasuring 2×2 m was excavated to 2-m depth around theborehole containing the sidewall samplers. A column ofglacial till measuring 0.5×0.5 m was left intact in thecenter of excavation surrounding the borehole containingthe sidewall samplers. A 10-cm thick layer of gravel wasplaced in the bottom of the excavation on top of whichdrainpipe (100 mm ID) was installed. A PVC standpipe(15-cm ID) was connected to the drainpipe to allow for theintroduction of freshwater and tracer to the infiltrationbasin. The excavation was backfilled with gravel and ashed was constructed over the basin to inhibit theinfiltration of precipitation. This setup allows for theintroduction of tracer directly into the upper oxidizedzone, bypassing the bioturbated unsaturated zone, in orderto investigate the vertical and horizontal transport ofsolutes that make it to the water table from the root zone.
An aqueous KBr solution (C0=10,000 mg Br–/L) wasintroduced into the infiltration basin in December 1997.The high bromide concentration was chosen to increasethe likelihood of detecting early arrivals at depth in the tilland underlying aquifer. The density of the tracer wasapproximately 4% greater than that of the ground waterand it is possible that this density contrast caused thedownward velocity of the tracer to be greater than that ofthe ambient flow. However, the choice of initial tracerconcentration was a compromise between the requirementof being able to detect low concentrations of bromide atdeeper levels in the reduced zone and effects of densitydriven flow along the plume front. A slug of tracer(3,000 L) was infiltrated over a 22-day period with aninfiltration rate of 34 mm/day, followed by the infiltrationof 8,000 L of freshwater over an additional 158 days(~12.7 mm/day). Groundwater levels inside the basin weremaintained at about 20 cm over ambient groundwaterlevels during infiltration. This head difference is well withinthe range of observed, naturally occurring fluctuations ingroundwater levels. Thus, the experiment was conductedunder enhanced flow conditions for 180 days, and undernaturally varying conditions for the remainder of the test.Originally, the tracer test was designed to characterize thevertical transport of a solute slug in the till over a 6-monthperiod, and the freshwater was infiltrated in order to maintainsteady-state flow conditions during this period. The decisionto monitor the long-term development of the plume wasmade after the 6-month period had expired.
MonitoringGroundwater levels were measured over a 3-year period instandpipe piezometers in the aquitard and the underlyingaquifer using electric drop lines and over shorter timeperiods using pressure transducers and data loggers.Groundwater levels in the sidewall samplers were mea-sured periodically using an electric drop line consisting ofa 3-mm (OD) coaxial cable. Rainfall and barometricpressure were also monitored onsite.
Plume development was monitored over a 1,743-dayperiod. Vertical migration of the bromide tracer in the oxidizedand reduced zones was monitored by sampling the sidewallsamplers using suction to lift water through the 3mmdiametertubing. This results in small stagnant volumes (20–40 ml) thatwere purged prior to retaining a sample for analysis. Thehorizontal migration of the bromide plume in the oxidized tillwas monitored by periodically sampling the standpipepiezometers installed around the infiltration basin. Bromideconcentrations were measured using an ion-selective probe(Phoenix Electrode Co., USA) with a detection limit ofapproximately 3 mg Br-/L and a Dionex 500 ion chromato-graph with a detection limit of 0.02 mg Br-/L. Goodagreement was found between concentrations measuredusing these two techniques. Analytical precision of bromidedetection was ±2% with the ion selective probe and ±1%with the ion chromatograph.
Field site and geology
The Flakkebjerg site is located at the Danish Institute ofAgricultural Sciences research station located about100 km southwest of Copenhagen on the island of Zealand(Fig. 1). The geology of the area consists of a thicksequence of Pleistocene glacial and interglacial sedimentsunderlain by Palaeocene limestone and clay. The field siteis located on an undulating till plain of Late Weischelianage that covers an area of approximately 250 km2.
The average annual precipitation is approximately620 mm of which about 360 mm is lost by evapotranspi-ration. Interflow and discharge through drains is estimatedto be approximately 210 mm/year, and recharge to theaquifer underlying the till is estimated to be 40–74 mm/year(Troldborg 2004), which is representative of the range ofestimated recharge to regional aquifers in central andeastern parts of Denmark. Precipitation and evapotranspi-ration vary throughout the year with the greatest rechargeoccurring from late autumn through the winter.
StratigraphyThis study focuses on a till sequence that extends 10–11 mbgs and overlies a regional sand aquifer deposited inthe late Weischelian (18,000–14,000 years BP). Theaquifer is a 10-m-thick layer of fine to medium-grainedglacio-fluvial Tsands deposited on an outwash plain. Theoverlying till consists of basal lacustrine sediments overlainsuccessively by a lower till, meltwater deposits and an uppertill, according to detailed mapping in two 5.5-m-deep
1476
Hydrogeology Journal (2007) 15: 1473–1488 DOI 10.1007/s10040-007-0198-5

excavations and cores from 32 borings at the site (Klint andGravesen 1999).
The basal lacustrine sediments consist of 1–2 m ofinterbedded, dark olive gray clay, silt and fine-grainedsand. The “lower till” is a 6–8-m-thick unit composed ofmassive, CaCO3-enriched sediment composed of clay(15%), silt (40%), sand (38–42%) and gravel (3–7%).The lower till is a loam, according to the United StatesDepartment Agriculture classification based on grain sizedistribution, and internal sediment structures suggests itwas deposited beneath a glacier as a lodgement till. Theboundary between the oxidized and reduced zones occursin the lower till at a depth of roughly 4.5 m and is markedby a color change from dark olive grey to olive brown.
The lower till is overlain by a meter-thick unit of olivebrown, stratified sandy clay that contains deformed,discontinuous beds of sand and clay. This is termed the“meltwater unit” and is interpreted to have been depositedin fluvial and lacustrine settings.
The top of the stratigraphic column consists of an“upper till”, 1–1.5 m thick, containing clay (10–15%), silt(20–25%), sand (57–63%) and gravel (3–7%). The uppertill is an olive brown sandy loam with gray mottling. TheCaCO3 content of lower part of this unit is roughly 20%,whereas the upper part is completely reworked bybioturbation and devoid of CaCO3. The soil horizon is0.5-m-thick and consists of organic rich, bioturbatedsandy, silty clay with minor gravel and cobbles.
FracturesThe formation of fractures at the field site can be related tothe depositional history of the tills during two glacieradvances/retreats and subsequent climatic changes during
the Quaternary period. The fractures are separated into foursystems: (1) large subvertical fractures related to the oldestglacier advance or interstadial climatic influence; (2)subhorizontal fractures related to subglacial drag/shearduring a glacial advance from northeast and in an initialstage of a younger glacier advance from southeast; (3)normal faults related to subglacial loading during a latestage of the youngest glacier advance; (4) minor desiccationand freeze-thaw fractures related to post-glacial climaticinfluence (Klint and Gravesen 1999). Tills of glacial origincover a large part of northern Europe and North Americaand many of these deposits have fracture characteristicssimilar to those observed at the Flakkebjerg site (Krügerand Kjær 1999 and McKay and Fredericia 1995).
The orientation, density and extent of the fractures varysignificantly with depth (Fig. 2). No single fracture systempenetrates the entire thickness, but the different systemscrosscut to create an interconnected network throughoutthe till. Fractures in system 1 are subvertical and cutdownward from the base of the oxidized zone presumablyto the underlying aquifer. The average fracture spacingdecreases with depth from 0.14 m at 3 mbgs toapproximately 1 m at 5.5 mbgs. The strike of thesefractures is roughly E–W. Reddish brown halos envelopthese fractures, suggesting that oxidizing water has flowedthrough them.
System 2 fractures are gently dipping features thatoccur from 1.5 m to greater than 5.5 mbgs and cut acrossthe system 1 fractures. The dips of these fractures rangeup to 25°, and their spacing is at most 0.5 m within theupper 5.5 m. Fractures in the upper part of this interval,between 1.5 and 3.5 mbgs, are nearly horizontal and,within the meltwater sediments from 2 to 3 mbgs,spacings are particularly close (~0.05 m).
Depth of fracturemapping D
epth
(m
bgs)
Dep
th (
mbg
s)
0
0 5
2
4
6
8
1010 15 20 25
System 1 FracturesSystem 2 FracturesSystem 3 FracturesSystem 4 Fractures
(Frac/m)
0
2
4
6
8
10
12
Soil Horizon
Upper Till
Meltwatersediments
Lower Till
LacustrineDeposits
Sand Aquifer
?
Sediment Fractures Fracture Intensity
Bioturbated(System 4)
Upper Oxidized(Systems 2 & 3)
Lower Oxidized(Systems 1, 2 & 3)
Reduced(Systems 1 & 2)
Fracture Zones
Fig. 2 Stratigraphic column and distribution of fractures
1477
Hydrogeology Journal (2007) 15: 1473–1488 DOI 10.1007/s10040-007-0198-5

System 3 consists of high-angle fractures and normalfaults in the oxidized zone. These fractures strike NE–SWand are spaced roughly 0.5 m apart. They terminate at thebase of the oxidized zone near 4 mbgs and their upperlimit is roughly 1.5 mbgs. These are dominant fractureshaving wider oxidation halos and a higher density of rootson fracture surfaces than the other fracture systems.
System 4 fractures are subvertical and extend from theground surface to approximately 2 mbgs. Strikes of thesefractures are highly variable and many appear to bepolygonal. Fracture spacing is less than 0.1 m. Worm androot holes are also common at shallow depths with system4 fractures.
The fracture network consists of three sets of verticalfractures, systems 1, 3 and 4, and one shallowly dippingset, system 2, that cuts across them. Detailed mapping in adeep excavation showed that the extents of the verticalfractures systems are limited, but the upper extent ofsystem 1 overlaps with the lower extent of system 3, andthe upper extent of system 3 overlaps with the lowerextent of system 4. The strikes of the vertical fracturesystems differ, so some of the vertical fractures of onesystem will locally intersect those of the adjacent system.However, the extent of these intersections is limited, andprobably represents only a contribution to the connectivityof the network. The gently dipping fractures of system 2provide the major connectivity between the verticalfracture systems at the site.
Hydrostratigraphic unitsSix hydrostratigraphic units can be defined based ongeologic features and hydrologic behavior. The upperthree units are in the oxidized zone and include thebioturbated, upper oxidized, lower oxidized zones. Theunderlying reduced zone includes an upper, middle andlower hydrostratigraphic unit.
The “bioturbated unit” extends from the ground surfaceto 1.5 mbgs and has a high density of wormholes, rootholes and vertical desiccation fractures (system 4). It
consists of the soil horizon and top of the upper till, andCaC03 is absent in the matrix.
The “upper oxidized unit” extends from about 1.5–3mbgs, and consists of the upper till and meltwater depositszone. It has the highest density of fractures, including theupper part of system 3 and the lower part of system 4, whichare crosscut by closely-spaced, sub-horizontal fractures insystem 2. The hydraulic conductivity of the entire oxidizedzone ranges from 4×10⁻⁸ to 4×10⁻⁷ m/s, with an averagevalue of 2×10⁻⁷ m/s.
The “lower oxidized unit” extends from the base of theupper oxidized zone (3 mbgs) to the top of the reducedzone (4–4.5 mbgs) and consists of the uppermost part ofthe lower till. It contains subvertical fractures fromsystems 1 and 3, cut by shallowly dipping fractures insystem 2. The lower oxidized zone is distinguished fromthe upper zone by a decrease in the density of gentlydipping fractures. Nevertheless, the hydraulic conductiv-ity of the lower oxidized zones is similar to that of theupper zone, at least according to the results of slug tests(Fig. 3).
The reduced zone extends from the bottom of the loweroxidized zone to the top of the underlying aquifer atroughly 10 mbgs. The upper contact of the reduced zoneis marked by a gradational color change from brown togray between 4.0 and 4.5 mbgs. Hydraulic conductivitydecreases across the contact from an average value of2×10-7 m/s in the oxidized zone to 3×10⁻⁸ m/s in the upperreduced zone. The hydraulic conductivity of an intervalfrom 7 and 8 mbgs is less than that in the overlying andunderlying material, and this low K zone will be referredto as the “middle reduced unit”. This low K unit wasdetected by slug tests, and it also is apparent in hydraulichead and concentration measurements made during thetracer test. The composition of the middle and upperreduced units are similar in core samples, and it appears thatthe difference in hydraulic conductivity results from changesin the connectivity of horizontal and vertical fracture sets. Ingeneral, the reduced zone includes system 1 and system 2fractures, but the middle reduced zone was below the bottom
0
2
4
6
8
10
10-10 10-9 10-8 10-7 10-6 10-5
Hydraulic conductivity, K (m/s)
Dep
th (
mbg
s)
matrixbulk
Soil
Upper Till
Meltwatersediments
Lower Till
LacustrineDeposits
Sand
ZoneSediment
Bioturbated
UpperOxidizedLower
Oxidized
UpperReduced
MiddleReduced
LowerReduced
Aquifer
Fig. 3 Hydraulic conductivity as a function of depth from field slug tests (bulk K) and lab samples (matrix K)
1478
Hydrogeology Journal (2007) 15: 1473–1488 DOI 10.1007/s10040-007-0198-5

of the excavation so the details of the connectivity offractures in this zone could not be observed. The “lowerreduced zone” includes lacustrine sediments below 9 mbgs,and has K values of about 6×10⁻⁸ to 3×10⁻⁷ m/s.
Hydraulic conductivity of the matrix was determined inthe laboratory and values are in the range of 1×10⁻¹⁰ to2×10-10 m/s. These values are two to three orders ofmagnitude less than bulk K values obtained from slugtests. This suggests that fractures occur throughout the till.Matrix porosity was also determined from laboratorysamples, and it decreases from 0.20 to 0.44 in theoxidized zone to 0.17 to 0.25 in the reduced zone.
Results
The behavior of the tracer was evaluated by firstcharacterizing the flux of water and then evaluatingtransport. Vertical profiles of hydraulic heads were usedto calculate hydraulic gradients, and vertical fluxes werecalculated using Darcy’s Law. The rate of advance of thetracer plume was determined by establishing the positionof the leading edge of the plume, and the position of thecenter of mass as functions of time.
The time series tracer data were simulated using asimple one-dimensional advection-dispersion model inorder to shed light upon the processes controlling verticaltransport in the till. These results were integrated into aconceptual model describing vertical transport in the till.
Hydraulic heads and water fluxGroundwater levels fluctuated seasonally during the studyperiod, attaining their highest elevations within thebioturbated zone during the winter, and their lowest levelswithin the lower oxidized zone in the autumn (Fig. 4). Themagnitude of annual groundwater level fluctuationsdecreased with depth from over 2.5 m in the oxidizedzones to 1.5 m in the reduced zone and underlying aquifer.
Head fluctuations also occurred on a shorter timescale,with piezometric levels increasing abruptly by as much as0.5 m in response to rainfall during the winter and spring.These head perturbations traveled through the till to the
underlying aquifer in less than 1.5 days, according todetailed tests described by Jones (1999). The short-termresponse to rainfall seems to change with season,however, because the record from conventional piezo-meters (Fig. 4) shows few fluctuations in the summer andautumn when piezometric levels were falling. The detailsof this effect are complicated, however, because adifferent response occurs in the sidewall piezometers,where head perturbations apparently resulting from rain-fall events are observed throughout the year.
Head profilesVertical profiles of hydraulic head maintained roughly thesame shape while differing in magnitude through most ofthe annual cycle of head variation in the aquifer, accordingto 27 measurements from the sidewall piezometers over1,000 days (Fig. 5). In general, the oxidized zone wascharacterized by uniform heads with mild gradients atsome times, and spatial variability with steep localgradients at other times. The high spatial variabilityappears to be the spatial manifestation of the short-termtemporal fluctuations accompanying rainfall events shownin the hydrograph when water levels are high (Fig. 4).
Hydraulic heads drop with depth and the gradient inthe reduced zone is steeper than in the overlying oxidizedzone (Fig. 5). The head gradient is particularly steepacross the middle reduced unit. Head perturbations withinthe reduced zone, inferred to be related to rainfall events,appear to be dampened compared to those in the oxidizedzone, although significant perturbations were observed inthe reduced zone. For example, the hydraulic head is
Aquifer
Gro
undw
ater
leve
l (m
bgs)
3 m6 m
7.5 m9 m
10 m
11 m
0
1
2
3
4
5
6Sep 99 Nov 99 Jan 00 Mar 00 May 00 Jul 00 Sep 00
Fig. 4 Groundwater levels in D-series piezometers as a function oftime
Depth (m)
2 4 6 8 10 12
Hy
dra
uli
cH
ead
(m)
27
28
29
30
31
32
33
OxidizedUpperreduced
Lower reduced
Mid
dle
Aquif
er
Fig. 5 Hydraulic head (m above sea level) profiles in the till overthe range of values of head in the aquifer. Filled circles: 9/18/2000;open triangles: 30/7/1998; filled squares: 25/6/1998; open dia-monds: 18/11/1999; filled triangles: 25/2/2000; open circles: 11/3/1999
1479
Hydrogeology Journal (2007) 15: 1473–1488 DOI 10.1007/s10040-007-0198-5

anomalously high at the top of the middle reduced zone inthe profile marked by filled circles (Fig. 5).
The hydraulic head profile when the head in the aquiferis particularly low appears to differ from the profiles whenthe aquifer head is higher. The low-head profile shown asfilled circles in Fig. 5 is characterized by a steepening ofthe head gradient in the oxidized zone and a flattening inthe middle reduced zone. This produces a head gradientthat is nearly uniform through the till when water levels inthe aquifer are low.
Head gradientsHead gradients were determined by regression using thehead measurements within a particular hydrostratigraphicunit. Average hydraulic head gradients ranged from a lowof 0.09 within the oxidized unit to a high of roughly 1.0 inthe middle reduced unit (Table 1). The average gradientswithin the upper and lower reduced units were 0.36 and0.45, respectively. For comparison, the gradient wasroughly uniform across the entire till and equal to 0.45when the head in the aquifer was low (circles in Fig. 5).Variability in the head gradients is σ=0.12–0.23, exceptwithin the intermediate reduced zone where the variabilityis greater with σ=0.45 (Figs. 5 and 6). Much of thisvariability appears to occur when head distributionscontaining non-linear perturbations are fit by linearregression.
The hydrograph data (Fig. 4) and the head profiles(Fig. 5) suggest that the till during high heads behavesdifferently when the heads are falling or low. Groundwaterlevels throughout the till fluctuate in response to short-term rainfall events when the hydraulic heads are high,whereas they decline uniformly during falling or low-headconditions. However, head gradients determined byregression fail to show seasonal periodicity (Fig. 6). Thissuggests that the seasonal effects that produced variationsin the hydrograph and head profiles have a limited effecton the head gradients. It is expected that the headgradients do vary seasonally, but the seasonal change ingradient is less than the variability resulting from short-term perturbations accompanying rainfall events.
Volumetric fluxVertical fluxes were determined as the product ofhydraulic head gradient and hydraulic conductivity. Itseems reasonable to use the lower estimate of thehydraulic conductivity for each unit because this valuewill limit the flux through the unit. This gives aremarkably consistent range of 0.24–0.28 m/year for theflux through the upper three units. Confidence intervals(95%) based on variability of the head gradient measure-ments are less than 0.05 m/year in the upper and middlereduced unit. The uncertainty in the oxidized zone is
Table 1 Vertical hydraulic head gradients, conductivities and calculated fluxes
Hydrostratigraphicunit
Monitoringwell series
Verticalgradient mean
Standard deviation/coeff.of variation
K min×10-7 m/s
K max×10-7 m/s
qv m/year
95% Con.m/year
Oxidized Sidewall -0.09 0.13/1.5 1.00 2.50 0.27 0.16Upper reduced Sidewall -0.37 0.12/0.3 0.20 0.35 0.24 0.03Middle reduced Sidewall -0.99 0.45/0.4 0.09 0.30 0.28 0.05Lower reduced D -0.46 0.22/0.5 0.60 3.00 0.86 0.16Entire till D -0.38 0.03/0.08 0.25 0.59 0.30 0.01
Abbreviations: Coeff. coefficient; Con. confidence intervals
Days365 730
Ver
tica
l H
ead G
radie
nt
-1.5
-1.0
-0.5
0.0
Fig. 6 Vertical hydraulic head gradient as function of time from the slope of the best-fit line through sidewall piezometer data from theoxidized zone (squares), upper oxidized zone (downward triangles), middle reduced zone (black triangles), and lower reduced zone (openupward triangles). The gradient from the upper and lower D piezometers in the till is represented by the large gray triangles. Dashed linesare the mean values for each zone, and solid lines are one standard deviation
1480
Hydrogeology Journal (2007) 15: 1473–1488 DOI 10.1007/s10040-007-0198-5

greater, 0.16 m/year, as a result of the larger variability inhead gradient in this zone.
The flux through the lower reduced unit is predicted tohave been several times greater than the overlying units,but this is due to a larger hydraulic conductivity estimatedfor that unit. It seems likely that the hydraulic conductivityof the lower reduced unit was over estimated because ofthe proximity of the underlying aquifer. The bulk K foreach unit ranged over roughly a factor of three, so thefluxes could be as much as three times larger than thevalues given above and in Table 1.
Vertical flux across the entire till was calculated byanother approach that used only two measurements. Thehead gradient was determined using one piezometer atthe top of the till and another at the top of the aquifer, andthe hydraulic conductivity of the till was determined as theharmonic mean of the values obtained at different depths(Fig. 3). By comparison, each of the other gradients wascalculated using best-fit lines through between 3 and 10head measurements at different depths. The average headgradient across the entire till is −0.38. The standarddeviation obtained using this approach is remarkablysmall, only 0.03. Flux determined using the simplemethod is 0.3 m/year, which was calculated using theminimum bulk hydraulic conductivity (Kmin=2.5×10
-8 m/s)for the entire till sequence. Interestingly, the simplemethod for determining vertical flux gives values that areessentially the same as the more detailed measurements inindividual zones.
The piezometer data indicate that the average flux ofwater through the reduced zone of the till is 0.28 m/year,using the low end of the ranges of hydraulic conductivitymeasurements. The 95% confidence interval for the fluxestimates in the upper and middle reduced zones, and forthe overall till is 0.05 m/year or less (Table 1). Seasonalvariations in flux probably do occur, but they are smalland obscured by the fluctuations caused by individualrainfall events. This suggests that the seasonal variation influx is less than 0.05 m/year.
Vertical transportVertical transport of bromide was determined using therelatively closely spaced sidewall samplers along withsome conventional samplers. The initial concentrationof the bromide tracer was C0=10,000 mg Br-/L andthis value will be used to scale the results to a relativeconcentration.
Concentration profilesThe concentration increased throughout the till within1–2 days after the tracer was applied (Fig. 7). Backgroundconcentration increased from 5×10⁻⁵ to 10-4 to more than0.01 throughout the upper oxidized zone (3 m) within1 day. The tracer rapidly penetrated much deeper than this,with concentrations of 10-3 at the tops of both the upperreduced unit (4 m) and middle reduced unit (7.25 m)within 2 days. These three depths where tracer was
observed during the first few days would remain as active“reservoirs” of tracer throughout the test.
The primary reservoir of tracer moved downward intothe lower oxidized zone during the first year of the test(Fig. 7a). During the first month of the test, tracerconcentration decreased to background values ahead ofthe primary reservoir, but it increased with depth as asecondary reservoir of tracer accumulated at the top of thereduced zone. Concentrations decreased beneath thesecondary reservoir, but increased again at a tertiaryreservoir on the top of the middle reduced unit (Fig. 7a).
Tracer was replaced with freshwater on day 22 andconcentrations in the trailing edge of the primary tracerreservoir began to diminish soon thereafter (Fig. 7a).Nevertheless, the front of the primary reservoir and theconcentration and width of the secondary reservoircontinued to increase. Concentrations at greater depth inthe tertiary reservoir decreased to roughly backgroundvalues soon after freshwater was applied, but theyincreased and fluctuated after that. Concentrations at the
Depth (m)
Upperreduced
C/C
o
10-5
10-4
10-3
10-2
10-1
100
initial day 2 day 33 day 131 day 393
2 3 4 5 6 7 8
C/C
o
10-6
10-5
10-4
10-3
10-2
10-1
100
day 393 day 985 day 1360 day 1728
Middlereduced
Upperoxidized
Loweroxidized
a
b
Fig. 7 Normalized concentration profiles during approximately thefirst a year since tracer release, and b 4.5 years since release
1481
Hydrogeology Journal (2007) 15: 1473–1488 DOI 10.1007/s10040-007-0198-5

top of the middle reduced unit continued to exceed thosein the underlying and overlying samplers.
Total massThe mass of tracer beneath the source area wasdetermined by integrating the concentration profiles as afunction of depth at different times. This gives the totalmass of tracer per unit area in plan view. The total massincreased abruptly to 0.4 gm/m2 and then decreased to0.2 gm/m2 during the first 270 days. Freshwater wasinjected into the tracer delivery pit until day 180, and thereduction in mass during the first 270 days probably isbecause the tracer was spread laterally in the oxidizedzone by the fresh water. The total mass was variable inthe range of 0.2 gm/m2 during the next 2 years, but then itdecreased from 0.21 to 0.15 gm/m2 during the last 2 yearsof the test.
It is possible that the total mass in the plume decreasedduring the last 2 years because tracer was being trans-ported through the till to below the sampler at 8 m.Alternatively, tracer could have been transported laterally,just as it was during the first 270 days.
The mass of tracer in the three reservoirs wasdetermined separately and scaled to the total mass at each
measurement time. These results show the mass in theoxidized zone decreases while that in the reduced zoneincreases, and the two masses are equal after approxi-mately 4 years (Fig. 8b). Interestingly, the rates of changeof normalized masses in the two reservoirs are fast for thefirst 730 days, the time when the total mass is decreasing.However, the rates of change of the normalized masses areroughly uniform after day 730, when the total mass in thesystem decreases.
The normalized mass in the lower reservoir, at the topof the middle reduced unit, remained extremely smallthroughout the experiment. The normalized mass in-creased during the test (even though the scale in Fig. 8masks this change) and reached a maximum of 0.005.
BreakthroughBreakthrough curves show the peculiar behavior of themultiple tracer reservoirs (Fig. 9). Concentrations in theoxidized unit increased and then fall (open circles inFig. 9), with the arrivals becoming increasingly delayedand peaks increasingly diminished with depth. Theconcentrations in the reduced zone behaved similarly(filled circles in Fig. 9), except that the concentrationsarrive at the top of the reduced zone early in the test andremained greater than concentrations in overlying sam-plers in the lower oxidized zone (e.g. large open circlesfrom the sampler at 3.5 m). For clarity, only a few of thedata sets are shown in Fig. 9.
This behavior seems to be repeated at the top of themiddle reduced zone, where tracer arrived early in the testand concentrations remained roughly equal to 0.001during the first year. The concentration fell to 10-4 duringthe second year, however, perhaps as a result of dilutionby the freshwater. Concentration increased to 4×10⁻³ andthen diminished to roughly 5×10⁻⁴ for the duration of thetest. Within the middle reduced unit, at 8 mbgs, tracerremained at background concentrations during the first
Fig. 8 a Total mass per unit area in the plume below the source(filled circles) as function of time. The shaded rectangle shows theduration of water injection; and b distribution of mass among thedifferent reservoirs shown as mass in each reservoir normalized tothe total mass in the plume at that particular time
2 m
3.5 m4 m
5.5 m
6 m
7.25 m
Time (days)
0 365 730 1095 1460 1825
C/C
o
10-4
10-3
10-2
10-1
100
Fig. 9 Concentration as functions of time and depth at selectedsidewall samplers. Water injection ended on day 180. The shadingis the tie lines between the data points
1482
Hydrogeology Journal (2007) 15: 1473–1488 DOI 10.1007/s10040-007-0198-5

year but it increased thereafter and all the samples fromthe middle confining unit (7.25, 7.4 and 8 mbgs)contained roughly the same concentration of tracer afterday 1,000, although these data are not shown.
Rate of advanceThe rate of advance of the tracer plume was determined byestablishing the position of the leading edge of the plume,and the position of the center of mass as functions of time.The times when tracer concentrations of C=0.01 andC=0.001 first arrived at particular locations were deter-mined from the breakthrough curves for each sampler. Theresults show the arrivals of C=0.001 at the three hydro-stratigraphic contacts occurs within a few days after thestart of the test (Fig. 10). These data give transportvelocities of 1–5 m/day for low concentrations of tracer toreach all three of the reservoirs at contacts within the till.
The arrival time data can be misleading, however,because by no means did the tracer arrive everywherewithin the till within a few days. In general, arrival timesincreased with depth below the top of each reservoir.For example, the tracer arrived at 2.75 m within 2 days,but it took another year for the C=0.01 front to penetrateto 3.5m. Moreover, concentrations reached 4mwithin a fewdays, but it would take roughly 4 years for the concentrationfront to reach 5.5 m. (Fig. 10). The concentrationsbelow the top of the middle reduced zone increased, butthey remained below C=0.001, so the curve can only beestimated in this region.
The arrival times can be fitted with straight lines withslopes that are approximately the same for the twoconcentration levels, but that differs between the twohydrostratigraphic units. The velocity of the tracer frontcan be determined as the inverse of the slopes of theselines. The velocity of the front of the primary tracer
reservoir was approximately 0.9 m/year, whereas thesecondary reservoir advanced at roughly 0.4 m/year.These velocities appear to be roughly constant. Forcomparison, the initial arrival of tracer moved at velocitiesof 500–1,000 m/year.
The movement of the tracer can also be evaluated bydetermining the center of mass as a function of time. Thiswas done by integrating the concentration profiles todetermine the first moment of the concentration at 33times during the test. The center of mass was calculatedfor the total plume, as well as the plumes in the oxidizedand the reduced zones. During approximately the first400 days, the center of mass of the total plume advancedat approximately 0.75 m/year as the plume migratedvertically in the upper oxidized zone (Fig. 11). The rate ofadvance slowed and advanced at approximately 0.2 m/year after roughly day 500, once the plume reached thelower oxidized zone and advanced at a near constant ratethereafter (Fig. 11). The center of mass of the plume in theoxidized zone was essentially the same as the total plumeduring the early, relatively rapid advance. After day 500,the center of mass of the oxidized plume lagged behindthe total center of mass which had migrated from theupper to the lower oxidized zones, yet the two centers ofmass advanced at about the same rate. Interestingly, therapid advance of the small amount of tracer that initiallycomposed the reduced plume caused its center of mass tobe quite low and then move upward. This upwardmovement essentially stopped and the location of thecenter mass in the reduced zone remained constant once
Arrival time (days)
0 365 730 1095 1460 1825
Dep
th(m
)
2
4
6
8
C=0.01
C= 0.001
Oxid
ized
Up
per
red
uce
d
Fig. 10 Depth ofC=0.01 and C=0.001 front as a function of arrivaltime. Dashed lines are best fits to C=0.01 data in the oxidized andreduced zones. The shaded rectangle shows the duration of waterinjection
Time (days)
0 500 1000 15000.0
0.5
1.0
1.5
2.0
2.5
Total
OxidizedUpper reducedC
ente
r o
f M
ass
(m)
Fig. 11 Displacement of the center of mass (below 2.2m depth) ofthe total plume, and the plumes in the oxidized and reduced zonesas functions of time. Dashed reference line is equivalent to slope0.18 m/year
1483
Hydrogeology Journal (2007) 15: 1473–1488 DOI 10.1007/s10040-007-0198-5

the total center of mass had migrated downward from theupper oxidized zone into the lower oxidized zone. Late inthe test, however, after day 1,400, the center of mass ofthe reduced plume moved at the same rate as the othercenters of mass, roughly 0.2 m/year. This coincides withthe migration of the total center of mass to the bottom ofthe lower oxidized zone.
Bromide concentrations at a depth of 11 m at the top ofthe underlying aquifer remained at background levels(0.08 mg Br-/L or C/Co=0.000008) until day 297, whenconcentrations there increased by a factor of 2. Thisapparently was the first arrival of the tracer in the aquifer,and it is roughly two orders of magnitude later than thefirst arrival at 7 m depth in the till. This large difference inarrival times could result from a significant reduction invelocity at the bottom of the aquitard, however, a morelikely explanation is that it is due to the relativeperformance of the samplers. Water samples wereobtained from the top of the aquifer using a conventionalpiezometer with a 1-m-long screen embedded in the sand2 m north and slightly hydraulically upgradient of thearray of sidewall samplers. Tracer recovered from theconventional piezometer in the aquifer is probablydiluted much more than when it is recovered from thesidewall samplers. Tracer reaching the aquifer as a diluteand fast plume, and then flowing along a single streamtube, could be diluted by an order of magnitude or morewhen it reached the conventional monitoring well in theaquifer below the infiltration basin. An alternativeexplanation could be that either the solute reached theaquifer through a fracture as depicted in Fig. 12d andtherefore was not sampled directly by the well, or theremight have been a lateral hydraulic gradient that couldhave sent the Br plume away from the well once itreached the aquifer. Concentrations in the aquifercontinued to increase slightly during the remainder ofthe test, and the highest values were a factor of 5 greaterthan background levels.
Periodic fluctuations in concentration were super-imposed on the systematic changes resulting from bulkdownward transport. Bromide concentrations throughoutthe till varied in response to groundwater level fluctua-tions at the seasonal and rainfall event scales. Maximumannual concentrations in the lower oxidized zone
occurred during the late summer months of all 3 yearsof the test. Groundwater levels were also lowest at thesetimes. Concentrations in the upper oxidized zonedecreased abruptly as the water levels increased eachyear in early winter. In contrast, the highest concen-trations in the reduced zone occurred during winter andspring when groundwater levels were high. Concentra-tions in both the lower oxidized and reduced zonesvaried erratically with temporary drops in concentrationobserved in samples collected immediately after periodsof heavy rainfall.
Theoretical analysisThe bromide breakthrough curves were simulated using asimple one-dimensional advection-dispersion model oftransport in porous media. The objective of the modelingexercise was to identify the dominant processes governingthe bulk vertical transport of solutes in the till. The tracerrelease was simulated by assuming that the concentrationis known beneath the bromide release pit, and that thisconcentration is given by
Co ¼ Dp; t < tf ð1Þ
Co ¼ Cpe�l t�tfð Þ; t < tf ð2Þ
where tf is the time when clean water was flushed intothe bromide pit. A solution to the boundary conditionsgiven above was obtained by superimposing analyticalsolutions given on pages 11 and 19 of van Genuchten andAlves (1982).
The data were analyzed using a Levenberg-Marquardtalgorithm to estimate the parameters that minimizeresiduals between predicted values and the concentrationtime series for each sampler. All of the solute break-through curves were fitted simultaneously, yielding asingle set of parameter estimates that describe the bulkvertical transport in the till. The parameter estimationprocess produced functions that fit the data fairly well,with an average r2 value of 0.7. The results show that the
Fig. 12 Conceptual model of the Flakkebjerg tracer test. a Initial fracture network relative to hydrostratigraphic units; b initial applicationof tracer; c early fracture dominated transport; d late matrix diffusion dominated transport
1484
Hydrogeology Journal (2007) 15: 1473–1488 DOI 10.1007/s10040-007-0198-5

retardation is relatively low, indicating that the retardationof bromide in the till is minor. The average velocity is0.002 m/day. The vertical flux was estimated to be about7×10-4 m/day. This gives a value of about 0.3 for theeffective porosity when using the average velocity. Theestimated effective porosity is within the range of matrixporosity values measured in the laboratory.
The average dispersion coefficient is 8.9×10⁻⁴ m2/day.The diffusion coefficient of Br in water is 1.7×10⁻⁴ m2/day,and using a tortuosity of 0.3 gives an effective diffusionconstant of 5×10⁻⁵ m2/day.
The ratio of the longitudinal dispersion to the molec-ular diffusion in this system is 18. The Peclet number wasdetermined using the depth of the sampler below thebottom of the bromide source (2 m) as the characteristiclength. This gives an average Peclet number of 3.5 andindicates that advection and dispersion are more importantthan diffusion in the transport of bromide through the till.The average dispersivity is 2 m.
The results of the theoretical analysis indicate thatvertical transport of the tracer is dominated by advection.Furthermore, the results indicate that vertical transport ofsolutes in the till appears to be adequately simulated usingan equivalent porous media (EPM).
Discussion
Much has been learned as a result of research during thepast 20 years about how compounds are transportedthrough tills, but novel monitoring methods were usedduring the Flakkebjerg test that further refine this under-standing. The conceptual model that results from this testrecognizes that fast transport paths exist along fracturesthrough the till, but significant solute reservoirs occur atinterfaces along these paths and affect the overall mass flux.
The flow of water and transport of solutes appear to becontrolled by the details of the fracture network in the till.The Flakkebjerg till includes at least three sets of verticalfractures contained within different depth ranges and withdifferent strikes. The bottom of one fracture set overlapsslightly with the top of the underlying set, so a few of thevertical fractures may locally intersect those in anoverlying or underlying set. However, most of theconnectivity between vertical sets of fractures appears tooccur through horizontal fractures that cut across them.System 3 fractures overlap with system 1 fractures at adepth of roughly 4 m, which is location of the secondarytracer reservoir at the contact between the oxidized andreduced zones. Fracture systems 4 and 3 overlap at a depthof approximately 2 m, which is where the tracer wasreleased. A fourth set of vertical fractures probably occursbelow approximately 7 m and is responsible for thebehavior of the middle reduced zone.
An idealized representation of the fracture networkconsists of different sets of vertical fractures of restrictedheight linked together by horizontal fractures (Fig. 12a).Pathways that traverse the till follow a vertical fracturedownward to its lower termination, and then turn along a
horizontal fracture and progress laterally until intersectinganother vertical fracture from an underlying set. Somepathways probably extended through the entire tillthickness at Flakkebjerg, but only after encountering atleast two intervals, at 4m and 7m, requiring horizontaltransport from one set of vertical fractures to another.These are intervals where tracer concentrations wereobserved to increase as mass accumulated ahead of themain plume. As a result, the regions where horizontalfractures connect vertical fractures act as reservoirs oftracer.
It appears that within a day or two after release, thetracer moves along a pathway and starts to accumulate inreservoirs associated with horizontal connecting fracturesat 4 and 7m (Fig. 12b). It seems likely that some tracerprobably also reached the aquifer at this time. Tracer wasfirst detected in the aquifer nearly 300 days later, this ismost likely because the fast path through the till onlyallowed minute amounts of tracer mass to penetrate andthis mass was diluted to less than detectable concen-trations until day 297.
The main reservoir of tracer progressed downward inthe upper oxidized zone at a velocity of about 0.8 m/yearduring the first year. However, transport along verticalfractures continued to actively move tracer ahead of thefront of the main reservoir, and increase the mass stored inthe reservoir at 4 m (Fig. 12c). The tracer was chased withfreshwater, and rainfall provided additional freshwater,which caused tracer concentrations to decrease at somelocations. The rate of advance of the main reservoirslowed to approximately 0.2 m/year after roughly 500 daysand advanced at a near constant rate thereafter. Concen-trations in the lower oxidized and reduced zones displayeda high degree of spatial variability over short verticaldistances through day 1,000.
Late in the test, the effects of matrix diffusion becomereadily apparent as concentrations patterns throughout thetill develop from being irregular to smoother, moreuniform distributions (Fig. 12d). The bulk of solute masswithin the oxidized and upper reduced zones moves at thesame rate of about 0.2 m/year and this velocity is similarto the downward volumetric water flux. The fast transportpaths remain active, but account for a minute fraction ofthe moving mass.
Simulation of the solute breakthough curves with asimple one-dimensional advection-dispersion modelshows that transport of the main solute plume isdominated by advection. The results indicate that transportrates of the main solute plume are controlled by the bulkhydraulic conductivity and an effective porosity, which isslightly less than the lowest values measured for thematrix. These results also indicate that transport of thebulk of the solute mass in the oxidized and reduced zonescan be simulated using an equivalent porous media (EPM)modeling approach and average hydraulic conductivities.Previous studies have shown that EPM methods areapplicable for simulating solute transport within theoxidized zone of tills where the fracture density is high,but are less effective in simulating solute transport at
1485
Hydrogeology Journal (2007) 15: 1473–1488 DOI 10.1007/s10040-007-0198-5

depth in tills where fractures are widely spaced such as inthe reduced zone (Sidle et al. 1998, Jørgensen et al. 1998,McKay et al. 1993a, b). The results of this study appear todiffer from those of previous investigations by indicatingthat the EPM method may be applicable for simulatingsolute transport in the reduced zone even where the fracturespacings are relatively large (0.5–1 m). However, it isimportant to note that in this study, the vertical transport ofa solute was monitored over a period of years, whereas asthe tracer tests performed by Sidle et al. (1998), Jørgensenet al. (1998) and McKay et al. (1993a, b) were conductedover much shorter time periods (weeks to months).
The results of this study suggest that the effects ofdiscrete fractures are important when explaining theresults of short-term tracer tests such as those cited above,but transport over time scales of years can be describedusing the EPM approach. This suggestion is supported byHelmke et al. (2005), who performed forced gradienttracer tests on intact columns of till in the laboratory andanalyzed the results using numerical models. Theirsimulations with EPM and discrete fracture models arevery similar, and both can explain the tracer results underlonger time scales and realistic hydraulic gradients.However, they also show that EPM assumptions can beinappropriate for short temporal scales (days to months)and at a length scales where fracture spacing is greaterthan the experimental test volume (or smaller than REV)such as in the reduced zone of tills.
The conclusion about the applicability of EPM modelsto transport through tills is apparently at odds withJørgensen et al. (2004), who conducted 3-month-longforced-gradient laboratory experiments with flow ratesranging between 11 and 49 mm/day and samples that were0.5 m long. Jørgensen et al. (2004) concluded that discretefracture, rather than EPM, numerical models wererequired to explain the results of their lab experiments.However, the scales of the flow rates, sample lengths, anddurations of the Jørgensen et al. (2004) experiments differfrom the in-situ scales of the Flakkeberg test by 1–2 ordersof magnitude. Those scale differences suggest that theresults of Jørgensen et al. (2004) are inapplicable to thefield study at Flakkebjerg.
The solute tracer in the till at the Flakkebjerg site wasobserved to migrate vertically at two different rates as a low-concentration front advanced ahead of the more slowlymoving main plume. These observations are consistent withnumerical studies of flow and transport in low-permeabilityfractured media which show that fractures control theposition of the leading edge of solute plumes and bulkhydraulic properties control the bulk movement of solutemass (Sudicky and McLaren 1992; Harrison et al. 1992;Therrien and Sudiky 1996). These modeling studies alsoshow that the mass flux in fractures is very small comparedto that of the matrix, indicating that the slow moving mainplume in fractured glacial tills represents the greatest threatto water quality in underlying aquifers. The results of thisstudy indicate that the EPM modeling approach isappropriate for simulating the long-term migration ofsolutes through glacial tills to underlying aquifers.
The rapid early arrivals of tracer at depth in the reducedzone may have been influenced by density effectsassociated with initial concentrations of the solute tracer.The initial concentrations were necessary to produce adistinct signal when the tracer arrived at the samplers.Analyses to evaluate the effects of tracer density areplanned for future work.
The Flakkebjerg tracer test benefited from advances inmonitoring and characterization techniques to produce datathat refines the conceptual model for solute transport throughtill. Sidewall samplers (Murdoch et al. 2000) were emplacedat vertical spacings that were closer than could be achievedusing vertical wells. Moreover, each sampler was embed-ded in the formation instead of contained within a wellbore,and the purge volume of the sidewall samplers was a smallfraction of short-screened sampling wells. As a result, thesidewall samplers provided higher spatial resolution, morerepresentative concentration measurements, and disruptedthe formation less than conventional samplers.
Summary and conclusions
The results of the tracer test show that solutes migratedvertically at several different time scales during the courseof the experiment. Concentrations increased throughoutthe upper oxidized zone within the first day of the test,while a low concentration front was rapidly transported todepth within the lower oxidized and reduced zones at ratesof 1–5 m/day. The depths where the tracer was observedduring the first few days remained as active reservoirs oftracer throughout the test. During the first year of the test,the center of mass of the main plume in the upper oxidizedzone migrated vertically at a rate of about 0.8 m/year,while the center of mass in the reduced zone movedslightly upward and then moved very slowly downward.Concentrations in the lower reservoirs fluctuated showingthe continued rapid transport of solutes to depth in the till.Concentrations in the underlying aquifer increased abovebackground levels after about 300 days and continued toincrease throughout the test, confirming connectivity ofthe fracture network across the thickness of the till. Therate of advance of the main plume decreased to about0.2 m/year as it descended into the lower oxidized zoneafter about 500 days and remained constant thereafter.Concentrations in the lower oxidized and reduced zonesdisplayed a high degree of spatial variability over shortvertical distances through day 1,000. Late in the test, theeffects of matrix diffusion become readily apparent asconcentrations patterns throughout the till developed frombeing irregular to smoother, more uniform distributions.The bulk of solute mass within the oxidized and upperreduced zones moves at the same rate of about 0.2 m/yearand this velocity is similar to the downward volumetricwater flux. The fast-transport paths remain active, butaccount for a minute fraction of the moving mass.
This investigation provides some of the first detailedvertical profiles of groundwater levels and solute transportwithin the oxidized and reduced zones over a time period of
1486
Hydrogeology Journal (2007) 15: 1473–1488 DOI 10.1007/s10040-007-0198-5

several years. The study benefited from detailed mapping atthe site, which revealed the various geometries andconnectivities of the fracture systems. The fracture networkis idealized as consisting of different sets of verticalfractures of restricted height linked together by horizontalfractures which create vertical hydraulic connectivity acrossthe entire thickness of the till. The conceptual modelrecognizes that fast-transport paths exist along fracturesthrough the till, but significant solute reservoirs occur atinterfaces along these paths and affect the overall mass flux.
Simulation of the vertical transport of the solute tracerusing a simple one-dimensional advection-dispersionmodel shows that advection is the dominant processgoverning the bulk transport of the solute mass and thattransport rates are controlled by the average hydraulicconductivity of the till. This is consistent with thecalculations showing that the mass in the plume front,which arrived in the lower reduced zone at early times andpersisted for the duration of the test, accounts for less than1% of the total mass. These results support the hypothesispresented by Helmke et al. (2005) that solute transport inglacial tills over a time scale of years can be reliablysimulated using an EPM modeling approach.
Tills provide important barriers to the contamination ofunderlying aquifers, and predicting the effectiveness ofthese barriers is important for managing groundwaterresources in glaciated areas. The EPM modeling approachused here is based on bulk hydraulic properties that can beobtained from relatively simple field studies. The impli-cations are that it may be feasible to combine the EPMapproach with simple field data to develop reliablepredictors of the rates at which tills in different areas willallow contaminants to reach underlying aquifers.
Acknowledgements The project was financed by the DanishGovernment under the National Strategic Environmental ResearchProgramme (SMP96). Additional funding was given by theGeological Survey of Denmark and Greenland (GEUS). The authorsgratefully acknowledge J. C. Refsgaard for his constructivesuggestions for improving the manuscript and the field, laboratoryand office assistance of P. Jensen, E. Clausen, J. Morthorst, K.Rasmussen and R. Hodges. M. Helmke, D. Daly and K-P. Seiler arealso thanked for their critical and insightful reviews of themanuscript. The opinions expressed in this paper are solely thoseof the authors and do not necessarily reflect those of DONG Energy.
References
D’Astous AY, Ruland WW, Bruce, JGR, Cherry JA, Gillham RW(1989) Fracture effects in the shallow groundwater zone inweathered Sarnia-area clay. Can Geotech J 26:43–56
Fenlon, JM, Moore, RC (1998) Transport of agrichemicals togroundwater and surface water in a small central Indianawatershed. J Environ Qual 27:884–894
Fredericia J (1990) Saturated hydraulic conductivity of clayey tillsand the role of fractures. Nord Hydrol 25:119–132
Harrison B, Sudicky EA, Cherry JA (1992) Numerical analysis ofsolute migration through fractured clayey deposits into under-lying aquifers. Water Resour Res 28(2):515–526
Helmke MF, Simpkins WW, Horton R (2005) Simulating conser-vative tracers in fractured till under realistic timescales. GroundWater 43(6):877–889
Hendry MJ (1982) Hydraulic conductivity of a glacial till inAlberta. Ground Water 20(2):162–169
Hinsby K, McKay LD, Jørgensen PR, Lenczewski M, Gerba CP(1996) Fracture aperture measurements and migration ofsolutes, and immiscible creosote in a column of clay-rich till.Ground Water 34(6):1065–1075
Hvorslev MJ (1951) Time lag and soil permeability in ground-waterobservations. US Army Corps Eng Bull 36:50
Jakobsen PR, Klint KES (1999) Fracture distribution and occur-rence of DNAPL in a clayey lodgement till. Nord Hydrol 30(4/5):285–300
Jones EH (1999) Hydraulic characterization of a fractured clayeytill, western Zealand, Denmark. MSc Thesis, Department ofGeology, University College of London, UK
Jørgensen PR, Fredericia J (1992) Migration of nutrients,pesticides and heavy metals in fractured clayey till. Géo-technique 42:67–77
Jørgensen PR, McKay LD, Spliid NH (1998) Evaluation of chlorideand pesticide transport in a fractured clayey till using largeundisturbed columns and numerical modeling. Water ResourRes 34(4):539–553
Jørgensen PR, Helstrup T, Urup J, Seifert D (2004) Modeling ofnon-reactive solute transport in fractured clayey till duringvariable flow rate and time. J Contam Hydrol 68 (3–4):193–216
Keller CK, van der Kamp G, Cherry JA (1986) Fracturepermeability and groundwater flow in clayey till near Saska-toon, Saskatchewan. Can Geotech J 23:229–240
Klint KE, Gravesen P (1999) Fractures and biopores in Weichselianclayey till aquitards at Flakkebjerg, Denmark. Nord Hydrol 30(4/5):267–284
Krüger J, Kjær KH (1999) A data chart for field description andgenetic interpretation of glacial diamict and associated sedi-ments: with examples from Greenland, Iceland and Denmark.Boreas 28:386–402
McKay LD, Fredericia J (1995) Distribution, origin, and hydraulicinfluence of fractures in a clay-rich glacial deposit. Can GeotechJ 32:957–975
McKay LD, Gillham RW, Cherry JA (1993a) Field experiments in afractured clay till. 2. Solute and colloid transport. Water ResourRes 29(12):3879–3890
McKay LD, Cherry JA, Gillham, RW (1993b) Field experiments ina fractured clay till. 1. Hydraulic conductivity and fractureaperture. Water Resour Res 29(4):1149–1162
McKay LD, Balfour DJ, Cherry JA (1998) Lateral chloridemigration from a landfill in a fractured clay-rich glacial deposit.Ground Water 36(6):988–999
McKay LD, Fredericia J, Lenczewski M, Morthorst J, Klint, KES(1999) Spatial variability of contaminant transport in a fracturedtill, Avedøre, Denmark. Nord Hydrol 30(4/5):333–360
Murdoch LC, Slack W, Harrar W, Siegrist RL (2000) Embeddedsidewall samplers and sensors to monitor the subsurface.Ground Water 38(5):657–664
Nilsson B, Sidle RC, Klint KES, Bøggild CE, Broholm K (2001)Mass transport and scale-dependent hydraulic tests in aheterogeneous glacial till-sandy aquifer system. J Hydrol243:162–179
Rosenbom A, Aamand, J, Friis K, Lindgreen H, Springer N (1998)Laboratory setups and experimental results: progress report. In:Pore-to-core scale-up studies of the transport properties of organicpollutants with natural attenuation. Geological Survey of Den-mark and Greenland Report No. 104, GEUS, Copenhagen
Ruland WW, Cherry JA, Feenstra S (1991) The depth of fracturesand active ground-water flow in a clayey till plain insouthwestern Ontario. Ground Water 29(3):405–417
Sidle RC, Nilsson B, Hansen M, Fredericia J (1998) Spatiallyvarying hydraulic and solute transport characteristics of afracture till determined by field tracer test, Funen, Denmark.Water Resour Res 34(10):2515–2527
1487
Hydrogeology Journal (2007) 15: 1473–1488 DOI 10.1007/s10040-007-0198-5

Sudicky EA, McLaren RG (1992) The Laplace transform Galerkintechnique for large-scale simulation of mass transport in discretelyfractured porous formations. Water Resour Res 28(2):499–514
Therrien R, Sudicky EA (1996) Three-dimensional analysis ofvariably-saturated flow and transport in discretely-fracturedporous media: model development and illustrative examples. JContam Hydrol 23(1–2):1–44
Troldborg L (2004) The influence of conceptual geological modelson the simulation of flow and transport in Quaternary aquifersystems (in English). PhD Thesis, Geological Survey of Den-mark and Greenland Report No. 107, GEUS, Copenhagen
van Genuchten MT, Alves WJ (1982) Analytical solutions of theone-dimensional convective-dispersive solute transport equa-tion. US Department of Agriculture, Tech Bull 1661:151
1488
Hydrogeology Journal (2007) 15: 1473–1488 DOI 10.1007/s10040-007-0198-5