fewer disruptions = fully engaged students
TRANSCRIPT
1 |
EXECUTIVE SUMMARY
Chromebook™ devices hit the sweet spot for education. They are easy for students to use and affordable for schools. But not all Chromebooks are created equal. Poor performing Chromebooks can lead to distracted or frustrated students, while better performing Chromebooks can keep students more engaged in their learning.To find out which Chromebooks better engage students while causing the fewest disruptions, our team at
Prowess Consulting put two Chromebooks to the test: the ASUS® Chromebook C201, powered by a
Rockchip® processor, and the Dell™ Chromebook 11, powered by an Intel® Celeron® processor N2840.
We ran the Chromebooks through two typical classroom scenarios and discovered that the Dell Chromebook 11
consistently outperforms the ASUS Chromebook C201 in the classroom because it offers:
• Full use of the apps that students need now and in the future
• Less wait time so that students can stay focused on learning
• More rugged features that can better support daily student use
FEWER DISRUPTIONS = FULLY ENGAGED STUDENTSMaximize your investment in learning with an Intel® processor-powered Chromebook™
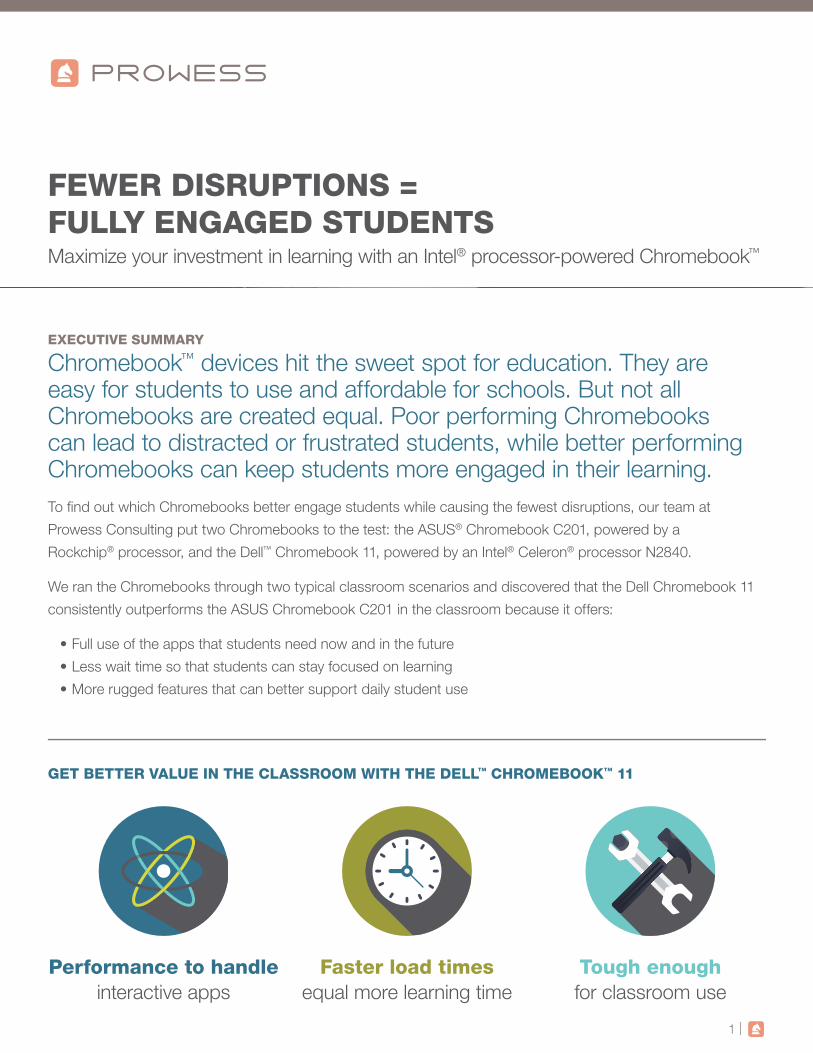
Performance to handle interactive apps
Faster load times equal more learning time
Tough enoughfor classroom use
GET BETTER VALUE IN THE CLASSROOM WITH THE DELL™ CHROMEBOOK™ 11

2 |
Which Chromebook Is Best for Your Students?Chromebooks are taking the education market by storm. They are a great fit for schools for
a variety of reasons, including an easy-to-use cloud-based ecosystem, simple collaboration
tools, low IT-maintenance requirements, and an affordable price.
The variety of Chromebooks on the market all run the same operating system and might
look similar on the outside, but that doesn’t mean that all Chromebooks offer the same
performance. The biggest differentiator between Chromebooks boils down to what’s inside.
The processor powering a Chromebook matters more than you might think.
To examine the differences between Chromebook models, our team at Prowess Consulting
put two Chromebooks to the test in authentic classroom scenarios. The Chromebooks we
tested include:
• ASUS Chromebook C201 powered by a Rockchip processor RK3288C (1.8 GHz)
• Dell Chromebook 11 powered by an Intel Celeron processor N2840 (2.16 GHz)
We ran both Chromebooks through typical classroom scenarios designed for elementary
and middle-school students—including interactive science and social-studies lessons.
The tests were designed to find out which Chromebook best supports student engagement
while causing the least frustration. The test scores are in: the Dell Chromebook 11 scored
consistently higher than the ASUS Chromebook C201 in the classroom setting because
it offers:
• Full use of the apps that your students need now and in the future
• Less wait time so that students can stay focused on learning
• More rugged features that can better survive daily student use
Full Use of the Apps That Your Students Need Now and in the FutureEducational apps get better every day. They have to if they want to keep up with today’s
students, who have been using technology since they could walk. To keep these students
interested and engaged, apps are becoming increasingly rich in graphics and more interactive.
In our test scenarios, we chose at least one graphically rich, interactive app per test. For
our science lesson, we tested a 3-D app that lets students virtually dissect a frog. For our
social-studies lesson on the history of bridges, we used the Google Maps™ app.
“ The Dell™ Chromebook™ 11 scored consistently
higher than the ASUS® Chromebook C201 in
the classroom setting. ”

3 |
As you will see in the detailed test scenario sections of this paper, both of these apps failed
the classroom test on the ASUS Chromebook C201. The 3-D frog-dissection app showed
a distorted frog image and not all the functions worked properly. The ASUS device froze up
mid-activity and produced a Web Graphics Library (WebGL) error screen. WebGL is a
JavaScript® interface that allows you to create real-time rendered, interactive 3-D graphics
in a browser without the need to download any plug-ins.
Similarly, the ASUS Chromebook C201 also failed the 3-D bridge activity because it did not
support Google Earth™ function in Google Maps. On the ASUS device, students don’t have
access to the Google Earth application’s tilt function that allows them to view the bridge in
3-D. This was a major hindrance to the project because the other exercises in the activity
relied on an aerial video of the 3-D bridge.
In contrast, the Dell Chromebook 11 performed flawlessly
with these graphically rich, interactive apps—no errors or
work stops. Students can record the 3-D aerial video of
the bridge tour and then use it in their class presentation and
other activities.
What does all of this mean for your students? The ASUS Chromebook C201, powered by a
Rockchip processor, lacks the performance necessary for many of today’s learning apps. If
your students’ experiences with the ASUS are like our experience, they will have problems
completing their assignments—which could lead to frustration, loss of focus, and less learning.
If the ASUS Chromebook C201 has trouble with today’s learning apps, it probably won’t do
well with the apps of the future, which will likely be even more interactive and graphical in
nature. If you are expecting your Chromebooks to have a lifespan of several years, you need
to be thinking not only of what your Chromebooks can do now but also of what they are
equipped to handle two or three years from now.
The Dell Chromebook 11 had no problems handling these 3-D interactive apps. And with
its more powerful Intel Celeron processor, the Dell Chromebook 11 is better prepared for
the more demanding apps of the future, which will likely rely on WebGL image libraries to
create real-time rendered, interactive 3-D graphics. Based on the prices we paid for these
Chromebooks, you can purchase the Dell Chromebook 11 for only about $0.14 more per
school day over a three-year device lifecycle.
Table 1. Invest in a Chromebook™ that can handle the apps of today and tomorrow
The Dell™ Chromebook™ 11 gives students full access to apps now and better performance to handle the apps of the future.1
The Dell Chromebook was, on average, 18 percent faster at completing lesson tasks than the ASUS® Chromebook.1
It costs less than $0.14 per school day per device to invest in the Dell Chromebook 11 over the ASUS Chromebook C201.*
*Estimates based on 180-day school year over a three-year device lifecycle. We paid $169.99 for the ASUS Chromebook C201 on amazon.com® and $245.15 for the Dell Chromebook 11 on www.dell.com™.
18%faster than the ASUS® Chromebook™ C201

4 |
Dell™ Chromebook™ 11 P22TIntel® Celeron® processor N2840
Less Wait Time so That Students Can Stay Focused on LearningYou are surrounded by students on a daily basis, so you know how quickly they can lose
focus. Even the smallest distractions can wreak havoc on classroom learning. So why not
choose a Chromebook that results in less time waiting for the device to load or to work
properly and in more time learning?
Our test results show that the ASUS Chromebook C201 performs slower across the board
on almost every task we timed and tested. It could leave students waiting more and learning
less. The detailed time charts for each test scenario are in the following sections. Based on
the numbers from our timed tests, we did some calculations to help you see how seconds
spent waiting can add up quickly.
Table 2 shows estimated time savings for a student
using a Chromebook device for just two activities per
day (equivalent to the length of the science activity
we tested). The time savings from using the Dell
Chromebook 11 over the ASUS Chromebook C201
equate to nearly 4.2 hours of lost learning time over one school year and 12.6 hours of lost
learning time over the life of the device (based on a three-year lifecycle). That’s more than a two
full days of instruction that you can gain back by investing in the Dell Chromebook 11.2
Table 2. Even if you use a Chromebook™ device in just two classes a day, you get significant time savings on the Intel® processor-powered Dell™ Chromebook 112
Estimates based on two Chromebook™ activities per school day over one school year*
Time saved using the Dell™ Chromebook 11 over the ASUS® Chromebook C201
Time saving per week 7 min
Time savings per month 29 min
Time savings per school year 4.2 hours = more than half a school day
Time savings over a 3-year life cycle 12.6 hours = almost two full school days
* Estimates based on National Center for Education Statistics, which shows that the average class time per day in U.S. schools is 6.64 hours and the average number of school days per year as 180. “Schools and Staffing Survey.” https://nces.ed.gov/surveys/sass/tables/sass0708_035_s1s.asp.
More Rugged Features That Can Better Support Daily Student UseMany schools have to keep their devices for at least three years before they can consider a
refresh. In some schools, Chromebooks live on a cart that classes check out throughout the
day, meaning that they might get non-stop use on any given day.
18%faster than the ASUS® Chromebook™ C201
12.6 hrs.saved over a 3-year device life cycle
U.S. Military Standard tested for durability, pressure, humidity, temperature, shock, and vibration
Sealed keyboard and touchpad
Scratch-resistent Corning® Gorilla® Glass touchscreen
180-degree hinge

5 |
From our research and experience handling these Chromebooks, we found that the Dell
Chromebook 11 is designed to be much more rugged than the tested ASUS device. The
Dell Chromebook 11 was designed with education in mind; it was built to last and to sustain
heavy classroom use. Table 3 highlights the unique durability features of the Dell Chromebook
11 compared to the ASUS Chromebook C201.
Table 3. The Dell™ Chromebook™ 11 is better equipped than the ASUS® Chromebook C201 to survive daily classroom use
Durability FeaturesASUS® Chromebook™ C201
Dell™ Chromebook 11
MIL-STD (U.S. Military Standard) tested for durability, pressure, temperature, humidity, shock, and vibration
Fully sealed keyboard and touch pad
180-degree hinge
Rubberized LCD and base trim for drop protection
Scratch-resistant touch screen made with Corning® Gorilla® Glass
Multi-colored lights signal to the teacher when students are online and not participating
Device Report Card
Grade Criterion
A Full or greater than 80 percent functionality for tested task
C Partial (50 to 80 percent) functionality for tested task
F Missing or less than 50 percent functionality for tested task

6 |
Test Scores: Chromebooks Put to the Classroom TestThe following sections compare the classroom experience for students using the two featured
Chromebooks in two typical K–12 scenarios: a seventh-grade science project and a fifth-grade
social-studies activity. Each scenario explains the student tasks involved in the activity and
then gives the highlights of our test results, in addition to the functionality differences and the
timed results for performance. For step-by-step test procedures and all timed-test results,
see Appendix B.
Scenario 1: Virtual Frog Dissection in a Seventh-Grade Life-Science ClassMaren is a seventh-grade science student.3 For her assignment, she conducts a virtual
dissection of a frog and engages in several activities related to learning, manipulating, and
presenting the internal anatomy of amphibians. After exploring online videos to learn new
content, she uses an educational 3-D model of a frog dissection in the 3DView app. She
captures and annotates screenshots using the PicMonkey® app, and then
she assembles a deck using Google™ Slides before creating a digital presentation to share with
her teacher and peers by using the Movenote® app.
Students Cannot Complete this Scenario on the ASUS® ChromebookUsing the ASUS Chromebook C201, things start going awry for Maren right off the bat. The
3-D rendering of the frog is distorted and shows up in a transparent, bright yellow form. Maren
is unable to see what the frog or its organs should look like. In contrast, when Maren uses the
Dell Chromebook 11, the 3-D frog image appears correctly, so Maren can rotate the 3-D view
and move the organs around as needed.
Figure 1. Distorted 3-D view of a virtual frog dissection on the ASUS® Chromebook™ C201 using 3DView
Figure 2. The 3-D view of a virtual frog dissection displayed correctly on the Dell™ Chromebook™ 11 using 3DView

7 |
In addition to not rendering the 3-D frog image correctly, the ASUS Chromebook is missing a
key function that Maren needs to do her assignment—the “Structural Analysis” function. This
function didn’t work at all in our testing, but instead caused the ASUS Chromebook C201
to freeze. When we tried to reload the app, a WebGL error appeared on the screen. At this
point, Maren hits a dead-end with her attempts to do the virtual frog dissection on the ASUS
Chromebook C201. It simply does not work.
Figure 3. The screen of the ASUS® Chromebook™ freezes up when trying to use the Structural Analysis feature in the 3DView app
Figure 4. Structural Analysis function of 3DView working correctly on the tested Dell™ Chromebook™ 11
Figure 5. A WebGL error appears on the ASUS® Chromebook™ when trying to reload the 3-D frog image in 3DView
The Dell™ Chromebook™ 11, powered by an Intel® processor, gives students better app capabilities now and performance to handle the apps of the future.

8 |
The 3-D frog dissection app isn’t the only app that failed to work properly on the ASUS
Chromebook C201. Maren also has a lot of trouble with the Movenote app, which fails multiple
times while trying to record a presentation on the ASUS Chromebook C201.
Maren and her classmates hit two major roadblocks in their assignment when using the
ASUS Chromebook C201—the virtual frog dissection and the Movenote presentation
recording. In addition, these students end up waiting longer for the ASUS Chromebook
C201 to perform the other tasks for this project. Creating and working on a Google™ Slides
presentation and opening 3-D files and photos for editing all take longer on the ASUS
Chromebook C201 than on the Dell Chromebook 11.
Table 4 shows how much faster the Dell Chromebook 11 completed the individual tasks.
Adding up all the timed tasks for the entire science activity, the Dell Chromebook 11 ends
up being 12 percent faster than the ASUS Chromebook C201. Faster loading times mean
less time waiting and fewer opportunities for distraction, which can equate to more time for
student learning.
Table 4. Results of six of the fourteen timed tasks for the science lesson scenario. Full task list and times are in Appendix B.
Science-Lesson TasksDell™ Chromebook™ 11 performed faster than the ASUS® Chromebook C201
Open Google™ Slides 33% faster
Create Google™ Slides presentation with YouTube® video 28% faster
Open 3DVew app 6% faster
Open frog-dissection file in 3DView app 14% faster
Open PicMonkey® photo editing app 45% faster
Add photos to Google Slides presentation 25% faster
Total time for anatomy lesson 12% faster
Figure 6. An error message that appeared repeatedly on the ASUS® Chromebook™ when running Movenote®
Figure 7. The Movenote® app recording a presentation on the tested Dell™ Chromebook™ 11

9 |
Scenario 2: History-of-Bridges Lesson in a Fifth-Grade Social-Science ClassQuinn is a fifth-grade student working on a social-studies project that explores the history
and design of prominent bridges.3 After choosing a bridge that he wants to focus on for his
class presentation, he looks up the bridge in the Google Maps app and records a virtual
aerial tour of the bridge using the Screencastify app. He then uploads the video to YouTube®.
He takes screen shots of the bridge while viewing the YouTube video and edits them in
the Autodesk® Pixlr® Touch Up photo editing app. Next, Quinn uses Canva, a web-based
poster-creator app, to make an infographic for his presentation. He posts his infographic into
a collaborative whiteboard space on the RealtimeBoard app. Then, for the last few minutes
of the lesson, his teacher lets the students play an online bridge-design game to learn more
about bridge engineering.
Students Experience Major Disruptions on the ASUS Chromebook C201Using the ASUS Chromebook C201, Quinn is dramatically limited with the Google Maps app
because the device does not support Google Earth, which has the 3-D tilt function that could
give Quinn a rich, 3-D view of the bridge from all angles. He is only able to view the bridge from
above (see Figures 8 and 9). His learning and workflow are hindered significantly by missing
out on this 3-D view. His aerial video can only include a top view of the bridge, which makes it
impossible to really learn about the bridge structure from various angles.
In contrast, on the Dell Chromebook 11, Quinn can experience the full 3-D functionality of the
Google Maps app. He can record an aerial video that captures various views of the bridge and
the surrounding areas. His screenshots and screencasts can include the 3-D views, which
makes his infographic and class presentation much more visually interesting and informative.
Figure 8. The Google Maps™ view on the ASUS® Chromebook™—note that there is no Google Earth™ 3-D tilt function available
Figure 9. The Google Maps™ view of the bridge on the Dell™ Chromebook™ 11 using the 3-D tilt function in Google Earth™

10 |
After taking screenshots of the Google Maps image, Quinn uses the Pixlr Touch Up app to edit
the photos to the way he wants them to look in his infographic for his class presentation. On
the ASUS Chromebook C201, Quinn runs into a variety of problems and errors trying to add
text or change effects. These disruptions not only cause a lot of frustration for Quinn, but could
completely derail his efforts to prepare his infographic for his class presentation, which would
negatively impact his learning experience.
In contrast, on the Dell Chromebook 11, he can make all of his edits with no errors or problems
using the Pixlr Touch Up app. He can modify the photos to his liking and insert them into his
infographic, positively impacting his learning experience.
Figure 10. Error on the ASUS® Chromebook™ when adding text to a photo in Autodesk® Pixlr® Touch Up
Figure 11. The Dell™ Chromebook™ 11 screen when adding text to a photo in Autodesk® Pixlr® Touch Up
Figure 12. Error on the ASUS® Chromebook™ when adding an effect to a photo in Autodesk® Pixlr® Touch Up
Figure 13. The Dell™ Chromebook™ 11 screen when adding an effect to a photo in Autodesk® Pixlr® Touch Up

11 |
In addition to the issues with Google Maps and Pixlr Touch Up on the ASUS Chromebook
C201, Quinn also finds that almost all of the activities in this lesson take significantly longer on
the ASUS device than on the Dell device. Faster speeds mean less time waiting—which means
less time for students to get distracted, bored, or frustrated.
The timed test results for this scenario are shown in Table 5. According to the total times,
a student like Quinn could complete all of the tasks for this lesson 37 percent faster on the
Dell Chromebook 11 than on the ASUS Chromebook C201.
Table 5. Results of seven of the thirteen timed tasks for the social studies lesson scenario. Full task list and times are in Appendix B.
Times for Social-Studies ActivitiesDell™ Chromebook™ 11 performs faster than the ASUS® Chromebook C201
Open Google Maps™ 60% faster
Download poster image from web 136% faster
Open Canva app 29% faster
Upload screenshot in Canva 30% faster
Open RealtimeBoard app 27% faster
Upload infographic in RealtimeBoard 21% faster
Play bridge-design game 138% faster
Total time for bridge lesson 37% faster
Faster speeds mean less time waiting—which means less time for students to get distracted, bored, or frustrated.

12 |
Head of Class: Dell Chromebook 11 Powered by an Intel ProcessorThe Dell Chromebook 11 earned top grades in our book as the Chromebook that will best
enhance your students’ learning experiences. In addition to being more durable in the
classroom than the ASUS Chromebook C201, the Dell Chromebook 11 performed better than
the ASUS device, proving that what’s inside your students’ Chromebooks really does matter.
The ASUS Chromebook C201 had difficulty running several critical apps in the student
scenarios, causing serious disruptions in the workflow of activities and lower-quality final
results. Students would likely be frustrated in these scenarios and could easily lose focus
with so many learning disruptions.
In contrast, the Dell Chromebook 11 had no problems with these same critical apps, and the
activities flowed smoothly from one to another, with the expected final results. It also performed
faster on almost every task, so students can spend less time waiting and more time learning.
In summary, the Dell Chromebook 11, powered by the Intel Celeron processor N2840,
offers the performance necessary to keep students engaged. Students not only spend
less time waiting for the device to perform but also get full access to the functionality of the
graphically rich, interactive apps powered by WebGL that they want to use today and in the
future—increasing the lifespan of your investment.
You can get all this in the Dell Chromebook 11 for approximately $0.14 more per device
per school day over the life of the machine.2 The Dell Chromebook 11, powered by an
Intel processor, is a smart way to invest in the learning of your students.
Maximize your investment in learning by choosing Chromebook™ devices powered by Intel® processors.
Dell™ Chromebook™ 11 P22TIntel® Celeron® processor N2840

13 |
AppendicesAppendix A: Test Environment
ASUS® Chromebook™ C201 Dell™ Chromebook 11
Reg Model C201P P22T
OS Google™ Chrome OS™ Chrome OS
Processor Quad-core Rockchip® processor RK3288C (1.8 GHz) Intel® Celeron® processor N2840 (2.16 GHz)
Storage 16 GB SSD (eMMC) 16 GB SSD (eMMC)
Memory 2 GB LPDDR3 2 GB DDR3L
Battery 2 cells, 38 Wh Up to 10 hours of use
Display 11.6” (1,366 x 768) 11.6” (1,366 x 768)
Graphics Integrated Rockchip Mali T764 Intel® HD Graphics
Card Reader Micro-SD, micro-SDXC, micro-SDHC SD card
Camera HD web camera HD web camera
Interface 1 x combo audio jack 2 x USB 2.0 ports 1 x micro-HDMI 1 x AC adapter plug
HDMI 1 x USB 2.0 port 1 x USB 3.0 port
Audio 2 built-in speakers and digital microphone 4 W internal stereo speaker (min 2 W x 2)
Networking Integrated 802.11a/b/g/n/ac Bluetooth® 4.1 support (on WLAN+ Bluetooth 4.1 combo card)
10/100 Mbps Intel® Dual-Band Wireless-AC 7260 802.11/a/b/g/n Bluetooth 4.0
Weight 2.16 lbs 2.91 lbs
Price at Time of Purchase
$169.00 (amazon.com®) $245.15 (www.dell.com™)
Software
Name Name
3DView RealtimeBoard
Autodesk® Pixlr® Touch Up Screencastify
Movenote® Google™ Slides
Google Maps™ PicMonkey®
Canva
Network Speed
Unless otherwise indicated, our tests were performed while devices were connected to an 802.11n wireless network. Network throughput fluctuates continually. We recorded network speeds at several points during the testing, and averaged the results. Averages are shown here.
Upload Speed 22.20 Mbps
Download Speed 71.66 Mbps

14 |
Appendix B: Test Procedure and ResultsScenario 1: Frog Anatomy Lesson
Creating a new presentation
1. From the bottom-left of the screen, click the Search icon.
2. Click All Apps.
3. Find Google™ Slides, and then click to open.
4. From the bottom-right of the screen, start a new presentation by clicking the + button.
5. Click OK to choose the default theme.
6. Click Click to add title and then type Virtual Frog Dissection.
7. Click Slide > New Slide.
8. Click Insert > Video, and then type Frog Anatomy.
9. Tap Enter, click the second video (part 2), and then click Select.
10. Double-click the image on the slide to start the video, and then click the pause button on video.
11. Click File > Rename, type Frog Dissection, and then click OK.
Dissection of a frog
1. From the bottom-left of the screen, click the Search icon.
2. Click All Apps.
3. Find 3DView and click to open.
4. Click File > Thingiverse.
5. In the search bar, type Frog Dissection.
6. Click The Frog Dissection Kit to open.
7. Click Download this Thing.
8. Click Download All Files.
9. Click Close.
10. From the right-hand side, in the Scene pane, click the down arrow for the Frog_Dissection_Kit.zip.
11. Rotate the view by clicking and dragging.
12. From the top, click the Structural Analysis button to change the view.
13. From the top, click the Structural Analysis button to change the view back.
14. On the right-hand side, in the Scene pane, click Organs_Combined.
15. Click and drag organs by clicking the square in the middle of the organs.
16. Press Ctrl+Shift+the Window button to take a selection screenshot.
17. Select the area for which you wish to take a screenshot.

15 |
Scenario 1: Frog Anatomy Lesson (Continued)
Create an image for your presentation
1. From the bottom-left of the screen, click the Search icon.
2. Click All Apps.
3. Find PicMonkey®, and then click to open.
4. Click the Edit for free link.
5. Click Open.
6. Select the image you wish to open, and then click Select.
7. From the left-hand side, click the Text button.
8. Click Add Text.
9. Click in the text box, and then type Organs.
10. From the left-hand side, click the Effects button.
11. Select Soften, and then click Apply.
12. From the top, click the Save button.
13. In the File Name field, type Organs.
14. In the Quality field, select Sean.
15. Click Save to my computer, and then click Save.
16. Click the Slides tab to make it active, and then click Slide > New Slide > Image.
17. Click Choose an image to open a new window, and then select Organs.jpg.
18. Click Open.
Recording a presentation
1. From the bottom-left of the screen, click the Search icon.
2. Click All Apps.
3. Find Movenote®, and then click to open.
4. Click the + (Add Slides) button.
5. Click Google Drive™ > Frog Presentation > Select.
6. If necessary, from the Adobe® Flash® Player Settings, click Allow, and then click Close.
7. Click the Start recording button and record a 30-second presentation.
8. Click Done to export.
9. Click Share to email the file.
Scenario 1 total time
ASUS® Chromebook™ C201 Dell™ Chromebook 11
6 minutes 7 seconds 5 minutes 36 seconds

16 |
Scenario 1 Results
Test ASUS® Chromebook™ C201 (Rockchip® processor RK3288C)
Dell™ Chromebook 11 (Intel® Celeron® processor N2840)
Creating a new presentation
Open Google™ Slides 4.97 seconds 3.75 seconds
Start new presentation 8.68 seconds 7.19 seconds
Create new slide 0.80 seconds 0.69 seconds
Add YouTube® video 1.51 seconds 1.26 seconds
Play video in app 2.33 seconds 1.45 seconds
Total 18.29 seconds 14.34 seconds
Dissection of a frog
Open 3DView 2.46 seconds 2.31 seconds
Open frog-dissection file 36.80 seconds 32.23 seconds
Navigate app: click different icons and layers and change views
N/A N/A
Take screenshot N/A N/A
Total 39.26 seconds 34.54 seconds
Create an image for your presentation
Open PicMonkey® 2.56 seconds 1.76 seconds
Select file to edit 2.37 seconds 2.16 seconds
Add text N/A N/A
Add effect N/A N/A
Save as “sean” quality 2.73 seconds 3.29 seconds
Add to Google™ Slides 3.77 seconds 3.01 seconds
Total 11.43 seconds 10.22 seconds
Recording a presentation
Open Movenote® 2.21 seconds 3.38 seconds
Add slides 6.04 seconds 5.19 seconds
Record 30-second presentation N/A N/A
Export by selecting done 17.80 seconds 17.44 seconds
Total 26.05 seconds 26.01 seconds

17 |
Scenario 2: Bridge Building Lesson
Google Maps™
1. From the bottom-left of the screen, click the Search icon.
2. Click All Apps.
3. Find Google Maps™ and click to open.
4. From the bottom-left of the screen, click the Satellite view.
5. In the search field, type Brooklyn Bridge, and then tap Enter.
6. Click and drag to rotate the view.
7. From the top-right of the screen, click Screencastify.
8. Click Start Recording to record the video.
9. Record a 3-minute video.
10. Click Stop Recording to stop recording the video.
11. Click Share, and then select YouTube® > Channel > Privacy.
12. Click Upload.
13. From the bottom-left of the screen, click the Search icon.
14. Click All Apps.
15. Find YouTube and click to open
16. From the left-hand side, click My Channel, and then click the Video link.
17. Click on the video just created. Pause the video and hold Ctrl+the Window button to take a screenshot.
Adding text to image
1. From the bottom-left of the screen, click the Search icon.
2. Click All Apps.
3. Find Autodesk® Pixlr® Touch Up and click to open.
4. Click My Computer.
5. Select a file, and then click Open.
6. Click Type, and then type Map in the text box.
7. Click Accept.
8. Click Effects > Classic > Vintage, and then click Accept.
9. Click Save, and then type the name BridgeMap.
10. Click the Download Bridge Poster bookmark, which directs to https://multco.us/bridges/news/downloadable-multnomah-county-bridge-posters.
11. Scroll to the bottom of the page, and then click the Hawthorn Bridge Poster link.
12. Click the Save icon, and then click Save.

18 |
Scenario 2: Bridge Building Lesson (Continued)
Export image
1. From the bottom-left of the screen, click the Search icon.
2. Click All Apps.
3. Find Canva and click to open.
4. Click Poster.
5. Click Uploads, select BridgeMap.jpg, and then resize the image.
6. Click Text, then click the first option to add text.
7. Resize and move the text.
8. Click Background, and then select the first cell in the third row to add background.
9. Click Download, and then select As an image.
Load RealtimeBoard
1. From the bottom-left of the screen, click the Search icon.
2. Click All Apps.
3. Find RealtimeBoard and click to open.
4. Click the Bridges board to load.
5. Click the + button to add files.
6. Click Upload (move to Downloads if you need to).
7. Click Untitled Design.jpg to upload, and then click Open.
8. In the URL bar, type http://armorgames.com/play/3999/cargo-bridge (or click the Cargo Bridge Game bookmark).
9. Click Start, and then click Start Game to start the game.
Scenario 2 total time
We did not compare overall times for these steps because the Pixlr Touch Up problems on the ASUS® Chromebook ™ C201 disrupted the timing sequence for every run-through.
Scenario 2 Results
Test ASUS® Chromebook™ C201 (Rockchip® processor RK3288C)
Dell™ Chromebook 11 (Intel® Celeron® processor N2840)
Google Maps™
Open Google Maps 3.71 seconds 2.32 seconds
Change to earth view N/A 0.56 seconds
Screencastify: Capture video of flyover
1.31 seconds 1.01 seconds
Upload video to YouTube® 4.80 seconds 4.53 seconds
Take screenshot N/A N/A
Total 9.82 seconds 8.42 seconds

Scenario 2 Results (Continued)
Test ASUS® Chromebook™ C201 (Rockchip® processor RK3288C)
Dell™ Chromebook 11 (Intel® Celeron® processor N2840)
Adding text to image
Open in Autodesk® Pixlr® Touch Up
1.55 seconds 3.79 seconds
Add text N/A N/A
Add effect N/A N/A
Conduct online research: download poster from https://multco.us/bridges/news/downloadable-multnomah-county-bridge-posters
1.77 seconds 0.75 seconds
Total 3.32 seconds 4.54 seconds
Export image
Open Canva 3.83 seconds 2.98 seconds
Upload screenshot 3.09 seconds 2.37 seconds
Export design as image 19.42 seconds 18.12 seconds
Total 26.34 seconds 23.47 seconds
Load RealtimeBoard
Open RealtimeBoard 9.09 seconds 7.14 seconds
Load board 10.57 seconds 6.69 seconds
Upload infographic (1.6 MB file) 20.10 seconds 16.60 seconds
Play bridge building game at http://armorgames.com/play/3999/cargo-bridge
4.19 seconds 1.76 seconds
Total 43.95 seconds 32.19 seconds
The analysis in this document was done by Prowess Consulting and commissioned by Intel.
Results have been simulated and are provided for informational purposes only. Any difference in system hardware or software design or
configuration may affect actual performance.
Prowess, the Prowess logo, and SmartDeploy are trademarks of Prowess Consulting, LLC.
Copyright © 2015 Prowess Consulting, LLC. All rights reserved.
Other trademarks are the property of their respective owners.
1 Percent calculated from combined times for both classroom scenarios we tested.
2 Estimates based on National Center for Education Statistics, which shows that the average class time per day in U.S. schools is 6.64 hours and the average number
of school days per year as 180. “Schools and Staffing Survey.” https://nces.ed.gov/surveys/sass/tables/sass0708_035_s1s.asp.
3 Maren and Quinn are fictional characters used as examples to explain the test results from students’ perspectives.