fesm image petrophysics final
DESCRIPTION
petrofisikaTRANSCRIPT

1
Image PetrophysicsA Fresh Look at Image Logs
Richard Holland
© 2009 Weatherford. All rights reserved.
Conventional Uses of Bore Hole Image Tools
• Visualization of complex structures
• Identification of faults and fractures and their orientation
• Determination of structural dip
• Definition of cross beds, thin beds and net-to-gross ratio in
sand-shale sequences
• Identification of sand-shale facies and sand thickness
counts
• Secondary porosity evaluation
• Depth matching, orientation and substitution of cores
• Structural and breakout analysis

2
© 2009 Weatherford. All rights reserved.
Evolution of Bore Hole Image Tools
Baker AtlasStar (1995)
HalliburtonEMI (1994)
SchlumbergerFMI (1991)
PrecisionHMI 2001
WeatherfordCMI (2006)
© 2009 Weatherford. All rights reserved.
Technology Driver
• To generate high-resolution petrophysical properties from Bore-hole Images
• To quantify textural heterogeneity and improve core-
facies predictability and petrophysical facies grouping
• To implement this methodology on all standard industry
image tools
• To extend the discrete single well analysis to a full field
approach
3
3
© 2009 Weatherford. All rights reserved.
MOTIVATION
• Combining borehole images with core and logs
– Generally an empirical approach
– Based on facies or facies associations
• Textural mapping from images
– Permits indicative grain size distribution
– Can be used in further permeability analysis.
• Methodology
– Use textural mapping to identify flow units which incorporates grain size
– Assign permeability relationship to flow units.
© 2009 Weatherford. All rights reserved.
Implications in Carbonate Reservoirs
• Carbonate Reservoirs:
– 60% of world oil reserves (est)
– 40% of world gas reserves (est)
• Carbonates differ from Clastics
– Deposition
– Digenesis
– Texture
• Concept
– Provide an idea of porosity variation around the well-bore
4
© 2009 Weatherford. All rights reserved.
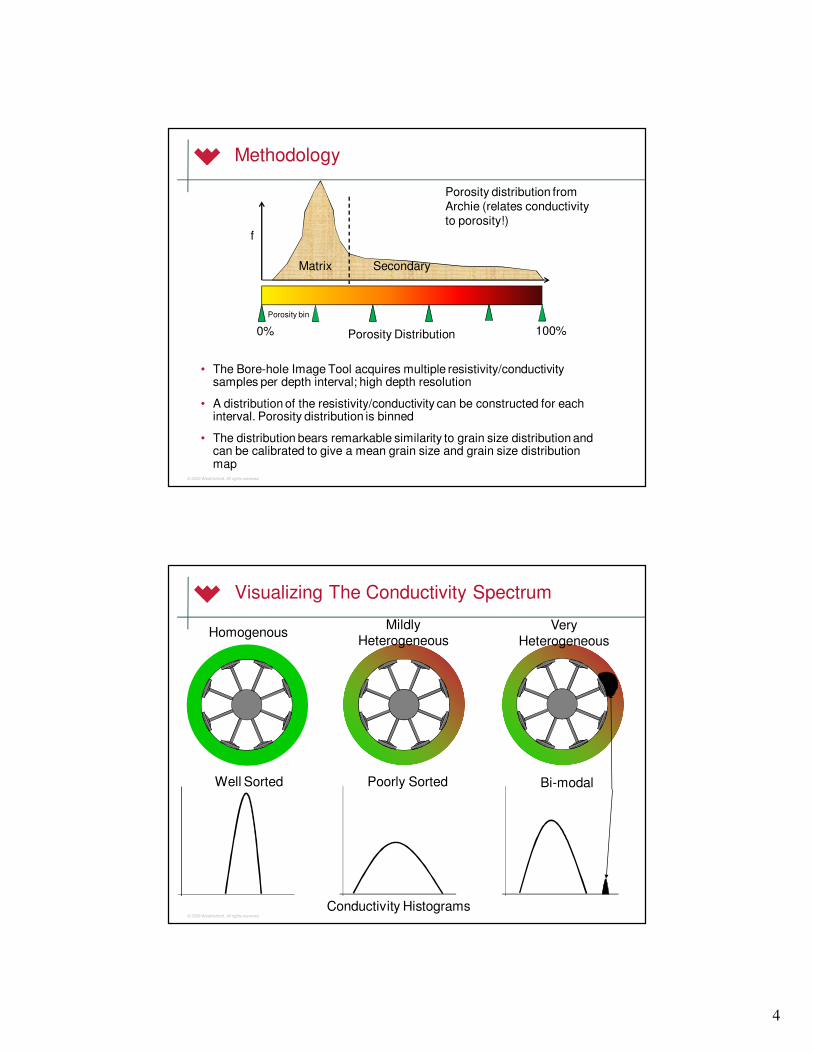
Methodology
• The Bore-hole Image Tool acquires multiple resistivity/conductivity samples per depth interval; high depth resolution
• A distribution of the resistivity/conductivity can be constructed for each interval. Porosity distribution is binned
• The distribution bears remarkable similarity to grain size distribution and can be calibrated to give a mean grain size and grain size distribution map
Matrix Secondary
f
Porosity Distribution0% 100%
Porosity distribution from Archie (relates conductivity to porosity!)
Porosity bin
© 2009 Weatherford. All rights reserved.
Visualizing The Conductivity Spectrum
HomogenousMildly
HeterogeneousVery
Heterogeneous
Conductivity Histograms
Well Sorted Poorly Sorted Bi-modal

5
© 2009 Weatherford. All rights reserved.
Image Tool Resolution
AMZ/AND/ALD = 6”
1”
Acoustic Images = 0.4”
Electrical Images = 0.2”
Analysis & Certainties Are Tool Resolution Dependent
Generated Vertical
Resolution
© 2009 Weatherford. All rights reserved.
Image Petrophysics
• Captures radial variability in porosity (Note the core plug distribution – grey dots)
• PHIT from image (calibrated against PHIT from logs)
• Computes high resolution volumes
• HR Volumes and Porosity distribution can be calibrated to Core
• Variability of the rock is captured

6
© 2009 Weatherford. All rights reserved.
Porosity Distribution
Porosity distribution
Sort Index
Porosity Bins
Porosities falling in the same bin indicate well sorted grains. Sort index is higher
Porosities falling in multiple bins indicate poorly sorted grains. Sort index is lower
© 2009 Weatherford. All rights reserved.
Permeability
• Permeability Equation:
• KAφeff2
• KA adjusted to match core permeability
• Alternatively:
• KA*φeff2 * 10^(KBφSimg/φPimg)
φSimg: secondary porosity from image
φPimg: primary porosity from image
Ref: Doyen, 1988

7
© 2009 Weatherford. All rights reserved.
• Predict core facies
• Evaluate lateral and
vertical heterogeneity
variability
• Define core based
stacking cyclicty and
surfaces
• Define Flow units
• Quantify porosity and
Permeability
• Core facies in un-cored
wells
Geology-Petrophysics Integration
Core Facies Predictions
Core Plugs
Flow Units
© 2009 Weatherford. All rights reserved.
Clastics Approach
Core
Core Fabric Log & Description
Pseudo Lithology Log
Distribution of conductivity spectrum from BH Images
Sorting & Grain size Index & Histograms
Grain Sorting Index Log
Porosity Image map & Volumetric (OH Log-BHI)
HR Porosity Log & Volumetric
Sedimentological Log
Facies Analysis
LQC & Processing
Conventional Advanced
Manual Interpretation
Well Completion & Reservoir Characterization
Geostatistical and/or Neural Network
8
© 2009 Weatherford. All rights reserved.
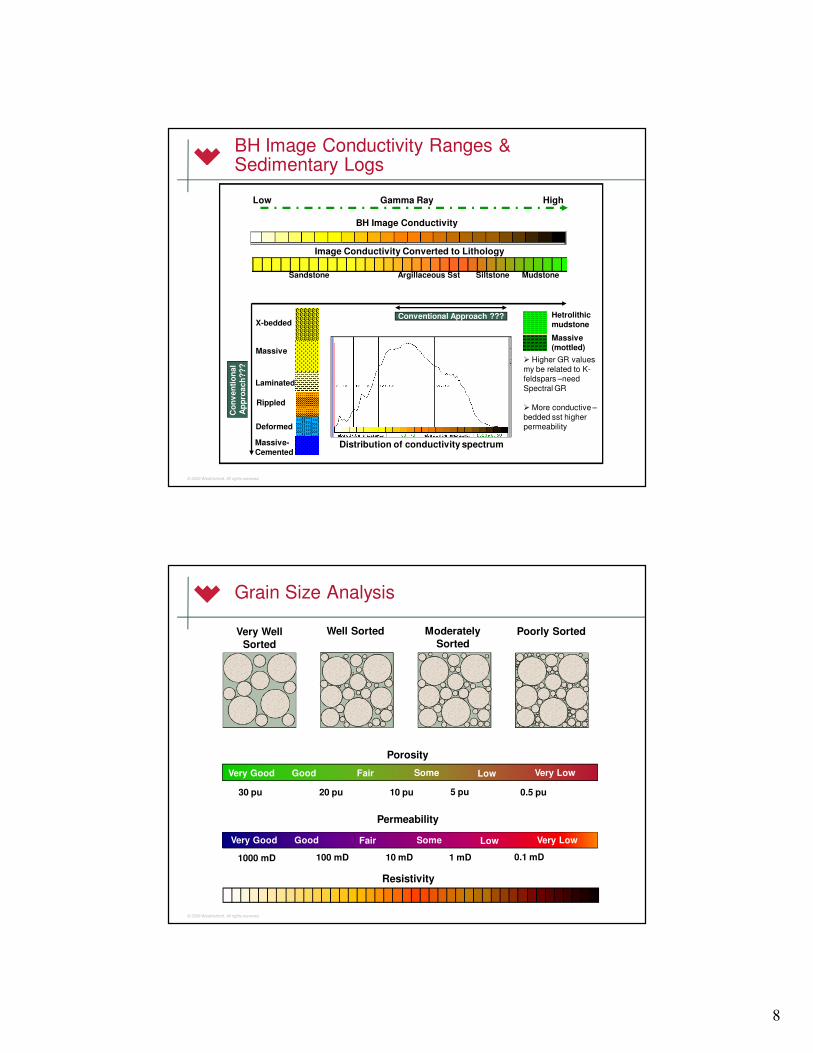
BH Image Conductivity Ranges & Sedimentary Logs
BH Image Conductivity
Image Conductivity Converted to Lithology
Gamma Ray Low High
Sandstone Argillaceous Sst Siltstone Mudstone
X-bedded
Laminated
Massive
Massive-Cemented
Rippled
Deformed
Hetrolithic mudstone
Massive (mottled)
� Higher GR values
my be related to K-
feldspars –need
Spectral GR
� More conductive –
bedded sst higher
permeability
Distribution of conductivity spectrum
Conventional Approach ???
Co
nv
en
tio
na
lA
pp
roa
ch
??
?
© 2009 Weatherford. All rights reserved.
Grain Size Analysis
Very Good Good SomeFair Low Very Low
Permeability
1000 mD 100 mD 10 mD 1 mD 0.1 mD
Resistivity
Very Good Good SomeFair Low Very Low
Porosity
30 pu 20 pu 10 pu 5 pu 0.5 pu
Very Well
Sorted
Well Sorted Moderately
SortedPoorly Sorted
9
© 2009 Weatherford. All rights reserved.
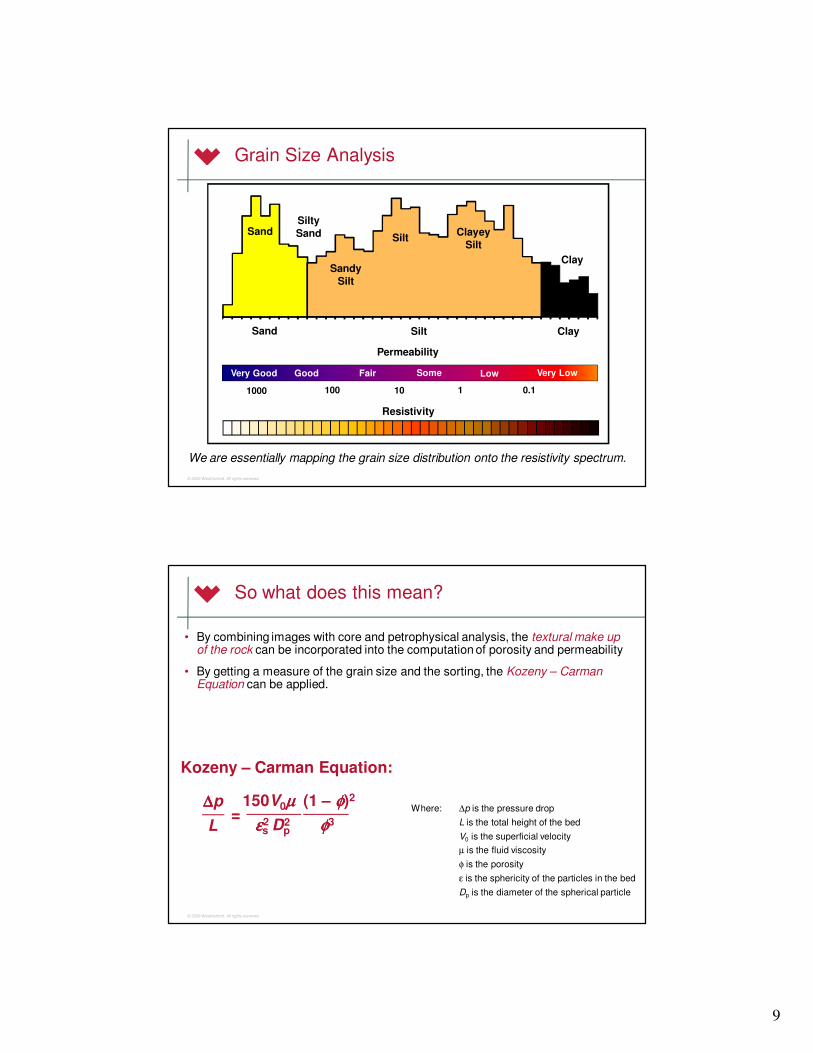
Grain Size Analysis
SandSilty
Sand
Sandy
Silt
SiltClayey
Silt
Clay
Sand Silt Clay
Very Good Good SomeFair Low Very Low
Permeability
1000 100 10 1 0.1
Resistivity
We are essentially mapping the grain size distribution onto the resistivity spectrum.
© 2009 Weatherford. All rights reserved.
So what does this mean?
• By combining images with core and petrophysical analysis, the textural make up of the rock can be incorporated into the computation of porosity and permeability
• By getting a measure of the grain size and the sorting, the Kozeny – Carman Equation can be applied.
=150V0µ µ µ µ (1 – φφφφ)2
εεεεs Dp φφφφ32 2
∆∆∆∆p
L
Where: ∆p is the pressure drop
L is the total height of the bed
V0 is the superficial velocity
µ is the fluid viscosity
φ is the porosity
ε is the sphericity of the particles in the bed
Dp is the diameter of the spherical particle
Kozeny – Carman Equation:

10
© 2009 Weatherford. All rights reserved.
Translating Images into Texture
Increasing
Grain Size
© 2009 Weatherford. All rights reserved.
Translating Images into Texture
Increasing
Grain Size
Better
Sorting
11
© 2009 Weatherford. All rights reserved.
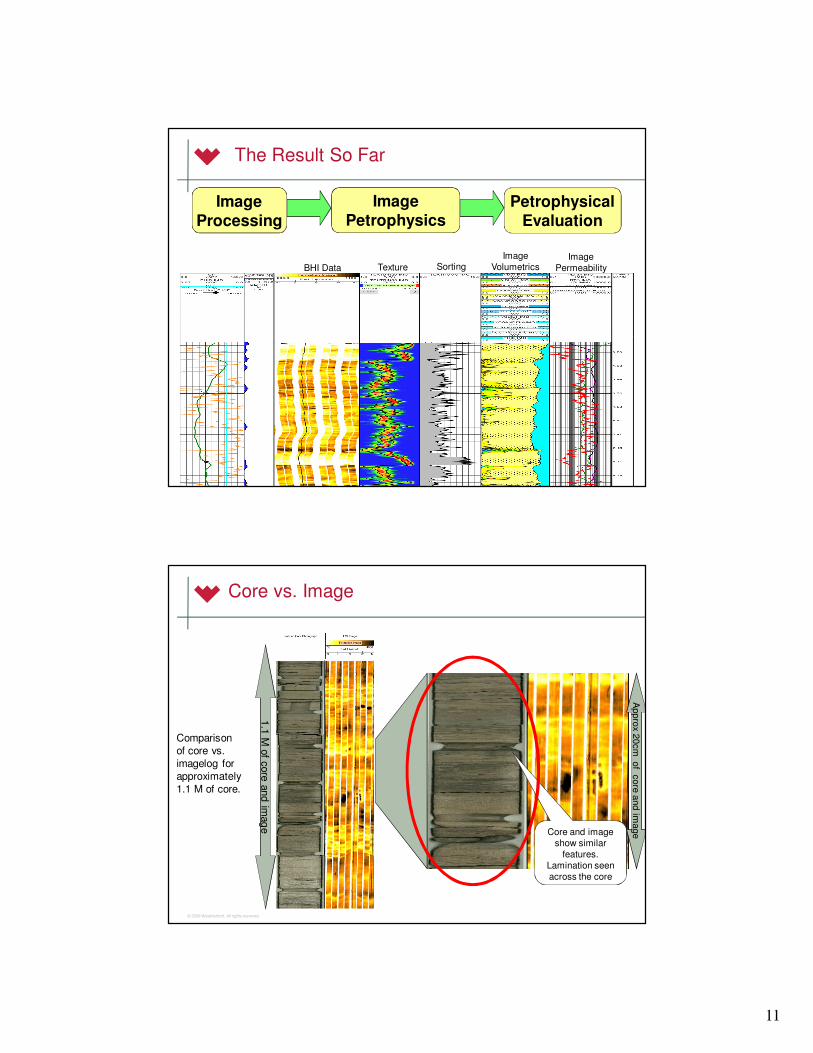
The Result So Far
BHI Data Texture SortingImage
VolumetricsImage
Permeability
ImageProcessing
PetrophysicalEvaluation
ImagePetrophysics
© 2009 Weatherford. All rights reserved.
Core vs. Image
Comparison
of core vs.
imagelog for
approximately
1.1 M of core.
Core and image
show similar
features.
Lamination seen
across the core
1.1
M o
f core
and im
ag
e
Appro
x 20cm
of c
ore
and im
age
12
© 2009 Weatherford. All rights reserved.
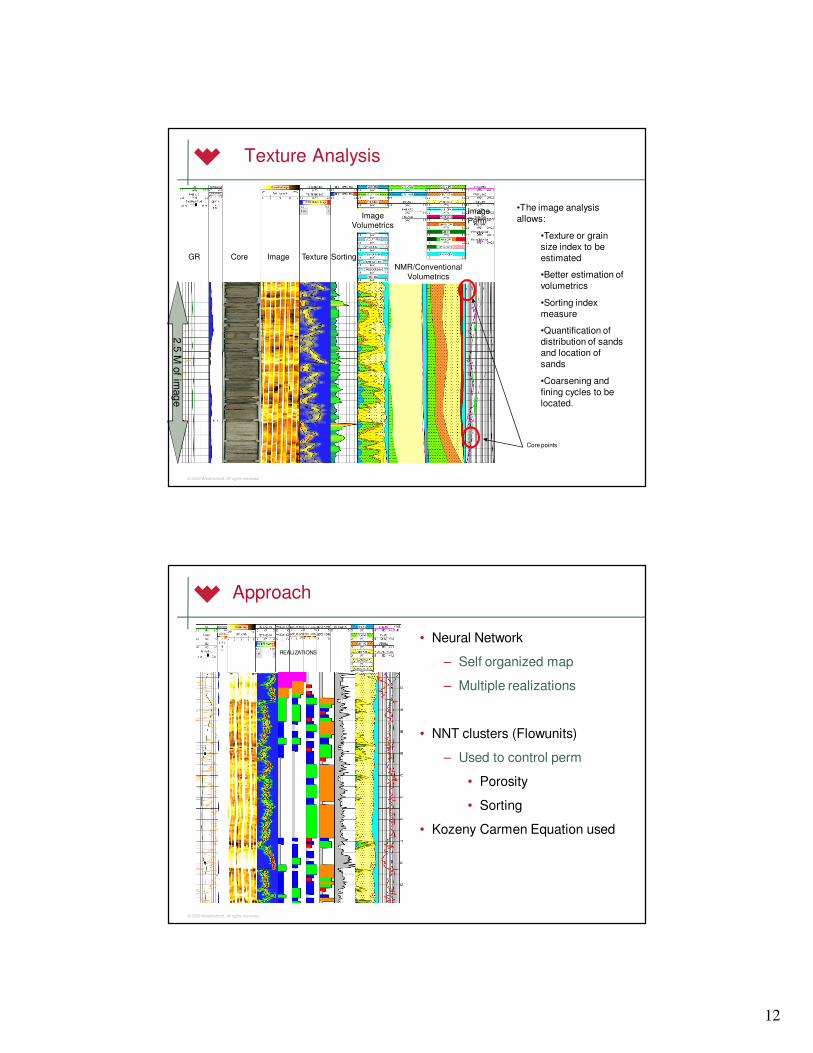
GR Core Image Texture Sorting
Image
Volumetrics
NMR/Conventional
Volumetrics
Image
Perm
•The image analysis
allows:
•Texture or grain
size index to be
estimated
•Better estimation of
volumetrics
•Sorting index
measure
•Quantification of
distribution of sands
and location of
sands
•Coarsening and
fining cycles to be
located.
Core points
2.5
M o
f imag
e
Texture Analysis
© 2009 Weatherford. All rights reserved.
Approach
• Neural Network
– Self organized map
– Multiple realizations
• NNT clusters (Flowunits)
– Used to control perm
• Porosity
• Sorting
• Kozeny Carmen Equation used
REALIZATIONS

13
© 2009 Weatherford. All rights reserved.
GrainsizeUses10 divisions fromClay to cobble
Pre
dic
ted
Tra
ined
1
4-5
3
2
Black – Core Perm
Purple – Coates type perm
Red – Kozeny-Carmen
Green – High resolution Rt
What about Core?
© 2009 Weatherford. All rights reserved.
Kozeny-Carmen Permeability
• General shape and range is comparable
– Permeability computed for the wells is similar to core measurements
• As one would expect the textural mapping from images and clustering is much more defined.
– Sorting and textural map allows a range to be assigned to flow units.
Image Petrophysics Core
14
© 2009 Weatherford. All rights reserved.
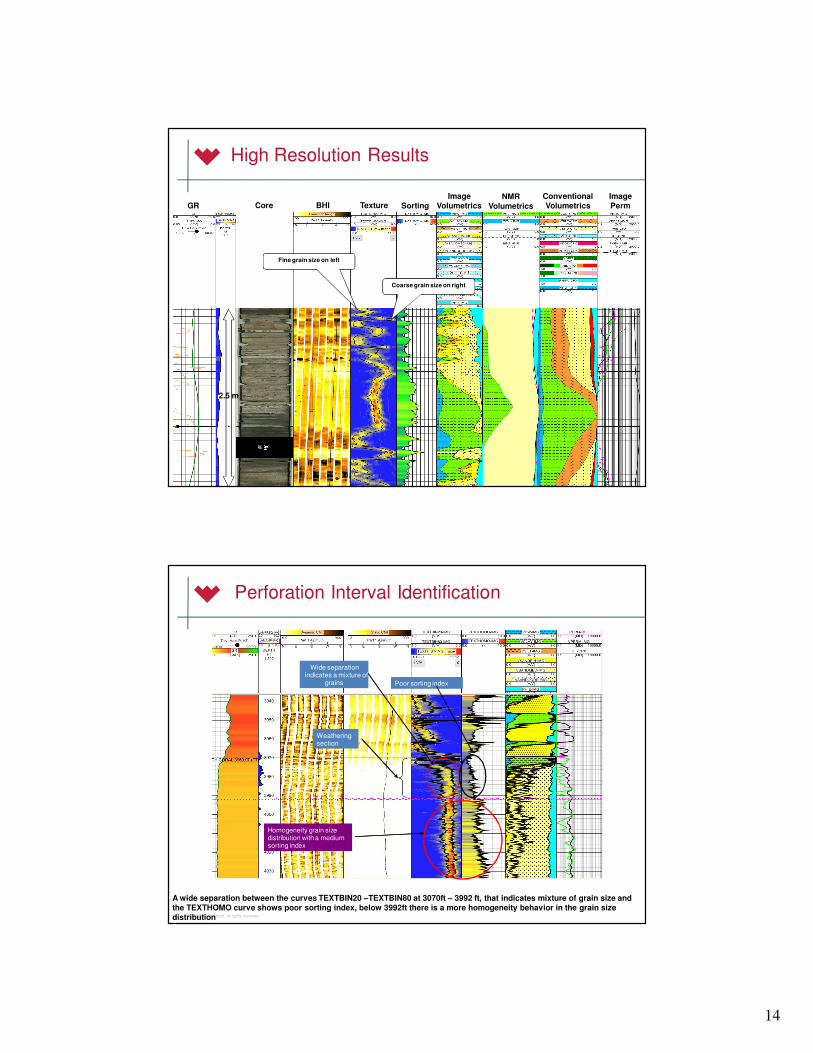
High Resolution Results
GR Core BHI Texture SortingImage
VolumetricsNMR
Volumetrics
ConventionalVolumetrics
Image Perm
Fine grain size on left
Coarse grain size on right
2.5 m
© 2009 Weatherford. All rights reserved.
A wide separation between the curves TEXTBIN20 –TEXTBIN80 at 3070ft – 3992 ft, that indicates mixture of grain size and the TEXTHOMO curve shows poor sorting index, below 3992ft there is a more homogeneity behavior in the grain size distribution
Perforation Interval Identification
Wide separation indicate a mixture of
grains Poor sorting index
Weathering section
Homogeneity grain size distribution with a medium sorting index
Wide separation indicates a mixture of
grains Poor sorting index
Weathering section
Homogeneity grain size distribution with a medium sorting index

15
© 2009 Weatherford. All rights reserved.28
As an Integration Tool
Predicted Facies
ASCII Load to Data Base
MDT & PLT Decisions
Model: Core Rock
Type/Flow Units
Fracture
Connectivity
3D Facies
Distribution
Perm Distribution
© 2009 Weatherford. All rights reserved.
Observations
• Image petrophysics appears to provide textural mean and homogeneity values that can be related to or calibrated with grainsize.
• Being able to use core derived sorting, porosity and heterogeneity to predict a mean grain size from borehole images and have it match is a useful tool.
• Producing flow units that incorporate sorting and grainsize permits use of algorithm's that accommodate these measurements such as Kozeny-Carmen equations.
• The resultant computed permeabilities from image data show variation that is consistent with what is seen in core.

16
© 2009 Weatherford. All rights reserved.
Thanks and Questions
I would like to thank the following people for their help and advice:
Paul Kalathingal, Region Manager, Weatherford Petroleum Consulting, Malaysia
Dr Manfred Frass, Region Manager, Weatherford Petroleum Consulting, Latin America
Dr Peter Elkington, Development Manager, Weatherford Geoscience Development, East Leake, UK
Ruben Martinez, Geologist, Weatherford Petroleum Consulting, Malaysia
And finally, thank you for listening and any questions