fertilizer sector chemicals sow today, harvest...
TRANSCRIPT

March 27, 2013
1
Sector Report
Fertilizer Sector Chemicals Sow today, harvest tomorrow!
Fertilizer sector – Set to rebound Though an awful year for the fertilizer sector came to an end, clouds of uncertainties still roam around the sector. Among key issues, with respect to the fertilizer sector, gas remains on top. Companies on the SNGPL’s network suffered the most, with complete gas shutdown for almost 290 days in CY12. Since a long-term gas plan has been on the cards, for the plants operating on the SNGPL network, the new ray of hope has eventually spelled out new soul into the fertilizer sector scrips once particulars of the long-term plan were approved by the ECC.
Engro Corporation Limited – The worst seems behind us CY12 was a miserable year for Engro Corporation, as its fertilizer arm (Enven) only managed to operate for 45 days during the entire year. This was the prime factor in dragging company’s bottom-line by a heft hefty 77% YoY in CY12. Silver lining appears on the horizon with the approval of long term gas plan, which will enable ENGRO to operate both of its plants though at a higher gas price of PKR 426/mmbtu, expected to be materialized by 2QCY14. Meanwhile, ENGRO is expected to receive gas from SNGP’s network as and when available on the agreed price of PKR 70/mmbtu. Assuming a 45 days gas availability of 76mmcfd, we expect EFERT to post an EPS of PKR 2.39 (Impact on ENGRO: PKR 4.99/share) in CY13. The stock offers 51% upside with SOTP Dec-13 PT of PKR 196/share; thus we recommend ‘Buy’.
Fauji fertilizer Company Limited – Safest bet in the fertilizer sector FFC remained the biggest beneficiary in terms of gas curtailment to peers in CY12, thanks to Mari’s gas network, which faced least gas curtailment (~12%-15%). FFC remained the market leader in urea sales, as the company managed to cater 46% of total urea offtake with capacity utilization at 120%. We expect the company to carry forward the same utilization level in CY13 with an estimated earnings PKR 15.49/share. We also expect the company’s new ventures i.e. significant stake in AKBL and power sector to yield long-term support to earnings. FFC trades at 16% discount to our DCF based Dec-13 TP of PKR 126/share. In addition, a massive CY13F DY of 14% puts icing on the cake. ‘Buy’ FFC!
Fauji Fertilizer Bin Qasim Limited – DAP margins on thriving mode FFBL’s plant remained shut on numerous occasions due to persistent gas curtailments during CY12. We expect CY13 not to bring any major turnaround in terms of gas availability. However, strong recovery in DAP’s primary margins (12% YoY jump to USD 280/ton) coupled with the fact that DAP production requires less gas (so low impact of gas curtailment on DAP production) is not only expected to mitigate the impact of lower urea production due to gas curtailment but yield a healthy 46% YoY earnings growth to PKR 6.66/share during CY13. Our DCF based Dec-13 target price for FFBL works out to PKR 45/share, offering an upside potential of 22% with CY13F DY of 16%, so, we recommend ‘Buy’ on FFBL.
Scrip PE* Div Yield* PB* ROE* Target Price Upside RecommendationFFC 7.0 14% 5.1 73% 126 16% BUYENGRO 7.8 - 1.6 21% 196 50% BUYFFBL 5.6 16% 2.6 47% 45 22% BUYSource: Arif Habib Research, * On CY13F earnings
Target Price 126
Last Closing 109
Upside 16%
KSE Code FFC
Bloomberg Code FFC PA
Target Price 45 Last Closing 37 Upside 22%KSE Code FFBLBloomberg Code FFBL PA
Target Price 196
Last Closing 130
Upside 51%KSE Code ENGROBloomberg Code ENGRO PA
Source: KSE
AnalystTahir [email protected]
Engro Corporation
Stock Performance
www.arifhabibltd.com
Fauji Fertilizer Bin Qasim
Fauji Fertilizer
60%
80%
100%
120%
140%
160%
180%
Mar
-12
Apr-1
2M
ay-1
2Ju
n-12
Jul-1
2Au
g-12
Sep-
12O
ct-1
2N
ov-1
2N
ov-1
2D
ec-1
2Ja
n-13
Feb-
13M
ar-1
3
FFBL KSE100FFC ENGRO

2
Sector Report
Content Sow today, harvest tomorrow! ........................................................................................................................................... 4
Gas plan on the map! ........................................................................................................................................................ 4
Pricing scenario; price cut seems a far cry! ........................................................................................................................ 5
Other side of the story post long-term gas plan .................................................................................................................. 5
FFC and FATIMA stand as key beneficiaries of price hike ................................................................................................. 5
GIDC remains talk of the town ........................................................................................................................................... 6
Outlook ............................................................................................................................................................................. 5
Key Risks ............................................................................................................................................................................ 7
CY12 a paining year for Fertilizer sector ............................................................................................................................ 8
Urea offtake remains dull, higher prices come to rescue .................................................................................................... 8
Severe production losses amid acute gas dearth but better 4Q CY12 earnings .................................................................. 8
Company-wise profitability analysis 2012 .......................................................................................................................... 8
Engro Corporation Limited (ENGRO) ................................................................................................................................. 9
Severe pain in CY12 ......................................................................................................................................................... 9
GSA at USD 4.26/mmbtu for the pipeline while USD 3.2/mmbtu remains for CY13 ............................................................ 9
Pricing scenario once the long-term plan in place ............................................................................................................ 10
What to expect in CY13? ................................................................................................................................................. 10
Financial Summary, Forecasts and Key Ratios ............................................................................................................... 12
Fauji Fertilizer Company Limited (FFC) ........................................................................................................................... 13
Operational outlook ......................................................................................................................................................... 13
Pricing scenario and impact............................................................................................................................................. 13
Askari Bank transaction and other business ventures ...................................................................................................... 14
Valuation ......................................................................................................................................................................... 14
Financial Summary, Forecasts and Key Ratios ............................................................................................................... 15
Fauji Fertilizer Bin Qasim Limited (FFBL) ........................................................................................................................ 16
Operational outlook ......................................................................................................................................................... 16
Pricing scenario and impact............................................................................................................................................. 16
Thriving DAP primary margins ......................................................................................................................................... 16
Askari Bank transaction and impact ................................................................................................................................. 17
Valuation ......................................................................................................................................................................... 17
Financial Summary, Forecasts and Key Ratios ............................................................................................................... 18
About the Sector ............................................................................................................................................................... 20
Annexure ........................................................................................................................................................................... 21
List of abbreviations…………………………………………………………………………………………………………………….27
Closing Prices as of Tuesday, 26th March, 2013

3
Sector Report
Page left blank intentionally

4
Fertilizer Sector
Sow today, harvest tomorrow! Though an awful year for the fertilizer sector came to an end, clouds of uncertainties still roam around the sector. Among key issues, with respect to the fertilizer sector, gas remains on top. Companies on the SNGPL network suffered the most, with complete gas shutdown for almost 290 days in CY12. However, a safe bet can be made on the companies operating on MARI’s network. In this detailed note, we have discussed Pakistan fertilizer sector’s fate going forward, including various factors that are shaping up the profitability outlook of the entire sector as well as individual companies alongside key risks that may continue to affect individual companies differently. Our individual company sample includes FFC, FFBL and ENGRO.
Gas plan on the map! Since a long-term gas plan has been on the cards, for the plants operating on the SNGPL network, the new ray of hope has eventually spelled out new soul into the fertilizer sector scrips, once particulars of the long-term plan were approved by the ECC. With the approval of the long-term plan (detailed graphical presentation of plan provided in the annexure) and the GSA signed, ENGRO and DWHC rallied by 43%, 59%, respectively against KSE100’s 5.7% since Jan-13. Only AGL lagged with -5.3% return.
The ECC has already approved the diversion of allocated gas from ENGRO's old plant to its new plant till Dec 31, 2013. Gas from MARI SML and Reti Maru could be in the network within the expected timeframe of 6-8 months (considered as the short-term plan). This should particularly benefit ENGRO in the short term, as the two fields are quite adjacent to the company’s plant. However, the long-term plan is scheduled to take around 12 months for completion (operational from 2QCY14). As per KSE notice, the GSA between EFert and the two fields i.e. Kunnar Pasaki Deep and Reti Maru has been signed while the gas price has not been disclosed by the company. Similarly, ENGRO’s other GSAs are also expected to be signed soon with respect to Mari SML as well as Sara West. Detail of the short-term as well as long-term plans is given as under:
Long term plan Fields mmcfd Availability Timeframe Kunnar Pasaki Deep 130 10 to 12 months Mari SML 22 2 to 3 months Bahu 15 NA Reti Maru 10 5 to 6 months Markori East 25 NA Total 202 Source: Arif Habib Research
Short term plan
Fields mmcfd Availability Timeframe
Mari SML 22 2 to 3 months
Reti Maru 10 5 to 6 months
Sara West - NA
Total 32
Source: Arif Habib Research
Compa ny mmcfdEngro 79 Dawood Hercul us Ferti l i zer 40 Pak Ara b Ferti l i zer 58 Agritech Limited 25 Total 202 Source: Arif Habib Research
Long term pla n brea kup

For important disclosure and analyst certification, kindly refer to end of the report 5
Fertilizer Sector
Pricing scenario; price cut seems a far cry! On the product pricing side, we rule out any price cuts in CY13 mainly due to unavailability of the gas on an immediate basis, and even the short term plan (Reti Maru, Mari SML, and Sara West) is expected to take at 6-8 months, thereby reducing any chance of price cuts in CY13. Instead, bright possibility exists for urea price augmentation (to pass on price to consumer), when OGRA is expected to increase gas sale prices from Jul-13 onwards.
Other side of the story post long-term gas plan With the successful implementation of the long-term gas arrangement plan assuming gas price, for plants operating on the SNGPL network, at USD5.0/mmbtu or ~PKR 500/mmbtu (excluding ENGRO, FFC ad FFBL), we expect urea price to rather be raised from 2QCY14 onwards.
In this regard, as per our calculations, the price for the 17% of the total urea production (or 0.9mn tons) should be increased by PKR 221/bag (see table below). Particularly, the cost for ENGRO’s Enven could jump by PKR 392/bag or 509% post gas-price increase (from USc70/mmbtu to USD4.26/mmbtu). However, weighted average gas cost for ENGRO should lead to a hike of PKR 224/bag post long-term plan.
Hence, after the proposed scenario, cost of 34% of total urea production (~2.1mn tons) is expected to increase by an average PKR 224/bag. Conclusively, going forward, we do not expect any price reduction from fertilizer companies, hence as analysis shows on average urea prices are expected to increase by PKR 224/bag once the long-term plan is in place primarily on account of increase in gas costs. The table further elaborates:
Gas Price (PKR/mmbtu) ProductionNew Old New Old mn tons New Old
FFC 320 320 24.00 7,680 7,680 2.04 120% 2.45 18,819 18,819 ENGRO (Old) 320 320 23.50 7,520 7,520 0.98 90% 0.88 6,599 6,599 ENGRO (Enven) 426 70 22.00 9,372 1,540 1.30 90% 1.17 10,965 1,802 FFBL 320 320 24.50 7,840 7,840 0.50 50% 0.25 1,960 1,960 FATIMA 70 70 21.00 1,470 1,470 0.50 90% 0.45 662 662 PAK Arab 500 320 24.50 12,250 7,840 0.09 90% 0.08 1,014 649 Agritech 500 320 24.50 12,250 7,840 0.47 90% 0.42 5,149 3,295 Dawood Herculis 500 320 24.50 12,250 7,840 0.45 90% 0.40 4,906 3,140
6.10 50,074 36,925
Gas Cost (PKR mn)Company Per ton Feed Gas Cost UtilisationCapacityConversion
PKR/ton PKR/bagIncrease in Feed gas cost for plants on SNGP excluding ENGRO 4,410 221 Increase in Feed gas cost for ENGRO's ENVEN 7,832 392 Weighted Avg increase in Feed Stock Cost for ENGRO 4,475 224 Source: Arif Habib Research
FFC and FATIMA stand as key beneficiaries of price hike FFC and FATIMA would remain major beneficiaries with respect to any increase in urea prices ahead, post long-term gas plan. FFC being the major player in the industry is expected to enjoy windfall gains in this regard while FATIMA would benefit the most courtesy its subsidized gas agreement with MARI Gas at USc 70/mmbtu.
Urea pricing in CY12
Source: NFDC and Bloomberg
1,500 1,600 1,700 1,800 1,900 2,000 2,100 2,200 2,300 2,400
Jan
Feb
Mar Apr
May Jun
Jul
Aug
Sep
Oct
Nov
Dec
Local ImportedPKR/bag

For important disclosure and analyst certification, kindly refer to end of the report 6
Fertilizer Sector
GIDC remains talk of the town Earlier, with the commencement of CY12, the Federal gov’t applied Gas Infrastructure Development Surcharge (GIDC) to all the fertilizer plants, which led gas prices to surge by a massive PKR 197/mmtbu, translating into a hefty jump of 207% YoY. After the imposition of the GIDC, the average urea price per 0bag went straight up 20% YoY in CY12. FATIMA and ENGRO were the key beneficiaries of the aforesaid cess due to their long-term agreements in place with the GoP at subsidized feed-stock price for ten years. However, only FATIMA enjoyed the aforesaid benefit as ENGRO (EnVen plant) was facing fatal gas curtailment due to shortage of gas on the SNGPL network.
As per the Budgetary Document for FY13, and the Finance Bill 2012, the gov’t had already approved the maximum price of GIDC, i.e PKR 300/mmbtu. However, GIDC for FY13TD remained intact at PKR 197/mmbtu, which is expected to be the same for the rest of FY13 as well. Our discussion with the industry reveals that urea manufacturers are not in a position to bear such a massive hike in gas prices (+52%) and, thus, passing on this impact in the urea prices, once increased, would be the eventual reality.
Outlook As far as sector outlook is concerned, we expect sector’s urea offtake to grow by 5% YoY in CY13. Our assumption with respect to growth in urea offtake mainly stems from: 1) increase in Wheat Support Price to PKR 1200/maund, 2) low interest rates to provide farmers with cheap agri-loans, 3) better demand due to increased cultivatable areas with improving yields amid favorable weather conditions last year (absence of huge floods).
As far as the long-term gas plan goes (gas pipeline to SNGPL network), we expect its materialization from 2QCY14 onwards and the impact on companies’ earnings from there onwards. Product prices may then be interesting to track as we expect a notch-up given higher gas prices along with pipeline expenditures incurred by the beneficiaries.
Gas and Fertilizer prices Historical Urea and DAP prices
Source: NFDC and Arif Habib Research
0
100
200
300
400
500
600
0200400600800
100012001400160018002000
2004
2005
2006
2007
2008
2009
2010
2011
2012
UreaFeed stockFuel stock
PKR/bag PKR/mmbtu
-500
1,000 1,500 2,000 2,500 3,000 3,500 4,000 4,500
CY
07
CY
08
CY
09
CY
10
CY
11
CY
12
Urea DAPPKR/bag
FFC 161 (3.54) FFBL 177 (0.64) ENGRO Fert 141 (1.91) ENGRO Corp - (4.00) Source: Arif Habib Research
FATIMA 161 0.63 Source: Arif Habib Research
Company Pass on price (PKR/bag)
Annualized EPS impact (pass-on)
Annualized EPS impact (no pass-on)
Pass on price (PKR/bag)Companies

7
Fertilizer Sector
Key Risks The key risk remains the unavailability of gas to the fertilizer plants, especially on the SNGPL network. In this regard, the materialization of the long-term plan and its timings are very crucial for the plants operating on the SNGPL network.
Alongside, pricing risk prevails, as the gov’t may pressurize the manufacturers to cut urea prices due to the plants utilizing its optimal capacities once the gov’t fulfils its commitment for the dedicated gas supply to all the companies operating on the SNGPL network. However, we believe the probability of this risk is low, as the gov’t is assuring gas supply to all the plants on SNGPL but at a significantly higher gas rate (56% higher than current levels) than the industry.
Additionally, the imported urea could be a threat to local manufacturers due to its subsidized price. The difference between the subsidized and the local prices is negatively related to the local sales. The GoP has already approved import of 0.17mn tons of urea for the upcoming Kharif season. This remains a threat in the short term.
Political instability and upcoming elections in May 13 remain a significant risk factor for the industry. The policies of the new gov’t and how it prioritizes gas allocation to the fertilizer sector would clarify the future of the fertilizer sector. However, with the long-term gas plan already approved, chances of gas curtailment would minimize as the plants operating on the SNGPL network would receive gas from the dedicated fields.

8
2012 Review
CY12 an ailing year for domestic fertilizers Urea offtake remains dull, higher prices come to rescue Total urea offtake for CY12 was down 11.5% YoY to stand at 5.2mn tons while our sample’s offtake was down 11.7%. However, as far as revenues are concerned, our fertilizer sample’s revenue rose 7% YoY. These incremental sales were mainly on account of higher urea prices (17% YoY in CY12) during the year. On the other hand, gross margins of our sample plunged by a massive 1,300bps during the year, from 50% in CY11 to 37% in CY12. This decline in gross margins was mainly due to upsurge in feed as well as fuel stock prices by massive 207% and 17% YoY to PKR 313/mmbtu and 510/mmbtu respectively. This decline in gross margins squeezed net margins to 15% in CY12, from a high of 27% in CY11.
Severe production losses amid acute gas dearth but better 4Q CY12 earnings Total urea production for CY12 clocked in at 4.3mn tons, down 12% YoY against the last year production of 4.9mn tons. This sizeable decline in the production was mainly due to the unavailability of gas particularly for the plants operating on the SNGPL network. As the commencement of Rabi season in 4Q was witnessed, along with expected increase in gas prices from Jan-13, urea offtake during 4QCY12 was boosted by 55% QoQ (pre-buying in expectation of increase in urea prices as seen in Jun-12). The profitability of our sample companies rose massive 151% QoQ to stand at PKR 9,294mn in 4QCY12.
Company-wise profitability analysis 2012 FFC remained the best-performer in our sector sample, as the company’s offtake remained intact at 2.4mn tons in comparison with the industry’s decline of 11.5% YoY. FFC’s bottomline was marginally down 7% YoY to PKR 20.84bn in CY12.
On the other hand, FFBL faced complete shutdown of gas in 1QCY12, leading to gross loss during the quarter. However, FFBL’s profitability jumped back, primarily due to prospering primary margins on DAP (increase in local product prices while decrease in int’l raw material prices). FFBL’s bottom-line plunged 60% YoY to PKR 4.3bn in CY12; the reduction was mainly due to the lower production of urea.
ENGRO was the key victim of gas curtailment during CY12; with its new plant remaining un-operational during 1HCY12 (arrangement was made in the 2HCY12 for diversion of gas to EnVen from the base plant due to annual turnaround). ENGRO’s total urea offtake plunged 25% YoY to 0.9mn tons while production contracted by 22% YoY in CY12. Thus, Engro Fertilizer recorded net loss of PKR 2.9bn in CY12, mainly owing to gas curtailment and immense financial cost burden.
CY12 Urea Offtake
Source: NFDC
0.0
1.0
2.0
3.0
4.0
5.0
6.0
7.0
2006
2007
2008
2009
2010
2011
2012
FFC FFBL ENGRO
FATIMA Industry
mn tons

9
Engro Corporation Limited
Engro Corporation Limited (ENGRO) Severe pain in CY12 CY12 was a miserable year for Engro Corporation, as its fertilizer arm only managed to operate for 45 days during the entire year. However, to lessen the severity of the situation, the company decided to divert gas from its base plant to EnVen. This enabled the company to yield 15-20% higher production from the same amount of gas due to efficiency of the new plant. However, it was a little too less and too late for CY12 profitability, which went downward by a hefty 77% YoY in CY12. However, net sales of Engro Corp. went up 9% YoY, mainly on account of 53% YoY jump in EFOOD’s sales in CY12. Despite a 400bps jump in gross margin of EFOOD, ENGRO suffered a 500bps drop in gross margins mainly on account of high gas prices and imposition of GIDC.
P&L (PKR mn) CY12A CY11A YoY Sales 125,151 114,612 9%
Gross profit 28,520 32,081 -11%
Selling and Admin expenses 11,683 10,177 15%
Other income 2,028 2,057 -1%
Finance cost 17,404 14,244 22%
Profit before taxation 2,457 11,459 -79%
Profit after taxation 1,797 7,811 -77%
EPS (PKR) 2.61 15.77
DPS (PKR) - 6.00 Source: Company accounts
GSA at USD 4.26/mmbtu for the pipeline while USD 3.2/mmbtu remains for CY13 The ECC has already extended the gas supply diversion from the Mari network to Enven till Dec-13. However, as per our discussion with the industry, the gov’t has turned down ENGRO’s request to supply the gas at a subsidized price of USD 0.7/mmbtu while USD 3.2/mmbtu has been continued at least for CY13.
Currently, ENGRO is operating its new plant (Enven) on Mari gas network (gas diversion from the base plant). Total gas availability to the new plant stands at 103mmcfd (93mmcfd from Mari, 10mmcfd from SNGPL). We foresee that, EFert will operate EnVen till the completion of the long-term gas plan (end 1QCY14) and the gas price will remain at USD 3.2/mmbtu. After completion of the long-term gas arrangement plan through a pipeline (details provided in annexure), while the company is expected to contend for its original GSA price of USc70/mmbtu, the gas price contract for the pipeline is expected to have been finalized at USD 4.26/mmbtu (feed gas at USD 3.75/mmbtu, USD 0.51/mmbtu as tolling charge). ENGRO is expected to operate both of its plants at 90% utilization levels once the pipeline becomes operational in CY14. Following table summarizes the benefits of gas diversion from base plant to EnVen.
Category Units Base EnVen Change
Gas mmcfd 93 103 10 mmcfd additional
Heat rate Btu/cu.f t 730 753 n.m
Gas mmbtu 67,890 77,559 9,669
Consumption mmbtu/ton 23.50 22.00 n.m
Production Tons/day 2,889 3,525 636
Production per annum Tons 953,349 1,163,385 22%
Total Capacity Tons 975,000 1,300,000 n.m
Capacity utilisation % 98% 89% n.m
Source: Arif Habib Research .
Target Price 196.00 Last Closing 130.03 UpsideKSE CodeBloomberg Code
Market Cap (US$ m)Outstanding Shares (m)Free Float12M Avg. Daily Turnover (m)12M High/Low (PKR)
Source: Company Financials
Source: Bloomberg
www.arifhabibltd.com
511.3 50%4.6
128.65/81.92Shareholding
678.4
The CompanyEngro Corporation Limited is a public listed company incorporated in Pakistan and its shares are quoted on Karachi, Lahore and Islamabad stock exchanges. The principal activity of the company is to manage investments in subsidairy companies and joint ventures. Engro fertilizer, Engro Polymer, Engro Foods, Engro Eximp and Engro Pow er are the subsidairies of Engro Corportaion, While Engro Vopak is a joint venture.
Stock Performance
Buy
51%ENGRO
ENGRO PA
Shares
60%
80%
100%
120%
140%
Mar
-12
Apr
-12
May
-12
Jun-
12Ju
l-12
Aug-
12Se
p-12
Oct
-12
Nov
-12
Dec
-12
Jan-
13
Feb-
13M
ar-1
3ENGRO KSE100
Joint Stcok
Co., 50.24%
Financial Ins., 8.04
%
Modaraba
Co., 5.73%
Others, 36.00%

10
Engro Corporation Limited
Pricing scenario once the long-term plan in place As far as product pricing is concerned, ENGRO is expected to maintain urea prices at current levels with least expectation of any price war in CY13, with part gas provision during the year. We derive our assumption from the demand-supply gap of urea, which is expected to remain widened as witnessed from regular imports being made by the gov’t. The GoP has already approved 0.13mn tons of urea for the Kharif season (commencing Apr-13 onwards). Even by mid 2014, when both of ENGRO’s plants are expected to be operational, we rule out any significant price cuts provided massive increase in contract gas price, especially for ENGRO (at USD4.26/mmbtu instead of Enven’s original contract price of USc70/mmbtu), unless the gas price is revised downward to the original GSA. Given huge financial burden and inability to absorb significant hike in the feed gas prices, increase in urea prices can be expected, instead.
What to expect in CY13? We have run sensitivity on EFert’s earrings assuming various possible scenarios. For the base-case of CY13 (remains same in all scenarios) we have assumed base plant to receive gas when there is an additional availability on the SNGPL network (recall the situation last year when Enven operated less than 45 days on SNGPL network) and Enven to operate at 90% capacity level (on Mari gas network) till the completion of the long-term gas plan (expected by end 1QCY14). Thus for CY13, the feed (gas) stock price for Enven will be USD 3.2/mmbtu (PKR 320.42/mmtbu same as current level) while for the base plant, once operational on incremental gas flows in CY13, the feed gas price expected to be applied will be USD 0.7/mmbtu (~PKR 70/mmtbu) till 1QCY14. ENGRO’s earnings sensitivity on CY13-gas diversion from Mari to Enven with old plant being run at USc70/mmbtu is provided as under:
CY13 Earnings ForecastCapacity UtilisationENVEN 90% 90% 90% 90%Base plant 14% in 45 days 13% in 40 days 10% in 30 days 0%Production (k tons)ENVEN 1,170 1,170 1,170 1170Base plant 140 124 93 0Total Production 1,310 1,294 1,263 1170Off take 1,266 1,251 1,221 1130Closing inventory 75 75 75 75Urea Prices (PKR) 1,670/bag 1,670/bag 1,670/bag 1,670/bagGas prices (USD/mmbtu)ENVEN (on Mari gas network) 3.2 3.2 3.2 3.2Base Plant (Rotational on SNGPL) 0.7 0.7 0.7 0.7EarningsENGRO Fertilizer (EPS: PKR) 2.39 2.22 1.89 0.93 Impact on Engro Corporation 4.99 4.65 3.98 1.95 ENGRO Corporation (EPS: PKR) 16.76 16.42 15.74 13.71 Source: Arif Habib Research
In addition to this, from 2QCY14 onwards, we have assumed Enven to operate at 90% utilization level, while base plant’s utilization depends upon the implementation of the long-term gas pipeline plan. We have run sensitivity on earnings based on the number of day’s base plant is anticipated to be operational (maximum 270 days or nine months) in CY14. Furthermore, the earnings sensitivity is based on two different feed gas price scenarios (from 2QCY14 onwards), which includes USD 4.26/mmbtu (gas sale price USD 3.75/mmbtu plus USD 0.51/mmbtu tolling charge), and USD 1.21/mmbtu (gas sale

11
Engro Corporation Limited price USD 0.7/mmbtu plus USD 0.51/mmbtu tolling charge). Our industry checks suggest ENGRO partially agreed on the gas sale price of USD 4.26/mmbtu and signed various GSAs for the long-term gas plan. However, company’s management is optimistic to bring back the gas sale price to USD 0.7/mmbtu (as per the original/initial agreement with SNGPL) though the company seems comfortable with the tolling charge of USD 0.51/mmbtu. Given its share in the gas allocation, ENGRO’s share in the long-term gas pipeline plan stands ~PKR 3.0bn out of total estimated cost of PKR 10bn, and we believe that ENGRO will utilize the existing subordinated loan of PKR 3bn to fund the Capex.
CY14 Earnings ForecastCapacity UtilisationENVEN 90% 90% 90% 90%Base plant 86% in 270 days 76% in 240 days 67% in 210 days 57% in 180 daysProduction (k tons)ENVEN 1,170 1,170 1,170 1,170 Base plant 838 745 652 559 Total Production 2,008 1,915 1,822 1,729 Off take 2,009 1,916 1,821 1,728 Closing inventory 75 75 75 75 Urea Prices 1,670/bag 1,670/bag 1,670/bag 1,670/bagGas prices (USD/mmbtu)ENVEN (on Mari gas network) 3.20 3.20 3.20 3.20 Base Plant (gas from long term plan) 4.26 4.26 4.26 4.26 EarningsENGRO Fertilizer (EPS: PKR) 8.42 7.89 7.34 6.79 Impact on Engro Corporation 17.66 16.56 15.41 14.26 ENGRO Corporation (EPS: PKR) 33.93 32.83 31.68 30.53 Source: Arif Habib Research
CY14 Earnings ForecastCapacity UtilisationENVEN 90% 90% 90% 90%Base plant 88% in 270 days 78% in 240 days 69% in 210 days 59% in 180 daysProduction (k tons)ENVEN 1,170 1,170 1,170 1,170 Base plant 838 745 652 559 Total Production 2,008 1,915 1,822 1,729 Off take 2,009 1,916 1,821 1,728 Closing inventory 75 75 75 75 Urea Prices 1,670/bag 1,670/bag 1,670/bag 1,670/bagGas prices (USD/mmbtu)ENVEN (on Mari gas network) 3.20 3.20 3.20 3.20 Base Plant (gas from long term plan) 1.21 1.21 1.21 1.21 EarningsENGRO Fertilizer (EPS: PKR) 12.36 11.38 10.39 9.41 Impact on Engro Corporation 25.94 23.87 21.80 19.74 ENGRO Corporation (EPS: PKR) 42.21 40.14 38.07 36.01 Source: Arif Habib Research
Valuation Our SOTP-based Dec-13 target price for the scrip (detailed company-wise value alongside) works out to PKR 196/share, translating into an upside potential of 51% from current level. However, any further change/revision in the subsidized gas availability and the long-term gas plan would lead us to amend our earnings estimates and the price target accordingly.
Target Prices (PKR/share) 13-Dec Corp Stake
Engro Fertilizer 45.92 100%
Engro Foods 102.81 88.54%
Engro Polymer 10.36 56.19%
Eximp 8.60 100%
Pow er 23.56 100%
Vopak 4.50 50%
Target Price Dec-13 196
Source; Arif Habib Research

12
Engro Corporation Limited
Financial Summary, Forecasts and Key Ratios PKR mn
Income Statement CY12A CY13E CY14F CY15F CY16FNet Sales 30,627 39,033 58,619 60,865 61,921 Gross profit 9,861 17,280 26,024 26,445 26,633 Gross margins 32% 44% 44% 43% 43%EBITDA margin 34% 45% 42% 41% 41%Operating Profit 6,778 13,678 20,753 20,860 20,927 Other income 379 884 1,172 1,217 1,238 Financial charges 10,703 9,922 7,450 5,141 3,303 PAT (2,935) 2,563 9,028 10,613 11,858 Net margins n.m 7% 15% 17% 19%Earnings per Share - Adjusted (PKR) (2.74) 2.39 8.42 9.89 11.05 DPS - - - - -
Balance Sheet CY12A CY13E CY14F CY15F CY16FTotal Shareholders' Equity 15,798 18,512 27,564 38,303 50,161 Non Current LiabilitiesLong Term Loan 48,482 33,906 20,471 10,142 3,983 Total Non Current Liabilities 55,459 40,883 27,448 17,119 10,961 Current LiabilitiesTrade and Other Payables 7,960 10,877 16,298 17,210 17,644 Total Current Liabilities 26,250 35,885 38,883 36,966 33,456 Total Liabilities and Equity 97,508 95,280 93,895 92,388 94,578 AssetsNon Current Assets 83,123 82,619 82,288 81,962 81,591 Current Assets 14,385 12,661 11,607 10,425 12,986 Total Assets 97,508 95,280 93,895 92,388 94,578
Cash Flow Statement CY12A CY13E CY14F CY15F CY16FCashflow from operating activities 6,371 11,033 18,297 14,746 15,633 Cash used in investing activities (1,857) (2,711) (2,953) (3,069) (3,118) Cashflow from financing activities (4,920) (7,708) (15,834) (13,033) (10,102) Net increase/(decrease in cash & equivalents (406) 614 (490) (1,355) 2,413 Cash 2,449 5,513 5,637 3,792 4,850
Ratio Analysis CY12A CY13E CY14F CY15F CY16FROE n.m 14% 33% 28% 24%ROA n.m 3% 10% 11% 13%Coverage ratio 0.63 1.38 2.79 4.06 6.34 Debt to equity 5.17 4.15 2.41 1.41 0.89 Debt to assets 0.84 0.81 0.71 0.59 0.47 Div yield 0% 0% 0% 0% 0%P/E n.m n.m n.m n.m n.mP/B n.m n.m n.m n.m n.mSource: Arif Habib Research

13
Fauji Fertilizer Company Limited
Fauji Fertilizer Company Limited (FFC) FFC remained the biggest beneficiary in terms of gas curtailment against peers in CY12, thanks to Mari’s gas network, which faced least gas curtailment (~12%-15%). FFC remained the market leader in urea sales, as the company managed to cater 46% of total urea off take. Company’s urea offtake remained intact at 2.4mn tons in CY12 as last year. Net sales of the company jumped 35% YoY to PKR 55bn in CY12. Improved sales were due to massive jump in urea prices by 17% YoY (mainly a pass on effect of GIDC imposition). However, gross margins of the company stood at 48%, down 1,400bps, as increase in urea prices was not sufficient enough to fully pass on the GIDC impact. Increase in gas prices along with the GIDC mainly contributed to this plunge in gross margins (partial pass-on of GIDC). Other income showed a massive decline of 36% YoY amid lower dividend income from the subsidiary FFBL.
P&L (PKR mn) CY12A CY11A YoY
Sales 74,333 55,221 35%
Gross profit 35,998 34,349 5%
Selling and Admin expenses 8,246 7,027 17%
Other income 4,268 6,630 -36%
Finance cost 999 786 27%
Profit before taxation 31,021 33,166 -6%
Profit after taxation 20,840 22,492 -7%
EPS (PKR) 16.38 17.68 -
DPS (PKR) 15.50 20.00 -23%
Source: Company accounts
Operational outlook Capacity utilization of the company was optimal in CY12, and was recorded at a huge 120%. We expect the company to carry forward with the same utilization level in CY13 as well, as the company operates on the least-affected Mari gas network, which is expected to remain the safest field in terms of gas supply.
Pricing scenario and impact FFC earnings are highly sensitive to urea price changes. We have run a sensitivity analysis on FFC earnings with respect to reduction in urea prices. Our sensitivity suggests every PKR 50/bag reduction in urea prices drags FFC earnings by PKR 1.11/share (-7% of base-case earnings for CY13). However, we do not expect any price cuts in the local urea prices due to prevailing demand-supply gap amid shortfall in production on account of unavailability of gas for most of CY13. Urea price cut can only be expected if all the capacities come online (ENGRO will have parallel capacity share with both of its plants fully operational) and given that the companies on the SNGPL network could easily bear additional cost burden of the feed stock price.
Reduction in urea prices PKR
50/bag PKR
100/bag PKR
150/bag PKR
200/bag
Base case EPS at PKR 1,670 EPS (PKR)
15.57 14.46 13.35 12.24 11.13
Change from the base-case -7% -14% -22% -29%
Source: Arif Habib Research
Target Price 126 Last Closing 109 UpsideKSE CodeBloomberg Code
Market Cap (US$ m)Outstanding Shares (m)Free Float12M Avg. Daily Turnover (m)12M High/Low (PKR)
Source: Company Financials
Source: Bloomberg
www.arifhabibltd.com
1,272.2 55%2.0
127.12/106.23Shareholding
1,413.0
The CompanyFauji Fertilizer Company Limited (FFC) is one of the key fertilizer players in Pakistan. It is a public company w ith shares listed on the Karachi, Lahore and Islamabad stock exchanges. The principal activity of the company is manufacturing, purchasing and marketing of fertilizers and chemicals. The Fauji Foundation has major shareholding in FFC w ith 44% stake.
Stock Performance
Buy
16%FFC
FFC PA
Shares
60%
70%
80%
90%
100%
110%
120%
130%
140%
Mar
-12
Apr
-12
May
-…Ju
n-12
Jul-1
2Au
g-12
Sep-
12O
ct-1
2N
ov-1
2D
ec-1
2Ja
n-13
Feb-
13M
ar-1
3
FFC KSE100
NIT & ICP, 3.3
%
Bank, DFI &
NBFI, 6.1%
Fauji Found., 44.3%
Others, 46.3%

14
Fauji Fertilizer Company Limited
Askari Bank transaction and other business ventures FFC has acquired 351mn shares of Askari Bank Ltd (AKBL) with the total estimated outlay of PKR 8.5bn. We expect FFC to easily fund this transaction with its cash and cash equivalent balances. Even after managing its working capital requirement, the company is left with PKR 1.6bn cash at the end CY13. However, to maintain its high dividend payout, we can expect the company to raise additional short-term debt for the transaction. Currently, FFC has available credit lines of PKR 11.24bn, out of which, only PKR 4.9bn had been used by the company as per the latest financials. Therefore, there is a bright chance that FFC could avail these credit lines for the funding of the aforesaid transaction and maintain its higher dividend payouts.
As far as earnings impact of the AKBL transaction’s impact on FFC earnings is concerned, assuming equity method treatment of the AKBL stake going forward, a cash dividend of PKR 0.5/share by AKBL ahead should yield a marginal impact on FFC (+0.8%) earnings according to FFC’s specified stake in AKBL. On the other hand, we expect earnings impact of FFC’s venture into wind power business to yield results. As per the latest info, the commercial operations of the FFCEL have not been started due to some technical reasons in the contract. However, on the basis of 16% ROE component, we have assumed that the commercial operation to start by 2HCY13 and having 1% annualized impact on the FFC earrings, keeping 20% equity contribution by the FFC.
Valuation Our Discounted Cash Flow (DCF) based December 2013 target price for FFC works out to PKR 126/share, translating into an upside potential of 16% from the last closing price of PKR 108.6/share. Our valuation is based on the market return of 19%, beta of 1.0 and a highly conservative terminal growth rate of 2%. Besides this sizeable upside potential the stock is trading at CY13 PER of 7.03x, offering a deep discount of 50% from the market PE, thus forming a strong case of rerating from current levels.
FFCStakeholding 60%AKBL Shares (mn) 351 Acquisition PKR bn OutlayPrice @ PKR 24.32/share 8.53 Source: KSE Notice, Arif Habib Research
FFC share in AKBL transaction
15
Fauji Fertilizer Company Limited
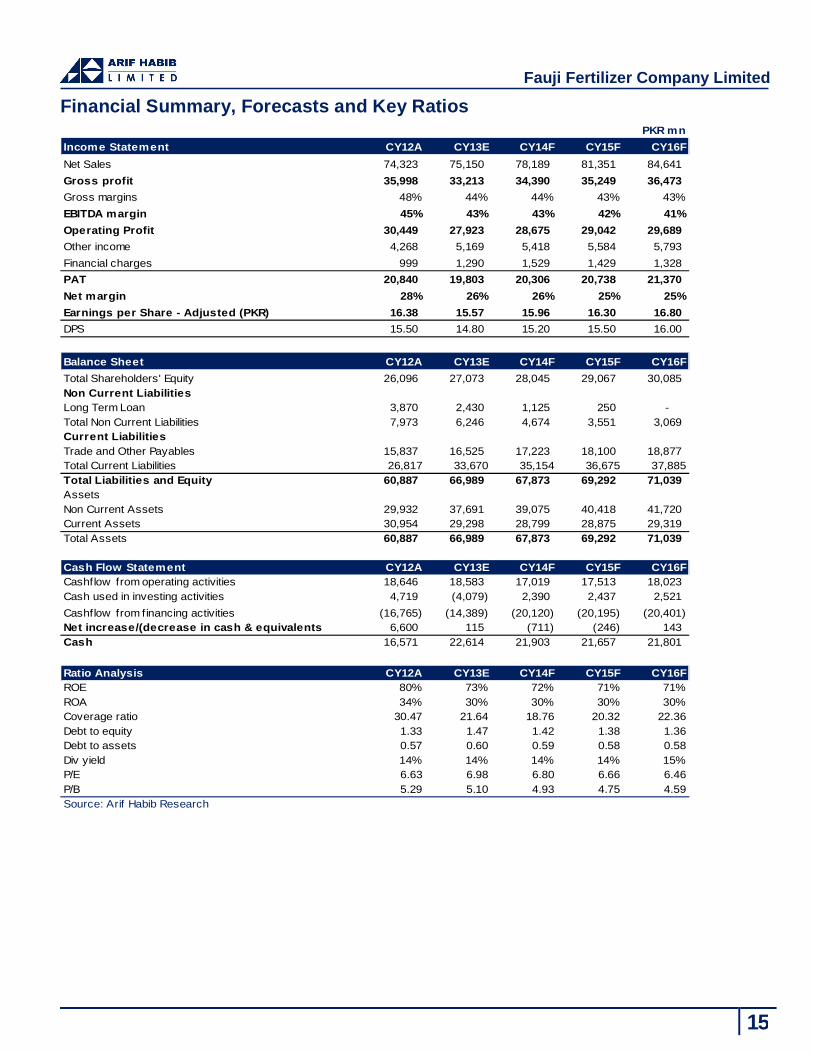
Financial Summary, Forecasts and Key Ratios PKR mn
Income Statement CY12A CY13E CY14F CY15F CY16FNet Sales 74,323 75,150 78,189 81,351 84,641 Gross profit 35,998 33,213 34,390 35,249 36,473 Gross margins 48% 44% 44% 43% 43%EBITDA margin 45% 43% 43% 42% 41%Operating Profit 30,449 27,923 28,675 29,042 29,689 Other income 4,268 5,169 5,418 5,584 5,793 Financial charges 999 1,290 1,529 1,429 1,328 PAT 20,840 19,803 20,306 20,738 21,370 Net margin 28% 26% 26% 25% 25%Earnings per Share - Adjusted (PKR) 16.38 15.57 15.96 16.30 16.80 DPS 15.50 14.80 15.20 15.50 16.00
Balance Sheet CY12A CY13E CY14F CY15F CY16FTotal Shareholders' Equity 26,096 27,073 28,045 29,067 30,085 Non Current LiabilitiesLong Term Loan 3,870 2,430 1,125 250 - Total Non Current Liabilities 7,973 6,246 4,674 3,551 3,069 Current LiabilitiesTrade and Other Payables 15,837 16,525 17,223 18,100 18,877 Total Current Liabilities 26,817 33,670 35,154 36,675 37,885Total Liabilities and Equity 60,887 66,989 67,873 69,292 71,039 AssetsNon Current Assets 29,932 37,691 39,075 40,418 41,720 Current Assets 30,954 29,298 28,799 28,875 29,319 Total Assets 60,887 66,989 67,873 69,292 71,039
Cash Flow Statement CY12A CY13E CY14F CY15F CY16FCashflow from operating activities 18,646 18,583 17,019 17,513 18,023 Cash used in investing activities 4,719 (4,079) 2,390 2,437 2,521 Cashflow from financing activities (16,765) (14,389) (20,120) (20,195) (20,401) Net increase/(decrease in cash & equivalents 6,600 115 (711) (246) 143 Cash 16,571 22,614 21,903 21,657 21,801
Ratio Analysis CY12A CY13E CY14F CY15F CY16FROE 80% 73% 72% 71% 71%ROA 34% 30% 30% 30% 30%Coverage ratio 30.47 21.64 18.76 20.32 22.36 Debt to equity 1.33 1.47 1.42 1.38 1.36 Debt to assets 0.57 0.60 0.59 0.58 0.58 Div yield 14% 14% 14% 14% 15%P/E 6.63 6.98 6.80 6.66 6.46P/B 5.29 5.10 4.93 4.75 4.59 Source: Arif Habib Research

16
Fauji Fertilizer Bin Qasim Limited
Fauji Fertilizer Bin Qasim Limited (FFBL) CY12 remained a turbulent year for FFBL as well as the company has also been plagued by the notorious gas shortages during CY12. FFBL’s plant remained shut on numerous occasions due to persistent gas curtailments, including a complete shutdown that the company plant went under for 1QCY12. However, sailing through such serious issues, FFBL’s profitability reverted in 2HCY12 causing bottom-line to turn red. The company recorded profit after tax (PAT) of PKR 4,338mn, a plunge of 60% YoY. This decline in profitability was on account of numerous issues, which mainly included: 1) total gas cut due to which urea production was completely halted during 1QCY12, and 2) primary margins of DAP showed a downward trend 9% YoY as compared to last year. Though steep recovery was observed in 2HCY12, along with that, lower urea offtake led the company to face this massive decline in its profitability during CY12.
P&L (PKR mn) CY12A CY11A YoY
Sales 47,911 55,869 -14%
Gross profit 11,461 20,116 -43%
Selling and Admin expenses 2,650 3,331 -20%
Other income 1,045 1,650 -37%
Finance cost 1,821 1,088 67%
Profit before taxation 6,469 16,170 -60%
Profit after taxation 4,338 10,767 -60%
EPS (PKR) 4.64 11.53
DPS (PKR) 4.50 10.00
Source: Company accounts
Operational outlook Going forward, we assume gas curtailment to remain at the same level as last year (total 45% including annual turnaround). Thus, we expect that the company would be able to operate its urea plant on 55% capacity while on the other hand, DAP plant is expected to operate at its optimal capacity.
Pricing scenario and impact We do not expect any price cuts in urea prices in the short term, as discussed earlier, while as far as FFBL is concerned, urea sales could be called as a third wheel in the company’s profitability as DAP remains the company’s primary product. On the other hand, DAP prices may seek a decline in CY13 by PKR 100-150/bag range, mainly owing to weakening DAP prices internationally.
Thriving DAP primary margins Primary margins of DAP is expected to remain on the impressive side, as we have already seen the declining trend in the int’l phosphoric acid prices since Mar-12. In the same tenure, the local DAP prices were stable, in fact, FFBL increased local DAP prices by PKR 150/bag in the 4QCY12. As a result of the contrary movements, DAP’s primary margins jumped to USD 280/ton in 4QCY12.
In 1QCY13, the company’s phos-acid contract was also settled at USD 770/ton, down 10% QoQ. However, with the full-fledged gas curtailment in winters faced by the company in the first two months of 1QCY13, it couldn’t yield the company much advantage out of it.
Target Price 45.0 Last Closing 37.0 UpsideKSE CodeBloomberg Code
Market Cap (US$ m)Outstanding Shares (m)Free Float12M Avg. Daily Turnover (m)12M High/Low (PKR)
Source: Company Financials
Source: Bloomberg
www.arifhabibltd.com
934.1 35%1.9
45.93/35.73Shareholding
352.8
The Company
Stock Performance
Buy
22%FFBL
FFBL PA
Shares
Fauji Fertilizer Bin Qasim Limited (FFBL) is a public limited company w ith its shares quoted on all three bourses of Pakistan. The principal activity of the company is manufacturing, purchasing and marketing of fertilizers. The company is a sudsidiary of Fauji Fertilizer Company Limited (FFC) having shareholding of 50.88%. Fauji Foundation is another major shareholder of FFBL.
60%
70%
80%90%
100%
110%
120%130%
140%
Mar
-12
Apr
-12
May
-12
Jun-
12Ju
l-12
Aug-
12Se
p-12
Oct
-12
Nov
-12
Dec
-12
Jan-
13F
eb-1
3M
ar-1
3
FFBL KSE100
FFC, 50.9%
Fauji Found., 23.2
%
Banks &
FIs., 8.4%
Others,34.4%

17
Fauji Fertilizer Bin Qasim Limited DAP primary margins Phosphoric acid price trend
Source: NFDC and Arif Habib Research
Askari Bank transaction and other business ventures FFBL has acquired 175mn shares of Askari Bank Limited with the total estimated outlay of PKR 4.27bn. Along with that, company is diversifying its base business and ready to enter in the meat export business with the expected completion by mid 2015. As far as AKBL transaction’s impact on FFBL’s earnings is concerned, assuming equity method treatment of the AKBL stake going forward, like FFC, a cash dividend of PKR 0.5/share by AKBL ahead should yield a marginal impact on FFBL (+1%) earnings according to FFBL’s specified stake in AKBL.
However, as far as the impact of meat business on FFBL’s earnings is concerned, the business is in its initial stage and, therefore, earnings impact can be calculated once detail is made available by the company. In addition to this, FFBL holds 35% each in Foundation Wind Energy I and II, which are scheduled to be completed in 2013. We will incorporate earnings impact of the same into FFBL’s bottomline once detail of the projects is made available.
Valuation Our Discounted Cash Flow (DCF) based December 2013 target price for FFBL works out to PKR 45/share, translating into a striking upside potential of 20 % from closing price of PKR 37.02 /share. Our valuation is based on the market return of 19%, beta of 1.09 and a very conservative terminal growth rate of 2% applied to the company valuation. Besides this sizeable upside potential, the stock trades at CY13 PER of 5.58x, offering a deep discount of 61% from the market PE, thus compelling a strong case of stock rerating from current levels.
255 260 265 270 275 280 285 290 295 300 305 310
-100 200 300 400 500 600 700 800 900
CY11A CY12A CY13F
Primary MarginsDAP CoversionLocal DAP
USD/ton USD/ton
700750800850900950
100010501100
Jan-
12
Feb-
12
Mar
-12
Apr-
12
May
-12
Jun-
12
Jul-1
2
Aug-
12
Sep-
12
Oct
-12
Nov
-12
Dec
-12
Jan-
13
Feb-
13
Mar
-13
USD/ton
FFBLStakeholding 30%AKBL Shares (mn) 175 Acquisition PKR bnPrice @ PKR 24.32/share 4.27 Source: KSE Notice, Arif Habib Research
FFBL share in AKBL transaction

For important disclosure and analyst certification, kindly refer to end of the report 18
Fauji Fertilizer Bin Qasim Limited
Financial Summary, Forecasts and Key Ratios PKR mn
Income Statement CY12A CY13E CY14F CY15F CY16FNet Sales 47,911 50,336 53,771 57,520 61,571 Gross profit 11,461 13,414 14,320 15,262 16,329 Gross margins 23.9% 26.6% 26.6% 26.5% 26.5%EBITDA m argin 20% 23% 23% 23% 23%Operating Profit 7,811 10,449 11,176 11,928 12,799 Other income 1,045 659 489 478 488 Financial charges 1,821 976 970 1,038 1,112 PAT 4,338 6,217 6,557 6,965 7,454 Net margin 9% 12% 12% 12% 12%Earnings per Share - Adjusted (PKR) 4.64 6.66 7.02 7.46 7.98 DPS 4.50 6.00 6.30 6.70 7.20
Balance Sheet CY12A CY13E CY14F CY15F CY16FTotal Shareholders' Equity 12,631 13,243 13,909 14,616 15,344 Non Current LiabilitiesLong Term Loan 1,232 924 616 308 - Total Non Current Liabilities 4,905 4,564 4,289 4,014 3,739 Current LiabilitiesTrade and Other Payables 11,176 10,600 11,326 12,132 12,989 Total Current Liabilities 23,168 20,203 21,513 22,968 24,514 Total Liabilities and Equity 40,704 38,010 39,711 41,597 43,597 AssetsNon Current Assets 17,435 22,514 23,681 24,890 26,143 Current Assets 23,268 15,496 16,030 16,707 17,455 Total Assets 40,704 38,010 39,711 41,597 43,597
Cash Flow Statement CY12A CY13E CY14F CY15F CY16FCashflow from operating activities 1,443 9,689 8,529 10,091 10,673 Cash used in investing activities 6,827 (6,493) (2,675) (2,853) (3,052) Cashflow from financing activities (9,105) (9,278) (6,579) (6,956) (7,456) Net increase/(decrease) in cash & equivalents (836) (6,082) (724) 282 165 Cash 4,717 2,707 1,982 2,264 2,430
Ratio Analysis CY12A CY13E CY14F CY15F CY16FROE 34% 47% 47% 48% 49%ROA 11% 16% 17% 17% 17%Coverage ratio 4.29 10.71 11.52 11.49 11.51 Debt to equity 2.22 1.87 1.86 1.85 1.84 Debt to assets 0.69 0.65 0.65 0.65 0.65 Div yield 12% 16% 17% 18% 19%P/E 7.97 5.56 5.27 4.96 4.64P/B 2.74 2.61 2.49 2.37 2.25 Source: Arif Habib Research

19
Page left blank intentionally
20
Fertilizer Sector
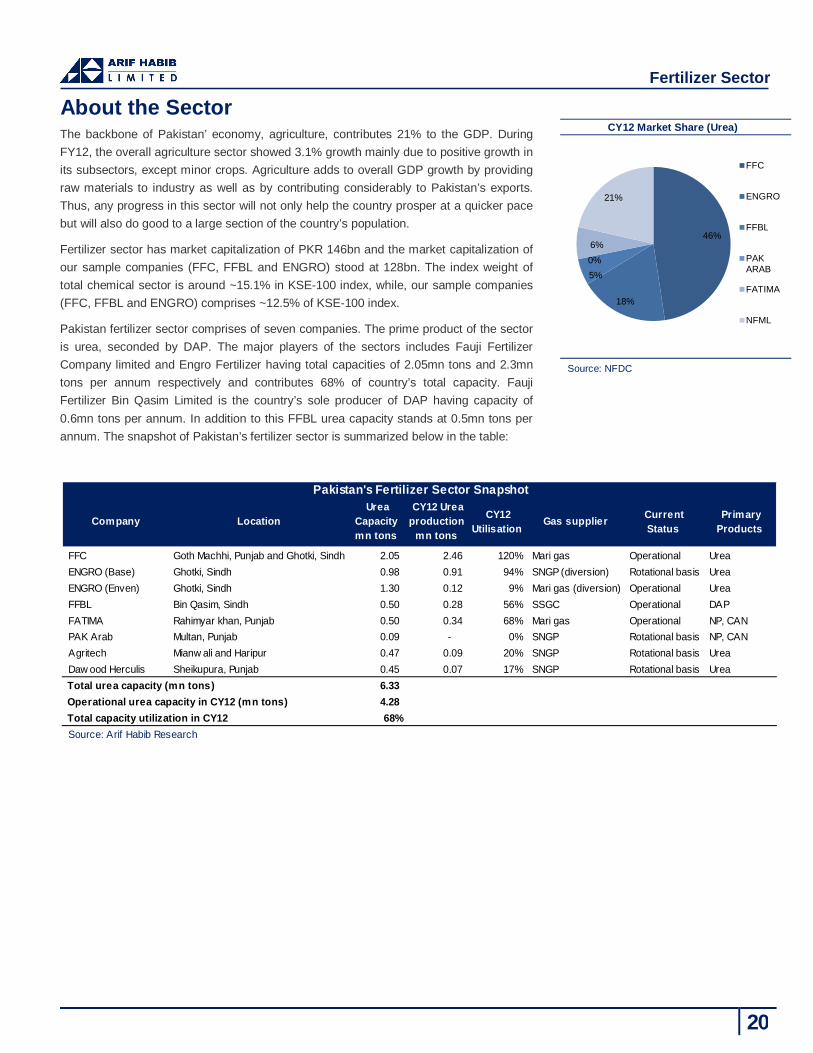
About the Sector The backbone of Pakistan’ economy, agriculture, contributes 21% to the GDP. During FY12, the overall agriculture sector showed 3.1% growth mainly due to positive growth in its subsectors, except minor crops. Agriculture adds to overall GDP growth by providing raw materials to industry as well as by contributing considerably to Pakistan’s exports. Thus, any progress in this sector will not only help the country prosper at a quicker pace but will also do good to a large section of the country’s population.
Fertilizer sector has market capitalization of PKR 146bn and the market capitalization of our sample companies (FFC, FFBL and ENGRO) stood at 128bn. The index weight of total chemical sector is around ~15.1% in KSE-100 index, while, our sample companies (FFC, FFBL and ENGRO) comprises ~12.5% of KSE-100 index.
Pakistan fertilizer sector comprises of seven companies. The prime product of the sector is urea, seconded by DAP. The major players of the sectors includes Fauji Fertilizer Company limited and Engro Fertilizer having total capacities of 2.05mn tons and 2.3mn tons per annum respectively and contributes 68% of country’s total capacity. Fauji Fertilizer Bin Qasim Limited is the country’s sole producer of DAP having capacity of 0.6mn tons per annum. In addition to this FFBL urea capacity stands at 0.5mn tons per annum. The snapshot of Pakistan’s fertilizer sector is summarized below in the table:
FFC Goth Machhi, Punjab and Ghotki, Sindh 2.05 2.46 120% Mari gas Operational UreaENGRO (Base) Ghotki, Sindh 0.98 0.91 94% SNGP (diversion) Rotational basis UreaENGRO (Enven) Ghotki, Sindh 1.30 0.12 9% Mari gas (diversion) Operational UreaFFBL Bin Qasim, Sindh 0.50 0.28 56% SSGC Operational DAPFATIMA Rahimyar khan, Punjab 0.50 0.34 68% Mari gas Operational NP, CANPAK Arab Multan, Punjab 0.09 - 0% SNGP Rotational basis NP, CANAgritech Mianw ali and Haripur 0.47 0.09 20% SNGP Rotational basis UreaDaw ood Herculis Sheikupura, Punjab 0.45 0.07 17% SNGP Rotational basis Urea
6.33 4.28 68%
Source: Arif Habib Research Total capacity utilization in CY12
Pakistan's Fertilizer Sector Snapshot
Operational urea capacity in CY12 (mn tons)
Gas supplier Current Status
Primary Products
Company Location
Total urea capacity (mn tons)
Urea Capacity mn tons
CY12 Urea production
mn tons
CY12 Utilisation
CY12 Market Share (Urea)
Source: NFDC
46%
18%
5%0%6%
21%
FFC
ENGRO
FFBL
PAK ARAB
FATIMA
NFML

21
Annexure
Gas Plan for Fertilizer Sector
Long Term Gas Plan
Short Term Gas Plan
Fields mmcfd Avaliablity (months)Mari SML 22 2 to 3 monthsReti Maru 10 5 to 6 monthsSara West n.a n.aTotal 32 Source: Arif Habib Research
Short term plan
Fields Information Fields Location OperatorKunnar Pasaki Deep Hyderabad, Sindh OGDCMari SML Dharki, Sindh Mari Gas Company Ltd Bahu Kohat, KPK OGDC Reti Maru Dharki, Sindh OGDC Markori East Kohat, Karak, KPK PPL Sara West Dharki, Sindh OGDC, POL Source: Company Websites and Arif Habib Research
Plant Information Fertilizer Companies LocationEngro Dharki, District Ghotki SindhDawood Herculus Fertilizer Sheikhupura, PunjabPak Arab Fertilizer Kherwal Road, MultanAgritech Limited Mianwali & HaripurSource: Company Websites and Arif Habib Research
Fields mmcfd Avaliablity (months) Company mmcfd
Kunnar Pasaki Deep 130 16 to 18 months Engro 79 Mari SML 22 2 to 3 months Dawood Herculus Fertilizer 40
Bahu 15 n.a Pak Arab Fertilizer 58 Reti Maru 10 5 to 6 months Agritech Limited 25 Markori East 25 n.a Total 202 Total 202 Source: Arif Habib Research
Source: Arif Habib Research
Long term plan Long term plan breakup

For important disclosure and analyst certification, kindly refer to end of the report 22
Annexure
ENGRO Plan (Reti Maru and Mari)

For important disclosure and analyst certification, kindly refer to end of the report 23
Annexure
ENGRO Plan (Sara West)

For important disclosure and analyst certification, kindly refer to end of the report 24
Annexure
ENGRO Plan (Kunnar Pasaki Deep)

For important disclosure and analyst certification, kindly refer to end of the report 25
Annexure
Bahu to Other Plants

For important disclosure and analyst certification, kindly refer to end of the report 26
Annexure
Makori East to Other Plants

27
List of Abbreviation ~ - Approximately
AGRI - Agritech Limited bn - Billion
bps – Base points CY- Calendar Year DAP - Di Ammonium Phosphate
DAWH - Dawood Hercules Corporation Div. Yield – Dividend Yield
DPS – Dividend per Share ECC – Economic Coordination Committee
Efert – Engro Fertilizers EPS – Earning per Share
FATIMA – Fatima Fertilizer Company Limited FFBL – Fauji Fertilizer Bin Qasim Limited
FFC – Fauji Fertilizer Company GIDC - Gas Infrastructure Development Surcharge
GoP – Government of Pakistan GSA – Gas Sale Agreement
Int’l – International KSE-100 – Karachi Stock Exchange 100 Index
MARI SML – MARI Sui Main mmbtu - Million Metric British Thermal Units
mn - Million NFDC – National Fertilizer Development Centre NFML – National Fertilizer Marketing Limited
OGRA – Oil Gas Regulatory Authority P/B – Price to Book
P/E – Price Earning PAK ARAB – Pakarab Fertilizers Limited
PKR – Pakistani Rupee QCY – Quarter Calendar Year
QoQ – Quarter on Quarter SNGPL - Sui Northern Gas Pipe Lines
USc – United States Dollar (cent) USD – United States Dollar
YoY – Year on Year
28
Disclaimer and related information
Analyst certification
The analysts for this report certify that all of the views expressed in this report accurately reflect their personal views about the subject companies and their securities, and no part of the analysts’ compensation was, is or will be, directly or indirectly related to specific recommendations or views expressed in this report.
Disclosures and disclaimer
This document has been prepared by investment analyst at Arif Habib Limited (AHL). AHL investment analysts occasionally provide research input to the company’s Corporate Finance and Advisory Department.
This document does not constitute an offer or solicitation for the purchase or sale of any security. This publication is intended only for distribution to current and potential clients of the Company who are assumed to be reasonably sophisticated investors that understand the risks involved in investing in equity securities.
The information contained herein is based upon publicly available data and sources believed to be reliable. While every care was taken to ensure accuracy and objectivity, AHL does not represent that it is accurate or complete and it should not be relied on as such. In particular, the report takes no account of the investment objectives, financial situation and particular needs of investors. The information given in this document is as of the date of this report and there can be no assurance that future results or events will be consistent with this information. This information is subject to change without any prior notice. AHL reserves the right to make modifications and alterations to this statement as may be required from time to time. However, AHL is under no obligation to update or keep the information current. AHL is committed to providing independent and transparent recommendation to its client and would be happy to provide any information in response to specific client queries.
Past performance is not necessarily a guide to future performance. This document is provided for assistance only and is not intended to be and must not alone be taken as the basis for any investment decision. The user assumes the entire risk of any use made of this information. Each recipient of this document should make such investigation as it deems necessary to arrive at an independent evaluation of an investment in the securities of companies referred to in this document (including the merits and risks involved), and should consult his or her own advisors to determine the merits and risks of such investment. AHL or any of its affiliates shall not be in any way responsible for any loss or damage that may be arise to any person from any inadvertent error in the information contained in this report.
We and our affiliates, officers, directors, and employees may: (a) from time to time, have long or short positions in, and buy or sell the securities thereof, company (is) mentioned herein or (b) be engaged in any other transaction involving such securities and earn brokerage or other compensation or act as advisor to such company (is) or have other potential conflict or interest with respect to any recommendation and related information and opinions. The disclosures of interest statements incorporated in this document are provided solely to enhance the transparency and should not be treated as endorsement of the views expressed in the report. AHL generally prohibits it analysis, persons reporting to analysts and their family members from maintaining a financial interest in the securities that the analyst covers.
All brands, logos, products & services and names mentioned in the report are, or may be, trademarks/property of the companies covered in the report, which have been used to identify products and services of the respective companies.
© 2013 Arif Habib Limited, Corporate Member of the Karachi, Lahore and Islamabad Stock Exchanges and Pakistan Merchentile Exchange. No part of this publication may be copied, reproduced, stored or disseminated in any form or by any means without the prior written consent of Arif Habib Limited.

29
Contacts
Management Designation Email Telephone
Shahid Ali Habib Chief Executive Officer [email protected] +92 -21-3240-1930
Equities Research Designation Email Telephone
Khurram Schehzad Head of Research [email protected] +92-21-3246-0742
Syed Abid Ali Assistant Vice President [email protected] +92-21-3246-2589
Sana Tawfik Economist and Analyst [email protected] +92-21-3246-1106
Tahir Abbas Analyst [email protected] +92-2132460717-19 Ext : 248
Taseer Abbas Analyst [email protected] +92-2132460717-19 Ext : 248
Numair Ahmed Analyst [email protected] +92-2132460717-19 Ext : 248
Rao Amir Ali Database Manager [email protected] +92-2132460717-19 Ext : 211
Ovais Shakir Database Officer [email protected] +92-2132460717-19 Ext : 211
Domestic sales Designation Email Telephone
Mohammed Imran, CFA, ACCA Head of Equity Sales [email protected] +92-21-3246-2596
M. Yousuf Ahmed Senior Vice President [email protected] +92-21-3242-7050
Farhan Mansoori Vice President [email protected] +92-21-3242-9644
Syed Farhan Karim Vice President [email protected] +92-21-3244-6255
Afshan Aamir Vice President [email protected] +92-21-3244-6256
Faraz Naqvi Assistant Vice President [email protected] +92-21-3244-6254
Furqan Aslam Assistant Vice President [email protected] +92-21-3240-1932
Azhar Javaid Manager Corporate Sale [email protected] +92-21-3246-8312
International Sales Designation Email Telephone
Adnan Katchi Head of International Sales [email protected] +92-21-3246-0743
Money Market & FX Designation Email Telephone
Zilley Askari Head of Inter Bank Brokerage
[email protected] +92-21-3240-0223
Corporate finance and advisory
Designation Email Telephone
M. Rafique Bhundi Head of Corporate Finance [email protected] +92-21-3246-0741
Usman Saeed Assistant Vice President [email protected] +92-21-3246-2597
Muhammad Zeeshan, CFA Assistant Vice President [email protected] +92-21-3246-0741
Ahmad Zeeshan Senior Analyst [email protected] +92-21-3246-2597