fertilizer sector improvement project report of 2015-2016 ... · fertilizer sector improvement...
TRANSCRIPT

Fertilizer Sector Improvement Project
Report of 2015-2016 Dry Season Trials
Trials with the Urea Deep Placement Technique on Transplanted Rice, Broadcast Rice, and
Rice-Gram System in Myanmar
Funded by
Implemented by
P.O. Box 2040
Muscle Shoals, Alabama 35662, USA
www.ifdc.org
October 2016

i
Table of Contents
Page Introduction ......................................................................................................................................1
Trials Tested in 2016 Dry Season .......................................................................................... 2 Materials and Methods .....................................................................................................................3
Site Selection .......................................................................................................................... 3 Trial Failures .......................................................................................................................... 3 Varieties and Farmers ............................................................................................................. 3 Experimental Design .............................................................................................................. 4 Basal Fertilizers ...................................................................................................................... 4 Treatments for UDP Adaptation Trials on Transplanted Rice ............................................... 5 Treatments for N-Rate Trials on Transplanted Rice .............................................................. 6 Treatments for UDP Before Broadcasting Seed .................................................................... 6 Treatments for UDP Spacing Trial on BR ............................................................................. 7 Treatments for Nitrogen x Potassium on TPR ....................................................................... 7 Treatments for Plant Spacing x Nitrogen Trials on TPR ....................................................... 8 Treatments for Fertilizer Management in the Rice-Gram System ......................................... 8 Treatments for Different Seed Rates on BR using UDP ........................................................ 9 Treatments for N-Rate Trial on Black Gram Using UDP and Prilled Urea ........................... 9 Plot Size and Spacing ........................................................................................................... 10 Weeds and Water Problems ................................................................................................. 10
Results and Discussion ..................................................................................................................11 UDP Adaptation Trials ......................................................................................................... 11
Yield (mt/ha) .................................................................................................................... 11 Dry Grain Weight of Biomass (g/25 plants) ..................................................................... 11 Number of Panicles per Hill ............................................................................................. 14 1,000-Grain Weight (g) .................................................................................................... 15 Agronomic Efficiency (AE) – Yield Grain per kg N Applied ......................................... 15 UDP, Yield Parameters, and Yield ................................................................................... 16
N-Rate Trial at Myaungmya ................................................................................................ 16 UDP Before Seed Broadcasting Trials ................................................................................. 19 UDP Spacing Trials on Broadcast Rice ............................................................................... 21 Nitrogen x Potassium on TPR at Chantharkone, Letpadan .................................................. 24 Plant Spacing x Nitrogen Rate Trial on TPR at Thewatchaung, Letpadan .......................... 25 Fertilizer Management Trials on Rice-Gram Cropping System .......................................... 26 Different Seed Rate Trial on BR .......................................................................................... 28 N-Rate Trial on Black Gram Using UDP and Prilled Urea ................................................. 29
Conclusion .....................................................................................................................................29

ii
UDP Adaptation Trials ......................................................................................................... 29 N-Rate Trial .......................................................................................................................... 30 UDP Before Broadcasting Trial on BR ................................................................................ 30 UDP Spacing Trials on BR .................................................................................................. 31 Nitrogen x Potassium Trial on TPR ..................................................................................... 31 Plant Spacing and N Rate Trial on TPR ............................................................................... 31 Fertilizer Management Trials on Rice-Gram Cropping System .......................................... 32 Different Seed Rates Trial .................................................................................................... 32
Appendix 1. Data Sheets ...............................................................................................................38 Eingyi, Twantay ................................................................................................................... 38 Inglone, Kunchangone ......................................................................................................... 39 Pyinmalwin, Daik-U ............................................................................................................. 40 Zaybine, Thanatpin ............................................................................................................... 41 Research Farm, Myaungmya ................................................................................................ 42 Yindaikkwin, Taikkyi ........................................................................................................... 43 Kanyingae, Kyaiklat ............................................................................................................. 44 Yindaikkwin, Taikkyi ........................................................................................................... 45 Kanyingae, Kyaiklat ............................................................................................................. 46 Chantharkone, Letpadan ....................................................................................................... 47 Thewatchaung, Letpadan ..................................................................................................... 48 Tharkwin, Einme .................................................................................................................. 49 Paramidaunt, Einme ............................................................................................................. 50 Ashaebine, Kyauktan ........................................................................................................... 51 Seed Rate Trial at Eingyi, Twantay ..................................................................................... 52
Photos .............................................................................................................................................53
List of Tables
Page
Table 1. Locations and Coordinates of Field Trials, Dry Season 2016 ................................ 3 Table 2. Varieties, Trial Types, and Collaborating Farmers for the 2016 Dry Season
Trials ....................................................................................................................... 4 Table 3. Experimental Designs Used for 2016 Dry Season Trials ....................................... 5 Table 4. Plot Size and Spacing Used for Specific Trial, 2016 Dry Season Trials .............. 10 Table 5. Locations, Varieties, and Dates of All Trials ....................................................... 34 Table 6. Test of Significant Levels of Plant Characteristics and Biomass Yield for All
Locations ............................................................................................................... 35 Table 7. Average Yield (mt/ha) of Different Treatments at All Locations ........................ 35

iii
Table 8. Percent Yield Superiority of UDP Over Other Treatments .................................. 35 Table 9. Biomass Grain Weight (g/25 plants) of Different Treatments at All Locations ... 36 Table 10. Number of Panicles per Hill of Different Treatments at All Locations ............... 36 Table 11. 1,000-Grain Weight (g) of Different Treatments at All Locations ....................... 36 Table 12. Agronomic Efficiency Values of Treatments at All Locations ............................ 36 Table 13. Analysis of Variance on Yield (t/ha) and Other Characteristics of N-Rate
Trial at Myaungmya ............................................................................................. 37 Table 14. Test of Significant Level for Yield and Component Characteristics of
Fertilizer Management Trial on Rice-Gram Cropping System ............................ 37
List of Figures
Figure 1. Paddy Yield Comparison of Different Treatments by Location ........................... 14 Figure 2. Response of Plant Height (cm) on Different N Rates ........................................... 17 Figure 3. Response of Number of Panicles per Hill on Different N Rates .......................... 18 Figure 4. Response of Biomass Straw Weight on Different N Rates .................................. 18 Figure 5. Yield Comparison of UDP Application, FP, and Zero N at Kanyingae and
Yindaikkwin ......................................................................................................... 21 Figure 6. Yield Response to Different UDP Spacing by Locations ..................................... 23 Figure 7. Yield Response (mt/ha) on Different Rates of Nitrogen and Potassium .............. 25 Figure 8. Yield Response (mt/ha) on Different Plant Spacing and Nitrogen Rates ............. 26
List of Photos
Photo 1. Layout and Land Leveling on UDP Spacing Trial at Kanyingae, Kyaiklat, Ayeyarwady, on December 1, 2015 ..................................................................... 53
Photo 2. Strengthening Separated Bunds Just Before Urea Application on UDP Adaptation Trial at Inglone, Kunchangone, Yangon, on January 28, 2016 ......... 53
Photo 3. Transplanting UDP Adaptation Trial at Eingyi, Twantay, Yangon, on January 27, 2016 ................................................................................................... 54
Photo 4. Sample Area for Crop Cut Harvesting Seed Rate Trial at Eingyi, Twantay, Yangon, on April 22, 2016 (Note: crop lodging) ................................................. 54
Photo 5. Harvesting UDP Adaptation Trial at Eingyi, Twantay, Yangon, on April 22, 2016 ...................................................................................................................... 55
Photo 6. Green Gram Crop from Fertilizer Management Trial on Rice-Gram System at Ashaebine, Kyauktan, Yangon, on February 2, 2016 (just before harvest) ...... 55

i
Acronyms and Abbreviations
AE Agronomic Efficiency
ANOVA Analysis of Variance
BR Broadcast Rice
Ca Calcium
cm centimeter
CV Coefficient of Variation
ft foot
FP Farmer’s Practice
FSI Fertilizer Sector Improvement
g gram
ha hectare
HYV High-Yielding Variety
IFDC International Fertilizer Development Center
in inch
K Potassium
kg kilogram
lb pound
LSD Least Significant Difference
m meter
MOP Muriate of Potash
mt metric ton
N Nitrogen
P Phosphorus
PU Prilled Urea
RCB Randomized Complete Block
S Sulfur
TSP Triple Superphosphate
TPR Transplanted Rice
UB Urea Broadcast
UDP Urea Deep Placement
USAID United States Agency for International Development

ii
Conversions
To Convert To Multiply by
acre hectare 0.4047
hectare acre 2.471
U.S. ton/acre mt/ha 2.24
lb/acre kg/ha 1.12
kg/ha lb/acre 0.89
K2O K 0.83
K K2O 1.2047
P2O5 P 0.4364
P P2O5 2.2915

1
Trials of Urea Deep Placement Technique on Transplanted Rice, Broadcast Rice, and Rice-
Gram System in 2015-2016 Dry Season, Myanmar
Introduction
Urea deep placement (UDP) technology is a proven technology that can increase the yield of
transplanted lowland rice by 15-20% with less use of urea (up to 40%) compared to broadcast
application of urea. This has been proven in Bangladesh and in sub-Saharan African
countries.
A number of UDP trials, with transplanted rice (TPR), were conducted at selected locations
in Yangon, Bago, and Ayeyarwady regions in Myanmar, during the 2014 wet season to 2015
wet season by the International Fertilizer Development Center (IFDC) through the Fertilizer
Sector Improvement (FSI) project, funded by the United States Agency for International
Development (USAID).
In the 2014 wet season, UDP technology, using the same or a lesser rate of nitrogen (N),
showed superiority over urea broadcasting (UB) at rates recommended by the Department of
Agriculture and at rates used by local farmers (farmer’s practice, FP). Average yield
increased by 11.57%, ranging from 3.06% to 24.92%.
In the 2015 dry season, UDP adaptation trials were run again, and it was found that the UDP
treatment out-yielded the FP treatment and the UB treatment by up to 29.55% and 36.73%,
respectively. The average yield superiority of the UDP treatment across all locations over the
second highest yield of FP was 11.10%, which was nearly the same as the average increase
during the 2014 wet season. Nitrogen rate trials carried out at two locations showed
significant response to N rates and between the type of application (UDP and broadcast).
Broadcast prilled urea (PU) produced a significantly higher yield of up to 104 kilograms (kg)
N per hectare (ha). For UDP, the yield differences were significant at up to 78 kg N/ha.
In the 2015 wet season, UDP adaptation trials continued in new locations. The yield
increments from UDP varied from 3.36% to 18.95%, with an average yield increase over all
locations; UDP resulted in a yield increase of 7.37% over UB and 14.70% over FP. UDP
technology was also evaluated on broadcast rice (BR) since farmers practiced the broadcast

2
seeding method more than the transplanting method for rice cultivation in this season. Other
trials relating to N rate, potassium (K) rate, time of application, and plant spacing, and
fertilizer management on the rice-gram system was also tested. The results showed the
possibilities of applying UDP technology on BR. UDP could be applied just before seed
broadcasting and gave higher yield than FP urea application and UDP application 26 days
after seed broadcasting with a very early variety (75 days to maturity). The trial has to be
repeated using a popular early maturing high-yielding variety (HYV) rather than using a very
early variety, which is not popular. Significant yield results between treatments were
observed in an N x K trial and a plant spacing x UDP rate trial. Confirmation of those results
is still needed with additional trials. No significant result was observed with long-term
fertilizer management trials on the rice-gram cropping system.
In this 2016 dry season, all trials of the 2015 wet season were repeated. Within the long-term
fertilizer trial on the rice-gram system, this was the first test on the second crop, gram. All
trials were conducted at selected locations in the three project regions, i.e., Yangon, Bago,
and Ayeyarwady. The trials established are listed below.
Trials Tested in 2016 Dry Season Sr. No. Trials Number of Trials
1. UDP adaptation trials on TPR 4
2. Different N-rate trial using UDP on TPR 1
3. UDP before seed broadcasting trial on BR 2
4. UDP spacing trial on BR 2
5. Nitrogen x potassium trial on TPR 1
6. Plant spacing x nitrogen trial on TPR 1
7. Fertilizer management trial on rice-gram cropping system 4
8. Different seed rate trial on BR using UDP 1
9. Different N-rate trial using UDP and prilled urea on black gram 1
TOTAL 17
3
Materials and Methods
Site Selection During the 2016 dry season, almost all sites and farmers were newly selected, except the
Research Farm in Myaungmya, where the N-rate trial with higher rates was tested, and the
long-term fertilizer management trials on the rice-gram system, which continued at their
same locations. The coordinates of the selected sites with the number of trials are given in
Table 1. Soil samples taken from each location were dried and stored for later testing to
identify initial soil condition.
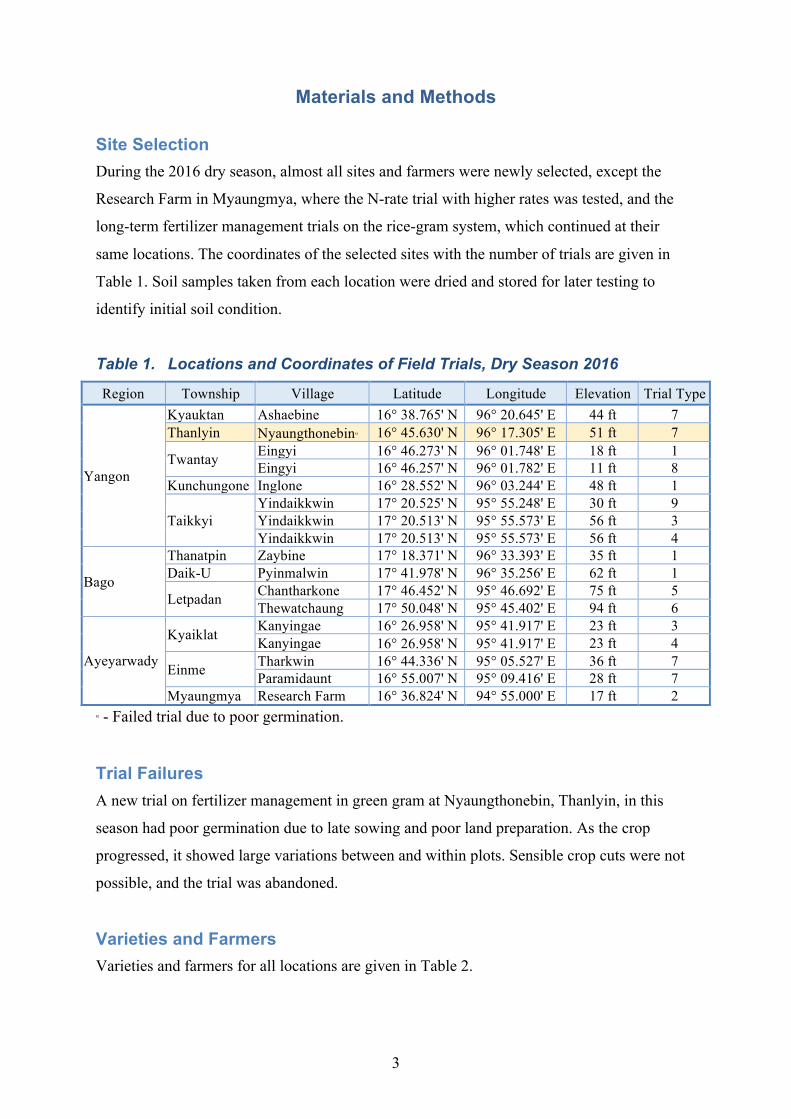
Table 1. Locations and Coordinates of Field Trials, Dry Season 2016
Region Township Village Latitude Longitude Elevation Trial Type
Yangon
Kyauktan Ashaebine 16° 38.765' N 96° 20.645' E 44 ft 7 Thanlyin Nyaungthonebinα 16° 45.630' N 96° 17.305' E 51 ft 7
Twantay Eingyi 16° 46.273' N 96° 01.748' E 18 ft 1 Eingyi 16° 46.257' N 96° 01.782' E 11 ft 8
Kunchungone Inglone 16° 28.552' N 96° 03.244' E 48 ft 1
Taikkyi Yindaikkwin 17° 20.525' N 95° 55.248' E 30 ft 9 Yindaikkwin 17° 20.513' N 95° 55.573' E 56 ft 3 Yindaikkwin 17° 20.513' N 95° 55.573' E 56 ft 4
Bago
Thanatpin Zaybine 17° 18.371' N 96° 33.393' E 35 ft 1 Daik-U Pyinmalwin 17° 41.978' N 96° 35.256' E 62 ft 1
Letpadan Chantharkone 17° 46.452' N 95° 46.692' E 75 ft 5 Thewatchaung 17° 50.048' N 95° 45.402' E 94 ft 6
Ayeyarwady
Kyaiklat Kanyingae 16° 26.958' N 95° 41.917' E 23 ft 3 Kanyingae 16° 26.958' N 95° 41.917' E 23 ft 4
Einme Tharkwin 16° 44.336' N 95° 05.527' E 36 ft 7 Paramidaunt 16° 55.007' N 95° 09.416' E 28 ft 7
Myaungmya Research Farm 16° 36.824' N 94° 55.000' E 17 ft 2 α - Failed trial due to poor germination.
Trial Failures A new trial on fertilizer management in green gram at Nyaungthonebin, Thanlyin, in this
season had poor germination due to late sowing and poor land preparation. As the crop
progressed, it showed large variations between and within plots. Sensible crop cuts were not
possible, and the trial was abandoned.
Varieties and Farmers Varieties and farmers for all locations are given in Table 2.

4
Table 2. Varieties, Trial Types, and Collaborating Farmers for the 2016 Dry Season Trials
Township Village Farmer Variety Remark Kyauktan Ashaebine U Aung Myo Shwewar Improved Green gram
Thanlyin Nyaungthonebin Daw Zin Mar Kyaw Shwewar Improved Green gram
Twantay Eingyi U Aung Myint Theedatyin HYV UDP adaptation trial Eingyi U Aung Myint Theedatyin HYV Seed rate trial
Kunchungone Inglone U Than Hla Theedatyin HYV UDP adaptation trial
Taikkyi Yindaikkwin U Zaw Min Htwe Yezin - 2 Improved Black gram Yindaikkwin U Zaw Min Htwe Theedatyin HYV UDP before sowing Yindaikkwin U Zaw Min Htwe Theedatyin HYV UDP spacing trial
Thanatpin Zaybine U San Shwe Oo Sinthukha HYV UDP adaptation trial Daik-U Pyinmalwin U Tin Win Naing Thai Manaw HYV UDP adaptation trial
Letpadan Chantharkone U Naing Tun Yadanartoe HYV N x K trial Thewatchaung U Thein Hlaing Yadanartoe HYV TPR space x N rate
Kyaiklat Kanyingae U Aye Than Theedatyin HYV UDP before sowing Kanyingae U Aye Than Theedatyin HYV UDP spacing trial
Einme Tharkwin U Aung Htay Win Yezin - 3 Improved Black gram Paramidaunt U Thet Naing Soe Yezin - 3 Improved Black gram
Myaungmya Research Farm U Htain Lin Tun Theedatyin HYV N-rate trial
Experimental Design A Randomized Complete Block (RCB) design with four treatments by three replications was
used in most of the trials (Table 3). An RCB with six treatments by three replications was
used in the N rate trial. An RCB with five treatments and three replications was used in the
two UDP spacing trials. A factorial experiment with RCB and three replications was used for
the nitrogen x potassium trial at Chantharkone, Letpadan. A 2 x 2 split plot design with three
replications was used for the plant spacing x nitrogen trial. The UDP before seed
broadcasting trial was simply sown in a large plot for each treatment, and data were taken
from three random samples within the plot. A different N-rate trial on black gram has four
treatments with three replications, and there were two separate trials, one with UDP and one
with prilled urea. A detailed plan for each trial is available in protocols, retained in a separate
document.
Basal Fertilizers In all the trials, a basal fertilizer of triple superphosphate (TSP), muriate of potash (MOP),
and gypsum is used as the source of phosphorus (P), K, and sulfur (S). In calculating the
rates, it is assumed:
TSP = 45% P2O5 or 20% P
MOP = 60% K2O or 50% K
Gypsum = 18% S and 23% Ca
5
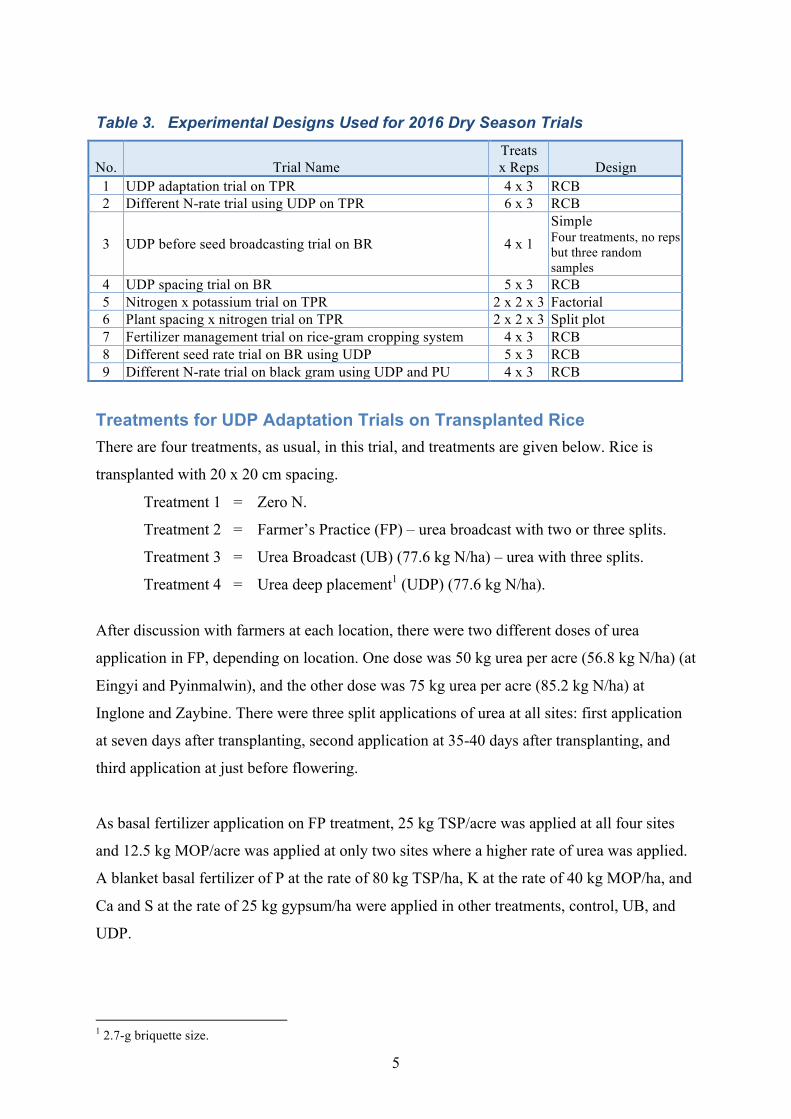
Table 3. Experimental Designs Used for 2016 Dry Season Trials
No. Trial Name Treats x Reps Design
1 UDP adaptation trial on TPR 4 x 3 RCB 2 Different N-rate trial using UDP on TPR 6 x 3 RCB
3 UDP before seed broadcasting trial on BR 4 x 1 Simple Four treatments, no reps but three random samples
4 UDP spacing trial on BR 5 x 3 RCB 5 Nitrogen x potassium trial on TPR 2 x 2 x 3 Factorial 6 Plant spacing x nitrogen trial on TPR 2 x 2 x 3 Split plot 7 Fertilizer management trial on rice-gram cropping system 4 x 3 RCB 8 Different seed rate trial on BR using UDP 5 x 3 RCB 9 Different N-rate trial on black gram using UDP and PU 4 x 3 RCB
Treatments for UDP Adaptation Trials on Transplanted Rice There are four treatments, as usual, in this trial, and treatments are given below. Rice is
transplanted with 20 x 20 cm spacing.
Treatment 1 = Zero N.
Treatment 2 = Farmer’s Practice (FP) – urea broadcast with two or three splits.
Treatment 3 = Urea Broadcast (UB) (77.6 kg N/ha) – urea with three splits.
Treatment 4 = Urea deep placement1 (UDP) (77.6 kg N/ha).
After discussion with farmers at each location, there were two different doses of urea
application in FP, depending on location. One dose was 50 kg urea per acre (56.8 kg N/ha) (at
Eingyi and Pyinmalwin), and the other dose was 75 kg urea per acre (85.2 kg N/ha) at
Inglone and Zaybine. There were three split applications of urea at all sites: first application
at seven days after transplanting, second application at 35-40 days after transplanting, and
third application at just before flowering.
As basal fertilizer application on FP treatment, 25 kg TSP/acre was applied at all four sites
and 12.5 kg MOP/acre was applied at only two sites where a higher rate of urea was applied.
A blanket basal fertilizer of P at the rate of 80 kg TSP/ha, K at the rate of 40 kg MOP/ha, and
Ca and S at the rate of 25 kg gypsum/ha were applied in other treatments, control, UB, and
UDP.
1 2.7-g briquette size.

6
UDP was applied only one time at seven days after transplanting and also for the first urea
application of UB treatment and FP treatment. The second application of urea was applied at
40 days after transplanting, and the third application of urea was applied at flowering time for
both UB and FP treatments. Sowing dates, transplanting dates, UDP dates, and harvesting
dates are given in Table 5.
Treatments for N-Rate Trials on Transplanted Rice This trial was conducted with the same six treatments (control and five different nitrogen
rates), with three replications, as the 2015 wet season. Treatments are as follows:
1. Zero N (control)
2. UDP with 2.7 grams (g) x 1 briquette (Urea 66 kg/acre)
3. UDP with 1.8 g x 2 briquettes (Urea 88 kg/acre)
4. UDP with (1.8 + 2.7) g x 1 briquette (Urea 110 kg/acre)
5. UDP with 1.8 g x 3 briquettes (Urea 132 kg/acre)
6. UDP with (1.8 g x 2) + (2.7 g x 1) (Urea 154 kg/acre)
Triple superphosphate at 50 kg/acre (56 kg P2O5/ha or 25 kg P/ha), MOP at 25 kg/acre
(37 kg K2O/ha or 30 kg K/ha), and gypsum at 10 kg/acre (4.5 kg S/ha) were applied as basal
fertilizer at plot layout time, just before transplanting.
Treatments for UDP Before Broadcasting Seed This trial was repeated with the same treatments as in the wet season 2015, but using a
popular early variety, Theedatyin, and 2.7-g urea briquettes. Urea rate was 1.5 times that of
the wet season. There are four treatments:
1. UDP just before sowing (100.8 kg urea/acre = 114.6 kg N/ha)
2. UDP at 20-25 days after sowing (100.8 kg urea/acre)
3. Control (Zero N)
4. Farmer’s dose of urea broadcast (75 kg urea/acre = 85.2 kg N/ha)
Triple superphosphate at 50 kg/acre (56 kg P2O5/ha or 25 kg P/ha), MOP at 25 kg/acre
(37 kg K2O/ha or 30 kg K/ha), and gypsum at 10 kg/acre (4.5 kg S/ha) were applied as basal
fertilizer for all treatments just before seed broadcasting.
A briquette size of 2.7 g was applied at a spacing of 14 x 12 inches on UDP plots. UDP was
applied just before seed broadcasting for Treatment 1 (UDP before sowing) and 20-25 days

7
after sowing for Treatment 2 (UDP after sowing). There were three split applications in equal
amounts of urea for Treatment 4 (total farmer’s rate of urea is 75 kg/acre), one at 20-25 days
after sowing, one at 40-45 days after sowing, and another at flowering time.
The trial was simply sown in a large (35 x 60 ft) plot. At harvesting time, three representing
samples were taken from each treatment to get three replications for analysis of variance
(ANOVA).
Treatments for UDP Spacing Trial on BR UDP application at 16 x 16 inch spacing seemed wider on broadcast rice since yellow lines
are left between UDP rows. Therefore, this trial was tested with closer UDP spacing than
16 x 16 inches. There are five treatments in this trial. Four spacings of UDP application were
compared with farmer’s practice broadcast urea application rate.
1. Farmer’s practice (75 kg urea/acre = 84 kg N/ha)
2. UDP with 16 x 14 inch spacing (75.6 kg urea/acre or 85.9 kg N/ha)
3. UDP with 16 x 12 inch spacing (88.2 kg urea/acre or 100.3 kg N/ha)
4. UDP with 14 x 14 inch spacing (86.4 kg urea/acre or 98.2 kg N/ha)
5. UDP with 14 x 12 inch spacing (100.8 kg urea/acre or 114.6 kg N/ha)
Triple superphosphate at 50 kg/acre (56 kg P2O5/ha or 25 kg P/ha), MOP at 25 kg/acre
(37 kg K2O/ha or 30 kg K/ha), and gypsum at 10 kg/acre (4.5 kg S/ha) were applied as basal
fertilizer for all treatments just before seed broadcasting.
UDP was applied one time only at 20-25 days after sowing by placing one 2.7-g urea
briquette at 3-4 in deep in the soil. There were three split applications in equal amounts of
urea for Treatment 1 (total farmer’s rate of urea is 75 kg/acre), one at 20-25 days after
sowing, one at 40-45 days after sowing, and another at flowering time.
Treatments for Nitrogen x Potassium on TPR This trial was an RCB factorial experiment in rice transplanted with 20 x 20 cm spacing. Two
factors were tested with three replications. Treatments are as follows:

8
Factor A - Nitrogen (2 doses)
1. UDP (with 1.8 g size) (44 lb urea/acre or 51.6 kg N/ha) 2. UDP (with 2.7 g size) (66 lb urea/acre or 77.6 kg N/ha)
Factor B - Potassium (2 doses)
3. Muriate of potash 25 kg/acre (37 kg K2O/ha) 4. Muriate of potash 50 kg/acre (74 kg K2O/ha)
Triple superphosphate at 50 kg/acre (56 kg P2O5/ha or 25 kg P/ha) and gypsum at 10 kg/acre
(4.5 kg S/ha) were applied as basal fertilizer at plot layout time, just before transplanting.
Treatments for Plant Spacing x Nitrogen Trials on TPR This trial was split plot design with two factors, main plot with plant spacing and sub-plot
with different nitrogen rates:
Main Plot - Spacing (S)
1. 20 x 20 cm spacing 2. 20 x 15 cm spacing
Sub-Plot - UDP (2 rates)
3. Using 1.8-g briquette 4. Using 2.7-g briquette
The urea rates were 44.1 kg/acre (51.8 kg N/ha) with 20 x 20 cm spacing and 58.8 kg/acre
(69 kg N/ha) with 20 x 15 cm spacing using a 1.8-g urea briquette. By using a 2.7-g urea
briquette, the rates were 66.2 kg/acre (77.6 kg N/ha) with 20 x 20 cm spacing and
88.2 kg/acre (103.5 kg N/ha) with 20 x 15 cm spacing.
Triple superphosphate at 50 kg/acre (56 kg P2O5/ha or 25 kg P/ha), MOP at 25 kg/acre
(37 kg K2O/ha or 30 kg K/ha), and gypsum at 10 kg/acre (4.5 kg S/ha) were applied as basal
fertilizer at plot layout time, just before transplanting.
Treatments for Fertilizer Management in the Rice-Gram System This trial is a long-term trial that extends across the rice crop and the gram crop at the same
location. It is a 4 x 3 RCB design with four treatments as follows:

9
Treatments on Rice Treatments on Gram
1. P2O5 40 kg/ha + K2O 40 kg/ha P2O5 0 kg/ha + K2O 0 kg/ha
2. P2O5 20 kg/ha + K2O 20 kg/ha P2O5 20 kg/ha + K2O 20 kg/ha
3. P2O5 0 kg/ha + K2O 0 kg/ha P2O5 40 kg/ha + K2O 40 kg/ha (No residue)
4. P2O5 0 kg/ha + K2O 0 kg/ha P2O5 40 kg/ha + K2O 40 kg/ha (+crop residue)
The trials were tested with gram crops. There were two trials with black gram and two trials
with green gram. One trial with green gram at Nyaung Thone Bin, Thanlyin, was just started
this season but failed due to poor germination.
Treatments for Different Seed Rates on BR using UDP This is a new trial testing different seed rates of BR using UDP for nitrogen fertilizer.
Farmers are broadcasting at a high seed rate (40-60 kg seed per acre) to get a dense
population and reduce the weed problem. This trial was conducted to determine yields with
lower seed rates combined with balanced nutrients with UDP in broadcast seeded rice. Five
different seed rates were tested with three replications. Treatments are:
1. 20 kg dry seed per acre (nearly one basket)
2. 25 kg dry seed per acre (nearly 1.25 baskets)
3. 30 kg dry seed per acre (nearly 1.5 baskets)
4. 35 kg dry seed per acre (nearly 1.75 baskets)
5. 40 kg dry seed per acre (nearly two baskets)
Triple superphosphate at 50 kg/acre (56 kg P2O5/ha or 25 kg P/ha), MOP at 25 kg/acre
(37 kg K2O/ha or 30 kg K/ha), and gypsum at 10 kg/acre (4.5 kg S/ha) were applied as basal
fertilizer at plot layout time, just before transplanting. UDP was applied.
UDP was applied one time only 20-25 days after seed broadcasting by placing 2.7-g
briquettes at a depth of 3-4 in.
Treatments for N-Rate Trial on Black Gram Using UDP and Prilled Urea This is a new trial with the gram crop to test different N rates using UDP and prilled urea.
Two trials, one with UDP and one with prilled urea, were tested side by side. Nitrogen rates
were the same for both trials and there were four treatments.

10
With Briquette Urea With Prilled Urea
1. Control (Zero N) Control (Zero N)
2. UDP with 1.8 g x .25 briquette Urea 12.5 kg N/ha
3. UDP with 1.8 g x .50 briquette Urea 25.0 kg N/ha
4. UDP with 1.8 g x 1 briquette Urea 50.0 kg N/ha
UDP was applied just after sowing by placing a specific sized briquette for Treatments 2, 3,
and 4 at 16 x 16 inch spacing. Prilled urea was applied along with basal fertilizers just before
sowing with last tillage.
Triple superphosphate at 25 kg/acre (28 kg P2O5/ha) and MOP at 12.5 kg/acre (18 kg K2O/ha)
were applied as basal fertilizers.
Plot Size and Spacing There are variations in plot size between trials according to the type of trial and the kind of
treatments. Many trials were conducted with a plot size of 16 x 16 ft. Plot sizes used in each
trial are given Table 4. A detailed plan can be seen in the protocols.
Table 4. Plot Size and Spacing Used for Specific Trial, 2016 Dry Season Trials
No. Trial Name Plot Size TPR Spacing
1 UDP adaptation trial on TPR 28 x 24 ft 8 x 8 in 2 Different N-rate trial using UDP on TPR 16 x 16 ft 8 x 8 in 3 UDP before seed broadcasting trial on BR 35 x 60 ft Broadcast 4 UDP spacing trial on BR 28 x 28 ft Broadcast 5 Nitrogen x potassium trial on TPR 16 x 16 ft 8 x 8 in 6 Plant spacing x nitrogen trial on TPR 16 x 16 ft 2 spacings tested 7 Fertilizer management trial on rice-gram cropping system 16 x 16 ft Broadcast (gram) 8 Different seed rate trial on BR using UDP 21 x 18 ft Broadcast 9 Different N-rate trial on black gram using UDP and PU 20 x 20 ft Broadcast (gram)
Trial descriptions about varieties used, sowing dates, UDP dates, and harvest dates can be
seen in Table 5.
Weeds and Water Problems Dry season rice often has weeds and water problems. Rice is mostly grown under insufficient
water conditions in the dry season. Though expecting more yields in the dry season, farmers
are always looking for cost reduction cultivation practices to minimize the cost of cultivation.

11
Water management practice was poor on many farmers’ fields regardless of water
availability. Farmers are keeping standing water very deep where availability of water is not
limited and not putting much effort to irrigate when there is no water in the field for a period
of time.
Weeds are normally a problem in rice fields with lack of water. A weed problem was noted
particularly at Pyinmalwin, Daik-U, and Thewatchaung, Letpadan.
Results and Discussion
UDP Adaptation Trials Yield (mt/ha) The results showed that the UDP treatment gave the highest yield at all four locations. UDP
yields ranged from 4.36 mt/ha at Pyinmalwin to 5.77 mt/ha at Eingyi. However, the
differences were only statistically significant at Eingyi, Inglone, and Pyinmalwin. There was
no significant difference among treatments at Zaybine. The second highest yield was
observed with UB treatment at Eingyi and Pyinmalwin, where N rate with UB (77.6 kg N/ha)
was higher than that with FP (56.8 kg N/ha). At Inglone and Zaybine, the second highest
yield was observed with the FP treatment in which the rate (85.2 kg N/ha) was higher than
the UB rate (77.6 kg N/ha). Control plots with Zero N had the lowest yields at all locations
(Table 7) (Figure 1).
Among all trials, the Pyinmalwin trial gave the lowest yield for all treatments, since soil
fertility in the location is the poorest, with very sandy soil. The average yield at Pyinmalwin
was only 3.42 mt/ha, while other locations gave more than 4.50 mt/ha (Figure 1).
Among the three locations where significant differences were found, UDP yields were
significantly higher than all other treatments at two locations (Eingyi and Inglone). At
Pyinmalwin, the UDP yield was the highest but not statistically different from the UB
treatment (Table 7).
Dry Grain Weight of Biomass (g/25 plants) Dry grain weights of biomass with UDP were highest at three locations (Eingyi, Inglone, and
Pyinmalwin), and statistical differences were also found. Dry grain weight of biomass with

12
UDP was significantly higher than all other treatments at Eingyi. However, there were no
statistical differences between any N-applied plots at the other locations. Only the control
treatment was statistically lower. At Zaybine, there was no significant difference between
treatments, and the UDP treatment did not give the highest grain weight. The UB treatment
had the highest biomass grain weight (762 g/25 plants), whereas UDP had 738 g/25 plants
(Table 9).
Eingyi (Twantay) – A popular variety of dry season rice, Theedatyin was used in this trial.
Significant differences were found in yield and all other component characteristics, except
1,000-grain weight and panicle length. The UDP treatment gave the highest yield
(5.77 mt/ha) and highest values for other characteristics, which were statistically higher than
other treatments. The UB treatment, which used the same N rate as UDP and a higher rate
than the FP treatment, gave the second highest yield (4.29 mt/ha) but was not significantly
different from the FP treatment. The control plot gave a significantly lower yield of
3.45 mt/ha (Table 7). Significant differences between treatments were also observed on
biomass yield (straw and grain and wet and dry). UDP gave the significantly highest biomass
than any other treatment, which indicates UDP application could increase both yield and
straw for animal feed. Among the yield contributing characteristics, the number of tillers per
hill was the most determining factor to increase yield. The UDP treatment had 21.3 panicles
per hill (Table 11), which was significantly higher than other treatments. The number of
spikelets and grains per panicle could be secondary determinants for yield. The UDP
treatment had the highest number with those characteristics (157 spikelets/panicle and
119 grains/panicle), which were significantly higher than other treatments (Refer to the
Eingyi, Twantay data sheet in Appendix 1).
Inglone (Kunchangone) – The Theedatyin variety was also used in this trial. Significant
differences were found in yield and other characteristics, except 1,000-grain weight and
panicle length. The number of grains per panicle and dry grain of biomass were significant at
P(0.05) level, and others were highly significant at P(0.01) level. The UDP treatment gave a
significantly higher yield (5.70 mt/ha) than other treatments. The UB and FP treatments were
not different, with nearly equal yield (4.86 and 4.87 mt/ha, respectively). Zero N treatment
gave a significantly lower yield of 3.38 mt/ha. Biomass straw weights, both wet and dry, with
UDP were significantly higher than other N-applied treatments (2,192 g wet straw weight and
650 g dry straw weight), while there was no statistical difference in biomass grain weight
among N-applied plots. Though no differences, UDP gave the highest biomass grain weights
13
(672 g wet grain and 617 g dry grain weight) among treatments. The determinant for yield
was the number of panicles per hill. UDP was the highest (17.8) and significantly different
than other treatments (Refer to the Inglone, Kunchangone data sheet in Appendix 1).
Pyinmalwin (Daik-U) – Farmers’ preferred variety, Thai Manaw, was used in this trial. It is
not an improved variety and, unfortunately, had poor purity. Off-type plants were observed
during the vegetative stage and rogued out. Due to impurity of seed and poor soil fertility
(light sandy soil), the yield at Pyinmalwin was the lowest among all test sites. Average paddy
yield was only 3.42 mt/ha, whereas other sites produced about 4.50 mt/ha. Nevertheless,
significant yield differences were found among treatments. The UDP treatment gave the
highest yield (4.36 mt/ha), which was not statistically different from the second highest yield
(3.77 mt/ha) with UB treatment. The yields of UB treatment and FP treatment were also not
significantly different. Zero N treatment gave a significantly lower yield. Significant
difference at P(0.05) level was found on biomass yield of straw and grain but only between
N-applied plots and Zero N. The UDP treatment did have a higher biomass yield than other
N-applied plots (UB or FP), but the difference was not significant. There were no treatment
differences in other characteristics (Refer to Pyinmalwin, Daik-U data sheet in Appendix 1).
Zaybine (Thanatpin) – The trial used a high-yielding, medium-maturing variety, Sinthukha
(140 days), with a higher rate of urea (75 kg urea/acre or 85.2 kg N/ha) on the FP treatment.
The soil is comparatively fertile since only one rice crop is grown in the dry season and the
land is flooded during the rainy season. The soil is clay meadow, which is suitable for a rice
crop. No significant difference was found on yield and many component characteristics.
However, the highest yield (5.39 mt/ha), highest number of panicles per hill (14.5), and
highest number of spikelets per panicle (203) were produced with UDP. Significant
difference at P(0.05) was found only on dry straw weight of biomass, but differences were
between the N-applied plots and control plot only (Refer to the Zaybine, Thanatpin data sheet
in Appendix 1).
Analysis of variance among treatments across all four locations showed highly significant
(P(0.01)) differences in yield. The UDP treatment produced the highest yield with 5.31 mt/ha,
and it was statistically different from the yields of all other treatments. The UB treatment
gave the second highest yield with 4.26 mt/ha, a little higher (but not significantly) than the
third highest yield with FP, which produced 4.23 mt/ha. Zero N treatment was the lowest
with 3.30 mt/ha (Figure 1).

14
The yields with UDP were the highest in all locations. Yield superiority of UDP over other
treatments varied from 11.07% over FP at Zaybine, Thanatpin, to 78.92% over the control at
Pyinmalwin, Daik-U. The UDP treatment could out-yield other treatments on both fertile soil
at Zaybine and poor soil at Pyinmalwin. The yield superiority of UDP over FP at Eingyi and
Pyinmalwin was higher than it was over UB, since the N rate with FP was lower than that
with UB. As an average across all locations, yield superiority of UDP was 24.67% over UB
and 25.30% over FP (Table 8).
Figure 1. Paddy Yield Comparison of Different Treatments by Location
Number of Panicles per Hill The highest number of panicles per hill with UDP were observed at three out of four
locations. UDP did not produce the highest number of panicles per hill at Pyinmalwin. The
UB treatment produced the highest with 15.7 numbers of panicles per hill, and UDP gave a
comparably high number of panicles with 15.3 per hill. Significant differences (P(0.05)) of
treatments on the number of panicles per hill were found at two locations only, Eingyi and
Inglone (Table 6). At both locations, the UDP treatment gave a significantly higher number
than all other treatments. The UDP treatment at Eingyi produced the highest number of
panicles per hill with 21.3, and it was significantly higher than other treatments. At Inglone,

15
the highest number of panicles per hill (17.8) in the UDP treatment was also significantly
higher than other treatments. There were no differences between treatments at the other two
locations. Though not significant, UDP did produce the highest number of panicles per hill at
Zaybine but not at Pyinmalwin. At Pyinmalwin, the UB treatment produced the highest
number of panicles per hill with 15.7, but this was only slightly higher than the UDP
treatment, which produced 15.3 panicles per hill (Table 10).
According to ANOVA across all four locations, there was significant difference at P(0.05). The
UDP treatment gave the highest number of panicles per hill with 17.2, and it was statistically
higher than all other treatments. FP produced the second highest with 14.3 panicles, UB was
third with 13.3 panicles, and Zero N produced the lowest with 12.0 panicles per hill. There
was no significant difference between those three treatments (Table 10).
1,000-Grain Weight (g) There was no significant difference in 1,000-grain weight among treatments in all locations.
Variations in 1,000-grain weight within treatments were observed at all locations. The UDP
treatment did not give the highest grain weight. The highest 1,000-grain weight with UDP
(26.1 g) was obtained at Pyinmalwin only. The UB treatment gave the highest grain weight at
three locations, Eingyi, Inglone, and Zaybine. ANOVA across locations by treatments also
showed no differences between treatments (Table 11).
Agronomic Efficiency (AE) – Yield Grain per kg N Applied In the 2016 dry season, UDP showed the highest agronomic efficiency2 (AE) at all four
locations, which means UDP was the most effective application method of nitrogen
application. The highest AE (29.94 kg/kg N) with UDP was calculated at Eingyi, which was
slightly higher than the second highest AE (29.86 kg/kg N) at Inglone. The lowest AE
(18.88 kg/kg N) with UDP was found at Zaybine.
As an average over all locations UDP is the most effective method of urea application among
all application methods and can give 25.86 kg rice by applying one kg of urea. The second
effective application was FP, which gave 12.93 kg rice yield per kg of urea. However, it was
only slightly higher than UB, which also gave 12.33 kg/kg urea (Table 12).
2 (Yield of fertilized crop – yield of control)/amount of fertilizer applied.

16
UDP, Yield Parameters, and Yield In the 2016 dry season, UDP treatment gave the highest yield at all four locations, and it was
significantly different at three locations, Eingyi, Inglone and Pyinmalwin. Only one location,
Zaybine, did not show significant differences among treatments, but the UDP treatment still
gave the highest yield (Table 7). Rice is grown one time only in the dry season at Zaybine
due to deep water conditions in the wet season. Soil is fertile since nutrient replacement
occurs due to precipitation of nutrients from floodwater. That may be the reason for no
differences between N-applied treatments and control. According to an analysis of locations
by treatments, it was found that the UDP treatment produced a significantly higher yield than
all other treatments with 5.31 mt/ha, followed by UB and FP. UB and FP treatments were not
different from one another, with 4.26 mt/ha and 4.23 mt/ha, respectively. Zero N gave
significantly lower yield with 3.30 mt/ha (Table 7 and Figure 1). Yield superiority of UDP,
on average, was 24.67% over the second highest treatment (UB), 25.30% over FP treatment,
and 60.85 % over Zero N treatment (Table 8).
Among the yield contributing characteristics, a significant difference was found in the
number of panicles per hill, followed by the number of grains per panicle at locations that
corresponded with yield differences. It is concluded that UDP could improve the number of
productive tillers over other urea application practices. This was clearly visible at the
maximum tillering stage. The number of grains per panicle may be a second characteristic
that could improve yield with UDP application, since it showed significant differences at two
locations (Table 6). Since there was no difference in 1,000-grain weight at any location, it is
assumed UDP does not improve this characteristic.
N-Rate Trial at Myaungmya In the 2016 dry season, the N-‐rate trial at Myaungmya showed no significant differences for yield. yield. Among the plant characteristics, significant differences were observed for plant height (P(0.05)), (P(0.05)), number of panicles per hill (P(0.01)), fresh straw weight (P(0.01)) and dry straw weight (P(0.01)) (
(P(0.01)) (

17
Table 13). Only one yield component characteristic, the number of panicles per hill, showed
significant difference among treatments. Biomass straw weight also showed significant
difference. This is important for animal feed. The maximum yield and highest values of most
parameters were found with the second highest N rate (155.3 kg N/ha), whether it was
significant or not. Only two characteristics, number of spikelets per panicle and 1,000-grain
weight, did not give the highest value with the second highest N rate (Refer to the Research
Farm, Myaungmya data sheet in Appendix 1).
Response curves of significant parameters (plant height, number of panicles per hill, and
biomass straw weight) are given in Figure 2, Figure 3, and Figure 4, which all show highest
values with the second highest N rate (155.3 kg N/ha).
Plant height – Significant differences were found between treatments. The highest N-rate
treatment (181.1 kg N/ha) did not give the tallest plant. It was nearly the same height as the
control (Zero N), and they are not statistically different. The second highest N rate
(155.3 kg N/ha) gave the tallest plant with 103 cm, and it was not different from the heights
with the two lowest N rates (77.6 kg N/ha and 103.5 kg N/ha) (Figure 2).
Figure 2. Response of Plant Height (cm) on Different N Rates
Number of panicles per hill – Analysis of variance shows significant differences in the
number of panicles per hill. This difference was between the control (11.4 panicles per hill)

18
and the N-rate treatments only. There were no significant differences among different N-rate
treatments. The highest N rate (181.1 kg N/ha) did not give the highest number of panicles
per hill (19.7). However, it was second in the group. The second highest N rate
(155.3 kg N/ha) gave the highest number of panicles (19.8) per hill. There were some
variations in the number of panicles per hill among the three lowest N rates. It did not follow
as the N rate increased (Figure 3).
Biomass straw weight – Significant differences were observed on both fresh and dry straw
weight. The trend was similar to plant height and number of panicles per hill. The highest
N-rate did not give the highest biomass straw weight. The second highest dose of nitrogen
gave the highest biomass straw weight. However, biomass straw weights of the top three N
rates were not significantly different (Figure 4).
Figure 3. Response of Number of Panicles per Hill on Different N Rates

19
Figure 4. Response of Biomass Straw Weight on Different N Rates
Yield – There were variations in yield among treatments and the ANOVA did not show a statistical statistical difference among the treatments. Rather, a high yield (5.86 mt/ha) was obtained even even with Zero N treatment. However, similar to other significant characteristics, the second highest highest N rate (155.3 kg N/ha) produced the highest yield with 6.12 mt/ha. The highest N rate (181.1 kg N/ha) produced the lowest yield with 5.03 mt/ha (

20
Table 13).
In this trial, it was noticed at harvesting time that grains from N-applied plots were less filled
compared to that of the Zero N plot. Although disease was not serious in the dry season, it
was observed that sheath rot disease was slight on most of N-applied plots. Grain
discoloration was also observed on N-applied plots. Because of the lowest biomass straw
weight, the Zero N treatment had the highest grain-straw ratio among all treatments.
This trial was conducted to identify the highest N rate that gives the peak yield. Based on the
similar result of yield to the significant results of plant height, panicles per hill, and biomass
straw weight, the highest yield could be obtained with a N rate of 155.3 kg N/ha, and the
yield would decline beyond that rate.
UDP Before Seed Broadcasting Trials These trials were conducted to determine possible alternatives for applying UDP technology
on broadcast rice at two locations, one at Yindaikkwin, Taikkyi township, Yangon region,
and one at Kanyingae, Kyaiklat township, Ayeyarwady region. It used a popular early
maturing variety (Thee Dat Yin – 110 days to maturity) to compare yield response to UDP
application before seed broadcasting (Treatment 1) and after seed broadcasting (Treatment 2)
with Zero N (Treatment 3) and surface broadcasting of urea as FP (Treatment 4).
Yindaikkwin (Taikkyi) – It was found that yield, plant height, number of grains per panicle,
and biomass straw and grain weights were significantly different between treatments. The
yield, plant height, and biomass straw weights were significant at P(0.01) level and others were
significant at P(0.05) level. UDP application after seed broadcasting produced the highest yield
with 6.30 mt/ha, and it was statistically different from yields in other treatments. UDP
application before seed broadcasting gave the second highest yield (5.11 mt/ha), but this was
not significantly different from FP treatment, which gave 4.90 mt/ha. Zero N treatment had
the significantly lowest yield with 2.90 mt/ha. Similar to yield response, plant height (cm),
number of grains per panicle, and biomass straw and grain weight had the highest value with
Treatment 2 (UDP after seed broadcasting).
Plant heights of UDP treatments were significantly higher than that of other treatments. UDP
after sowing treatment had a height of 86 cm, which was not different from plant height
(82 cm) of UDP before sowing treatment. The Zero N treatment had significantly shorter

21
plant height with 70 cm. The number of grains per panicle of UDP after sowing was the
maximum with 110, but not significantly different from that of UDP before sowing, which
had 93 grains per panicle. The number of grains per panicle of UDP before sowing, FP, and
Zero N were not statistically different. UDP after sowing treatment produced the highest
biomass weights of both straw and grain (Refer to Yindaikkwin, Taikkyi data sheet in
Appendix 1).
Kanyingae, Kyaiklat – In this trial, significant differences among treatments were found in
yield and all other characteristics except 1,000-grain weight. Plant height, number of
spikelets per panicle, and biomass straw weight were highly significant (P(0.01)), and yield and
other characteristics were significant at P(0.05) level. Treatment 1 (UDP application before
seed broadcasting) produced the highest yield with 5.67 mt/ha, followed by Treatment 2
(UDP application after sowing) with 4.95 mt/ha, and Treatment 4 (FP prilled urea
application) with 4.10 mt/ha yield. Zero N treatment gave the lowest yield with 2.90 mt/ha.
However, the significant difference was between urea-applied treatments and Zero N
treatment only. There was no statistical difference among urea-applied treatments (Refer to
Kanyingae, Kyaiklat data sheet in Appendix 1).
Unlike yield results, other plant characteristics gave the highest values with UDP after
sowing. Plant height with UDP treatments (before and after sowing) was significantly higher
than that with other treatments. Plant height with UDP after sowing treatment was 92 cm and
not different from that of UDP before sowing treatment, which had a plant height of 91 cm.
The FP treatment had 80-cm plant height, and Zero N had the significantly shortest plant
height with 68 cm.
The number of panicles per square meter of UDP after sowing treatment was the maximum,
with 502, and significantly different from all other treatments. The FP treatment produced the
second maximum number of panicles per square meter (415) followed by UDP before sowing
(383) and Zero N (362), which are not different from each other.
The difference in biomass grain weight (g/m2) was significant at P(0.05), and this difference
was between urea-applied treatments and Zero N treatment only (Refer to Kanyingae,
Kyaiklat data sheet in Appendix 1).

22
According to yield results from both locations, UDP-applied plots gave higher yield than FP
treatment, although there were some inconsistent results within UDP-applied plots. UDP
before sowing produced the highest yield at Kanyingae, while UDP after sowing produced
the highest yield at Yindaikkwin. It suggests that UDP can be applied before or after seed
broadcasting. In this trial, UDP was applied at 14 x 12 inch spacing, at a rate of
114.6 kg N/ha, which was higher than the rate of FP (85.2 kg N/ha), which may be the reason
for the higher yield with UDP (Figure 5).
Figure 5. Yield Comparison of UDP Application, FP, and Zero N at Kanyingae
and Yindaikkwin
UDP Spacing Trials on Broadcast Rice These trials were designed to determine the best spacing for UDP application on broadcast
rice, since the UDP spacing (16 x 16 inches) on broadcast rice seemed wide, leaving thin
yellow lines between points of placement of urea briquettes. This was interpreted as a sign
that the plants were not getting enough N. Trials were conducted at two locations, one at
Taikkyi township, Yangon region, and one at Kyaiklat township, Ayeyarwady region, using a
popular early maturing variety (Thee Dat Yin – 110 days to maturity). UDP spacing
treatments were 16 x 14, 16 x 12, 14 x 14, and 14 x 12 inches. A check treatment was FP
with broadcast prilled urea split surface application as Treatment 1. Nitrogen rates were

23
therefore 85.9 kg/ha with 16 x 14 inch, 100.3 kg/ha with 16 x 12 inch, 98.2 kg/ha with
14 x 14 inch, and 114.6 kg/ha with 14 x 12 inch spacing. FP treatment had 84 kg N/ha.
Yindaikkwin, Taikkyi – In this trial, yield and most characteristics were not significantly
different among treatments. Significant differences were found only on plant height and
biomass straw weights, both fresh and dry. The results showed some variations between
treatments. Yield and most of characteristics gave the highest value, with 16 x 12 inch UDP
spacing. The number of spikelets per panicle and biomass grain weight were the highest with
the narrowest UDP spacing (14 x 12 inch). The tallest plant height (88 cm) was observed
with 14 x 14 inch UDP spacing. Significant characteristics, plant height, and dry biomass
straw weight showed differences between UDP-applied plots and FP plot only. There were no
statistical differences between UDP-applied plots with different UDP spacing. There was no
difference on fresh straw weight between UDP-applied treatments, and the weight of closer
spacing of UDP was also not different from that of Zero N treatment (Refer to Yindaikkwin,
Taikkyi data sheet in Appendix 1).
Kanyingae, Kyaiklat – Analysis of variance showed significant differences among
treatments on yield and most characteristics, except dry biomass grain weight and 1,000-grain
weight. The highest yield (8.26 mt/ha), the tallest plant (93 cm), and the largest panicle
(20.2 cm) with a large number of spikelets and grains (126 and 98, respectively) were
observed with UDP spacing of 14 x 14 inches. However, biomass yields and a large number
of panicles per square meter were produced with 16 x 12 inch spacing.
The highest yield, with 14 x 14 inch UDP spacing, was 8.26 mt/ha, not statistically different
from that with 16 x 12 inch or 14 x 12 inch spacing. UDP spacing of 16 x 14 inches gave the
lowest yield (6.44 mt/ha) among the UDP-applied treatments and was not statistically
different from the FP treatment. It can be said that UDP application with closer spacing,
which means a higher N rate, could give higher yield than UDP application with 16 x 14 inch
spacing, with a consequently lower N rate.
In most of the plant characteristics (plant height, panicle length, number of spikelets, and
number of grains per panicle), UDP with 14 x 14 inch spacing gave the highest values. But
the number of panicles per meter square and biomass yields were highest with UDP and
spacing of 16 x 12 inches. However, differences were mostly between FP and UDP plots
only. When comparing the N rate, UDP with 16 x 12 inch spacing (88.2 kg urea/acre or

24
100.3 kg N/ha) and 14 x 14 inch spacing (86.4 kg urea/acre or 98.2 kg N/ha) did not differ
significantly (Refer to Kanyingae, Kyaiklat data sheet in Appendix 1).
Analysis of variance across locations showed no difference between treatments. This may be
due to different trends in yield at each location. The highest yield was observed with
16 x 12 inch UDP spacing at Yindaikkwin, whereas it was observed with 14 x 14 inch UDP
spacing at Kanyingae. Significant difference at Yindaikkwin was between UDP-applied plots
and FP plot and that at Kanyingae was between the three closest UDP spacing treatments and
FP and 16 x 14 inch. As an average over locations, 16 x 12 inch UDP spacing showed the
highest yield with 7.51 mt/ha. It could be said that UDP could be applied at 16 x 12 inch or
14 x 14 inch spacing since 16 x 14 inch spacing gave similar yield to FP treatment at
Yindaikkwin. The N rate of those two spacings was not very different, 100.3 kg N/ha with
16 x 12 inch spacing and 98.2 kg N/ha with 14 x 14 inch spacing (Figure 6).
Figure 6. Yield Response to Different UDP Spacing by Locations
Nitrogen x Potassium on TPR at Chantharkone, Letpadan Two different rates of nitrogen (51.7 kg N/ha and 77.6 kg N/ha) using two different sizes of
urea briquettes and two different rates of potassium (37 kg K2O/ha and 74 kg K2O/ha) were
tested with three replications. There were some variations in plant performance and yield

25
among trial plots. There were no significant differences between treatments. However,
significant difference P(0.05) was observed for potassium rates.
Nitrogen – The higher nitrogen rate (77.6 kg N/ha) gave higher yield of 6.59 mt/ha compared
to 6.42 mt/ha with the lower nitrogen rate (51.7 kg N/ha). But they were not statistically
different.
Potassium – In this trial, it seemed potassium was more limiting than nitrogen. Significant
difference at P(0.05) was observed between high K rate and low K rate. The higher K rate gave
higher yield (6.73 mt/ha) than the low K rate, which gave 6.28 mt/ha.
N x K interaction – There was no interaction between N and K rate. Higher rates gave
higher yields for both N and K. However, the yield with high K rate was significantly higher
than the low K rate (Figure 7).
In this trial, there was no visual difference between N rates at early stages. Plants were
equally healthy and green. No difference was observed between N rates though the higher N
rate gave higher yield than the lower N rate. N may not be a limiting nutrient on this soil.
There was no clear visual difference between K rates before harvest. However, yields with
different K rates were significantly different at P(0.05). The higher K rate produced higher
yield than the lower K rate. K may therefore be more limiting than N (Refer to Chantharkone,
Letpadan data sheet in Appendix 1).

26
Figure 7. Yield Response (mt/ha) on Different Rates of Nitrogen and Potassium
Plant Spacing x Nitrogen Rate Trial on TPR at Thewatchaung, Letpadan Two different plant spacings (S1=20 x 20 cm and S2=20 x 15 cm) were tested as the main
factor, and two different sizes of urea briquette were tested as the sub-factor in a split plot
design with three replications. Nitrogen rates were therefore 51.8 kg N/ha (20 x 20 cm
spacing) and 69.0 kg N/ha (20 x 15 cm spacing) for 1.8-g briquette, and 77.6 kg N/ha
(20 x 20 cm spacing) and 103.5 kg N/ha (20 x 15 cm spacing) for 2.7-g briquette. According
to statistical analysis, there were no significant yield differences for both factors and no
significant interaction was observed.
However, closer spacing (20 x 15 cm) gave a slightly higher yield (5.79 mt/ha) than wider
spacing (20 x 20 cm), which gave 5.75 mt/ha for low N rates. With higher N rates,
20 x 20 cm spacing gave higher yield (5.86 mt/ha) than 20 x 15 cm spacing (5.78 mt/ha). As
an average, wider spacing gave more yield than closer spacing. But according to ANOVA,
the difference was not significant (Figure 8). This is because plants sown in wider spacing
having more productive tillers (17.6 panicles per hill) than plants with closer spacing, which
have only 14.3 panicles per hill.
Figure 8. Yield Response (mt/ha) on Different Plant Spacing and Nitrogen
Rates
0
20
40
60
80
100
120
5.68
5.70
5.72
5.74
5.76
5.78
5.80
5.82
5.84
5.86
5.88
S1N1 S2N1 S1N2 S2N2
N Rate (kg/ha
)
Yield (m
t/ha
)
Yields with Plant Spacing and N Rates
Yield N rate kg/ha

27
There was no significant yield difference between N rates. With wider spacing, the higher N
rate produced more yield than low N rate (5.86 mt/ha and 5.75 mt/ha, respectively). With
closer spacing, the yields with lower N rate and higher N rate were similar (5.79 and
5.78 mt/ha, respectively). As an average over two spacings, the lower N rate gave lower yield
(5.77 mt/ha) and higher N rate gave higher yield (5.82 mt/ha) (see Figure 8).
Fertilizer Management Trials on Rice-Gram Cropping System Different amounts of P and K on rice or gram were tested in the rice-gram cropping system.
This is a long-term experiment to study the carryover effect of P and K on the subsequent
crop (gram or rice).
In the 2016 dry season, the gram crop was grown for the first time after harvesting the wet
season rice crop. With Treatment 1, zero P and zero K were applied on the gram crop, and
both P and K had been applied on the rice crop. With Treatment 2, half the amount of P
(20 kg P2O5/ha) and half the amount of K (20 kg K2O/ha) were applied, which was the same
amount applied on rice. The full amount of P (40 kg P2O5/ha) and the full amount of K
(40 kg K2O/ha) were applied on Treatments 3 and 4. After harvesting the gram crop, all crop
residue will be added for the next rice crop on Treatment 4. No N was applied on the gram
crop. The trials were conducted on the same plot as rice at all locations.
The significant test of yield and all component characteristics for all three locations are given
in Table 14. According to the ANOVA, there were no significant differences between
treatments on almost all component characteristics and yield. Significant difference at P(0.05)
was observed on 100-seed weight at Tharkwin, Einme only.
Thar Kwin, Einme – No significant differences were observed on yield and plant
characteristics, except 100-grain weight. Significant difference at P(0.05) was observed on
100-seed weight. Generally, P- and K-applied plots gave heavier seed weight than plots with
no P and K, or with half of the P and K applied. The plots that received the full amount of P
and K had 100-seed weight of 4.87 g (Treatment 3) and 4.67 g (Treatment 4) and were not
statistically different from each other. Zero P and K and half P and K had 100-seed weight of
4.47 g each. The yields of different treatments were inconsistent. The full P and K treatments
(Treatment 3) gave 1.15 mt/ha, while another (Treatment 4) gave only 1.05 mt/ha. Zero P and
K produced 1.07 mt/ha, while the half P and K treatment produced 0.79 mt/ha. Yield

28
difference may be due to lack of plant uniformity, which was observed at the growing stage.
Some plants were very small while other plants had normal growth (Refer to Tharkwin,
Einme data sheet in Appendix 1).
Parami Daunt, Einme – According to ANOVA, there were no differences between
treatments on all plant characteristics and yield. The Zero P and K treatment produced the
lowest yield with 1.56 mt/ha, and the half P and K treatment gave the second lowest yield
4.66 mt/ha. The full amount of P- and K-applied plots gave higher yields with 1.77 mt/ha
(Treatment 3) and 1.68 mt/ha (Treatment 4). But the yields were not significantly different
from each other. Other plant characteristics showed no differences between treatments. The
number of seeds per pod ranged from 6.5 (Treatment 4) to 6.9 (Treatment 2). P- and
K-applied treatments produced heavier grain weight than no P and K treatments. Zero P and
K produced 4.60 g of 100-grain weight, and plots that received P and K produced 4.67-4.77 g
of 100-seed weight. But there was no significant difference between treatments (Refer to
Paramidaunt, Einme data sheet in Appendix 1).
Ashaebine, Kyauktan – It was difficult to interpret P and K response on yield since all
treatments gave nearly equal yields ranging from 1.63 mt/ha to 1.88 mt/ha. Zero P and K did
not give the lowest yield, and the highest yield was observed with half P and K treatment.
They are not significantly different from each other. No differences between treatments were
observed on other characteristics. Although no differences, P- and K-applied plots gave a
slightly heavier grain weight (8.47 g and 8.53 g) with the full amount of P and K and 8.27 g
and 8.47 g with half the amount of P and K and Zero P and K, respectively (Refer to
Ashaebine, Kyauktan data sheet in Appendix 1).
This is the first time a gram crop was planted in a rice-gram system. Farmers’ practice of land
preparation must improve to get proper tillage for the gram crop. Residual moisture content
of the soil is also important to get good germination and establishment of the crop. Poor
germination and poor crop establishment were noted at all locations. This is evident by how
many plants in 100 ft2 could be harvested (see the data sheets of all locations in Appendix 1).
Final yields are adjusted to the same number of plants. The non-significant result may be
because P and K levels applied in this experiment are too low. The trial will continue with
higher rates of P and K in coming seasons/years.

29
Different Seed Rate Trial on BR Myanmar farmers are practicing broadcast rice using a high seed rate (150-200 kg/ha). UDP
application at 25-30 days after sowing on a dense broadcast rice field is difficult since
seedlings are too thick to use the push type UDP applicator. This trial was conducted to study
yield differences between different seed rates on broadcast rice. There were five treatments
with five seed rates (50, 62.5, 75, 87.5, and 100 kg seed/ha). As basal fertilizer,
50 kg TSP/acre, 25 kg MOP/acre, and 10 kg gypsum/acre were applied just before sowing.
UDP was applied at 20-25 days after sowing with 14 x 12 inch spacing (100 kg urea/acre).
In this trial, no significant differences were found on yield or any characteristics. There are
some variations of results on all parameters. Trends of results are not similar among
parameters. The lowest seed rate (50 kg seed/ha) gave the highest yield with 5.82 mt/ha. The
lowest yield (4.97 mt/ha) was found with 75-kg seed rate. But with biomass yields per square
meter, both straw and grain were the highest with the highest seed rate (100 kg/ha). The
number of panicles per square meter also had the same result with biomass yields, which
could mean that the highest seed rate may produce the highest yield. Although not a
significant difference, the lowest seed rate had the highest number of spikelets and grains.
That might be the reason that the highest yield occurred with a lower seed rate and less
number of panicle per square meter. The reason the crop cut yield did not agree with the
above results may be due to sample size. It was somewhat difficult to get a 100 ft2 crop cut
sample area that had enough population. The germination of broadcast rice on a farmer’s
field is often found not uniform due to uneven land preparation. However, from the results of
this trial, seed rate on broadcast rice could be reduced down to 50 kg dry seed/ha (Refer to
Seed Rate Trial at Eingyi, Twantay data sheet in Appendix 1).
N-Rate Trial on Black Gram Using UDP and Prilled Urea This trial was conducted for the first time to see the response of N on yield by applying
different rates of urea briquettes and prilled urea. Two trials were conducted side by side.
There are some constraints with farmers’ practice of land preparation and the residual
moisture content of soil. It was difficult to deep-place urea briquettes due to uneven tillage.
The soil was too hard to apply UDP in many places. Germination and establishment of crop
were very poor. Several variations in plant growth and germination were observed. The data
was found hard to interpret and not reported.
30
Conclusion
UDP Adaptation Trials UDP treatment gave the highest yield at all four locations. It was significantly higher at three
locations, but there was no significant difference at Zaybine. Although not significant, the
yield with UDP (5.39 mt/ha) was clearly the highest among all treatments (Table 7). The
highest yield increase of UDP over other N-applied treatments was 41.69% and observed at
Eingyi, where the FP N rate was lower than the UDP rate. The lowest yield increase of
11.07% was calculated at Zaybine, where the FP N rate was higher than the UDP rate. On
average, yield superiority of UDP over UB with the same N rate was 24.67%. It was 25.3%
over FP, although N rates varied. It is concluded that a 25% yield increase can be expected by
applying UDP (Table 7 and Table 8).
The highest yield with UDP was explained by the number of productive tillers since it was
significantly the highest at two locations (Eingyi and Inglone). At the other two locations, it
was not significant, but panicles with UDP were not the lowest or even more than other
treatments, particularly at Zaybine (Table 10).
With UDP technology, 25.86 kg of rice was obtained by applying a kilogram of N, whereas
surface broadcasting of prilled urea gave only 12-13 kg of grain per kg of N (Table 12). It is
concluded that UDP technology is clearly the most effective use of N fertilizer and needs less
fertilizer than urea surface broadcast applications.
N-Rate Trial There was no significant difference in yield among treatments. However, the highest yield
(6.12 mt/ha) was obtained with the second highest N rate of 155.3 kg N/ha. The yield started
to decline after that, and the highest N rate (181.1 kg N/ha) did not give the highest yield; it
was even lower than the control (Refer to Research Farm, Myaungmya data sheet in
Appendix 1). This yield result was similar to the results of the number of panicles per hill and
biomass straw weight in which significant differences were observed; the highest number of
panicles per hill and highest biomass straw weight were produced with the second highest N
rate. Although not significant, other characteristics also had the highest value/amount with
the second highest N rate, except the number of spikelets per panicle. The total number of
spikelets per panicle was similar for all N rates. Therefore, it can be concluded that the
31
highest rice yield can be expected with an N rate of about 155.3 kg/ha with balanced
fertilization of other important nutrients.
UDP Before Broadcasting Trial on BR Significant results from test locations showed a possibility of UDP application before seed
broadcasting on broadcast rice fields. UDP application just before seed broadcasting gave the
highest yield at Kanyin Gae, Kyaiklat, although it was not statistically different from other
N-applied treatments (Refer to Kanyingae, Kyaiklat data sheet in Appendix 1). At Yin Daik
Kwin, Taikkyi, UDP application after seed broadcasting produced the highest yield, and it
was statistically different from all other treatments. UDP before sowing gave the second
highest yield at Taikkyi. It seemed that UDP application before sowing did not provide
enough N throughout the season at Taikkyi (Refer to Yindaikkwin, Taikkyi data sheet in
Appendix 1). It was observed at flowering time that the plant color under UDP in the
pre-sowing treatment was not as green as the post-sowing treatment. However, this did not
show at Kyaiklat. In these trials, unlike on transplanted rice, UDP spacing of 14 x 12 inches
was used and, therefore, the N rate with UDP (114.6 kg N/ha) was higher than the FP
treatment (85.2 kg N/ha). It was tested on an early maturing variety, Thee Dat Yin. With
normal UDP spacing of 16 x 16 inches and medium-maturing variety, the result may be
different.
Based on the trials, it can be concluded that UDP application could be practiced just before
seed broadcasting on broadcast rice, especially with early varieties. This is more convenient
than applying UDP after seed broadcasting, particularly if application is late and in a dense
field.
UDP Spacing Trials on BR Between Taikkyi and Kyaiklat trials, a significant result was found at Kyaiklat only. Almost
all parameters, except 1,000-grain weight and dry grain biomass weight, showed significant
differences among treatments. Significant differences in yield were between FP treatment and
UDP treatments only. There were no differences between UDP-applied plots. At Taikkyi,
significant differences were observed with plant height and wet and dry straw weight only.
Other characteristics, including yield, did not show differences. Yield results were not
consistent among Taikkyi and Kyaiklat. The Taikkyi trial gave the highest yield with
16 x 12 inch spacing, while the Kyaiklat trial gave the highest yield with 14 x 14 inch

32
spacing. However, N rates were not much different between 16 x 12 inch and 14 x 14 inch
spacing (100.3 kg N/ha and 98.2 kg N/ha, respectively).
Based on the results, which showed no differences between UDP-applied plots, a UDP
spacing of 16 x 12 inches or 14 x 14 inches could be applied along with a seed rate of not
more than 75 kg/ha. When transplanting, normal spacing of 16 x 16 inches is still
recommended.
Nitrogen x Potassium Trial on TPR According to results, significant difference at P(0.05) was observed with K rates. There was no
significant difference between N rates or N x K interaction. However, the higher N rate
(77.6 kg N/ha) gave a higher yield of 6.59 mt/ha than the lower N rate, which gave only
6.42 mt/ha. The higher K rate (74 kg K2O/ha) gave significantly higher yield than the lower K
rate (37 kg K2O/ha), which means K is more limiting a nutrient than N in the soil tested.
Plant Spacing and N Rate Trial on TPR Although results showed no differences on both factors, plant spacing and N rates, wider
spacing of 20 x 20 cm gave higher yield than closer spacing of 20 x 15 cm with a higher N
rate. With a lower N rate, closer spacing gave slightly higher yield than wider spacing. This is
the dry season, and the result is different from the wet season trial conducted in 2016. In the
wet season, wider spacing gave a higher yield with a low N rate than with a high N rate
(Refer to the 2016 Wet Season Summary Report), which means that more N fertilizer is
needed in the dry season than in the wet season.
Fertilizer Management Trials on Rice-Gram Cropping System This is a long-term trial on the rice-gram system, testing the carryover effect of N applied as
UDP on the rice crop to the gram crop and P and K on subsequent crop, rice or gram.
Different amounts of P and K were applied on the rice or gram crop. The total amount of P
and K was 40 kg P2O5/ha and 40 kg K2O/ha, respectively. Treatments on the gram crop were:
0 P and 0 K for Treatment 1 (all P and K were applied on the rice crop). Half of the amount
of P and K (20 kg P2O5/ha and 20 kg K2O/ha) was applied for Treatment 2, and the entire
amount of P and K (40 kg P2O5/ha and 40 kg K2O/ha) was applied on Treatments 3 and 4.

33
Among three tested locations, significant difference at P(0.05) was observed only on 100-seed
weight at Thar Kwin, Einme only. No significant differences were observed for yield or other
characteristics at all locations. This means that P and K applied on the gram crop could
improve 100-grain weight at Thar Kwin since P and K applied at the full amount (Treatments
3 and 4) gave statistically higher yield than half of the amount or zero applied plots.
Carryover effect was not observed because of non-significant results on yield and other
characteristics. This means that the amount of P and K applied appears to be enough for the
rice crop only. The trial will be continued with higher amounts of P and K in coming seasons
by applying 60 kg/ha each for P2O5 and K2O.
In these trials, poor germination and poor crop establishment were noted, particularly on the
black gram crop at Einme. Residual moisture content and land preparation are critical to
obtain proper germination and good crop establishment since the gram crop is grown with
residual moisture. Unfavorable late rain tends to rush land preparation, which also leads to
poor crop establishment and low yield.
Different Seed Rates Trial The seed rate trial showed no statistical differences on yield or any parameters between
treatments. According to results, the lowest seed rate (20 kg seed/acre) gave the highest yield
with 5.82 mt/ha. This yield arose with fewer panicles per square meter but with more
spikelets and grains per panicle. However, the highest biomass weight, both straw and grain,
was produced by the highest seed rate, which came from more panicles per square meter.
Since the yield was not significantly different between seed rates, farmers may have two
options. Use a lower seed rate combined with balanced fertilizer management to get high
yield with fewer panicles bearing more grains or use a high seed rate with less fertilizer to get
a similar yield with more panicles bearing less grains. Currently, farmers are practicing a high
seed rate on broadcast rice to ensure germination to get enough plant population in a given
area.