fertilizer response and profitability in rwanda · 13 peas: map of fertilizer promotion...
TRANSCRIPT
FERTILIZER RESPONSE AND PROFITABILITY IN RWANDA
A Synthesis of Findings from MINAGRI Studies Conducted by
The Food Security Research Project (FSRP)
and
The FAO Soil Fertility Initiative
By
Valerie Kelly* Anastase Murekezi**
February 2000
*Associate Professor, Department of Agricultural Economics, Michigan State University **Agronomist, Consultant to FAO Soil Fertility Initiative and to the Food Security Research Project
Food Security Research Project, FSRP/MINAGRI, B.P. 2848 Kigali, Rwanda. Tel. (250) 82572
REPUBLIC OF RWANDA MINISTRY OF AGRICULTURE, ANIMAL RESOURCES, AND FORESTRY
2
TABLE OF CONTENTS 1. Introduction 4
1.1.Policy Context 4
1.2.Objectives of the Synthesis 4
1.3.Conceptualizing Potential and Effective Fertilizer Demand 5
2. Background on the Studies and Research Methods 7
2.1. Criteria Used to Evaluate Profitability 7
2.2. Summary of FSRP and FAO/SFI Methods 7
2.3. Implications of Differences in the FSRP and FAO/SFI Methods 9
2.3.1. Response Data 9
2.3.2. Input Prices 11
2.3.3. Output prices 11
3. Summary of Key Findings on Fertilizer Profitability 13
3.1. Recommendations for Climbing Bean Fertilization 16
3.2. Recommendations for Maize Fertilization 18
3.3. Recommendations for Rice Fertilization 20
3.4. Recommendations for Sorghum Fertilization 22
3.5. Recommendations for Potato Fertilization 24
3.6. Recommendations for Soybean Fertilization 26
3.7. Recommendations for Sweet Potato Fertilization 28
3.8. Recommendations for Cabbage Fertilization 30
3.9. Recommendations for Peas, Wheat, and Cassava Fertilization 32
4. Taking Stock and Moving Forward 36
4.1. General Organization of Fertilizer Promotion Activities 36
4.2. Implications for Research and Extension Activities 37
4.3. Implications for Market Development Activities 39
4.4. Implications for Sectoral and Macro-economic Policy Design 40
List of References Cited 41
Appendix 1: Principal Fertilizer Response References Consulted by FSRP 42
Appendix 2: Principal Fertilizer Response References Consulted by FAO/SFI 44
Appendix 3: Participants to the Fertilizer Response and Profitability Workshop on
December 15, 1999 at MINAGRI, Kigali. 46
3
LIST OF TABLES
1 Comparison of Analytical Methods Used in FSRP/FAO Fertilizer Studies 9
2 Profitable Fertilizer Treatments for Climbing Beans, by Zone 16
3 Profitable Fertilizer Treatments for Maize, by Zone 18
4 Profitable Fertilizer Treatments for Rice, by Zone 20
5 Profitable Fertilizer Treatments for Sorghum, by Zone 22
6 Profitable Fertilizer Treatments for Potatoes, by Zone 24
7 Profitable Fertilizer Treatments for Soybeans, by Zone 26
8 Profitable Fertilizer Treatments for Sweet Potatoes, by Zone 28
9 Profitable Fertilizer Treatments for Cabbage, by Zone 30
10 Estimate of Effective Demand for Fertilizer in Rwanda: 1999-2010 39
LIST OF FIGURES
1 Factors Affecting Fertilizer Consumption Levels 6
2 Real Price Trends for Maize: 1995-1999 12
3 Traffic Light Guide to Fertilizer Mapping 14
4 Map of Agro-bioclimatic Zones in Rwanda 15
5 Climbing Beans: Map of Fertilizer Promotion Recommendations for
Rwanda 17
6 Maize: Map of Fertilizer Promotion Recommendations for Rwanda 19
7 Rice: Map of Fertilizer Promotion Recommendations for Rwanda 21
8 Sorghum: Map of Fertilizer Promotion Recommendations for Rwanda 23
9 Potatoes: Map of Fertilizer Promotion Recommendations for Rwanda 25
10 Soybeans: Map of Fertilizer Promotion Recommendations for Rwanda 27
11 Sweet Potatoes: Map of Fertilizer Promotion Recommendations for Rwanda 29
12 Cabbage: Map of Fertilizer Promotion Recommendations for Rwanda 31
13 Peas: Map of Fertilizer Promotion Recommendations for Rwanda 33
14 Wheat: Map of Fertilizer Promotion Recommendations for Rwanda 34
15 Cassava: Map of Fertilizer Promotion Recommendations for Rwanda 35
4
FERTILIZER RESPONSE AND PROFITABILITY IN RWANDA
A SYNTHESIS OF FINDINGS FROM MINAGRI STUDIES CONDUCTED BY
THE FOOD SECURITY RESEARCH PROJECT AND
THE FAO SOIL FERTILITY INITIATIVE 1. INTRODUCTION 1.1 Policy Context The Government of Rwanda (GOR) has proposed the following actions and policies aimed at enhancing the use of improved farm inputs:1 ? Identify the potential for fertilizer use by agro-ecological zones (the most fertilizer
responsive crops and varieties and the most effective types of fertilizer for each zone). ? Promote an increased supply (imports) of fertilizer progressively from the current
annual average of 4,000 tons to 10,000 tons within five years. ? Reinforce farmers’ technical capacity to use fertilizers through extension programs. ? Reinforce farmers’ interest in and access to fertilizers (by improving the credit system,
improving markets for high value crops, etc.). ? Create an environment which encourages private sector fertilizer marketing
(importation, distribution, etc.) through the reduction of import and sales taxes and improvement in the physical infrastructure (roads, stores, etc.) to make the business profitable.
Knowing what fertilizers to recommend for different crops and zones as well as having a good grasp of the farm-level profitability of fertilizer given various input/output price scenarios is a critical first step in implementing the entire program. Consequently, a key objective of the Food Security Research Project (FSRP) and the FAO Soil Fertility Initiative (SFI) has been to update analyses of fertilizer profitability using existing sources of fertilizer response data and recent prices for fertilizer and key crops. 1.2. Objectives of the Synthesis The objectives of this synthesis are to:
• Present in synthesis form key conclusions and recommendations of the FSRP/FAO-SFI studies on fertilizer profitability in Rwanda;
• Incorporate into the synthesis information and comments obtained from participants in the December 15, 1999, MINAGRI Fertilizer Profitability Workshop conducted to present and validate the preliminary findings of the two studies.
1Ministry of Agriculture, Animal Resources and Forestry. 1999. Proposed Fertilizer Policy.
5
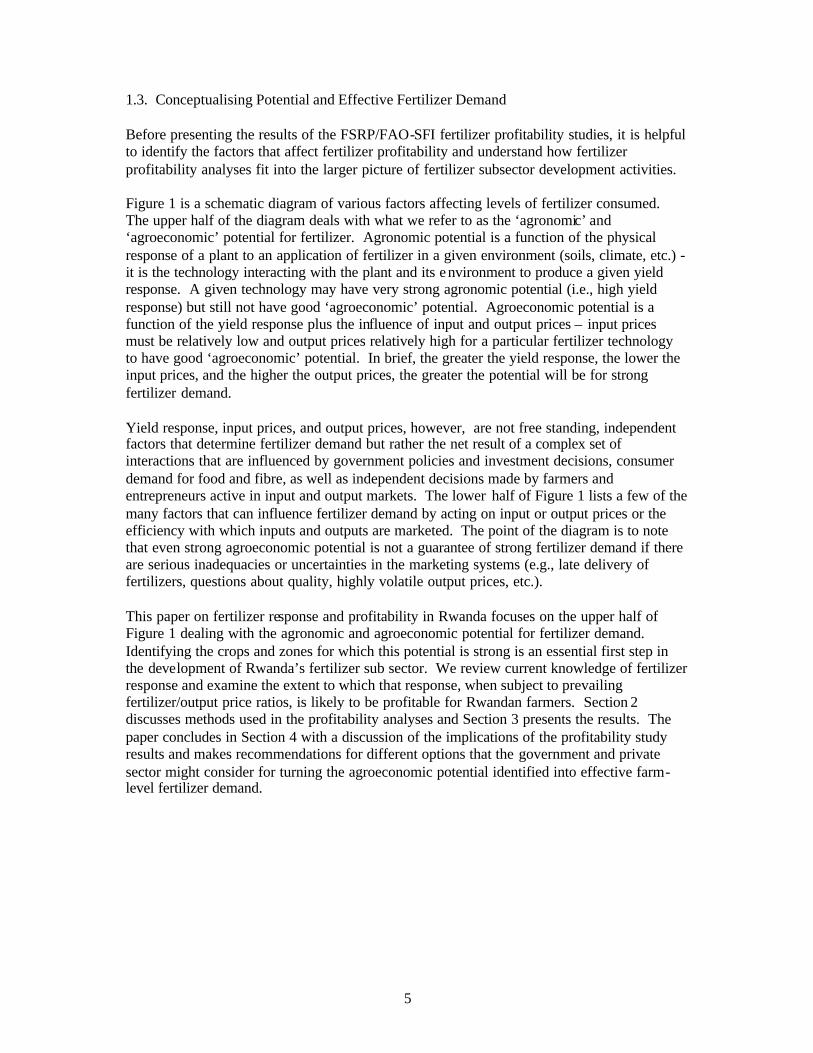
1.3. Conceptualising Potential and Effective Fertilizer Demand Before presenting the results of the FSRP/FAO-SFI fertilizer profitability studies, it is helpful to identify the factors that affect fertilizer profitability and understand how fertilizer profitability analyses fit into the larger picture of fertilizer subsector development activities. Figure 1 is a schematic diagram of various factors affecting levels of fertilizer consumed. The upper half of the diagram deals with what we refer to as the ‘agronomic’ and ‘agroeconomic’ potential for fertilizer. Agronomic potential is a function of the physical response of a plant to an application of fertilizer in a given environment (soils, climate, etc.) - it is the technology interacting with the plant and its environment to produce a given yield response. A given technology may have very strong agronomic potential (i.e., high yield response) but still not have good ‘agroeconomic’ potential. Agroeconomic potential is a function of the yield response plus the influence of input and output prices – input prices must be relatively low and output prices relatively high for a particular fertilizer technology to have good ‘agroeconomic’ potential. In brief, the greater the yield response, the lower the input prices, and the higher the output prices, the greater the potential will be for strong fertilizer demand. Yield response, input prices, and output prices, however, are not free standing, independent factors that determine fertilizer demand but rather the net result of a complex set of interactions that are influenced by government policies and investment decisions, consumer demand for food and fibre, as well as independent decisions made by farmers and entrepreneurs active in input and output markets. The lower half of Figure 1 lists a few of the many factors that can influence fertilizer demand by acting on input or output prices or the efficiency with which inputs and outputs are marketed. The point of the diagram is to note that even strong agroeconomic potential is not a guarantee of strong fertilizer demand if there are serious inadequacies or uncertainties in the marketing systems (e.g., late delivery of fertilizers, questions about quality, highly volatile output prices, etc.). This paper on fertilizer response and profitability in Rwanda focuses on the upper half of Figure 1 dealing with the agronomic and agroeconomic potential for fertilizer demand. Identifying the crops and zones for which this potential is strong is an essential first step in the development of Rwanda’s fertilizer sub sector. We review current knowledge of fertilizer response and examine the extent to which that response, when subject to prevailing fertilizer/output price ratios, is likely to be profitable for Rwandan farmers. Section 2 discusses methods used in the profitability analyses and Section 3 presents the results. The paper concludes in Section 4 with a discussion of the implications of the profitability study results and makes recommendations for different options that the government and private sector might consider for turning the agroeconomic potential identified into effective farm-level fertilizer demand.
6
Source: Naseem and Kelly. 1999.
7
2. BACKGROUND ON THE STUDIES AND RESEARCH METHODS 2.1. Criteria Used to Eva luate Profitability Both the FSRP and the FAO/SFI studies use estimated value/cost ratios to evaluate the potential profitability of fertilizer. The value/cost ratio is calculated as:
VAP/CFT where VAP = the value of additional production attributable to the fertilizer treatment
CFT = the cost of the fertilizer treatment In classifying treatments as ‘profitable’ at the farm level both studies used a v/c ≥2 as the cut-off point. In other words, the minimum incentive required for a farmer to use fertilizer is the case where the potential returns to the investment are at least double the cost of the investment. This is a common rule of thumb used in fertilizer analysis for agricultural systems where farmers are just beginning to adopt fertilizer. Although strictly speaking, a v/c > 1 is profitable (costs of the investment are covered and there is something left over for profit), farmers who have limited financial resources and face substantial production and price risks (high inter -annual variability in yields due to climatic factors and high variability in prices due to poorly developed markets) are seldom willing to risk an investment unless estimated returns are substantially greater than the investment. There is no debate in the literature that the v/c must be at least 2. There is, however, substantial debate as to whether the ratio must be at least 3 in many areas of Africa. The opinion of the authors is that cases where the v/c ratio is 3 or better are the cases where fertilizer promotion is mos t likely to succeed in the short-run. Cases where the v/c is only 2 or slightly higher, are potentially profitable, but will require more extension assistance and monitoring to ensure that farmers are using fertilizer properly and able to obtain the yields achieved during the earlier trials and demonstrations providing the fertilizer response data used in this report. Although both the FSRP and the FAO/SFI reports used the same profitability criteria, there are numerous differences in the sources and nature of the response data as well as the input and output price assumptions used. These differences are described in the next two sections. 2.2. Summary of FSRP and FAO/SFI Methods The FSRP approach has been to: (1) Review and synthesize published documents reporting results of past fertilizer trials
and demonstrations for five key crops: climbing beans, maize, rice, sorghum, and potatoes; given the variety of sources consulted, FSRP response data examined varies considerably in terms of numbers of observations, sites and years covered, and treatments evaluated (including some information on response to manure and lime applications);
8
(2) Use the 1995-1999 market price data collected by the PASAR2 to develop a set of hypotheses about output prices faced by farmers (price variations across years, seasons and markets are taken into account after converting data to real prices using December 1998 as the base year); prices for each analysis were selected from markets identified as the ones most frequently used for a particular crop by farmers in a particular agrobioclimatic zone;
(3) Calculate the cost of various types of fertilizer by prefecture (based on fertilizer prices for Kigali supplied by potential importers in early 1999 and transport costs provided by both fertilizer distributors and the World Food Program);
(4) Estimate the probable financial returns (v/c ratio) to the use of fertilizer for selected crop/zone combinations by combining information from the first 3 steps;
(5) Prepare a preliminary report of findings that included an evaluation of the relative strength of the different v/c ratios estimated (e.g., giving more weight to examples with a large number of sites, years, or repetitions covered in the trials or demonstrations); and
(6) Develop an interactive spreadsheet that permits analysts to change/update assumptions about crop response to fertilizer, fertilizer prices, transport prices, and output prices.
The SFI/FAO approach has been to: (1) Use NP (nitrogen/phosphorous) response data to estimate fertilizer production functions
for the five key crops noted above plus soybeans, peas, wheat, sweet potato, cassava, and cabbage. The number of observations, agrobioclimatic zones covered, and dates for the response data vary by crop, but all data were collected as part of the FAO/DANIDA Project which was active throughout the 1980s and early 1990s. All trials were conducted on farmers' fields using a basal dose of K (34 kg for pulses, 42 for cereals, and 50 for tubers) and an application of manure that represented farmers' usual practices.
(2) The quadratic model was then used to identify the dose of N and P that would result in a minimum marginal rate of return of 2 (equivalent to a v/c ratio ≥2 and referred to as the economically optimum dose),3 using prices for N and P based on a weighted average of nutrient prices represented in the three fertilizers currently available in Rwanda (NPK, DAP, and urea).
(3) V/C ratios were then calculated using two scenarios about the fertilizer products used to supply the economically optimum dose : The quantity of NPK (17-17-17) and urea required versus the quantities of DAP and urea required.
(4) Fertilizer costs were based on prices for fertilizer 1999 imports; the prices reflect a policy of pan-territorial pricing as the private sector importer/distributor (Business Center) added a fixed transport cost to all fertilizer delivered throughout the country regardless of distance and actual cost.
(5) Output prices were the September/October 1999 nominal prices reported by PASAR (for most crops this is the period of the year when prices are low); prices for each analysis were taken from the most active markets for the particular crop/zone combination being examined.
2 Projet d’Appui à la Sécurité Alimentaire au Rwanda 3 Note that the economically optimum dose is NOT the profit maximizing dose, which has a marginal rate of return equal to one. The logic in making this distinction is based on a belief that the profit maximizing dose is too expensive and too risky to be considered during the early stages of fertilizer promotion in Africa.
9
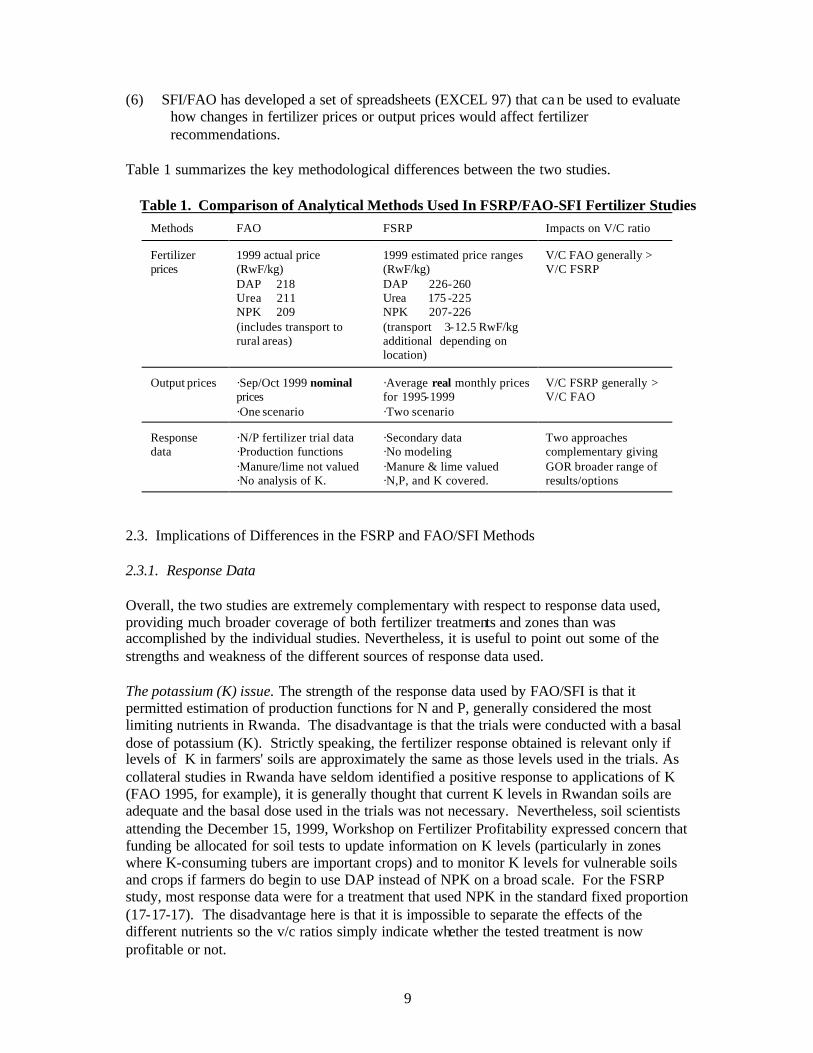
(6) SFI/FAO has developed a set of spreadsheets (EXCEL 97) that ca n be used to evaluate how changes in fertilizer prices or output prices would affect fertilizer recommendations.
Table 1 summarizes the key methodological differences between the two studies.
2.3. Implications of Differences in the FSRP and FAO/SFI Methods 2.3.1. Response Data Overall, the two studies are extremely complementary with respect to response data used, providing much broader coverage of both fertilizer treatments and zones than was accomplished by the individual studies. Nevertheless, it is useful to point out some of the strengths and weakness of the different sources of response data used. The potassium (K) issue. The strength of the response data used by FAO/SFI is that it permitted estimation of production functions for N and P, generally considered the most limiting nutrients in Rwanda. The disadvantage is that the trials were conducted with a basal dose of potassium (K). Strictly speaking, the fertilizer response obtained is relevant only if levels of K in farmers' soils are approximately the same as those levels used in the trials. As collateral studies in Rwanda have seldom identified a positive response to applications of K (FAO 1995, for example), it is generally thought that current K levels in Rwandan soils are adequate and the basal dose used in the trials was not necessary. Nevertheless, soil scientists attending the December 15, 1999, Workshop on Fertilizer Profitability expressed concern that funding be allocated for soil tests to update information on K levels (particularly in zones where K-consuming tubers are important crops) and to monitor K levels for vulnerable soils and crops if farmers do begin to use DAP instead of NPK on a broad scale. For the FSRP study, most response data were for a treatment that used NPK in the standard fixed proportion (17-17-17). The disadvantage here is that it is impossible to separate the effects of the different nutrients so the v/c ratios simply indicate whether the tested treatment is now profitable or not.
Table 1. Comparison of Analytical Methods Used In FSRP/FAO-SFI Fertilizer Studies Methods
FAO
FSRP
Impacts on V/C ratio
Fertilizer prices
1999 actual price (RwF/kg) DAP 218 Urea 211 NPK 209 (includes transport to rural areas)
1999 estimated price ranges (RwF/kg) DAP 226-260 Urea 175 -225 NPK 207-226 (transport 3-12.5 RwF/kg additional depending on location)
V/C FAO generally > V/C FSRP
Output prices
·Sep/Oct 1999 nominal prices ·One scenario
·Average real monthly prices for 1995-1999 ·Two scenario
V/C FSRP generally > V/C FAO
Response data
·N/P fertilizer trial data ·Production functions ·Manure/lime not valued ·No analysis of K.
·Secondary data ·No modeling ·Manure & lime valued ·N,P, and K covered.
Two approaches complementary giving GOR broader range of results/options
10
The manure issue. The FAO/SFI trial data as well as many of the FSRP sources of fertilizer response data fail to provide information for a pure control plot -- i.e., one without any manure. Furthermore , the quantities of manure are seldom clearly specified. This renders the interpretation of the results difficult as we do not know what the response to the fertilizer would be if a farmer were unable to apply the same amount of manure as was applied in the trials. Our inability to know what would happen in the absence of the basal dose of manure suggests that the extension program should stress the importance of manure being used in combination with inorganic fertilizers rather than as a substitute for them. 4 In the FSRP database, there are some examples of NPK and or DAP response without a basal dose of manure – few of these were profitable and they are therefore not summarized in this report. There were also a few examples of crop response to manure only (no inorganic fertilizers) – none of these cases are reported here as they were never more profitable than the treatments using chemical fertilizers either alone or in combination with organic matter. Future fertilizer research needs to take the manure issue into account by designing true control plots so one can evaluate manure and fertilizer response independently as well as the interaction effects. The lime issue. The FAO/SFI trials in zone 5a (Hautes Terres de Bufundu et Bushiru) used a basal application of lime (2.5 tons) at the head of each 4-season rotation. Although the lime cost was not taken into account when identifying the economically optimum dose of N and P, an effort has been made to examine the potential impact on overall profitability (v/c ratio) of the lime application in the potato section of this synthesis. The treatment of lime in studies reviewed by FSRP was variable, in some cases data permitted the inclusion of lime application costs in the v/c ratio calculation and in other cases it did not (in the latter case, lime was applied to both the control and the test plot). None of the FSRP cases using lime fell into the profitable category, hence they are not referred to in this synthesis report. The lack of strong profitability of lime treatments in the limited number of cases examined by the FSRP study suggests a need for further research in this area.5 The site/observation issue. Many of the sources consulted by FSRP were syntheses of results from multiple sites and/or years of trials and demonstrations. Documentation was frequently very poor concerning the number of observations used to calculate average yield response and the variability (e.g., a standard deviation or coefficient of variation). This limited our ability to compare the relative strength of results from different reports and evaluate the risk associated with fertilizer use (e.g., percent of plots with low yield response). Although the FAO/SFI data base permitted some analysis of variability in yield response across time and space, this has not yet been done.
4 Weight and Kelly (1999) present an extensive review of literature on fertilizer/organic matter complementarities in Africa and elsewhere. The implications for maintaining soil quality and increasing productivity are thoroughly discussed. 5An extensive literature review of lime use in Rwandan agriculture has recently been completed by Frank R. Beernaert (1999); we did not receive a copy of this early enough to include it in our review.
11
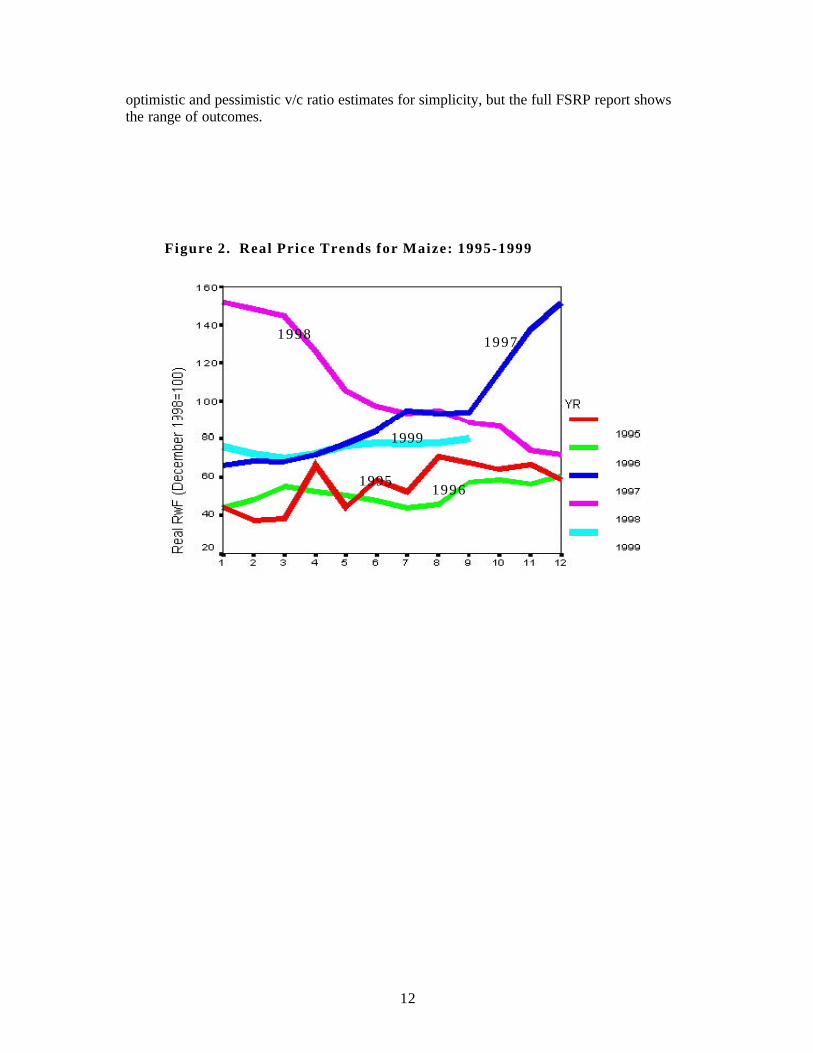
The improved practices issue. Another problem encountered in sources consulted by FSRP was the allusion to improved practices having been used with the fertilizer treatment but a failure to clarify exactly what this included. It generally appeared to include some combination of an improved seed variety (with the variety not always being specified), spacing techniques, fertilizer application techniques (broadcasting versus placing it in the seed pocket or on the seeding line), and other unspecified practices. Information was lacking on the labor implications of applying fertilizer and using these improved practices, so no effort was made to account for increased labor costs. Although evidence from other countries suggests that fertilizer application itself does not require a great deal of additional labor, fertilizer use may also increase demand for planting, weeding, and harvest labor. If the additional labor is substantial, it should be quantified and t he costs added to the costs of using fertilizer. 2.3.2. Input prices Prices used by FAO/SFI reflect the price situation at a specific point in time (late 1999) and a system of pan-territorial pricing that does not reflect the true costs of transport to zones that are far from Kigali. FSRP prices are estimates for May 1999 rather than actual import costs encountered toward the end of 1999, but use a variety of sources that permitted two input price scenarios: a low -cost scenario using lowest estimates of both fertilizer and transport costs and a high-cost scenario using the highest cost estimates. In general, even the low -cost scenario for FSRP proved to be more expensive than the FAO/SFI price estimates. Given the differences in the input prices used, FAO results – all else equal – are likely to be more profitable than FSRP results. This effect is more pronounced for zones further from Kigali where the benefits of the pan-territorial pricing policies are greater. 2.3.3. Output prices The key difference in output prices is similar to that of input prices. The FSRP analysis uses several price scenario while the FAO/SFI analysis uses prices at a single point in time. That point in time - September/October 1999 - represents a time of year when prices for many crops tend to be low. Hence, the impact – all else equal – is to make FAO/SFI v/c ratios lower than they would be using average annual prices. Using 1999 prices appears to be a reasonable choice as a review of post war price trends (real prices using December 1998 as a base) suggests that the post-war price volatility was finally diminishing: after two years of very low prices (1995-1996) followed by two years of unusually high prices (1997-1998), prices seem to have settled about mid-way between the two extremes and remained relatively stable up through September 1999. This is illustrated in Figure 2 (p.12), using the case of maize prices as an example. FSRP analysis uses average real monthly prices calculated across all the post-war years. Two scenarios were examined. A high-price scenario using the average price for the 3-4 months of the year where there are shortages versus a low -price scenario assuming the farmer sells at or shortly after harvest time. When calculating v/c ratios, input and output prices were combined to produce an optimistic and a pessimistic scenario: the optimistic one uses high output prices and low fertilizer and transport prices while the pessimistic one uses low output prices and high fertilizer and transport prices. In this synthesis we have reported only the midpoint value between the
12
optimistic and pessimistic v/c ratio estimates for simplicity, but the full FSRP report shows the range of outcomes.
1998 1997
1999
19961995
Figure 2. Real Price Trends for Maize: 1995-1999
13
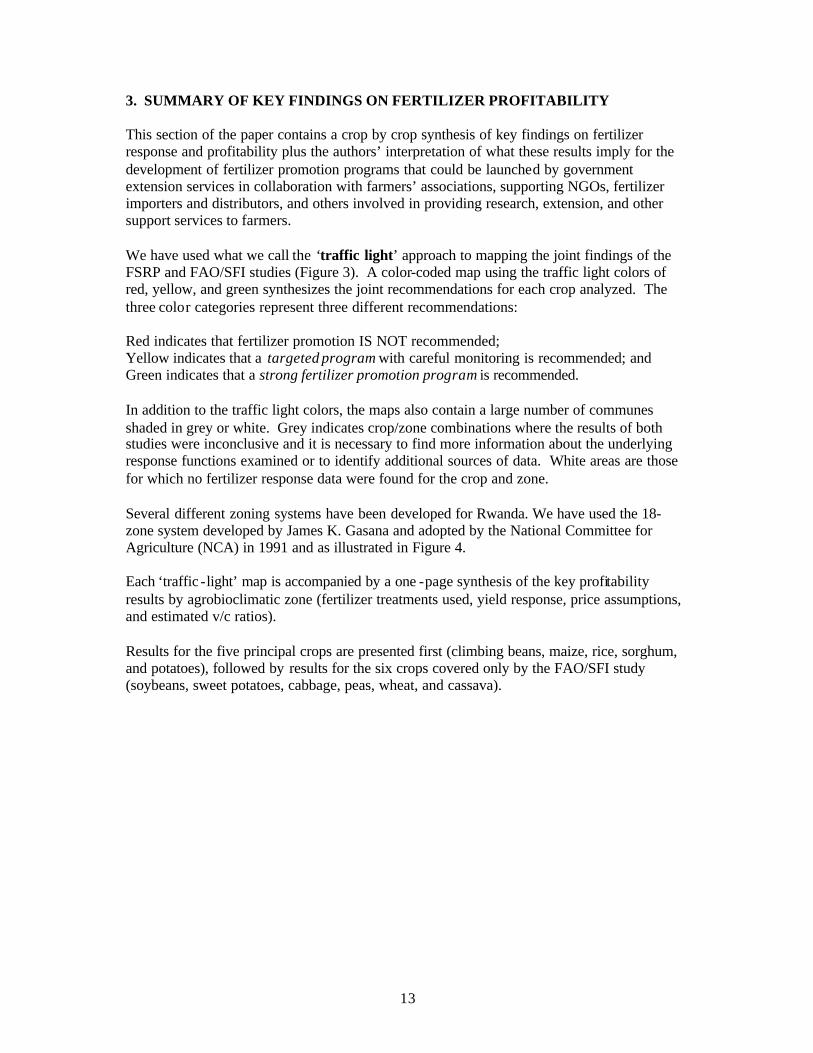
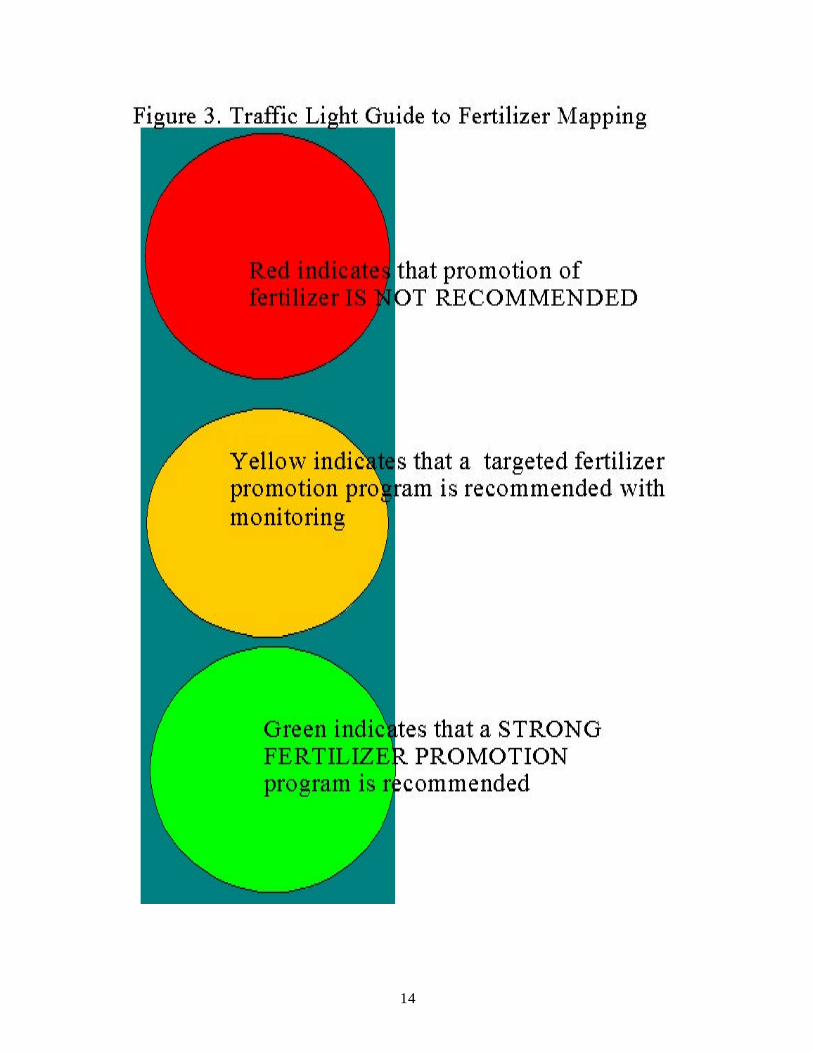
3. SUMMARY OF KEY FINDINGS ON FERTILIZER PROFITABILITY This section of the paper contains a crop by crop synthesis of key findings on fertilizer response and profitability plus the authors’ interpretation of what these results imply for the development of fertilizer promotion programs that could be launched by government extension services in collaboration with farmers’ associations, supporting NGOs, fertilizer importers and distributors, and others involved in providing research, extension, and other support services to farmers. We have used what we call the ‘traffic light’ approach to mapping the joint findings of the FSRP and FAO/SFI studies (Figure 3). A color-coded map using the traffic light colors of red, yellow, and green synthesizes the joint recommendations for each crop analyzed. The three color categories represent three different recommendations: Red indicates that fertilizer promotion IS NOT recommended; Yellow indicates that a targeted program with careful monitoring is recommended; and Green indicates that a strong fertilizer promotion program is recommended. In addition to the traffic light colors, the maps also contain a large number of communes shaded in grey or white. Grey indicates crop/zone combinations where the results of both studies were inconclusive and it is necessary to find more information about the underlying response functions examined or to identify additional sources of data. White areas are those for which no fertilizer response data were found for the crop and zone. Several different zoning systems have been developed for Rwanda. We have used the 18-zone system developed by James K. Gasana and adopted by the National Committee for Agriculture (NCA) in 1991 and as illustrated in Figure 4. Each ‘traffic -light’ map is accompanied by a one -page synthesis of the key profitability results by agrobioclimatic zone (fertilizer treatments used, yield response, price assumptions, and estimated v/c ratios). Results for the five principal crops are presented first (climbing beans, maize, rice, sorghum, and potatoes), followed by results for the six crops covered only by the FAO/SFI study (soybeans, sweet potatoes, cabbage, peas, wheat, and cassava).
14
15
Figure 4: Classification of Agro-Bioclimatic Zones in Rwanda
16
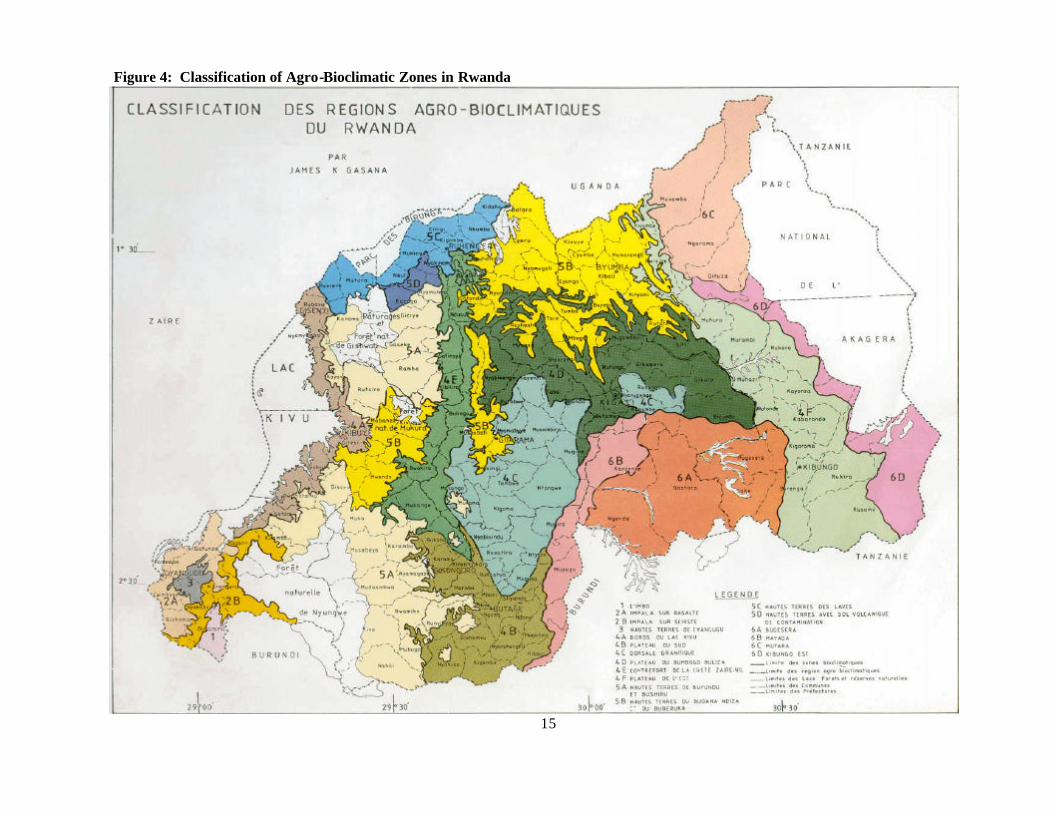
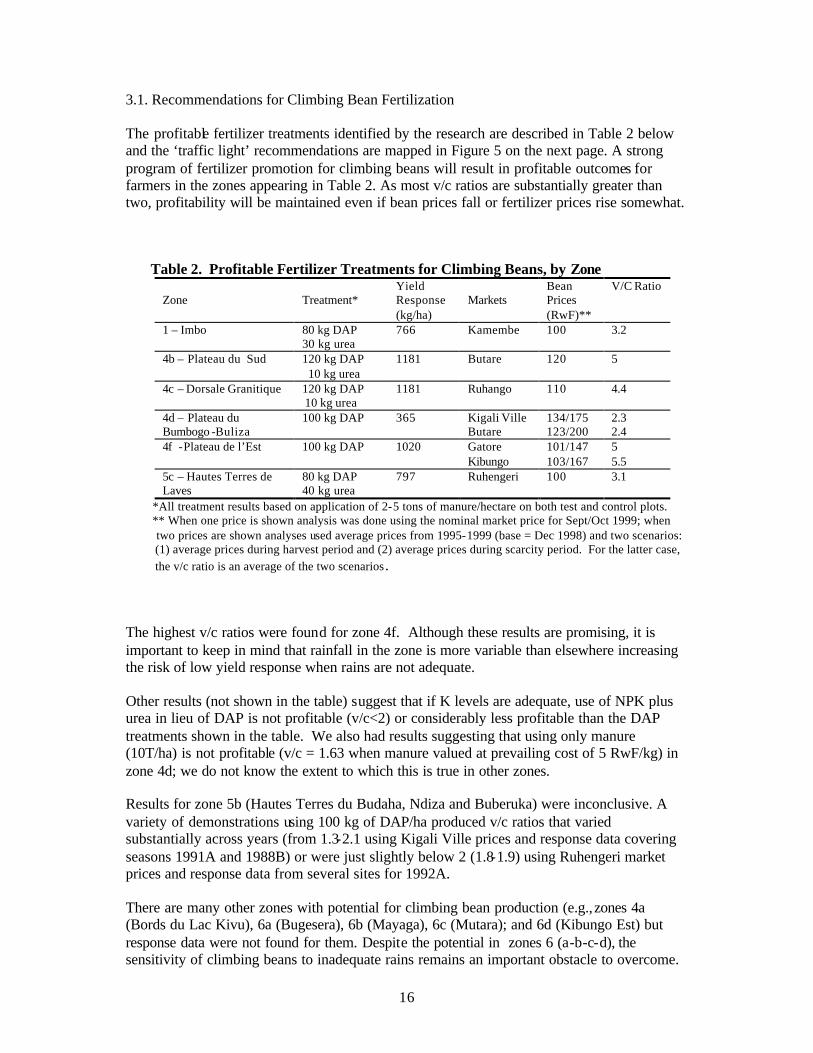
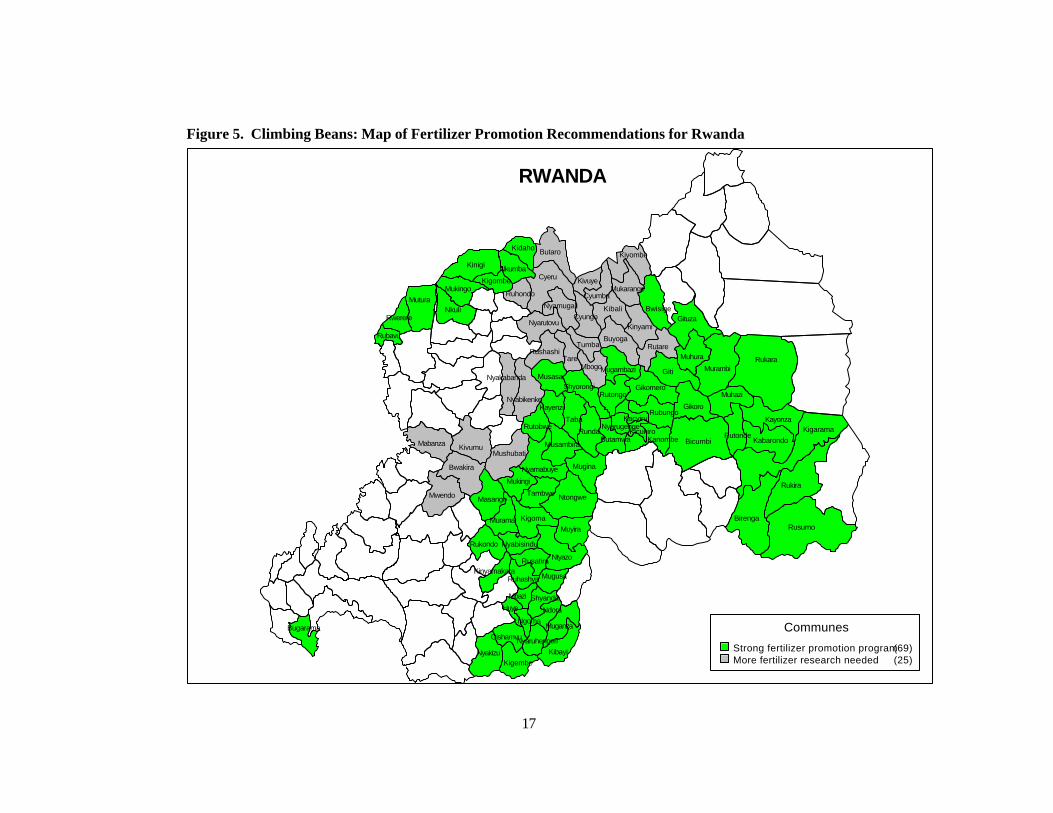
3.1. Recommendations for Climbing Bean Fertilization The profitable fertilizer treatments identified by the research are described in Table 2 below and the ‘traffic light’ recommendations are mapped in Figure 5 on the next page. A strong program of fertilizer promotion for climbing beans will result in profitable outcomes for farmers in the zones appearing in Table 2. As most v/c ratios are substantially greater than two, profitability will be maintained even if bean prices fall or fertilizer prices rise somewhat. The highest v/c ratios were found for zone 4f. Although these results are promising, it is important to keep in mind that rainfall in the zone is more variable than elsewhere increasing the risk of low yield response when rains are not adequate. Other results (not shown in the table) suggest that if K levels are adequate, use of NPK plus urea in lieu of DAP is not profitable (v/c<2) or considerably less profitable than the DAP treatments shown in the table. We also had results suggesting that using only manure (10T/ha) is not profitable (v/c = 1.63 when manure valued at prevailing cost of 5 RwF/kg) in zone 4d; we do not know the extent to which this is true in other zones. Results for zone 5b (Hautes Terres du Budaha, Ndiza and Buberuka) were inconclusive. A variety of demonstrations using 100 kg of DAP/ha produced v/c ratios that varied substantially across years (from 1.3-2.1 using Kigali Ville prices and response data covering seasons 1991A and 1988B) or were just slightly below 2 (1.8-1.9) using Ruhengeri market prices and response data from several sites for 1992A. There are many other zones with potential for climbing bean production (e.g., zones 4a (Bords du Lac Kivu), 6a (Bugesera), 6b (Mayaga), 6c (Mutara); and 6d (Kibungo Est) but response data were not found for them. Despite the potential in zones 6 (a-b-c-d), the sensitivity of climbing beans to inadequate rains remains an important obstacle to overcome.
Table 2. Profitable Fertilizer Treatments for Climbing Beans, by Zone Zone
Treatment*
Yield Response (kg/ha)
Markets
Bean Prices (RwF)**
V/C Ratio
1 – Imbo 80 kg DAP 30 kg urea
766 Kamembe 100 3.2
4b – Plateau du Sud 120 kg DAP 10 kg urea
1181 Butare 120 5
4c – Dorsale Granitique 120 kg DAP 10 kg urea
1181 Ruhango 110 4.4
4d – Plateau du Bumbogo -Buliza
100 kg DAP 365 Kigali Ville Butare
134/175 123/200
2.3 2.4
4f -Plateau de l’Est 100 kg DAP 1020 Gatore Kibungo
101/147 103/167
5 5.5
5c – Hautes Terres de Laves
80 kg DAP 40 kg urea
797 Ruhengeri 100
3.1
*All treatment results based on application of 2-5 tons of manure/hectare on both test and control plots. ** When one price is shown analysis was done using the nominal market price for Sept/Oct 1999; when two prices are shown analyses used average prices from 1995-1999 (base = Dec 1998) and two scenarios: (1) average prices during harvest period and (2) average prices during scarcity period. For the latter case, the v/c ratio is an average of the two scenarios.
17
Figure 5. Climbing Beans: Map of Fertilizer Promotion Recommendations for Rwanda
Kinyamakara
Rukondo
Kinigi
Kidaho
Nkumba
KigombeMukingo
NkuliMutura
Rwerere
Rubavu
Butaro
Cyeru
Ruhondo
Nyamugali
Kivuye
Cyumba
Kiyombe
Mukarange
Kinyami
KibaliCyungo
Nyarutovu
Tumba
TareRushashi
Nyakabanda
Nyabikenke
MusasaShyorongi
Rutongo
Mugambazi Giti
Muhura
GituzaBwisige
MurambiRukara
Muhazi
Gikoro
Gikomero
RubungoKacyiru
Kayenzi
Taba
RundaButamwa
Musambira
Rutobwe
Nyamabuye Mugina
NtongweTambwe
Mukingi
Masango
MushubatiKivumuMabanza
Bwakira
Mwendo
Murama KigomaMuyira
Ntyazo
Nyabisindu
Rusatira
Ruhashya Mugusa
ShyandaMbazi
Huye
NgomaMuganza
Ndora
KibayiNyaruhengeri
KigembeNyakizu
Gishamvu
BicumbiRutonde
Kayonza
KabarondoKigarama
Rukira
BirengaRusumo
RutareBuyoga
Bugarama
Nyarugenge
KanombeKicukiro
Mbogo
RWANDA
Communes
Strong fertilizer promotion program (69)More fertilizer research needed (25)
18
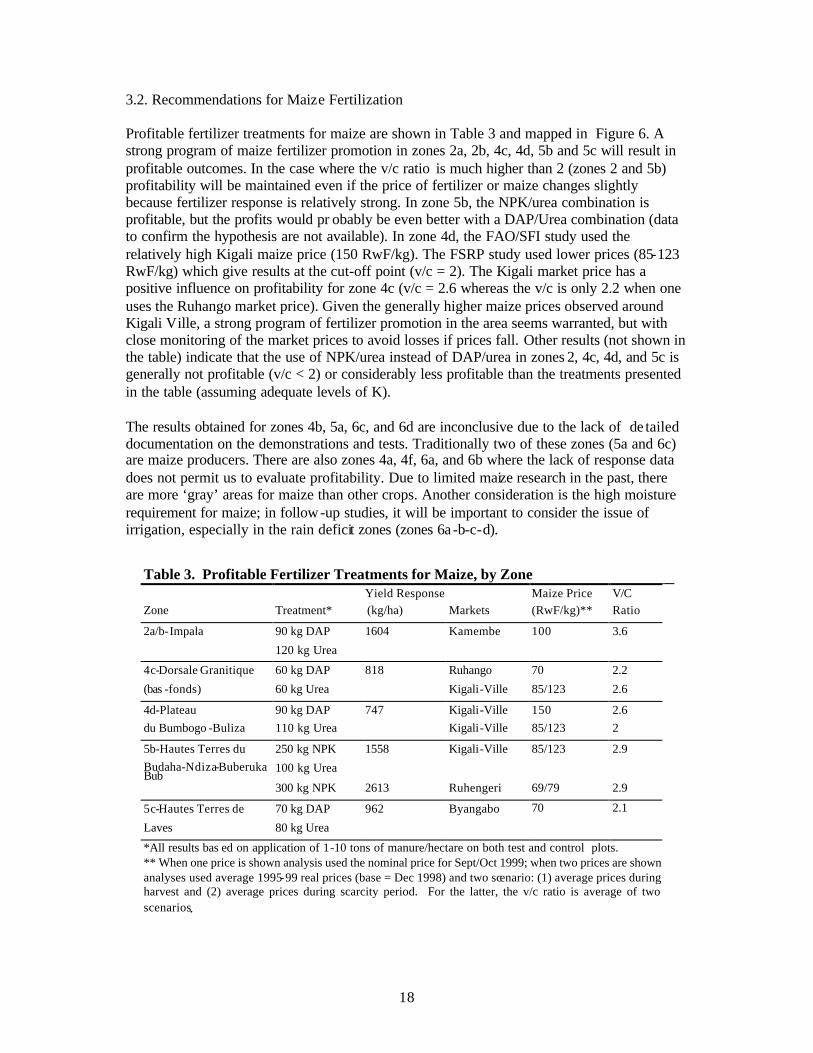
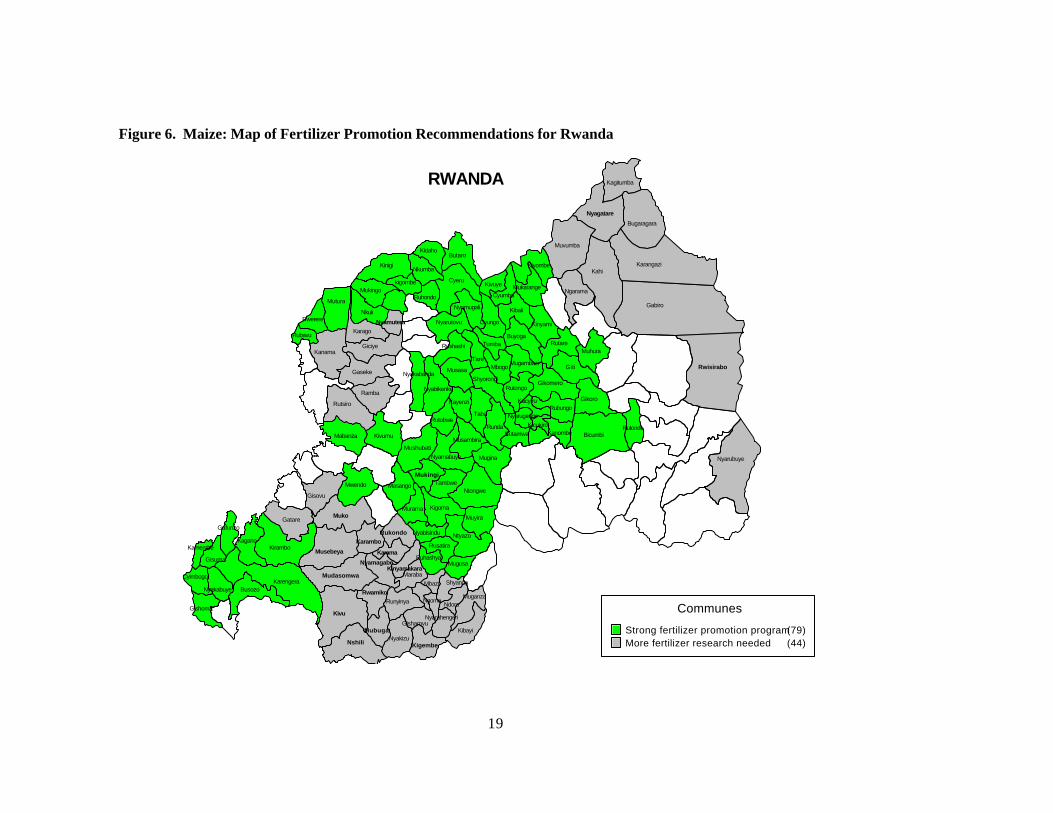
3.2. Recommendations for Maize Fertilization Profitable fertilizer treatments for maize are shown in Table 3 and mapped in Figure 6. A strong program of maize fertilizer promotion in zones 2a, 2b, 4c, 4d, 5b and 5c will result in profitable outcomes. In the case where the v/c ratio is much higher than 2 (zones 2 and 5b) profitability will be maintained even if the price of fertilizer or maize changes slightly because fertilizer response is relatively strong. In zone 5b, the NPK/urea combination is profitable, but the profits would pr obably be even better with a DAP/Urea combination (data to confirm the hypothesis are not available). In zone 4d, the FAO/SFI study used the relatively high Kigali maize price (150 RwF/kg). The FSRP study used lower prices (85-123 RwF/kg) which give results at the cut-off point (v/c = 2). The Kigali market price has a positive influence on profitability for zone 4c (v/c = 2.6 whereas the v/c is only 2.2 when one uses the Ruhango market price). Given the generally higher maize prices observed around Kigali Ville, a strong program of fertilizer promotion in the area seems warranted, but with close monitoring of the market prices to avoid losses if prices fall. Other results (not shown in the table) indicate that the use of NPK/urea instead of DAP/urea in zones 2, 4c, 4d, and 5c is generally not profitable (v/c < 2) or considerably less profitable than the treatments presented in the table (assuming adequate levels of K). The results obtained for zones 4b, 5a, 6c, and 6d are inconclusive due to the lack of de tailed documentation on the demonstrations and tests. Traditionally two of these zones (5a and 6c) are maize producers. There are also zones 4a, 4f, 6a, and 6b where the lack of response data does not permit us to evaluate profitability. Due to limited maize research in the past, there are more ‘gray’ areas for maize than other crops. Another consideration is the high moisture requirement for maize; in follow-up studies, it will be important to consider the issue of irrigation, especially in the rain deficit zones (zones 6a -b-c-d).
Table 3. Profitable Fertilizer Treatments for Maize, by Zone
Yield Response
Maize Price
V/C
Zone Treatment*
(kg/ha)
Markets
(RwF/kg)**
Ratio
2a/b-Impala
90 kg DAP
1604
Kamembe
100
3.6
120 kg Urea
4c-Dorsale Granitique
60 kg DAP
818
Ruhango
70
2.2
(bas -fonds) 60 kg Urea
Kigali-Ville
85/123
2.6
4d-Plateau
90 kg DAP
747
Kigali-Ville
150
2.6
du Bumbogo -Buliza 110 kg Urea
Kigali-Ville
85/123
2
5b-Hautes Terres du
250 kg NPK
1558
Kigali-Ville
85/123
2.9
Budaha-Ndiza-Buberuka 100 kg Urea
Bub
300 kg NPK
2613
Ruhengeri
69/79
2.9
5c-Hautes Terres de
70 kg DAP
962
Byangabo 70 2.1
Laves
80 kg Urea
*All results bas ed on application of 1-10 tons of manure/hectare on both test and control plots. ** When one price is shown analysis used the nominal price for Sept/Oct 1999; when two prices are shown analyses used average 1995-99 real prices (base = Dec 1998) and two scenario: (1) average prices during harvest and (2) average prices during scarcity period. For the latter, the v/c ratio is average of two scenarios.
19
Figure 6. Maize: Map of Fertilizer Promotion Recommendations for Rwanda
Kigembe
Nyamutera
Mukingi
RWANDA
KidahoButaro
KinigiNkumba
kigombeMukingo
Nkuli
Mutura
Rwerere
Rubavu
Kanama
Karago
Muvumba
Kagitumba
Bugaragara
Karangazi
Gabiro
Kahi
Ngarama
Kiyombe
CyeruKivuye
CyumbaMukarange
Kibali
Kinyami
RutareMuhura
Giti
Gikoro
BicumbiRutonde
Nyarubuye
Rubungo
Gikomero
Buyoga
Cyungo
Nyamugali
Nyarutovu
Rushashi
Tare
Tumba
MbogoMugambazi
Rutongo
Kacyiru
NyarugengeKicukiro
KanombeButamwa
ShyorongiMusasa
Nyabikenke
Nyakabanda
Giciye
Gaseke
Ramba
Rutsiro
Mabanza Kivumu
Mushubati
Rutobwe
Kayenzi
Taba
Runda
Musambira
MuginaNyamabuye
TambweNtongwe
Kigoma
Masango
Murama
Nyabisindu Ntyazo
Muyira
Mugusa
Rusatira
MarabaMbazi Shyanda
Muganza
Kibayi
Nyaruhengeri
Nyakizu
Karengera
KiramboKagano
Gafunzo
Gisuma
Kamembe
Cyimbogo
Nyakabuye
Gishoma
Busozo
Gatare
Gisovu
Mwendo
Ruhondo
Gishamvu
NgomaRunyinya Ndora
Rwisirabo
Muko
Musebeya
KaramboRukondo
Karama
Mudasomwa
Kivu
Rwamiko
Nshili
Mubuga
Ruhashya
KinyamakaraNyamagabe
Nyagatare
Communes
Strong fertilizer promotion program (79)More fertilizer research needed (44)
20
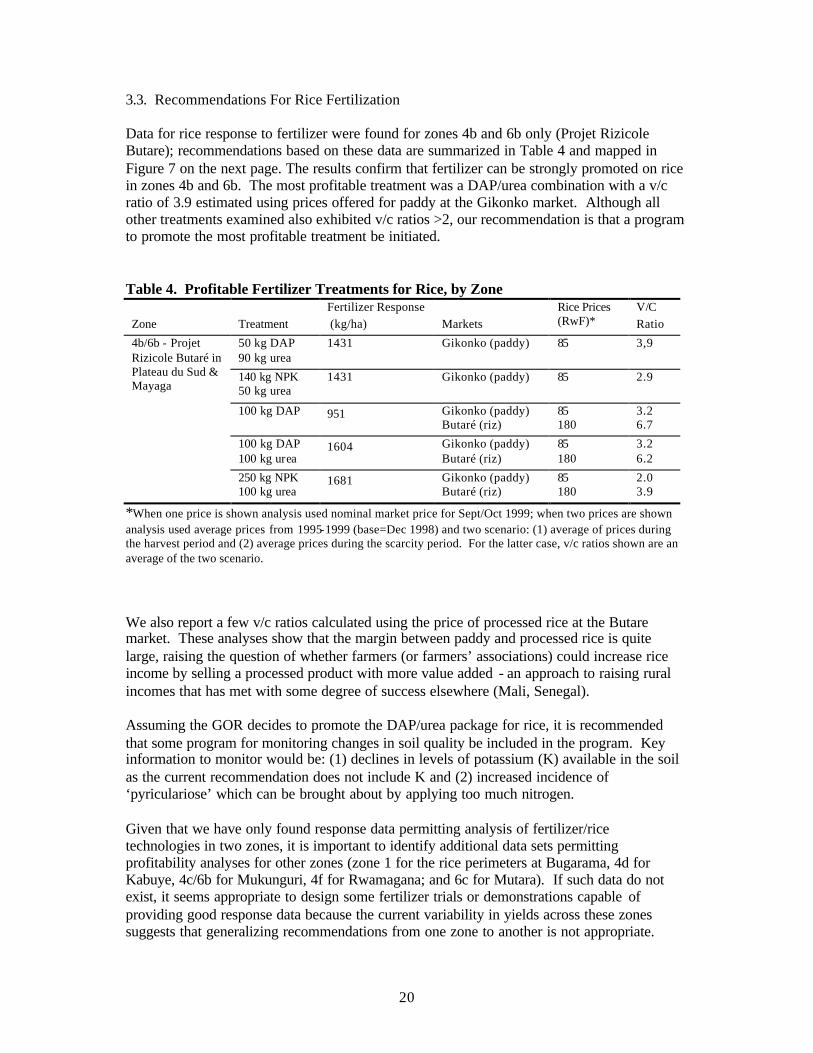
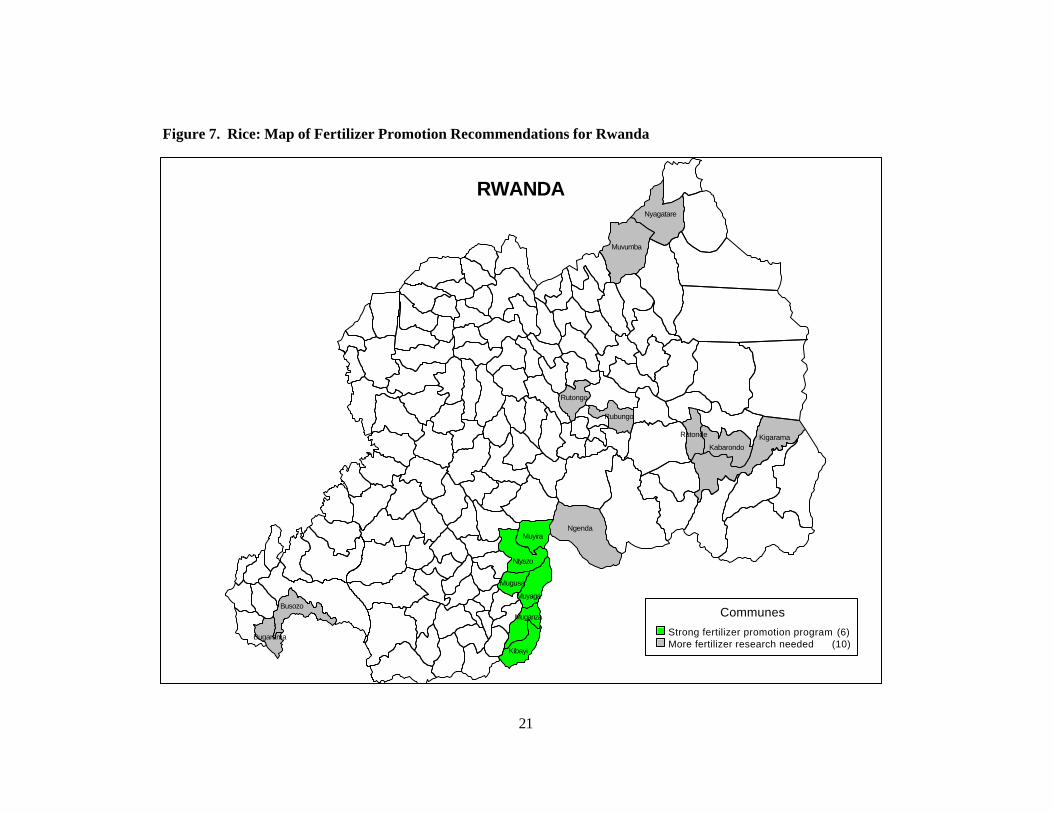
3.3. Recommendations For Rice Fertilization Data for rice response to fertilizer were found for zones 4b and 6b only (Projet Rizicole Butare); recommendations based on these data are summarized in Table 4 and mapped in Figure 7 on the next page. The results confirm that fertilizer can be strongly promoted on rice in zones 4b and 6b. The most profitable treatment was a DAP/urea combination with a v/c ratio of 3.9 estimated using prices offered for paddy at the Gikonko market. Although all other treatments examined also exhibited v/c ratios >2, our recommendation is that a program to promote the most profitable treatment be initiated. Table 4. Profitable Fertilizer Treatments for Rice, by Zone Zone
Treatment
Fertilizer Response (kg/ha)
Markets
Rice Prices (RwF)*
V/C Ratio
50 kg DAP 90 kg urea
1431 Gikonko (paddy)
85 3,9
140 kg NPK 50 kg urea
1431
Gikonko (paddy) 85 2.9
100 kg DAP 951 Gikonko (paddy)
Butaré (riz) 85 180
3.2 6.7
100 kg DAP 100 kg urea
1604 Gikonko (paddy) Butaré (riz)
85 180
3.2 6.2
4b/6b - Projet Rizicole Butaré in Plateau du Sud & Mayaga
250 kg NPK 100 kg urea
1681 Gikonko (paddy) Butaré (riz)
85 180
2.0 3.9
*When one price is shown analysis used nominal market price for Sept/Oct 1999; when two prices are shown analysis used average prices from 1995-1999 (base=Dec 1998) and two scenario: (1) average of prices during the harvest period and (2) average prices during the scarcity period. For the latter case, v/c ratios shown are an average of the two scenario. We also report a few v/c ratios calculated using the price of processed rice at the Butare market. These analyses show that the margin between paddy and processed rice is quite large, raising the question of whether farmers (or farmers’ associations) could increase rice income by selling a processed product with more value added - an approach to raising rural incomes that has met with some degree of success elsewhere (Mali, Senegal). Assuming the GOR decides to promote the DAP/urea package for rice, it is recommended that some program for monitoring changes in soil quality be included in the program. Key information to monitor would be: (1) declines in levels of potassium (K) available in the soil as the current recommendation does not include K and (2) increased incidence of ‘pyriculariose’ which can be brought about by applying too much nitrogen. Given that we have only found response data permitting analysis of fertilizer/rice technologies in two zones, it is important to identify additional data sets permitting profitability analyses for other zones (zone 1 for the rice perimeters at Bugarama, 4d for Kabuye, 4c/6b for Mukunguri, 4f for Rwamagana; and 6c for Mutara). If such data do not exist, it seems appropriate to design some fertilizer trials or demonstrations capable of providing good response data because the current variability in yields across these zones suggests that generalizing recommendations from one zone to another is not appropriate.
21
Figure 7. Rice: Map of Fertilizer Promotion Recommendations for Rwanda
Bugarama
Busozo
Kibayi
Muganza
Muyaga
Mugusa
Ntyazo
MuyiraNgenda
Rutongo
Rubungo
Rutonde
KabarondoKigarama
Muvumba
Nyagatare
RWANDA
Communes
Strong fertilizer promotion program (6)More fertilizer research needed (10)
22
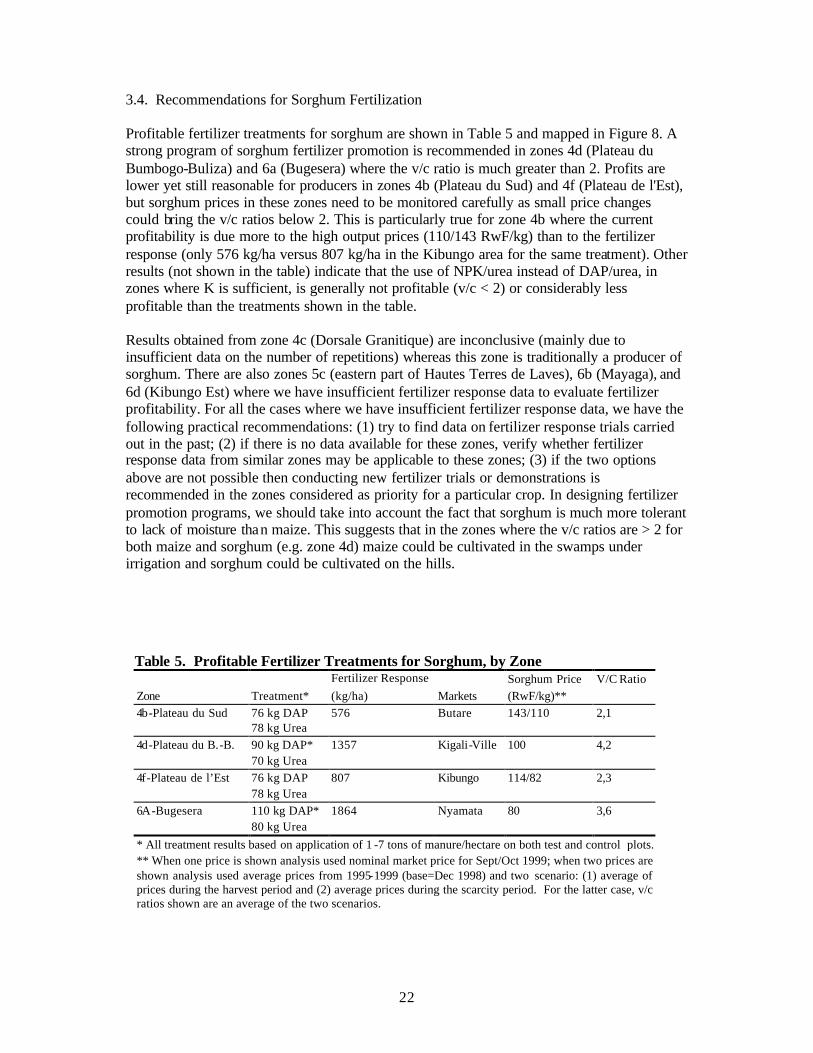
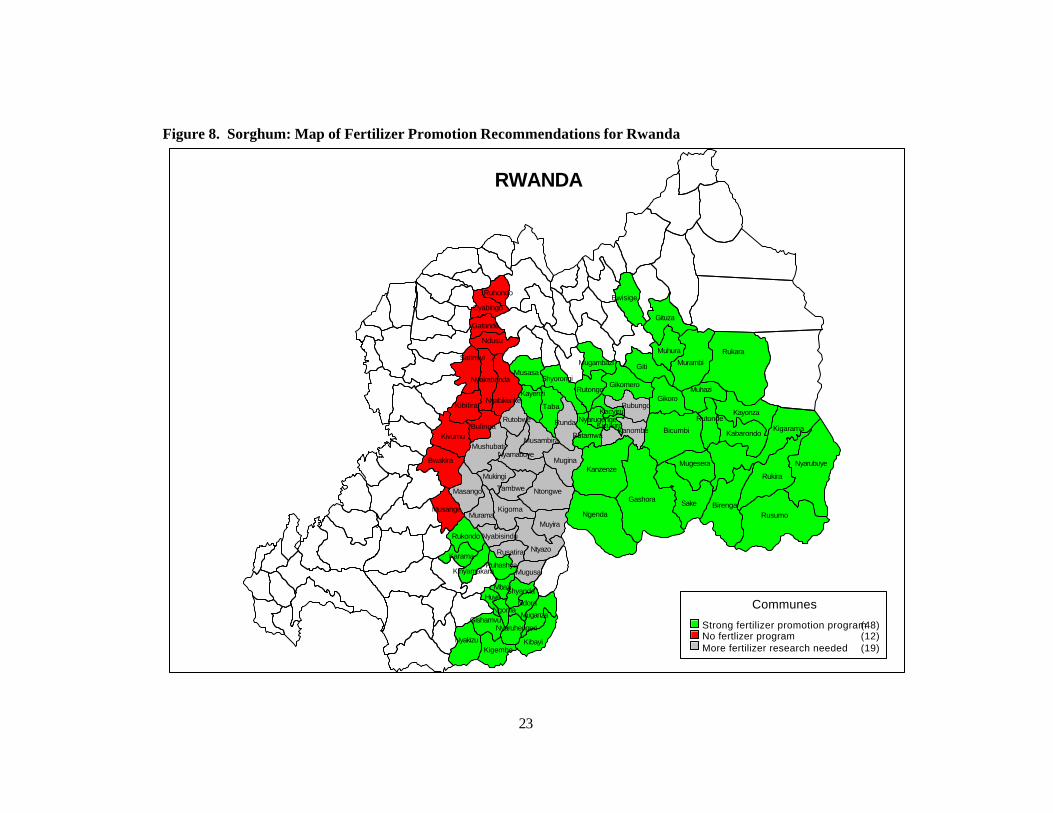
3.4. Recommendations for Sorghum Fertilization Profitable fertilizer treatments for sorghum are shown in Table 5 and mapped in Figure 8. A strong program of sorghum fertilizer promotion is recommended in zones 4d (Plateau du Bumbogo-Buliza) and 6a (Bugesera) where the v/c ratio is much greater than 2. Profits are lower yet still reasonable for producers in zones 4b (Plateau du Sud) and 4f (Plateau de l'Est), but sorghum prices in these zones need to be monitored carefully as small price changes could bring the v/c ratios below 2. This is particularly true for zone 4b where the current profitability is due more to the high output prices (110/143 RwF/kg) than to the fertilizer response (only 576 kg/ha versus 807 kg/ha in the Kibungo area for the same treatment). Other results (not shown in the table) indicate that the use of NPK/urea instead of DAP/urea, in zones where K is sufficient, is generally not profitable (v/c < 2) or considerably less profitable than the treatments shown in the table. Results obtained from zone 4c (Dorsale Granitique) are inconclusive (mainly due to insufficient data on the number of repetitions) whereas this zone is traditionally a producer of sorghum. There are also zones 5c (eastern part of Hautes Terres de Laves), 6b (Mayaga), and 6d (Kibungo Est) where we have insufficient fertilizer response data to evaluate fertilizer profitability. For all the cases where we have insufficient fertilizer response data, we have the following practical recommendations: (1) try to find data on fertilizer response trials carried out in the past; (2) if there is no data available for these zones, verify whether fertilizer response data from similar zones may be applicable to these zones; (3) if the two options above are not possible then conducting new fertilizer trials or demonstrations is recommended in the zones considered as priority for a particular crop. In designing fertilizer promotion programs, we should take into account the fact that sorghum is much more tolerant to lack of moisture than maize. This suggests that in the zones where the v/c ratios are > 2 for both maize and sorghum (e.g. zone 4d) maize could be cultivated in the swamps under irrigation and sorghum could be cultivated on the hills.
Table 5. Profitable Fertilizer Treatments for Sorghum, by Zone
Fertilizer Response
Sorghum Price
V/C Ratio
Zone Treatment*
(kg/ha)
Markets
(RwF/kg)**
4b-Plateau du Sud 76 kg DAP
576
Butare
143/110
2,1
78 kg Urea
4d-Plateau du B.-B. 90 kg DAP*
1357
Kigali-Ville
100
4,2
70 kg Urea
4f-Plateau de l’Est 76 kg DAP
807
Kibungo
114/82
2,3
78 kg Urea
6A-Bugesera 110 kg DAP*
1864
Nyamata
80
3,6
80 kg Urea
* All treatment results based on application of 1 -7 tons of manure/hectare on both test and control plots. ** When one price is shown analysis used nominal market price for Sept/Oct 1999; when two prices are shown analysis used average prices from 1995-1999 (base=Dec 1998) and two scenario: (1) average of prices during the harvest period and (2) average prices during the scarcity period. For the latter case, v/c ratios shown are an average of the two scenarios.
23
Figure 8. Sorghum: Map of Fertilizer Promotion Recommendations for Rwanda
Ruhondo
Gishamvu
NyakizuKigembe
Kibayi
Nyaruhengeri
Muganza
NdoraNgoma
HuyeShyandaMbazi
Kinyamakara
Karama
Rukondo
RuhashyaMugusa
Rusatira
Muyira
Ntyazo
Nyabisindu
MuramaKigoma
NtongweTambwe
Mukingi
Mushubati
Masango
Musange
Bwakira
Kivumu
Kibilira
BulingaRutobwe
Nyamabuye
Musambira
Mugina
Sake
Mugesera
RusumoBirenga
Rukira
Nyarubuye
KigaramaRutonde
Kabarondo
Kayonza
MuhaziGikoro
Bicumbi
Ngenda
Gashora
Kanzenze
Kicukiro
Kacyiru
Kanombe
Rubungo
Nyarugenge
Butamwa
Runda
Taba
Gikomero
Giti
RukaraMurambi
Muhura
Gituza
Bwisige
Mugambazi
RutongoShyorongi
Kayenzi
MusasaNyakabanda
Nyabikenke
Satinsyi
Ndusu
Gatonde
Cyabingo
RWANDA
Communes
Strong fertilizer promotion program (48)No fertlizer program (12)More fertilizer research needed (19)
24
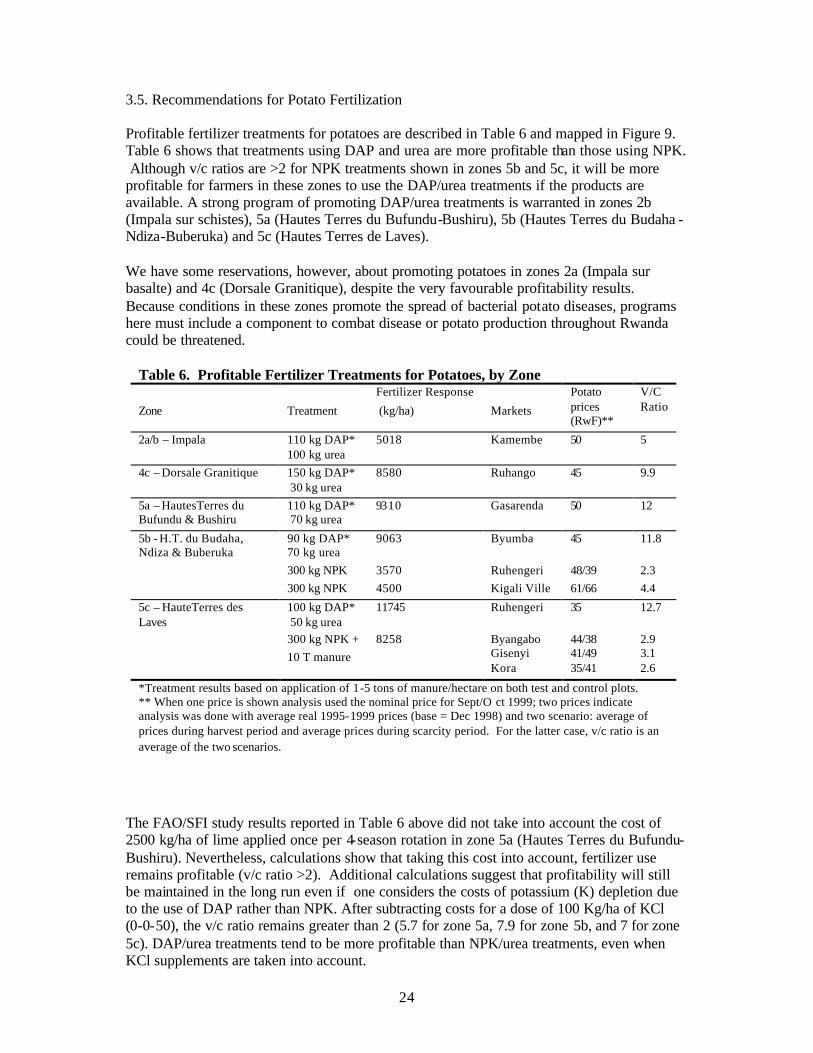
3.5. Recommendations for Potato Fertilization Profitable fertilizer treatments for potatoes are described in Table 6 and mapped in Figure 9. Table 6 shows that treatments using DAP and urea are more profitable than those using NPK. Although v/c ratios are >2 for NPK treatments shown in zones 5b and 5c, it will be more profitable for farmers in these zones to use the DAP/urea treatments if the products are available. A strong program of promoting DAP/urea treatments is warranted in zones 2b (Impala sur schistes), 5a (Hautes Terres du Bufundu-Bushiru), 5b (Hautes Terres du Budaha -Ndiza-Buberuka) and 5c (Hautes Terres de Laves). We have some reservations, however, about promoting potatoes in zones 2a (Impala sur basalte) and 4c (Dorsale Granitique), despite the very favourable profitability results. Because conditions in these zones promote the spread of bacterial potato diseases, programs here must include a component to combat disease or potato production throughout Rwanda could be threatened.
The FAO/SFI study results reported in Table 6 above did not take into account the cost of 2500 kg/ha of lime applied once per 4-season rotation in zone 5a (Hautes Terres du Bufundu-Bushiru). Nevertheless, calculations show that taking this cost into account, fertilizer use remains profitable (v/c ratio >2). Additional calculations suggest that profitability will still be maintained in the long run even if one considers the costs of potassium (K) depletion due to the use of DAP rather than NPK. After subtracting costs for a dose of 100 Kg/ha of KCl (0-0-50), the v/c ratio remains greater than 2 (5.7 for zone 5a, 7.9 for zone 5b, and 7 for zone 5c). DAP/urea treatments tend to be more profitable than NPK/urea treatments, even when KCl supplements are taken into account.
Table 6. Profitable Fertilizer Treatments for Potatoes, by Zone
Zone
Treatment
Fertilizer Response
(kg/ha)
Markets
Potato prices (RwF)**
V/C Ratio
2a/b – Impala 110 kg DAP* 100 kg urea
5018 Kamembe 50 5
4c – Dorsale Granitique 150 kg DAP* 30 kg urea
8580 Ruhango 45 9.9
5a – HautesTerres du Bufundu & Bushiru
110 kg DAP* 70 kg urea
9310 Gasarenda 50 12
5b - H.T. du Budaha, Ndiza & Buberuka
90 kg DAP* 70 kg urea
9063 Byumba 45 11.8
300 kg NPK 3570 Ruhengeri 48/39 2.3 300 kg NPK 4500 Kigali Ville 61/66 4.4
5c – HauteTerres des Laves
100 kg DAP* 50 kg urea
11745 Ruhengeri 35 12.7
300 kg NPK + 10 T manure
8258 Byangabo Gisenyi Kora
44/38 41/49 35/41
2.9 3.1 2.6
*Treatment results based on application of 1-5 tons of manure/hectare on both test and control plots. ** When one price is shown analysis used the nominal price for Sept/O ct 1999; two prices indicate analysis was done with average real 1995-1999 prices (base = Dec 1998) and two scenario: average of prices during harvest period and average prices during scarcity period. For the latter case, v/c ratio is an average of the two scenarios.
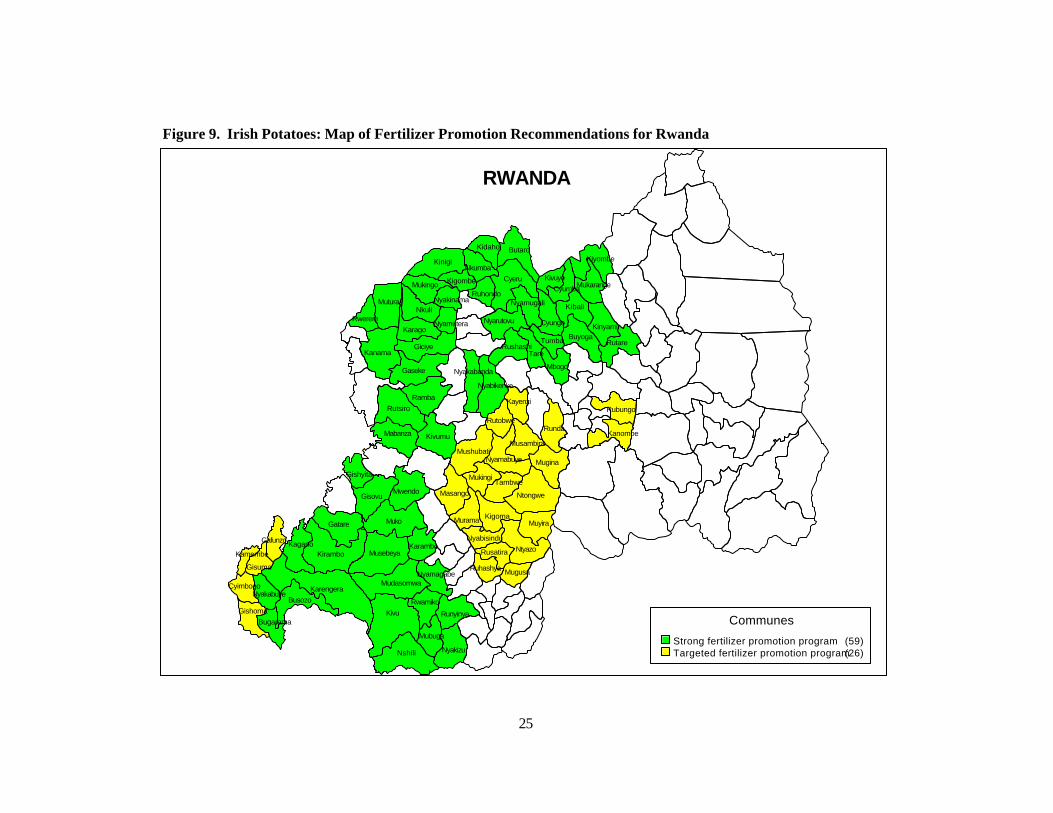
25
Figure 9. Irish Potatoes: Map of Fertilizer Promotion Recommendations for Rwanda
MugusaRuhashya
Nyabisindu
Rusatira Ntyazo
MuyiraMurama Kigoma
Tambwe
Ntongwe
Mugina
Runda
Rubungo
KanombeMusambira
Nyamabuye
Mukingi
Masango
Mushubati
Rutobwe
Kayenzi
Gafunzo
Kamembe
Gisuma
Cyimbogo
GishomaBugarama
NyakabuyeBusozo
Kivu
Nshili Nyakizu
Mubuga
Runyinya
Rwamiko
NyamagabeMudasomwa
KaramboMusebeya
Karengera
KaganoKirambo
Gatare Muko
MwendoGisovu
Gishyita
KivumuMabanza
RutsiroRamba
GiciyeKanama
Gaseke Nyakabanda
Nyabikenke
Tare
Mbogo
TumbaRushashi
Nyarutovu
RuhondoNyakinama
NyamuteraKarago
NkuliRwerere
Mutura
Mukingo Kigombe
KinigiNkumba
Kidaho
Nyamugali
Cyungo
BuyogaRutare
Kinyami
Kibali
Cyeru KivuyeCyumbaMukarange
KiyombeButaro
RWANDA
Communes
Strong fertilizer promotion program (59)Targeted fertilizer promotion program (26)
26
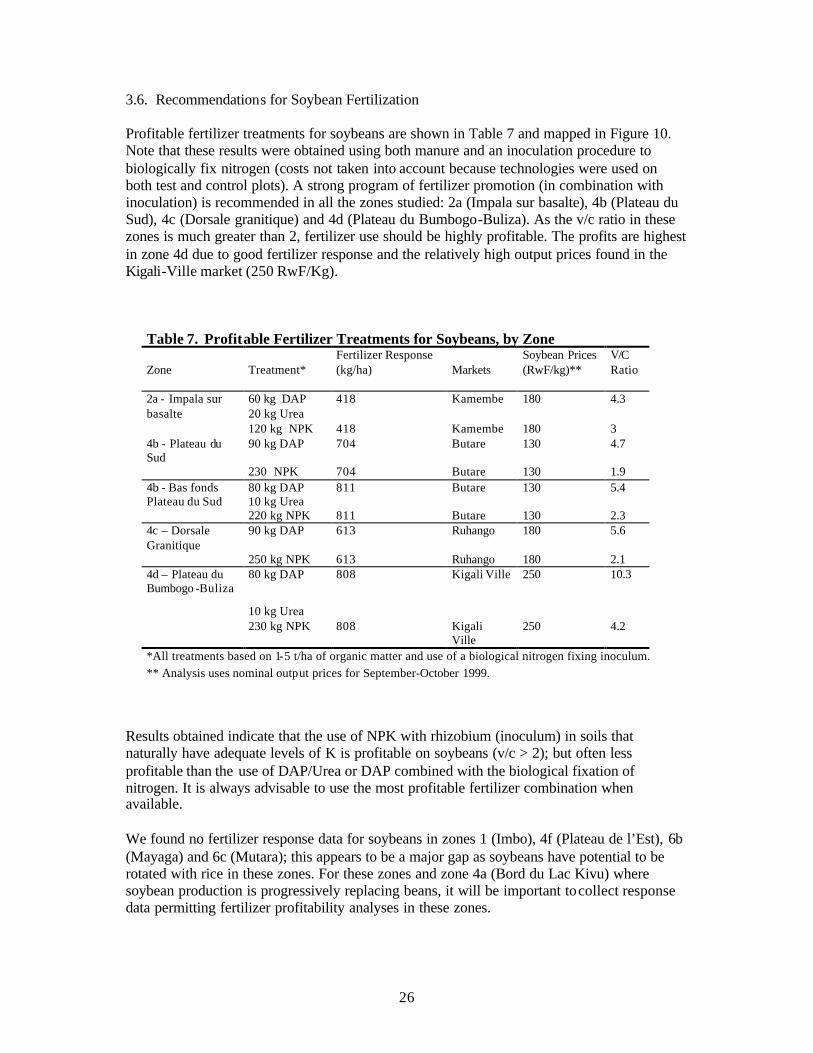
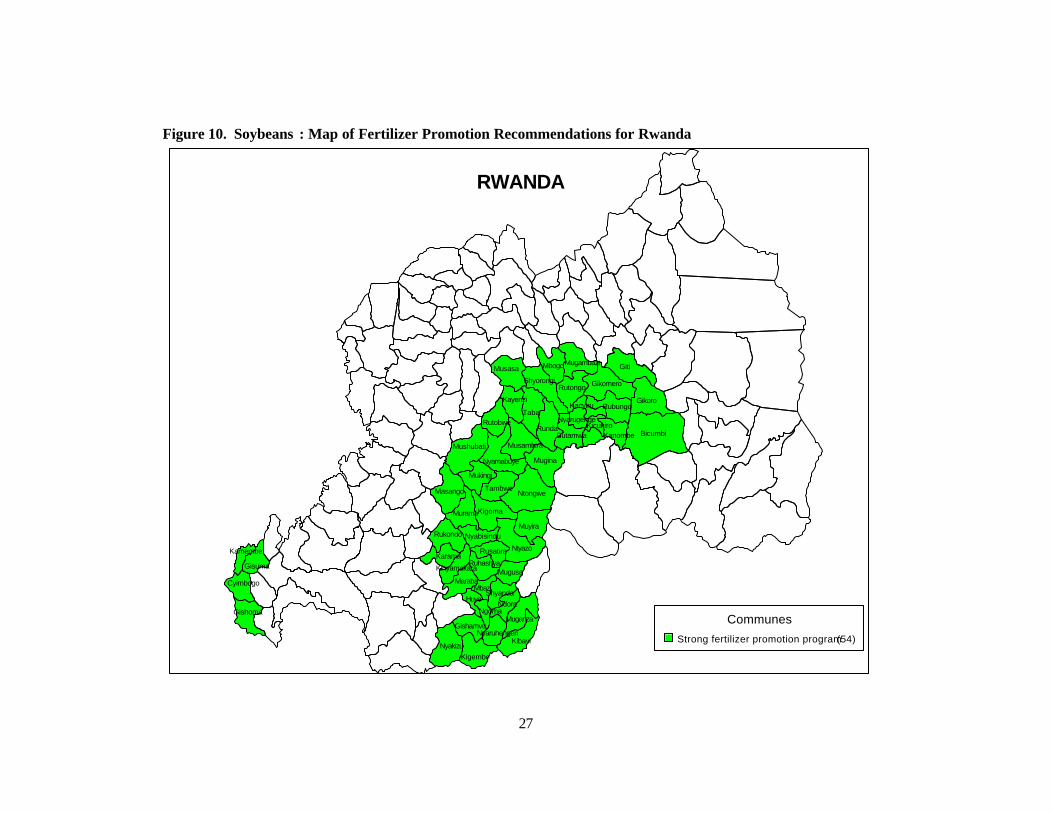
3.6. Recommendations for Soybean Fertilization Profitable fertilizer treatments for soybeans are shown in Table 7 and mapped in Figure 10. Note that these results were obtained using both manure and an inoculation procedure to biologically fix nitrogen (costs not taken into account because technologies were used on both test and control plots). A strong program of fertilizer promotion (in combination with inoculation) is recommended in all the zones studied: 2a (Impala sur basalte), 4b (Plateau du Sud), 4c (Dorsale granitique) and 4d (Plateau du Bumbogo-Buliza). As the v/c ratio in these zones is much greater than 2, fertilizer use should be highly profitable. The profits are highest in zone 4d due to good fertilizer response and the relatively high output prices found in the Kigali-Ville market (250 RwF/Kg). Results obtained indicate that the use of NPK with rhizobium (inoculum) in soils that naturally have adequate levels of K is profitable on soybeans (v/c > 2); but often less profitable than the use of DAP/Urea or DAP combined with the biological fixation of nitrogen. It is always advisable to use the most profitable fertilizer combination when available. We found no fertilizer response data for soybeans in zones 1 (Imbo), 4f (Plateau de l’Est), 6b (Mayaga) and 6c (Mutara); this appears to be a major gap as soybeans have potential to be rotated with rice in these zones. For these zones and zone 4a (Bord du Lac Kivu) where soybean production is progressively replacing beans, it will be important to collect response data permitting fertilizer profitability analyses in these zones.
Table 7. Profitable Fertilizer Treatments for Soybeans, by Zone Zone
Treatment*
Fertilizer Response (kg/ha)
Markets
Soybean Prices (RwF/kg)**
V/C Ratio
2a - Impala sur basalte
60 kg DAP 20 kg Urea
418 Kamembe 180 4.3
120 kg NPK 418 Kamembe 180 3 4b - Plateau du Sud
90 kg DAP 704 Butare 130 4.7
230 NPK 704 Butare 130 1.9 4b - Bas fonds Plateau du Sud
80 kg DAP 10 kg Urea
811 Butare 130 5.4
220 kg NPK 811 Butare 130 2.3 4c – Dorsale Granitique
90 kg DAP 613 Ruhango 180 5.6
250 kg NPK 613 Ruhango 180 2.1 4d – Plateau du Bumbogo -Buliza
80 kg DAP 808 Kigali Ville 250 10.3
10 kg Urea 230 kg NPK 808 Kigali
Ville 250 4.2
*All treatments based on 1-5 t/ha of organic matter and use of a biological nitrogen fixing inoculum. ** Analysis uses nominal output prices for September-October 1999.
27
Figure 10. Soybeans : Map of Fertilizer Promotion Recommendations for Rwanda
Giti
Gikoro
Bicumbi
MugambaziMbogo
Rutongo Gikomero
Musasa
Shyorongi
Kayenzi
Taba
RundaButamwa
Nyarugenge
Kacyiru Rubungo
KicukiroKanombe
Mugina
Musambira
Rutobwe
Mushubati
Nyamabuye
Mukingi
Masango TambweNtongwe
KigomaMurama
Rukondo Nyabisindu
Ntyazo
Muyira
RusatiraKarama
KinyamakaraRuhashya
Mugusa
MbaziMaraba
ShyandaNdora
Muganza
KibayiNyaruhengeri
Ngoma
Huye
Gishamvu
NyakizuKigembe
Gisuma
Kamembe
Cyimbogo
Gishoma
RWANDA
Communes
Strong fertilizer promotion program (54)
28
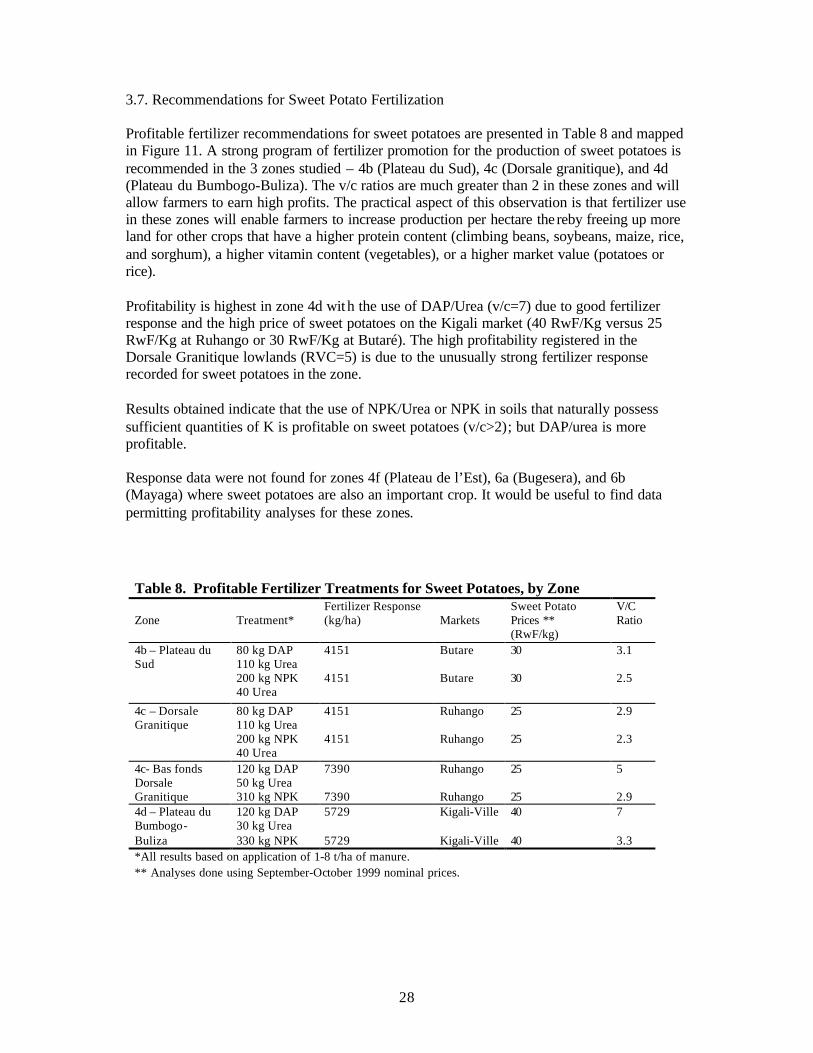
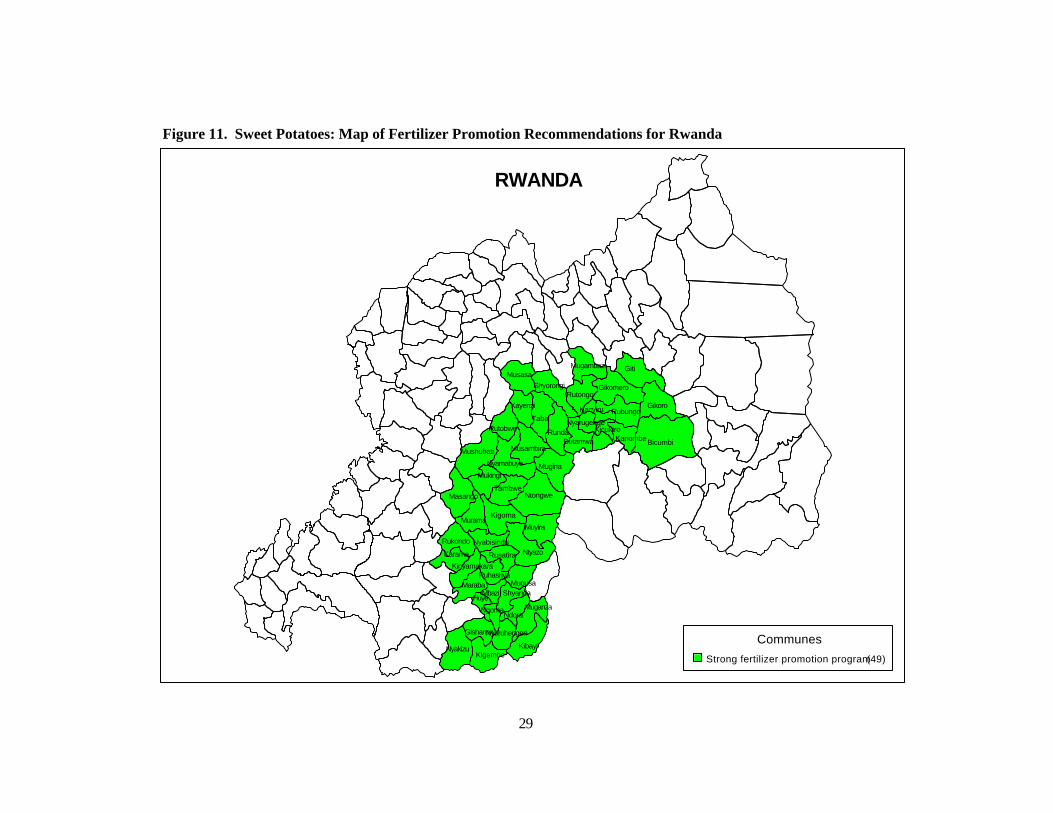
3.7. Recommendations for Sweet Potato Fertilization Profitable fertilizer recommendations for sweet potatoes are presented in Table 8 and mapped in Figure 11. A strong program of fertilizer promotion for the production of sweet potatoes is recommended in the 3 zones studied – 4b (Plateau du Sud), 4c (Dorsale granitique), and 4d (Plateau du Bumbogo-Buliza). The v/c ratios are much greater than 2 in these zones and will allow farmers to earn high profits. The practical aspect of this observation is that fertilizer use in these zones will enable farmers to increase production per hectare the reby freeing up more land for other crops that have a higher protein content (climbing beans, soybeans, maize, rice, and sorghum), a higher vitamin content (vegetables), or a higher market value (potatoes or rice). Profitability is highest in zone 4d with the use of DAP/Urea (v/c=7) due to good fertilizer response and the high price of sweet potatoes on the Kigali market (40 RwF/Kg versus 25 RwF/Kg at Ruhango or 30 RwF/Kg at Butaré). The high profitability registered in the Dorsale Granitique lowlands (RVC=5) is due to the unusually strong fertilizer response recorded for sweet potatoes in the zone. Results obtained indicate that the use of NPK/Urea or NPK in soils that naturally possess sufficient quantities of K is profitable on sweet potatoes (v/c>2); but DAP/urea is more profitable. Response data were not found for zones 4f (Plateau de l’Est), 6a (Bugesera), and 6b (Mayaga) where sweet potatoes are also an important crop. It would be useful to find data permitting profitability analyses for these zones.
Table 8. Profitable Fertilizer Treatments for Sweet Potatoes, by Zone Zone
Treatment*
Fertilizer Response (kg/ha)
Markets
Sweet Potato Prices ** (RwF/kg)
V/C Ratio
4b – Plateau du 80 kg DAP 4151 Butare 30 3.1 Sud 110 kg Urea 200 kg NPK 4151 Butare 30 2.5 40 Urea
4c – Dorsale 80 kg DAP 4151 Ruhango 25 2.9 Granitique 110 kg Urea 200 kg NPK 4151 Ruhango 25 2.3 40 Urea 4c- Bas fonds 120 kg DAP 7390 Ruhango 25 5 Dorsale 50 kg Urea Granitique 310 kg NPK 7390 Ruhango 25 2.9 4d – Plateau du 120 kg DAP 5729 Kigali-Ville 40 7 Bumbogo- 30 kg Urea Buliza 330 kg NPK 5729 Kigali-Ville 40 3.3 *All results based on application of 1-8 t/ha of manure. ** Analyses done using September-October 1999 nominal prices.
29
Figure 11. Sweet Potatoes: Map of Fertilizer Promotion Recommendations for Rwanda
NyakizuKigembe
Kibayi
Muganza
NyaruhengeriGishamvu
Huye
NgomaNdora
ShyandaMaraba
MbaziMugusa
Ruhashya
Karama
KinyamakaraRusatira
Muyira
NtyazoNyabisinduRukondo
MuramaKigoma
Masango
Mukingi
TambweNtongwe
Mugina
Musambira
Nyamabuye
Mushubati
RutobweKanombe
Kicukiro
RubungoKacyiru
Nyarugenge
ButamwaRunda
Taba
Kayenzi
MusasaShyorongi
Rutongo
Mugambazi
Gikomero
Bicumbi
Gikoro
Giti
RWANDA
Communes
Strong fertilizer promotion program (49)
30
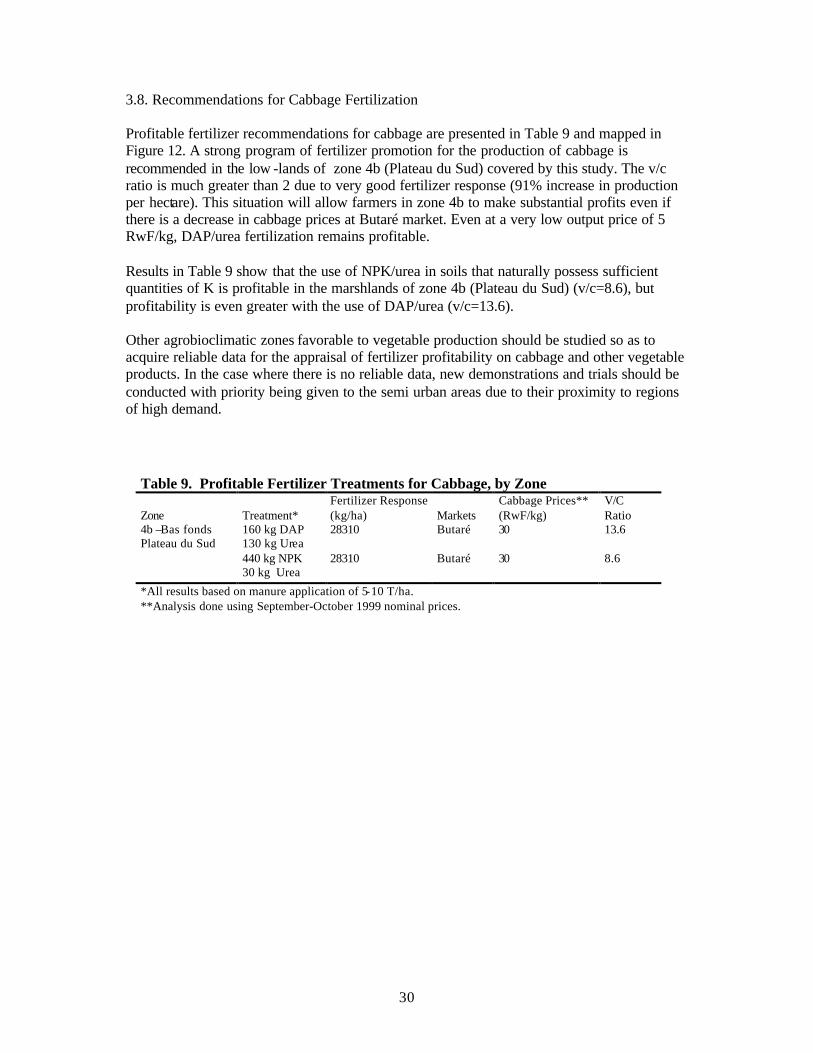
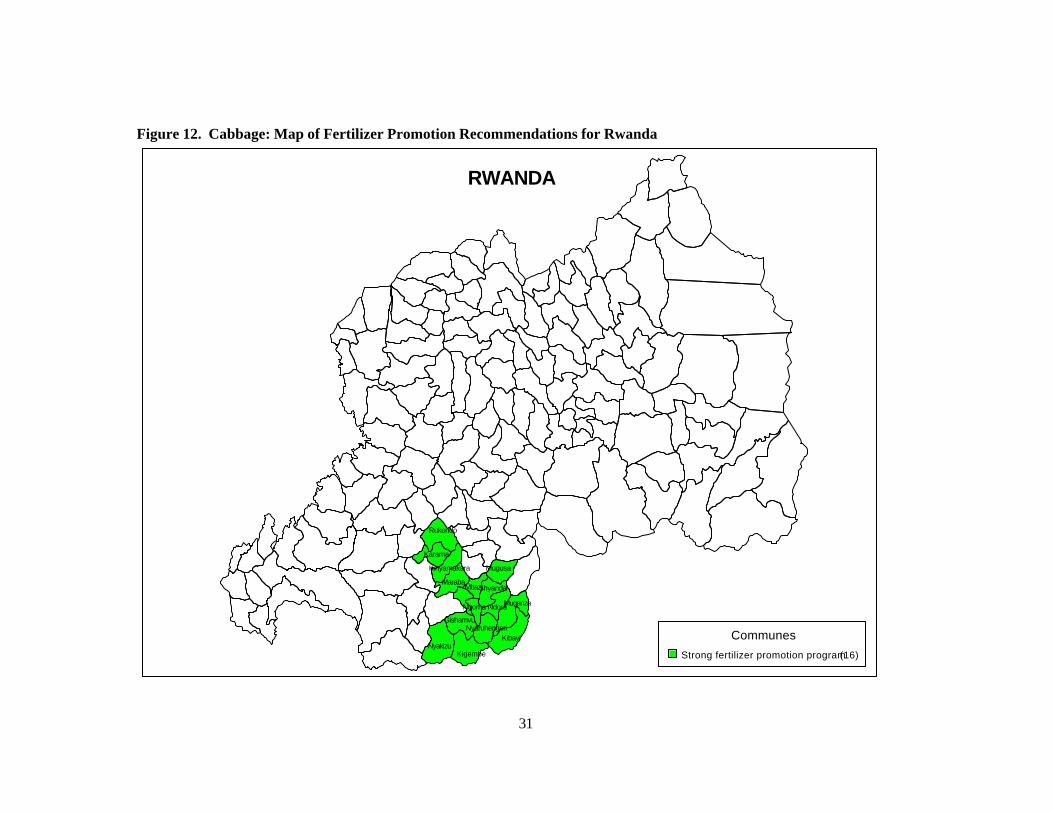
3.8. Recommendations for Cabbage Fertilization Profitable fertilizer recommendations for cabbage are presented in Table 9 and mapped in Figure 12. A strong program of fertilizer promotion for the production of cabbage is recommended in the low -lands of zone 4b (Plateau du Sud) covered by this study. The v/c ratio is much greater than 2 due to very good fertilizer response (91% increase in production per hectare). This situation will allow farmers in zone 4b to make substantial profits even if there is a decrease in cabbage prices at Butaré market. Even at a very low output price of 5 RwF/kg, DAP/urea fertilization remains profitable. Results in Table 9 show that the use of NPK/urea in soils that naturally possess sufficient quantities of K is profitable in the marshlands of zone 4b (Plateau du Sud) (v/c=8.6), but profitability is even greater with the use of DAP/urea (v/c=13.6). Other agrobioclimatic zones favorable to vegetable production should be studied so as to acquire reliable data for the appraisal of fertilizer profitability on cabbage and other vegetable products. In the case where there is no reliable data, new demonstrations and trials should be conducted with priority being given to the semi urban areas due to their proximity to regions of high demand.
Table 9. Profitable Fertilizer Treatments for Cabbage, by Zone Zone
Treatment*
Fertilizer Response (kg/ha)
Markets
Cabbage Prices** (RwF/kg)
V/C Ratio
4b –Bas fonds 160 kg DAP 28310 Butaré 30 13.6 Plateau du Sud 130 kg Urea 440 kg NPK 28310 Butaré 30 8.6 30 kg Urea
*All results based on manure application of 5-10 T/ha. **Analysis done using September-October 1999 nominal prices.
31
Figure 12. Cabbage: Map of Fertilizer Promotion Recommendations for Rwanda
RWANDA
Rukondo
Karama
Kinyamakara
MarabaMbazi
Mugusa
Shyanda
Muganza
Kibayi
NdoraNgoma
NyaruhengeriGishamvu
NyakizuKigembe
Communes
Strong fertilizer promotion program (16)
32
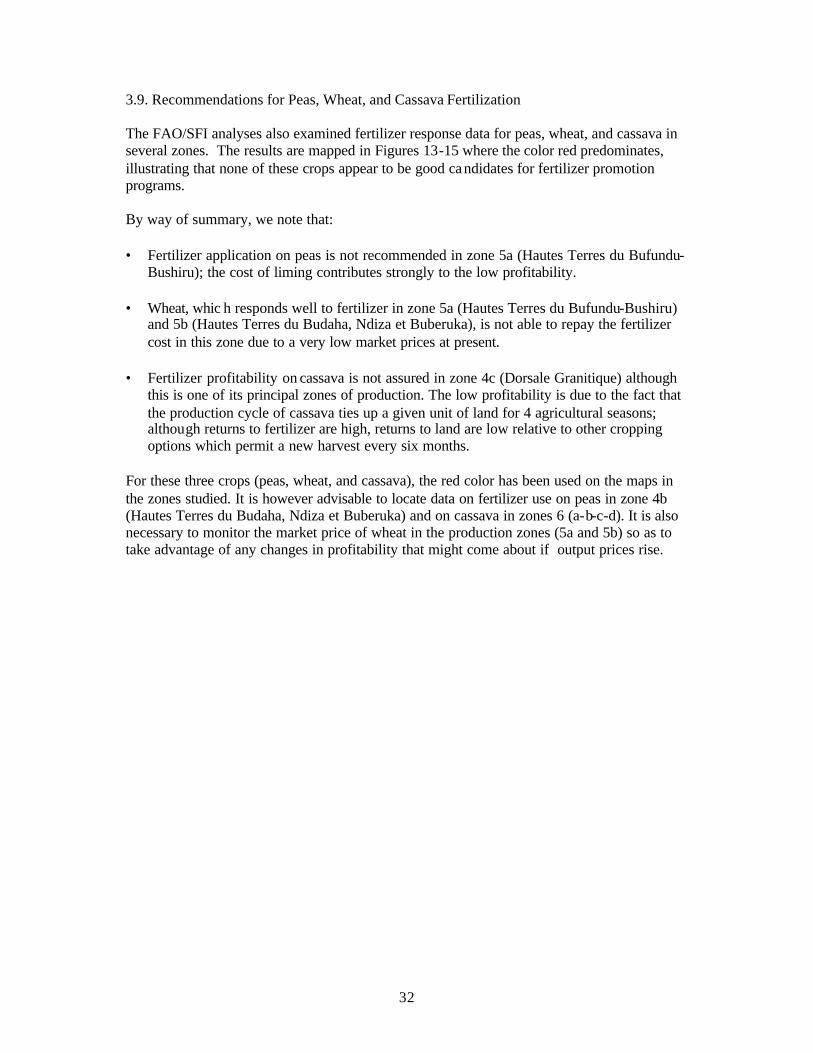
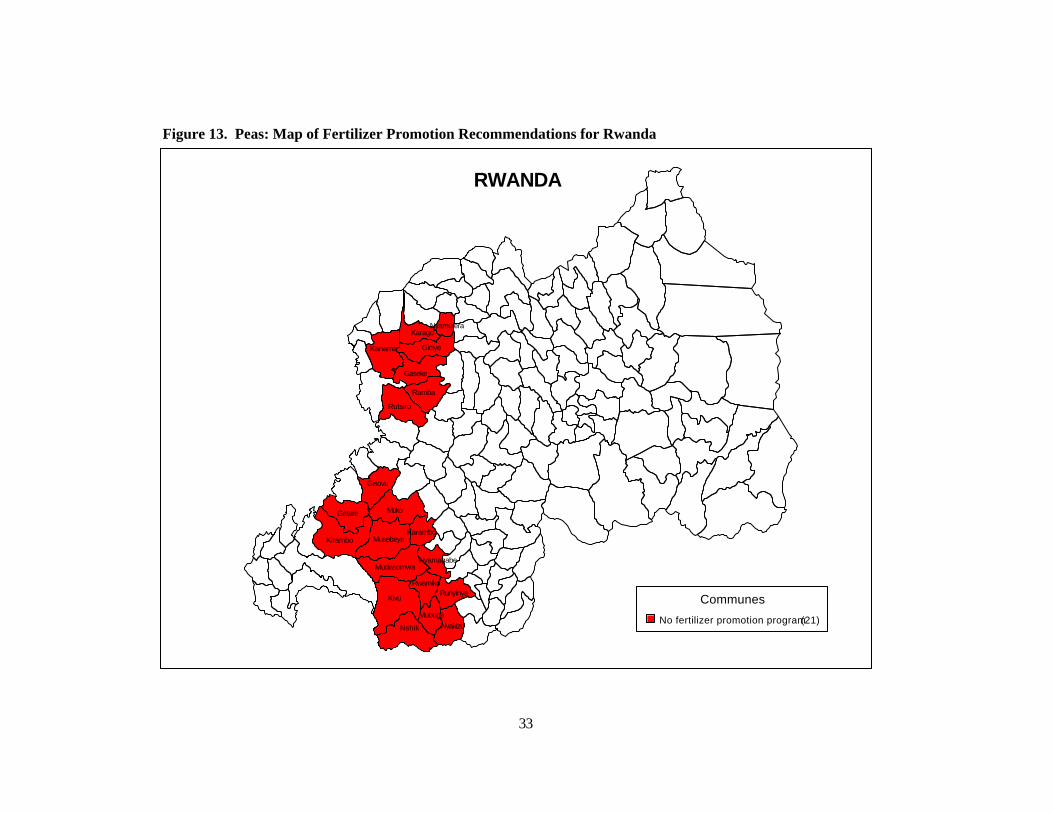
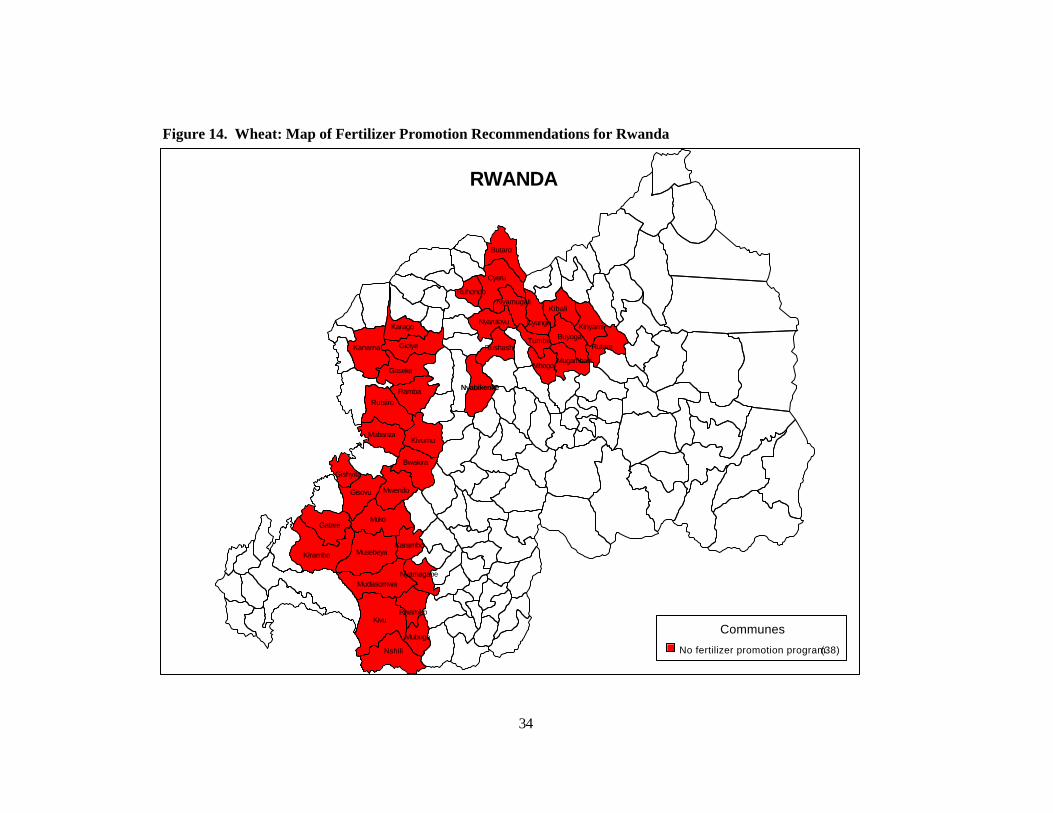
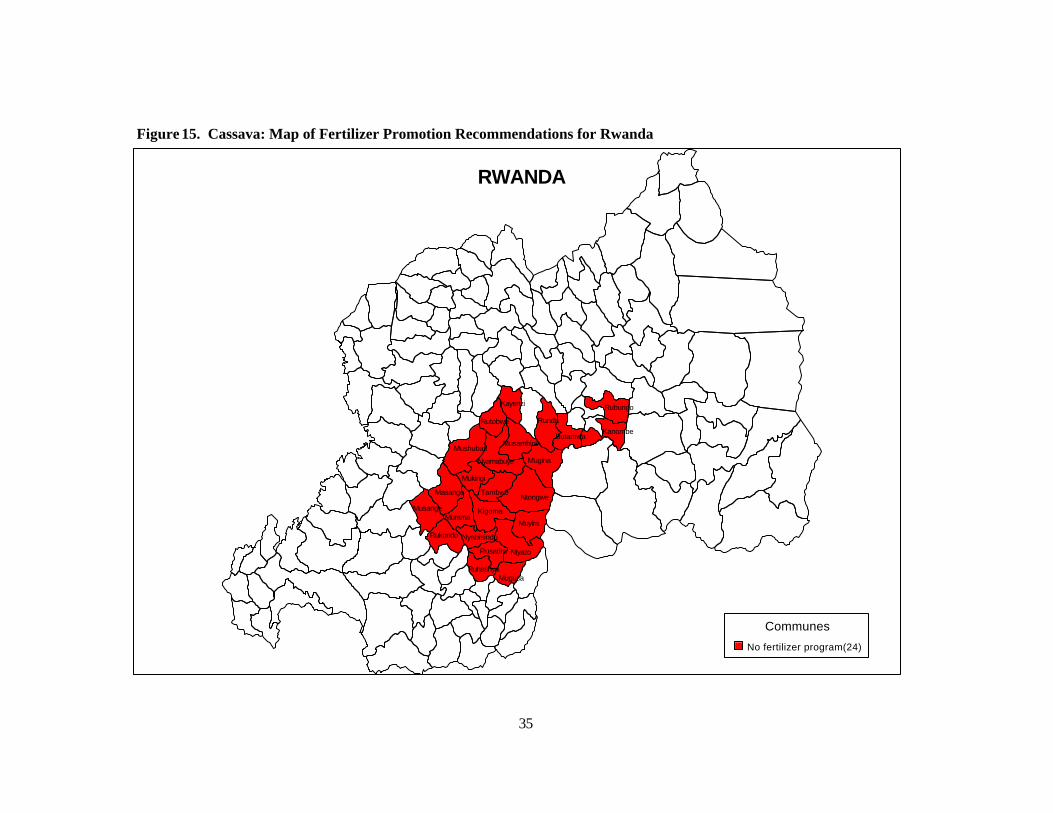
3.9. Recommendations for Peas, Wheat, and Cassava Fertilization The FAO/SFI analyses also examined fertilizer response data for peas, wheat, and cassava in several zones. The results are mapped in Figures 13-15 where the color red predominates, illustrating that none of these crops appear to be good ca ndidates for fertilizer promotion programs. By way of summary, we note that: • Fertilizer application on peas is not recommended in zone 5a (Hautes Terres du Bufundu-
Bushiru); the cost of liming contributes strongly to the low profitability. • Wheat, whic h responds well to fertilizer in zone 5a (Hautes Terres du Bufundu-Bushiru)
and 5b (Hautes Terres du Budaha, Ndiza et Buberuka), is not able to repay the fertilizer cost in this zone due to a very low market prices at present.
• Fertilizer profitability on cassava is not assured in zone 4c (Dorsale Granitique) although
this is one of its principal zones of production. The low profitability is due to the fact that the production cycle of cassava ties up a given unit of land for 4 agricultural seasons; although returns to fertilizer are high, returns to land are low relative to other cropping options which permit a new harvest every six months.
For these three crops (peas, wheat, and cassava), the red color has been used on the maps in the zones studied. It is however advisable to locate data on fertilizer use on peas in zone 4b (Hautes Terres du Budaha, Ndiza et Buberuka) and on cassava in zones 6 (a-b-c-d). It is also necessary to monitor the market price of wheat in the production zones (5a and 5b) so as to take advantage of any changes in profitability that might come about if output prices rise.
33
Figure 13. Peas: Map of Fertilizer Promotion Recommendations for Rwanda
RWANDA
KaragoNyamutera
GiciyeKanama
Gaseke
Ramba
Rutsiro
Gisovu
Gatare
Kirambo Musebeya
Muko
Karambo
MudasomwaNyamagabe
Rwamiko
KivuRunyinya
Mubuga
Nshili Nyakizu
Communes
No fertilizer promotion program (21)
34
Figure 14. Wheat: Map of Fertilizer Promotion Recommendations for Rwanda
Nyabikenke
Mubuga
Nshili
KivuRwamiko
NyamagabeMudasomwa
Karambo
Muko
MusebeyaKirambo
Gatare
Gishyita
Gisovu Mwendo
Bwakira
KivumuMabanza
RutsiroRamba
Gaseke
GiciyeKanama
KaragoNyarutovu
Rushashi
MugambaziMbogo
Tumba BuyogaRutare
Kinyami
Kibali
Cyungo
NyamugaliRuhondo
Cyeru
Butaro
RWANDA
Communes
No fertilizer promotion program (38)
35
Figure 15. Cassava: Map of Fertilizer Promotion Recommendations for Rwanda
MugusaRuhashya
Rusatira
Nyabisindu
Ntyazo
Muyira
Mugina
NtongweTambwe
Mukingi
KigomaMurama
Rukondo
Musange
Masango
Mushubati
Nyamabuye
Musambira
Rutobwe
Kayenzi
Runda
ButamwaKanombe
Rubungo
RWANDA
Communes
No fertilizer program (24)
36
4. TAKING STOCK AND MOVING FORWARD The information presented in this synthesis represents findings based on an extensive – but not exhaustive – review of fertilizer response literature and data bases available to the FAO and FSRP teams in 1999. The review permitted us to (1) make many concrete recommendations by crop and zone for specific types of fertilizer promotion programs, (2) identify some ‘gray’ areas where information reviewed is inconclusive, and (3) identify some ‘white’ areas for which fertilizer response data have not yet been found. The Fertilizer Profitability Workshop (MINAGRI/FSRP/FAO, 15 December 1999) permitted an open discussion of the FSRP/FAO preliminary recommendations among a diverse set of individuals currently working on fertilizer issues in Rwanda. The consensus of the workshop participants was that the GOR should adopt a policy of replacing NPK/urea fertilizers with the DAP/urea recommendations that were shown to be more profitable by the FSRP/FAO research. Many of the participants urged that this transition be accompanied by (1) careful monitoring of soil quality (i.e., levels of K, soil organic matter, and acidity in particular) among farmers adopting the DAP/urea recommendations; (2) further basic research on the levels of K, organic matter, and soil acidity throughout Rwanda to evaluate the potential medium- and long-run implications of using DAP in lieu of NPK; and (3) continued efforts to fill in the ‘gray’ and ‘white’ areas of the maps with more solid recommendations. Based on the workshop participants’ validation of the methods and results of the profitability studies, we outline below some ideas on the possible ‘next steps’ that the GOR and its partners could take as they move forward in transforming the agroeconomic potential for fertilizer use identified in section 3 into high levels of actual fertilizer consumption. We recommend aiming for a new ‘traffic light’ mapping system where within 5 years the green areas represent crop/zone combinations where fertilizer consumption is real rather than potential. For this to happen, however, requires collaboration and planning among a large group of diverse actors including (but not limited to) farmers, farmers’ associations, extension services (both government and NGO), research institutes, fertilizer importers and distributors, agricultural produce traders and processors, government services and projects. Suggestions on specific tasks that need to be accomplished and ways of getting them done are summarized under four headings below: general organization of fertilizer promotion activities, research and extension activities, market development activities, and the role of government policy. 4.1. General Organization of Fertilizer Promotion Activities As noted above, the key to successful fertilizer promotion is through coordination of the functions performed by the many actors already involved in the fertilizer subsector. To illustrate the importance of this need for coordination, we use the Fertilizer Profitability Workshop recommendation that efforts to promote DAP/urea fertilizers be accompanied by a system of monitoring. This recommendation raises a multitude of questions. Some of the most obvious are: • Who should train farmers to use DAP/urea fertilizers? • Who should do the monitoring (sampling, data collection, analysis, reporting)? • What are the key items to monitor? • Who will evaluate monitoring reports and recommend changes if necessary?
37
• Who will pay for training and monitoring? • Who will ensure that fertilizer is delivered in a timely and efficient manner? In many countries extension agents would train farmers to use fertilizer and also do the monitoring (e.g., Ethiopia, Mali, Mozambique), but given that Rwanda has opted for a streamlined extension service it is unlikely that the agronomists now assigned to each commune would have the time and resources to implement a full scale fertilizer training and monitoring program. Other resources in the communes will need to be called into action: • NGOs are already performing a wide range of extension and monitoring services in many
communes; • DSA (in collaboration with FSRP) is already doing household level survey work in many
communes; • Some fertilizer distributors are already providing credit and output marketing services; • FAO is currently monitoring fertilizer distributed under their 1994-1999 import program; • Researchers at ISAR could identify key variables that need monitoring and design
appropriate data collection techniques to be implemented by others; • The agronomy faculty at the university could contribute to the design of the monitoring
system and get their students involved in collecting and/or analyzing the data as well as assisting with identifying additional data sources permitting the GOR to develop recommendations for the ‘gray’ and ‘white’ areas of the maps; and
• Core funding from all actors offering to participate could be supplemented with additional funding from government and/or donor-funded projects.
The challenge is to coordinate and facilitate the activities of these diverse actors so that the aggregate effect of all the individual efforts currently underway adds up to more than the sum of the individual parts – overlap and redundancy need to be reduced and complementarities promoted. One way of doing this is to organize monthly meetings of the various stakeholders at the national, prefecture, and commune level – developing strategies and work plans at each level that assign tasks and responsibilities corresponding to each stakeholders interests and capacities. Coordination at the national level might be managed by the Ministry’s Extension Department (supported by the Agricultural and Rural Markets Development Project, ARMDP, funded by the World Bank), at the prefecture level by the DRSA (Direction Regional de Service Agricole) local administration, and at the commune level by the agronomists. The point we are making here is that despite the many ‘green lights’ found in the profit ability analyses, fertilizer adoption and increased use per hectare is not going to happen without a concerted effort by a wide range of actors. Appropriate coordinating and funding mechanisms must be found to harness the contributions of various actors, making judicious use of their comparative advantages and potential complementarities. The scenario sketched out above is only one of many ways to organize a national fertilizer promotion program. The GOR, in collaboration with its partners, must rapidly develop the most appropriate program for Rwanda, given currently available human, physical, and financial resources.
4.2. Implications for Research and Extension Activities The profitability study has identified two broad types of fertilizer research that need to be pursued: (1) farm-level monitoring of profitability and impacts on soil quality among those
38
adopting the FSRP/FAO recommendations and (2) basic research on fertilizer response for crops and zones not well covered by the current study. The farm-level monitoring should be designed in a manner that permits statistical analysis of both fertilizer response and profitability results (i.e., large sample size, comparison of control and test plots, etc.). Among the factors that one would want to monitor are: • Changes in levels of K and soil organic matter over time; • Fertilizer response (kg/ha); • Profits (v/c ratios); • Links between level of fertilizer response and production practices (e.g., seeding rates and
timing, methods of applying fertilizer, use of anti-erosion techniques, weeding practices, water control, pesticide use);
• Inter-annual and seasonal crop-rotation systems; and • Inter-annual and seasonal output price variability. One of the weaknesses of past fertilizer response data is that there is seldom a time dimension permitting one to analyze the inter-annual risk associated with using fertilizer. Developing a data base that follows the same farmers or the same treatments over a period of several years would permit much better estimates of average profitability of fertilizer technologies over time – this type of data can provide useful information for the design of credit programs. As noted in Section 4.1 above, farm-level monitoring of fertilizer response and profitability will require collaboration from a wide range of actors involved in extension, research, and marketing activities. Filling in the gaps in the basic understanding of fertilizer response for various crops and zones in Rwanda needs to be done in a manner that makes the best possible use of existing data bases. A first step is to rebuild the data bases that were developed during the 1980-1993 period and improve the documentation of these data bases. We suspect that many of the earlier reports for these studies are available in the MINAGRI library, but the archival nature of the document registry system at the library makes it a very time-consuming task to track down the relevant reports. Our recommendation is that faculty and students at the university work with the MINAGRI libr arian and the FAO/Kigali librarian in an effort to identify all documents reporting fertilizer response results. Copies of these documents should then be put in a special library and used as the basis for doing additional profitability analyses similar to those conducted by the FSRP/FAO teams. Only in cases where no prior fertilizer response data are found should an effort be made to conduct new fertilizer trials or demonstrations. In addition to filling in the gaps for specific crops and zones, there is a need to better understand how levels of K and soil organic matter affect fertilizer response – this is an area where the design of past trials prevented one from looking at the interactions. ISAR should be charged with the design and implementation of appropriate studies. The key challenges with respect to extension are the need to train farmers in the correct use of fertilizers and the need to monitor their progress and revise recommendations if results are less satisfactory than anticipated. To improve the chances of these training and monitoring activities leading to major improvements in agricultural productivity, the extension services should consider some of the following options:
39
• Limit the number of fertilizer promotion programs to the 2-3 best performing crops per zone;
• Begin with the crops that exhibit strong v/c ratios (>2.5); • Focus on DAP/urea fertilizers to keep costs down; • Promote use of anti-erosion structures to ensure efficient use of fertilizers and reduce risk
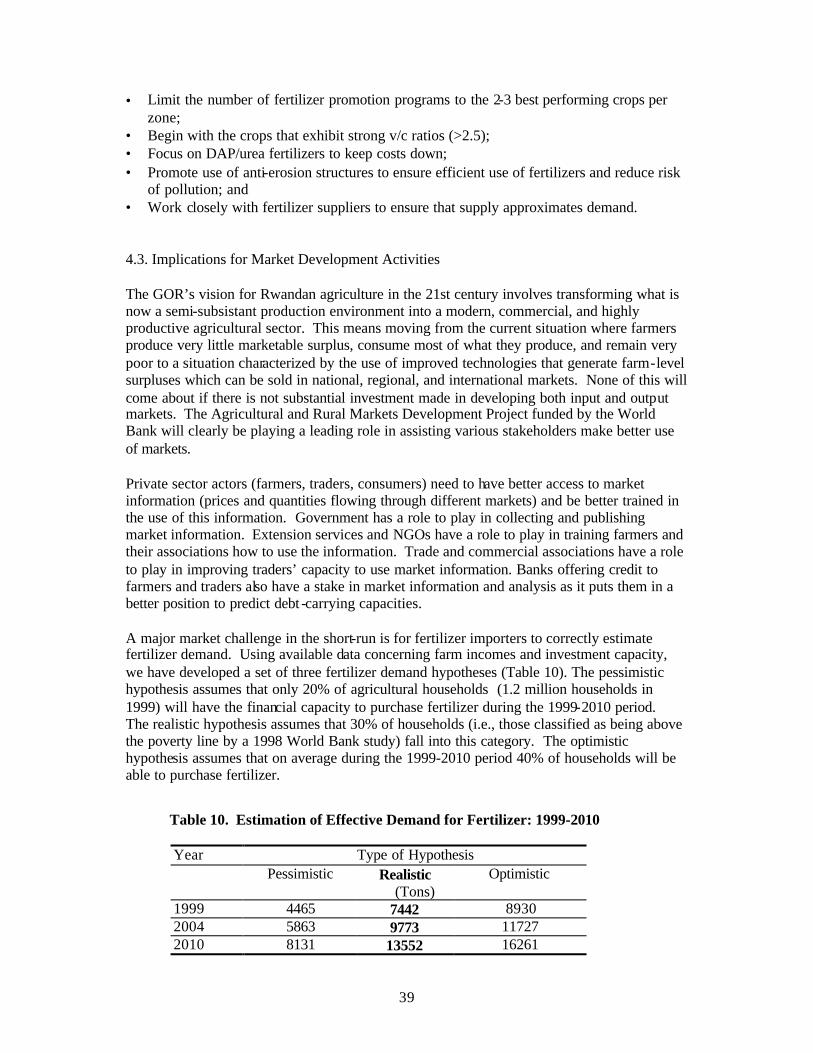
of pollution; and • Work closely with fertilizer suppliers to ensure that supply approximates demand. 4.3. Implications for Market Development Activities The GOR’s vision for Rwandan agriculture in the 21st century involves transforming what is now a semi-subsistant production environment into a modern, commercial, and highly productive agricultural sector. This means moving from the current situation where farmers produce very little marketable surplus, consume most of what they produce, and remain very poor to a situation characterized by the use of improved technologies that generate farm-level surpluses which can be sold in national, regional, and international markets. None of this will come about if there is not substantial investment made in developing both input and output markets. The Agricultural and Rural Markets Development Project funded by the World Bank will clearly be playing a leading role in assisting various stakeholders make better use of markets. Private sector actors (farmers, traders, consumers) need to have better access to market information (prices and quantities flowing through different markets) and be better trained in the use of this information. Government has a role to play in collecting and publishing market information. Extension services and NGOs have a role to play in training farmers and their associations how to use the information. Trade and commercial associations have a role to play in improving traders’ capacity to use market information. Banks offering credit to farmers and traders also have a stake in market information and analysis as it puts them in a better position to predict debt -carrying capacities. A major market challenge in the short-run is for fertilizer importers to correctly estimate fertilizer demand. Using available data concerning farm incomes and investment capacity, we have developed a set of three fertilizer demand hypotheses (Table 10). The pessimistic hypothesis assumes that only 20% of agricultural households (1.2 million households in 1999) will have the financial capacity to purchase fertilizer during the 1999-2010 period. The realistic hypothesis assumes that 30% of households (i.e., those classified as being above the poverty line by a 1998 World Bank study) fall into this category. The optimistic hypothesis assumes that on average during the 1999-2010 period 40% of households will be able to purchase fertilizer.
Table 10. Estimation of Effective Demand for Fertilizer: 1999-2010
Year Type of Hypothesis Pessimistic Realistic Optimistic (Tons)
1999 4465 7442 8930 2004 5863 9773 11727 2010 8131 13552 16261
40
Demand projections reported in Table 10 are based on the following assumptions: Fertilizer consumption increases annually at the rate of the GDP (estimated by GOR at 5.6%); Each purchasing household can spend RwF 2000 per season or 4000 per year (based on MINAGRI national survey data, 1987, and informal survey in Kajevuba, Rwasave and Mwogo cultivated marshlands, 1999). The 1999 estimates for the realistic hypothesis are quite close to the quantities of fertilizer actually imported for 1999 (sales were at 5811 tons by October 1999 and there appeared to be substantial unmet demand). If the GOR and its partners move ahead in an aggressive and collaborative manner, we believe it is possible to increase average levels of fertilizer used per hectare substantially. During the recent past, fertilizer consumption has been approximately 2.9 kg/ha of cultivated land. Our estimates suggest that consumption should be able to reach about 8 kg/ha during the next 5 years and even 11 kg/ha by 2010. 4.4. Implications for Sectoral and Macro-economic Policy Design The role of the government is primarily one of enabling the private sector to produce and market products as efficiently and cost-effectively as possible. Recent measures have been taken by the government to reduce the costs of fertilizer. Among the most important were the removal of taxes (ICHA) and import duties, and establishment of a credit facility for fertilizer importers. Given the relatively small size of the Rwandan fertilizer market at present, it will be important for the government to foster competition in import and marketing activities. This is not an easy task as fertilizer by its very nature tends to exhibit economies of size and scale that mitigate against the development of many small, competitive fertilizer companies. Nevertheless, it will be important to provide safeguards that minimize the chances of a defacto fertilizer import and distribution monopoly developing. Another import-facilitating role that can be played by government is ensuring that transportation and communications infrastructure is adequate so that (1) fertilizer can be marketed efficiently throughout the entire country and (2) farmers’ produce can be moved rapidly from surplus to deficit zones. Both input and output markets must operate efficiently if farmers are to realize the agroeconomic potential of fertilizer described in Section 3. A final area of policy that might warrant government action is the official promotion of DAP/urea treatments in lieu of using NPK/urea. One of the major results of the profitability analyses presented in this report was the finding that DAP/urea treatments are more profitable (assuming that natural K levels are adequate) than NPK/urea. Official GOR support of this option would be likely to speed up the transition and save farmers substantial amounts of money that would otherwise be spent on unneeded quantities of K included in 17-17-17. It is recommended that the GOR promote imports of DAP and urea and at the same time fund training programs to help both farmers and traders learn about the proper use of DAP/urea treatments. Introduction of DAP/urea treatments should be facilitated by the fact that there are some zones where DAP is already being used (particularly for beans) and by the fact that some NPK/urea treatments are still profitable (though not the most profitable), permitting a gradual transition from one t o the other.
41
LIST OF REFERENCES CITED
Beernaert, Frank R. 1999. Feasibility Study of a Production Project of Lime and/or Ground Travertine for the Management of Acid Soils in Rwanda: Agro-Pedological Report. Unpublished report submitted to the Government of Rwanda. Commission Nationale d’Agriculture (Rwanda). Juin 1991. Zones agro-climatiques du Rwanda (James GASANA). 3.2. Kigali: Rwanda. MINAGRI/APNI. 1987. Enquête sur la connaissance de l’engrais minéral en milieu rural. Kigali, Rwanda: Ministry of Agriculture. Ministry of Agriculture, Animal Resources and Forestry. 1999. Proposed Fertilizer Policy. Naseem, Anwar and Valerie Kelly. 1999. Macro Trends and Determinants of Fertilizer Use in Sub-Saharan Africa. MSU International Development Paper No. 73. E. Lansing: Michigan State University. Weight, David and Valerie Kelly. 1999. Fertilizer Impacts on Soils and Crops of Sub-Saharan Africa. MSU International Development Paper No. 21. E. Lansing: Michigan State University. World Bank. June 1998. Rwanda Poverty Note, Rebuilding an Equitable Society: Poverty and Poverty Reduction after the Genocide.
42
APPENDIX 1
PRINCIPAL FERTILIZER RESPONSE REFERENCES CONSULTED BY FSRP Commission des Communautes Europeennes (CCE), FAO et MINAGRI. February 1993. “Mission sur la Politique Nationale d'Intrants Agricoles: Version définitive.” . CCE/FAO report prepared by Cabinet Siadous et Associés (France). Commission Nationale d'Agriculture (Rwanda). April 1991. “Rapport Préliminaire: Vol II: (1) Appuis à la production agricole (2) Analyse du sous-secteur des productions animales.”. FAO. 1984. “Accroissement de la production vivrière par l'émploi des engrais: Rwanda: Conclusions et recommandations du projet.” Rapport terminal. FAO. 1990. “Programme Engrais Rwandais: Accroissement de la Production Vivrière par l’Emploi des Engrais: Résultats des Essais et Démonstrations 1980-1989.” Document de travail. FAO. FAO. 1995. “Accroissement de la production vivrière par l’emploi des engrais: Conclusions et Recommandations du Projet Engrais.” Rapport terminal. FAO (Service de la Gestion de la Nutrition des Plantes). March 1995. “Synthèse des Activités et Valorisation des Résultats sur La Nutrition des Plantes et la Production Agricole: Le Projet Engrais au Rwanda. Gascon, J. F. October 1989. “Le Programme Des Expérimentations du P.I.A. - 1989 Protocoles et Résultats.” Projet PNUD/FAO/Gouvernement Rwandais. Gillet, Y. and D. Brogniez. November 1991. “Document de Référence sur l'Utilisation des Engrais et Amendements calcaires dans le Cadre de la Définition d'une Politique des Intrants Agricoles au Rwanda.” Programme Engrais au Rwanda (FAO/DANIDA) et Projet Appui au Programme National Intrants (FED) MINAGRI. December 1990. “Résultats d'Expérimentation en Fertilisation en milieu réel: Saison 1989-90A: Pomme de terre.” FAO Programme Engrais/FAO-DANIDA Projet Kigali Nord. MINAGRI. May 1991. “Résultats d'Expérimentation en Fertilisation en milieu réel sur terrasses radicales: Saisons 1989-90B et 1990-91 A.” . FAO, Programme Engrais/ FAO-DANIDA, Centre de Formation Agricole et de Petit Elevage de Kamonyi. MINAGRI. April 1991. “Résultats d'Expérimentation en Fertilisation en milieu réel: Saison 1990-91 A: Patate douce et Pomme de terre.” . FAO Programme Engrais, FAO-DANIDA, Projet Croix Rouge Kigali. Ndindabahizi, I. and R. Ngwabije. April 1991. “Evaluation des Système d’Exploitation Agricole pour une Régionalisation des Techniques de Conservation et d’Amélioration de la Fertilité des Sols au Rwanda..” Consulting report. MINAGRI, Dir. Général du Génie Rural et de la Conservation des Sols, Projet PNUD/FAO RWA/89/003, Stratégie Nationale de Conservation des Sols,.
43
Nezehose, J. B. 1990. Agriculture Rwandaise : Problématique et Perspectives. Kigali: INADES - Formation - Rwanda. Ngirumwami, J. L. July 1989. “Résultats de l’enquête sensibilité/motivation des agriculteurs dans la zone du Projet Mais de Virunga.” Kigali : MINAGRI, DSA. PNUD/FAO. April 1997. “Formulation de la stratégie de développement agricole: macroéconomique.” Mission d'áppui. PNUD/FAO/MINAGRI. Programme National pour l'Amélioration de la Pomme de Terre. 1983. “PNAP Rapport Annuel 1983.” Annual Report. Institut des Sciences Agronomiques du Rwanda (ISAR). Roche, P. 1987. “Accroissement de la production vivrière par l’emploi des engrais: Rwanda.” Document de terrain. FAO. Rutunga, V., and H. Neel. 1980. “Problèmes de fertilisation des sols de prairie a eragrostis de haute altitude (Mata).” Rapport technique. Institut des Sciences Agronomiques du Rwanda. Rutunga, V. April 1991. “Essai de synthèse des connaissances acquises sur la fertilité des terres et la fertilisation des cultures au Rwanda (1960-1990).” Projet PNUD/FAO RWA/69/003. MINAGRI, Direction Générale du Génie Rural et de la Conservation des Sols. Scaglia , J. A. September 1991. “Fonctions de Production Azote et Phosphore sur Pomme de Terre: Eléments Agronomiques et Economiques en Préfecture de Gikongoro.” FAO Programme Engrais, FAO-DANIDA, Bureau de Butaré. Tumuhawenimana, I. and L. Nirere. July 1983. “La recherche en champs d’agriculteurs appliquée à la culture de la pomme de terre.” Seminar. Programme National pour l’amélioration de la pomme de terre (PNAP - ISAR) in collaboration with Centre International de la pomme de terre (CIP) and Programme Régional d’amélioration de la culture de la pomme de terre en Afrique Centrale (PRAPAC), July 11-16, 1983. Y. Gillet, J. A. Scaglia, and E. Bomans. 1992. “Les sols acides au Rwanda.” Conference paper. FAO/DANIDA, Programme Engrais: 5ème Atelier Régional pour la Gestion des Sols Acides et Gestion des Sols après Défrichement en Afrique (IBSRAM), May 6-11, 1992.
44
APPENDIX 2
PRINCIPAL FERTILIZER RESPONSE REFERENCES CONSULTED BY FAO/SFI Bublot, Georges. 1974. Economie de la Production Agricole. Louvain. Commission Nationale d’Agriculture (Rwanda). Juin 1991. Zones agro-climatiques du Rwanda (James GASANA).Volume III, Document 2, Kigali. de GEUS, Jan G. 1973. Fertilizer Guide for Tropics and Subtropics. CENTRE D’ETUDE DE L’AZOTE. FAO. 1987. Guide sur les engrais et la nutrition des plantes. Rome. FAO/FIAC. 1988. Coûts et Marges de la Commercialisation des Engrais dans les Pays en Développement 1985/86. Rome. FAO/FIAC. 1990. L’Emballage des Engrais dans les Pays en Développement. Rome. FAO. 1991. FAO Yearbook on Fertilizer. Rome. FAO. Mars 1995. Synthèse des Activités et Valorisation des Résultats sur la Nutrition des Plantes et la Production Agricole. Le Projet Engrais au Rwanda. FAO/Programme Engrais. 1995. Accroissement de la Production Vivrière par l’Emplo i des Engrais, RWANDA. Conclusions et Recommandations du Projet, Rome. Hunt, Roderick. 1982. The Functional Approach to Plant Growth Analysis. London. Institut Des Sciences Agronomiques Du Rwanda (ISAR). Décembre 1987. Synthèse de la Recherche Agronomique au cours des 25 dernières années 1962-1987. Rubona. ISAR/GTZ. Septembre 1992. Commercialisation de l’Agriculture dans des Conditions de Pression Démographique: Une Etude sur la Sécurité Alimentaire des Ménages et ses Implications pour la Formulation de la Politique Alimentaire au Rwanda. Document de Travail, Rubona. JAPIOT, François. Juin 1997. Etude des Systèmes de Production pour l’Elaboration des Politiques et des Stratégies du Secteur Agricole. MINAGRI/FAO, Kigali. Loveridge, Scott. Juillet 1992. Les Sources de Revenu des Ménages Agricoles Rwandais, les Exportations et Leur Impact sur la Disponibilité Alimentaire en Milieu Rural, Année Agricole 1990. Document de Travail N037. MINAGRI/DSA, Kigali. MINAGRI. 1985. Premier Séminaire National sur la Fer tilité des Sols au Rwanda. Kigali, du 17 au 20 Juin 1985. MINAGRI. 1985 et 1986. Résultats de l’Enquête Nationale Agricole 1984. Rapport 1, Volume 1 et Volume 2, Kigali.
45
MINAGRI/APNI. 1987. Enquête sur la connaissance de l’engrais minéral en milieu rural. Kigali. MINAGRI. Mars 1989. Séminaire Régional sur la Problématique de Fertilisation et du Revenu du Paysan sur les sols acides de hautes altitudes du Rwanda. Gikongoro, du 13 au 19 Novembre 1988. MINAGRI. Décembre 1992. Enquête Nationale Agricole 1990: Production, Superficie, Rendement, Elevage et Leur Evolution 1984-1990. Kigali. MINAGRI. 1992. Rapport du Séminaire National sur la Stratégie de Conservation des Sols. Volume III, Communications Techniques, Kigali. MINAGRI/Newick Park Initiative. 1997. Rapport du Séminaire sur l’Amélioration de la Fertilité des Sols Comme Principale Composante de l’Intensification Agricole dans les Pays Densément Peuplés et à Ressources en Terres Limitées. Kigali, 07-09 Octobre 1997. MINAGRI. Mars 1998. Formulation de la Stratégie de Développement Agricole, Kigali. MINAGRI. Octobre 1998. Stratégie et Plan d’Actions pour la Sécurité Alimentaire, Kigali MINAGRI/FAO/PAM/UE/FEWS. 1999. Rapports d’évaluation des récoltes, Saisons culturales de 1994 B à 1999 B. MINECOFIN. July 1999. Rwanda Development Indicators. Kigali. Ngirumwami, Jean Léonard. Octobre 1992. Analysis of Food Crop Production and Marketing Trends in Rwanda with Emphasis on Dry Beans. MINAGRI/DSA, Kigali. Rutunga, Venant. Avril 1991. Essai de synthèse des connaissances acquises sur la Fertilité des Terres et la Fertilisation des Cultures au Rwanda (1960-1990). MINAGRI, Kigali. UWAMARIYA, Laurence, Hyacinthe Fabiola, Tom Zalia. Juillet 1990. Etude sur les Engrais Minéraux et les Pesticides au Rwanda. MINAGRI/DSA, Kigali. World Bank. June 1998. Rwanda Poverty Note, Rebuilding an Equitable Society: Poverty and Poverty Reduction after the Genocide. World Bank/IFPRI. June 1999. The Distribution of Inputs in Rwanda: A Descriptive Analysis. (Draft Report). LUTZ, C., A. Van TILBURG. 1999. Marketing of Agricultural Commodities in Rwanda. (Draft Report). WORLD BANK/University of Groningen/ Wageningen Agricultural University.
46
Appendix 3
Participants to the Fertilizer Response and Profitability Workshop December 15, 1999 MINAGRI, Kigali
1. MUGOREWERA, Drocella (Secretary General, MINAGRI)
2. MUTEBWA, Alfred (Director of Planning and Agricultural Statistics,
MINAGRI)
3. MULINDA, Venuste (Director Commercialisation and Rural Development,
MINAGRI)
4. NGARAMBE, Vincent (Direc teur du Genie Rural et Conservation des Sols,
MINAGRI)
5. EL BAYER, Attia (Genie Rural, MINAGRI)
6. RUHIGANA, Venuste (Genie Rurale, MINAGRI)
7. GATWAZA, Pierre Claver (DPSA, MINAGRI)
8. CHRISTIANSEN, Karin (Economist, DPSA, MINAGRI)
9. NYIRIMANA, Joseph (Director of Agr icultural and Rural Markets Development
Project, ARMDP, MINAGRI)
10. MUNYANGAJU, Allois (Agricultural and Rural Markets Development Project,
ARMDP, MINAGRI)
11. BUSOKEYE, Laetitia (Food Security, European Union)
12. MENWEYELLET, Moussie (Food Security Team leader, USAID)
13. RWAMASIRABO, Serge (Food Security Advisor, USAID)
14. GASCON, Jean-François (FAO)
15. GASHUGI, Laurent (FAO)
16. NABAHUNGU, Leon (ISAR Scientist)
17. RURANGWA, Raphael (Director of PGERB)
18. RUZINDANA, Ernest (DRSA Gikongoro and Director of PDAG)
19. KYANGA Aleston (Division de Statistiques Agricoles, MINAGRI)
20. MUREKEZI, Anastase (Agronomist and Consultant)
21. KELLY, Valerie (Associate Professor, Michigan State University)
22. MPYISI, Edson (In-country coordinator, Food Security Research Project, FSRP,
MINAGRI)